Testing the Upper Echelons Theory in the European context
95
Testing the Upper Echelons Theory in the European context Flávio Miguel Gens Ramos [email protected] Master in Finance Dissertation Supervisor: Júlio Fernando Seara Sequeira da Mota Lobão, PhD 16 th September 2015
Transcript of Testing the Upper Echelons Theory in the European context

Testing the Upper Echelons Theory in the
European context
Flávio Miguel Gens Ramos
Master in Finance Dissertation
Supervisor: Júlio Fernando Seara Sequeira da Mota Lobão, PhD
16th September 2015

i
Author’s Biography
Flávio Miguel Gens Ramos was born on 24th of April 1988 in Portugal. Prior to enrolling
in the Master in Finance at the Faculty of Economics of University of Porto, Portugal,
starting in September 2013, he obtained a Bachelor’s Degree in Economics from Nova
Business School, in Lisbon, Portugal.
After his Bachelor’s, he worked as an Audit FSI Senior Consultant for Deloitte &
Associados, SROC, SA, during four years.
During the Master in Finance, the author joined EQUUS Consulting, an IT Swiss based
company, as a Financial Services Senior Consultant, which is his current place of work.
The author takes this opportunity to thank his girlfriend, his family and University and
workplace colleagues for all the support and patience during these long nine months.
As well as his University’s Professors who supported the endeavor of producing the thesis
while aboard. Highlighting the importance of the contribution of Professor Paulo Jorge
Marques de Oliveira Pereira, the Director of the Master in Finance, who allowed for this
exception, and of Professor Júlio Fernando Seara Sequeira Mota Lobão, the Thesis
Supervisor, who was always available to provide assistance despite the geographical
limitations.
ii
Abstract
The current research applies the premises of the Upper Echelons Theory, presented by
Hambrick and Mason (1984), and shows that the Top Management Team (TMT) of
European firms has a significant impact on firms’ decisions and performance.
The undertaken study considered some of the original Propositions presented by
Hambrick and Mason (1984), and added additional variables to address the main
criticisms and limitations presented by previous researches.
In the explanation of firms’ decisions and performance an innovative approach was taken
by applying the models in a cross-national basis, meaning taking into consideration
companies from a large number of European countries simultaneously and without a
country control variable.
In order to do so, a large database comprising data regarding TMT characteristics, firms’
financial indicators and corporate decisions, was used and applied in a large study period
starting in 2004 and ending in 2013.
Sample databases were taken from the aforementioned large database in order to study
the chosen relationships between different corporate decisions and firm indicators with
the different TMT demographic and background characteristics.
The largest data sample included information regarding 634 companies from 10 different
countries, and 2417 top managers with 31 different nationalities.
Applying this methodology it was possible to achieve meaningful results, some of which
contradict the Upper Echelons Theory’s propositions such as the positive relationship
between age and leverage and the negative impact of TMT heterogeneity in companies’
performance, and others that support the Theory such as the long-term negative
relationship between age and growth in return.
Doing so this study is one of the first to implement successfully the analysis of the Upper
Echelons Theory in the European context, on a cross-national level, and considering one
of the largest data samples, allowing also to overcome the limitations presented by studies
dependent on questionnaires.
Key-words: Upper Echelons, Manager, TMT heterogeneity, conflict, strategic
leadership, corporate decisions, firm performance.
JEL-Codes: G02, G32, G34, M10, Z10

iii
Content Index
1. Introduction ................................................................................................................... 1
2. Literature Review ......................................................................................................... 3
2.1 The Upper Echelons Theory and following studies on the TMT impact ........... 3
2.2 Age ...................................................................................................................... 6
2.3 Functional track .................................................................................................. 7
2.4 TMT heterogeneity ............................................................................................. 8
2.5 Analysis of the methodological aspects of similar studies ............................... 10
3. Study implementation ................................................................................................. 12
3.1 Propositions of the Upper Echelons Theory chosen for the study .................... 12
3.2 Data collection and databases used ................................................................... 13
3.3 Base model ........................................................................................................ 14
3.4 Data processing and data retrieved ................................................................... 15
3.5 Final databases .................................................................................................. 17
4. Chosen variables and models constructed .................................................................. 28
4.1 Chosen variables ............................................................................................... 28
4.2 Models constructed ........................................................................................... 31
5. Empirical results ......................................................................................................... 35
5.1 Results from the regressions ............................................................................. 35
5.2 Consistency checks ........................................................................................... 49
6. Conclusion .................................................................................................................. 53
References ....................................................................................................................... 56
Appendixes ..................................................................................................................... 62
Appendix 1 – E-views models’ outputs .................................................................. 62
Appendix 2 – E-views heteroscedasticity and autocorrelation tests ....................... 73
Appendix 3 – E-views Levene tests on models 3a and 3b ...................................... 76
Appendix 4 – E-views Anova tests on models 6a and 6b ....................................... 87
Appendix 5 – Classification rules for acquisitions and functional background ..... 89
Index of Figures
Figure 1 - Upper Echelons perspective of organizations .................................................. 1

iv
Index of Tables
Table 1 - Methodological aspects of similar studies ....................................................... 11
Table 2 - Database 1 main variables ............................................................................... 17
Table 3 - Nationalities of managers in database 1 .......................................................... 18
Table 4 - Locations of companies in database 1 ............................................................. 19
Table 5 - Database 2 main variables ............................................................................... 19
Table 6 - Nationalities of managers in database 2 .......................................................... 20
Table 7 - Locations of companies in database 2 ............................................................. 21
Table 8 - Database 3 main variables ............................................................................... 22
Table 9 - Nationalities of managers in database 3 .......................................................... 23
Table 10 - Locations of companies in database 3 ........................................................... 23
Table 11 - Database 4 main variables ............................................................................. 24
Table 12 - Nationalities of managers in database 4 ........................................................ 25
Table 13 - Locations of companies in database 4 ........................................................... 25
Table 14 - Database 5 main variables ............................................................................. 26
Table 15 - Nationalities of managers in database 5 ........................................................ 27
Table 16 - Set of control variables used .......................................................................... 31
Table 17 - Relationship between age and solvency ratio ................................................ 36
Table 18 – Relationship between age and corporate diversification .............................. 38
Table 19 - Relationship between age and firm's volatility in profit margin ................... 40
Table 20 - Relationship between age and firm's volatility in ROA ................................ 41
Table 21 - Relationship between age and growth over an extended period ................... 43
Table 22 - Relationship between age and yearly growth ................................................ 44
Table 23 - Relationship between functional track and corporate diversification ........... 46
Table 24 - Relationship between TMT heterogeneity and profit margin ....................... 47
Table 25 - Relationship between TMT heterogeneity and ROA .................................... 48
Table 26 – Large TMT inter-percentile statistical comparison....................................... 50
Table 27 - Small TMT inter-percentile statistical comparison ....................................... 51
Table 28 - Sample of classification by base sector ......................................................... 89
Table 29 - Functional background classification ............................................................ 90

1
1. Introduction
Corporate decisions and performance are a reflection of the personal characteristics of
companies’ Upper Echelons, i.e. the TMT, and not only a natural consequence of the
environment surrounding the firm.
This assertion is defended by Hambrick and Mason’s (1984) Upper Echelons Theory,
which takes a step further in the knowledge of corporate decision making, by assuming
that the environment is not enough to explain the actions and outcomes of corporations:
Figure 1 - Upper Echelons perspective of organizations
Source: Hambrick and Mason (1984)
The Upper Echelons Theory is in accordance with the Behavioral Finance spectrum, since
top managers are not automated machines, possessing limited knowledge and cognitive
capacities, which allow for a biased corporate decision making process.
The Theory has been analyzed extensively since 1984, using different scopes and
methods, yielding a variety of results, and suffering from important limitations.
A first great limitation of previous studies is the recurring use of questionnaires with low
or incomplete response rates, due to the lack of a wide database with information about
managers’ and corporations’ characteristics. Secondly, multiple authors limited their
studies to very specific market circumstances or managers’ characteristics.
Finally, the use of demographic characteristics as a proxy for psychological
characteristics has also been criticized by Priem et al. (1999), since there is no real proxy
for the “black box” of decision making.
2
In order to overcome the aforementioned survey limitations this study is based on the use
of very large databases, obtained from Amadeus and Zephyr, with a complete set of
information regarding TMT characteristics and corporate decisions and performance.
Additionally, this research considers multiple environment related control variables
allowing to understand the circumstances in which the decision occurs, consequently
making the demographic characteristic a better proxy for human expected behavior.
The current research also adds new features to the study of the Upper Echelons Theory
by considering a cross-national European environment, still neglected by literature.
Contrary to previous studies, this research selected three different demographic
characteristics, namely age, functional background and TMT heterogeneity, addressing
multiple impacts of managers on corporate decisions and outcomes of European firms.
The results of the current study indicate that only some TMT demographic characteristics,
namely age and heterogeneity, impact specific corporate decisions and performance.
Some corporate decisions, namely the degree of diversification corporate acquisitions,
were proven to be negatively correlated with cultural individualism, a cultural variable
which Hofstede (2001) has shown to be significantly different across countries.
Overall, age presented results that were contrary to the Upper Echelons Theory, since it
was found that it has a positive impact in leverage and in the volatility of the profit margin,
and a negative correlation with the long-term sales of the firm.
These results indicate that older managers take more risks than younger managers, which
can be a result of the specific European firms’ financing structures. As Goldman and
Sachs (2015) show European firms depend greatly on loans, which favor more
experienced managers in detriment of young entrepreneurs.
The impact of TMT heterogeneity partially contradicted the expectations of Hambrick
and Mason (1984), being negatively correlated with firm performance, measured by profit
margin and ROA, for both the stable and the turbulent economic periods.
The results support the hypothesis of Goldstein et al. (1985) who defend that in uncertain
environments it may be preferable to concentrate the decision process on fewer people.
The current research is structured as follows: it initiates in Chapter 2 with a literature
review, followed by the presentation of the study implementation circumstances in
Chapter 3. The models constructed, their variables and results are debated in Chapter 4
and 5. Finally the conclusions and limitations are discussed is presented in Chapter 6.

3
2. Literature Review
The Upper Echelons Theory has been vastly researched on, leading to multiple
conclusions which increased the knowledge on the impact of the TMT on corporations.
Simultaneously, several contradictory results were obtained thus leading to a great
number of unsolved questions.
In this Chapter a literature review on Hambrick and Mason’s (1984) Upper Echelons
Theory, and on the three demographic characteristics studied, namely age, functional
track and TMT heterogeneity, is made. This Chapter is concluded with the analysis of the
methodological aspects of similar studies.
2.1 The Upper Echelons Theory and following studies on the TMT impact
The Upper Echelons Theory presented by Hambrick and Mason (1984) provides a new
direction on the research on corporate decision making, by proposing that managers’
personal characteristics are reflected in the decisions taken by the firms.
The aforementioned Theory proposed the use of several demographic characteristics,
namely age, socioeconomic background, functional track, formal education, financial
position, group heterogeneity and other career experiences, as a proxy for the
psychological drivers of decision making.
The expected impact of TMT characteristics on decisions and outcomes of firms is deeply
connected with the Behavioral Finance research, since psychological biases prevent
individuals from acting in full rationality.
As Kahneman (2011) and Zhu and Chen (2015) defend psychological biases, such as
overconfidence, and the consequent use of heuristics to decide, lead to choices different
from rational expectations.
Consequently, decisions do not depend strictly on the environment and it is possible that
different managers decide differently in similar situations, as shown by Norburn (1986)
and Norburn and Birley (1986).
Although the Upper Echelons Theory provides a new framework of research it was a
result of previous studies regarding the impact of managers on firms, such as the research
of Hambrick and Snow (1977) who provide a framework called dominant coalition,
defending that managers only see a subset of the environment, since their vision is
clouded by past and current performance which induces mandatory strategies.

4
The impact of managers on corporate outcomes was firstly studied by Lieberson and
O’Connor (1972) and by Weiner and Mahoney (1981) who found that leadership and
stewardship, respectively, have a significant on corporate performance and stock returns.
Following the presentation of the Theory, several authors debated the different impacts
of managers in corporations. Hambrick (1989), for instance, introduced the concept of
strategic leadership, in which both internal and external factors affect corporate decisions.
In an attempt to prove the importance of managers, Bennedsen et al. (2007) show, using
the case of 6.753 Danish firms, that when managers or one of their relatives die, the
performance of the company is impacted negatively up to two years after the event.
As Tixier (1984) and Graham et al. (2013) show not only the managers are important but
also their characteristics. The first author found that companies from different countries
in Europe look for different profiles.
The second author discovered that the degree of risk aversion depends both on the role of
the manager, either CEO or CFO, and on its location, namely Europe or United States.
As Child (1972) defends managers affect both the decision and the way it is presented to
stakeholders. Adams et al. (2005) support Child (1972) premises by showing, in their
study of CEO’s of 336 of Fortune 500 companies, that CEO’s and executive managers
can indeed affect the corporate decisions.
Following these results, Hambrick (2007) enriched the Upper Echelons Theory by
proposing the inclusion of power and discretion as moderators of managerial influence.
In order to measure power, Carpenter et al. (2004) defended that TMT compensation can
indicate the level of discretion of the management.
Later studies found that the discretion power of managers can be constrained by the
institutional logic of the firm, as defended by Clark et al. (2014), and by the management
structure which sometimes includes supervisory boards, as defended by Nielsen (2010).
Based on all the knowledge gathered on the impact of managers in corporate decisions
and performance a wide spectrum of authors from several different fields of science, used
the Upper Echelons Theory as base for their research.
In one of the most referenced books on the importance of Upper Echelons, “The art and
science of leadership”, Nahavandi (2008) presented the six forces affecting strategic
leadership: structure, strategy, technology, environment, culture and leadership.

5
Eisenhardt and Schoonhoven (1990), in their study of the United States semi-conductor
industry, shown that the specific characteristics of firms combined with market
characteristics will drive growth, since different firms have different available resources,
for instance the ability to hire highly skilled and experienced managers.
Nielsen and Nielsen (2012) used a sample of 146 Swiss based firms and shown that
nationality diversity in the TMT is a driver of performance, especially if the tenure of the
TMT increases, implying that affective conflicts are solved over time.
D’Aventi (1990), shown that the elite status of managers is also an important determinant
on how firms acts, since the prestige of managers generates trust of creditors and other
stakeholders on the firm. Kadushin (1995), also shown that the largest French companies
chose managers who belong to specific elites, such as schools and country clubs.
Hayden (2012) in his PhD discussion, studying Dutch managers, added a new feature to
the study of the Upper Echelons Theory by proposing that in fact the all managers,
independently from their background, focus on innovation, either exploitative, i.e.
efficiency improvement, or exploratory, i.e. new product development.
On the ethical background, Manner (2010) shown, using KLD ratings of 650 United
States corporations as a proxy for corporate social responsibility practices, that the
academic background impacts the ethical behavior of managers.
Zee and Swagerman (2009), following the scandals regarding IT firms in USA, shown
that the introduction of Sabarnes-Oxley act impacted slightly the constitution of the TMT.
Human capital research shown that managers may impact performance by choosing the
right people, as argued by Winne and Sells (2006).
Aurora Teixeira (2002) on the other hand, found that the degree of qualification of the
human capital does not impact directly performance, but allows for a better the adaptation
to the constant technological changes.
Lee et al. (2014) took the study of managers’ characteristics to the adoption of new
technologies by Australian companies and show that TMT beliefs regarding IT innovation
will impact positively and strongly the adoption of new technologies.
Concluding, the studies that followed the TMT have proven without a doubt that corporate
decisions do not depend solely on the environment. Managers’ characteristics, such as
age, functional background or diversity, shape the actions and performance of firms.

6
2.2 Age
Age is the first TMT characteristic presented in the Upper Echelons Theory. This
demographic variable is associated with vigor, availability to take risk, careless decisions,
and learning.
Therefore, firms managed by younger individuals are expected to risk more, taking on
more leverage, obtaining higher returns, and a greater variability of performance.
The assumption that younger individuals risk more, and take more careless decisions, is
supported by the studies of several authors. Taylor (1975) proved that older managers
take more time to decide to be able to gather more information, to select the useful inputs
in the diagnosis of the situation, allowing for a better assessment.
The time taken to decide is also associated with rigidity in the decision making process.
As show Chown (1960) has proven, older people tend to be more rigid when deciding,
being this rigidity associated with a delay in the reaction to new circumstances was shown
by Carlsson and Karlsson (1970).
The greater risk taken by younger individuals does not impact only the care in decision
making. Child (1974) found that that younger age is associated with innovation, growth
in sales and increasing net earnings, and that older age is connected to the preference for
stable earnings.
Additionally, Stevens et al. (1978) have found that age is positively associated with
commitment. Which may also contribute for the volatility presented by firms with
younger managers, who are less reluctant to leave the company when it stops fitting their
career objectives, generating instability inside the firm.
As the studies of Norburn (1986) and Norburn and Birley (1986) show, younger managers
tend to be found managing growth firms, which by nature are firms with a greater risk,
and a greater growth since they are in the beginning of their life.
Finally, Marinova et al. (2010) in their research, on the impact of gender of executive
manage on the performance of Danish and Dutch firms, found that age has a negative
impact on corporate performance.

7
2.3 Functional track
Hambrick and Mason (1984) present functional track, or the previous working experience
of TMT members, as another very important demographic and/or background
characteristic.
According to the Upper Echelons Theory a manager experienced in sales will focus much
more on the output, trying to increase the financial performance of the firm by entering
new markets, selling innovative products, or even investing in early growth markets.
On the other hand, a manager with a deeper contact to manufacturing processes will try
to increase internal performance, focusing more on processes and the efficiency of the
procedures already in place, also trying to cut costs and to cut input to output time.
As a result of these two different approaches to management, Hambrick and Mason (1984)
classified the functional track of managers as output or throughput.
Some studies have supported the assumptions of the Upper Echelons Theory, such as the
one from Deaborn and Simon (1958), who have shown that managers present selective
attention and therefore are better prepared to deal with situations that they are used to
handle, for instance the tasks of their own department.
As Deaborn and Simon (1958) show a manager deeply related to manufacturing will tend
to analyze the problem as a manufacturing process, and consider the several tasks that
could be changed to increase performance.
According to Miles et al. (1978) managers tend to present three types of strategic believes
which are dependent on to their past experience. The first, is the belief in traditional
strategy, i.e. focusing on performance and on improving the internal processes.
The, second belief is in the human resources strategy, i.e. focusing on growth, on new
markets, and on innovation. Finally, there is the analyzer strategy which is a belief that it
is possible to mix the previous two.
Finally, as Hayed and Abernathy (1980) argue the preferred strategies for firms will
depend on the previous types of roles of the TMT. Their study has shown that managers
who come from financial and law related roles will focus more on defensive strategies,
trying to increase efficiency and cutting costs, avoiding innovation and taking risks.

8
2.4 TMT heterogeneity
Since the introduction of the Theory in 1984, the demographic vector that captured the
greater attention was TMT heterogeneity, i.e. the demographic and background diversity
inside the TMT is expected to impact firm performance.
The attention given to this vector is a natural reaction to the changing world environment,
in which globalization has been breaking cultural differences and dogmas.
Companies, on the other hand, do not change so rapidly, for instance as Baker (2014)
defends it is still difficult for women to rise inside companies, and as Allemand et
al.(2014) shows without mixed mechanisms, of quotas and talent pooling it is difficult for
women to reach top positions.
Despite the great expectations that TMT heterogeneity may change the paradigm of
companies increasing their performance, the results of previous researches on
heterogeneity, made in both inside and outside Europe, have been quite divergent.
Outside the European context, some studies advocate that greater diversity increases
performance [Marimuthu and Kolandaisamy (2009) Erhardt et al. (2003); Boeker (1997);
Lee and Farh (2004); Robertson and Park (2006)].
Others defend that homogeneity improves performance [Miller et al. (1998); West and
Schwenk (1996)] and there are even others that found no support for the impact of
heterogeneity on performance [Wiersema and Bantel (1992); Bergen et al. (2005)].
As the meta-analysis of Certo et al. (2006) shows, most studies performed outside Europe
present a positive relationship between heterogeneity and Return on Assets (ROA).
In the European context, results are also inconclusive. Rodriguez and Pawlak (2014)
found that, for 147 large Spanish, education level diversity impacts performance
negatively, but industry and international diversity have a positive impact.
On the other hand, Marinova et al. (2010) found no impact of gender diversity, in the
executive and supervisory boards, on the performance of 186 listed Danish and Dutch
companies, measured by an adjusted Tobin-Q.
Tibben (2010) also found no impact of diversity on the performance, measured by the
Tobin-Q, of 126 listed firms from Belgium, The Netherlands, Germany and France. The
author simultaneously found a U-shaped relationship between diversity and performance.

9
On the other hand, Honing (2012), studying 277 firms from Germany, The Netherlands
and the U.K, and Germet (2011), studying 87 firms from The Netherlands, found a
positive impact of nationality diversity in stock returns and in Tobin-Q respectively.
Different explanations for the inconclusive results of studies of the impact of TMT
diversity in corporate performance have been presented.
Priem et al. (1999) defends that specific personal characteristics, such as charisma and
power, should be included in the study of TMT heterogeneity.
Other authors defended that decisions of heterogeneous groups are subject to several
layers of conflict. Amason (1996) started to present the concepts of functional and
dysfunctional, i.e. affective, conflict.
Carson et al. (2004) later introduced the task conflict. And finally, Evans and Carson
(2005) added the moderating impact of social capital in the decision making process.
Li (2014) and Vries et al. tested the way conflict impacts teams interactions and found
that the greater integration and identification the lower the levels of affective conflict.
Based on Li’s (2014) results it is important to understand the situations in which different
decisions are taken. As several studies show the environment shapes the decision making
process.
Keck et al. (2014) defend that groups tend to combine more information when deciding,
reflecting an opinion to which all members can compromise, converging to risk neutrality.
However, as Dovidio et al. (2009) defend there are different hierarchies in group
decisions, since large groups can be divided into two types of sub-groups, the advantaged
group and the disadvantaged group, who seek for different types of outcomes.
Besides the different hierarchies which may block opinions, individuals may feel
inhibited from sharing their opinion in group decisions since, as Xiao et al. (2009)
defends, people suffer from regret biases.
The hierarchical and human biases effects may be amplified by the stress/ambiguity
brought by the environment.
According to Hermann (1963) groups react to changes in the environment, either by
innovating or by taking destructive decisions. However, when stress increases the
dependence on leadership and the risk of making wrong decisions also increases.
As Diskell and Salas (1991) state, in large groups the leader will tend to ignore the
opinions of employees, centralizing the decision on the top of the company.

10
Goldstein et al. (1985) and Lejarraga et al. (2014) reached a similar conclusion. When
faced with changing environments groups show rigidity, by choosing to consider the same
amount of information with little routine adaptation, failing to adapt to the environment.
According to Straw et al. (1981), the impact of rigidity is twofold and depends on the
threat itself. If the threat implies a change in the environment, the more rigid companies’
are expected to fail to adapt at the necessary speed, generating greater negative impact.
On the other hand, if the threat does not change the environment, the group is expected to
use the same decision mechanisms, considering the same necessary inputs, implying that
no destructive action is taken.
Concluding, groups are expected to bring up the best inputs from individuals and provide
the best solution for the organization.
However, conflict may arise within groups, especially when the stress in the environment
increases and when rigidity is great, as proposed by McNeil and Thomson (1971).
Therefore the turbulence on the environment, as a driver of stress, and the power of the
TMT will be essential to understand the impact of TMT heterogeneity.
2.5 Analysis of the methodological aspects of similar studies
As discussed, in the previous Sections, several studies have analyzed the Upper Echelons
Theory, by analyzing the specific situations in which the characteristics of the TMT
influence the decisions and outcomes of the companies.
These studies considered different methodologies, such as the use of surveys or databases,
and were performed in different industries and countries.
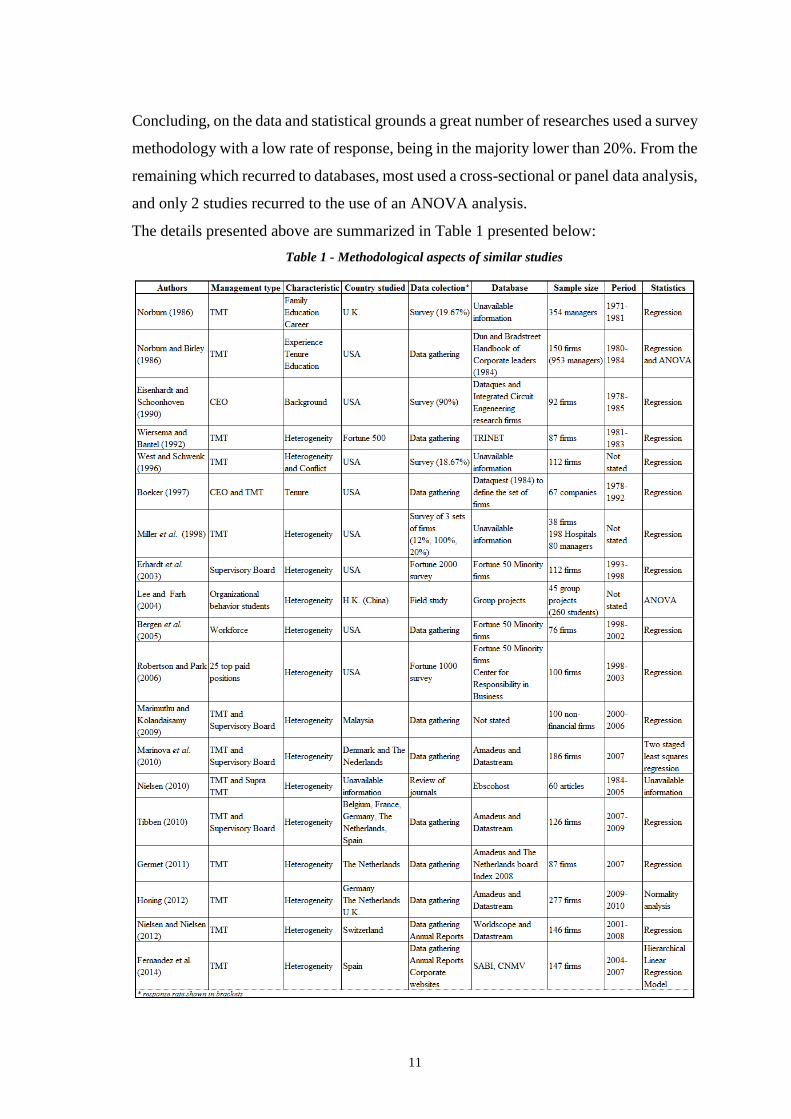
Nevertheless, as we can observe in Table 1, most studies either focused on companies
from the United States (USA), or only considered one specific country.
As we can observe in Table 1, in the nineteen most relevant studies, only nine were
performed outside the USA, from which two considered Asia, and seven Europe.
From the universe of studies done in Europe, five focused on central and northern Europe,
namely United Kingdom, Switzerland, The Netherlands, Germany, Belgium, Denmark
and France. The other two studies included a southern European county, namely Spain.
Only four out of the nineteen studies considered more than one country. However they
included a country control variable. Therefore, no true cross-border study, in which
multiple firms are considered independently from their location, was ever attempted.
11
Concluding, on the data and statistical grounds a great number of researches used a survey
methodology with a low rate of response, being in the majority lower than 20%. From the
remaining which recurred to databases, most used a cross-sectional or panel data analysis,
and only 2 studies recurred to the use of an ANOVA analysis.
The details presented above are summarized in Table 1 presented below:
Table 1 - Methodological aspects of similar studies
12
3. Study implementation
As stated previously, the aim of this research is to understand the drivers of corporate
decision and performance in European companies, based on the understanding of the main
characteristics of their Upper Echelons.
In 1984, Hambrick and Mason presented several Propositions to guide the research on
TMT influence in corporations. Therefore, to obtain a greater knowledge about European
firms it is essential to determine which Propositions to study.
After determining the research questions, i.e. Propositions, it is possible to determine the
necessary information and, recurring to similar studies, the model to be implemented.
In this Chapter all the aforementioned subjects are discussed, starting by a presentation of
the Propositions chosen, followed by a presentation of the databases used, a discussion of
the base model to be implemented, and the demonstration of the data processing tasks,
which led to the final databases to be used.
3.1 Propositions of the Upper Echelons Theory chosen for the study
The Propositions of the Hambrick and Mason (1984) Upper Echelons Theory are intended
to steer the study of the impact of the TMT in the decisions and performance of
companies.
Therefore, by testing these Propositions in their original form it will be possible to obtain
a greater knowledge regarding the impact of managers in European companies.
The Propositions to be tested were chosen based in two different criteria. On one hand,
the information regarding the TMT specific characteristic should be easily accessible and
easily interpreted by investors, allowing them to use the results of the current research
without great effort.
On the other hand, the study itself is dependent on the currently existing information, thus
the quality and quantity of data present in the databases Amadeus and Zephyr implies that
not all the Propositions can be tested. A preliminary data analysis was undertaken in order
to understand the available information in the aforementioned databases.
The result of the aforementioned analysis of relevance and data quality culminated in the
selection of the following Propositions:
13
P1 Age: Firms with younger managers will be more inclined to pursue risky
strategies than will firms with older managers. Specific forms of risk include unrelated
diversification, product innovation, and financial leverage;
P2 Age: Firms with younger managers will experience greater growth and
variability in profitability from industry averages than will firms with older managers;
P3 Functional track: There will be a positive relationship between the degree of
output-function experience of top managers and the extent to which the firm emphasizes
outputs in its strategy. Indicators of an output emphasis include product innovation,
related diversification, advertising, and forward integration;
P20 Group heterogeneity: In stable environments, team homogeneity will be
positively associated with profitability;
P 21 Group heterogeneity: In turbulent, especially discontinuous environments,
team heterogeneity will be positively associated with profitability.
The study of these Propositions will allow the study to focus simultaneously on the impact
of several demographic and background characteristics in diverse financial corporate
decisions and corporate performance.
The analysis of these different dimensions of decision making will allow to obtain a global
overview regarding European firms’ TMT’s impact on decisions and performance.
Additionally, since each Proposition is tested separately, considering only a combination
of one individual demographic or background characteristic, and one decision or
performance indicator, it is possible to maintain the focus in specific decisions, allowing
to understand the framework/ environment in which each relationship occurs.
3.2 Data collection and databases used
The research on the several Propositions presented in the previous section carries also
large data requirements. Therefore, it is important to use databases which contain detailed
information about European firms’ financial corporate decisions, financial performance,
and demographic indicators of the TMT.
Amadeus database compiles almost all of the information necessary containing, at date of
the study, data about more than nineteen million and nine hundred thousand European
enterprises, including public, private, profit and non-profit organizations.

14
From those companies, one hundred thousand are profit organizations with information
regarding the TMT and financial indicators for ten year study period, starting in the 1st of
January 2004 and ending in the 31st of December of 2013.
The only information unavailable in Amadeus were the details regarding the M&A deals
performed by these companies in the ten year period under study. Consequently it was
also necessary to merge the information in Amadeus with the information in Zephyr.
Since the study of each Proposition focuses on different demographic characteristics and
financial indicators, different samples were taken from the one hundred thousand firms.
3.3 Base model
Several authors criticized prior researches, on the Upper Echelons Theory, which were
based on cross-sectional data, given that to establish causality it is important to understand
how the demographic variables interact with the financial variable over time, which is
possible using panel data.
The information present in Amadeus allows for the study of the different relationships for
multiple and consecutive one year periods, for thousands of companies, from a broad set
of industries and European countries, being the perfect base for this research.
The study of each Proposition will imply the use of several individual models,
nevertheless each model will have a similar structure as presented below:
𝐷(𝑐)𝑖,𝑡 = 𝛼 + 𝛽1𝑖,𝑡𝑀𝑎𝑛𝑎𝑔𝑒𝑟 𝑐ℎ𝑎𝑟𝑎𝑐𝑡𝑒𝑟𝑖𝑠𝑡𝑖𝑐 + 𝛽2,𝑖,𝑡𝑗
𝐶𝑜𝑛𝑡𝑟𝑜𝑙 𝑉𝑎𝑟𝑖𝑎𝑏𝑙𝑒 + ∈𝑖,𝑡
Where, D (c) stands for Decision taken by the corporation;
Manager characteristic stands for the demographic, background or group
characteristic under study in the Proposition;
Control Variable stands for the set of control variables that intend to overcome the
already found exogenous effects.
The set of control variables chosen intends to obtain a clearer view over the impact of
Upper Echelons characteristics in corporate decision and performance.
These control variables are TMT tenure, company size, industry, TMT size, previous year
performance, economic environment turbulence, age of the company, maturity stage of
industry, international experience, TMT compensation, gender diversity, presence of
15
executive managers in supervisory roles, and the degree of individualism of the country
in which each firm is located.
3.4 Data processing and data retrieved
The application of the model to different Propositions implies that in some cases
information regarding the TMT and the financial indicators of the firms is sufficient, and
that in other cases it is necessary to obtain also information regarding the M&A deals
performed by those firms.
Therefore, two different databases were taken from Amadeus. The first considering only
the TMT and financial information, and the other restricting the number of firms to the
ones that have performed M&A deals in the study period.
In order to extract the data from Amadeus several restrictions were applied, the study
period was defined as the ten year period starting in the beginning of 2004 and ending in
December 2013, corresponding to the maximum number of years with data available.
The rationale beneath the choice of the large study period is directly linked to the research
topic, the relationships defined by the Propositions should always be true, even though
they may be affected by the environment. The large study period allows to understand if
in fact the relationships occur and are maintained in the European context.
Consequently, the first restriction on the database implied that all the firms selected had
to have information about their financial indicators and TMT demographic characteristics
for all the years studied.
An additional restriction was made on the types of firms chosen. The firms in the study
had to be public or private, thus excluding government institutions and non-profit
organizations, which suffer more from restrictions from institutional logic rules, as
debated by Clarck et al. (2014).
As a result of the aforementioned restrictions it was possible to extract from Amadeus the
first set of data with 110.579 firms, from 29 different countries.
The second dataset extracted, for the study of the impact of TMT characteristics in the
diversification of M&A deals, had an additional restriction, namely the existence of at
least one corporate acquisition in the study period.
The aforementioned selection process held a total of 3.012 firms, from 34 different
countries. This database was then complemented with information from Zephyr.

16
After the extraction of data it was observed that in several cases there were blank fields
or fields with the description “N.A.”, meaning non available.
Consequently, an exclusion process was performed considering that in order to conduct
the study it was necessary to have complete information about the necessary financial
indicators and control variables of each firm for all the study period.
Additionally, the information regarding the TMT of each firm needed to be complete
enough to allow for meaningful results. In this case the criteria was different, since having
data for all the top managers of the firm is an excessive restriction.
Therefore, it was considered that having demographic information for two thirds of the
top managers is enough to understand the characteristics of the TMT, since most decisions
in a firm can be performed with a qualified majority.
Additionally, for the specific case of firms with small TMT’s, i.e. firms with less than the
average number of members, a 60% minimum information principle was applied.
The average number of members in the database is four individuals, since usually firms
have odd TMT sizes this number was rounded up to five managers. The previous criteria
implies that the database has to have complete information for at least three managers.
The principles presented above do not guarantee full information for all variables,
nevertheless it is still one of the most restrictive criteria applied in the research on the
Upper Echelons Theory, since some studies were only performed to subsets of the TMT,
and others even ignored the total number of top managers.
The data treatment process was complete with the exclusion of control variables for which
information was not complete or consistent. The first variable to be excluded was TMT
compensation, which was missing for almost all managers. This exclusion is not critical
since another proxy of power was also considered.
The second variable excluded was the date of inception, since impossible numbers were
present in the database, since there were companies with inception date after 2004 that
had financial information for the entire study period, which ranged from 2004 to 2013.
Finally, the variable international experience had to be excluded, since the biographies
present on Amadeus did not contain enough information to allow to understand the degree
of international experience of managers.
17
3.5 Final databases
Resulting from the aforementioned demanding data process five different sample
databases were constructed.
The first two databases intended to study Proposition 1, so the relationship between age
and the level of risk undertaken by the corporation. The first sample database considered
as dependent variable the degree of solvency ratio1, as proxy for leverage, and the second
sample database considered as dependent variable the ratio of unrelated acquisitions.
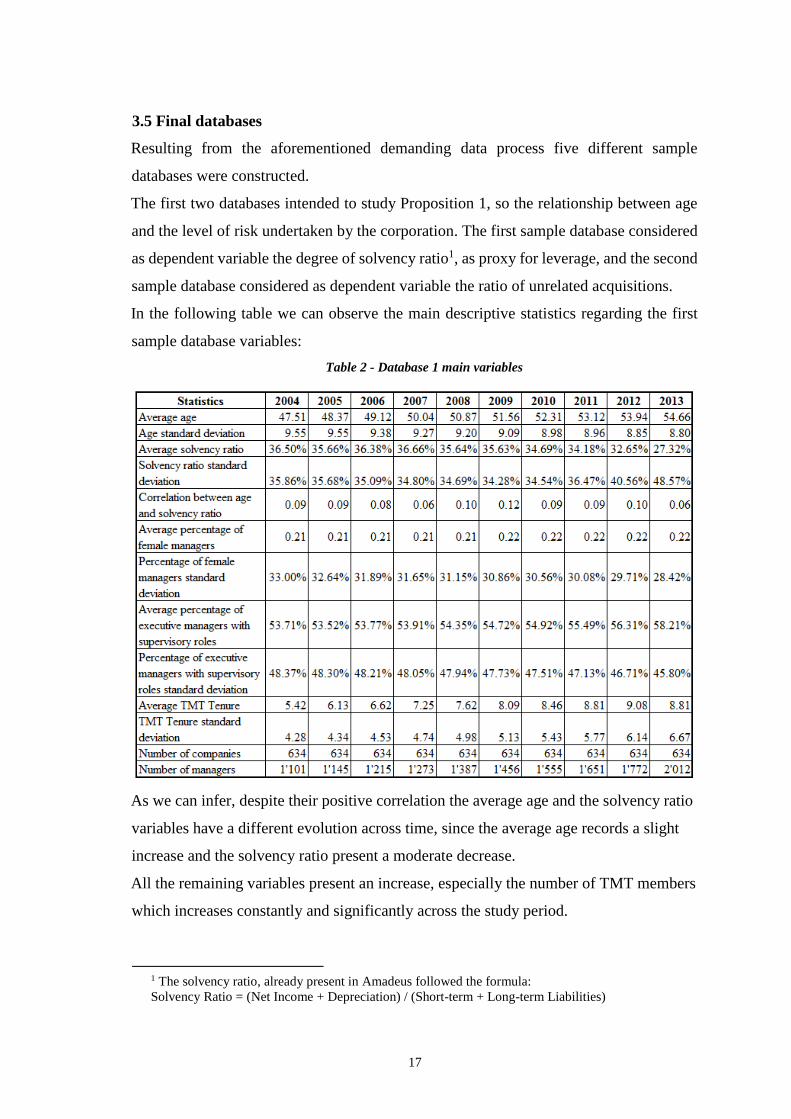
In the following table we can observe the main descriptive statistics regarding the first
sample database variables:
Table 2 - Database 1 main variables
As we can infer, despite their positive correlation the average age and the solvency ratio
variables have a different evolution across time, since the average age records a slight
increase and the solvency ratio present a moderate decrease.
All the remaining variables present an increase, especially the number of TMT members
which increases constantly and significantly across the study period.
1 The solvency ratio, already present in Amadeus followed the formula:
Solvency Ratio = (Net Income + Depreciation) / (Short-term + Long-term Liabilities)
18
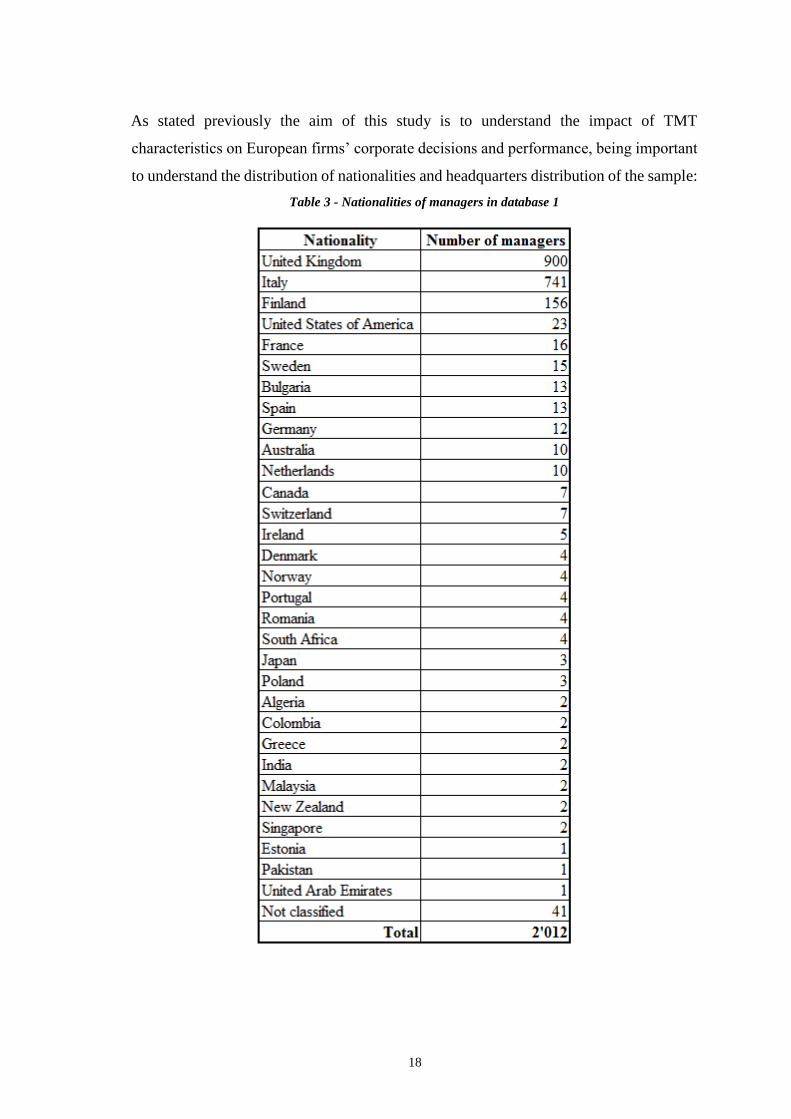
As stated previously the aim of this study is to understand the impact of TMT
characteristics on European firms’ corporate decisions and performance, being important
to understand the distribution of nationalities and headquarters distribution of the sample:
Table 3 - Nationalities of managers in database 1

19
Table 4 - Locations of companies in database 1
According to the information presented, the large majority of companies’ locations and
managers’ nationalities are from the United Kingdom, Italy and Finland.
Nonetheless, companies from ten different countries are studied, being one of the largest
number of countries ever considered in the research on the Upper Echelons Theory.
The following table presents the main descriptive statistics regarding the second database:
Table 5 - Database 2 main variables

20
The second database includes the list of corporate acquisition deals performed by 134
companies during the period starting in 2004 and ending in 2013. It is possible to observe
that the average age is similar to the values presented by database 1, and that there is a
tendency for concentration M&A deals, which represent 85% of M&A deals.
This second database is smaller than the previous one since it only considers the
companies which undertook an acquisition deal in the study period. Despite the lower
number of companies the list of nationalities and locations is still relevant.
Nonetheless, we can observe that there is a great concentration in the United Kingdom:
Table 6 - Nationalities of managers in database 2

21
Table 7 - Locations of companies in database 2
The third database addresses the study of Proposition 2, which related the variability and
growth in return with the age of the TMT members.
This Proposition relates to two different features of return, namely changes in returns and
the growth in return. Therefore, the database had to contain enough information to address
specifically each one of these features. The main variables descriptive statistics in
database 3 can be presented as follows:

22
Table 8 - Database 3 main variables
Similarly to database 1 the average age is increasing over the study period from 2004 to
2013. Additionally, profit margin and ROA, proxy of performance, are much more
volatile than the solvency ratio, showing a decreasing trend over the period of research.
All the remaining variables show an increasing trend, especially the number of managers
which almost duplicates during the period of study.
This sample database also presents a great number of nationalities and locations, being
Italy the largest location and nationality:
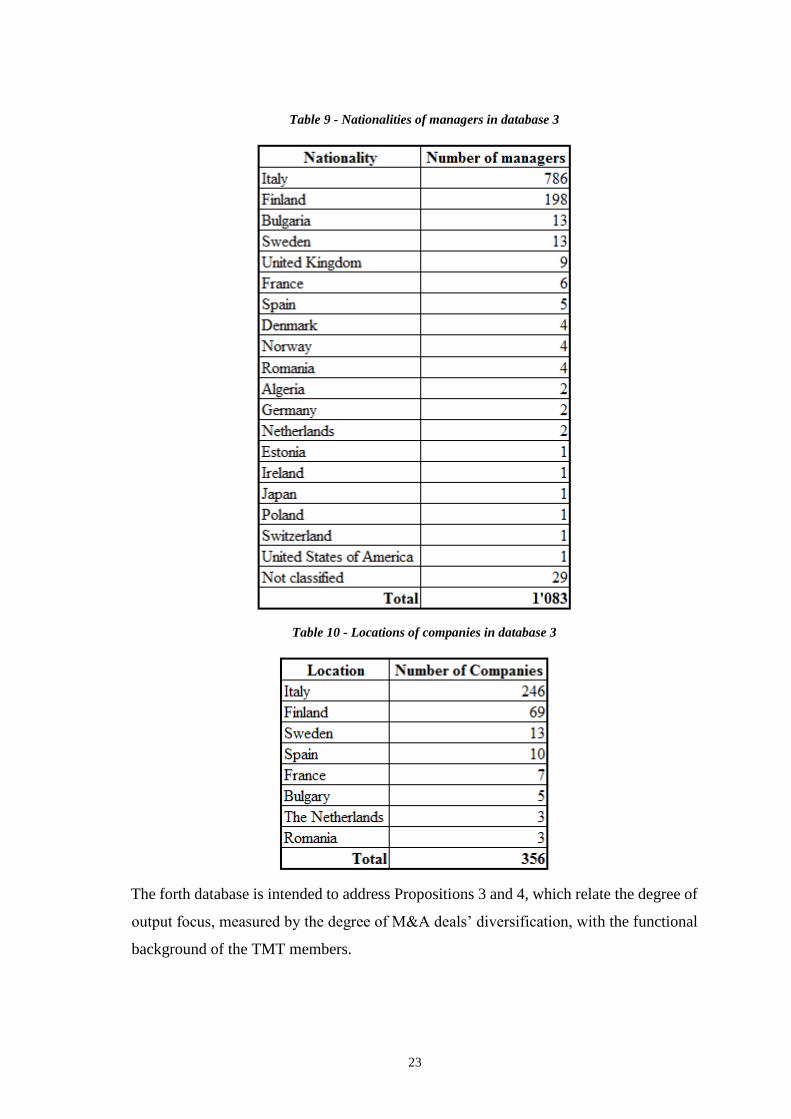
23
Table 9 - Nationalities of managers in database 3
Table 10 - Locations of companies in database 3
The forth database is intended to address Propositions 3 and 4, which relate the degree of
output focus, measured by the degree of M&A deals’ diversification, with the functional
background of the TMT members.
24
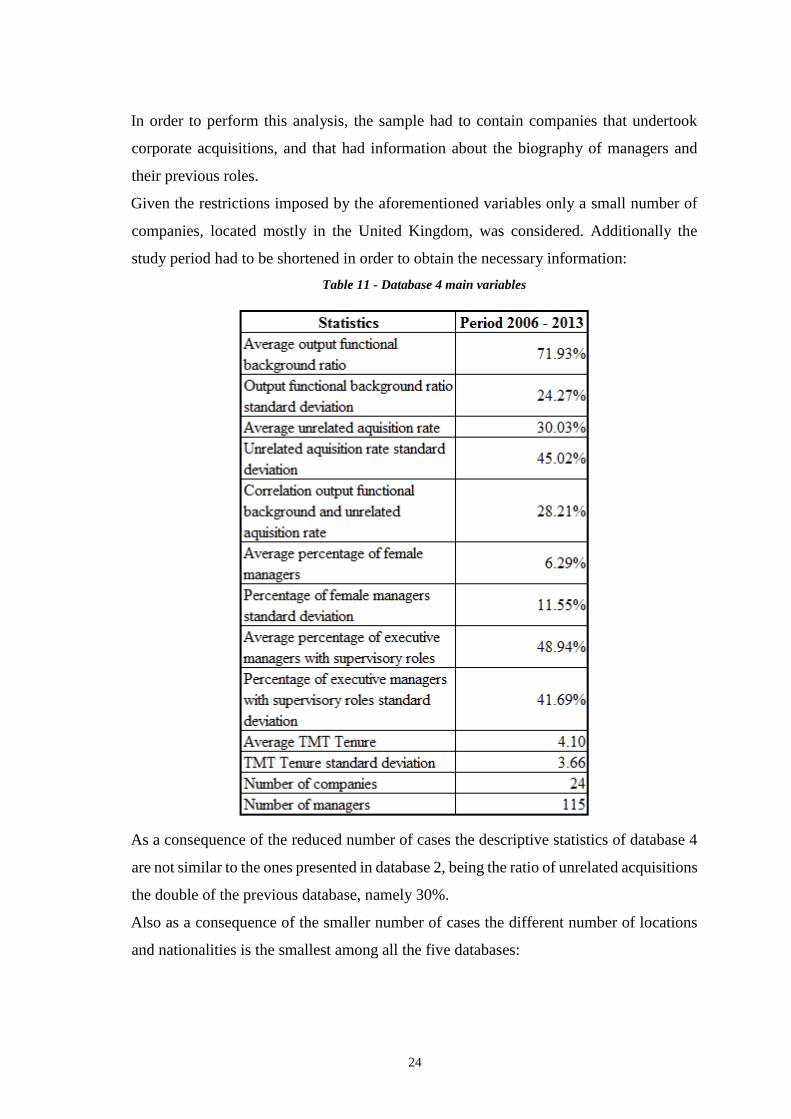
In order to perform this analysis, the sample had to contain companies that undertook
corporate acquisitions, and that had information about the biography of managers and
their previous roles.
Given the restrictions imposed by the aforementioned variables only a small number of
companies, located mostly in the United Kingdom, was considered. Additionally the
study period had to be shortened in order to obtain the necessary information:
Table 11 - Database 4 main variables
As a consequence of the reduced number of cases the descriptive statistics of database 4
are not similar to the ones presented in database 2, being the ratio of unrelated acquisitions
the double of the previous database, namely 30%.
Also as a consequence of the smaller number of cases the different number of locations
and nationalities is the smallest among all the five databases:

25
Table 12 - Nationalities of managers in database 4
Table 13 - Locations of companies in database 4
Finally, the fifth database intended to study Propositions 21 and 22, namely the
relationship between TMT’s heterogeneity and financial performance.
Since the proxy of performance were the profit margin and ROA, the companies
considered for this sample database were the same as in database 3. Consequently, the
only significant difference is the dependent variable heterogeneity:

26
Table 14 - Database 5 main variables
As we can observe the degree of TMT heterogeneity, proxy by the Blau index of
heterogeneity, is increasing along the study period starting in 2005 and ending in 2010.
Nevertheless, the correlation between the explanatory and the explained variables shows
a great volatility, changing between negative and positive figures.
This volatility can be associated with the different types of environments, namely stable
and turbulent environments.
During the years composing the study period it was possible to identify one environment
changing event, the sub-prime crisis which is estimated to have burst in late 2007.
In order to compare the impact of TMT heterogeneity on performance, two sub-sets of
equal length were determined, namely the period from 2005 to 2007 and the period from
2008 to 2010.
Although the study period is smaller than in database 2 the number of nationalities is still
relevant:

27
Table 15 - Nationalities of managers in database 5
28
4. Chosen variables and models constructed
The test of each Proposition required the use of specific sample databases and models, in
order to analyze more clearly the relationship between the demographic characteristics of
TMT members and the financial decisions and corporate performance of their firms.
4.1 Chosen variables
Dependent variables
Each model focused on the relationship between different TMT characteristics variables,
i.e. the explanatory variables, and different corporate decision and financial indicators,
i.e. the dependent variables.
Therefore, the determination of the corporate decision and financial indicators’ variables
depended on the research questions selected.
In the study of Proposition 1, an analysis between age and risk taking decisions is made
with the selection of two indicators of corporate risk taking, financial leverage and the
degree of diversification of corporate acquisitions.
The financial leverage indicator selected was the “solvency ratio”, which indicates the
ability of each firm to generate enough cash to fulfil the payment of its debt. Therefore,
the lower the ratio, the higher the leverage.
The degree of diversification of corporate acquisitions was measured by the ratio of
“unrelated diversification” computed as the percentage of unrelated businesses’
acquisitions by each one of the 134 companies in the period ranging from 2004 until 2013.
Diversification is associated with risk reduction therefore the higher the rate of unrelated
businesses acquired the lower the risk taking behavior from managers.
The study of Proposition 2 focused on the relationship between age, the variability of
performance and the growth in return. The performance and return indicators chosen were
profit margin, ROA and sales growth.
The performance variables selected, profit margin and ROA, followed previous studies
such as Lieberson and O’Connor (1972), who defended that managers have a greater
degree of discretion over accounting measures, and Certo et al. (2006) who concluded
that most studies found a positive relationships between TMT diversity and ROA.
Proposition 2 defends that age is expected to impact the variability of performance,
therefore the variables used were the standard deviation of the profit margin and of ROA.

29
Since age is also expected to be directly linked with growth, the growth variable, sales
growth, was computed as the yearly percentage increase in sales.
Propositions 3 and 4 defend that there is a relationship between the functional background
and the focus of the decisions made by managers, either connected with external growth
and innovation, or focused on internal performance.
In order to study these propositions, the dependent variable chosen was the degree of
diversification, proxy by the degree of unrelated corporate acquisitions performed by 24
firms over the 2006 to 2013 period. The diversification level indicates the focus on
unknown businesses and the will to expand current operations.
Finally, the study of Propositions 21 and 22 comprised the analysis of the relationship
between TMT heterogeneity and corporate performance. Therefore, performance
indicators were once again used, namely the profit margin and ROA of each firm for the
period ranging from the beginning of 2005 until the end of 2013.
Differently from Proposition 2, it is expected that TMT heterogeneity impact performance
directly, therefore the yearly values of profit margin and ROA were used.
Explanatory variables
The current research focuses on the impact of three main TMT characteristics, age,
functional background and TMT heterogeneity.
The explanatory variable Age was obtained as the average age of the TMT members, in
which the TMT comprised both executive managers and supervisory board.
The functional background variable was proxy by the “Output ratio”, which measures the
percentage of TMT members whose previous job functions are related to the output role,
explained by Hambrick and Mason (1984).
The TMT heterogeneity was measured by the Blau’s Index for heterogeneity computed
using the number of different cultural identities in the TMT in each year.
Each cultural identity was built as a combination of three different TMT characteristics,
nationality, gender and age. Therefore, in each company the different combinations of the
three factors composed a sub-group inside the TMT.
Based on the aforementioned sub-group construction it was possible to compute the
Blau’s Index of heterogeneity, following West and Schwenk’s (1996) research:

30
𝐻𝑒𝑡𝑒𝑟𝑜𝑔𝑒𝑛𝑒𝑖𝑡𝑦 𝐼𝑛𝑑𝑒𝑥 = 1 − ∑ 𝑃𝑖2
in which P represents the number of different cultural identity groups in each TMT, i.
Control variables
Control variables are key in the current analysis since they allow to determine the
environment in which corporate decisions are taken, and performance indicators are
observed, allowing to understand more easily the impact of each TMT characteristic.
The control variables considered in the study were firm size, TMT size, industry, gender
diversity, independence of the supervisory board, TMT tenure, prior performance, and
degree of individualism of the country where firms are located.
Firm size was measured by the assets size, computed as the natural logarithm of the total
assets of each firm. The size of the company signals different environmental constraints,
for instance the capacity to grow or the capacity to take debt.
TMT size was determined as the natural logarithm of the number of TMT members in
each company. It allows to moderate the different types of conflict, since the larger TMT
size allows to reduce agency conflicts and hazardous decisions by the predominant group.
The industry control variable was composed by six industry dummy variables
representing six different industries, considering that the firms without an industry
classification in the database were included in the intersect, “α”. Similarly to the firm size,
the industry variable allows to understand the environmental constraints of each firm.
Gender diversity was proxy by the female ratio, computed as the proportion of women
managers in the TMT of each company. Although, women representativeness is low, it is
expected that women’s different perspective has a moderating impact in decisions.
The degree of independence of the supervisory board was obtained using the “dependency
ratio”, computed as the percentage of supervisory roles performed by executive managers.
The variable allows to understand how much decision making power executive managers
has.
TMT tenure stands for the number of years the managers belonging to the TMT have been
working together as part of the TMT in that specific company.
Contrary Zee and Swagerman (2009), who measured tenure as the length of time each
manager had been working in that company, the method chosen, in the current research,

31
considers that TMT tenure can only act as a moderating factor if managers have been
working together in the current role building trust and procedures.
The measures of prior performance depended on the specific model in which they were
applied, thus three control variables were built, previous year sales growth, previous year
profit margin and previous year ROA. As referred by Honing (2012), the current year
performance may be a result of previous years’ performance.
Finally, Hofstede (2001) has shown that some specific culture indicators, such as the
country’s individualism, are significantly different across countries. Given its expected
significant impact, the firms’ countries degree of individualism was considered.
The importance of these variable is supported by the results from Ferris et al. (2013) who
found a significant relationship between the overconfidence of individuals from a country,
which can be influenced by individualism, with the number of M&A deals.
Concluding, most of the control variables chosen have been used previously by other
researchers. In the following table a comparison between the proxy of the current research
and the ones chosen by other authors is made:
Table 16 - Set of control variables used
4.2 Models constructed
Conducting the study of different relationships between TMT characteristics and firm
decisions and performance indicators implies the determination of different databases and
models to address each specific Proposition presented by Hambrick and Mason (1984).

32
The first model addresses Proposition 1, which considered as dependent variable the
solvency ratio of each firm for each year, and as explanatory variable the average age of
the TMT members:
Solvency ratio𝑖,𝑡 = 𝛼 + 𝛽1𝑖,𝑡𝐴𝑔𝑒 + 𝛽2,𝑖,𝑡𝐴𝑠𝑠𝑒𝑡𝑠 𝑠𝑖𝑧𝑒 + 𝛽3,𝑖,𝑡𝐹𝑒𝑚𝑎𝑙𝑒 𝑟𝑎𝑡𝑖𝑜 +
𝛽4,𝑖,𝑡𝐵𝑜𝐷 𝑟𝑎𝑡𝑖𝑜 + 𝛽5,𝑖,𝑡𝑇𝑀𝑇 𝑡𝑒𝑛𝑢𝑟𝑒 + 𝛽6,𝑖𝑇𝑀𝑇 𝑠𝑖𝑧𝑒 + 𝛽7,𝑖13𝐼𝑛𝑑𝑢𝑠𝑡𝑟𝑦 + ∈𝑖,𝑡 (1)
The second model also focused on Proposition 1, by studying the impact of age on the
percentage of unrelated corporate acquisitions made by the firm each year. Differently,
from the first model the data available did not allow for the use of a panel data model,
since there were not enough firms with acquisitions occurring each single year:
Unrelated diversification𝑖 = 𝛼 + 𝛽1𝑖𝐴𝑔𝑒 + 𝛽2,𝑖𝐴𝑠𝑠𝑒𝑡𝑠 𝑠𝑖𝑧𝑒 + 𝛽3,𝑖𝐹𝑒𝑚𝑎𝑙𝑒 𝑟𝑎𝑡𝑖𝑜 +
𝛽4,𝑖𝐼𝑛𝑑𝑖𝑣𝑖𝑑𝑢𝑎𝑙𝑖𝑠𝑚 + 𝛽5,𝑖𝐵𝑜𝐷 𝑟𝑎𝑡𝑖𝑜 + 𝛽6,𝑖𝑇𝑀𝑇 𝑡𝑒𝑛𝑢𝑟𝑒 + 𝛽7,𝑖𝑇𝑀𝑇 𝑠𝑖𝑧𝑒 +
𝛽8,𝑖14𝐼𝑛𝑑𝑢𝑠𝑡𝑟𝑦 + ∈𝑖 (2)
The third model is the first one to study Proposition 2, considering as dependent variable
the variability in performance, measured by two different variables, the profit margin and
ROA, and as explanatory variable the average age of the TMT members.
Profit Margin Volatility𝑖 = 𝛼 + 𝛽1𝑖𝐴𝑔𝑒 + 𝛽2,𝑖𝐴𝑠𝑠𝑒𝑡𝑠 𝑠𝑖𝑧𝑒 + 𝛽3,𝑖𝐹𝑒𝑚𝑎𝑙𝑒 𝑟𝑎𝑡𝑖𝑜 +
𝛽4,𝑖𝐵𝑜𝐷 𝑟𝑎𝑡𝑖𝑜 + 𝛽5,𝑖𝑇𝑀𝑇 𝑡𝑒𝑛𝑢𝑟𝑒 + 𝛽6,𝑖𝑇𝑀𝑇 𝑠𝑖𝑧𝑒 + 𝛽7,𝑖13𝐼𝑛𝑑𝑢𝑠𝑡𝑟𝑦 + ∈𝑖 (3𝑎)
ROA Volatility𝑖 = 𝛼 + 𝛽1𝑖𝐴𝑔𝑒 + 𝛽2,𝑖𝐴𝑠𝑠𝑒𝑡𝑠 𝑠𝑖𝑧𝑒 + 𝛽3,𝑖𝐹𝑒𝑚𝑎𝑙𝑒 𝑟𝑎𝑡𝑖𝑜 +
𝛽4,𝑖𝐵𝑜𝐷 𝑟𝑎𝑡𝑖𝑜 + 𝛽5,𝑖𝑇𝑀𝑇 𝑡𝑒𝑛𝑢𝑟𝑒 + 𝛽6,𝑖𝑇𝑀𝑇 𝑠𝑖𝑧𝑒 + 𝛽7,𝑖13𝐼𝑛𝑑𝑢𝑠𝑡𝑟𝑦 + ∈𝑖 (3𝑏)
Since the variability of performance was measured as the standard deviation of the profit
margin and of the ROA of each firm, a cross-sectional analysis was also performed, using
the average figures of the explanatory and control variables for the study period, ranging
from 2004 to 2013.

33
Proposition 2 also comprised the study of relationship between the firm growth in return,
measured by sales growth, and the average age of the TMT members.
This specific relationship was studied using both a cross-sectional and a panel data
analysis, allowing to understand the effect of age on growth in a yearly basis and over an
extended period. Consequently two models were built:
Sales growth𝑖 = 𝛼 + 𝛽1𝑖𝐴𝑔𝑒 + 𝛽2,𝑖𝐴𝑠𝑠𝑒𝑡𝑠 𝑠𝑖𝑧𝑒 + 𝛽3,𝑖𝐹𝑒𝑚𝑎𝑙𝑒 𝑟𝑎𝑡𝑖𝑜 +
𝛽4,𝑖𝐵𝑜𝐷 𝑟𝑎𝑡𝑖𝑜 + 𝛽5,𝑖𝑇𝑀𝑇 𝑡𝑒𝑛𝑢𝑟𝑒 + 𝛽6,𝑖𝑇𝑀𝑇 𝑠𝑖𝑧𝑒 + 𝛽7,𝑖13𝐼𝑛𝑑𝑢𝑠𝑡𝑟𝑦 + ∈𝑖 (4𝑎)
Sales growth𝑖,𝑡 = 𝛼 + 𝛽1𝑖,𝑡𝐴𝑔𝑒 + 𝛽2,𝑖,𝑡𝐴𝑠𝑠𝑒𝑡𝑠 𝑠𝑖𝑧𝑒 + 𝛽3,𝑖,𝑡𝐹𝑒𝑚𝑎𝑙𝑒 𝑟𝑎𝑡𝑖𝑜 +
𝛽4,𝑖,𝑡𝐵𝑜𝐷 𝑟𝑎𝑡𝑖𝑜 + 𝛽5,𝑖,𝑡𝑇𝑀𝑇 𝑡𝑒𝑛𝑢𝑟𝑒 + 𝛽6,𝑖𝑇𝑀𝑇 𝑠𝑖𝑧𝑒 +
+𝛽7,𝑖,𝑡𝑃𝑟𝑒𝑣𝑖𝑜𝑢𝑠 𝑦𝑒𝑎𝑟 𝑔𝑟𝑜𝑤𝑡ℎ + 𝛽8,𝑖14𝐼𝑛𝑑𝑢𝑠𝑡𝑟𝑦 + ∈𝑖,𝑡 (4𝑏)
Since the data available started in 2004 the sales growth values had to be computed
starting from 2005, thus reducing the study period of model 4a to the set of years ranging
from 2005 until 2013.
The variable “previous year growth” was added to model 4b, as a measure of prior
performance, resulting in the reduction of the study period to the timeframe ranging from
the 2006 to 2013.
Propositions 3 and 4 comprised the analysis of the relationship between diversification,
measured by the degree of unrelated businesses acquired by each firm, and the functional
track of each TMT member:
Unrelated acquisition𝑖 = 𝛼 + 𝛽1𝑖𝑂𝑢𝑡𝑝𝑢𝑡 𝑟𝑎𝑡𝑖𝑜 + 𝛽2,𝑖𝐴𝑠𝑠𝑒𝑡𝑠 𝑠𝑖𝑧𝑒 +
𝛽3,𝑖𝐹𝑒𝑚𝑎𝑙𝑒 𝑟𝑎𝑡𝑖𝑜 + 𝛽4,𝑖𝐼𝑛𝑑𝑖𝑣𝑖𝑑𝑢𝑎𝑙𝑖𝑠𝑚 + 𝛽5,𝑖𝐵𝑜𝐷 𝑟𝑎𝑡𝑖𝑜 + 𝛽6,𝑖𝑇𝑀𝑇 𝑡𝑒𝑛𝑢𝑟𝑒 +
𝛽7,𝑖𝑇𝑀𝑇 𝑠𝑖𝑧𝑒 + 𝛽8,𝑖13𝐼𝑛𝑑𝑢𝑠𝑡𝑟𝑦 + ∈𝑖 (5)
As in Proposition 1 the model used recurred to a cross-section regression, but the study
period had to be reduced, ranging from 2006 until 2013, in order to have enough
information for a low number of companies, 24 firms were studied.

34
Finally, Propositions 21 and 22 were addressed by analyzing the impact of TMT
heterogeneity in corporate performance, measured by the profit margin and ROA, in both
stable and turbulent economic environments.
Given the fact that the analysis comprised two different types of environments, the study
period was divided in two equal timeframes, namely the stable period ranged from 2005
until 2007 and the turbulent period ranged from 2008 until 2010 respectively. The model
was used in both periods was:
Profit Margin𝑖,𝑡 = 𝛼 + 𝛽1𝑖,𝑡𝐻𝑒𝑡𝑒𝑟𝑜𝑔𝑒𝑛𝑒𝑖𝑡𝑦 𝐼𝑛𝑑𝑒𝑥 + 𝛽2,𝑖,𝑡𝐴𝑠𝑠𝑒𝑡𝑠 𝑠𝑖𝑧𝑒 +
𝛽3,𝑖,𝑡𝐹𝑒𝑚𝑎𝑙𝑒 𝑟𝑎𝑡𝑖𝑜 + 𝛽4,𝑖,𝑡𝐵𝑜𝐷 𝑟𝑎𝑡𝑖𝑜 + 𝛽5,𝑖,𝑡𝑇𝑀𝑇 𝑡𝑒𝑛𝑢𝑟𝑒 + 𝛽6,𝑖𝑇𝑀𝑇 𝑠𝑖𝑧𝑒 +
+𝛽7,𝑖,𝑡𝑃𝑟𝑒𝑣𝑖𝑜𝑢𝑠 𝑦𝑒𝑎𝑟 𝑃𝑟𝑜𝑓𝑖𝑡 𝑀𝑎𝑟𝑔𝑖𝑛 + 𝛽8,𝑖14𝐼𝑛𝑑𝑢𝑠𝑡𝑟𝑦 + ∈𝑖,𝑡 (6𝑎)
ROA𝑖,𝑡 = 𝛼 + 𝛽1𝑖,𝑡𝐻𝑒𝑡𝑒𝑟𝑜𝑔𝑒𝑛𝑒𝑖𝑡𝑦 𝐼𝑛𝑑𝑒𝑥 + 𝛽2,𝑖,𝑡𝐴𝑠𝑠𝑒𝑡𝑠 𝑠𝑖𝑧𝑒 + 𝛽3,𝑖,𝑡𝐹𝑒𝑚𝑎𝑙𝑒 𝑟𝑎𝑡𝑖𝑜 +
𝛽4,𝑖,𝑡𝐵𝑜𝐷 𝑟𝑎𝑡𝑖𝑜 + 𝛽5,𝑖,𝑡𝑇𝑀𝑇 𝑡𝑒𝑛𝑢𝑟𝑒 + 𝛽6,𝑖𝑇𝑀𝑇 𝑠𝑖𝑧𝑒 + +𝛽7,𝑖,𝑡𝑃𝑟𝑒𝑣𝑖𝑜𝑢𝑠 𝑦𝑒𝑎𝑟 𝑅𝑂𝐴 +
𝛽8,𝑖14𝐼𝑛𝑑𝑢𝑠𝑡𝑟𝑦 + ∈𝑖,𝑡 (6𝑏)
The “previous year profit margin” and “previous year ROA” were added as control
variables based on the same expectations of model 4b, in which the profitability of one
year will impact the actions of the TMT in the following year.

35
5. Empirical results
5.1 Results from the regressions
The models presented in the previous Chapter, and their respective databases, were tested
using the tool “E-views”, whose outputs are presented in appendix 1.
As stated in the “Base model” Section, the analysis of the selected Propositions intended
to extend the use of panel data to the study of the Upper Echelons Theory, being this
method applied in three out of the six models.
In the models in which panel data was used, the random effects method of estimation was
chosen, since the activity of each company depends partially on the environment in which
each company operates, not being expected a common intersect for all the firms.
Proposition 1
The first model to be estimated, used the panel data method, and intended to understand
if the age of the TMT members of European firms impacts the risk taking behavior,
measured by the Solvency Ratio, of these firms.
Proposition 1, assumes that as individuals get older their risk taking behavior reduces,
implying that an older TMT would prefer a lower leverage, i.e. a higher solvency ratio.
The results of the estimation of the model are presented below:
36
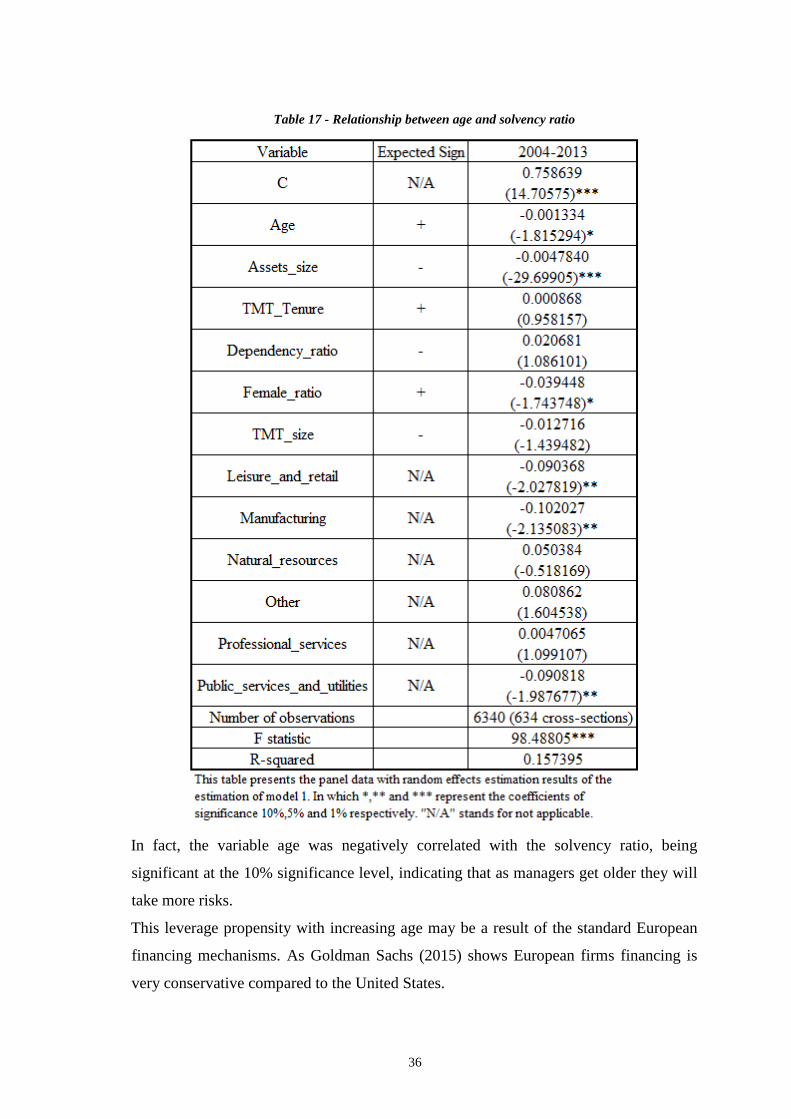
Table 17 - Relationship between age and solvency ratio
In fact, the variable age was negatively correlated with the solvency ratio, being
significant at the 10% significance level, indicating that as managers get older they will
take more risks.
This leverage propensity with increasing age may be a result of the standard European
financing mechanisms. As Goldman Sachs (2015) shows European firms financing is
very conservative compared to the United States.

37
In fact more than 70% of financing comes from bank loans, which usually demand
guarantees and proven capabilities, features which are associated with more experienced
managers.
Assets size was also found to be negatively correlated with the solvency ratio. These
results may be justified by the fact that companies with a greater amount of assets are able
to support a greater amount of debt.
Against expectations, the female ratio was also negatively correlated with the solvency
ratio, and thus the result point out that in fact companies with more female managers risk
more, by taking more debt.
Finally, some industries presented significant results, meaning that, as expected, leverage
do not depend only on the TMT characteristics but also on industry standards.
The study of Proposition 1 was complemented with the analysis of the impact of age in
the degree of unrelated corporate acquisitions, being older TMT’s acquire more unrelated
businesses in order to diversify their investments and reduce risks. The results of the
model tested are presented in the Table below:

38
Table 18 – Relationship between age and corporate diversification
Results show that there is no significant relationship between age and the degree of
diversification. However, as defended by Hofstede (2001) the cultural variable
individualism had a significant impact by being negatively associated with the degree of
diversification of corporate acquisitions.

39
These results show that more individualistic cultures prefer more risky policies, namely
towards concentration, contradicting Ferris et al. (2013) who found similar impacts of
overconfidence in concentration and diversification.
Additionally, oppositely to expectations the dependency ratio was found to be positively
associated with the degree of diversification of M&A deals, indicating that when the
executive board has greater discretion there is a tendency to acquire unrelated businesses.
This specific result may be related to the hubris hypothesis in corporate takeovers
defended by Roll (1986) who defended that managers may acquire other firms to grow
their power.
Therefore, when the supervisory board cannot prevent the executive board from acting on
hubris, it is likely that number of acquisitions increase thus increasing the likelihood of
diversification.
Proposition 2
According to Proposition 2, the risk taking behavior of younger managers will imply
higher growth in returns but also a higher volatility in performance. Since the impact of
risk taking on return is twofold two models were built.
The first model, tested the impact of age on the variability of return, measured by the
standard deviation of the profit margin and of ROA. The second model tested the impact
of age in growth in return, measured by the growth in sales.
The second model was tested using both a panel data methodology and a cross-sectional
methodology, in order to infer the impact of age in sales growth yearly and over a period.
The results of the first model are presented below:

40
Table 19 - Relationship between age and firm's volatility in profit margin

41
Table 20 - Relationship between age and firm's volatility in ROA
Against expectations the variable age has a slightly positive significant impact on the
variability of the profit margin, implying that as TMT members get older they implement
riskier policies making the volatility in return increase. Age was also found to have no
impact on the volatility of ROA.

42
A possible explanation may be the rigidity in decision making, in an environment that is
facing deep changes, as defended by Chown (1960). This rigidity will imply a slower
response to changing environments and consequently a greater impact on the profitability.
In accordance with expectations it was found that the TMT size negatively impacts the
variability in the profit margin, corroborating the assumption from Germet (2011), that
the larger the TMT the more difficult it is for the dominant sub-group to act
independently, reducing the risks taken.
Also, in accordance with expectations the variable dependency ratio was found to be
positively and significantly related with ROA volatility, implying that a management with
greater power will affect more the decisions taken, thus accentuating impact of their
personal characteristics on the decisions and on performance.
The assets size variable was also found to impact negatively the volatility ROA, thus as
the company gets larger it will get a lower volatility in profitability.
Finally, the TMT tenure was also negatively associated with the volatility in ROA,
implying that as the TMT members relationships increase so will the alignment between
their opinions, resulting in a lower risk taking behavior.
As stated previously the second model, which addressed Proposition 2, was implemented
using two different methods. The estimation of the first method which considered the
impact of age on sales growth over an extended period are presented below:

43
Table 21 - Relationship between age and growth over an extended period
As shown by the results and according to expectations age was found to be negatively
correlated with sales growth. These results are aligned with the findings presented by
Norburn (1986) and Norburn and Birley (1986), and Marinova et al. (2010), implying
that on the long-run companies with older manager will tend to have a lower growth.

44
The variable TMT tenure, as expected, was found to be negatively correlated with sales
growth. As expected if the TMT tenure increases the alignment between TMT members
also increases, reducing extreme positions which implies a conversion to risk neutrality.
The second implementation of the model studied the impact of age in yearly sales growth:
Table 22 - Relationship between age and yearly growth

45
No statistically significant result was found between TMT average age and the yearly
growth in sales.
The only variable which presented statistically significant results was assets size, which
against expectations presented a positive relationship with the yearly growth in sales. This
result implies that the larger companies have a greater growth capacity each year.
Proposition 3 and 4
According to Propositions 3 and 4, managers with an output related background will also
take decisions much more focused on innovation and on increasing their markets,
implying that they would be tempted to invest in unrelated firms.
The model constructed intended to use the previous roles performed by the TMT as a sign
of the degree of diversification of corporate acquisitions. However, due to the reduced
number of firms in the sample-database the results were inconclusive, as it is possible to
observe in the following table:

46
Table 23 - Relationship between functional track and corporate diversification
Proposition 21 and 22
The last model to be implemented intended to test Propositions 21 and 22, according to
which it is expected that in stable economic environments homogeneity has a positive
effect on performance, and that in turbulent environments TMT heterogeneity will lead
to better results.

47
The impact of TMT heterogeneity on firm performance was studied considering both the
profit margin and ROA proxy of financial return. The results of the estimation of the
impacts of TMT heterogeneity on both variables are as shown in the following Tables:
Table 24 - Relationship between TMT heterogeneity and profit margin

48
Table 25 - Relationship between TMT heterogeneity and ROA
According to expected, results show that the previous year performance indicators, either
profit margin or ROA, had a positive and significant impact on the performance of the
current year, implying that the decisions taken always consider past performance.
TMT tenure presented a positive relationship with the profit margin, which is according
to expectations and implies that the extent of time TMT members work together the

49
greater their alignment between the TMT, which translates into a lower degree of conflict
and consequently a greater return.
Also according to expectations the assets size was found negatively correlated with ROA,
implying that the growth in assets does not translate in a proportional growth in sales.
Finally, the Blau heterogeneity index of heterogeneity was found to be negatively
correlated with profitability on both economic periods, and over the entire study period.
These results in the stable economic period are in line with Hambrick and Mason (1984)
expectations, since in stable periods companies with TMT members with similar
characteristics will have a lower level of conflict, making it easier to apply the standard
internal policies which maximize the return.
However, the results in the turbulent period contradict the original Theory, indicating that
in turbulent periods the affective conflict generated by diversity will have a greater impact
on performance than the benefits of different experiences.
Overall, these results contradict the research made in Europe, namely Marinova (2010)
and Tibben (2010) which also found no impact of diversity, and Germet (2011) and
Honing (2012) who found a positive impact of nationality diversity on performance.
Comparing these results with studies outside Europe, they are found to be aligned with
the results of Miller et al. (1998) and West and Schwenk (1996), who defend the positive
impact of TMT homogeneity.
Concluding, the results indicate that to survive negative periods the company has to decide
and act quickly and in consonance, therefore using the best of opinions, in the shortest
period of time.
In a heterogeneous TMT environment without the proper managing tools the process of
gathering, debating and deciding, taking into consideration all TMT members opinion,
can be difficult, and thus a stronger guidance based on a lower number of opinions may
be preferable, as discussed by Goldstein et al. (1985).
5.2 Consistency checks
The models presented in the previous session were tested in order to verify the consistency
of their results. The first checks performed were the tests of autocorrelation and
heteroscedasticity of the cross-sectional models, their results are shown in appendix 2.
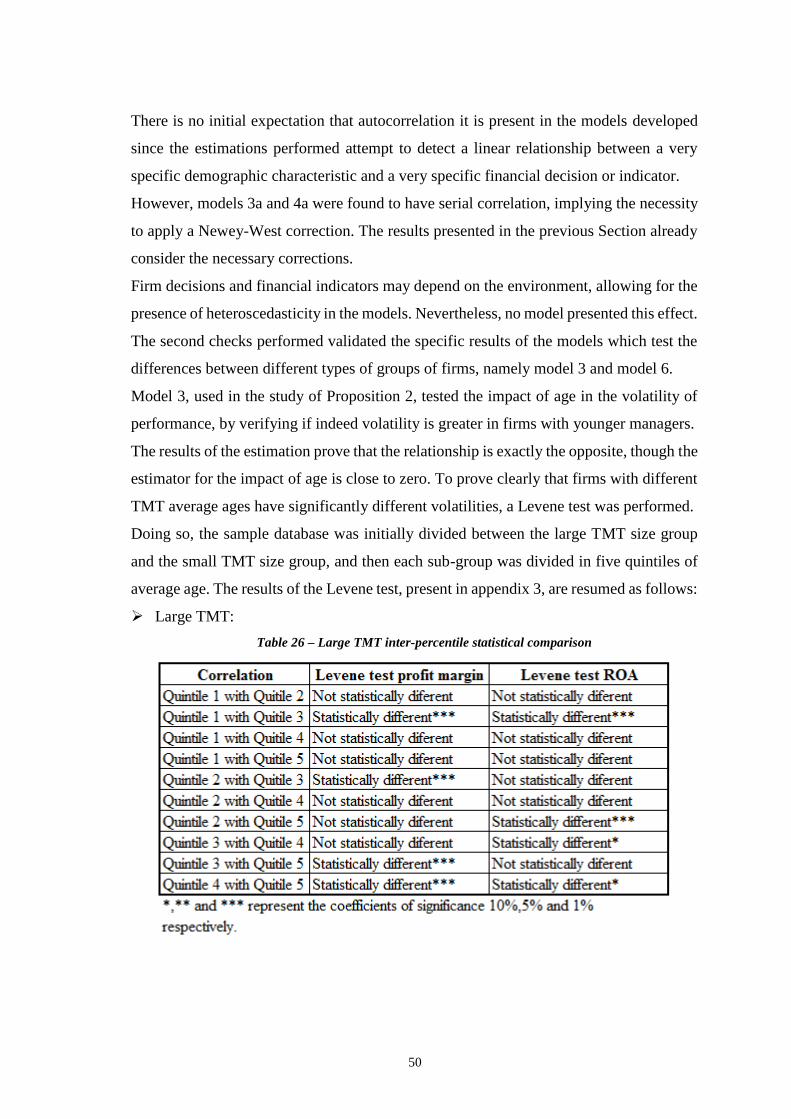
50
There is no initial expectation that autocorrelation it is present in the models developed
since the estimations performed attempt to detect a linear relationship between a very
specific demographic characteristic and a very specific financial decision or indicator.
However, models 3a and 4a were found to have serial correlation, implying the necessity
to apply a Newey-West correction. The results presented in the previous Section already
consider the necessary corrections.
Firm decisions and financial indicators may depend on the environment, allowing for the
presence of heteroscedasticity in the models. Nevertheless, no model presented this effect.
The second checks performed validated the specific results of the models which test the
differences between different types of groups of firms, namely model 3 and model 6.
Model 3, used in the study of Proposition 2, tested the impact of age in the volatility of
performance, by verifying if indeed volatility is greater in firms with younger managers.
The results of the estimation prove that the relationship is exactly the opposite, though the
estimator for the impact of age is close to zero. To prove clearly that firms with different
TMT average ages have significantly different volatilities, a Levene test was performed.
Doing so, the sample database was initially divided between the large TMT size group
and the small TMT size group, and then each sub-group was divided in five quintiles of
average age. The results of the Levene test, present in appendix 3, are resumed as follows:
Large TMT:
Table 26 – Large TMT inter-percentile statistical comparison

51
Small TMT:
Table 27 - Small TMT inter-percentile statistical comparison
As we can observe, in the larger TMT groups the variance of performance indicators of
most of the age quintiles is not statistically different.
On the other hand, on the smaller TMT groups, the variance of profit margin of nine out
of ten quintile relationships is statistically different, and the variance of ROA of six out
of ten quintile relationship is statistically different.
Thus, we can conclude that for the small TMT group, which composes the large majority
of the database, the age of the TMT is significantly correlated with the volatility of the
profit margin.
On the other hand, given the low number of statistical differences between age quintiles,
we cannot conclude that the age of the TMT is significantly correlated with ROA
volatility.
Model 6, used in the study of Propositions 21 and 22, intended to test the different impacts
of the TMT heterogeneity on the performance of the firms, given a specific economic
environment, either stable or turbulent.
The analysis of the database clearly indicates that from 2007 to 2008 the performance of
the companies dropped suddenly, which indicates the expected transition between
environments due to the sub-prime crisis.
In order to support the results presented in the previous Section, an Anova analysis was
performed, proving that there is a statistically significant difference between the profit
margins and the ROA of the firms’ pre-2008 and post-2008.

52
The profit margin the Anova F-Test, presented in appendix 4, presents a value of
34.63477, proving that the profit margins’ were statistically significantly different,
between the two periods, at the 1% significance level.
The ROA the Anova F-Test, presented in appendix 4, presents a value of 6.776375,
proving that the ROAs’ were statistically significantly different, between the two periods,
also at the 1% significance level.

53
6. Conclusion
The Upper Echelons Theory presented in 1984 by Hambrick and Mason has been subject
to multiple tests using distinct methods during the last three decades. The results from
these previous studies have lead to a better knowledge regarding the managerial impact
on the decisions and performance of companies.
The great majority of past studies focused on specific environmental circumstances,
industries and countries, being mainly performed in samples of firms operating in the
United States. Therefore, the knowledge regarding the impact of managers in European
companies is still scarce.
The current study attempts to increase the knowledge on European companies’ decision
making by introducing a different methodology. This new approach considers a cross-
national European environment, in which the firms are treated as equal independently of
the country in which they are based.
The approach chosen contradicts the criticism made by Hambrick (2007), assuming that
the influence of specific characteristics of managers on the decisions taken by the firms
should not be entirely connected to the culture of each manager.
In order to apply this methodology some of the original Propositions presented by
Hambrick and Mason (1984) were tested using a large sample of firms across a broad
study period, ranging from the beginning of 2004 until the end of 2013.
Once again, the methods chosen differ from previous research, firstly by avoiding the
restriction of the study of the Upper Echelons Theory to specific environmental
circumstances, and secondly by preventing the use of survey methodologies which
depend greatly on the rates of response.
Finally, the current research builds on knowledge gathered from previous studies, namely
by considering as part of the TMT both executive management and the supervisory
boards, since it is expected that human traits influence the perception of all the managers.
As a result of this approach it was possible to better understand the influence of some
TMT characteristics on the decisions and performance of European firms.
The first main finding contradicted the results from Bertrand e Schoar (2003) since, in
European firms, age has been found to be positively correlated with leverage.
54
These results may be associated with the conservative financing structure of European
firms, which favors loans whose clauses may be excessively demanding for younger and
less experienced managers with a lower wealth.
The second conclusion allows to realize that corporate acquisitions are not solely
influenced by managers’ personal characteristics, it is in fact also a result of specific
cultural variables, namely the individualism of the country where companies are located,
as Hofstede (2001) and Ferris et al. (2013) have point out.
The third conclusion contradicted the original expectations of Hambrick and Mason
(1984) once again, since age has been found to be positively associated with the volatility
of profitability, when measured by the profit margin.
In accordance to the Upper Echelons Theory it has been found that age is negatively
correlated with sales growth. Once again the findings do not support the idea that younger
managers risk more, although they seem to have a better sales growth.
Finally, the most interesting and surprising findings were related to TMT heterogeneity
which was found to be overall negatively correlated with firm performance, measured by
two indicators the profit margin and ROA.
Dividing the study period into a stable, 2005 to 2007, and a turbulent economic period,
2008-2010, it was possible to find a statistically significant negative correlation between
diversity and the profit margin for the turbulent period, and a significant negative
correlation between diversity and ROA for both the stable and the turbulent periods.
These results support the theory for the stable period, since it is expected that
homogeneous TMTs act in an aligned way following the structures and procedures
already in place.
On the other hand, contrary to the Theory results indicate that in turbulent periods TMT
heterogeneity impacts negatively performance, which may be a result from affective
conflict present in stressful environments.
Concluding, these findings corroborate the arguments presented by Goldstein et al.
(1985), Lejarraga et al. (2014) and Diskell and Salas (1991), which indicate that under
threat groups show rigidity in the decision making process, and react slowly to the
changes in the environment.

55
Therefore, in a turbulent economic situation it may be preferable to concentrate the
decision making process in a more restrict and homogeneous group, in order to prevent
the negative consequences of a slow reaction.
Finalizing, the aforementioned results shall be used with caution since they depend on the
samples used, which depend on the availability of information in the databases, and on
the classification of the functional background and types of M&A variables, which
followed the criteria presented in appendix 5.
Nevertheless, as mentioned previously, the use of a large database allows for a less biased
analysis than questionnaire methods, being expected that the future improvement of the
quality of information, present in the databases, will increase the knowledge on the
European companies’ decision making process.

56
References
Adams, R. B. et al. D. (2005), “Powerful CEOs and Their Impact of Corporate
Performance”, The Review of Financial Studies, Vol.18, No.4, pp.1403-1432
Allemand, I. et al. (2014), “Institutional theory and gender diversity on European
Boards”, Working paper, Cahiers du CEREN 46
Amason, A. C. (1996), “Distinguishing the Effects of Functional and Dysfunctional
Conflict on Strategy Decision Making: Resolving the Paradox for Top Management
Teams”, The Academy of Management Journal, Vol.39, No.1, pp.123-148
Baker, C. (2014), “Stereotyping and women’s roles in leadership positions”, Industrial
and Commercial Training, Vol. 46, No. 6, pp. 332-337
Bennedsen, M. et al. D. (2007), “Do CEOs Matter?”, Working paper, Copenhagen
Business School, Columbia University and New York University
Bergen, C.W. V. et al. (2005), “Workforce diversity and organizational performance”,
Equal Opportunities International, Vol.24, No.3/4, pp.1-16
Bertrand, M. and Schoar, A. (2003). “Managing with Style: the Effect of Managers on
Firm Policies.”, Quarterly Journal of Economics, Vol. 118, No.4, pp.1169-1208
Boeker, W. (1997), “Strategic Change: The Influence of Managerial Characteristics and
Organizational Growth”, The Academy of Management Journal, Vol.40, No.1, pp.152-
170
Carlsson, G. and Karlsson, K. (1970), “Age, Cohorts and the Generation of Generations”,
American Sociological Review, Vol.35, No.4, pp.710-718
Carpenter, M. A. et al. (2004), “Upper Echelons Revised: Antecedents, Elements, and
Consequences of Top Management Team Composition”, Journal of Management,
Vol.30, No.6, pp.749-778
Carson, C. M. et al. (2004), “Performance gains through diverse top management teams”,
Team Performance Management: An International Journal, Vol.10, No.5/6, pp. 121-126
Certo, S. T. et al. (2006), “Top Management Teams, Strategy and Financial Performance:
A Meta-Analytic Examination”, Journal of Management Studies, Vol.43, No.4, pp.813-
839
Child, J. (1972), “Organizational Structure, Environment and Performance: The Role of
Strategic Choice”, British Sociological Association, Vol.6, No.1, pp.2-22

57
Child, J. (1974), “Managerial and Organizational Factors Associated with Company
Performance”, The Journal of Management Studies, pp.175-189
Clark, J. et al. (2014), “When do CEOs matter? Ownership, governance and the influence
of CEOs on firm performance”, The Leadership Quarterly, Vol. 25, pp. 358-372
Chown, S. (1960), “A Factor Analysis of the Wesley Rigidity Inventory: Its Relationship
to Age and Nonverbal Intelligence”, Journal of Abnormal and Sociological Psychology,
Vol.61, No.3, pp.491-494
D’Aventi, R. (1990), “Top Managerial Prestige and Organizational Bankruptcy”,
Organizations Science, Vol.1, No.2, pp.121-142
Dearborn, D. and Simon, H. (1958), “Selective Perception: A Note on the Departmental
Identifications of Executives”, Sociometry, Vol.21, No.2, pp.140-144
Diskell, J. and Salas, E. (1991), “Group decision making under stress”, Journal of Applied
Psychology, Vol.76, No.3, pp.473-478
Dovidio, J.F. et al. (2009), “Cooperation and Conflict within Groups: Bridging Intragroup
and Intergroup Processes”, Journal of Social Issues, Vol.65, No.2, pp. 429-449
Eisenhardt, K. and Schoonhoven, C. B. (1990), “Organizational Growth: Linking
Funding Team, Strategy, Environment, and Growth Among U.S. Semi-Conductor
Ventures, 1978-1988”, Administrative Science Quarterly, Vol.35, No.3, pp.504-529
Erhardt, N. L., et al. (2003), “Board of Director Diversity and Firm Financial
Performance”, Journal of Corporate Governance, Vol.11, No.2, pp.102-111
Evans, W. R. and Carson, C. M. (2005), “A social capital explanation of the relationship
between functional diversity and group performance”, Team Performance Management:
An International Journal, Vol.11, No.7/8, pp.302-315
Ferris et al. (2013), “CEO Overconfidence and International Merger and Acquisition
Activity”, Journal of Financial and Quantitative Analysis, Vol. 48, No.1, pp.137-164
Fernandez, M. et al. (2014), “Top management demographic characteristics and company
performance”, Industrial Management & Data Systems, Vol. 114, No. 3, pp. 365-386
Germet, P. (2011), “The relationship between board characteristics and corporate
performance: Evidence from the Netherlands”, Master Thesis in Accountancy, Faculty of
Economics and Business Studies, Tilburg University
Graham, J. R. et al. (2013), “Managerial attitudes and corporate actions”, Journal of
Financial Economics, Vol.109, pp.103-121

58
Goldman Sachs (2015), “European Economics Analyst: Unlocking Europe’s economic
potential through financial markets”, Goldman Sachs Economics Research, Issue
No.15/07
Goldstein, D.L. (1985), “Group decision making under threat: The Tycoon Game”, The
Academy of Management Journal, Vol. 28, No.3, pp. 613-627
Hambrick, D. C. (1989), “Guest Editor’s Introduction: Putting Top Managers Back in the
Strategy Picture”, Strategic Management Journal, Vol.10, pp.5-15
Hambrick, D. C. (2007), “Upper Echelons Theory: An Update”, The Academy of
Management Review, Vol.32, No.2, pp.334-343
Hambrick, D. C. and Mason, P. A. (1984), “Upper Echelons: The Organization as a
Reflection of Its Top Managers”, The Academy of Management Review, Vol.9, No.2,
pp.193-206
Hambrick, D. C. and Snow, C. C. (1977), “A Contextual Model of Strategic Decision
Making in Organizations”, Academy of Management Proceedings, pp.109-112
Hayes, R. and Abernathy, W. (1980), “Managing Our Way to Economic Decline”,
Harvard Business Review
Hermann, C. (1963), “Some consequences of crisis which limit the viability of
organizations”, Working Paper
Heyden, M. L. M. (2012), “Essays on Upper Echelons & Strategic Renewal: A Multilevel
Contingency Approach”, PhD Dissertation, Erasmus University Rotherdam
Hofstede, G. (2001), Culture’s Consequences: Comparing Values, Behaviors, Institutions
and Organizations Across Nations 2nd Edition, Sage, Thousand Oaks, California
Honing, S. (2012), “Does diversity in executive boards make a difference? Nationality
Diversity and firm performance in German, Dutch and British Multinational Enterprises”,
Master Thesis, Amsterdam Business School, University of Amsterdam
Kadushin, C. (1995), “Friendship Among the French Financial Elite”, American
Sociological Review, Vol.60, No.2, pp.202-221
Kahneman, D. (2011), Thinking fast and slow, Macmillan
Keck, S. et al. (2014), “Group decision making under ambiguity: Convergence to
neutrality”, Journal of Economic Behavior & Organization, Vol. 103, pp. 60-71

59
Lee, C. and Farh, J.-L. (2004), “Joint Effects of Group Efficacy and Gender Diversity on
Group Cohesion and Performance”, Applied Psychology: An International Review,
Vol.53, No.1, pp.136-154
Lee, J. et al. (2014), “Enablers of top management team support for integrated
management control system innovations”, International Journal of Accounting
Information Systems, Vol.15, pp. 1-25
Lejarraga, T. (2014), “Decisions from experience: How groups and individuals adapt to
change”, Mem Cogn, Vol. 42, pg. 1384-1397
Li, C.R. (2014), “Top management team diversity in fostering organizational
ambidexterity: Examining TMT integration mechanisms”, Innovation: Management
policy & practice, 2014, Vol.16, No.3, pp. 303-332
Lieberson, S. and O’Connor, J. F. (1972), “Leadership and Organizational Performance:
A Study of Large Corporations”, American Sociological Review, Vol.37, No.2, pp.117-
130
Manner, M. H. (2010), “The Impact of CEO Characteristics on Corporate Social
Performance”, Journal of Business Ethics, Vol.93, Supplement 1, pp.53-72
Marimuthu, M. and Kolandisamy, I. (2009), “Demographic Diversity in Top Level
Management and Its Implications on Firm Financial Performance: An Empirical
Discussion”, International Journal of Business and Management, Vol.4, No.6, pp.176-
188
Marinova et al., (2010), “Gender Diversity and Firm Performance: Evidence from Dutch
and Danish Boardrooms”, Working/Discussion paper 10-03, Utrecht School of
Economics, University of Utrecht
McNeil, K. and Thompson, J. (1971), “The Regeneration of Social Organizations”,
American Sociological Review, Vol.36, N.4, pp.624-637
Miles et al. (1978), “Organizational Strategy, Structure and Process”, The Academy of
Management Review, Vol.3, No.3, pp.546-562
Miller et al. (1998), “Cognitive Diversity Among Upper-Echelon Executives:
Implications for Strategic Decision Processes”, Strategic Management Journal, Vol.19,
pp.39-58
Nahavandi, A. (2008), The Art and Science of Leadership 5th Edition, New Jersey:
Prentice Hall

60
Nielsen, S. (2010), “Top Management Team Diversity: A Review of Theories and
Methodologies”, International Journal of Management Reviews, pp.301-316
Nielsen, Bo B. and Nielsen, S. (2013), “Top Management Team Nationality Diversity
and Firm Performance: A Multilevel Study”, Strategic Management Journal, Vol. 34, pp.
372-382
Norburn, D. (1986), “GOGOs, YOYOs and DODOs: Company Directors and Industry
Performance”, Strategic Management Journal, Vol. 7, pp. 101-117
Norburn, D. and Birley, S. (1986), “An Empirical Test of Upper-Echelons Theory”,
Working paper 86.01, National Academy of Management Meeting, Chicago
Priem, R. L. et al. (1999), “Inherent Limitations of Demographic Proxies in Top
Management Team Heterogeneity Research”, Journal of Management, Vol. 25, N.6, pp.
935-953
Robertson, Q. M. and Park, H. J. (2006), “Examining the Link Between Diversity and
Firm Performance: The Effects of Diversity Reputation and Leader Racial Diversity”,
CAHRS Working Paper 06-02, Cornel University
Roll, R. (1986), “The Hubris Hypothesis of Corporate Takeovers”, The Journal of
Business, Vol. 59, No. 2, pp.197-216
Stevens et al., (1978), “Assessing Personal, Role and Organizational Predictors of
Managerial Commitment”, The Academy of Management Journal, Vol. 21, No. 3, pp.
380-396
Straw, B. et al. (1981), “Threat-Rigidity effects in Organizational Behavior: A multi-level
analysis”, Administrative Science Quarterly, Vol. 26, pp. 501-524
Taylor, R. (1975), “Age and Experience as Determinants of Managerial Information
Processing and Decision Making Performance”, The Academy of Management Journal,
Vol. 18, No. 1, pp.74-81
Teixeira, A. (2002), “On the link between human capital and firm performance: A
Theoretical and Empirical Survey”, Working Papers da FEP no. 121, Faculdade de
Economia, Universidade do Porto
Tibben P. (2010), “Top Management Team diversity and firm performance”, Master
Thesis in International Economics and Business, Utrecht School of Economics,
University of Utrecht

61
Tixier, M. (1994), “Management Styles Across Western European Cultures”, The
International Executive, Vol.36, No.4, pp. 377-391
Vries, T. A. (2014), “Antecedents of Individuals’ Inter-team Coordination: Broad
Functional Experiences as a mixed blessing”, The Academy of Management Journal, Vol.
57, No.5, pp. 1334-1359
Weiner, N. and Mahoney, T. A. (1981), “A Model of Corporate Performance as a
Function of Environmental, Organizational and Leadership Influences”, The Academy of
Management Journal, Vol.24, No. 3, pp.453-470
West, C. T. Jr. and Schwenk , C. R. (1996), “Top Management Team Strategic Consensus,
Demographic Homogeneity and Firm Performance: A Report of Resounding Evidence”,
Strategic Management Journal, Vol.17, No.7, pp.571-576
Wiersema, M. F. and Bantel, K. A. (1992), “Top Management Team Demography and
Corporate Strategic Change”, The Academy of Management Journal, Vol.35, No.1,
pp.91-121
Winne, S. D. and Sels, L. (2006), “The Impact of Upper and Lower Echelon Human
Capital and HR Practices on Innovation on Start-ups”, Working paper, Department of
Marketing and Organization Studies, Katholieke Universiteit Leuven
Xiao, Z. et al. (2009), “Economic environment and personality: how do they influence
investment decisions and regret?”, Social Behavior and Personality, Vol. 37, 10, pp.
1297-1304
Yamak, S. et al. (2014), “The Role of External Environment In Upper Echelons Theory:
A Review of Existing Literature and Future Research Directions”, Group and
Organizational Management, Vol.39, 69-109
Zee, A. V. D. and Swagerman, D. (2009), “Upper Echelons Theory and Ethical Behavior:
an Illustration of the Theory and a Plea for its Extension Towards Ethical Behavior”,
Journal of Business Systems, Governance and Ethics, Vol.4, No.2, pp.27-43
Zhu, D. and Chen, G. (2015), “CEO Narcissism and the impact of Prior Board Experience
on Corporate Strategy”, Administrative Science Quarterly, Vol. 60, No.1, pp. 31-65

62
Appendixes
Appendix 1 – E-views models’ outputs
The econometric/statistical software E-views was the tool used in the testing of the
different models. In this appendix the outputs for each model are presented in order to
support the results presented in section 5.1.
Proposition 1 model 1: Relationship between age and solvency ratio
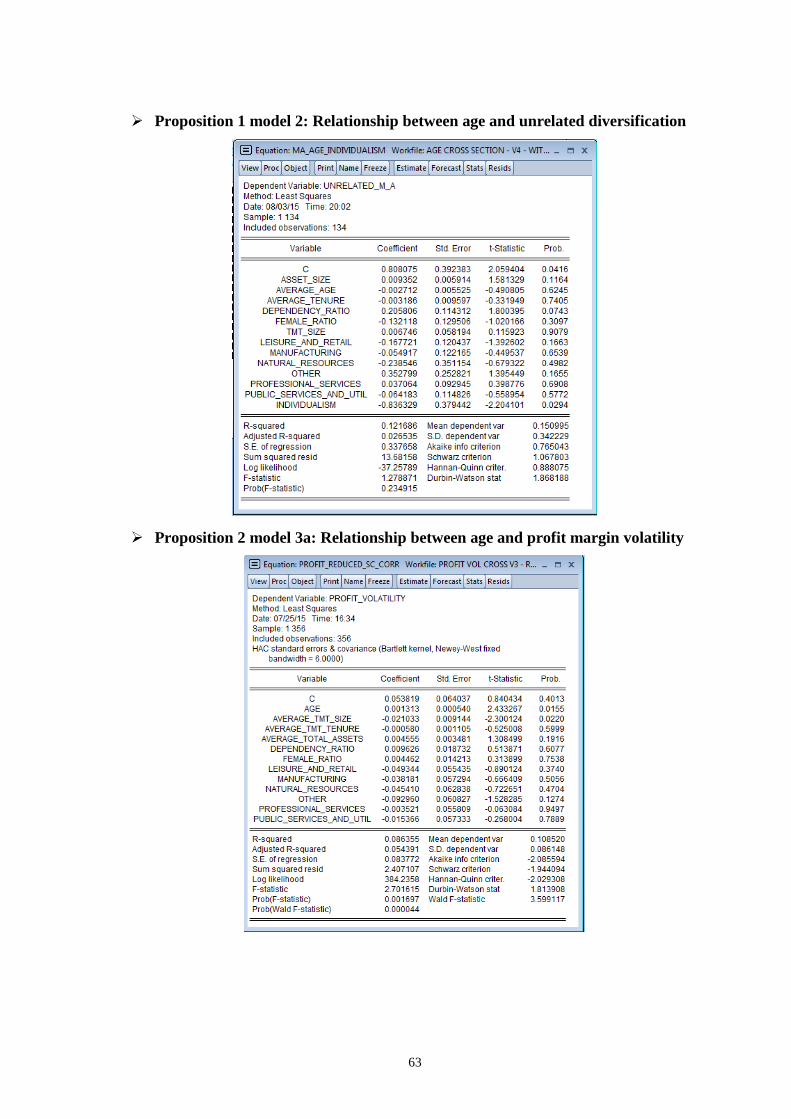
63
Proposition 1 model 2: Relationship between age and unrelated diversification
Proposition 2 model 3a: Relationship between age and profit margin volatility

64
Proposition 2 model 3b: Relationship between age and ROA volatility
Proposition 2 model 4a: Relationship between age and long-term growth

65
Proposition 2 model 4b: Relationship between age and yearly growth

66
Propositions 3 and 4 model 5: Relationship between functional background and
unrelated diversification
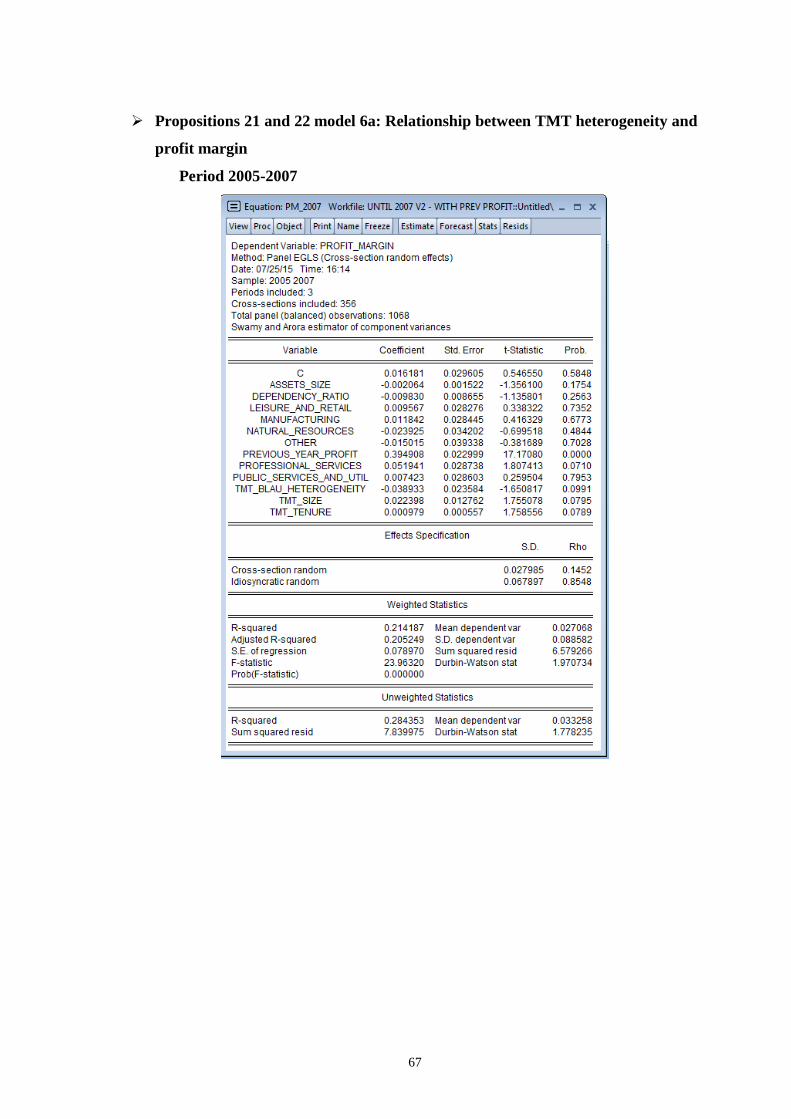
67
Propositions 21 and 22 model 6a: Relationship between TMT heterogeneity and
profit margin
Period 2005-2007
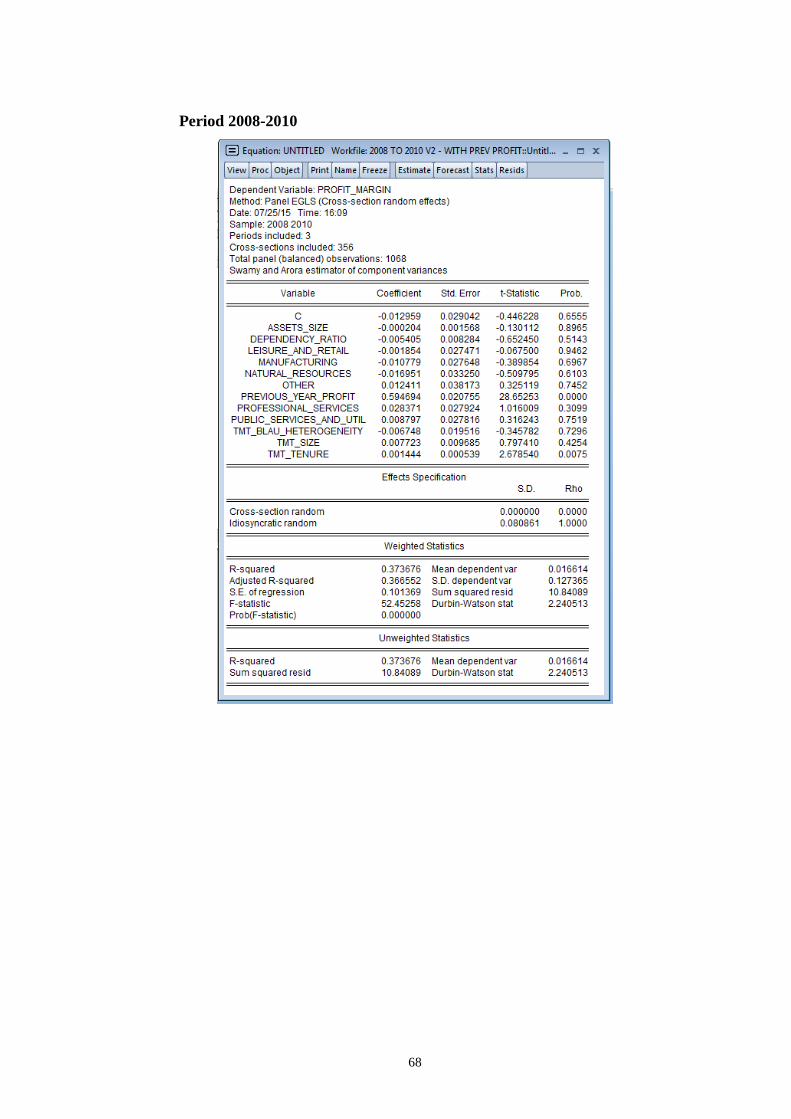
68
Period 2008-2010
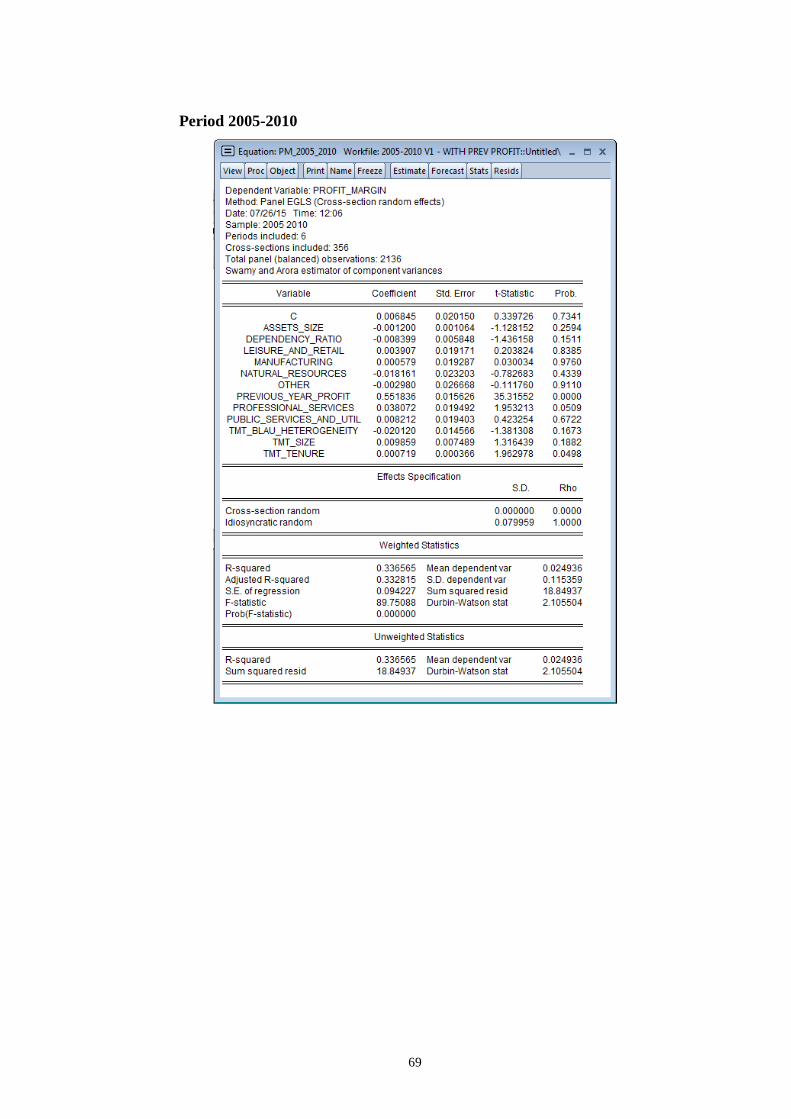
69
Period 2005-2010

70
Propositions 21 and 22 model 6b: Relationship between TMT heterogeneity and
ROA
Period 2005-2007

71
Period 2008-2010

72
Period 2005-2010

73
Appendix 2 – E-views heteroscedasticity and autocorrelation tests
In order to assure the correctness of the results presented above, heteroscedasticity and
autocorrelation tests were run on the cross-section models, using the tool E-views.
Proposition 1 model 2: Relationship between age and unrelated diversification
Proposition 2 model 3a: Relationship between age and profit margin volatility

74
Proposition 2 model 3b: Relationship between age and ROA volatility
Proposition 2 model 4a: Relationship between age and long-term growth

75
Propositions 3 and 4 model 5: Relationship between functional background and
unrelated diversification
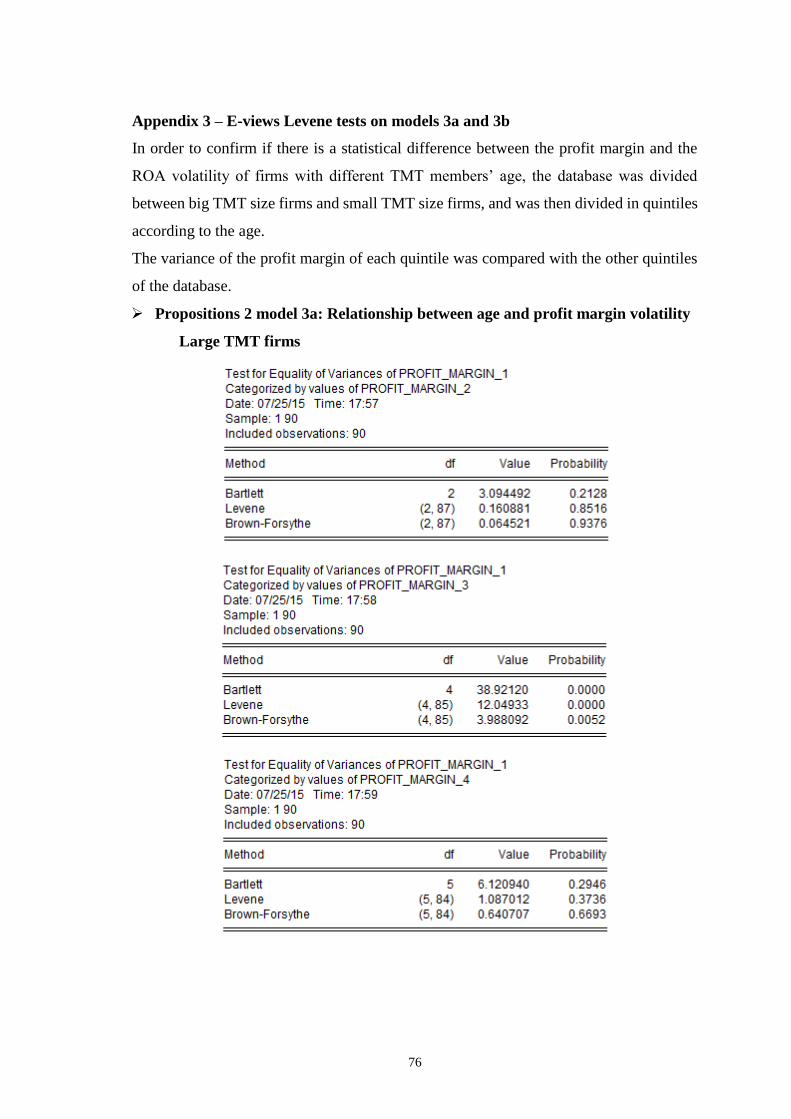
76
Appendix 3 – E-views Levene tests on models 3a and 3b
In order to confirm if there is a statistical difference between the profit margin and the
ROA volatility of firms with different TMT members’ age, the database was divided
between big TMT size firms and small TMT size firms, and was then divided in quintiles
according to the age.
The variance of the profit margin of each quintile was compared with the other quintiles
of the database.
Propositions 2 model 3a: Relationship between age and profit margin volatility
Large TMT firms
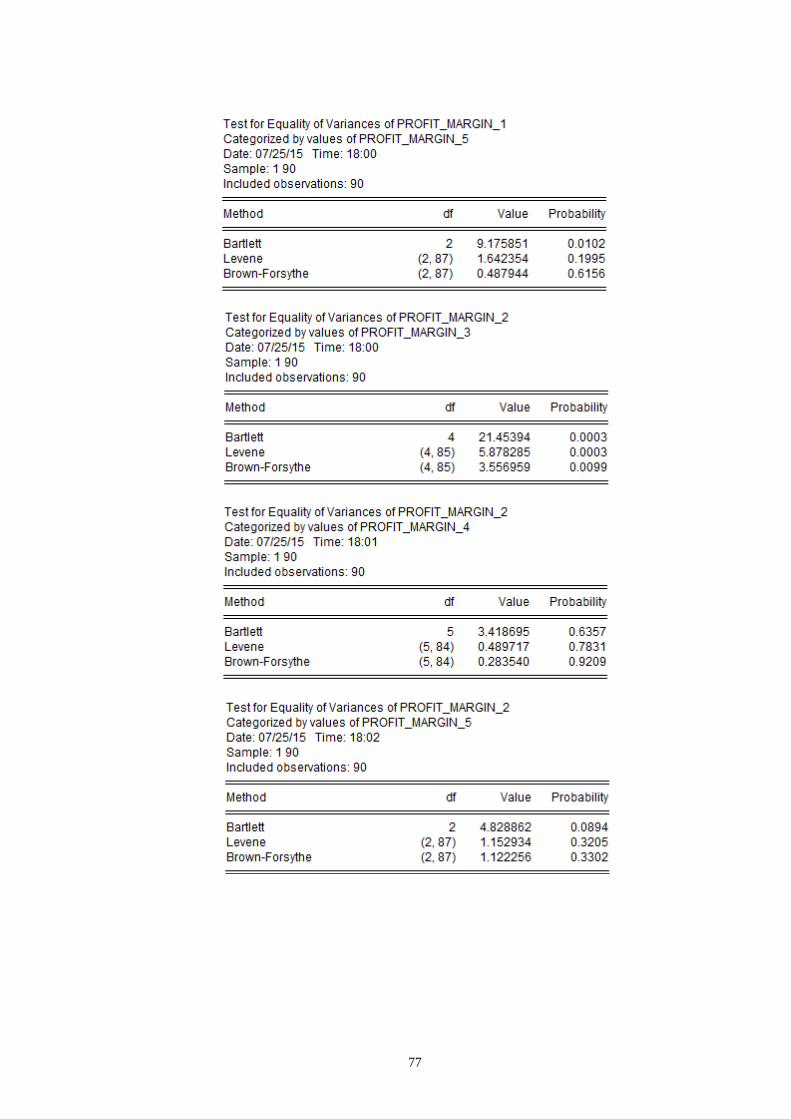
77
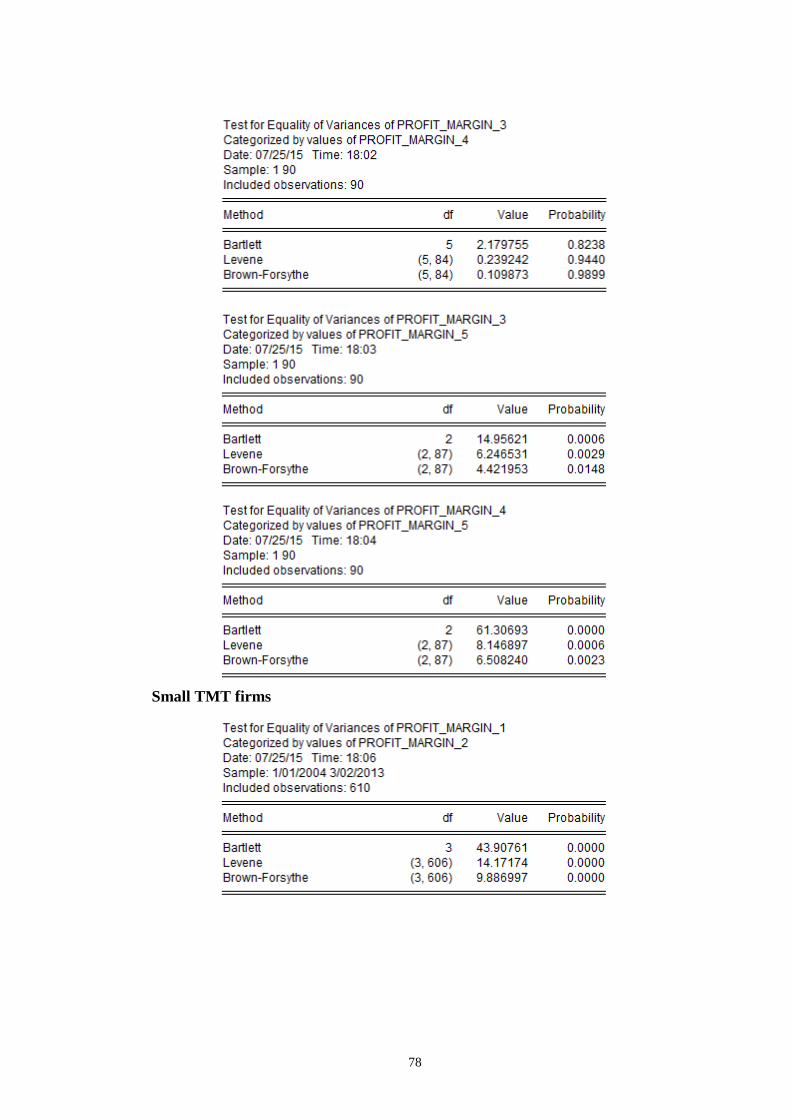
78
Small TMT firms

79

80

81
Proposition 2 model 3b: Relationship between age and ROA volatility
Large TMT firms

82

83
Small TMT firms

84

85

86

87
Appendix 4 – E-views Anova tests on models 6a and 6b
In order to confirm if there is a statistical difference between the performance of firms on
the stable and turbulent periods, an Anova analysis was performed comparing the profit
margins and the ROA of each firm in each one of the sub-periods.
Propositions 21 and 22 model 6a: Relationship between TMT heterogeneity and
profit margin

88
Propositions 21 and 22 model 6b: Relationship between TMT heterogeneity and
ROA

89
Appendix 5 – Classification rules for acquisitions and functional background
Corporate acquisition classification
The initial database comprised almost five thousand corporate acquisitions which had to
be classified according to their nature, either being related or unrelated businesses. A
business was considered to be related if its base sector descriptions were similar.
The table below provides a sample of the classification of related businesses by sector:
Table 28 - Sample of classification by base sector
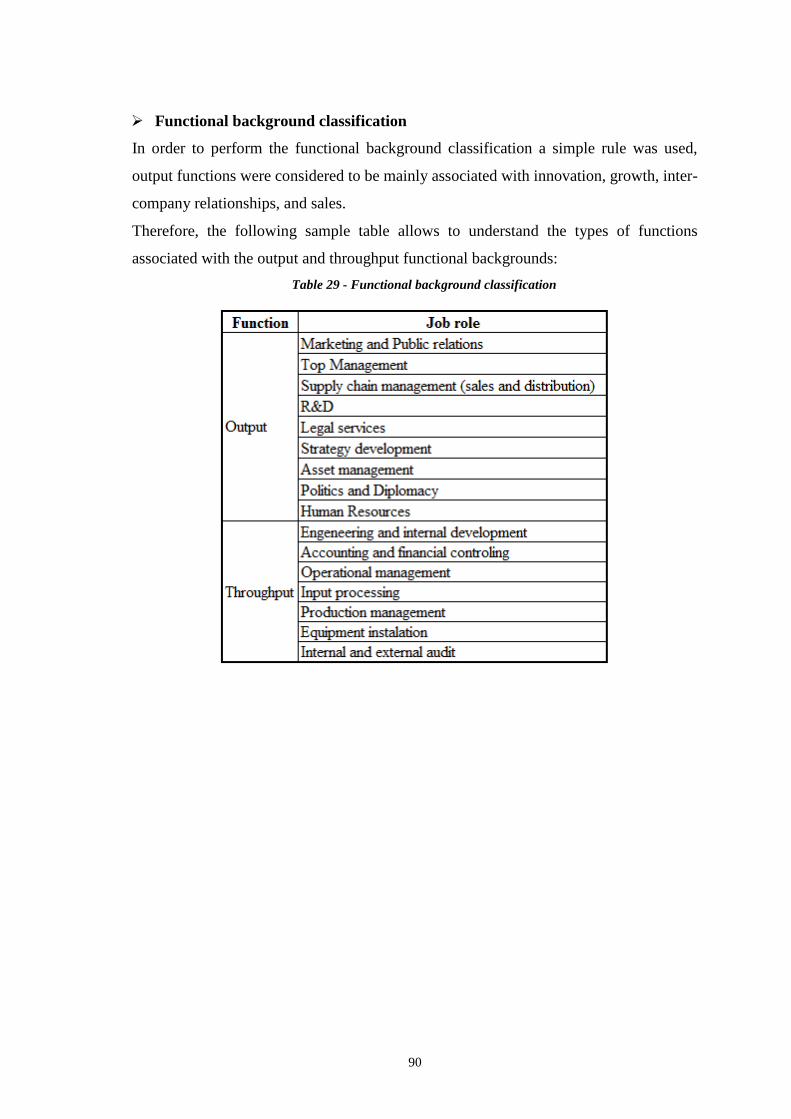
90
Functional background classification
In order to perform the functional background classification a simple rule was used,
output functions were considered to be mainly associated with innovation, growth, inter-
company relationships, and sales.
Therefore, the following sample table allows to understand the types of functions
associated with the output and throughput functional backgrounds:
Table 29 - Functional background classification