Testing the Efficacy of Micro Vortex Generator Geometries ...
17
Paper ID #31919 Testing the Efficacy of Micro Vortex Generator Geometries on Boundary Layer Separation Mitigation Mr. Kyle Bohmier,Grand Valley State University Studied Mechanical Engineering at Grand Valley State University in Allendale, MI as an undergrad. Currently employed by JR Automation in Holland, MI as an Applications Engineer. Dr. Sanjivan Manoharan, Grand Valley State University c American Society for Engineering Education, 2020
Transcript of Testing the Efficacy of Micro Vortex Generator Geometries ...

Paper ID #31919
Testing the Efficacy of Micro Vortex Generator Geometries on BoundaryLayer Separation Mitigation
Mr. Kyle Bohmier, Grand Valley State University
Studied Mechanical Engineering at Grand Valley State University in Allendale, MI as an undergrad.Currently employed by JR Automation in Holland, MI as an Applications Engineer.
Dr. Sanjivan Manoharan, Grand Valley State University
c©American Society for Engineering Education, 2020

Testing the Efficacy of Micro Vortex Generator Geometries on Boundary
Layer Separation Mitigation
Abstract
This paper investigates the performance of custom designed vortex generators (VGs) with respect to
airfoil aerodynamics. The research was carried out by an undergraduate student enrolled in an
independent study that took place over the summer semester. The student applied basic fluid mechanics
principles to solve an existing practical problem: mitigation of boundary layer separation. Vortex
Generators are passive devices located near the trailing edge of an airfoil to aid in aerodynamics. They
energize the flow by adding turbulence thus delaying the separation of the boundary layer. Apart from the
size, the shape of the vortex generator is critical in evaluating the efficacy. While several studies on VG
size exists, the effect of VG shape on boundary layer separation has not been extensively studied.
First, the base NACA 4414 airfoil was numerically investigated using the commercially available
software ANSYS FLUENT. The lift coefficient at various angles of attack and the stall angle were
identified for a Reynolds Number of 2x10⁵. This was then compared to experimentally available data in
the literature and the numerical setup was verified. The chord length of the airfoil was 100 mm while the
stall angle of attack was 14 deg. A grid independence study was also done to identify an optimal mesh
size. Following this, two custom VG shapes (Modified Trapezoidal and Delta Wing) were tested. Both
design concepts were based on basic fluid mechanics principles. For each VG shape, a parametric study
was conducted where the height, thickness, axial chord location, inter-spacing, rotation, and angle of
incidence were varied to identify the best performing configuration. For the Modified Trapezoidal, a
tab/no-tab setup was also considered. A Modified Trapezoidal configuration was identified as an optimal
geometry. This configuration had no effect on lift coefficient till 10 deg. angle of attack. However,
beyond this angle, there was a marked increase in lift, and the stall angle was delayed to 18 deg. While
the Delta Wing configuration did not provide positive results, strong vortices were present. Further
modifications could be done to utilize these vortices by aligning them in an effective manner. It is
believed that such a VG design could also be used on fins to improve heat transfer performance in heat
exchangers.
Background
Vortex generators are small devices added to various surfaces with the purpose of delaying boundary-
layer separation. This delay in separation results in a smaller wake region and consequently better lift and
drag performance. This is achieved by transferring momentum from the free stream into the area near to
the surface by creating vortices. Traditionally, vortex generators had a height approximately equal to the
thickness of the boundary-layer and were capable of effectively controlling separation in a localized area.
However, they did tend to suffer from one common problem; they could incur parasitic drag
approximately equal in magnitude to the reduction in drag from delaying the boundary-layer separating
resulting in them having little to no benefit. This parasitic drag is a result of the conventional vortex
generators creating an excessive amount of turbulence that the near wall flow is incapable of recovering
from after delaying the separation of the boundary-layer. In order to fix this problem, micro vortex
generators (MVGs) began to be used. Unlike conventional VGs where the device height and boundary-
layer thickness are approximately equal, micro vortex generators tend to have device heights that are 10%
to 50% of the boundary-layer thickness. Even though the device height is significantly less than that of a
conventional vortex generator, they have been shown to have comparable or better results that
conventional vortex generators because of their greatly reduced amount of parasitic drag [1-4].
Conventional and non-conventional vortex generators also have other applications that they are used for
as well including: noise reduction, increasing lift, and improving heat exchanger performance. It has been
shown in various studies that they are capable of decreasing noise by up to 2 decibels and increasing lift

by 14%; however, because these are not the main area of interest for this research project, they will not be
discussed any further during this study.
Micro vortex generators come in a variety of sizes and geometries. Seven common geometries and two
common orientations are shown in Figure 1; however, this is by no means an exhaustive list.
(B)
(A)
Figure 1: (A) Common Vortex Generator Geometries; (B) Common Orientations [1]
In addition to geometry and orientation playing an important role in the effectiveness of the micro vortex
generators, the placement is also crucial. For them to be able to function, they must be able to be placed
upstream of the separation point (see Fig. 2) so that momentum can be continually transferred to the near
wall flow. According to Lin [1], an optimal location is approximately 5 to 30 times the height of the
device upstream from the separation point. There are special circumstances though where it would be
ideal to place the generators further upstream if they produce longer lasting vortices. Because knowing
the separation location and boundary-layer thickness are crucial to being able to correctly design and
place a micro vortex generator, an accurate model is important.
Figure 2: Illustration of boundary layer separation, wake region, and separation point
Base Airfoil Analysis
The chosen airfoil for this study was a NACA 4414 airfoil with the profile shown in Figure 3. The profile
was generated using Airfoiltools’ online generator. It was defined as having a maximum camber of 4.3%
located at 40% chord length, a maximum thickness of 14%, and 151 points. Using the generated
coordinates, the airfoil was modeled in SolidWorks with a 100 mm chord length and a 20 mm span.

Figure 2: NACA 4414 airfoil modeled in SolidWorks
For this investigation, the commercially available software ANSYS FLUENT was used for all CFD
simulations. Before conducting numerical studies with the NACA 4414 airfoil, the numerical setup had to
be verified. The widely used Clark-Y airfoil was utilized with input parameters from Lyon et al. at a
Reynolds number of 200,000. The data was then compared to experimental results from Lyon et al. and
were found to be in excellent agreement. After validating the setup, the NACA 4414 solid model was
imported into DesignModeler from SolidWorks. A 12 mm thick slice of the airfoil was taken to reduce
domain size and thus computational time since the airfoil is symmetric. After creating the domain for the
model, a mesh convergence study was performed at an angle of attack of 0°. To ensure that the shape of
the domain had no bearing on the results, a c-shaped domain and rectangular domain were used. It was
found that both domains yielded identical results. The rectangular domain was selected for convenience.
The simulations were run using the settings defined in Table 1 and boundary conditions in Table 2. Table
3 shows the successive meshes used during the convergence study and their corresponding base lift
coefficient values. Two spheres of influence were used to provide additional refinement near to the
airfoil, and 12 inflation layers were used to capture the boundary-layer. It was decided that the mesh was
refined enough when the percent change from one mesh to another was less than half of a percent.
Table 1: Main settings
Flow Type 3-D
Solver Type Pressure Based
Turbulence
Model Spalart-Allmaras
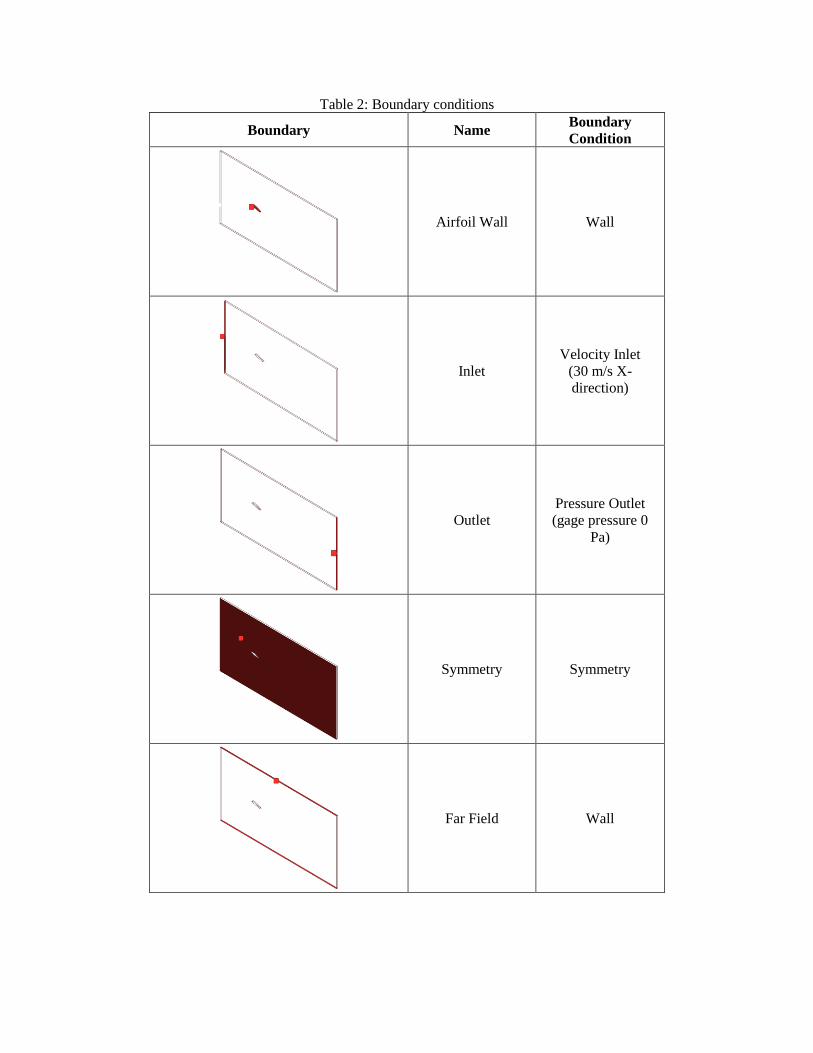
Table 2: Boundary conditions
Boundary Name Boundary
Condition
Airfoil Wall Wall
Inlet
Velocity Inlet
(30 m/s X-
direction)
Outlet
Pressure Outlet
(gage pressure 0
Pa)
Symmetry Symmetry
Far Field
Wall

Table 3: Mesh Refinement
Run Mesh Number
of Cells
Lift
Coefficient
Percent
Change
1
40,052 0.3531 -
2
85,466 0.3711 5.11
3
259,675 0.3869 4.10
4
1,023,823 0.4010 3.64
5
2,067,677 0.4059 1.22
6
3,152,834 0.4071 0.29

Based on Table 3, the airfoil mesh settings that will be used for all following simulations will be the
settings used in run #5. Using this mesh, boundary conditions, and physical settings, the lift coefficient
for the base airfoil was determined from 0° to 20°. These values are shown in Figure 3.
Figure 3: Lift Coefficient vs. Angle of Attack for Base NACA 4414 Airfoil
As can be seen in Figure 3, the airfoil began to stall after an angle of attack of 14°; this is also called the
critical angle of attack. Because of this, it will be the angle of attack that all VG configurations will be
tested at to determine their effectiveness. Also, from these simulations, it was determined that the
boundary-layer thickness was approximately 0.2 mm. This will be used as a reference when looking at the
height of the VGs to decide if they qualify as an MVG.
Vortex Generator Concept #1: Modified Trapezoidal
The first vortex generator concept that was tested was a modified trapezoidal design. The original concept
had the addition of a tab and two flanges as shown in Figure 4. The intent of these additions was to
provide additional points to create vortices. As previously mentioned, the same mesh and simulation
settings were used from the base airfoil test, with the addition of refinement around the vortex generators
on the airfoil. They were refined until the element size was small enough to capture all of the physical
details of the VG. Throughout the testing of this VG concept, thirteen different configurations were
tested. They are described in Table 4 along with their resulting lift coefficient and percent change from
the base airfoil. Refer to Figure 4 for variable meanings and Appendix A for configuration images. It is
important to note that while MVGs are the subject of interest of this paper, minimum size requirements
had to be met in case physical samples of the VGs were to be 3-D printed to allow for the possibility of
experimental tests. Due to this, many of the configurations tested are taller than the boundary-layer, and
therefore do not qualify as MVGs.
0.0000
0.5000
1.0000
1.5000
2.0000
2.5000
0 2 4 6 8 10 12 14 16 18 20
CL
Angle of Attack [°]
Lift Coefficient vs. Angle of Attack for Base Airfoil

Figure 4: Vortex generator concept #1 depiction and terminology
From Table 4, the best performing configuration for this vortex generator concept was configuration 12.
This configuration was then tested with an angle of attack of 0° to 20° to compare its performance to the
base airfoil over a range of angles of attack. Using the same simulation settings, the results in Figure 5
were obtained.
Figure 5: VG concept #1 lift coefficient compared to base airfoil lift coefficient
As can be seen in Figure 5, the final vortex generator concept was capable of delaying flow separation by
an additional 4° while having minimal effect at lower angles of attack. This configuration will be
discussed further in the analysis and discussion section.
0.0000
0.5000
1.0000
1.5000
2.0000
2.5000
0 2 4 6 8 10 12 14 16 18 20
CL
Angle of Attack [°]
Lift Coefficient vs. Angle of Attack
Base VG #1

Table 4: Modified trapezoidal vortex generator results at an angle of attack of 14°
Configuration
Height
h
[mm]
Thickness
t
[mm]
Location
Along
Chord
LAC
[%]
Horizontal
Spacing
HS
[mm]
Convergence
Angle
CA
[°]
Rotation
Type
Angle of
Incidence
AoI
[°]
Tab CL Percent
Change
1 1.10 0.40 10 8 28 - 0 Yes 1.3094 -12.50
2 1.10 0.40 20 8 28 - 0 Yes 1.4842 0.01
3 0.75 0.05 20 8 28 - 0 Yes 1.5620 5.12
4 0.75 0.05 20 8 28 Counter 20 Yes 1.3652 -8.34
5 0.75 0.05 10 8 28 - 0 Yes 1.519 2.33
6 0.75 0.05 10 8 28 Counter 20 Yes 1.3147 -12.10
7 0.75 0.05 20 8 28 - 0 No 1.5665 5.41
8 0.75 0.05 20 8 45 - 0 No 1.5924 7.05
9 0.25 0.05 20 8 45 - 0 No 1.4454 -2.64
10 0.75 0.05 20 8 53 - 0 No 1.5769 6.07
11 0.75 0.05 25 8 45 - 0 No 1.5937 7.13
12 0.75 0.05 25 6 45 - 0 No 1.6051 7.84
13 0.75 0.05 25 6 45 Co 20 No 1.4524 -2.15

Vortex Generator Concept #2: Delta Wing
The second vortex generator concept that was tested was a delta wing design. The original concept had a
delta wing on top of an aerodynamic riser as shown in Figure 6. The intent of the design was to utilize the
strong tip vortices that form from the high and low pressure air mixing. As previously mentioned, the
same mesh and simulation settings were used from the base airfoil test, with the addition of refinement
around the vortex generators on the airfoil. They were refined until the element size was small enough to
capture all of the physical details of the VG. Throughout the testing of this VG concept, eleven different
configurations were tested. They are described in Table 5 along with their resulting lift coefficient and
percent change from the base airfoil. Refer to Figure 6 for variable meanings and Appendix B for
configuration images.
Figure 6: Vortex generator concept #2 depiction and terminology
From Table 5, it can be seen that none of the configurations tested were able to produce a useful increase
in lift coefficient. In fact, most configurations produced a fairly significant decrease in lift coefficient. The
expected reason behind this is discussed further in the discussion section.

Table 5: Delta wing vortex generator results at an angle of attack of 14°
Configuration
Height
h
[mm]
Thickness
t
[mm]
Radius
Location
Along Chord
LAC
[%]
Rotation
Type
Ange of
Incidence
AoI
[°]
CL Percent
Change
1 0.15 0.10 No 10.0 - 0 1.4888 0.32
2 0.15 0.10 No 10.0 Co 10 1.4847 0.05
3 0.15 0.10 No 10.0 Counter 10 1.4840 0.00
4 0.15 0.10 No 10.0 Co 25 1.4009 -5.76
5 0.15 0.10 No 10.0 Counter 25 1.3832 -7.03
6 1.15 0.05 No 10.0 - 0 1.4011 -5.75
7 1.15 0.05 No 10.0 Co 10 1.3350 -10.57
8 1.15 0.05 No 10.0 Counter 10 1.4060 -5.40
9 1.15 0.55 Yes 10.0 Counter 10 1.3865 -6.79
10 1.15 0.55 Yes 10.0 Counter 25 1.3743 -7.68
11 1.15 0.05 Yes 10.0 Counter 25 1.4681 -1.08
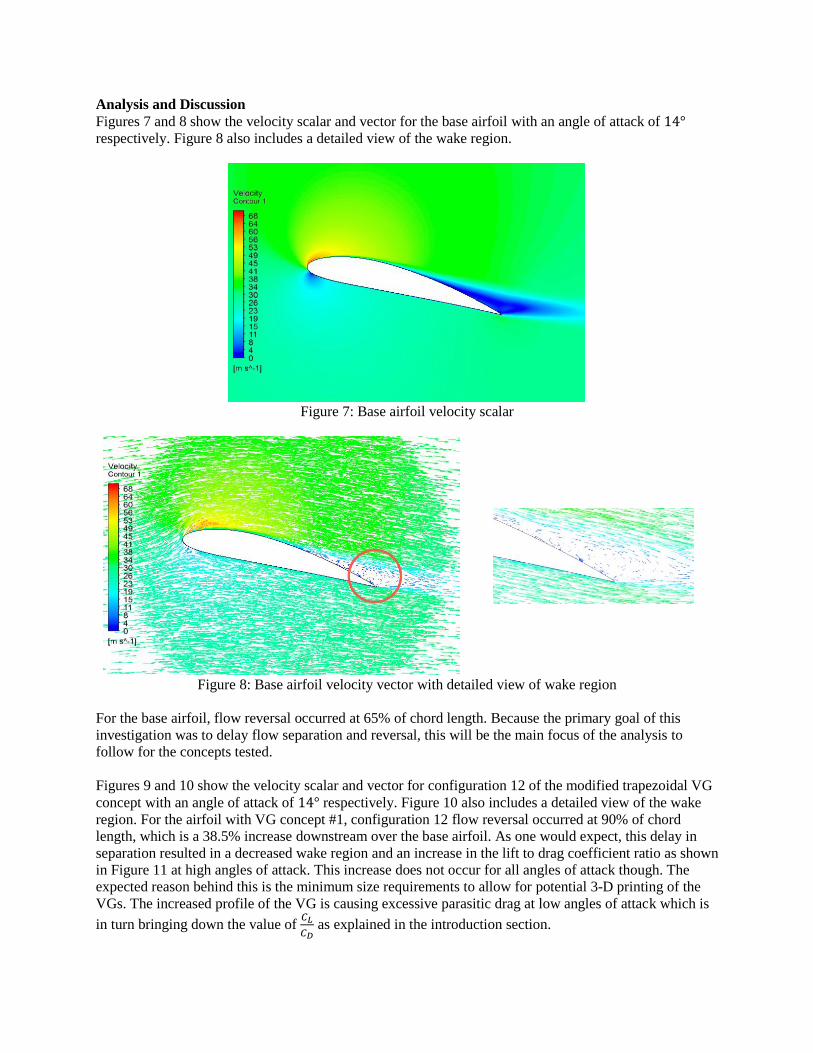
Analysis and Discussion
Figures 7 and 8 show the velocity scalar and vector for the base airfoil with an angle of attack of 14° respectively. Figure 8 also includes a detailed view of the wake region.
Figure 7: Base airfoil velocity scalar
Figure 8: Base airfoil velocity vector with detailed view of wake region
For the base airfoil, flow reversal occurred at 65% of chord length. Because the primary goal of this
investigation was to delay flow separation and reversal, this will be the main focus of the analysis to
follow for the concepts tested.
Figures 9 and 10 show the velocity scalar and vector for configuration 12 of the modified trapezoidal VG
concept with an angle of attack of 14° respectively. Figure 10 also includes a detailed view of the wake
region. For the airfoil with VG concept #1, configuration 12 flow reversal occurred at 90% of chord
length, which is a 38.5% increase downstream over the base airfoil. As one would expect, this delay in
separation resulted in a decreased wake region and an increase in the lift to drag coefficient ratio as shown
in Figure 11 at high angles of attack. This increase does not occur for all angles of attack though. The
expected reason behind this is the minimum size requirements to allow for potential 3-D printing of the
VGs. The increased profile of the VG is causing excessive parasitic drag at low angles of attack which is
in turn bringing down the value of 𝐶𝐿
𝐶𝐷 as explained in the introduction section.

Figure 9: VG concept #1 configuration 12 velocity scalar
Figure 10: VG concept #1, configuration 12 velocity vector with detailed view of wake region
Figure 11: 𝐶𝐿
𝐶𝐷 vs. angle of attack for base airfoil and VG#1 configuration 12
0.00
5.00
10.00
15.00
20.00
25.00
30.00
35.00
40.00
45.00
0 5 10 15 20
CL
/ C
D
Angle of Attack [°]
Lift Coefficient/Drag Coefficient vs. Angle of Attack
Base
VG #1

To compare the performance of VG concept #1, data from two other sources was used as comparison as
seen in Fig. 12. These configurations are a normal vane VG [5] and a fixed slotted airfoil [6]. As can be
seen in the figure, the current VG concept #1 was the best performer at high angles of attack. It is worth
to note that this design had the largest delay in critical angle of attack. The slotted airfoil had the best
peak performance at moderate angles of attack (100 – 140), but had poor performance at low angles of
attack. Since the slotted airfoil relies on diverting high pressure air from the pressure side (bottom) to
suction side (top), the lift is negatively affected at low angles of attack.
Figure 12: Lift coefficient vs. angle of attack for base airfoil and various improvement methods.
In order to verify that the concept geometry (modified trapezoidal with flange) performed better than a
standard trapezoidal design (no flange), an additional simulation was run with the VGs in the same
location as configuration 12. However, the VGs had the flange portions removed. At an angle of attack of
14°, the standard trapezoidal case produced less lift when compared to the modified trapezoidal thus
validating the fact that the flanges were important in creating the additional turbulence. With further
modifications, it is thought that this difference in performance could be increased further.
For VG concept #2, it was already mentioned that most configurations provided a fairly significant
decrease in lift. It is believed that this is due to the angle at which flow is crossing the VG at. An
additional simulation was performed to try to verify this. The simulation was set-up with flow coming
straight at only a VG with an angle of incidence of 20°. The streamlines of this simulation are shown in
Figure 13. As can be seen in the figure, strong vortices are being formed from the delta wing as expected.
However, during the simulations with the VGs mounted on the airfoils, these same vortices are not
present. It is thought that this is because the flow is following the curvature of the airfoil prior to crossing
the VG, which is not allowing the vortices to form correctly. This in turn causes the VG to only create
additional drag and decrease lift as a result. Additional testing would need to be conducted to determine if
altering the angle at which the flow crosses the VG would yield positive results. An area for further
investigation would be to vary the inclination of the delta wing VG to ensure the desired flow is achieved.
0.0000
0.5000
1.0000
1.5000
2.0000
2.5000
0 2 4 6 8 10 12 14 16 18 20
CL
Angle of Attack [°]
Lift Coefficient vs. Angle of Attack
Base
VG #1
Vane⁵
Slot Airfoil⁶

However, given its ability to generate strong vortices, it could potentially be of great use when coupled
with fins to enhance heat transfer.
Figure 13: Delta wing VG only simulation streamlines
Conclusion
A numerical investigation was conducted using ANSYS Fluent for a NACA 4414 airfoil to determine the
effect of custom designed vortex generators on increasing lift and delaying boundary-layer separation. To
achieve this, the lift coefficient values and critical angle of attack for the base airfoil were first
determined. Various custom configurations of a modified trapezoidal VG and a delta wing VG were then
tested. It was determined that the modified trapezoidal VG performed the best at all angles of attack while
significantly increasing the critical angle of attack. At much higher angles of attack, it was even superior
to other existing configurations in the literature. The delta wing VG did not show the same positive
results when placed on the airfoil, but was capable of producing strong vortices when simulated by itself.
Bibliography
[1] Lin, J. C., Review of Research on Low-Profile Vortex Generators to Control Boundary-Layer
Separation, Progress in Aerospace Sciences, 2002, Vol. 38, pp. 389 – 420.
[2] Panaras, A., and Lu, F., Micro-Vortex Generators for Shock Wave/Boundary Layer Interactions,
Progress in Aerospace Sciences, 2015, vol. 74, pp. 16-47
[3] Agarwal, S., and Kumar, P., Numerical Investigation of the Flow Field and Effect of Varying Vortex
Generator Location on Wing Performance, American Journal of Fluid Dynamics, 2016, vol. 6, no. 1, pp.
11-19
[4] Sorensen, N., Zahle, F., Bak, C., Vronsky, T., Predicition of the Effect of Vortex Generators on Airfoil
Performance, Journal of Physics, 2014, vol. 524, pp. 1-11
[5] DiGiovanni, D., O’Hearn, J., Visser, R., Manoharan, S., The Design, Build, and Test of an Airfoil: An
Experimental and Numerical Study of Flow Characteristics, ASEE North Central Section Conference,
Akron, OH, 2018
[6] Chapman, J. and Manoharan, S., Numerical Investigation of Flow Characteristics of a Slotted NACA
4414 Airfoil, ASEE Annual Conference and Exposition, Tampa, FL, 2019

Appendix A: Vortex generator concept #1 images
Configuration 1 Configuration 2 Configuration 3 Configuration 4
Configuration 5 Configuration 6 Configuration 7 Configuration 8
Configuration 9 Configuration 10 Configuration 11 Configuration 12
Configuration 13

Appendix B: Vortex generator concept #2 images
Configuration 1 Configuration 2 Configuration 3 Configuration 4
Configuration 5 Configuration 6 Configuration 7 Configuration 8
Configuration 9 Configuration 10 Configuration 11 Configuration 12