Testing Record Accuracy Using a Random Statistical Sample and Excel Michael (Mike) Showers, CPPA.
48
Testing Record Accuracy Using a Random Statistical Sample and Excel Michael (Mike) Showers, CPPA
-
Upload
marshall-daniel -
Category
Documents
-
view
218 -
download
0
Transcript of Testing Record Accuracy Using a Random Statistical Sample and Excel Michael (Mike) Showers, CPPA.

Testing Record Accuracy Using a Random Statistical Sample and Excel
Michael (Mike) Showers, CPPA

Agenda• Sample types• Sampling for the proportion• Method• Hardware and software requirements• Data requirements• Determining sample size (Excel)• Obtaining a random sample (Excel)• Thoughts about testing• Using the results

Types of Samples• Non-probability samples:
(from DCMA-INST 124, “Contract Property Management”)
Purposive – “a process to evaluate areas, items, or actions involving credible, known, suspected deficiencies or reported conditions of a critical/substantial nature”
Judgment – “a process used to evaluate areas, items or action, based on the reviewer’s professional judgment.”

Types of Samples• Probability Samples
– Simple random sample• With replacement• Without replacement
– Systematic Samples– Cluster Samples– Stratified Samples

Purpose of Random Statistical Samples
• Provide insight into the total population without having to review the total population– Control cost– Reduce the possibility of bias
Sample Goal• Estimate the proportion of
errors within a population– Invoice processing errors – Documented transaction errors– Property record accuracy errors
(existence)

Example Questions• For Accountability Records –
– What is the estimate of the total number of items that could not be found in the total population, based on a random statistical sample of the population?
• For Supply Records – – What is the estimate of the total number of
items in the total population where the quantity deviation exceeds X%, based on a random statistical sample of the population?

How• Decide on the acceptable level of confidence • Decide on the acceptable sampling error• Estimate the proportion of population likely to
be defective• From this, determine the appropriate sample
size• Prepare random statistical sample• Apply the sample to actual data• Test to the sample• Document the result

Needed• Computer using Windows XP or
later• Microsoft Excel, 2007 or more
recent.• Access to Excel Options and the
Add-in for the Data Analysis Toolpak
• Spreadsheet of data to be analyzed (Inventory List)

Data Requirements• Property List
– Unique identifiers• Control numbers• Manufacturer, Model, and Serial
– Description– Location– User (Often useful for locating that which is not in
location)– Quantity (if supply items)
• Historical Data– Prior accuracy data– Stated standard of performance

Sample Requirements• Need to know:
– The Population (Frame)– Desired confidence level– Acceptable sampling error
• (possible difference between two samples, e.g. + 3%)
– Population Proportion• Historically derived
– Results of prior tests– Actual

Statistical Basis• Central Limit Theorem –
“As the sample size gets large enough, the sampling distribution for the mean is approximately normally distributed.”
(Levine et al)
• Law of large numbers“The Law of Large Numbers says that in repeated, independent trials with the same probability p of success in each trial, the percentage of successes is increasingly likely to be close to the chance of success as the number of trials increases…”(http://www.stat.berkeley.edu/~stark/SticiGui/Text/gloss.htm#law_of_large_numbers)

Sample Size for the Proportion
2
2 )1(
e
zn
n=sample sizeZ=z value from standardized normal distributione= acceptable sampling errorπ= the population proportion
(Levine et al)

Excel Tool for determining the Sample Size
Started on a new spreadsheet in cell A1


Prepping the Spreadsheet
• Put your data in a spreadsheet
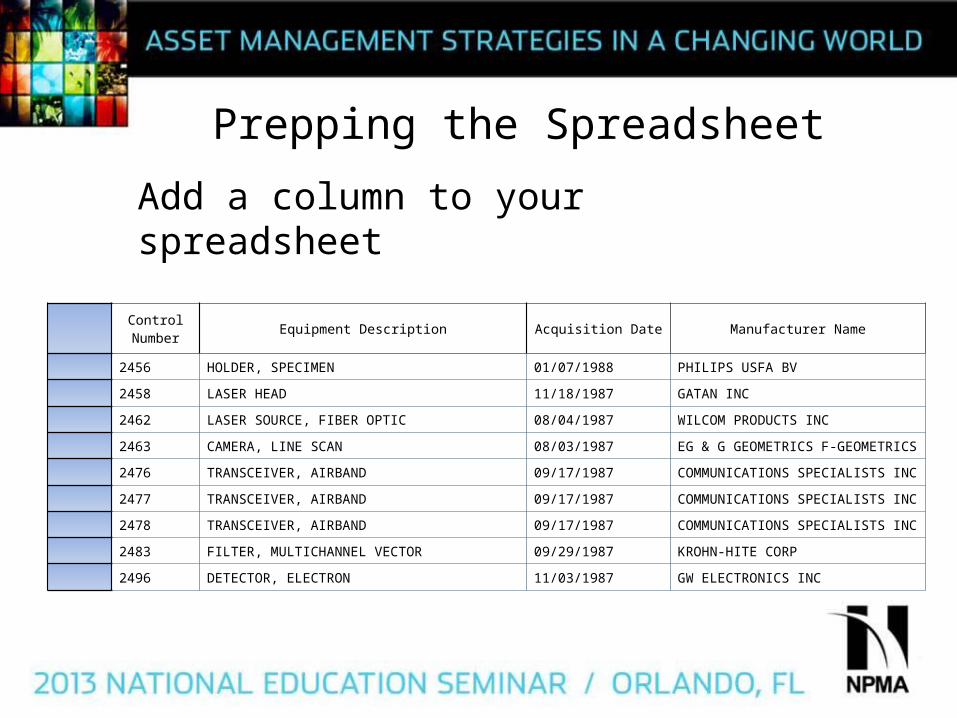
Prepping the Spreadsheet
Add a column to your spreadsheet
Control Number Equipment Description Acquisition Date Manufacturer Name
2456 HOLDER, SPECIMEN 01/07/1988 PHILIPS USFA BV
2458 LASER HEAD 11/18/1987 GATAN INC
2462 LASER SOURCE, FIBER OPTIC 08/04/1987 WILCOM PRODUCTS INC
2463 CAMERA, LINE SCAN 08/03/1987 EG & G GEOMETRICS F-GEOMETRICS
2476 TRANSCEIVER, AIRBAND 09/17/1987 COMMUNICATIONS SPECIALISTS INC
2477 TRANSCEIVER, AIRBAND 09/17/1987 COMMUNICATIONS SPECIALISTS INC
2478 TRANSCEIVER, AIRBAND 09/17/1987 COMMUNICATIONS SPECIALISTS INC
2483 FILTER, MULTICHANNEL VECTOR 09/29/1987 KROHN-HITE CORP
2496 DETECTOR, ELECTRON 11/03/1987 GW ELECTRONICS INC

Prepping the Spreadsheet
• Sequentially number the items in the spreadsheet
1.Type 1 in cell A2 or the first cell beside your data2.Type =1+A2 in cell A3 (The result should be 2)3.Copy cell A34.Highlight the remainder of the column by clicking on A4, 5. Hold the shift key while pressing END then the down
arrow Hold Control and type V (This should number the entire column)
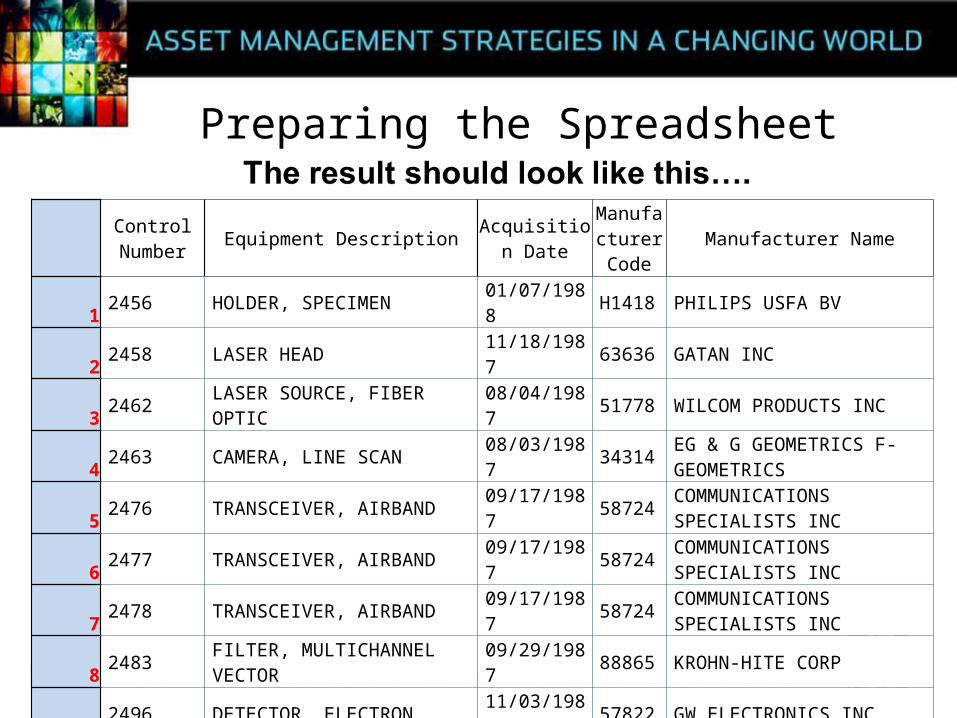
Preparing the Spreadsheet
Control Number Equipment Description Acquisition
DateManufact
urer Code
Manufacturer Name
1 2456 HOLDER, SPECIMEN 01/07/1988 H1418 PHILIPS USFA BV
2 2458 LASER HEAD 11/18/1987 63636 GATAN INC
3 2462 LASER SOURCE, FIBER OPTIC 08/04/1987 51778 WILCOM PRODUCTS INC
42463 CAMERA, LINE SCAN 08/03/1987 34314 EG & G GEOMETRICS F-
GEOMETRICS
52476 TRANSCEIVER, AIRBAND 09/17/1987 58724 COMMUNICATIONS SPECIALISTS
INC
62477 TRANSCEIVER, AIRBAND 09/17/1987 58724 COMMUNICATIONS SPECIALISTS
INC
72478 TRANSCEIVER, AIRBAND 09/17/1987 58724 COMMUNICATIONS SPECIALISTS
INC
8 2483 FILTER, MULTICHANNEL VECTOR 09/29/1987 88865 KROHN-HITE CORP
9 2496 DETECTOR, ELECTRON 11/03/1987 57822 GW ELECTRONICS INC
10 2580 CAMERA, VIDEO 12/31/1987 S0293 MATSUSHITA ELEC INDUS CO
11 2639 TUNER, FREQUENCY 05/25/1988 30245 MICRODYNE CORP

Setting Up the Toolpak
• On the Excel Options screen click “Add-Ins”
• Highlight “Analysis Toolpak”• Click “Go” at the bottom of the page.• On the following screen click Analysis
Toolpak• Click OK• If it needs to be installed, click YES

Setting Up the Toolpak• Click the Office Button

Setting Up the Toolpak
Click the “Excel Options” Button.

Setting Up the Toolpak• Click Advanced and• OK on the Excel Options screen
If asked to install, Click Yes

Selecting the Sample• Click the Data Tab on the Ribbon

Selecting the Sample
• Click on Data Analysis

• Result – Data Analysis Screen
Selecting the Sample

Selecting the Sample• Scroll down, • Highlight Sampling and • Click OK

Selecting the Sample• The Sampling Screen
Click the range selector at the end of the “Input Range” field
The Sampling Screen will appear

Selecting the Sample
Highlight the numbers in the A column that are Adjacent to the control numbers in column B
and press return

Selecting the Sample
Make sure the Random block
is checked Key the number of
Samples in the appropriate field

Selecting the Sample
Click the range selector at the end of the output range
Click the Output Range Button
The Sampling Window will appear again

Selecting the Sample
Click an open range on the Spreadsheet and press return

Selecting the SampleClick OK

Selecting the SampleItem #
1 992 623 774 875 126 57 358 729 59
10 51
11 6812 44
13 4014 95
15 4416 2717 8418 5319 1520 15
Initial Sample Results

Selecting the Sample• Highlight the data• Click the Data Tab
and the Sort Tab
• Sort JUST THE COLUMN in ascending order(click on continue with
current selection)
Item #5
1 122 153 154 275 356 407 448 449 51
10 53
11 5912 62
13 6814 72
15 7716 8417 8718 9519 99

Selecting the SampleItem #
51 122 153 154 275 356 407 448 449 51
10 53
11 5912 62
13 6814 72
15 7716 8417 8718 9519 99
Note the repeat in the sample
This happens from time to time. When it does, I use the number + a predetermined addition to replace the duplicate

Sample SelectionItem # Stock Number Description Quantity Unit Price UOM Locator/Project Itemnumber Comments Manufacturer Partnumber Quantity On Hand Variance
1 5310-00-E97-0837 NUT, SELF-LOCKING 1669 $0.84 EA 200B02A52 100%2 5305-00-E97-1532 SCREW MACHINE 509 $1.04 EA 200B02B32 100%3 5305-00-E97-1219 SCREW MACHINE 730 $0.10 EA 200B02F12 100%4 5305-00-E97-1591 SCREW MACHINE 910 $1.32 EA 200B02H31 100%5 5325-00-E97-1424 INSERT,SCREW THREAD 794 $0.37 EA 200B04C24 100%6 5305-00-E97-1650 SCREW, MACHINE 1002 $1.68 EA 200B14G31 100%7 5310-00-G95-1306 WASHER,FLAT 4321 $0.14 EA 200B17A12 100%8 5310-00-G95-1300 WASHER,FLAT 4590 $0.06 EA 200B17A43 100%9 5325-00-E99-0299 INSERT,SCREW THREAD 690 $1.15 EA 200B17G24 100%
10 5935-00-E12-0131 CONNECTOR 14
$1.00 GEMS 150 PARTS HANDCARRIED TO TRAX BY RICH WILLIAMS 4-19-2012 PUT-AWAY 06/11/12 - MC POSITRONIC SADD44S0GM0G
100%
11 5905-00-E09-0558 RESISTOR, THICK FILM 23
$3.50 GEMS 412 BOX 7 FROM SAIC PARTS XRF QTY 3 8/30/12 GS 9/8/12 SOTA M55342K06B9E53R
100%
12 5935-00-E09-6827 CONNECTOR 1 $317.56 GPM 3406 FLIGHT TYCO 1883056-1 100%
13 5998-00-E09-0027 COUPONS 2
$1.00 GPM 4597 A D/C: N/A LOT# 0409080404 AM10/27/2010AMERICAN TECHNICAL CERAMICS 2085264
100%
14 5955-00-E10-0257 OSCILLATOR 4 $5,370.00 GPM 3879 7EA MAX 3-4-11 VECTRON EX-245-CAF-107SS-10M0000 100%
15 5961-00-E06-1249 DIODE 10
$15.34 GPM 808 NON-FLIGHT 7/21/09 Changed location (Orig. TE31005B1) MICROSEMI JANTX1N5711UR-1
100%
16 5955-00-E09-6330 OSCILLATOR (MATERIAL) 20 $796.00 GPM 3242 FLIGHT REC.20ea TWT, 7/7/10 MTI 010854-0574 100%17 5935-00-E97-0728 CONNECTOR 20 $25.00 GPM 3953 FLIGHT LOT# 0203287683 20EA MAX 3-22-10 TYCO 311P409-3S-B-12 100%18 5962-00-E09-5422 MICROCIRCUIT 25 $100.00 GPM 2813 FLIGHT LOT#: 2HCYA KK AEROFLEX 5962R9656901QXC 100%19 5905-00-E97-0664 RESISTOR, FIXED, FILM 68 $1.85 GPM 935 FLIGHT LOT#: TR159550 SOTA M55342K06B5E11R 100%20 5905-00-E09-1758 RESISTOR 100 $5.00 GPM 2418 FLIGHT LOT# 42535605 NEAL VISHAY D55342K07B1E62S 100%21 5905-00-E98-0851 RESISTOR 100 $0.86 GPM 3171 FLIGHT LOT#: TR167231 KK SOTA D55342K07B100ES 100%
• Recommend printing the selected sample
• Highlight and copy the sample items within the population one at a time

Selecting the Sample• Paste the selection on a separate
sheet using “paste special” and “values”
5 5325-00-E97-1424 INSERT,SCREW THREAD 794 0.37EA
200B04C24
12 5935-00-E09-6827
CONNECTOR 1 317.56
GPM 3406
FLIGHTTYCO
1883056-1
15 5961-00-E06-1249
DIODE 10 15.34
GPM 808
NON-FLIGHT 7/21/09 Changed location (Orig. TE31005B1) MICROSEMI
JANTX1N5711UR-1
20 5905-00-E09-1758
RESISTOR 100 5
GPM 2418
FLIGHT LOT# 42535605 D55342K07B1E62S
27 5905-00-E01-0593
Resistor, Chip, RM1505, 499ohms, 1%, FR=S, 0.1W 48 2.96
HST-HRV 142 STATE OF THE ART
D55342K07B499DS

Using the Sample5 5325-00-E97-1424 INSERT,SCREW THREAD 794 0.37 EA 200B04C24
12 5935-00-E09-6827 CONNECTOR 1 317.56 GPM 3406 FLIGHT TYCO 1883056-1 15 5961-00-E06-1249 DIODE 10 15.34 GPM 808 NON-FLIGHT 7/21/09 Changed location (Orig. TE31005B1)MICROSEMI JANTX1N5711UR-1 20 5905-00-E09-1758 RESISTOR 100 5 GPM 2418 FLIGHT LOT# 42535605 D55342K07B1E62S 27 5905-00-E01-0593 Resistor, Chip, RM1505, 499ohms, 1%, FR=S, 0.1W 48 2.96 HST-HRV 142 STATE OF THE ART D55342K07B499DS
• You can print the sheet and use it to perform your testing
• You can take a laptop or tablet along to enter the data
• For equipment, I just note when I visually confirm the existence of an item in the sample

Using the Sample• For material items you can add a
column to record the actual counts• Another column can be added to
determine the quantity variance using the formula:
=1-(quantity on record/quantity on hand)
• Type it in the first cell of the variance column
• Then copy it down the column
Quantity On Hand Variance
16501%
5002%
7300%
9001%
7940%