Testing of Proposed BCA2010 Volume 2 House Energy Efficiency
40
CONSULTANT REPORT TO THE AUSTRALIAN BUILDING CODES BOARD TESTING OF PROPOSED BCA2010 VOLUME 2 HOUSE ENERGY EFFICIENCY DEEMED-TO-SATISFY MEASURES WITH BERS PRO ENERGY RATINGS July 2009 by Dr Clyde Anderson, RPEQ 5482, MIEAust 46145 Certified Energy Efficiency Assessor, ABSA 40121 and Michael Anderson Certified Energy Efficiency Assessor, ABSA 40203 Clyde Anderson Pty Ltd PO Box 12, COORPAROO QLD 4151 Email: [email protected] Web: www.clydeanderson.com.au
Transcript of Testing of Proposed BCA2010 Volume 2 House Energy Efficiency

CONSULTANT REPORTTO
THE AUSTRALIAN BUILDING CODES BOARD
TESTING OF PROPOSED BCA2010 VOLUME 2
HOUSE ENERGY EFFICIENCYDEEMED-TO-SATISFY MEASURES
WITHBERS PRO ENERGY RATINGS
July 2009
by Dr Clyde Anderson, RPEQ 5482, MIEAust 46145 Certified Energy Efficiency Assessor, ABSA 40121
and Michael Anderson Certified Energy Efficiency Assessor, ABSA 40203
Clyde Anderson Pty Ltd PO Box 12, COORPAROO QLD 4151 Email: [email protected] Web: www.clydeanderson.com.au

Testing Proposed BCA2010 DTS with BERS Pro
EXECUTIVE SUMMARY
The COAG National Strategy on Energy Efficiency 2009-2020 Memorandum of Understanding signed on 30 April 2009 agreed that the energy efficiency requirement of residential buildings be increased to a minimum of six stars or equivalent in the BCA2010 update.
The proposed BCA2010 DTS measures needed to be tested against Energy Rating software (BERS Pro in this case) to verify equivalence.
To be equivalent to 6 Stars was agreed to mean that the majority of building designs would be within the 5.0 to 7.0 Stars range.
The proposed BCA2010 DTS measures (DTS2010) reflecting higher Star Rating stringency, increased insulation on all surfaces and reduced glazing Allowances.
Testing was for three house designs, BCA Climate Zones 1 to 7, in nine cities and with orientations N, NW, W and SW.
The test program intentionally maximised the glazing area and therefore the U-value selected was probably lower than would be necessary for “normal” houses. All houses tested has glazing area to gross floor area more than 20%.
Lower U-value glazing was required for less than optimal orientations, highlighting cost savings if a building design included glazing maximised in the NE to NW orientation sectors.
The new glazing measures would most likely increase the use of LowE, double-glazing and low conductance frames, and in colder climates should encourage tall, narrow glazing with little shade and high SHGC.
The following Table gives the overall results of the testing program:
Six Stars Equivalence House 1 House 8 House 12 Description 1 Storey BV/Slab 2 Storey BV/Slab 2 Storey, Light frame,
open under first floor BCA Climate Zones 1, 2, 3, 4, 5, 6, 7 1, 2, 3, 4, 6, 7 6, 7
Table 1 Climate Zones for Six Stars Equivalence of DTS2010
In Perth (Climate Zone 5) the external walls for Houses 1 and 8 were cavity brick.
In Perth and Adelaide (Climate Zone 5) House 8 did not achieve 6 Stars equivalence with either High air movement or ceiling fans.
House 12 with an unenclosed suspended timber floor was not able to achieve 6 Star equivalence in Climate Zones 1 to 5. It was suggested that either these designs should be excluded from the DTS2010 measures, the area of unenclosed floor be limited, and/or a specific time-limited concession be employed to facilitate the transition to more energy efficient designs.
House 12 could achieve 6 Stars equivalence in Climate Zone 2 with a suspended slab floor with R2.5 total insulation (more than DTS2010), and High air movement or ceiling fans.
2

Testing Proposed BCA2010 DTS with BERS Pro
High air movement and ceiling fans reduced cooling energy significantly in Climate Zones 1, 2 and 3.
Based on limited testing with different floors for Houses 1 and 12 in Climate Zone 2, houses with enclosed (to the ground) timber floors appear to need at least masonry walls to achieve 6 Stars equivalence.
A hypothetical “ultimate house” concept, with minimum uncontrolled heat transfer, was used to establishing the relative contribution of different building elements to the remaining controllable heat transfer. This approach could assist future BCA development by clarifying changes that make the highest effective improvement in energy efficiency at lowest additional cost.
Increasing ceiling and wall insulation beyond DTS2010 was achieving diminishing returns, as the combined amount of residual controllable heat transfer through these surfaces was less than 10% of the total controllable heat transfer for House 12 (total energy difference to the ultimate house).
3

Testing Proposed BCA2010 DTS with BERS Pro
CONTENTS
Page Executive Summary 2 Contents 4 1.0 Introduction 5 2.0 Method 6 3.0 Results 11
3.1 Glazing Area to Floor Area Ratios and Glazing Type 11 3.2 Area Adjustment Factor 12 3.3 The Effect of Location, Standard Air Movement 13 3.4 The Effect of Orientation 14 3.5 The Effect of High Air Movement 15 3.6 The Effect of Ceiling Fans 16 3.7 House 12 (light-weight) Improvements to Achieve 5.0 Stars 18 3.8 Investigating House 1 Floor Variations 23
4.0 Conclusions 25
Appendix A - Consultancy Brief - Energy Efficiency Project 26 Appendix B - House Plans 28 Appendix C - Glazing Results 34 Appendix D - Simulation Results 37 Appendix E - The Cooling Effect of Ceiling Fans in AccuRate 40
4

Testing Proposed BCA2010 DTS with BERS Pro
1.0 INTRODUCTION
On 30 April 2009 the Council of Australian Governments (COAG) endorsed a National Strategy on Energy Efficiency 2009-2020 Memorandum of Understanding http://www.coag.gov.au/coag_meeting_outcomes/2009-04-30/docs/ National_strategy_energy_efficiency_MOU.pdf Amongst other “Key Elements of the Strategy” was Making Buildings More Energy Efficient:..
“42. As a first step, Governments have agreed to the following measures, subject to a Regulatory Impact Analysis: …
42.2. increasing energy efficiency requirements for new residential buildings to target a minimum of six stars, or equivalent, in the BCA 2010 update, to be implemented by May 2011, as well as introducing new energy efficiency requirements for hot-water systems and lighting...”
Consequently, on 8 June 2009 the Australian Building Codes Board (ABCB) released Draft Proposals for BCA 2010 Volume 2: http://www.abcb.gov.au/go/thebca/aboutbca
Amongst other changes, the BCA Proposal included increased stringency for the Energy Efficiency of houses to 6 Stars for the thermal calculation method of assessment, which necessitated relocating the Star Rating from a Verification Method to be part of the Deemed-To-Satisfy measures. This was to capture other Deemed-To-Satisfy elements, such as installation of thermal insulation and thermal breaks to metal frames. The reference building Verification Method V2.6.2.2 remained.
The proposed increased stringency in the Deemed-To-Satisfy measures needed to be tested for their “equivalence” to 6 Stars and a Consultancy Brief (Appendix A) was issued on 18 June 2009, and the project started 23 June 2009.
This report discusses the results of the comparison between the Proposed BCA2010 DTS measures and the Star Ratings from BERS Pro http://www.solarlogic.com.au/bers-pro. BERS Pro meets the requirements of the ABCB Protocol for House Energy Rating Software Version 2006.1. The version of BERS Pro used was dated 9 July 2009. A more recent version dated 17 July 2009 was not used as it may have required recalculation of all test results to that date. It is not known if this later version would make any difference in the results reported. Changes reported include: the calculation of radiation exchange between ground and an elevated floor in an enclosed underfloor space (not likely to affect the results for the base designs), in addition to displaying area-adjusted Star Ratings and formatting changes to the BERS Pro Report. All results in this Report are area-adjusted values. An updated AccuRate calculation engine was also available from 17 July 2009.
The equivalence to “Six Stars” was agreed to be interpreted as an average of 6.0 Stars across the variability of tested building designs, air movement, locations and orientations. To retain a nominal stringency average of 6.0 Stars across the building stock for all tested Climate Zones, it was considered reasonable therefore that some designs could be no less than 5.0 Stars. In addition, some designs would be expected to be no more than 7.0 Stars provided there was no significant cost disadvantage compared to other house designs in the same Climate Zone. Therefore, 5 to 7 Stars was the “equivalence range”. Where a design configuration deviated from the 5 to 7 Stars range, this was to be flagged for possible further investigation or possible additional consideration needed to be included in the proposed DTS measures.
5

Testing Proposed BCA2010 DTS with BERS Pro
2.0 METHOD
There were several parts in the testing exercise. Appendix A contains the project Consultancy Brief. The following discussion contains the details of the research method used to test the DTS measures. There were many ways to approach the exercise and this method is acknowledged as being one of many possible valid approaches.
Three house designs were nominated by ABCB from the set used for NatHERS software accreditation which included the AccuRate calculation engine. These house designs have been extensively tested and therefore have a good database of expected performance across Australia. Details of the houses are provided in Appendix B and summarised in Table 2. The selection of the three house designs was to represent some of the main design types used across Australia.
House 1 8 12 Storeys 1 2 2
External Walls Brick Veneer Perth - Cavity Brick
Brick Veneer Perth - Cavity Brick
Cavity Panel
Floor Slab on Ground Timber / Slab on Ground
Timber / Slab on Ground
Roof Tiles Tiles Metal Approximate Floor
Area, m² Conditioned / Unconditioned
133 / 32 220 / 109 114 / 51
Table 2 House Descriptions
The use of cavity brick construction is widespread in Perth. House 12 included approximately 101m² of suspended timber floor which was open below (high set).
Each House was to be modelled with proposed BCA 2010 DTS-compliant Building Fabric (Part 3.12.1), External Glazing (Part 3.12.2), Building Sealing (Part 3.12.3) and Air Movement (Part 3.12.4).
Included in Appendix B are drawings showing how the buildings were to be Zoned with Kitchen/Living, Living, Bedroom, Corridor, Wet Area and Garage type zones.
Once the building layout, with the various zones was drawn into the BERS Pro software, the building fabric was changed for each BCA Climate Zone. For each Orientation and Location the external glazing was recalculated with the percentage opening calculated to just achieve compliance.
Modelling was done with the glazing type and area that just complied with the proposed provisions (using a revised glazing calculator), with a minimum 20% glass area to gross floor area.
It was decided that the limit of Glazing stringency was to be tested so that both Aggregate Conductance and Solar Heat Gain were as high as possible. The constraints were the size of the wall that contained the glazing (maximum possible height and width) and limiting the selection of glazing types to ten products (see Table 3). All glass products selected were nominally clear with near maximum total SHGC for the given total U-value.
6

Testing Proposed BCA2010 DTS with BERS Pro
Table 3 shows the ten selected glazing products used in the test program. The first seven products were Generic in the BERS Pro Custom Window selector. There was an overlap in U-value between LowE single-glazing in timber or PVC frames and double-glazing in Standard Al frames. Tinted products (apart from LowE) were not selected as low U-value products were required in colder climates, which benefited from the higher SHGC of clear glass. The last two products were high performance triple-glazing.
Product Description Total U-Value Total SHGC Single Clear in Standard Al. Frames 6.46 0.76 Single Clear in Improved Al. Frames 5.91 0.75 Single LowE Clear in Standard Al. Frames 4.54 0.64 Single LowE Clear in Improved Al Frames 3.98 0.63 Single LowE Clear in Timber Frames 3.67 0.63 Double Clear in PVC Frames 3.08 0.67 Double LowE Clear in PVC Frames 2.53 0.62 3mm Clear/12mm Argon Gap/4mm Clear with Sungate 500 in a Rylock Thermal Composite Frame
2.04 0.63
3mm Clear/12mm Argon Gap/4mm Clear with Sungate 500/90mm Air Gap/4mm Clear in a Rylock Thermal Composite Acoustic Frame
1.54 0.51
4mm Clear/12mm Argon Gap/4mm Clear with Sungate 500/12mm Argon Gap/4mm Clear with Sungate 500 in a Paarhammer Timber Tilt & Turn Frame
1.21 0.45
Table 3 Glazing Products used for the Test Program
The new Glazing Calculator included different effects of the glazing parameters on Aggregate Conductance and Aggregate Solar Heat Gain. Climate Zone 1 used the BCA2009 formulas (Conductance Exposure Factor = 1.0), but the other Climates required a different approach to the glazing size calculation. In the BCA2009 House Glazing Calculator, reducing glazing size reduced the Aggregate Conductance. With the Proposed BCA2010 House Glazing Calculator, reducing width gave the same % of the Conductance Allowance, since the Conductance Allowance now included shade and Solar Heat Gain (formula adjusted by Bruce Lightfoot from the Draft Proposal).
The Procedure for maximising the glass size was to start with the original height, width, shade and clear glass in Standard Al. Frames. All adjustments were possible using scaling factors for size, with an all-round linear adjustment to the shade projection. Maximum sizes of glazing set by “if” statements where required. To simplify the calculation the width and shade were adjusted before the height. A Conductance Solution was found first by minimising the shade; then the Solar Heat Gain solution was found by adjusting the width. If the solution resulted in less than 20% glass area to gross floor area then a glazing product with a lower total U-value was selected and the iteration repeated.
If the conductance was not maximised (over 95% of the Allowance) then the glazing height was increased. Reducing the glass height made the Conductance and Solar Heat Gain % of the Allowance lower. Increasing the shade, increased the Conductance and reduced the Solar Heat Gain. Reducing the width reduced only the Solar Heat Gain % of the Allowance. Generally within the range of selected glazing products, the Aggregate Conductance and Aggregate Solar Heat Gain were more than 90% of the Allowance. There were some
7

Testing Proposed BCA2010 DTS with BERS Pro
situations where the maximum possible glazing did not reach a maximum solution, especially for Solar Heat Gain. The selection of the type of glazing was to satisfy Conductance. For low U-value products the SHGC is also slightly lower and Aggregate Solar Heat Gain was maximised below 80% of the Allowance.
Appendix C shows that it was definitely possible to find a solution with more than 20% glazing area to gross floor area (G/F) for every climate tested, provided the glazing total U-value was low enough. The maximum for House 12 (Ground floor) was 53% glazing area to gross floor area. These new glazing measures would most likely increase the use of LowE, double-glazing and low conductance frames, and in colder climates should encourage tall, narrow glazing with little shade and high SHGC.
The preferential orientations were clearly discernible from the BCA Glazing Tables 3.12.2.2.a and 3.12.2.2b as NE, N and NW. For these orientations more glass was possible, or higher U-value glazing (typically lower cost) was possible for the same glazing/floor ratio. Mixed glazing around a building should be employed more in the future to deliver improved Energy Efficiency within glazing size expectations.
There was an option in the test program to relocate glazing to maximise glass in these “preferred” orientations. This would have required different glazing changes for each orientation. Any relocation would have been subject to a degree of trial and error possibly requiring multiple simulations to determine the “optimum” result. In the end, this element of subjectivity was seen as unnecessary as the original glazing calculation procedure outlined above achieved acceptable results.
The test program intentionally maximised the glazing area and therefore the U-value selected was probably lower than would be necessary for “normal” houses. Based on the selected glazing in the tables in Appendix C, houses in these climates with 20% G/F should achieve compliance with glazing U-value one or two steps higher in Table 3. Lower U-value was required for less than optimal orientations, highlighting cost savings if a building design includes glazing maximised in the NE to NW orientation sectors. It may not be possible to have a glazing solution with 20% G/F and low cost glazing (e.g. single clear in standard Al frames) for many climates and some orientations.
Solar gains were maximised with high Solar Heat Gain Coefficient. The lowest U-value glazing selected was an equivalent R-value of R0.83, which was low compared to the external wall total R-value requirements of R2.8 or R2.4 (with 15° shade angle). Consequently, even with superior triple-glazing the conductive heat transfer is 2.9 times the lowest BCA2010 proposed external wall. This indicates that where solar gains were not available or beneficial in cold climates (due to orientation or shade), as little glazing area as possible was necessary to minimise uncontrolled conductive heat loss. To achieve required air movement may require full-opening designs (e.g. casement) or non-glazed (insulated) openings.
For normal Energy Efficiency Assessments the spreadsheet for air movement was required to be completed before the glazing calculator, as the air movement ratio compared to the requirement affected the glazing Solar Heat Gain Allowance. However in this test program, for the Standard and High air movement buildings the opening percentages were calculated after the sizes were determined. The opening percentages ranged from 0% to 90% and there was no requirement for optimum positioning of openings. Certain glazed and opaque openings (doors) had fixed opening percentages in this calculation so other glazed openings were adjusted to achieve at least 5% opening area / floor area per room with each storey of the building complying with BCA Table 3.12.4. For Standard air movement this was 10% for Climates 1, 2, 3 & 4, 7.5% for Climate 5, and 5% for Climates 6 & 7. For High
8

Testing Proposed BCA2010 DTS with BERS Pro
air movement the opening area / floor area was twice these values.
Ventilation openings need not be glass and opaque openings including louvres, hatches, shutters and doors can be employed to achieve the required air movement. For the current exercise all opaque openings remained at the original sizes and required air movement was available from these and glazing with various opening percentages. Achieving the required opening area to floor area ratio for some rooms included sharing ventilation between rooms along a breeze path (BCA Part 3.12.4.2) to give the required minimum building aggregate air movement.
Roof colour benefited from the R-value concession. For Climates Zones 1, 2, 3, 4 and 5 the upper surface solar absorptance was not more than 0.40 (0.30 selected = very-light), and for Climate Zones 6 and 7 not more than 0.60 (0.50 selected = medium). The Roof/Ceiling total R-value concession for Climate Zones 1 to 5 was R0.5 with standard roof-space ventilation (unvented as insulation was now required directly under the roof tiles). There were no roof lights or downlights.
External walls (except for Houses 1 and 8 in Perth) had a surface density less than 220kg/m². The solar absorptance of the walls was not more than 0.45 (0.30 selected = very-light), allowing a total R-value concession of R0.4 if there was also a minimum shade angle of 15° for Climate Zones 1, 2, 3, 4 and 5. For Houses 1 and 8 in Perth all stories had a minimum shade angle of 15° from eaves (or Porch, Patio, Alfresco, Balcony, Carport or Verandah with wall solar absorptance not more than 0.45 (0.30 selected = very-light) requiring no added insulation.
Orientations of the houses tested were North, North West, West and South West (top of drawings) for the nine locations of: Darwin, Brisbane, Longreach, Wagga Wagga, Perth, Adelaide, Moorabbin (Melbourne), Canberra and Hobart (BCA Climate Zones 1 to 7). Houses were to be modelled for Standard air movement and High air movement, which resulted in a recalculation of glazing type, sizes, shade and opening for each combination of orientation and location.
Due to time limitations the High air movement calculations were completed for House 1, all orientations and locations; and Houses 8 and 12, North orientation only for Brisbane and Perth. The difference between Standard and High air movement was expected to be similar for the other orientations and locations as House 1.
House 12 was further investigated to determine suitable measures to improve the Star Ratings to at least 5.0 for Brisbane, North orientation.
An extra task was added to the test program to investigate the effect of adding ceiling fans in the thermal simulation without changing air movement or ventilation opening. This was an academic exercise as the adding of ceiling fans would change the air movement Allowance and therefore the Glazing Solar Heat Gain Allowance, and hence the glazing sizes. 900mm diameter ceiling fans were added at the rate of one fan per 20m² floor area or part thereof in Habitable rooms, excluding corridors and WIR. The purpose of the calculations was to gauge the relative benefit of ceiling fans in the AccuRate calculation engine with no other changes in the buildings.
An further extra task requested by ABCB after preliminary results were analysed, was to test the variability of floor configurations for House 1, Brisbane, North orientation. This investigated the difference between slab on ground, suspended timber floor and suspended slab of different heights enclosed, open and very open, in addition to extra insulation for open and very open arrangements.
9

Testing Proposed BCA2010 DTS with BERS Pro
The BERS Pro simulation results reported in Appendix D include the area-adjusted Cooling Energy MJ/m², Heating Energy MJ/m² (of conditioned floor area) and area-adjusted Star Ratings. Based on the Protocol's tabulated total energy load MJ/m² star band criteria, linear interpolation was performed to arrive at decimal Stars. This manual interpolation was to aid interpretation of the results and was in addition to the ABCB Protocol for House Energy Rating Software Version 2006.1.
Additional information available from the BERS Pro simulation results included unadjusted Cooling, Heating and Star Ratings for each Conditioned zone as well as temperature data for all zones for every hour of the modelled year. Whilst this information was valuable in trouble-shooting actual house designs, it was not employed in the current testing exercise. There were fewer hours of conditioning in Bedrooms compared to Living areas, with lower internal heat gains compared to Living/Kitchen areas. Therefore generally, for the same room size, location, glazing and materials, Bedrooms scored higher than the overall House Star Rating, with Living and Living/Kitchen generally scoring lower than the House Star Rating. To improve a poorly-performing house, usually required attention firstly to the Living/Kitchen areas and poorly-performing Bedrooms (too hot or too cold). As the total energy for Living areas could be over 50% of the building total energy, largest gains were available from improvements in these areas.
For the current exercise, varying treatments room-by-room was not included as this sensitivity was not possible in prescriptive DTS measures. Consistent around each building was shade by the roof line (including Patio). The only exception was House 12 where the Ground floor glazing was shaded only by the building above or by adding louvre shade devices.
10

Testing Proposed BCA2010 DTS with BERS Pro
3.0RESULTS
A listing of the area-adjusted Cooling Energy, Heating Energy and Star Ratings for most simulations is Appendix D. Across the Climates the magnitude of Cooling Energy relative to the Heating Energy naturally varied widely. There were inevitable differences in Cooling Energy and Heating Energy results for different NatHERS Climates for the same BCA Climate Zone (e.g. Perth versus Adelaide and Canberra versus Hobart). There were wide differences in the total MJ/m² for the same Star Rating across NatHERS Climate files. This difference could be up to eight or nine times between a mild climate and an extreme (hot or cold) climate.
The Climates listed in the Tables below were the BCA Climate Zone (1 to 7) and the NatHERS Climate File used in the BERS Pro thermal simulation. There are several different NatHERS Climate Files that are relevant for each BCA Climate Zone. The results presented in this report include climate combinations that contain Australia's highest population density areas. For a comprehensive analysis of the Proposed BCA measures' equivalence for each Climate Zone, the simulation results for a full set of NatHERS Climate Files for each BCA Climate Zone should be examined - outside the scope of the present Report.
One item that was not questioned in the current analysis was the Star Bands in the ABCB Protocol for House Energy Rating Software 2006.1. It was assumed that the process of setting the star bands was based on sound scientific principals and represented an equitable assessment of Energy Efficiency across the many climates in Australia. It was assumed that the range and band divisions represented relative proportional improvements in total energy for every climate.
The Star Bands were a regulatory tool that reflected the relative stringency in each NatHERS Climate based on detailed and extensive comparative calculations for a number of building designs. The higher the Building Fabric Star Rating, the higher the effect of the operation of the house by the occupants on the actual heating and cooling energy. A ten stars house would experience only minor discomfort without artificial cooling and heating: with cooling energy related to necessary humidity control, and heating energy impacted by solar gains in colder climates. Consequently, a six Star house in every climate represented a similar degree of difficulty or cost relativity to a higher or lower Star rating house in the same climate.
However, the Star Bands were fixed and the results were often best compared using Area-Adjusted Stars. If there was clear evidence that the Star Bands or any calculation in the AccuRate simulation engine was needing adjustment, the Australian Department of Environment, Water, Heritage and the Arts (DEWHA) would be interested in seeing the details. Further investigation in this area was outside the scope of this Report.
3.1Glazing Area to Floor Area Ratios and Glazing Type
The calculation of Glazing was iterative, as discussed above. The highest possible U-value was selected that achieved a Solution within the 20% glass to gross floor area (G/F) minimum limit. Higher U-value glazing (~ lower cost) was possible with less than 20% G/F.
For each combination of location, orientation and air movement, new glazing sizes and openings were calculated. Whilst this information was helpful in the development of the results; based on several re-calculations of glazing, the overall Star Rating result did not differ greatly, so long as nearly the maximum of Conductance and Solar Heat Gain percent
11

Testing Proposed BCA2010 DTS with BERS Pro
of Allowances were achieved. As the current exercise was to test the limit of the proposed DTS stringency, the highest possible percent of the Allowances was sought for all cases, consistent with maximum possible glazing sizes.
Consequently, the detail in Appendix C Tables C1 and C2 is provided for reference purposes only. Tables C1 and C2 show the minimum of 20% G/F. Lower U-value glazing was employed in Locations currently accustomed to higher U-value products. This was a necessary consequence of the tighter glazing stringency.
Price competition as well as local manufacture in performance glazing products was likely to increase with higher demand for these products. In the Australian market this should result in lower real cost of these products to the industry. However, lower cost imported products that meet all the Australian requirements may also be more available.
Varying the glazing areas for each storey was by use of height and width factors which were multipliers in the Glazing Calculator of the original building glazing sizes (Appendix B). This process largely preserved the distribution of glazing to each room and façade, without favouring any orientation. As discussed earlier, more glass in the NE, N and NW orientation sectors was possible with lower contribution to the Aggregate Allowances. Buildings with glass preferentially placed in these sectors would enjoy either higher G/F and/or higher U-value glazing (~ lower cost).
Maximum sizes in the modified Glazing Calculator spreadsheet were determined by “if” statements for height and width, where once the glazing reached the wall size available it was not increased further. Other glazing continued to be increased by the ratio until the limit was reached. Consequently, the scale factors listed in Appendix C included these maximum size limitations.
For some Climates (e.g. House 1 Climates 3, 4, 6 and 7) the glazing height was maximised “Max” to achieve a Conductance Solution.
With High air movement, higher G/F (increased by 2% to 10%) was possible with wider glazing. When adding ceiling fans and investigating building fabric variations, the same glazing size, type and opening percentage for the house with Standard air movement was employed. Usually adding ceiling fans would change the air movement calculation, which changed the glazing size and opening, but the “raw” effect of ceiling fans was being investigated as discussed in Section 3.6.
For High air movement (Table C2) the same glazing types as listed in Table C1 were employed. For House 1, Climate 1 glazing sizes were not changed for High air movement, but eaves were reduced in depth. High air movement was not investigated further for Houses 8 and 12 as the trend was fairly clear from House 1 results and the spot results for Climates 2 and 5. See Section 3.5 for the discussion on the effect of High air movement.
3.2Area Adjustment Factor
Table 4 shows the Area Adjustment factors applied by BERS Pro to the raw simulation results to arrive at the floor area-adjusted cooling energy, heating energy and Star Rating. To obtain the unadjusted cooling energy and heating energy (MJ/m²) divide the listed energies in Appendix D by the area-adjustment factor.
Area Adjustment factors do not change with orientation, but vary according to Location and Climate. The area-adjustment factor increases the energy load for buildings larger than
12

Testing Proposed BCA2010 DTS with BERS Pro
200m² conditioned floor area and reduces the energy load for buildings smaller than 200m² according to a formula embedded in the software. The floor plans for each house were nominally identical across locations with the same room sizes, only with changed insulation, shade and glazing.
Location, Climate House 1 House 8 House 12 Darwin 1/1 0.95 1.04 0.92
Brisbane 2/10 0.90 1.05 0.87 Longreach 3/3 0.93 1.04 0.90
Wagga Wagga 4/20 0.90 1.04 0.87 Perth 5/13 0.90 1.05 0.87
Adelaide 5/16 0.90 1.05 0.87 Moorabbin 6/62 0.90 1.04 0.87 Canberra 7/24 0.90 1.04 0.88
Hobart 7/26 0.90 1.04 0.87
Table 4 Floor Area Adjustment Factors
3.3The Effect of Location, Standard Air Movement
Whilst the results vary for each House type, it was more instructive to discuss the overall results across the three houses. The results for each location were averaged across the orientations examined. Whilst the cooling and heating energy varied widely for the different orientations in each location, the area-adjusted Star Rating varied typically by 0.5 Stars to a maximum of 1.0 Stars from North to South-West. See Section 3.4 for the discussion on the effect of orientation.
Location, Climate House 1 House 8 House 12 AVERAGE Darwin 1/1 6.3 6.1 4.5 5.6
Brisbane 2/10 6.4 5.6 3.3 5.1 Longreach 3/3 6.7 6.7 3.8 5.7
Wagga Wagga 4/20 6.5 6.2 4.8 5.8 Perth 5/13 6.0 4.2 2.6 4.3
Adelaide 5/16 6.4 4.7 2.9 4.7 Moorabbin 6/62 6.6 6.2 5.5 6.1
5.9 Canberra 7/24 6.6 5.9 5.3 Hobart 7/26 6.8 6.6 6.5 6.6 AVERAGE 6.5 5.8 4.4 5.5
Legend: < 5.0 Stars, 5.0 to 5.4 Stars, 5.5 to 6.5 Stars, 6.6 to 7.0 Stars, > 7.0 Stars
Table 5 Average Star Rating per Location, Standard Air Movement
The colour coding on Table 5 indicates the equivalence values from 5.0 to 7.0 Stars.
13

Testing Proposed BCA2010 DTS with BERS Pro
House 12 dominated the below 5 Stars results for Climate Zones 1, 2, 3, 4 and 5 (warm to hot climates) and House 8 was below 5 Stars only for Climate Zone 5. There was no average result above 7.0 Stars, indicating the overall degree of stringency (average 5.5 Stars) was slightly below the required average equivalence of 6.0 Stars. Referring to the individual Standard air movement results for each orientation (Appendix D), there was no result above 6.9 Stars for any House or Location.
Based on averages for four orientations for each location, the proposed BCA2010 DTS measures were slightly high in the equivalence range (5 to 7 Stars) for House 1 (average 6.5 Stars), roughly equivalent for House 8 (average 5.8 Stars), but not equivalent for House 12 (average 4.4 Stars). This indicated a strong likelihood that the current BCA2009 DTS measures were below 5 Stars in stringency for House 12 in Climate Zones 1 to 5.
For every location House 8 average was lower than or equal to House 1 average, and House 12 average was lower than House 8 average. The relative results for these three houses may have been related to the overall thermal mass of the building (walls and floor) per unit floor area (discussed further in Sections 3.8 and 3.9). House 1 had the highest thermal mass per square metre floor area and House 12 had the lowest.
House 1 showed remarkable consistency across Climates (overall standard deviation 0.3 Stars), possibly reflecting the use of buildings with similar design in the setting of the Star Bands in the ABCB Protocol. House 8 was more variable with a standard deviation of 0.8 Stars, and House 12 was most variable with a standard deviation of 1.3 Stars.
Of the locations, across the house designs Darwin, Longreach, Wagga Wagga, Moorrabbin and Canberra included 5.5 to 6.5 Star equivalence, but House 12 in Darwin, Longreach and Wagga Wagga was below the equivalence range (5 to 7 Stars). Hobart average of 6.6 Stars was in the upper quartile of the equivalence range. Brisbane average of 5.1 was in the lower quartile of the equivalence range. All three houses had averages within the 5 to 7 Star equivalence range only for Moorabbin, Canberra and Hobart.
The problem of House 8, Climate Zone 5 (Perth and Adelaide) may be related to the availability of the thermal mass to the inside air, in addition to the need for thermal mass in these locations to regulate the effects of the wide variations in external temperature. See the discussion on thermal mass in Section 3.7. Some external insulation on the brick walls would be expected to improve these Star Ratings (not tested).
3.4The Effect of Orientation
Due to the low Standard Deviation for House 1 results the variability with orientation was also lowest for House 1. The difference between orientations was between 0.1 Stars and 1.1 Stars, most likely due to the wide range of glazing U-value and Glass to Floor ratios, especially for Houses 8 and 12.
Orientation House 1 House 8 House 12 AVERAGE North 6.7 0.3SD 5.6 0.9SD 3.9 1.4SD 5.4
North-West 6.6 0.2SD 5.7 0.8SD 4.2 1.2SD 5.5 West 6.4 0.3SD 5.8 0.8SD 4.5 1.4SD 5.6
South-West 6.3 0.3SD 6.1 0.8SD 4.7 1.3SD 5.7 AVERAGE 6.5 5.8 4.3 5.5
Table 6 Average and Standard Deviation per Orientation, Standard Air Movement
14

Testing Proposed BCA2010 DTS with BERS Pro
Table 6 shows that the preferred orientation was North for House 1, but South-West for Houses 8 and 12. This could be because for these two houses typically had glazing with lower U-value as the orientations changed from North to South-West (see Appendix C). House 1, by comparison used the same glazing for every orientation of each location simulated. Many houses had glazing solutions with over 95% of the Allowances for Conductance and Solar Heat Gain.
In the course of increasing the G/F for some designs, repeat calculations for different glazing solutions were observed to make little difference to the Star Ratings. More work would be required in this area to test performance sensitivity of houses with (say) 75% or 50% of the Conductance and Solar Heat Gain Allowances. It was considered likely that a house would have a higher Star Rating with lower percentages of the glazing Conductance and Solar Heat Gain Allowances.
Over all the orientations the 6 Stars equivalence range was satisfied by Houses 1 and 8 but not by House 12. The averages for each orientation were in the lower quartile of the 5 to 7 Stars equivalence range, but each House 12 orientation average was below the equivalence range.
3.5The Effect of High Air Movement
High air movement was investigated thoroughly for House 1 with spot confirmation checks for Houses 8 and 12. For each Location and Orientation the glazing sizes and the percentage opening of each glazed element were recalculated. High air movement increased the Solar Heat Gain constants CSHGC in BCA Table 3.12.2.1 by about 10%, effectively allowing 10% more glazing.
Table 7 shows the differences between Standard and High air movement across the Climates and Orientations. Appendix D gives the respective cooling energy and heating energy results.
The difference between Standard and High air movement was strongly related to the climate. The AccuRate engine in BERS Pro employs a look-ahead algorithm to establish if variable operational features such as window coverings, adjustable external shade awnings and ventilation openings were beneficial or not. If the outdoor conditions were likely to reduce heating or cooling by a particular setting of the adjustable feature (up or down, open or closed), then the program places these features in the best setting. In this way, each simulation assumed the occupants operated the building actively and intelligently in order to maximise the internal comfort naturally before applying artificial heating and cooling.
External temperatures outside of the internal thermostat settings for each Zone type over the hours of conditioning each day would result in the ventilation openings being closed during these times. More extreme climates were therefore less likely to benefit from natural ventilation as much as milder climates. In fact, predominantly cold climates could only gain from large quantities of fresh air in an energy-efficient manner if it was pre-heated using exhaust air and a heat exchanger.
Consequently, Climate Zone 2 (the mildest climate tested with more hours of comfortable external temperatures during the conditioning hours) had the highest improvement in Star Rating from air movement. Climate Zone 1 could gain from the beneficial breeze, but had hotter breezes than Climate Zone 2 and the ventilation openings would be closed for more hours than Climate Zone 2.
15

Testing Proposed BCA2010 DTS with BERS Pro
House 1 North North-West
West South-West
AVERAGE
Air Movement S H S H S H S H S H ∆ Darwin 1/1 6.3 6.9 6.4 6.8 6.3 6.7 6.3 6.7 6.3 6.8 0.5 Brisbane 2/10 6.8 7.8 6.6 7.9 6.0 7.2 6.2 7.2 6.4 7.5 1.1 Longreach 3/3 6.8 6.7 6.8 6.7 6.6 6.4 6.4 6.3 6.7 6.5 -0.2 Wagga Wagga 4/20 6.7 6.7 6.5 6.5 6.3 6.2 6.3 6.2 6.5 6.4 -0.1 Perth 5/13 6.1 6.0 6.1 6.1 5.9 5.7 5.8 5.6 6.0 5.9 -0.1 Adelaide 5/16 6.5 6.2 6.6 6.4 6.3 6.0 6.0 5.8 6.4 6.1 -0.3 Moorabbin 6/62 6.9 6.5 6.6 6.5 6.5 6.5 6.3 6.3 6.6 6.5 -0.1 Canberra 7/24 6.9 6.5 6.6 6.1 6.5 6.1 6.5 6.1 6.6 6.2 -0.4 Hobart 7/26 6.9 6.6 6.9 6.5 6.8 6.4 6.7 6.3 6.8 6.5 -0.3
North House 8 House 12 Air Movement S H ∆ S H ∆
Brisbane 2/10 5.4 5.8 0.4 2.6 3.0 0.4 Perth 5/13 4.0 3.8 -0.2 2.1 2.2 0.1
Table 7 Differences between Standard Air Movement and High Air Movement
All other climates showed a slightly negative benefit from High air movement. In Climate Zones 3 to 7 the effect of High air movement was an equal or slightly lower Star Rating. This was most likely due to the allowed increase in glazing sizes with higher glazing to gross floor area (G/F) for High air movement. Small differences between Climates, could also be related to the relative hours of pleasant external temperatures, as well as available breezes at those times. Detailed climate analysis would be required to quantify these breeze-availability differences (outside the scope of this Report).
Appendix D shows the differences across the orientations were fairly consistent, indicating the DTS benefits of air movement may be correctly assigned according to orientation.
Generally, because of the higher glazing allowed for High air movement houses, the benefits of more breeze availability could be negated by increased uncontrolled heat transfer through the glazing. Also, houses that performed poorly had less benefit from the breeze.
The trend for Houses 8 and 12 due to High air movement was similar to House 1, though less in magnitude. The Star Rating increase for Houses 8 and 12 for Climate Zone 2, was less than the Star Rating increase for House 1. For Climate Zone 5, the difference was very slight and possibly positive for the poorly-performing House 12. Little more could be gained from this house comparative analysis without more results in other locations.
3.6The Effect of Ceiling Fans
The reported benefit of ceiling fans alone was to be investigated. This was without the associated increase in air movement as a percentage of the allowance (lower air movement allowance) and the resulting increase in the allowable glazing area. Effectively, this analysis
16
Testing Proposed BCA2010 DTS with BERS Pro
for ceiling fans was to eliminate the effect of external breezes from the comparative results.
Appendix E has a discussion on the calculation of the cooling effect of ceiling fans in the AccuRate engine.
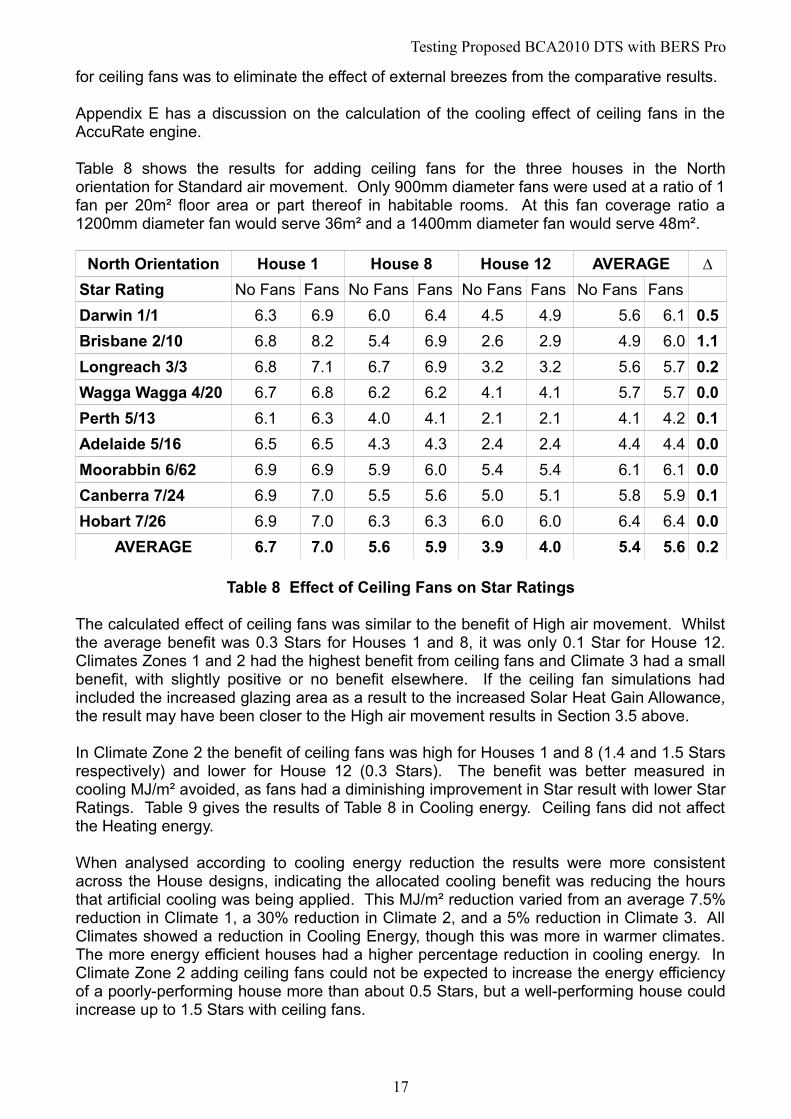
Table 8 shows the results for adding ceiling fans for the three houses in the North orientation for Standard air movement. Only 900mm diameter fans were used at a ratio of 1 fan per 20m² floor area or part thereof in habitable rooms. At this fan coverage ratio a 1200mm diameter fan would serve 36m² and a 1400mm diameter fan would serve 48m².
North Orientation House 1 House 8 House 12 AVERAGE ∆ Star Rating No Fans Fans No Fans Fans No Fans Fans No Fans Fans Darwin 1/1 6.3 6.9 6.0 6.4 4.5 4.9 5.6 6.1 0.5 Brisbane 2/10 6.8 8.2 5.4 6.9 2.6 2.9 4.9 6.0 1.1 Longreach 3/3 6.8 7.1 6.7 6.9 3.2 3.2 5.6 5.7 0.2 Wagga Wagga 4/20 6.7 6.8 6.2 6.2 4.1 4.1 5.7 5.7 0.0 Perth 5/13 6.1 6.3 4.0 4.1 2.1 2.1 4.1 4.2 0.1 Adelaide 5/16 6.5 6.5 4.3 4.3 2.4 2.4 4.4 4.4 0.0 Moorabbin 6/62 6.9 6.9 5.9 6.0 5.4 5.4 6.1 6.1 0.0 Canberra 7/24 6.9 7.0 5.5 5.6 5.0 5.1 5.8 5.9 0.1 Hobart 7/26 6.9 7.0 6.3 6.3 6.0 6.0 6.4 6.4 0.0
AVERAGE 6.7 7.0 5.6 5.9 3.9 4.0 5.4 5.6 0.2
Table 8 Effect of Ceiling Fans on Star Ratings
The calculated effect of ceiling fans was similar to the benefit of High air movement. Whilst the average benefit was 0.3 Stars for Houses 1 and 8, it was only 0.1 Star for House 12. Climates Zones 1 and 2 had the highest benefit from ceiling fans and Climate 3 had a small benefit, with slightly positive or no benefit elsewhere. If the ceiling fan simulations had included the increased glazing area as a result to the increased Solar Heat Gain Allowance, the result may have been closer to the High air movement results in Section 3.5 above.
In Climate Zone 2 the benefit of ceiling fans was high for Houses 1 and 8 (1.4 and 1.5 Stars respectively) and lower for House 12 (0.3 Stars). The benefit was better measured in cooling MJ/m² avoided, as fans had a diminishing improvement in Star result with lower Star Ratings. Table 9 gives the results of Table 8 in Cooling energy. Ceiling fans did not affect the Heating energy.
When analysed according to cooling energy reduction the results were more consistent across the House designs, indicating the allocated cooling benefit was reducing the hours that artificial cooling was being applied. This MJ/m² reduction varied from an average 7.5% reduction in Climate 1, a 30% reduction in Climate 2, and a 5% reduction in Climate 3. All Climates showed a reduction in Cooling Energy, though this was more in warmer climates. The more energy efficient houses had a higher percentage reduction in cooling energy. In Climate Zone 2 adding ceiling fans could not be expected to increase the energy efficiency of a poorly-performing house more than about 0.5 Stars, but a well-performing house could increase up to 1.5 Stars with ceiling fans.
17

Testing Proposed BCA2010 DTS with BERS Pro
North Orientation House 1 House 8 House 12 AVERAGE ∆ Cooling MJ/m² No Fans Fans No Fans Fans No Fans Fans No Fans Fans
Darwin 1/1 327 289 342 317 442 420 370 342 -28 Brisbane 2/10 28 15 39 24 63 51 43 30 -13 Longreach 3/3 112 103 116 108 264 258 164 156 -8 Wagga Wagga 4/20 21 19 34 32 88 86 48 46 -2 Perth 5/13 27 23 63 57 140 137 77 72 -4 Adelaide 5/16 33 31 73 72 128 127 78 77 -1 Moorabbin 6/62 14 13 33 30 32 30 26 24 -2 Canberra 7/24 18 14 69 63 74 71 54 49 -4 Hobart 7/26 5 4 24 22 23 22 17 16 -1
Table 9 Cooling Energy Reduction with Ceiling Fans
Ceiling fans could be used instead of air-conditioning or they could be used with air-conditioning, allowing a higher thermostat setting with humidity control being the main requirement. Use of ceiling fans in warmer climates should reduce the operation of air-conditioning and possibly allow smaller air-conditioning sizes to be installed for equivalent comfort. It was suggested that ceiling fans should be installed with air-conditioning to minimise air-conditioning use. Other forms of mechanical air circulation were also feasible but were not included in the Star Rating software as only permanently-installed appliances were considered.
Ceiling fans only appeared to significantly benefit houses in Climate Zones 1, 2 and 3. Further investigation into the appropriateness of the relative benefit from ceiling fans for different climates was outside the scope of this Report.
3.7House 12 (light-weight) Improvements to Achieve 5.0 Stars
Of the three houses, House 12 scored the lowest Star Rating for all climate Zones. Part of the current exercise was to determine what changes would be possible or necessary to increase the Energy Rating of poorly performing designs to at least 5.0 Stars, the minimum for Six Stars equivalence.
From Table 5 BCA Climates 2 and 5 scored the lowest Star Rating. The following discussion relates to various changes in Building Fabric for House 12, North orientation in Brisbane, BCA Climate Zone 2. Brisbane's NatHERS Climate 10 had the lowest MJ/m² Star bands of any Australian capital city, reflecting the mild climate. It was likely that changes for Brisbane would also improve the results for Perth and Adelaide, though the higher temperature variability in Climate Zone 5 may favour thermal mass designs.
Questions that need answers when House 12 results are compared to the other housesinclude:What makes House 12 perform so poorly? and:What can be done to improve it's thermal performance that can be included in DTSmeasures?
As a partial answer to the first question: the timber construction and open underfloor are main differences compared with Houses 1 and 8. Several variations in the building fabric
18
Testing Proposed BCA2010 DTS with BERS Pro
were to be investigated to determine what changes gave the greatest improvement (including lowest cost).
A new concept of an “ultimate house” was introduced. The ultimate house had the minimum of uncontrolled heat transfer. This was a hypothetical, impractical, academic design with the same floor plan and “glazing” sizes, but with maximised insulation on all surfaces and with minimum solar gains. The ceiling, walls and exposed floor had added R15 insulation and the “glass” was changed to R1.0 bulk insulation in timber frames with total U-value 1.19 and total SHGC 0.01. This ultimate house was used for calibration purposes, to determine the relative heat transfer through the different building elements. Analysis could have varied the insulation on each surface to obtain a specific result, but the simplicity of an over-all building result was preferred.
Heat transfer could not be lower for the ultimate house (without making glazing smaller), so the difference in total energy between the test configuration and the ultimate house would represent the amount of controllable heat transfer remaining. The total energy for the ultimate house was therefore residual, unavoidable and ultimately uncontrollable.
It could be argued that eliminating solar gains in the ultimate house disadvantaged the beneficial effect of glazing in winter. However, apart from low U-value glazing in NE to NW orientations with little to no shade; in winter, glazing conductive heat loss may overwhelm solar heat gain in colder climates. In summer, there was little corresponding conductive heat loss to the solar heat gain. Some conductive heat transfer was permitted through the ultimate house glazing, to act as a measure (calibration) of the minimum of uncontrollable heat transfer.
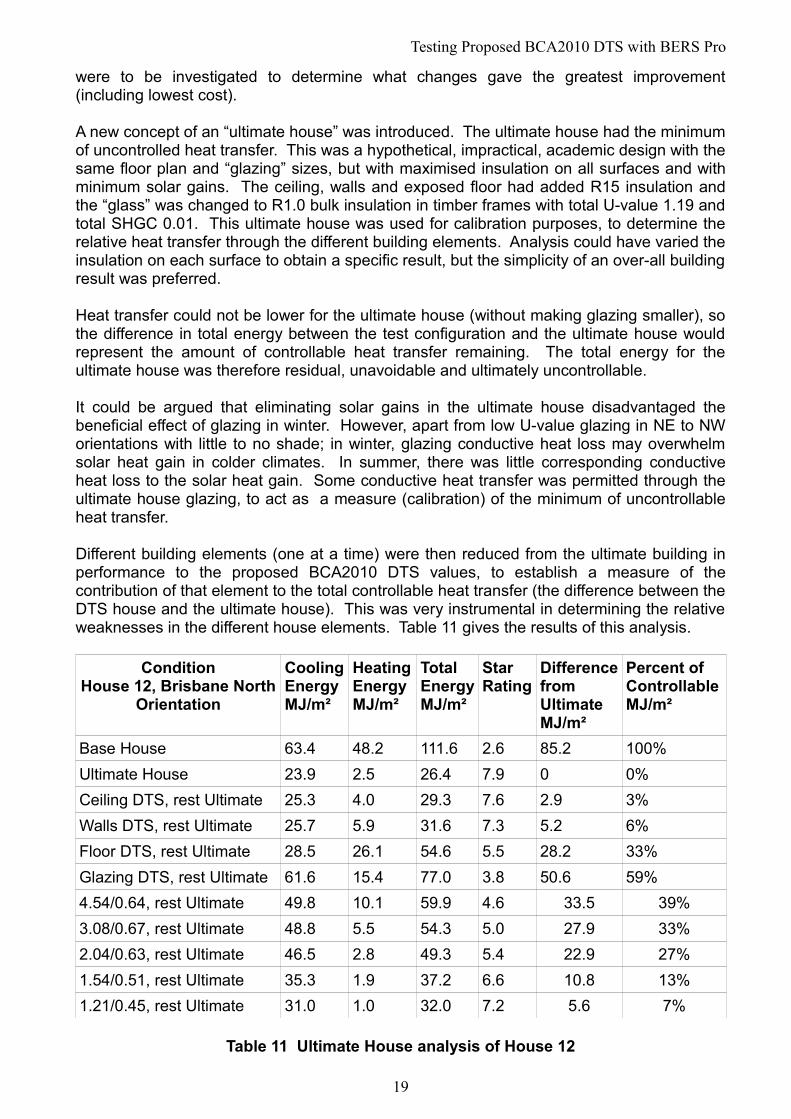
Different building elements (one at a time) were then reduced from the ultimate building in performance to the proposed BCA2010 DTS values, to establish a measure of the contribution of that element to the total controllable heat transfer (the difference between the DTS house and the ultimate house). This was very instrumental in determining the relative weaknesses in the different house elements. Table 11 gives the results of this analysis.
Condition House 12, Brisbane North
Orientation
Cooling Energy MJ/m²
Heating Energy MJ/m²
Total Energy MJ/m²
Star Rating
Difference from Ultimate MJ/m²
Percent of Controllable MJ/m²
Base House 63.4 48.2 111.6 2.6 85.2 100% Ultimate House 23.9 2.5 26.4 7.9 0 0% Ceiling DTS, rest Ultimate 25.3 4.0 29.3 7.6 2.9 3% Walls DTS, rest Ultimate 25.7 5.9 31.6 7.3 5.2 6% Floor DTS, rest Ultimate 28.5 26.1 54.6 5.5 28.2 33% Glazing DTS, rest Ultimate 61.6 15.4 77.0 3.8 50.6 59% 4.54/0.64, rest Ultimate 49.8 10.1 59.9 4.6 33.5 39% 3.08/0.67, rest Ultimate 48.8 5.5 54.3 5.0 27.9 33% 2.04/0.63, rest Ultimate 46.5 2.8 49.3 5.4 22.9 27% 1.54/0.51, rest Ultimate 35.3 1.9 37.2 6.6 10.8 13% 1.21/0.45, rest Ultimate 31.0 1.0 32.0 7.2 5.6 7%
Table 11 Ultimate House analysis of House 12
19

Testing Proposed BCA2010 DTS with BERS Pro
The ultimate house achieved 7.9 Stars, indicating that there was significant room for improvement of the DTS2010 compliant design. In order to achieve 5.0 Stars the total energy needed to be no more than 55MJ/m².
The separation of the building elements in the ultimate building analysis was not expected to account entirely for the total controllable heat transfer, due to thermal lag and temporal interactions between the different elements. However, on this simple analysis the sum of the percentages of controllable heat transfer was 101%. This indicated that the different building elements were acting almost independently in the thermal simulation, thus validating this analysis approach for this building. A building with more thermal mass may have a different sum of the element percentages. Consequently for this building, the examination of each element in isolation may yield helpful conclusions.
Increasing the ceiling insulation more than the DTS value was not expected to make much more difference in the overall result (3%). Likewise increasing the wall insulation beyond DTS was also a minor contributor (6%) to the total controllable heat transfer. Once adequate insulation was applied to ceiling and walls, adding more insulation gave diminishing returns.
The floor was a different storey. The DTS insulation (R1.0 total) had a significant amount of heat loss (high heating energy) with a total energy amounting to 33% of the remaining controllable heat transfer. By increasing floor insulation this house would achieve an improved Star Rating. See below for the floor analysis.
The glazing contributed the majority of the controllable heat transfer, accounting for 59% of the difference compared to the ultimate house. Additional calculations were performed by changing the glazing to establish what could be done to reduce this uncontrolled heat transfer. The second half of Table 11 shows the effect of lower U-value glazing (total U-value and total SHGC listed). This was with glazing sizes and shade the same as the base design and other elements as for the ultimate house. The relative differences between the glazing products was roughly proportional to the total U-value. It was possible to have heating energy below the ultimate house because of solar gains through the glazing. But since the ultimate house heating energy was already low this was a minor improvement.
Increasing the stringency of glazing for this climate would increase the Star Rating for the other houses which already achieve 6.0 Star equivalent stringency (see Table 5). The suspended floor was already a factor in the glazing calculator allowances. Perhaps for this Climate the timber floor needed lower Glazing constants in BCA Table 3.12.2.1. Another approach could also incorporate the lack of wall thermal mass in the glazing constants.
Further simulations were performed in order to quantify the effects of some practical changes that could be employed to increase House 12 to 5.0 Stars (less than 55MJ/m² total). This concentrated on maximising the floor insulation and varying the glazing, as well investigating other floor configurations.
Varying the glazing type only with ceiling and walls at DTS and the floor total R-value of R3.5, yielded the first half of Table 12. This indicated that unless the glazing allowances were reduced to less than one third of the proposed BCA2010 there was no possibility of this light-weight design achieving 5.0 Stars, even with ceiling fans. The glazing would need to have a total U-value below 2.04 - a much higher glazing stringency than other designs (undesirable).
20

Testing Proposed BCA2010 DTS with BERS Pro
Condition House 12, Climate 2, North
Orientation
Cooling Energy MJ/m²
Heating Energy MJ/m²
Total Energy MJ/m²
Star Rating
Base House 63.4 48.2 111.6 2.6 Floor R3.5, 6.46/0.76 63.7 29.8 93.5 3.1 Floor R3.5, 4.54/0.64 52.6 23.7 76.3 3.8 Floor R3.5, 3.08/0.67 51.2 17.5 68.7 4.1 Floor R3.5, 2.04/0.63 49.2 13.2 62.4 4.5 Floor R3.5, 1.54/0.51 38.9 12.0 50.9 5.3 Floor R3.5, 1.21/0.45 33.7 9.7 43.4 6.0 Base House, ceiling fans 51.4 48.2 99.6 2.9 20% glazing/gross floor 41.1 44.1 85.2 3.4 Suspended slab, total R1.0 45.0 24.9 69.9 4.1 Suspended slab, total R3.0 51.9 12.7 64.6 4.9 1st floor Slab on Ground 35.5 13.4 48.9 6.1
Table 12 House 12 Comparison of Different Floor Configurations
The problem of House 12 was identified as not being related to the external walls, since the insulated external walls contributed only 6% of the total controllable heat transfer in this design (compared to the ultimate building). It should be possible to achieve 5.0 Stars with light-weight walls. Table 12 indicated that the open under-floor environment was a problem with this design. With R3.5 total floor insulation the heating energy was reduced only 38%, and the cooling energy was slightly higher than the base house.
This therefore led to the conclusion that the lack of floor thermal mass may be a factor in the inability of the base design of House 12 to score over 5.0 Stars without serious glazing improvements. Whilst slab floor was significantly more expensive, many builders specialise in these designs with concrete pumping to sloping sites. If the energy efficiency of a building with light-weight walls and insulated slab floor was shown to meet the Energy Efficiency stringency requirements, then a Building Solution could be codified as a DTS Solution. This would then require suspended timber-floor designs to be withdrawn from Part 3.12.0(a)(ii) DTS provisions, leaving compliance according to thermal calculations (Part 3.12.0(a)(i) Star Ratings or V2.6.2.2 Reference Building).
Table 12 shows the results of modelling the base House 12 with a suspended slab floor including DTS2010 insulation total R1.0 and total R3.0 insulation. If the equivalent stringency was required to be at least 5.0 Stars this is achieved for House 12 with a suspended slab floor, R2.5 total insulation (by interpolation) and ceiling fans. Tables 7 and 8 have indicated that High air movement was nearly equivalent to ceiling fans in this Climate.
The house design was modified to be a single storey slab on ground to allow comparison with House 1. This now scored 6.1 Stars, which possibly explains why the difference between light-weight and brick-veneer walls was not as high as previously thought. It may be related to the placement and amount of insulation. For brick-veneer walls the insulation on the inside of the brick walls reduced the availability of the masonry thermal mass to the internal air. The brick thermal mass still moderates (including thermal lag) the external temperature to the outside of the internal stud wall insulation. So the difference between
21

Testing Proposed BCA2010 DTS with BERS Pro
insulated cavity panel and insulated brick veneer walls was not as great.
Reverse brick-veneer walls with masonry on the inside were thermally superior to standard brick veneer design with a small increase in cost due to the weather-proof external cladding. An alternative would be a small amount of additional insulated cladding to external brickwork. This cladding would be best achieved with a durable surface and would improve the thermal performance of the brick thermal mass without being a structural element. Appropriate installation would include moisture, vermin and termite requirements.
House 12 which included an open under-floor, with an adequately insulated suspended slab, was able to achieve 5.0 Stars with ceiling fans or High air movement. In cooler climates overheating was less and adding insulation below the floor was expected to always reduce heating energy. The results for House 12 in Climates 6 and 7 (Table 5) were evidence of this.
After careful consideration of the results above the amount of “available thermal mass” was considered an important parameter for achieving 6 Star equivalent energy efficiency of buildings.
If a building design lacks beneficial, available thermal mass then there was less passive regulation or control of internal temperatures and more artificial heating and cooling would be required. A building with high available thermal mass would not vary much in internal temperature over a day and across the seasons.
The casual definition of available thermal mass, includes reference to building elements with medium to high specific heat capacity. Typical specific heat capacities (ability to store heat) for some building materials are listed in Table 13.
Specific Heat Capacity, J/kg.K polystyrene insulation 340 fibreglass insulation 880 concrete 880 plasterboard 1050 timber 2090 water 4190
Table 13 Specific Heat Capacities of Some Building Materials
To benefit from the specific heat capacity, there were several related parts to the application of thermal mass:
• there needs to be several tonnes of the material • the material should be closely-connected to the inside air • protected from extremes of external temperatures (insulation and shading) • positioned to maximise the ability to gain from controlled solar gains in winter and
cooling breezes in summer
The term “closely-connected” refers to the minimisation of surface treatments and coatings that add insulation between the thermal mass and the inside air (e.g. floor coverings). Any insulating layer reduces the availability of the thermal mass for heat transfer to and from the inside air. The design, selection, position and use of thermal mass should allow it to be
22

Testing Proposed BCA2010 DTS with BERS Pro
regenerated for passive heating or cooling during the rest of the day and over several days.
In addition to conventional building materials there are “phase-change” materials that store latent heat in the change of phase from solid to liquid.
However, some sites or designs cannot incorporate thermal mass floors, like House 12 and have a lower Star Rating. If these designs are to continue in the more stringent DTS2010 energy efficiency regime, either some form of concession needs to be recognised in the proposed BCA but with a definite time period for cessation. The concession may be related to the renew-ability and low embodied energy benefits of timber products in addition to relative cost and construction flexibility (other important sustainability issues). Without a limit on the concession, parts of the industry may be reluctant to improve the energy efficiency in a timely fashion, and inefficient market expectations will continue. Limiting the amount of unenclosed (to the ground) exposed timber floor could be included in the BCA. Alternatively, suspended timber floors could be excluded from the prescriptive DTS measures.
Another possibility, in order to secure the Objective of reducing greenhouse gas emissions, is that suspended timber floor houses be allowed to be constructed with the permanent prohibition on the installation of air-conditioning for indoor or room climate control in any form apart from fans and single-phase spot coolers or heaters (appliances). Any control of this nature will have to be agreed-to and implemented by the regulating authority in each State and Territory, possibly through COAG (not preferred).
The theory of thermal mass is based on buildings with more tonnes of thermal mass per square metre floor area tending to have more natural internal temperature regulation. This is conditional on the thermal mass being suitably available to the conditioned spaces, and used correctly including being protected from the uncontrolled external temperature swings (position, shading and insulation), and exposed to controlled thermal re-generation resources (sunlight in winter and night cooling breezes in summer). In line with this theory and with this correct use, slab on ground floors (due to the thermal coupling with the ground) have more beneficial thermal mass than masonry walls, externally insulated masonry walls (reverse brick-veneer) are more beneficial to internally insulated masonry walls, and externally insulated suspended slab floors are more beneficial than externally insulated suspended timber floors.
3.8 Investigating House 1 Floor Variations
Because of the influence on the floor on the results for House 12, further investigation of the effect of floor types was undertaken for House 1. The differences investigated in Table 14 include timber floor with different under-floor heights and open or very-open environments. Climate Zone 2, Brisbane for North orientation was selected for comparison. The simulations had the same roof and wall insulation, and glazing. For enclosed under-floors the ventilation opening was 1000mm²/m.
The results in Table 14 reinforced the previous results for House 12 investigations related to floor constructions. House 1 with a low-set enclosed timber floor was 0.8 Stars lower than a low-set suspended slab floor, which was 0.8 Stars lower than a slab on ground. There was a clear loss of thermal ground coupling as the floor to ground height increased. The ground coupling was lost with open and then very-open configurations, resulting in only 3.3 Stars for a timber floor with R1.0 added, more than half the 6.8 Star Rating of the slab on ground. The increase in total energy was mostly heating (8 to 47 MJ/m² = 5.8 times) compared to cooling (28 to 41 MJ/m² = 46% higher).
23

Testing Proposed BCA2010 DTS with BERS Pro
Increasing the insulation below the open timber floor from R1 total to R2 added, helped to reduce the uncontrolled heat loss through the floor back to 22 MJ/m² (= 2.7 times slab on ground). With ceiling fans or High air movement the brick-veneer insulated timber floor would achieve 5.0 Stars. This was a result different to House 12 where an insulated suspended slab floor with ceiling fans or high air movement was required to achieve 5.0 Stars.
Condition House 1, Climate 2, North Orientation
Cooling Energy MJ/m²
Heating Energy MJ/m²
Star Rating
Base House, Slab on Ground 28 8 6.8 Timber, enclosed 600mm 37 15 5.2 Timber, enclosed 1000mm 40 17 4.8 Timber, enclosed 1500mm 41 20 4.6 Timber, enclosed 2000mm 42 21 4.4 Timber, open 600mm, R1 total 39 33 4.0 Timber, open 600mm, R2 added 40 19 4.8 Timber, very open, R1 total 41 47 3.3 Timber, very open, R2 added 40 22 4.6 Susp slab, enclosed 600mm 31 12 6.0 Susp slab, enclosed 2000mm 34 17 5.4 Susp slab, open 600mm, R1 total 31 26 4.9 Susp slab, open 600mm, R2 added 32 14 5.7 Susp slab, very open, R1 total 31 39 4.0 Susp slab, very open, R2 added 32 16 5.5
Table 14 House 1 with Different Floor Configurations
For this mild climate, Insulating under an enclosed suspended timber floor may increase the cooling energy more than the reduction in cooling energy (not investigated). The construction of the bounding walls of the sub-floor would also influence the performance of the enclosed underfloor. Higher thermal mass sub-floor walls would be expected to improve the temperature regulation below the floor and increase the habitable room energy efficiency (not investigated). This may not be able to be modelled with some Energy Rating software.
The results for House 1 with a suspended slab floor were nearly 1.0 Stars better than for the timber floor for all conditions, strongly pointing to the consistent thermal mass benefit of the concrete floor. Adding insulation (from R1.0 total to R2.0 added) made almost the same improvement for the configurations investigated: timber open - 0.8 Stars, timber very open -1.3 Stars, slab open - 0.8 Stars, slab very open - 1.5 Stars.
With some thermal mass, buildings of lighter construction can achieve 5.0 Stars and therefore be within the 6 Stars equivalence band. A Building Solution for 6 Stars equivalency can be found with either masonry external walls or a slab floor, with floors insulated if not enclosed . A third possibility related to internal thermal mass walls was not investigated. More extensive results were not obtained and further work in this area is
24

Testing Proposed BCA2010 DTS with BERS Pro
recommended before codifying. Yet to be determined are the minimum total R-value for exposed floors and how to establish the minimum thermal mass requirements.
4.0 CONCLUSIONS
Whilst the testing program had limitations including: scope, variety of house designs, NatHERS Climate files and orientations, as well as limited investigation for High air movement, and improvements to bring poorly-performing designs to at least 5.0 Stars, there were major outcomes including:
• House 1 with DTS2010 measures achieved 6 Stars equivalence for all locations and all conditions tested, except for timber floors.
• House 8 with DTS2010 measures achieved 6 Stars equivalence for all Climate Zones except Zone 5 (Perth and Adelaide).
• House 12 with DTS2010 measures achieved 6 Stars equivalence for Climate Zones 6 and 7 (Moorabbin, Canberra and Hobart).
• A clear indication that thermal mass (walls or floor) would be required for 6 Stars equivalence in Climate Zone 2.
• Lightweight designs could not be adequately improved with increased insulation, ceiling fans or High air movement, and comparable glazing stringency to more massive designs.
• Exposed floors need to be adequately insulated to minimise winter heat loss. Timber floors should be above a storey below or be enclosed to the ground.
• Ceiling fans and High air movement are effective in reducing cooling energy in Climate Zones 1, 2 and 3. However, they are insufficient to increase a poorly-performing house more than about 0.5 Stars in these Climates.
More research is required on the edges of this testing regime, in order to verify that trends remain valid for other conditions and that untested combinations achieve the expected outcomes. In particular, the issue of adding thermal mass to otherwise lightweight designs needs extensive and careful consideration.
If revisions to the proposed or future BCA are to be developed, use of the “ultimate building” comparative process may yield minimum cost improvements to the energy efficiency in the Australian building stock.
It is possible that the proposed BCA 2010 roof insulation requirements presents a lower reduction in remaining controllable heat transfer than improvements possible with increases in stringency to other building elements, particularly exposed floors and glazing.
25

Testing Proposed BCA2010 DTS with BERS Pro
APPENDIX A
CONSULTANCY BRIEF – ENERGY EFFICIENCY PROJECT BCA VOLUME TWO
HOUSE ENERGY RATING TESTING
TASK DESCRIPTION
Determine what ratings to the Nationwide House Energy Rating Scheme are achieved with three typical houses using the Prescriptive Deemed-to-Satisfy proposals for BCA 2010.
HISTORY
Prescriptive Deemed-to-Satisfy proposals for BCA 2010 were developed and released on 8 June 2009. These need to be tested to determine whether they achieve, on average, the target stringency.
METHODOLOGY
Three houses are to be modelled in 4 orientations. The plans are at the end of this document. Elevations will be provided to the successful tenderer.
The houses are to be as shown in the basic plans and construction specifications provided but configured to satisfy DTS proposals. The houses have been selected from the set used for NatHERS software accreditation and AccuRate PRO files of their as built configurations will be available. Houses without eaves by default are to have equal eaves on all sides with widths selected to suit the climate. Glazing should be configured by following these guidelines:
• Glazed doors which are functionally necessary (eg. connecting a living area to a patio) should be left at their default height but adjusted in width if necessary for compliance. (Sliding doors can be changed to hinged doors if opening widths become unviable).
• Floor-to-eaves windows should first be reduced in height by lifting the sill to 800mm above the floor and then adjusted in width to the extent needed for compliance
• User adjustable external blinds can be used (where appropriate) to augment shading by eaves.
• Economical choices of improved glazing types can be used instead of reductions to glazing areas
• Glazing / floor area ratio should not fall below 20%. (Floor area covers all internal area, not simply the net conditioned floor area.)
The roof and walls are to be of colours that benefit from the R-Value concession. The wall construction is to be brick veneer in all but Perth where it is to be cavity brick.
The process will be as follows:
Step 1. Adjust the building fabric, sealing and air movement configurations to just satisfy the BCA DTS proposals without concessions or the use of rooflights.
Step 2. Adjust the glazing area so that it just complies with the proposed glazing provisions for “standard air movement” using higher performance glazing such as toned, low e and/or double glazing where beneficial to maximise the area. Glazing may be resized or relocated during configuration provided glazing area does not fall below 20% of floor area. A revised glazing calculator will be provided.
Step 3. Rate the houses in the North, West, South West and North West orientations in Adelaide, Perth, Melbourne (Moorabbin), Hobart, Darwin, Brisbane, Canberra, Longreach and Wagga Wagga. (Orientation is based on the wall facing the top of the plan drawing.)
26

Testing Proposed BCA2010 DTS with BERS Pro
Step 4. Repeat Step 2 with ceiling fans in habitable rooms and the proposed glazing provisions for “high air movement”.
SUPERVISION & REPORTING
Supervision is by the Project Manager nominated by the ABCB Office.
DELIVERABLES
• A draft and final report that shows the ratings in decimal stars achieved by each house, in each orientation, in each location with and without ceiling fans.
• A weekly progress report in the form of a brief email to the Project Manager.
TIMING
• Draft report no later than by 3 July 2009 (sooner if possible).
• Final report no later than by 17 July 2009 (sooner if possible).
Note: The ABCB Office intends to undertake this work with three different consultants each using one of the three different house energy rating packages. However, a tenderer may tender on all three tasks with a single consolidated report.
27

Testing Proposed BCA2010 DTS with BERS Pro
APPENDIX BHOUSE 1 PLANS
28

Testing Proposed BCA2010 DTS with BERS Pro
HOUSE 8 PLANS
29

Testing Proposed BCA2010 DTS with BERS Pro
30

Testing Proposed BCA2010 DTS with BERS Pro
HOUSE 12 PLANS
31

Testing Proposed BCA2010 DTS with BERS Pro
32

Testing Proposed BCA2010 DTS with BERS Pro
33

Testing Proposed BCA2010 DTS with BERS Pro
APPENDIX CGLAZING RESULTS
The modified Glazing Calculator was used to obtain the maximum glazing sizes possible consistent with the Aggregate Conductance Allowance, the Aggregate Solar Heat Gain Allowance, and the available wall size.
The following Tables give the glazing sizes and types for Standard air movement and High air movement for the three houses. Lower U-value glazing was selected when a higher U-value did not achieve the minimum 20% glazing area to gross floor area requirement.
See Section 3.1 for further information.
34

Testing Proposed BCA2010 DTS with BERS Pro
STANDARD AIR MOVEMENT House 1 House 8 House 12 Location BCA/ NatHERS Climate
Orien tation
Scale Factor Height/ Width
Glass/ Floor
Total U-value /SHGC
Scale Factor Height/Width Gnd - 1st
Glass/Floor Gnd - 1st
Total U-value /SHGC Gnd - 1st
Scale Factor Height/Width Gnd - 1st
Glass/Floor Gnd - 1st
Total U-value /SHGC Gnd - 1st
Darwin 1/1 N 1.4 / 1.2 25% 6.46 / 0.76 1.06-1.33/1.2228% - 25% 5.91/0.75 -
6.46/0.76 1.15-1.27 23% - 23% 6.46/0.76 -6.46/0.76
NW 1.4 / 1.2 25% 6.46 / 0.76 1.06-1.33/1.2228% - 25% 5.91/0.75 -6.46/0.76 1.20-1.26 24% - 23% 6.46/0.76 -
6.46/0.76
W 1.4 / 1.2 25% 6.46 / 0.76 1.06-1.33/1.2228% - 25% 5.91/0.75 -6.46/0.76 1.24-1.27 24% - 23% 6.46/0.76 -
6.46/0.76
SW 1.4 / 1.2 25% 6.46 / 0.76 1.06-1.33/1.2228% - 25% 5.91/0.75 -6.46/0.76 1.28-1.27 25% - 23% 6.46/0.76 -
6.46/0.76 Brisbane 2/10 N 1.5 / 0.95 21% 4.54 / 0.64 1.04/1.06-
1.05/1.22 29% - 20% 6.46/0.76 -6.46/0.76 1.82-1.44 36% - 26% 6.46/0.76 -
6.46/0.76
NW 1.45 / 1.1 24% 4.54 / 0.64 0.90/0.97-1.33/1.22 23% - 25% 6.46/0.76 -
6.46/0.76 1.13-1.10 22% - 20% 6.46/0.76 -2.53/0.62
W 1.8 / 1.2 30% 4.54 / 0.64 0.93/1.06-1.59/1.17 27% - 26% 4.54/0.64 -
6.46/0.76 1.00-1.10 20% - 20% 2.53/0.62 -2.53/0.62
SW Max / 1.2 31% 4.54 / 0.64 0.73/1.06-1.40/1.16 20% - 25% 4.54/0.64 -
6.46/0.76 2.40-1.10 47% - 20% 2.53/0.62 -2.53/0.62
Longreach 3/3 N Max /
0.78 20% 3.67 / 0.63 1.44/0.56-1.6/0.91 20% - 22% 6.46/0.76 -
3.67/0.63 1.60-1.43 31% - 26% 6.46/0.76 -4.54/0.64
NW Max/ 0.77 20% 3.67 / 0.63 1.44/0.62-
1.6/1.17 22% - 28% 4.54/0.64 -3.67/0.63 1.15-1.44 23% - 26% 4.54/0.64 -
2.53/0.62
W Max / 0.85 22% 3.67 / 0.63 1.45/0.56-
1.6/1.17 20% - 28% 3.98/0.63 -3.67/0.63 1.23-1.20 24% - 22% 2.53/0.62 -
2.53/0.62
SW Max / 0.93 24% 3.67 / 0.63 1.15/0.63-
1.6/1.10 22% - 27% 2.53/0.62 -3.67/0.63 1.08-1.32 21% - 24% 2.53/0.62 -
2.53/0.62 Wagga Wagga 4/20 N Max /
1.14 30% 2.53 / 0.62 1.45/0.72-1.6/0.91 25% - 22% 4.54/0.64 -
3.67/0.63 1.54-1.60 30% - 29% 6.46/0.76 -3.67/0.63
NW Max / 1.13 30% 2.53 / 0.62 1.45/0.56-
1.6/0.94 20% - 23% 3.98/0.63 -3.67/0,63 1.06-1.65 21% - 30% 4.54/0.64 -
2.04/0.63
W Max / 1.26 33% 2.53 / 0.62 1.45/0.60-
1.6/1.17 21% - 28% 3.08/0.67 -3.67/0.63
1.29-1.69/0.685 25% - 20% 2.04/0.63 -
2.04/0.63
SW Max / 1.22 32% 2.53 / 0.62 1.45/0.57-
1.6/0.84 20% - 21% 2.53/0.62 -3.67/0.63 1.13-1.12 22% - 20% 2.04/0.63 -
2.53/0.62 Perth 5/13 N 1.7 / 1.2 29% 5.91 / 0.75 1.44/1.06-
1.6/1.21 37% - 29% 6.46/0.76 -6.46/0.76 2.00-1.65 39% - 30% 6.46/0.76 -
6.46/0.76
NW 1.4 / 1.2 25% 5.91 / 0.75 1.44/0.77-1.6/1.22 27% - 30% 6.46/0.76 -
6.46/0.76 1.47-1.60 29% - 29% 6.46/0.76 -3.98/0.63
W 1.6 / 1.2 28% 5.91 / 0.75 1.44/0.57-1.6/1.22 20% - 30% 6.46/0.76 -
6.46/0.76 2.00-1.60 39% - 29% 2.53/0.62 -2.53/0.62
SW 1.7 / 1.2 29% 5.91 / 0.75 1.44/0.68-1.6/1.19 24% - 29% 4.54/0.64 -
6.46/0.76 1.40-1.60 28% - 29% 2.53/0.62 -2.53/0.62
Adelaide 5/16 N 1.7 / 1.2 29% 5.91 / 0.75 1.44/1.06-
1.6/1.21 37% - 29% 6.46/0.76 -6.46/0.76 2.00-1.65 39% - 30% 6.46/0.76 -
6.46/0.76
NW 1.4 / 1.2 25% 5.91 / 0.75 1.44/0.77-1.6/1.22 27% - 30% 6.46/0.76 -
6.46/0.76 1.47-1.60 29% - 29% 6.46/0.76 -3.98/0.63
W 1.6 / 1.2 28% 5.91 / 0.75 1.44/0.94-1.6/1.22 33% - 30% 3.98/0.63 -
6.46/0.76 2.00-1.60 39% - 29% 2.53/0.62 -2.53/0.62
SW 1.7 / 1.2 29% 5.91 / 0.75 1.44/0.93-1.6/1.19 33% - 29% 3.08/0.67 -
6.46/0.76 1.40-1.60 28% - 29% 2.53/0.62 -2.53/0.62
Moorabbin 6/62 N Max /
1.27 33% 3.08 / 0.67 1.45/0.93-1.6/0.97 33% - 24% 3.98/0.63 -
3.98/0.63 2.00-1.60 39% - 30% 4.54/0.64 -2.53/0.62
NW Max / 1.27 33% 3.08 / 0.67 1.45/0.95-
1.6/0.93 34% - 23% 3.08/0.67 -3.98/0.63 1.49-1.60 29% - 29% 3.98/0.63 -
2.04/0.63
W Max / 1.25 33% 3.08 / 0.67 1.45/0.92-
1.6/1.14 33% - 28% 2.53/0.62 -3.98/0.63 1.00-1.40 24% - 25% 2.53/0.62 -
2.04/0.63
SW Max / 1.25 33% 3.08 / 0.67 1.45/0.97-
1.6/0.93 34% - 23% 2.04/0.63 -3.67/0.63 1.72/0.91-1.60 31% - 29% 2.04/0.63 -
2.04/0.63 Canberra 7/24 N Max /
1.27 33% 2.53 / 0.62 1.45/1/03-Max/0.92 36% - 29% 3.67/0.63 -
3.67/0.63 2.00-1.65 39% - 30% 5.91/0.75 -2.04/0.63
NW Max / 1.27 33% 2.53 / 0.62 1.45/0.95-
Max/1.22 34% - 33% 3.08/0.67 -3.08/0.67 2.00-1.65 39% - 30% 2.53/0.62 -
2.04/0.63
W Max / 1.27 33% 2.53 / 0.62 1.45/0.95-
Max/1.09 34% - 29% 2.53/0.62 -3.08/0.67
Max/1.36-1.54/1.65 53% - 44% 1.21/0.45 -
1.21/0.45
SW Max / 1.27 33% 2.53 / 0.62 1.45/0.95-
Max/1.01 34% - 27% 2.04/0.63 -3.08/0.67
#/2.00-1.69/1.19 20% - 34% 2.04/0.63 -
2.04/0.63 Hobart 7/26 N Max /
1.27 33% 2.53 / 0.62 1.45/1/03-Max/0.92 36% - 29% 3.67/0.63 -
3.67/0.63 2.00-1.65 39% - 30% 5.91/0.75 -2.04/0.63
NW Max / 1.27 33% 2.53 / 0.62 1.45/0.95-
Max/1.22 34% - 33% 3.08/0.67 -3.08/0.67 2.00-1.65 39% - 30% 2.53/0.62 -
2.04/0.63
W Max / 1.27 33% 2.53 / 0.62 1.45/0.95-
Max/1.09 34% - 29% 2.53/0.62 -3.08/0.67
Max/1.36-1.54/1.65 53% - 44% 1.21/0.45 -
1.21/0.45
SW Max / 1.27 33% 2.53 / 0.62 1.45/0.95-
Max/1.01 34% - 27% 2.04/0.63 -3.08/0.67
#/2.00-1.69/1.19 20% - 34% 2.04/0.63 -
2.04/0.63
TABLE C1 - Glazing Sizes and Types - Standard Air Movement
35

Testing Proposed BCA2010 DTS with BERS Pro
HIGH AIR MOVEMENT House 1 House 8 House 12 Location BCA/ NatHERS Climate
Orien tation
Scale Factor Height/ Width
Glass/ Floor
Total U-value/SHGC
Scale Factor Height/Width Gnd - 1st
Glass/Floor Gnd - 1st
Total U-value /SHGC Gnd - 1st
Scale Factor Height/Width Gnd - 1st
Glass/Floor Gnd - 1st
Total U-value /SHGC Gnd - 1st
Darwin 1/1 N 1.4 / 1.2 25% 6.46 / 0.76
NW 1.4 / 1.2 25% 6.46 / 0.76
W 1.4 / 1.2 25% 6.46 / 0.76
SW 1.4 / 1.2 25% 6.46 / 0.76 Brisbane 2/10 N 1.5 / 1.0824% 4.54 / 0.64 1.04/1.16-
1.7/0.95 32% - 24% 6.46/0.76 -6.46/0.76 1.99-1.59 39% - 29% 6.46/0.76 -
6.46/0.76
NW 1.45 / 1.21 26% 4.54 / 0.64
W 1.8 / 1.3434% 4.54 / 0.64
SW Max / 1.42 37% 4.54 / 0.64
Longreach 3/3 N Max /
0.86 23% 3.67 / 0.63
NW Max/ 0.85 22% 3.67 / 0.63
W Max / 1.36 25% 3.67 / 0.63
SW Max / 1.02 27% 3.67 / 0.63
Wagga Wagga 4/20 N Max /
1.26 33% 2.53 / 0.62
NW Max / 1.25 33% 2.53 / 0.62
W Max / 1.39 36% 2.53 / 0.62
SW Max / 1.36 35% 2.53 / 0.62
Perth 5/13 N 1.7 / 1.3232% 5.91 / 0.75 1.44/1.28-1.6/1.33 45% - 32% 6.46/0.76 -
6.46/0.76 2.05- 1.66 40% - 30% 6.46/0.76 -6.46/0.76
NW 1.4 / 1.3328% 5.91 / 0.75
W 1.6 / 1.3431% 5.91 / 0.75
SW 1.7 / 1.3533% 5.91 / 0.75 Adelaide 5/16 N 1.7 / 1.3232% 5.91 / 0.75
NW 1.4 / 1.3328% 5.91 / 0.75
W 1.6 / 1.3431% 5.91 / 0.75
SW 1.7 / 1.3533% 5.91 / 0.75 Moorabbin 6/62 N Max /
1.62 42% 3.08 / 0.67
NW Max / 1.42 37% 3.08 / 0.67
W Max / 1.39 36% 3.08 / 0.67
SW Max / 1.39 36% 3.08 / 0.67
Canberra 7/24 N Max / 1.7 43% 2.53 / 0.62
NW Max / 1.7 43% 2.53 / 0.62
W Max / 1.7 43% 2.53 / 0.62
SW Max / 1.7 43% 2.53 / 0.62
Hobart 7/26 N Max / 1.7 43% 2.53 / 0.62
NW Max / 1.7 43% 2.53 / 0.62
W Max / 1.7 43% 2.53 / 0.62
SW Max / 1.7 43% 2.53 / 0.62
TABLE C2 - Glazing Sizes and Types - High Air Movement
36

Testing Proposed BCA2010 DTS with BERS Pro
APPENDIX DSIMULATION RESULTS
Based on the glazing in Appendix C and the proposed BCA 2010 DTS insulation the buildings were simulated, resulting in the following Tables for Standard air movement and High air movement.
Tables D1 and D2 include area-adjusted Cooling Energy MJ/m² and Heating Energy MJ/m² and area-adjusted Star Ratings. To obtain the unadjusted cooling or heating energy divide the listed energy by the relevant area-adjustment factor listed in Table 4.
37

Testing Proposed BCA2010 DTS with BERS Pro
STANDARD AIR MOVEMENT House 1 House 8 House 12 Location BCA/ NatHERS Climate
Orien tation
Cooling MJ.m²
Heating MJ/m² Star Rating Cooling
MJ.m² Heating MJ/m² Star Rating Cooling
MJ.m² Heating MJ/m² Star Rating
Darwin 1/1 N 327 0 6.3 342 0 6.0 442 0 4.5
NW 325 0 6.4 344 0 6.0 443 0 4.5 W 327 0 6.3 344 0 6.0 452 0 4.4 SW 330 0 6.3 333 0 6.2 448 0 4.5
Brisbane 2/10 N 28 8 6.8 39 11 5.4 63 48 2.6 NW 29 8 6.6 36 13 5.4 43 37 3.6 W 32 11 6.0 36 13 5.5 54 32 3.4 SW 29 12 6.2 31 13 6.0 50 29 3.7
Longreach 3/3 N 112 1 6.8 116 3 6.7 264 20 3.2 NW 112 2 6.8 118 4 6.6 228 19 3.7 W 119 2 6.6 113 4 6.7 213 11 4.0 SW 125 2 6.4 109 5 6.8 204 11 4.2
Wagga Wagga 4/20 N 21 89 6.7 34 97 6.2 88 139 4.1
NW 25 92 6.5 34 100 6.1 75 124 4.6 W 30 96 6.3 35 104 5.9 66 107 5.1 SW 29 100 6.3 29 92 6.4 60 109 5.2
Perth 5/13 N 27 41 6.1 63 56 4.0 140 102 2.1
NW 28 41 6.1 58 57 4.1 123 92 2.4 W 33 40 5.9 56 53 4.2 124 67 2.7 SW 30 44 5.8 50 49 4.6 91 71 3.1
Adelaide 5/16 N 33 51 6.5 73 77 4.3 128 150 2.4 NW 32 49 6.6 67 74 4.6 115 134 2.8 W 38 51 6.3 64 69 4.8 113 106 3.1 SW 37 58 6.0 59 61 5.1 88 112 3.4
Moorabbin 6/62N 14 81 6.9 33 93 5.9 32 117 5.4 NW 19 84 6.6 30 91 6.1 44 110 5.2 W 17 90 6.5 30 89 6.2 32 100 5.8 SW 15 98 6.3 27 78 6.6 42 98 5.6
Canberra 7/24 N 18 106 6.9 69 119 5.5 74 135 5.0 NW 26 112 6.6 59 120 5.7 95 132 4.8 W 31 113 6.5 56 109 6.0 98 97 5.3 SW 24 121 6.5 50 106 6.2 52 111 6.0
Hobart 7/26 N 5 108 6.9 24 121 6.3 23 133 6.0
NW 6 113 6.9 20 117 6.3 26 125 6.0 W 8 116 6.8 17 109 6.7 21 94 6.9 SW 5 122 6.7 11 103 6.9 11 107 6.9
Table D1 - Results for Standard Air Movement
38

Testing Proposed BCA2010 DTS with BERS Pro
HIGH AIR MOVEMENT House 1 House 8 House 12 Location BCA/ NatHERS Climate
Orien tation
Cooling MJ.m²
Heating MJ/m² Star Rating Cooling
MJ.m² Heating MJ/m² Star Rating Cooling
MJ.m² Heating MJ/m² Star Rating
Darwin 1/1 N 293 0 6.9 NW 294 0 6.8 W 301 0 6.7 SW 303 0 6.7
Brisbane 2/10 N 17 9 7.8 33 12 5.8 46 50 3.0 NW 18 8 7.9 W 21 12 7.2 SW 19 14 7.2
Longreach 3/3 N 115 1 6.7 NW 115 2 6.7 W 123 2 6.4 SW 128 3 6.3
Wagga Wagga 4/20 N 23 90 6.7
NW 25 92 6.5 W 32 98 6.2 SW 29 102 6.2
Perth 5/13 N 27 42 6.0 70 58 3.8 122 103 2.2 NW 30 39 6.1 W 36 39 5.7 SW 33 44 5.6
Adelaide 5/16 N 35 56 6.2 NW 36 50 6.4 W 43 53 6.0 SW 42 61 5.8
Moorabbin 6/62 N 15 94 6.5
NW 16 93 6.5 W 14 95 6.5 SW 13 100 6.3
Canberra 7/24 N 19 122 6.5 NW 30 129 6.1 W 35 127 6.1 SW 28 134 6.1
Hobart 7/26 N 4 126 6.6 NW 6 131 6.5 W 7 130 6.4 SW 5 135 6.3
TABLE D2 Results for High Air Movement
39

Testing Proposed BCA2010 DTS with BERS Pro
APPENDIX E THE COOLING EFFECT OF CEILING FANS IN ACCURATE
There has been some academic discussion regarding the benefits of ceiling fans in warm climates. The current algorithm in AccuRate for ceiling fans is based on a simplification of research by Szokolay, S.V. and Hope, P.G. “Ceiling fans: their effect on energy ratings by the AccuRate program”, Stage 1 Report for the Australian Greenhouse Office, August 2005.
To include the benefit of ceiling fans in thermal simulations required answers to these questions: How much air is moved by fans?, and What is the effect of this airflow on physiological cooling?
The fan model of Szokolay and Hope concludes with horizontal radial airflow from an annulus at floor level with a circumference of twice fan diameter and 300mm high, with velocities of 0.50m/s, 0.66m/s and 0.77m/s for 900mm, 1200mm and 1400mm diameter ceiling fans. The “cooling effect” was 1.6K, 2.4K and 2.8K respectively. The “target area” was the floor area of a circle twice the fan diameter, or 2.56m², 4.52m² and 6.16m² respectively. The cooling benefit which was added to the cooling thermostat setting in the AccuRate software was the “cooling effect” multiplied by the ratio of the target area to the room area. For example, to obtain the maximum cooling benefit from 1200mm fans required four fans in an 18m² room - a highly impractical consequence of the model.
Compare this with BCA Explanatory Information Part 3.12.4.3 “...As a general rule a 900mm diameter fan will serve a floor area of 20m². However, this may vary depending on the various factors including the blade design, the ceiling clearance and the power of the fan.”
The AccuRate algorithm gave flexibility with the ratio of fan size to room size affecting the cooling benefit, but there were several shortcomings of the model lacking academic rigour.
The simplified algorithm avoided complicated coding into the AccuRate engine. It does not take into account the power or speed of the fans, the type of the fan blades, the efficiency of the fan, nor the effect of wind shear and local turbulence on the felt “cooling effect” of airflow across the skin. There was no allowance for the position of the occupants inside or outside the “target area” nor the presence of furniture which would increase the airflow around the remaining room area. There was no recognition of any vertical or swirling airflow component from the fan. The algorithm did not consider the temperature of the circulating air nor the relative humidity. All of these factors were important if not critical to the physiological cooling effect and therefore the calculated benefit of ceiling fans.
Whilst these questions remain unanswered, undue simplification of the calculation was likely to bias results against the use of ceiling fans, which have been widely recognised experientially as being beneficial, if not necessary, in warmer climates. Inadequate recognition of the benefit of ceiling fans in thermal simulations may lead to unnecessary building over-design and cost of construction, with increasing air-conditioning use where fans were not installed and should have been installed. In warm climates ceiling fans were a suitable replacement for air-conditioning for moderate temperatures (say 27°C to 30°C).
Amongst the other assumptions used in the AccuRate Engine relating to radiant temperatures, metabolic rate, clothing, internal heat loads and thermostat settings, the issue of ceiling fans may be best resolved with future research related to what clothing people “normally” wear in their homes from summer to winter. More skin exposed to airflow and lighter clothing would also increase the felt cooling effect of ceiling fans.
40