TESTING FOR COMPETITION IN THE SPANISH BANKING …
45
Luis Gutiérrez de Rozas TESTING FOR COMPETITION IN THE SPANISH BANKING INDUSTRY: THE PANZAR-ROSSE APPROACH REVISITED 2007 Documentos de Trabajo N.º 0726
Transcript of TESTING FOR COMPETITION IN THE SPANISH BANKING …

Luis Gutiérrez de Rozas
TESTING FOR COMPETITIONIN THE SPANISH BANKINGINDUSTRY: THE PANZAR-ROSSE APPROACH REVISITED
2007
Documentos de Trabajo N.º 0726

TESTING FOR COMPETITION IN THE SPANISH BANKING INDUSTRY:
THE PANZAR-ROSSE APPROACH REVISITED

TESTING FOR COMPETITION IN THE SPANISH BANKING INDUSTRY:
THE PANZAR-ROSSE APPROACH REVISITED (*)
Luis Gutiérrez de Rozas (**)
COMISIÓN NACIONAL DE ENERGÍA
(*) This paper is the sole responsibility of the author and, therefore, the views presented herein do not necessarily reflectthose of the Banco de España or the National Energy Commission. The author wishes to thank Jesús Saurina andVicente Salas-Fumás for their valuable comments and suggestions as well as his former colleagues at the FinancialStability Department of the Banco de España for their advice and support. Helpful comments by an anonymous refereeand the editor, Enrique Alberola, are also gratefully acknowledged.
(**) Address for correspondence: Luis Gutiérrez de Rozas; Alcalá 47, 28014 Madrid, Spain. Tel: +34 91 787 9893;e-mail: [email protected].
Documentos de Trabajo. N.º 0726
2007

The Working Paper Series seeks to disseminate original research in economics and finance. All papers have been anonymously refereed. By publishing these papers, the Banco de España aims to contribute to economic analysis and, in particular, to knowledge of the Spanish economy and its international environment. The opinions and analyses in the Working Paper Series are the responsibility of the authors and, therefore, do not necessarily coincide with those of the Banco de España or the Eurosystem. The Banco de España disseminates its main reports and most of its publications via the INTERNET at the following website: http://www.bde.es. Reproduction for educational and non-commercial purposes is permitted provided that the source is acknowledged. © BANCO DE ESPAÑA, Madrid, 2007 ISSN: 0213-2710 (print) ISSN: 1579-8666 (on line) Depósito legal: M.37196-2007 Unidad de Publicaciones, Banco de España
Abstract
The aim of this paper is to assess the level of competition prevailing in the Spanish banking
system. The current analysis employs a widely used non-structural methodology put forward
by Panzar and Rosse (1987) —the so-called H-statistic— and draws upon a comprehensive
panel dataset of Spanish commercial and savings banks covering the period 1986-2005.
Standard estimates characterize a hump-shaped profile for the H-statistic throughout the
time span under consideration. Nevertheless, a weighted procedure is subsequently
performed in order to control for firm size and the number of branches. The estimation
outcome reveals a gradual rising path for the H-statistic, thus suggesting a more competitive
environment among larger banks. In both settings, a noteworthy increase in the degree of
competition is identified at the turn of the eighties, when several liberalization-oriented policy
measures came into force. The aforementioned findings discredit the widespread hypothesis
which states that concentration impairs competition.
JEL Classification: G21; L13; L10.
Keywords: Banking; Competition; Panzar-Rosse; Market Structure.

BANCO DE ESPAÑA 9 DOCUMENTO DE TRABAJO N.º 0726
1 Introduction
Competition has become a recurrent topic in the banking literature. Specifically, during the
last decade a great deal of empirical work has attempted to measure the level of competition
prevailing in European banking markets. The beginning of the third stage of the Economic
and Monetary Union, in January 1999, and the projected changeover to the euro triggered
the interest of researchers in this issue. The initial purpose was to explore the impact of
European policy actions aimed to create a level-playing-field in the provision of financial
services. The transformation of the European Union's financial landscape was expected
to unleash competitive forces in the banking industry, boost the scope of desintermediation
and securitisation, foster cross-border capital flows and prompt the restructuring and
consolidation processes.
Another stimulus which made researchers draw attention on this issue stems
from industrial organization (IO) theory. In particular, the conventional view which holds that
increasing concentration may lead to undesirable exercise of market power, i.e. that
concentration impairs competition, has been subject to an enormous amount of controversy.
The IO theory on competition is usually divided into two major streams, namely the structural
and non-structural approaches1. The former embraces the structure-conduct-performance
(SCP) paradigm and the efficiency hypothesis (EH).
The SCP, originally due to Bain (1951), investigates whether high levels of market
concentration result in collusive behavior and other non-competitive practices among larger
firms. The simplest procedure to test the SCP paradigm consists in regressing a measure of
the firms' profitability on a proxy for market concentration. A positive coefficient is expected to
arise in order to validate this hypothesis as it would imply that higher concentration goes hand
in hand with higher market power.
On the other hand, the EH, which stems from Demsetz (1973) and Peltzman (1977),
states that efficient firms increase in size and, therefore, in market share due to their ability to
generate higher profits, leading to higher market concentration. Under the EH there is no
direct relationship between competition and concentration, and a highly concentrated sector
is the logical outcome of market forces.
The banking literature has now advanced well past this simple approaches. In
reaction to the theoretical and empirical shortcomings attributed to the structural stream,
namely the recognition of the need to endogenize market structure, three non-structural
models of competitive behavior have been developed within the emerging New Empirical
Industrial Organization (NEIO) framework. These models, which measure competition and
emphasize the analysis of the competitive conduct of firms without using explicit information
about the structure of the market, belong to Iwata (1974), Bresnahan (1982) and Lau (1982),
and Panzar and Rosse (1987). These models have an important feature in common, they
measure competition by estimating deviation from competitive pricing.
The Iwata model consists in the estimation of conjectural variation values
for individual firms supplying an homogeneous product in an oligopolistic market.
1. Interested readers should refer to Bikker (2004).

BANCO DE ESPAÑA 10 DOCUMENTO DE TRABAJO N.º 0726
The Bresnahan-Lau model comes down to the estimation of a simultaneous equation system
where a parameter representing the degree of market power of firms is included. Both the
Iwata and the Bresnahan-Lau models have scarcely been applied for empirical purposes.
For instance, the Iwata measure has only been applied once to banking by Shaffer and
DiSalvo (1994). Their main drawback relies on their data-intensiveness.
By contrast, the third approach has received widespread acceptance by the
academic community. The Panzar-Rosse model builds a competition indicator, the so-called
H-statistic, which provides a quantitative assessment of the competitive nature of a market.
The H-statistic is calculated from reduced-form revenue equations and measures the
elasticity of total revenues with respect to changes in factor input prices. Panzar and Rosse
showed that, under certain assumptions, the comparative static properties of this type of
equations provide a proxy for the overall level of competition prevailing in the market.
Last, but not least, other reasons underlying the awakening of competition analyses
in banking economics have to do with the safety and soundness of financial systems, as an
adequate degree of competition and concentration is supposed to safeguard financial
stability. Indeed, it has become a matter of prime interest among central bank regulators and
supervisors, who are in need of devices for monitoring the evolution of banking competition.
Despite the great number of investigations devoted to the topic, it should be
underlined that evidence is still rather mixed. The bulk of empirical studies report the
existence of monopolistic competition for every single country under consideration (including
Spain), albeit to varying degrees. In this context, the main purpose of this article is to
contribute to the ongoing debate over this issue and to cast some light on the Spanish case
by means of the Panzar-Rosse approach.
The current paper draws upon a comprehensive bank-level dataset of Spanish
depositary institutions covering an extensive twenty-year-long period (from 1986 to 2005).
Two different econometric techniques are performed in order to exploit both the
cross-sectional and time-series dimensions of the panel data, and, thus, ensure a robust
assessment of the overall level of competition prevailing in the Spanish banking industry.
Standard estimates reveal a hump-shaped profile for the H-statistic, within the upper
monopolistic competition range. Subsequently, the analysis is sharpened with a weighted
procedure which accounts for differences in firm size and the number of branches.
A reinforced level of increasing competition is the main finding within this setting.
The remainder of this paper is structured as follows. Section 2 discusses several
views on the production process of banking firms in order to set the stage for the theoretical
framework of the Panzar-Rosse approach, which is described in Section 3. A brief survey of
the literature on this particular methodology is presented in Section 4. Section 5 provides
an overview of the dataset. The empirical model employed in the analysis is presented in
Section 6. Afterwards, estimation results are reported in Section 7. The final section offers
a brief summary and outlines some competition policy implications.

BANCO DE ESPAÑA 11 DOCUMENTO DE TRABAJO N.º 0726
2 A Primer in the Theory of Banks' Activities
Before entering the analysis of the methodology put forward by Panzar and Rosse it is worth
devoting a couple of pages to review the different approaches of banks' activities which have
been developed within the industrial organization framework. Indeed, several assumptions
about banks' production activities have to be made in order to transfer the NEIO approaches
from classical industries to banking sectors, since the latter are only to a limited extent
comparable to other kind of firms.
Even though several attempts have intended to model the role played by banks as
economic and production units of the economy, the lack of agreement concerning the
appropriate delineation of output and inputs for banking firms has a long history and still
remains as a controversial issue that plagues all bank studies. Briefly, the vast literature
carried out in this field may be divided, according to Colwell and Davis (1992), into two
separate branches: the production approach (PA) and the intermediation approach (IA). Both
approaches apply the classical microeconomic theory of the firm, but differ in the specification
of banks' activities.
The PA, set forth by Benston (1965) and Bell and Murphy (1968), posits that banks
are devoted to the production of services to depositors and borrowers using labor and
physical capital as factor inputs. This approach explicitly recognizes the multiproduct nature
of banking firms.
A challenging point of view comes from the IA, as it holds that deposits and loans
have different characteristics. While the former are presented as divisible, liquid, short-term
and riskless assets, the latter are described as being indivisible, illiquid, long-term and risky.
Besides, the total amount of loans granted by a certain bank may not equal the total amount
of deposits collected, as it can adjust its surplus or deficit of funds at the interbank market.
For these reasons, and in order to highlight the transformation activity carried out by banks,
the IA posits that banks produce loans using labor, physical capital and financial capital
(deposits plus funds borrowed in the financial markets) as inputs.
Several tests addressing whether deposits are best characterized as outputs or
inputs have been posed. For instance, Hancock (1991) provides an interesting study based
on the 'user cost methodology'. This author regresses banks' profits on the real balances of
banks' balance sheet items2. Those balance sheet items exhibiting positive coefficients are
asummed to correspond to outputs, whereas variables reporting negative coefficients
are associated with inputs. Hancock's inquiry reveals that both loans and deposits deserve
the consideration of outputs. Thus, her findings are in line with the production approach.
Nonetheless, Hughes and Mester (1993) developed another test consisting in
the estimation of a variable cost function with fixed levels of deposits. They find that the
derivatives of this function are negative, which they interpret to mean that deposits
are inputs, as an increase in the level of one input, ceteris paribus, ought to be linked to
a reduction in the amount of money spent on other inputs. In a more recent study,
2. It should be noted, as in Freixas and Rochet (1997), that contrary to non-financial firms, whose input and output data
are obtained from their profit and loss accounts, the input and output volumes of banks are obtained from their balance
sheet statements.

BANCO DE ESPAÑA 12 DOCUMENTO DE TRABAJO N.º 0726
Hughes, Mester and Moon (2001) extend this analysis and draw the conclusion that
uninsured and insured deposits alike are to be categorized as inputs3. Therefore, their results
are consistent with the intermediation approach.
Noteworthingly, a previous study by Sealey and Lindley (1977) offers a reconcilable
view of both approaches. These authors, who were among the first to model the technical
and economic features of banks' production functions, consider deposits as an intermediate
output, supplied by means of several services offered to depositors, and later used in the
issuance of loans. Thus, a remarkable feature of banking institutions stems from the fact
that a substantial part of their costs relates with the provision of services as partial payment
for an input (loanable funds). The cost of 'attracting' this input comprises implicit resource
costs, i.e. labor, capital and material inputs involved in this activity.
As a result of the preceeding analysis, the production process of the banking firm is
amenable to suit the stylized scheme presented in Figure I. The multistage production
process comprehends three basic inputs —labor, financial capital and physical capital— and
one intermediate output —deposits— which also exhibits the characteristics of an input as it
is deployed to produce the final output —loans—.
Figure I. The multistage production process of the banking firm
according to Sealey and Lindley (1977)
LABOR
FINANCIAL CAPITAL
PHYSICAL CAPITAL
BASIC INPUTS
DEPOSITS
LOANS
OUTPUT
INTERMEDIATE OUTPUT
FINAL OUTPUT
INPUTS
LABOR
FINANCIAL CAPITAL
PHYSICAL CAPITAL
BASIC INPUTS
DEPOSITS
LOANS
OUTPUT
INTERMEDIATE OUTPUT
FINAL OUTPUT
INPUTS
It is worth emphasizing that only the 'intermediate' view related above is consistent
with both the empirical evidence and the neoclassical theory of the firm underlying the
Panzar-Rosse methodology. As the following subsection will review, it was originally designed
for quantifying the level of competition in homogenous single-output industries.
3. This view is additionally supported by the rising importance of interbank deposits which certainly do not meet the
characteristics of final outputs [Hempell (2002)].

BANCO DE ESPAÑA 13 DOCUMENTO DE TRABAJO N.º 0726
3 Theoretical Framework of The Panzar-Rosse Approach
John C. Panzar and James N. Rosse (P-R hereinafter) developed an empirical test
to discriminate between oligopolistic, monopolistically competitive and perfectly competitive
markets. Their procedure, which is based on the comparative static properties of
reduced-form revenue equations, accomplishes a concise indicator, the so-called H-statistic.
Under certain restrictive assumptions, it can be interpreted as a continuous and increasing
measure of the overall level of competition prevailing in a particular market.
The methodology put forward by Panzar and Rosse (1987) stems from a general
equilibrium market model. It relies heavily on the premise that firms will employ different
pricing strategies in response to changes in factor input prices depending on the competitive
behavior of market participants. In other words, competition is measured by the extent to
which changes in input prices are reflected in firms' equilibrium revenues4.
Following Bikker and Haaf (2002), let’s consider a representative bank i. The twofold
profit optimization condition applies at the industry and firm levels. At the former level, the
zero profit constraint must hold5:
( ) ( )Ciiii
Riii ZWyCZyR ,,, ** =
(1)
where ( )iR ⋅ and ( )⋅iC refer to the revenue and cost functions of bank i, iy is the output of
the firm, iW is a K-dimensional vector of factor input prices of bank i, ( )Kiii w,...,wW 1= , RiZ is
a vector of J exogenous variables affecting the revenue function ( )RJi
Ri
Ri z,...,zZ 1= and C
iZ is a
vector of L exogenous variables that shift the cost function ( )CLi
Ci
Ci z,...,zZ 1= .
At the individual level, marginal revenues must equal marginal costs:
( ) ( )Ciiii
Riii ZWyCZyR ,,, *'*' =
(2)
The measure of competition formulated by P-R, the H-statistic, evaluates the
elasticity of total revenues with respect to changes in factor input prices:
∑=
⎟⎟⎠
⎞⎜⎜⎝
⎛⋅
∂∂
=K
k i
ki
ki
i
Rw
wRH
1*
*
(3)
4. By the way, Panzar and Rosse developed this methodology in 1977 during the course of an empirical study of
the American daily newspaper industry. Ever since, their methodology has been applied to several sectors ranging from
banking systems to airline industries.
5. Variables marked with an asterisk represent equilibrium values.

BANCO DE ESPAÑA 14 DOCUMENTO DE TRABAJO N.º 0726
The empirical application of the P-R approach usually assumes log-linearity in the
specifications of the marginal revenue and cost functions6:
( ) ( ) ( )∑=
++=J
j
Rjijii zLndyLnaaRLn
110
'
(4)
( ) ( ) ( ) ( )∑∑==
+++=L
l
Clij
K
kkikii zLnvwLnbyLnccCLn
1110
'
(5)
For a profit-maximizing bank the equilibrium output results from (2):
( ) ( ) ( ) ( ) ( )∑∑∑===
+++=++L
l
Clil
K
kkik
J
ji
Rjiji zLnvwLnbyLncczLndyLnaa
111
*10
*10
(6)
Rearranging terms:
( ) ( ) ( ) ( ) ( )⎟⎟⎠
⎞⎜⎜⎝
⎛−++−⋅
−= ∑ ∑ ∑
= = =
K
k
L
l
J
j
Rjij
Clilkiki zLndzLnvwLnbac
cayLn
1 1 100
11
* 1
(7)
The reduced-form equation for revenues of the representative bank is given by the
product of the equilibrium output of bank i and the common price level:
( ) ( )***ii ypLnRLn =
(8)
The price level is provided by the inverse demand equation, which also reads in
logarithms:
( ) )(YLnpLn λµ += (9)
where
∑=
=I
iiyY
1 (10)
is the aggregate output of the industry.
After a bit of algebra, the reduced-form revenue equation is achieved:
( ) ( ) ( )∑∑==
++=Q
qqiq
K
kkiki zLnwLnRLn
11
* δβα (11)
where iZ is a vector of Q bank-specific variables, without explicit reference to their origin
from the cost or revenue functions7, ( )Qiii z,...,zZ 1= .
6. Ln denotes the natural logarithm. For estimation purposes, the log-specification is intended to avoid
heteroskedasticity.

BANCO DE ESPAÑA 15 DOCUMENTO DE TRABAJO N.º 0726
Hence, the H-statistic is calculated as follows:
∑=
=K
kkH
1β
(12)
The H-statistic abridges in a single figure the overall level of competition prevailing in
the market under consideration. According to P-R, the H-statistic ranges from minus infinity
to unity (Figure II). A negative H arises when the competitive structure is a monopoly or a
perfect colluding oligopoly. In both cases, an increase in input prices will translate into higher
marginal costs, a reduction of equilibrium output and, subsequently, a fall in total revenues8.
If H lies between zero and unity, the market structure is characterized by monopolistic
competition. Under perfect competition the H-statistic equals to unity. In this particular
situation, a proportional increase in factor input prices induces an equiproportional change in
revenues without distorting the optimal output of any individual firm.
Contestable markets would also generate an H-statistic equal to unity. The
contestability theory, first stated by Baumol, Panzar and Willig (1982), enables the existence
of competition in highly concentrated scenarios9 under very restrictive circumstances,
basically free entry and exit of market participants, i.e. neither economic nor legal
entry barriers, completely costless exit, and highly price-elastic demands for industry's output.
On account of these features, the threat of potential new market participants forces larger
firms to price their output in a competitive manner.
Figure II. Interpretation of the H-statistic
1
0
H
…Monopoly equilibrium
Perfect colluding oligopoly
Monopolistic competition
Perfect competition
Oligopoly in a contestable market1
0
H
…Monopoly equilibrium
Perfect colluding oligopoly
Monopolistic competition
Perfect competition
Oligopoly in a contestable market
Since P-R is a static approach, a critical feature of the empirical implementation is
that the test must be undertaken on observations that are in long-run equilibrium. In previous
studies, testing for long-run equilibrium involves the computation of the H-statistic in
a reduced-form equation of profitability, using a measure such as ROE or ROA in place of
revenues as dependent variable. The resulting H is supposed to be significantly equal
to zero in equilibrium, and significantly negative in case of disequilibrium. This empirical test
has traditionally been justified on the grounds that competitive markets will equalize
7. In practice, both functions are affected by a common set of variables. It is hard to make a distinction between them.
8. One limitation of the approach that should be noted concerns the increasing relationship between H and competition,
which may not hold in certain other oligopoly equilibria. In fact, as De Bandt and Davis (2000) point out, P-R is somehow
a joint test of underlying theory and competitive behavior.
9. Conversely, less concentrated environments could engender collusive practices.

BANCO DE ESPAÑA 16 DOCUMENTO DE TRABAJO N.º 0726
risk-adjusted rates of return across firms such that, in equilibrium, rates of return should
not be correlated statistically with factor input prices. However, the fact that we observe
market entry and exit might question the existence of an overall equilibrium in the market
under investigation10.
Another crucial assumption, on which the previous section elaborates, is that
the P-R test only applies for single-output firms. Consequently, banks must be treated as
producers of intermediation services by means of factor inputs such as labor, physical capital
and financial capital. In other words, the entire scope of activities is needed in order to
estimate the level of competition within the sector. However, even if the previous assumption
is ignored, the analysis of separate segments of the market is hampered by accounting
standards, since data are not detailed enough to estimate the appropriate reduced-form
revenue equations. At last, other requirements inherent to the P-R approach relate to the cost
structure, which must be homogeneous, and the price elasticity of demand, which must be
greater than unity.
Some authors claim that one of the advantages of the P-R model, as well as other
non-structural models, is that there is no need to specify a relevant market, since
the behavior of individual firms provides an indication of their market power11. This rationale
could be misleading as the selection of firms included in the sample is implicitly revealing
a geographical market. Conventionally, existing studies —and the current analysis is no
exception— locate the relevant market within national boundaries12.
Overall, the P-R model is regarded as a valuable tool for assessing market
conditions. Since banks' revenues are more likely to be observable than output prices
and quantities or actual costs, data availability becomes much less of a constraint and helps
to explain why this model has been more successfully applied than the Iwata or the
Bresnahan-Lau models. Indeed, such information is recorded in public accounting statements
and readily available through several data sources.
10. The assumption of long-run equilibrium should be considered as the most problematic within this approach. Indeed,
a number of authors impose that banks have reached this steady state.
11. The relevant market is theoretically defined by the largest set of suppliers of a particular product or service, including
actual and potential competitors [Bikker (2004)].
12. In the Spanish case, it appears to be a sensible assumption due to the widespread establishment of large
and medium-sized banks throughout the territory, and the scarce presence of foreign credit institutions [Gutiérrez de
Rozas (2006)].

BANCO DE ESPAÑA 17 DOCUMENTO DE TRABAJO N.º 0726
4 Literature Review
This subsection is intended to provide a brief summary of the articles that have applied the
P-R methodology to Spain, either in cross-country studies or Spain-only studies (see Table I).
As mentioned in the introduction, recent changes in the European banking industry have
fueled a large literature on banking competition and concentration.
The first study of European markets13 is due to Lloyd-Williams, Molyneux and
Thornton (1994), who carried out the P-R methodology on a sample of French, German,
Italian, Spanish and UK banks for the period 1986-1989. Their results point towards an
intermediate level of monopolistic competition in the Spanish case.
A few years later, Bikker and Groeneveld (2000) focused on a sample of European
countries between 1989 and 1996. They hardly found evidence of increasing competition
during this period. A novelty put forward by these authors is the attachment of different
weights to banks included in the sample. These weights are computed as the share of
individual banks in the total volume of assets of the banking system. In this case, H-statistics
are higher than those resulting from the unweighted model.
In the same vein, Bikker and Haaf (2002) extend the analysis to 23 OECD countries
over the period 1988-1998. For every single country, including Spain, results describe a
monopolistic competition environment. They posit the distinction between several bank sizes,
in order to capture different geographical markets. In particular, large, medium-sized and
small banks are supposed to operate in an international, national and regional dimension,
respectively. Competition appears to be stronger for large banks and weaker for small banks.
These results are fully consistent with those obtained in the contemporary work by De Bandt
and Davis (2000).
Both Bikker and Groeneveld (1998) and Bikker and Haaf (2002) account for possible
gradual changes in the market structure by introducing a logistic time curve model into the
original P-R setting. Once, the competitive behavior of the banking industry is identified,
their analyses focus on the relationship between competition and market structure. Their
purpose is to check the validity of the SCP paradigm. Results support the conventional view
that concentration impairs competition14.
Another influential study belongs to Claessens and Laeven (2004), who exploit
the broadest sample, by far, ever employed in a multi-country analysis of banking
competition. They compute the H-statistic for fifty developed and developing countries for the
period 1994-2001. According to their results, monopolistic competition is the best
description of the markets under consideration. Subsequently, they draw attention on the
13. It should be outlined that the earliest analyses applying the P-R approach to banking sectors were conducted
by Nathan and Neave (1989), who applied it to the Canadian financial system, and Lloyd-Williams, Molyneux and
Thornton (1991), who focused on the Japanese case. Northcott (2004) and Staikouras et al. (2006) provide excellent
and up-to-date surveys of worldwide studies devoted to this topic.
14. However, most cross-country studies circumvent a key characteristic of several banking industries. When focusing
on the relationship between competition and concentration, Herfindahl-Hirschman indexes are calculated on a national
basis, even though such geographical scope may not be indicative of the actual level of concentration prevailing in
regional or local markets. The German case is frequently used to highlight this feature. Germany exhibits an atomized
financial market with highly concentrated local markets (at a Länder level) but a scarcely concentrated national market
[Deutsche Bundesbank (2005)]. For Spain, there is no evidence of such disparities [Cebrián (1997)].

BANCO DE ESPAÑA 18 DOCUMENTO DE TRABAJO N.º 0726
factors underlying competition by regressing the estimated H-statistics on a number of
country-specific characteristics. These refer to the presence of foreign banks, activity
restrictions, entry regime, market structure, competition from the non-bank sector, general
macroeconomic conditions and overall development of the country. They do not come across
a straightforward relationship between competition and concentration, but find that fewer
entry and activity restrictions (i.e. higher contestability) result in more competition.
Weill (2004) measures banking competition for a sample of twelve EU countries over
the period 1994-1999. Annual Tobit-based estimates of the H-statistic depict a decreasing
pattern of monopolistic competition in Spain. In the second stage of the analysis, this author
explores the relationship between competition and efficiency. Efficiency scores, estimated
using a stochastic frontier approach, are regressed on the H-statistic and a set of explanatory
variables including macrofactors, an intermediation ratio and geographical dummies. His
results show a negative relationship between competition and efficiency.
An interesting comparison between the Spanish and UK banking systems is
conducted by Utrero-González (2004). Elaborating on the work by Bikker and Haaf (2002),
the purpose of the analysis is to identify competitive divergences due to the introduction of
the euro. Estimation results describe an overall scenario of monopolistic competition, in line
with previous studies. The main innovation of the paper is the distinction between commercial
banks and non-profit institutions. The former are reported to operate under conditions of
quasi-perfect competition, whereas the latter seem to operate in a less competitive
environment.
More recently, Casu and Girardone (2006) focus on a sample containing the former
EU-15 member countries. They extend the standard specification to account for bank
efficiency, calculated by means of a non-parametric DEA (Data Envelopment Analysis)
approach. They regress the H-statistic against several structural indicators and estimated
efficiency levels. The degree of concentration does not appear to be related to the level of
competition.
In an extensive paper, Staikouras et al. (2006) carry out the first multi-country
analysis for the EU following enlargement to 25 Member States, covering the 1998-2002
time-span. They find evidence of monopolistic competition with larger banks behaving more
competitively than smaller banks, and new members showing higher levels of competition
than former members. Complementarily, these authors try an atypical dependent variable
in the reduced-form revenue equation, namely organic income, which is defined as interest
revenue plus fee and commission income.
The first Spain-only study was undertaken by Maudos and Pérez (2003), who
focused on the period 1992-1999. Using a sample of commercial and savings banks, their
investigation leads to conclude that competition decreases during the period under
consideration (the full-sample estimation of the H-statistic is 0.71). They buttress their findings
with the calculation of Lerner indexes, used to proxy the level of market power exerted by
banks.
Last of all, Garrido (2004) assesses the degree of competition among Spanish
banks between 1994 and 2000 employing a wide variety of econometric techniques. In spite
of the instability of least squares estimates for separate years, results are in keeping with
monopolistic competition. Furthermore, during the last period under study the level of

BANCO DE ESPAÑA 19 DOCUMENTO DE TRABAJO N.º 0726
competition decreased, confirming conclusions reached by other authors. Following Maudos
and Pérez (2003) and Bikker and Haaf (2002), the level of competition is also measured
separately for commercial and savings banks, on the one hand, and for large, medium-sized
and small banks, on the other.
Summing up, this compilation of articles seems to provide ample evidence
supporting the hypothesis that monopolistic competition, albeit to varying degrees, is the
prevailing environment among Spanish banks. In fact, monopolistic competition is quite a
recurrent finding owing to the wide range of values the H-statistic can take within this
scenario (between zero and unity). This context enhances the importance of several
methodological issues concerning the empirical implementation of the P-R approach such as,
inter alia, data, estimation techniques and sample period under consideration.
Regarding data availability for banking studies, a few caveats are in order. The
aforementioned studies display two common features (see Table I). First, they all draw upon
samples obtained from commercial databases such as Bankscope (Bureau van Dijk) and
Fitch-IBCA Ltd, a London-based rating agency15. Since commercial data sources are biased
in favor of larger firms, the actual level of competition might be underestimated. Second,
these studies concentrate on five to eight year-long samples. Such coverage may turn out to
be unsatisfactory to disentangle the fundamentals underlying banks' behavior.
Two remarkable innovations of the current study are the use of a comprehensive
data source, and the consideration of a longer period of time. Obviously, the purpose is to
provide a reliable background for an accurate implementation of the P-R approach. The next
section summarizes the main characteristics of the data employed in the analysis.
15. With the exception of Maudos and Pérez (2003), who build a panel dataset with information gathered from annual
reports by AEB (Asociación Española de Banca) and CECA (Confederación Española de Cajas de Ahorros).

BANCO DE ESPAÑA 20 DOCUMENTO DE TRABAJO N.º 0726
5 Data
The main database employed in this study is the information contained in balance sheets,
income statements as well as complementary files, reported by depositary institutions to the
Spanish supervisory authority (Banco de España) over the period beginning in 1986 and
ending in 2005.
In compliance with accounting standards, Spanish banks are compelled to
enclose regular information about their activity and business structure. In particular, banks
report detailed information concerning the volume and composition of assets held in terms of
cash and balances, loans, debt securities, financial instruments, tangible/intangible assets,
as well as deposits, debt certificates and other financial instruments on the liabilities side.
With respect to the income statement (or profit and loss account), it embodies an appealing
number of entries related to interest income and expenses, fees and commissions, gains
and losses on financial assets and liabilities, as well as personnel, administrative and other
operating expenses. Regarding complementary files, these documents provide valuable
information about human resources and structural capacity of banking firms, in terms of staff
composition and number of branches, respectively.
Even though, Spanish data are available back in time for several years, due to
differing reporting schemes between commercial ('bancos') and savings banks ('cajas de
ahorros') 1986 was chosen to be the earliest observation date in the analysis16. The balance
sheets and income statements are reported on a monthly and quarterly basis, respectively.
For the sake of comparability, end-of-year aggregate figures from the balance sheet
(December) and the income statement (fourth quarter) have been taken so as to transform
accounting information into yearly data.
No cooperative banks ('cooperativas de crédito') are included in the sample due to
the lack of relevant data for the purpose of this study. In addition, Spanish cooperative banks
represent a small share of the financial market. Branches of foreign banks with limited
presence in the country are also excluded, specially in retail banking, to keep the units of
analysis as much homogeneous as possible. The total number of banks with usable
information starts with 184 in 1986 (of which 112 are commercial banks and 72 savings
banks) and ends with 122 in 2005 (76 and 46, respectively). The consolidation process
among Spanish banks explains the bulk of variation in the number of firms. Besides, just a
handful of firms are recorded to have started or ceased operating during the period under
consideration.
It should be stressed that the population of commercial and savings banks
considered in the paper represents the vast majority of the banking system (between 84
and 92% of aggregate assets corresponding to the credit institutions sector). Therefore, the
sample shall be regarded as fairly representative and comprehensive (Table II). As far as
this author is concerned, this is the most exhaustive data sample ever employed in the
implementation of the P-R methodology for the Spanish banking industry.
16. Ever since, all variables can be straightforwardly defined.

BANCO DE ESPAÑA 21 DOCUMENTO DE TRABAJO N.º 0726
First adjustments to these data were undertaken in a general consistency check,
excluding all observations where banks reported missing values. In a next step, the data
were adjusted for outliers. For each factor input price17, observations lying outside the 1-99th
percentile range were deleted from the sample. An additional number of observations
were dropped due to reporting errors in some regressing variables. Taken together, these
adjustments amount to a reduction of the original raw data by 289 out of 3,232 observations
(around 8.9%). Despite the above modifications, the absence of a selecting bias resulting
from the partial omission of small depositary institutions, as in commercial databases, is a big
advantage this study benefits of.
The dataset has also taken into account mergers and acquisitions (M&A, hereinafter).
In contrast with previous studies which circumvent this issue, each transaction is considered
to engender an entirely new institution, implying a separate registration in the dataset. The
purpose is to avoid structural breaks in the data, otherwise great deviations in the estimation
results are expected to arise, as the majority of M&A involved medium-sized and large banks.
Needless to say, the resulting panel is unbalanced since not all banks submitted
information throughout the entire time span. The choice for an unbalanced dataset entails the
advantage of permitting a greater number of observations to enter the estimations, however,
at the cost of including firms which presumably do not behave as they would typically do in
market equilibrium, because they are new entrants18, exiting or merged banks.
Before embarking upon the assessment of the level of competition prevailing in the
Spanish banking industry, a brief description of the market structure is in order. Several
commonly used indicators of concentration, namely CR1, CR3, CR5, CR10, as well as the
Herfindahl-Hirschman index (HHI) and the numbers-equivalent (NE) are reported in Table III.
CRn is the percentage market share of the n largest depositary institutions, ranked according
to assets, in the sum of the assets of all banks in a particular observation date. The HHI is
calculated as the sum of the squares of all depositary institutions’ market shares, according
to total assets. The NE translates the measure of concentration, as reported by the HHI, into
the number of equally-sized firms constituting the same level of concentration.
For illustrative purposes, Figure III depicts the CR5 and the level of market
share instability, measured by the instability index (II), over the period under consideration.
The instability index was devised by Hymer and Pashigan (1962) and it is formally defined as:
[ ]∑=
−−=N
ititit ssII
11,,
(13)
where t,is is the share of firm i at time t. The larger is the value of II, the more unstable is the
industry. Abrupt rises have traditionally been related to the presence of fierce competition,
regardless the degree of clustering19. According to the five-firm concentration we can
distinguish two stages, namely 1986-2000, characterized by a moderate pattern of increasing
17. As the next section will review, three input prices are considered, namely price of labor (PL), price of loanable funds
(PLF) and price of capital expenditure (PCE).
18. In particular, new entrants are supposed to behave more agressively (i.e. more competitively) in order to gain market
share and fulfil their short-term objectives.
19. Empirically, the index is not very sensitive to the exclusion of small companies. However, it should be recognized that
the treatment of M&A may overstate the actual level of instability. Anyway, since this criterium has been maintained
throughout the sample, the II should be regarded as a meaningful and consistent measure in relative terms.

BANCO DE ESPAÑA 22 DOCUMENTO DE TRABAJO N.º 0726
consolidation, and 2001-2005, which exhibits a slightly decreasing path. By contrast,
attending to the degree of instability up to four different stages can be recorded: 1987-1993
is a phase dominated by sudden changes, which slows down during 1994-1998. A peak of
instability is reached between 1999 and 200020 whereas a remarkable level of stability is
achieved during 2001-2005. Overall, the aforementioned patterns of concentration and
varying levels of market instability throughout the twenty-year-long sample period under
consideration provide a suitable background for the empirical analysis of banking competition.
20. A couple of M&A deals involving the two largest commercial banks took place in this period.

BANCO DE ESPAÑA 23 DOCUMENTO DE TRABAJO N.º 0726
6 The Empirical Model
Several specifications have been presented in the burgeoning literature devoted to the P-R
methodology. For empirical purposes, the following operationalization of equation (11) is
used21:
( ) ( ) ( ) ( ) ( )( ) ( ) ( ) itittittitt
ittittittitttit
uLDTLDLnLFTALnLOATALnEQTALnPCELnPLFLnPLLnNITALn
+++++++++=
432
1321
δδδδβββα
(14)
The dependent variable, NITA, is the ratio of Net Income to Total Assets. The set
of explanatory variables embraces three factor input prices, namely PL (Price of Labor),
PLF (Price of Loanable Funds) and PCE (Price of Capital Expenditure), as well as four
bank-specific variables: EQTA (EQuity to Total Assets), LOATA (LOAns to Total Assets),
LFTA (Loanable Funds to Total Assets) and the scale factor LDTLD, which represents the
individual market share according to loans and deposits. Finally, itu is the disturbance term.
The H-statistic at time t is given by the following expression:
ttttH 321 βββ ++= (15)
At this stage of the analysis, it is worth elaborating on the choice of the
aforementioned set of variables22, since former studies have employed a wide range of
explanatory indicators. Whereas traditional approaches in the literature have used either gross
interest or total income as dependent variable, the current exercise draws attention on net
total income alone. This concept comprises interest income, net brokerage fees and
commissions and net gains on financial assets and liabilities. The decision to consider total
revenue, rather than only interest revenue, relies mainly on the fact that non-interest income
has increased dramatically in recent years. This choice is supported, among others by Casu
and Girardone (2006), who argue that in a more competitive environment, the distinction
between interest and non-interest income becomes less relevant, as banks struggle for profits
in both fronts23. By the same token, the existence of accounting differences across years24 is
an additional argument in favor of a broader view of bank revenues [Staikouras et al. (2006)].
A number of authors employ unscaled revenues. The main drawback of this
procedure is the strong correlation (close to unity) between the dependent variable and
the scale factor, which would deliver non-significant coefficients for other explanatory
variables. In order to abstract from size effects and, thus, avoid distorted estimations, the
dependent variable is expressed as a ratio to total assets.
On the other hand, there seems to be common agreement on the inputs used by
banking firms, namely labor, loanable funds (comprising demand deposits and term deposits)
21. Subscripts i and t refer to bank i and year t.
22. Annex I contains a detailed description of each variable.
23. De Bandt and Davis (2000), using OECD data, estimated that non-interest income accounted for 20 to 40% of total
net income for a selected group of European banks between 1992 and 1996. These figures resulted from both an
increasing trend of the non-interest income –which stems from the reinforcement of non-core business areas such
as asset management, mutual funds and insurance– and the reduction of interest income.
24. For instance, three major changes in financial reporting standards happened in Spain during the time span under
consideration, namely in 1986, 1992 and 2005.
BANCO DE ESPAÑA 24 DOCUMENTO DE TRABAJO N.º 0726
and physical capital (fixed capital plus materials), which is in line with the production process
held by Sealey and Lindley (1977). A separate price is assigned to each.
Factor input prices are commonly proxied by ratios of expenses to respective
volumes. Concerning the price of labor, existing studies tend to use personnel expenses
divided by total assets, due to the scarce availability of employment data in commercial
databases. By contrast, in this study, PL is measured by the ratio of personnel expenses to
total number of employees. It should be highlighted that the latter definition aims to provide a
cleaner and more accurate measure of unit labor costs25.
The price of loanable funds, PLF, is obtained by dividing the sum of interest
expenses by the amount of loanable funds (which comprise deposits, tradable securities and
subordinated instruments) outstanding at the end of each year. This formulation provides a
broader measure of funding costs, in contrast with previous studies which usually restrict to
the interest paid per deposit unit. On the other hand, the price or unit cost of physical capital
(PCE) is conventionally calculated as the ratio of capital expenses (i.e. operating expenses,
taxes and amortization) to the stock of fixed assets.
Overall, the dependent variable and these three factor input prices show a strong
variability. Figure IV(a) displays a dispersion graph corresponding to NITA which is
characterized by a decreasing cyclical pattern. PL experiments a steady growth rate with
increasing volatility, which may reflect changes in the staff composition26 —Figure IV(b)—.
Noticeably, PLF shows a similar profile to NITA. In contrast with PL, the dispersion
of PLF (measured by the distance between the first and the third quartile)
has experienced a progressive reduction —Figure IV(c)—. Conversely, the price of capital
expenditure —Figure IV(d)— shows, in the last few observation dates, a particularly striking
spread.
Input prices are followed by a set of bank-specific factors which, basically, are
intended to catch differences in risk, business mix and size. Specifically, these control
variables account for risk propensity (captured by EQTA), variations in the relative weight
of the loan portfolio (which are mirrored in LOATA) and importance of deposits in the balance
sheet (LFTA). LDTLD is included to consider the possible impact of scale economies.
Last, TASS (Total ASSets) and BRANCH (number of BRANCHes), are other variables
designed to control for the firm size27.
Summary statistics of the aforementioned variables are presented in Table IV.
Regarding the set of bank-specific variables, mean values for LFTA remain fairly stable
throughout the sample period (around 87%), whereas LDTLD experiments a continuous
growth, ranging from 0.6 to 1%. Remarkably, average figures for EQTA and LOATA are quite
similar to those reported by Staikouras et al. (2006). However, it should be highlighted
that the mean volumes of total assets (TASS) are somewhat lower, which seemingly
reveals that their sample is biased towards larger banks. On average terms, the number of
branches increases dramatically during the time span under consideration.
25. The former is actually a relative weight of personnel expenses in the balance sheet.
26. Since the entire spectrum of employees is comprised in the computation of the labor price, rises in PL could spring
from a higher proportion of highly qualified workers.
27. As the next section will review, TASS and BRANCH are only used in the weighted version of the model.

BANCO DE ESPAÑA 25 DOCUMENTO DE TRABAJO N.º 0726
Finally, Table V contains the correlation matrix of all the variables involved in the
empirical analysis. As expected, the dependent variable exhibits a weak correlation with
the scale variables. Noticeably, low values are reported for PL and PCE in the first column
(NITA). These figures suggest the finding of close-to-zero and non-significant elasticities in the
next step of the analysis, which is devoted to the estimation of the econometric model
presented above.

BANCO DE ESPAÑA 26 DOCUMENTO DE TRABAJO N.º 0726
7 Estimation Results
The reduced-form revenue function stated in equation (14) is linear in its unknown parameters
and, therefore, amenable to estimation by standard methods. In order to exploit both
the cross-sectional and the time-series dimensions of the panel dataset, two different
least squares regression procedures have been performed. In particular, subsample and
full-sample estimates for the period 1986-2005 have been obtained by means of pooled
generalized least squares (PGLS) and pooled weighted least squares (PWLS).
Ordinary least squares is the simplest and most common estimation procedure
employed in the P-R literature. However, in order to offset the potential existence of
heteroskedasticity in the data, generalized least squares was considered a more appropriate
method to start with28. As in many other studies, the current dataset is not large enough to
attain robust annual estimates for the eight parameters in the model. Accordingly, the sample
period is divided in four lustrums: 1986-1990, 1991-1995, 1996-2000 and 2001-2005.
Table VI displays PGLS regression results. The dependent variable, NITA, appears to
be positevely related to the price of loanable funds (PLF). By contrast, the price of labor (PL)
and the price of capital expenditure (PCE) are negatively associated with the net income
variable, albeit to to a very limited extent. Regarding the coefficients of the remaining
explanatory variables, a negative sign for EQTA was expected to arise because lower
capital ratios are supposed to lead to higher bank revenues. However, estimation results
show positive values for this variable. Presumably, an explanatory hypothesis may state
that reinforced capital buffers encourage risk-taking. Hence, banks could be improving their
earning capacity through riskier loan portfolios. The reported positive coefficients for LOATA
seem plausible because more loans reflect more potential income. Last, evidence for
LFTA and the scale variable LDTLD is blurred by their non-significance.
Figure V(a) plots the H-statistics corresponding to the PGLS estimation outcome.
The first stage exhibits the lowest level (0.55), but rises substantially during the second
stage (0.70) and reaches it maximum during the third phase (0.79). Noteworthingly,
the H-statistic falls to an intermediate position (0.55) during the last stage. This result is
concurrent with the decline in the degree of concentration of the industry —Figure III—.
In accordance with these results, monopolistic competition (MC) is the proper assessment
for the Spanish banking market, since both the null hypotheses of H equal to zero (oligopoly)
and H equal to one (perfect competition) are rejected, at the 90% confidence level, in
each of the four subsamples under consideration. The full-period estimate of the H-statistic
stands at 0.78.
Several striking features of the estimation outcome should be highlighted. First, the
marked rise of the H-statistic between the first and second subsample periods is likely
to be explained by a handful of contemporary policy initiatives which, both at the European
and national levels, aimed to create a unified market for banking services. In particular, at the
28. By the way, several tests have previously been performed cross-sectionally in order to check out the validity of
the long-run equilibrium assumption. The dependent variable in equation (14) was ordinarily replaced by a proxy for the
return on equity (ROE), which was specifically designed for this purpose. For every single year, but two, the null
hypothesis cannot be rejected at the 95% confidence level. These equilibrium test results are available upon request to
the author.

BANCO DE ESPAÑA 27 DOCUMENTO DE TRABAJO N.º 0726
national level, legal restrictions on the geographical scope of savings banks were removed
in 1989. This development triggered the consolidation and outward expansion processes
among savings banks29, enhancing the level of integration of the Spanish banking market30.
Besides, at the European level, remaining constraints on the number of branches of foreign
banks in member countries were abrogated as a result of the Second Banking Co-ordination
Directive31 (enacted in 1992).
Second, among the constituent parts of the H-statistic only the price of loanable
funds contributes significantly to the explanation of the net income of banks. By contrast,
both the price of labor and the price of capital expenditure provide a deceiving outcome
due to their scarce correlation with the dependent variable.
Third, the dispersion of the price of loanable funds fell during the last years of
the sample —Figure IV(c)—. This fall is even more dramatic if we attend to the distance
between 1-99th percentiles32. The fact that this reduction is not entirely mirrored in the
volatility of the dependent variable —Figure IV(a)— is responsible for shrinking the elasticity
of this input and, hence, the value of the H-statistic corresponding to the fourth stage33.
Last but not least, the overall level of competition during the nineties is, in
comparison with former studies, relatively high and stable. Table IX gathers P-R results
for the Spanish banking industry (ES), as well as for Germany (DE), France (FR), Italy (IT),
United Kingdom (UK) and the United States (US). In most cases, an intermediate level
of monopolistic competition, with H-statistics varying from 0.3 to 0.6, is recorded for Spain.
Remarkably, Germany does also exhibit a similar range of values, whereas the US appears
to have slightly less competitive banks. Without exception, the PGLS estimates obtained
in this study stand well above the figures reported in the literature.
A number of authors discriminate between small, medium-sized and large banks34.
However, such distinction is not made in this analysis since, basically, all banks are presumed
to offer an homogeneous variety of financial products. An alternative approach, set forth by
Bikker and Groeneveld (2000), consists in estimating a model where banks are weighted
according to their size in terms of total assets. This approach is intuitively justified by the fact
that larger firms may be able to influence the pricing strategy of smaller market participants35.
Likewise, it seems sensible that in order to obtain a more representative and realistic
picture of the actual level of competition, those banks with a larger number of customers
29. Up to that date, savings banks were confined to the regional markets they belonged to.
30. Accordingly, the distinction between commercial and savings banks, which other authors posit, becomes
presumably irrelevant. Nevertheless, the main feature that remains to distinguish savings banks from other type of
financial institutions is their organizational form. Savings banks, which typically began as mutual funds, operate with a
significant level of state involvement. Despite being a challenging issue, whether its particular governance regime can
affect or not their competitive behavior is hardly analyzable under the P-R approach and is well beyond the scope of this
paper.
31. Salas-Fumás and Saurina (2003) and Fernández de Guevara, Maudos and Pérez (2005) provide concise overviews
of the liberalization-oriented policy measures which came into force during this period at the national and European
levels, respectively.
32. For the sake of presentation, Figure IV only depicts the first and third quartile range. Otherwise, the strong upward
biases these variables show would seriously distort the graphs.
33. This convergence in the price of loanable funds brings up an insight due to Shaffer (2004) which states that if
price-taking firms buy homogeneous inputs in a common set of markets, the data will lack any variation on account
of the so-called ‘absolute version of the law of one price’. Ultimately, no regressions can be run on such a sample.
34. For instance, Bikker and Haaf (2002) split up their worldwide sample according to the following criterium:
the smallest 50% firms constitute the small-bank sample, the largest 10% form the large-bank sample, and the
remainder 40% make up the medium-sized sample.
35. A detailed analysis of the price setting behavior of Spanish banks is provided in Martín-Oliver, Salas-Fumás and
Saurina (2007).

BANCO DE ESPAÑA 28 DOCUMENTO DE TRABAJO N.º 0726
(proxied by the total amount of assets) and an extensive nationwide presence (gauged by the
number of branches) ought to have a greater impact on the estimation outcome36.
Tables VII and VIII collect PWLS regression results. Employing TASS and BRANCH
as weighting variables, this estimation procedure37 turns out to improve the significance of the
explanatory variables (p-values are surpassingly lower). Besides, the elasticity of PLF and,
therefore, the H-statistic are somewhat higher than in the standard model. The evolution
of the H-statistic describes a different pattern from the unweighted setup. The H-statistic
does now evidence a remarkable staggered increase —Figures V(b) and V(c)—.
The entire time span PWLS estimates (0.95 and 1.00) may induce to think of the
existence of a more competitive environment among larger banks. This conjecture is in
keeping with Bikker and Groeneveld (2000), who point out that larger banks are relatively
more active in international wholesale markets, where competition is regarded to be more
fierce. By contrast, retail and corporate finance markets, where small and medium-sized
banks operate, are assumed to be less competitive.
An alternative explanation would consider instead that large banks are closer
to long-run equilibrium than smaller banks, which presumably embrace new arrivees
[Shaffer (2004)]. If that is the case, a greater value of the H-statistic does not reliably imply
that the former behave more competitively. However, since the long-run equilibrium condition
has been successfully verified for the entire sample of banks, this criticism does not apply.
Moreover, this encouraging finding, which deserves to be regarded as the foremost
contribution of the analysis, discredits the widespread hypothesis which states that large
banks are prone to perform non-competitively, as it would have led to a lower value of
the P-R indicator.
36. Besides, weighting can also be justified on econometric grounds. From an ‘asymptotic point of view', large banks
are expected to behave more 'normal' than smaller ones. Bikker and Groeneveld (2000) corroborate this argument
with the empirical finding of smaller disturbance terms for larger firms. Thus, weighted estimation appears to be more
efficient.
37. PWLS estimates have been computed by means of Stata's iweight (importance weight) option, which enables to
weight the set of observations according to any variable specifically designed for this purpose. In the current analysis
two scale factors –TASS and BRANCH– are used separately to carry out PWLS results. A shortcoming which goes hand
in hand with this procedure is related with the possible existence of heteroskedasticity in the data. Obviously, with
weighting procedures –and this one is no exception– there is no chance of using White's variance and covariance
matrix. However, the log-specification of equation (14) is intended to undermine this circumstance.

BANCO DE ESPAÑA 29 DOCUMENTO DE TRABAJO N.º 0726
8 Concluding Remarks
Banks play a prominent role in the allocation of economic resources. Furthermore, they exert
a fundamental influence on asset transformation, provision of liquidity insurance, access to
payment services, and thereby, are a key to economic growth and development. In this
context, the need for reliable analytical instruments devoted to the measurement of the level
of competition prevailing in banking markets appears to be broadly justified.
Nevertheless, the interest of researchers in this issue was not elicited until the recent
trend towards consolidation in the European banking industry. Ever since, the analysis of
competition has turned into a burgeoning field in banking economics. Despite the great
number of investigations which have focused on the Spanish case, mainly in multi-country
studies, evidence on the actual level of competition is rather mixed and still subject to debate.
In order to shed light on this topic, the current study attempts to carry out an
exhaustive analysis of the Spanish banking industry. In particular, it extends previous
studies to several respects. First, a substantially longer period of time, covering two decades
(1986-2005), is under consideration. Second, a comprehensive panel dataset of commercial
and savings banks has been constructed using the information these institutions report to the
Spanish supervisory authority (Banco de España).
The empirical analysis is grounded on a widespread non-structural approach due to
Panzar and Rosse (1987). Overall, the estimation outcome leads to conclude that the
prevailing level of competition is quite higher than reported in the literature, and in
the particular case of large banks it is really close to perfect competition. Second, there
is no apparent relationship between competition and market structure —in terms of
concentration and instability—.
The robustness of the results presented herein is challenged by a recent paper due
to Fernández de Guevara and Maudos (2006). These authors analyze the role of size,
efficiency, specialization and concentration, among other factors, in the explanation of market
power. Using as laboratory the Spanish banking system in a fairly similar sample period
(1986-2002), they estimate Lerner indexes to proxy the degree of market power. The two
major results of this piece of work have to do with an increasing pattern of market power
starting in the mid-1990s and the lack of significance of the level of concentration in
the explanation of this trend. Whether the former finding can be reconciled or not with the
evolution of competition described in the current analysis is quite a complex issue.
Nevertheless, it deserves a brief comment on an intuitive difference between the terms
'competition' and 'market power', since they are often used interchangeably. Market power
is, basically, an individual phenomenon which results from the behavioral pricing strategy of a
particular firm. By contrast, competition should be regarded as a collective phenomenon
stemming from the aggregate interaction of the set of market participants. Therefore, the
empirical relationship between them is not as straightforward as it may seem at first glance38.
38. Indeed, the Lerner index is an indicator of market power, not competition. It is based on prices and marginal costs,
and provides a separate figure for each of the firms in the industry. Conversely, the H-statistic is just an indicator of
competition, not market power. Based on the price elasticities of factor input prices in a reduced-form revenue equation,
it provides a single figure for the whole industry.

BANCO DE ESPAÑA 30 DOCUMENTO DE TRABAJO N.º 0726
Noteworthingly, the lack of significance of market concentration is concurrent with
the results achieved in this article. In a sense, as Claessens and Laeven (2004) claim, this
finding is consistent with the contestability theory. If carefully explored, the validity of
the contestability theory may deliver far-reaching policy implications. Up to date, worldwide
competition authorities draw upon merger guidelines based on indirect yardsticks such as
the Herfindahl-Hirschman index. These heuristic procedures are in keeping with out of fashion
structural approaches, within the classical IO theory, which posit that concentration impairs
competition. The fact that concentration ratios may not provide an appropriate criterium to
evaluate the actual impact of a certain deal, should be a matter of great concern39.
Moreover, competition policies should be subject to deep revision. A step in the right
direction would involve the use of NEIO indicators such as the H-statistic reviewed in this
article, which stands out for several advantages regarding data availability, the simplicity of
the estimation procedure and its clear interpretation. An additional argument which backs
up the P-R methodology as a valuable tool for competition monitoring relies on its flexibility to
account for characteristics specific to each sector. To date, few studies have outlined this
issue.
Finally, it is worth highlighting that the financial sector is only comparable to a limited
extent to other type of industries. As a matter of fact, there are conflicting views on
the desirable degree of competition in banking40. From a theoretical perspective, intense
competition is assumed to lower intermediation expenses and contribute to the improvement
of efficiency, at the cost of shortening the average duration of lending relationships and
eroding banks' profitability. Therefore, both the solvency and the ability of financial institutions
to withstand liquidity shocks could be seriously undermined. Remarkably, this trade-off
context enhances the role played by banking regulators, inasmuch as certain prudential tools
may turn out to provide a necessary buffer against adverse developments.
In order to sharpen our understanding of financial stability, forthcoming research
efforts ought to direct attention towards the common fundamentals underlying competition
and market structure in banking industries. At present, there is a deal of work that needs to
be done.
39. In fact, perfect competition could emerge in highly concentrated scenarios, and vice versa.
40. For a detailed discussion on the optimal level of competition in the banking sector, see Cetorelli (2001) and
Vives (2001).

BANCO DE ESPAÑA 31 DOCUMENTO DE TRABAJO N.º 0726
REFERENCES
BAIN, J. S. (1951). “Relation of profit rate to industry concentration: American manufacturing 1936-1940”, Quarterly
Journal of Economics, 65 (3), pp. 293-324.
BAUMOL, W. J., J. C. PANZAR and R. D. WILLIG (1982). Contestable markets and the theory of industry structure,
Harcourt Brace Jovanovich, San Diego, CA.
BELL, F. W., and N. B. MURPHY (1968). “Economies of scale and division of labor in commercial banking”, National
Banking Review, 5, pp. 131-139.
BENSTON, G. J. (1965). “Branch banking and economies of scale”, Journal of Finance, 20, pp. 312-331.
BERGER, A. N., A. DEMIRGÜÇ-KUNT, R. LEVINE and J. G. HAUBRICH (2004). “Bank concentration and competition:
An evolution in the making”, Journal of Money, Credit, and Banking, 36, pp. 433-451.
BIKKER, J. A. (2004). Competition and Efficiency in a Unified European Banking Market, Edward Elgar Publishing
Limited, UK.
BIKKER, J. A., and J. M. GROENEVELD (2000). “Competition and concentration in the EU banking industry”, Kredit und
Kapital, 33, pp. 62-98.
BIKKER, J. A., and K. HAAF (2002). “Competition, concentration and their relationship: An empirical analysis of the
banking industry”, Journal of Banking and Finance, 26, pp. 2191-2214.
BRESNAHAN, T. F. (1982). “The oligopoly solution concept is identified”, Economic Letters, 10, pp. 87-92.
CARBÓ, S., D. HUMPHREY, J. MAUDOS and P. MOLYNEUX (2006). “Cross-country comparisons of competition and
pricing in European banking”, UC-LSE Conference, Milan.
CASU, B., and C. GIRARDONE (2006). “Bank competition, concentration and efficiency in the Single European Market”,
The Manchester School, 74 (4), pp. 441-468.
CEBRIÁN, J. (1997). “Concentración del sistema bancario español en el periodo 1980-1995”, Boletín Económico, enero,
Banco de España, pp. 79-102.
CETORELLI, N. (2001). “Competition among banks: Good or bad?”, Federal Reserve Bank of Chicago, Economic
Perspectives, second quarter, pp. 38-48.
CLAESSENS, S., and L. LAEVEN (2004). “What drives bank competition? Some international evidence”, Journal of
Money, Credit, and Banking, 36 (3), pp. 563-583.
COLWELL, R. J., and P. DAVIS (1992). “Output and productivity in banking”, Scandinavian Journal of Economics, 94,
pp. 111-129.
DE BANDT, O., and P. DAVIS (2000). “Competition, contestability and market structure in European banking sectors on
the eve of EMU”, Journal of Banking and Finance, 24, pp. 1045-1066.
DEGRYSE, H., and S. ONGENA (2005). Competition and regulation in the banking sector: A review of the Empirical
Evidence on the sources of bank rents, CentER-Tilburg University Working Paper.
DEMSETZ, H. (1973). “Industry structure, market rivalry and public policy”, Journal of Law Economics, 16, pp. 1-10.
DEUTSCHE BUNDESBANK (2005). “Bank competition and the stability of the financial system”, Financial Stability
Review, november, pp. 101-116.
FERNÁNDEZ DE GUEVARA, J., and J. MAUDOS (2006). “Explanatory factors of market power in the banking system”,
The Manchester School, 75 (3), pp. 275-296.
FERNÁNDEZ DE GUEVARA, J., J. MAUDOS and F. PÉREZ (2005). “Market power in European banks”, Journal of
Financial Services Research 27 (2), pp. 109-137.
FREIXAS, X., and J. C. ROCHET (1997). Microeconomics of Banking, The MIT Press, Cambridge, MA.
GARRIDO, A. (2004). El grado de competencia en el sistema bancario español, Universitat de Barcelona Working Paper.
GILBERT, R. (1984). “Bank market structure and competition”, Journal of Money, Credit, and Banking, 16, pp. 617-660.
GUTIÉRREZ DE ROZAS, L. (2006). “La posición relativa de la banca española en el contexto europeo”, Estabilidad
Financiera, No. 10, Banco de España, pp. 99-126.
HANCOCK, D. (1991). A theory of production for the financial firm, Kluwer Academic Publishers, Norwell, MA.
HEMPELL, H. S. (2002). Testing for competition among German banks, Economic Research Centre, Deutsche
Bundesbank, Discussion Paper 04/02.
HUGHES, J. P., and L. J. MESTER (1993). “A quality and risk-adjusted cost function for banks: Evidence on the 'too-
big-to-fail' doctrine”, Journal of Productivity Analysis, 4, pp. 293-315.
HUGHES, J. P., L. J. MESTER and C. G. MOON (2001). “Are scale economies in banking elusive or illusive? Evidence
obtained by incorporating capital structure and risk-taking into models of bank production”, Journal of Banking and
Finance, 25, pp. 2169-2208.
HYMER, S., and P. PASHIGAN (1962). “Turnover of firms as a measure of market behavior”, Review of Economics and
Statistics, 44, pp. 82-87.
IWATA, G. (1974). “Measurement of conjectural variations in oligopoly”, Econometrica, 42, pp. 947-966.
LAU, L. J. (1982). “On identifying the degree of competitiveness from industry price and output data”, Economic Letters,
10, pp. 93-99.
LLOYD-WILLIAMS, D. M., P. MOLYNEUX and J. THORNTON (1991). Competition and contestability in the Japanese
commercial banking market, Institute of European Finance, Research Papers in Banking and Finance No. 16.
–– (1994). “Competitive conditions in European banking”, Journal of Banking and Finance, 18 (3), pp. 444-459.
MARTÍN-OLIVER, A., V. SALAS-FUMÁS and J. SAURINA (2007). “A test of the law of one price in retail banking”,
Journal of Money, Credit, and Banking, forthcoming.
MAUDOS, J., and F. PÉREZ (2003). “Competencia versus poder de mercado en la banca española, Moneda y Crédito,
217, pp. 139-166.

BANCO DE ESPAÑA 32 DOCUMENTO DE TRABAJO N.º 0726
NATHAN, A., and E. H. NEAVE (1989). “Competition and contestability in Canada’s financial system: Empirical results”,
Canadian Journal of Economics, 22 (3), pp. 576-594.
NORTHCOTT, C. A. (2004). Competition in banking: A review of the literature, Bank of Canada Working Paper 2004-24.
PANZAR, J. C., and J. N. ROSSE (1987). Testing for ‘monopoly’ equilibrium”, Journal of Industrial Economics, 25,
pp. 443-456.
PELTZMAN, S. (1977). “The gains and losses from industrial concentration”, Journal of Law and Economics, 20,
pp. 229-263.
ROSSE. J. N., and J. C. PANZAR (1977). Chamberlin vs Robinson: An empirical study for monopoly rents, Bell
Laboratories Economic Discussion Paper.
SALAS-FUMÁS, V., and J. SAURINA (2003). “Deregulation, market power and risk behaviour in Spanish Banks”,
European Economic Review, 47, pp. 1061-1075.
SEALEY, C. W. JR., and J. T. LINDLEY (1997). “Inputs, outputs and the theory of production and cost at depositary
financial institutions”, Journal of Finance, 32, pp. 1251-1266.
SHAFFER, S. (2004). “Comment on “What drives banking competition? Some international evidence”, by Stijn Claessens
and Luc Laeven, Journal of Money, Credit, and Banking, 36 (3), pp. 585-592.
SHAFFER, S., and J. DISALVO (1994). “Conduct in a banking duopoly”, Journal of Banking and Finance, 18 (6),
pp. 1063-1082.
STAIKOURAS, C., and A. KOUTSOMANOLI-FILLIPAKI (2006). “Competition and concentration in the new European
banking landscape”, European Financial Management, 12 (3), pp. 443-482.
TIROLE, J. (1988). The Theory of Industrial Organization, The MIT Press, Cambridge, MA.
UTRERO-GONZÁLEZ, N. (2004). “Banking competition in UK and Spain: Is there a Euro effect?”, FMA European
Conference, Zürich.
VIVES, X. (2001). “Competition in the changing world of banking”, Oxford Review of Economic Policy, 17 (4),
pp. 535-547.
WEILL, L. (2004). “On the relationship between competition and efficiency in the EU banking sector”, Kredit und Kapital,
37 (3), pp. 329-352.

BANCO DE ESPAÑA 33 DOCUMENTO DE TRABAJO N.º 0726
APPENDIX
Annex I. Definition of Variables
1. Dependent Variable
• NITA: Ratio of Net Income to Total Assets (%).
Net Income = Interest and Similar Income + Variable portfolio Income + Fee and
Commission Income + Gains on Financial Assets and liabilities - Brokerage Fee and
Commission Expenses - Losses on Financial Assets and Liabilities.
2. Explanatory Variables
2.1 Factor Input Prices
• PL: Price of Labor (Ratio of Personnel Expenses to Staff Number) (thousands of
Euros/employee).
• PLF: Price of Loanable Funds (Ratio of Interest Expenses to Loanable Funds) (%).
Interest Expenses (IE) = IE from Banco de España + IE from Credit Institutions + IE
from the Spanish General Government + IE from Other Resident Sectors + IE from
Non-resident Creditors + IE from Loans and Other Tradable Securities.
Loanable Funds (LF) = Deposits from Banco de España + Deposits from Credit
Institutions + Deposits from the Spanish General Government + Deposits from Other
Resident Sectors + Deposits from Other Non-resident Creditors + Loans and Other
Tradables Securities + Subordinated Instruments.
• PCE: Price of Capital Expenditure (Ratio of Capital Expenditure to Fixed Assets) (%).
Capital Expenditure = Operating Expenses + Contributions and Taxes + Fixed Assets
Amortization and Provisions.
2.2 Bank Specific Variables
2.2.1 RISK VARIABLE
• EQAS: Ratio of Equity to Total Assets (%).
Equity = - Issued Capital - Unregularized Loss + Special Funds + Capital or
Endowment Fund + Reserves + Net Profit (Loss).
2.2.2 BUSINESS-MIX VARIABLES
• LOATA: Ratio of Loans to Other Resident Sectors to Total Assets (%).
• LFTA: Ratio of Loanable Funds to Total Assets (%).
2.2.3 SCALE VARIABLES
• LDTLD: Individual Volume of Loans and Deposits to Aggregate Volume of Loans
and Deposits (to Other Resident Sectors) (%).

BANCO DE ESPAÑA 34 DOCUMENTO DE TRABAJO N.º 0726
• TASS: Total Assets (hundreds of millions of Euros).
• BRANCH: Number of branches.
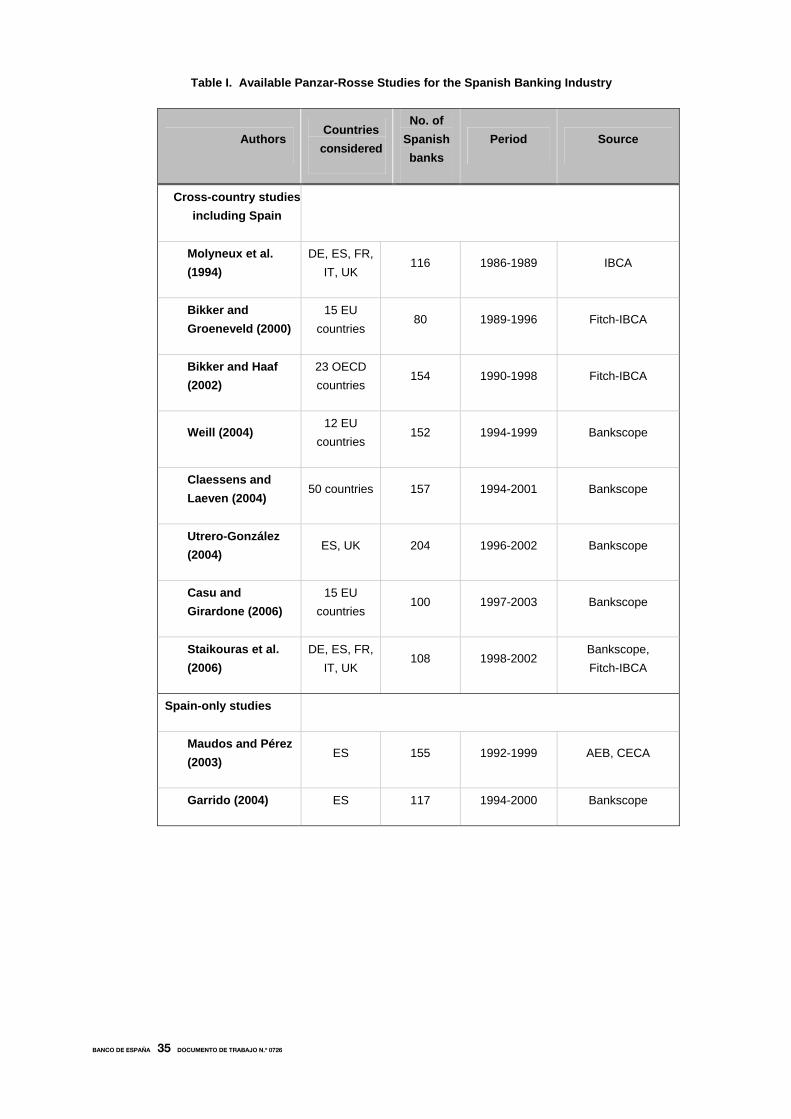
BANCO DE ESPAÑA 35 DOCUMENTO DE TRABAJO N.º 0726
Table I. Available Panzar-Rosse Studies for the Spanish Banking Industry
Authors Countries considered
No. of Spanish banks
Period Source
Cross-country studies including Spain
Molyneux et al. (1994)
DE, ES, FR, IT, UK
116 1986-1989 IBCA
Bikker and Groeneveld (2000)
15 EU countries
80 1989-1996 Fitch-IBCA
Bikker and Haaf (2002)
23 OECD countries
154 1990-1998 Fitch-IBCA
Weill (2004) 12 EU
countries 152 1994-1999 Bankscope
Claessens and Laeven (2004)
50 countries 157 1994-2001 Bankscope
Utrero-González (2004)
ES, UK 204 1996-2002 Bankscope
Casu and Girardone (2006)
15 EU countries
100 1997-2003 Bankscope
Staikouras et al. (2006)
DE, ES, FR, IT, UK
108 1998-2002 Bankscope, Fitch-IBCA
Spain-only studies
Maudos and Pérez (2003)
ES 155 1992-1999 AEB, CECA
Garrido (2004) ES 117 1994-2000 Bankscope

BANCO DE ESPAÑA 36 DOCUMENTO DE TRABAJO N.º 0726
Table II. Number of Banks in the Sample
No. of observations per bank type
Year No. of banks
Commercial banks
Savings banks
Comprehensiveness*
1986 184 112 72 84.0
1987 186 114 72 84.9
1988 191 115 76 87.6
1989 191 116 75 88.2
1990 186 121 65 81.5
1991 178 123 55 85.3
1992 177 124 53 81.9
1993 176 125 51 86.1
1994 174 123 51 91.1
1995 172 122 50 90.7
1996 169 119 50 90.8
1997 166 116 50 91.5
1998 157 107 50 93.8
1999 149 100 49 93.1
2000 137 90 47 92.9
2001 136 90 46 92.3
2002 132 86 46 92.2
2003 126 80 46 92.3
2004 123 77 46 92.3
2005 122 76 46 92.4
1986-2005 3,232 2,136 1,096 90.6
Note: Comprehensiveness refers to the percentage of assets corresponding to Spanish depositary
institutions which is accounted for by the banks included in the sample.

BANCO DE ESPAÑA 37 DOCUMENTO DE TRABAJO N.º 0726
Table III. Market Structure Indicators based on Banks’ Total Assets
Year CR1 CR3 CR5 CR10 HHI NE II
1986 7.5 21.3 33.5 48.5 310 32 -
1987 7.6 20.8 32.4 47.7 298 34 8.0
1988 10.8 23.7 33.2 48.0 327 31 45.3
1989 10.1 22.5 33.0 46.9 312 32 9.3
1990 10.4 25.8 35.7 47.6 344 29 38.3
1991 9.7 24.6 36.0 51.4 359 28 36.5
1992 10.1 25.4 37.2 49.8 365 27 21.1
1993 11.8 29.0 41.4 53.5 434 23 34.9
1994 9.9 26.4 38.7 54.2 398 25 17.7
1995 9.5 25.8 38.5 54.4 393 25 10.5
1996 10.3 27.5 39.5 54.5 412 24 9.7
1997 10.8 28.3 39.8 54.6 420 24 9.4
1998 10.6 27.7 41.9 57.5 446 22 18.5
1999 16.7 35.9 48.2 60.4 608 16 42.6
2000 19.0 43.1 53.8 63.9 801 12 48.7
2001 17.5 41.1 51.4 62.2 733 14 7.7
2002 16.2 39.7 50.1 61.4 676 15 9.7
2003 15.6 39.1 49.4 61.9 661 15 7.2
2004 15.3 37.4 47.8 62.4 624 16 8.5
2005 15.1 36.5 47.1 62.8 607 16 7.4
Note: CRn, HHI, NE and II stand for Concentration Ratio of the n largest firms, Herfindahl-Hirschman
Index, Numbers-Equivalent and Instability Index, respectively. CRn is the percentage market share of
the n largest banks, ranked according total assets, in the sum of the assets of all banks in each
observation date. HHI is the sum of the squares of all banks’ percentage market shares, according to
total assets, and ranges from 0 to 10,000. The NE is the number of equally-sized firms constituting the
same level of concentration as reported by the HHI. The II measures the aggregate difference in the
banks’ percentage market shares between two consecutive years.

BANCO DE ESPAÑA 38 DOCUMENTO DE TRABAJO N.º 0726
Table IV. Descriptive Statistics
Mean NITA PL PLF PCE EQTA LOATA LFTA LDTLD TASS BRANCH
1986 10.5 25.4 7.1 55.4 7.8 36.2 88.0 0.58 12.9 143.6
1987 10.9 27.2 7.4 70.9 8.5 38.3 87.3 0.57 13.6 139.7
1988 10.6 33.1 6.9 74.8 9.6 41.2 86.4 0.55 16.3 156.3
1989 10.8 34.2 7.6 86.5 10.1 39.9 86.0 0.55 19.3 164.0
1990 11.6 35.0 8.7 96.1 10.6 38.6 85.2 0.56 20.5 156.6
1991 11.8 36.5 8.7 91.9 11.0 40.5 85.2 0.59 25.2 169.2
1992 11.3 38.3 8.3 111.1 10.4 40.3 86.2 0.59 27.4 169.4
1993 11.4 41.7 8.2 118.4 10.0 37.0 86.9 0.62 35.8 179.2
1994 9.0 42.7 6.1 121.9 10.2 36.6 86.8 0.61 38.5 192.2
1995 9.6 45.9 6.9 125.1 9.8 37.8 86.9 0.60 40.2 197.4
1996 9.0 48.7 6.2 118.8 9.5 37.7 87.2 0.64 46.6 210.8
1997 7.7 50.5 4.6 141.8 9.8 40.4 87.4 0.64 50.2 216.8
1998 6.5 51.5 3.6 132.8 9.4 44.9 87.4 0.70 60.1 244.9
1999 5.5 54.5 2.5 125.5 9.1 49.7 87.2 0.74 69.1 260.5
2000 5.9 54.2 3.3 158.9 9.9 51.7 86.0 0.78 81.2 273.3
2001 6.2 55.7 3.6 167.9 10.2 53.5 86.1 0.81 90.7 280.3
2002 5.4 58.6 2.7 196.0 9.9 56.0 86.5 0.84 98.9 287.7
2003 4.9 60.9 2.0 242.7 9.6 59.1 86.9 0.91 122.0 317.0
2004 4.5 63.0 1.8 206.4 9.7 61.1 87.1 0.97 143.9 348.7
2005 4.3 63.9 1.9 244.0 6.3 66.8 90.1 1.00 183.6 371.5
Note: NITA: Net Income to Total Assets; PL: Price of Labor; PLF: Price of Loanable Funds; PCE: Price of Capital
Expenditure; EQTA: Equity to Total Assets; LOATA: Loans to Total Assets; LFTA: Loanable Funds to Total Assets; LDTLD:
Loans and Deposits To aggregate Loans and Deposits; TASS: Total ASSets; BRANCH: Number of Branches.

BANCO DE ESPAÑA 39 DOCUMENTO DE TRABAJO N.º 0726
Table V. Correlation Matrix
1986-2005
NITA PL PLF PCE EQTA LOATA LFTA LDTLD TASS BRANCH
NITA 1.00
PL -0.37 1.00
PLF 0.80 -0.20 1.00
PCE -0.12 0.45 0.00 1.00
EQTA 0.16 0.00 0.08 -0.09 1.00
LOATA -0.18 -0.06 -0.33 -0.13 -0.05 1.00
LFTA -0.17 -0.10 -0.12 0.01 -0.87 0.15 1.00
LDTLD -0.10 -0.02 -0.13 -0.16 -0.03 0.03 0.01 1.00
TASS -0.19 0.10 -0.17 -0.08 -0.04 0.03 0.00 0.83 1.00
BRANCH -0.13 -0.03 -0.18 -0.18 -0.04 0.07 0.02 0.95 0.81 1.00
Note: NITA: Net Income to Total Assets; PL: Price of Labor; PLF: Price of Loanable Funds; PCE: Price of
Capital Expenditure; EQTA: Equity to Total Assets; LOATA: Loans to Total Assets; LFTA: Loanable Funds to
Total Assets; LDTLD: Loans and Deposits To aggregate Loans and Deposits; TASS: Total Assets; BRANCH:
Number of Branches.

BA
NC
O D
E E
SP
AÑ
A 40
DO
CU
ME
NT
O D
E T
RA
BA
JO
N.º 0
726
Table VI. Pooled Generalized Least Squares (PGLS) Estimation Results Dependent variable: Ln(NITA)
coefficient p-value 1986-1990 1991-1995 1996-2000 2001-2005 1986-2005
-0.001 -0.015 -0.010 -0.009 -0.016 Ln(PL) 0.582 0.000 0.003 0.002 0.000 0.555 0.717 0.796 0.555 0.795 Ln(PLF) 0.000 0.000 0.000 0.000 0.000 -0.006 -0.002 -0.002 0.002 -0.002 Ln(PCE) 0.000 0.073 0.444 0.102 0.003 0.146 0.006 0.088 0.090 0.060 Ln(EQTA) 0.001 0.905 0.080 0.002 0.014 0.041 0.045 0.024 0.006 0.017 Ln(LOATA) 0.000 0.000 0.001 0.400 0.000 0.168 -0.041 -0.009 0.046 0.009 Ln(LFTA) 0.012 0.592 0.908 0.245 0.831 0.058 0.021 -0.014 -0.040 -0.009 Ln(LDTLD) 0.008 0.361 0.523 0.029 0.448 -0.061 0.116 0.064 0.034 0.083 cons 0.166 0.032 0.268 0.214 0.002
No. of obs. 853 824 718 548 2943 R-squared 0.57 0.57 0.44 0.32 0.73
H-statistic 0.548MC 0.700 MC 0.786 MC 0.546 MC 0.777 MC
F-stat 448.45 533.99 223.88 28.14 2924.13 H0: H=0 p-value 0.000 0.000 0.000 0.000 0.000 F-stat 306.30 98.46 16.91 19.12 241.05 H0: H=1 p-value 0.000 0.000 0.000 0.000 0.000
Note: Superscript MC (Monopolistic Competition) indicates that H=0 and H=1 are rejected at the 5% significance level.

BA
NC
O D
E E
SP
AÑ
A 41
D
OC
UM
EN
TO
DE
TR
AB
AJ
O N
.º 07
26
Table VII. Pooled Weighted Least Squares (PWLS) Estimation Results Dependent variable: Ln(NITA) Weighting variable: TASS
coefficient p-value 1986-1990 1991-1995 1996-2000 2001-2005 1986-2005
0.000 -0.013 -0.016 -0.010 -0.018 Ln(PL) 0.120 0.000 0.000 0.000 0.000 0.528 0.800 0.977 1.040 0.968 Ln(PLF) 0.000 0.000 0.000 0.000 0.000 -0.002 0.004 0.001 0.003 0.002 Ln(PCE) 0.000 0.000 0.001 0.000 0.000 0.201 0.101 0.113 0.064 0.110 Ln(EQTA) 0.000 0.000 0.000 0.000 0.000 0.051 0.040 0.033 0.025 0.018 Ln(LOATA) 0.000 0.000 0.000 0.000 0.000 0.178 -0.006 0.042 -0.006 0.041 Ln(LFTA) 0.000 0.348 0.000 0.001 0.000 0.005 0.008 -0.041 -0.024 -0.023 Ln(LDTLD) 0.032 0.000 0.000 0.000 0.000 -0.076 0.073 0.042 0.048 0.056 cons 0.000 0.000 0.000 0.000 0.000
No. of obs. 14122 27437 43413 68424 153397 R-squared 0.56 0.67 0.62 0.57 0.88
H-statistic 0.526MC 0.790 MC 0.962 MC 1.034 MC 0.952 MC
F-stat 14305.73 31798.97 54399.76 55024.11 350000 H0: H=0 p-value 0.000 0.000 0.000 0.000 0.000 F-stat 11683.48 2238.56 83.45 58.85 869.7 H0: H=1 p-value 0.000 0.000 0.000 0.000 0.000
Note: Superscript MC (Monopolistic Competition) indicates that H=0 and H=1 are rejected at the 5% significance level.

BA
NC
O D
E E
SP
AÑ
A 42
DO
CU
ME
NT
O D
E T
RA
BA
JO
N.º 0
726
Table VIII. Pooled Weighted Least Squares (PWLS) Estimation Results Dependent variable: Ln(NITA) Weighting variable: BRANCH
coefficient p-value 1986-1990 1991-1995 1996-2000 2001-2005 1986-2005
-0.001 -0.010 -0.018 -0.022 -0.018 Ln(PL) 0.000 0.000 0.000 0.000 0.000 0.545 0.807 1.014 1.053 1.013 Ln(PLF) 0.000 0.000 0.000 0.000 0.000 0.008 0.016 0.002 0.010 0.005 Ln(PCE) 0.000 0.000 0.000 0.000 0.000 0.260 0.225 0.216 0.059 0.213 Ln(EQTA) 0.000 0.000 0.000 0.000 0.000 0.054 0.062 0.042 0.028 0.024 Ln(LOATA) 0.000 0.000 0.000 0.000 0.000 0.244 0.170 0.175 -0.008 0.157 Ln(LFTA) 0.000 0.000 0.000 0.000 0.000 -0.019 0.019 0.000 0.006 -0.017 Ln(LDTLD) 0.000 0.000 0.551 0.000 0.000 -0.125 -0.072 -0.046 0.093 -0.031 cons 0.000 0.000 0.000 0.000 0.000
No. of obs. 129787 149206 171882 174190 625065 R-squared 0.59 0.76 0.82 0.72 0.92
H-statistic 0.552MC 0.812MC 0.998PC 1.042MC 1.001PC
F-stat 120000 220000 500000 200000 2000000 H0: H=0 p-value 0.000 0.000 0.000 0.000 0.000 F-stat 77035.18 11797.27 3.03 322.37 1.77 H0: H=1 p-value 0.000 0.000 0.082 0.000 0.183
Note: Superscript MC (Monopolistic Competition) indicates that H=0 and H=1 are rejected at the 5% significance level. Superscript PC (Perfect Competition) indicates that H=0 is rejected but H=1 is not rejected at the 5% significance level.

BA
NC
O D
E E
SP
AÑ
A 43
D
OC
UM
EN
TO
DE
TR
AB
AJ
O N
.º 07
26
Table IX. Panzar-Rosse Model Results in Other Studies
H-statistics This study Authors
ES DE FR IT UK US Period ES
Cross-country studies PGLS PWLSTASS PWLSBRANCH
Molyneux et al. (1994) 0.47 0.13 0.73 -0.61 0.62 - 1986-1989 0.53 0.51 0.55
Bikker and Groeneveld (2000) 0.58 0.85 0.91 0.91 0.72 - 1989-1996 0.67 0.75 0.78
De Bandt and Davis (2000) - 0.27 0.19 0.51 - 0.55 1992-1996 0.72 0.81 0.81
Bikker and Haaf (2002) 0.59 0.62 0.70 0.82 0.63 0.55 1990-1998 0.74 0.87 0.92
Weill (2004) 0.53 0.58 0.58 0.62 0.57 - 1994-1999 0.78 0.96 0.97
Claessens and Laeven (2004) 0.53 0.58 0.69 0.60 0.74 0.41 1994-2001 0.78 0.96 0.99
Utrero-González (2004) 0.29 - - - 0.49 - 1996-2002 0.76 0.96 0.99
Casu and Girardone (2006) 0.31 0.36 0.17 0.41 0.32 - 1997-2003 0.65 0.96 0.97
Staikouras et al. (2006) 0.52 0.50 0.79 0.67 0.67 - 1998-2002 0.59 0.74 0.72
Spain-only studies PGLS PWLSTASS PWLSBRANCH
Maudos and Pérez (2003) 0.71 - - - - - 1992-1999 0.81 0.95 0.97
Garrido (2004) 0.57 - - - - - 1994-2000 0.79 0.97 0.99
This study 1986-2005 0.78 0.95 1.00 Note: For the sake of comparability, reported H-statistics for other studies are, whenever available, full-sample least squares estimates. PGLS stands for Pooled Generalized Least
Squares. PWLSTASS and PWLSBRANCH stand for Pooled Weighted Least Squares with TASS (Total Assets) and BRANCH (Number of Branches) as weighting variables, respectively.

BANCO DE ESPAÑA 44 DOCUMENTO DE TRABAJO N.º 0726
Figure III. Market Structure and Consolidation in the Spanish Banking Industry
0
10
20
30
40
50
60
70
1986 1987 1988 1989 1990 1991 1992 1993 1994 1995 1996 1997 1998 1999 2000 2001 2002 2003 2004 2005
%
0
10
20
30
40
50
60
70
%
CR5
Instability Index
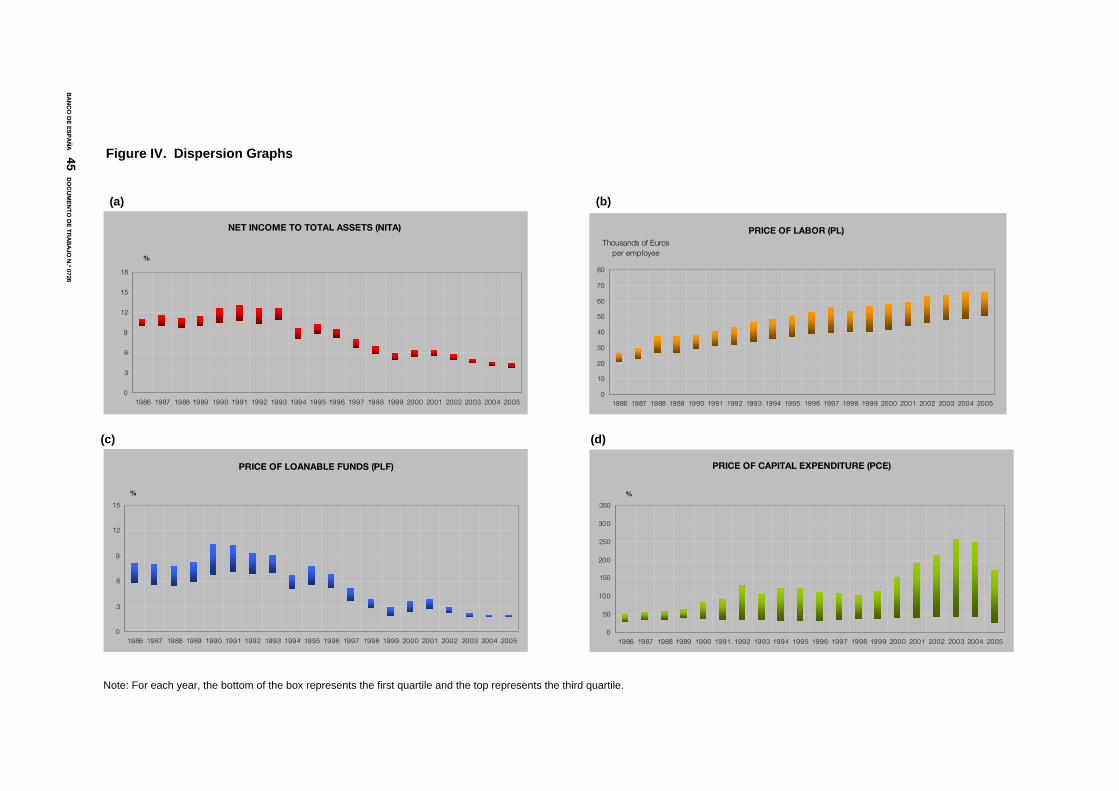
BA
NC
O D
E E
SP
AÑ
A 45
D
OC
UM
EN
TO
DE
TR
AB
AJ
O N
.º 07
26
Figure IV. Dispersion Graphs
(a) (b)
NET INCOME TO TOTAL ASSETS (NITA)
0
3
6
9
12
15
18
1986 1987 1988 1989 1990 1991 1992 1993 1994 1995 1996 1997 1998 1999 2000 2001 2002 2003 2004 2005
%
PRICE OF LABOR (PL)
0
10
20
30
40
50
60
70
80
1986 1987 1988 1989 1990 1991 1992 1993 1994 1995 1996 1997 1998 1999 2000 2001 2002 2003 2004 2005
Thousands of Euros
per employee
(c) (d)
PRICE OF LOANABLE FUNDS (PLF)
0
3
6
9
12
15
1986 1987 1988 1989 1990 1991 1992 1993 1994 1995 1996 1997 1998 1999 2000 2001 2002 2003 2004 2005
%
PRICE OF CAPITAL EXPENDITURE (PCE)
0
50
100
150
200
250
300
350
1986 1987 1988 1989 1990 1991 1992 1993 1994 1995 1996 1997 1998 1999 2000 2001 2002 2003 2004 2005
%
Note: For each year, the bottom of the box represents the first quartile and the top represents the third quartile.

BANCO DE ESPAÑA 46 DOCUMENTO DE TRABAJO N.º 0726
Figure V. Estimation Results
(a) Pooled Generalized Least Squares (PGLS) Estimates
-0.2
0
0.2
0.4
0.6
0.8
1
1986 1987 1988 1989 1990 1991 1992 1993 1994 1995 1996 1997 1998 1999 2000 2001 2002 2003 2004 2005
H
(b) Pooled Weighted Least Squares (PWLS) Estimates according to total assets
-0.2
0
0.2
0.4
0.6
0.8
1
1986 1987 1988 1989 1990 1991 1992 1993 1994 1995 1996 1997 1998 1999 2000 2001 2002 2003 2004 2005
H
(c) Pooled Weighted Least Squares (PWLS) Estimates according to the number of branches
-0.2
0
0.2
0.4
0.6
0.8
1
1986 1987 1988 1989 1990 1991 1992 1993 1994 1995 1996 1997 1998 1999 2000 2001 2002 2003 2004 2005
H

BANCO DE ESPAÑA PUBLICATIONS
WORKING PAPERS1
0626 CRISTINA BARCELÓ: A Q-model of labour demand.
0627 JOSEP M. VILARRUBIA: Neighborhood effects in economic growth.
0628 NUNO MARTINS AND ERNESTO VILLANUEVA: Does limited access to mortgage debt explain why young adults
live with their parents?
0629 LUIS J. ÁLVAREZ AND IGNACIO HERNANDO: Competition and price adjustment in the euro area.
0630 FRANCISCO ALONSO, ROBERTO BLANCO AND GONZALO RUBIO: Option-implied preferences adjustments,
density forecasts, and the equity risk premium.
0631 JAVIER ANDRÉS, PABLO BURRIEL AND ÁNGEL ESTRADA: BEMOD: A dsge model for the Spanish economy
and the rest of the Euro area.
0632 JAMES COSTAIN AND MARCEL JANSEN: Employment fluctuations with downward wage rigidity: The role of
moral hazard.
0633 RUBÉN SEGURA-CAYUELA: Inefficient policies, inefficient institutions and trade.
0634 RICARDO GIMENO AND JUAN M. NAVE: Genetic algorithm estimation of interest rate term structure.
0635 JOSÉ MANUEL CAMPA, JOSÉ M. GONZÁLEZ-MÍNGUEZ AND MARÍA SEBASTIÁ-BARRIEL: Non-linear
adjustment of import prices in the European Union.
0636 AITOR ERCE-DOMÍNGUEZ: Using standstills to manage sovereign debt crises.
0637 ANTON NAKOV: Optimal and simple monetary policy rules with zero floor on the nominal interest rate.
0638 JOSÉ MANUEL CAMPA AND ÁNGEL GAVILÁN: Current accounts in the euro area: An intertemporal approach.
0639 FRANCISCO ALONSO, SANTIAGO FORTE AND JOSÉ MANUEL MARQUÉS: Implied default barrier in credit
default swap premia. (The Spanish original of this publication has the same number.)
0701 PRAVEEN KUJAL AND JUAN RUIZ: Cost effectiveness of R&D and strategic trade policy.
0702 MARÍA J. NIETO AND LARRY D. WALL: Preconditions for a successful implementation of supervisors’ prompt
corrective action: Is there a case for a banking standard in the EU?
0703 PHILIP VERMEULEN, DANIEL DIAS, MAARTEN DOSSCHE, ERWAN GAUTIER, IGNACIO HERNANDO,
ROBERTO SABBATINI AND HARALD STAHL: Price setting in the euro area: Some stylised facts from individual
producer price data.
0704 ROBERTO BLANCO AND FERNANDO RESTOY: Have real interest rates really fallen that much in Spain?
0705 OLYMPIA BOVER AND JUAN F. JIMENO: House prices and employment reallocation: International evidence.
0706 ENRIQUE ALBEROLA AND JOSÉ M.ª SERENA: Global financial integration, monetary policy and reserve
accumulation. Assessing the limits in emerging economies.
0707 ÁNGEL LEÓN, JAVIER MENCÍA AND ENRIQUE SENTANA: Parametric properties of semi-nonparametric
distributions, with applications to option valuation.
0708 ENRIQUE ALBEROLA AND DANIEL NAVIA: Equilibrium exchange rates in the new EU members: external
imbalances vs. real convergence.
0709 GABRIEL JIMÉNEZ AND JAVIER MENCÍA: Modelling the distribution of credit losses with observable and latent
factors.
0710 JAVIER ANDRÉS, RAFAEL DOMÉNECH AND ANTONIO FATÁS: The stabilizing role of government size.
0711 ALFREDO MARTÍN-OLIVER, VICENTE SALAS-FUMÁS AND JESÚS SAURINA: Measurement of capital stock
and input services of Spanish banks.
0712 JESÚS SAURINA AND CARLOS TRUCHARTE: An assessment of Basel II procyclicality in mortgage portfolios.
0713 JOSÉ MANUEL CAMPA AND IGNACIO HERNANDO: The reaction by industry insiders to M&As in the European
financial industry.
0714 MARIO IZQUIERDO, JUAN F. JIMENO AND JUAN A. ROJAS: On the aggregate effects of immigration in Spain.
0715 FABIO CANOVA AND LUCA SALA: Back to square one: identification issues in DSGE models.
0716 FERNANDO NIETO: The determinants of household credit in Spain.
0717 EVA ORTEGA, PABLO BURRIEL, JOSÉ LUIS FERNÁNDEZ, EVA FERRAZ AND SAMUEL HURTADO:
Actualización del modelo trimestral del Banco de España.
0718 JAVIER ANDRÉS AND FERNANDO RESTOY: Macroeconomic modelling in EMU: how relevant is the change in
regime?
1. Previously published Working Papers are listed in the Banco de España publications catalogue.
0719 FABIO CANOVA, DAVID LÓPEZ-SALIDO AND CLAUDIO MICHELACCI: The labor market effects of technology
shocks.
0720 JUAN M. RUIZ AND JOSEP M. VILARRUBIA: The wise use of dummies in gravity models: Export potentials in
the Euromed region.
0721 CLAUDIA CANALS, XAVIER GABAIX, JOSEP M. VILARRUBIA AND DAVID WEINSTEIN: Trade patterns, trade
balances and idiosyncratic shocks.
0722 MARTÍN VALLCORBA AND JAVIER DELGADO: Determinantes de la morosidad bancaria en una economía
dolarizada. El caso uruguayo.
0723 ANTON NAKOV AND ANDREA PESCATORI: Inflation-output gap trade-off with a dominant oil supplier.
0724 JUAN AYUSO, JUAN F. JIMENO AND ERNESTO VILLANUEVA: The effects of the introduction of tax incentives
on retirement savings.
0725 DONATO MASCIANDARO, MARÍA J. NIETO AND HENRIETTE PRAST: Financial governance of banking supervision.
0726 LUIS GUTIÉRREZ DE ROZAS: Testing for competition in the Spanish banking industry: The Panzar-Rosse approach
revisited.
Unidad de PublicacionesAlcalá, 522; 28027 Madrid
Telephone +34 91 338 6363. Fax +34 91 338 6488e-mail: [email protected]
www.bde.es