
Testing and numerical simulation of Holocene marine sand ... · PDF fileŠarūnas...
12
33 since 1961 BALTICA Volume 27 Number 1 June 2014 : 33–44 doi: 10.5200/baltica.2014.27.04 Testing and numerical simulation of Holocene marine sand uniaxial compression at Lithuanian coast Šarūnas Skuodis, Darius Markauskas, Arnoldas Norkus, Gintaras Žaržojus, Neringa Dirgėlienė Skuodis Š., Markauskas D., Norkus A., Žaržojus G., Dirgėlienė N., 2014. Testing and numerical simulation of Holocene marine sand uniaxial compression at Lithuanian coast. Baltica, 27 (1), 33–44. Vilnius. EISSN 1648-858X. Manuscript submitted 29 January 2014 / Accepted 5 May 2014 / Published online 9 June 2014 © Baltica 2014 Abstract Compressibility of quartz sand from the Lithuanian coastal area in Klaipėda environs is investigated by testing and numerical simulation, with validation of obtained results. The shape of sand grains has been analysed with a scanning electronic microscope (SEM). The determined morphological parameters of sand grains are employed to create discrete models (particle models of grains) subsequently used for sand compres- sion test numerical simulation via discrete element method (DEM) techniques. The background version of DEM and the numerical time-integration algorithm are implemented in original DEMMAT code. Compres- sion tests have been realised by an oedometer device. Test versus numerical simulation results have revealed a dependence of significant compression curve character on the discretised shape of sand grains and Young’s modulus of particles. Keywords • oedometer • sand • uniaxial compression • morphological parameters • numerical simulation • discrete ele- ment method Šarūnas Skuodis ([email protected]), Darius Markauskas, Arnoldas Norkus, Gintaras Žaržojus, Neringa Dirgėlienė, Vilnius Gediminas Technical University, Saulėtekio al. 11, LT-10223 Vilnius, Lithuania INTRODUCTION Evaluation of the actual compressibility properties via soil compression tests is important for employment of subsequent numerical analysis of stress and strain state of ground subjected by supplement loading (e.g. loads transmitted via foundations from a superstructure, in- teraction of structure and soil strata, etc). The confined compression (oedometer) test is approved as a relative- ly fast and simple laboratory test. It is performed under different conditions, loading paths and durability. Test conditions depend on physical changes of multiphase system of soil, generally related with reorganisation of soil grains, that of initial change of skeleton in cohe- sive soils and velocity of water filtration in saturated soils. One must note that in some cases the duration of testing procedure for prediction of long term soil be- haviour and in other specific cases is very long (Tong, Yin 2011), thus sometimes taking into account the time and test cost ratio it is not worth even to start the test. From the other hand one cannot qualitatively explain the variation of soil compression test results, basing on some processing of already known testing and analysis data separately or in concert with a view analysis. It is obvious, that having not identified the actual physical mechanism for soil grain reorganisation during com- pression process and its peculiarities, one cannot ex- plain the observed scatter of test results under disposal. This mechanism cannot be recorded by applying usual techniques of testing and view analysis but can be sim- ulated applying the relevant discrete element method (DEM) techniques, employed mathematical models of processes and the discrete models of soil grains. The above-mentioned circumstances as well as the permanently reducing computational costs, the development of numerical techniques and software in the field of multi-scale analysis (including the par- ticle strata mechanics) initiated a fast development and the applications in the field of the soil behaviour numerical analysis by means of DEM. Such an ap- proach combined with an experimental analysis for validation and calibration of the mathematical mod- els is definitely a promising one, allowing reduce the price and quantity of laboratory tests and a reasonless conservatism in determining the design values of me- chanical properties of soils in near future.
Transcript of Testing and numerical simulation of Holocene marine sand ... · PDF fileŠarūnas...

33
since 1961BALTICA Volume 27 Number 1 June 2014 : 33–44
doi: 10.5200/baltica.2014.27.04
Testing and numerical simulation of Holocene marine sand uniaxial compression at Lithuanian coast
Šarūnas Skuodis, Darius Markauskas, Arnoldas Norkus, Gintaras Žaržojus, Neringa Dirgėlienė
Skuodis Š., Markauskas D., Norkus A., Žaržojus G., Dirgėlienė N., 2014. Testing and numerical simulation of Holocene marine sand uniaxial compression at Lithuanian coast. Baltica, 27 (1), 33–44. Vilnius. EISSN 1648-858X.Manuscript submitted 29 January 2014 / Accepted 5 May 2014 / Published online 9 June 2014© Baltica 2014
Abstract Compressibility of quartz sand from the Lithuanian coastal area in Klaipėda environs is investigated by testing and numerical simulation, with validation of obtained results. The shape of sand grains has been analysed with a scanning electronic microscope (SEM). The determined morphological parameters of sand grains are employed to create discrete models (particle models of grains) subsequently used for sand compres-sion test numerical simulation via discrete element method (DEM) techniques. The background version of DEM and the numerical time-integration algorithm are implemented in original DEMMAT code. Compres-sion tests have been realised by an oedometer device. Test versus numerical simulation results have revealed a dependence of significant compression curve character on the discretised shape of sand grains and Young’s modulus of particles.
Keywords • oedometer • sand • uniaxial compression • morphological parameters • numerical simulation • discrete ele-ment method
Šarūnas Skuodis ([email protected]), Darius Markauskas, Arnoldas Norkus, Gintaras Žaržojus, Neringa Dirgėlienė, Vilnius Gediminas Technical University, Saulėtekio al. 11, LT-10223 Vilnius, Lithuania
InTroducTIon
Evaluation of the actual compressibility properties via soil compression tests is important for employment of subsequent numerical analysis of stress and strain state of ground subjected by supplement loading (e.g. loads transmitted via foundations from a superstructure, in-teraction of structure and soil strata, etc). The confined compression (oedometer) test is approved as a relative-ly fast and simple laboratory test. It is performed under different conditions, loading paths and durability. Test conditions depend on physical changes of multiphase system of soil, generally related with reorganisation of soil grains, that of initial change of skeleton in cohe-sive soils and velocity of water filtration in saturated soils. One must note that in some cases the duration of testing procedure for prediction of long term soil be-haviour and in other specific cases is very long (Tong, Yin 2011), thus sometimes taking into account the time and test cost ratio it is not worth even to start the test. From the other hand one cannot qualitatively explain the variation of soil compression test results, basing on some processing of already known testing and analysis
data separately or in concert with a view analysis. It is obvious, that having not identified the actual physical mechanism for soil grain reorganisation during com-pression process and its peculiarities, one cannot ex-plain the observed scatter of test results under disposal. This mechanism cannot be recorded by applying usual techniques of testing and view analysis but can be sim-ulated applying the relevant discrete element method (DEM) techniques, employed mathematical models of processes and the discrete models of soil grains.
The above-mentioned circumstances as well as the permanently reducing computational costs, the development of numerical techniques and software in the field of multi-scale analysis (including the par-ticle strata mechanics) initiated a fast development and the applications in the field of the soil behaviour numerical analysis by means of DEM. Such an ap-proach combined with an experimental analysis for validation and calibration of the mathematical mod-els is definitely a promising one, allowing reduce the price and quantity of laboratory tests and a reasonless conservatism in determining the design values of me-chanical properties of soils in near future.

34
Currently, one can find many research reports on sand compression tests accompanied by numerical modelling of the tests for soil in order to reproduce the soil compression nature (Singh et al. 2012; Berg, Johannsmann 2003; Lewandowska, Pilawski 2012; Vittorias et al. 2010). However, one faces with many difficulties as particle shape discretization, problem size, singularity, convergence and many other diffi-culties, which appear in numerical simulations using DEM (Cavarretta 2009; Luding 2008; Khanal, To-mas 2008; Zhu et al. 2008).
It is obvious that evaluation of 3D versus 2D mod-els of compression test is much more efficient and exact. Generally, one deals with technical difficulties and amount of time, relevant technical resources and skills to evaluate 3D model of sand grains.
Therefore, a rational approach for saving time in discretisation of sand grains, that of computational resources and simulation accuracy requires substan-tiate the relevant morphology investigation via im-age analysis method, namely: using either the three dimension (3D) approach if it is rather irregular in volume, or two dimensions (2D) one, otherwise. The investigated sand samples correspond the Baltic Sea coast sand in Klaipėda environs (generally typical sand for Baltic Sea coast) with grains of high enough natural sphericity, roundness and roughness. Thus, 2D analysis is sufficient approach as 2D and 3D mor-phology parameters are very similar.
Another principal approach and discussion is re-lated with the aspects and simplifications of numeri-cal modelling via DEM processes. The state of art in the field of investigations, aimed for decreasing the computational time via DEM techniques (Fakhri et al. 2012), summarise the following, namely: (a) di-ameter sand grains is increased (Renouf et al. 2006); (b) Young’s modulus of particles is decreased or taken natural as for quartz (Yohannes et al. 2013; Lim, McDowell 2008); (c) density of particle is ar-tificially increased (Tordesillas et al. 2009); (d) the soil grading curve different from that obtained via test is employed for simulation of soil grain size distri-bution (Arasan et al. 2011); (e) the soil sample size and/or size of grains are reduced (Wu et al. 2009; Prisco, Galli 2011; Calvetti 2008) or the sample and grains sizes are increased (Geng et al. 2012; Chen, Zhou 2012); (f) discrete model of actual grain shape is simulated either as a simple sphere (Lin, Wu 2012; Safronov et al. 2012; Jasevičius et al. 2011; Abbas et al. 2005; Markauskas, Kačianauskas 2006) or as a multisphere (Tumonis et al. 2012; Kruggel-Emden et al. 2008); (g) soil is simulated omitting the smallest grains (particles) (Modenese et al. 2012).
The compressibility of Klaipėda environs sand samples is analysed via testing, numerical simula-tion, subsequent validation of obtained results is per-
formed. The aim of the present paper is to evaluate numerically the actual reorganisation of soil particles during compression process. Validation criterion is a response of the sample to be compatible with that recorded via the testing. The following techniques (from the above listed ones) for this purpose are em-ployed, namely: creating of the discrete models of soil grains based on scanning electronic microscope (SEM) 2D view morphological analysis; simulating the grading curve of the soil to be compatible with an actual one; choosing the different physical param-eters of soil grains and oedometer device, reducing in proportion (versus actual test) the composition and the number of particles for numerical simulation; and reducing in proportion the time of simulation in the way to avoid dynamic effects.
EnGInEErInG GEoLoGIcAL SETTInG
The sediments deposited on the Lithuanian coast of the Baltic Sea have been formed during the Quater-nary. There are two geologically and geomorphologi-cally different sectors of the Lithuanian coastal area: the mainland area (to the north from Klaipėda) and the Curonian Spit [Kuršių Nerija] (Gudelis 1992). The investigated area is located in the southern part of the Lithuanian mainland area of the Baltic Sea (the northern part of Klaipėda city) (Fig. 1).
Northwards from the Klaipėda city, only the im-mediate near coast area contains a sandy strip of Holocene marine sediments (m IV), which occur as deep as to 4–5 metres in the sea. The material com-posing the near shore sediments mainly consists of different sand, where medium coarse and fine sand (Repečka 1999; Gulbinskas, Trimonis 1999) with admixture of gravel and organic matter (Gadeikis, Repečka 1999; Dundulis et al. 2006) prevails. This sand has been used for investigations (one sample of 14 kg). The coordinates of sampling location (marked in Fig. 1) are 55°46’4.07”, 21°4’39.06” (WGS), and sampling depth 0.4–0.5 meters.
The average density of particles (ρs) for ma-rine sands is 2.67 Mg/m³ and varies from 2.65 to 2.71 Mg/ m³, respectively. The bulk density of the sand varies from 1.83 to 2.09 Mg/m³, where the av-erage is 1.98 Mg/m³. Regardless of the genesis of marine sand and their grain size distribution, quartz and feldspar prevail in mineral composition. The natural moisture content (w) depends on a degree of saturation and ranges from 13.7 to 27.7%. The void ratio (e) in fine sand varies from 0.474 to 0.778 (Ga-deikis, Repečka 1999; Dundulis et al. 2004; Dundu-lis et al. 2006). The recent marine sediments (m IV) have been formed in the coastal zone, therefore high sphericity P = 0.84 (Dundulis et al. 2004) is a distinc-tive morphological feature of grain shape.

35
Fig. 1 Location of investigated site and lithological types of bottom surface sediments (after S. Gulbinskas and E. Tri-monis 1999): 1 – boulders (>64 mm) and gravel (64–2 mm); 2 – coarse-grained (2–0.5 mm) and medium-grained (0.5–0.25 mm) sand; 3 – fine sand (0.5–0.063 mm); 4 – location of investigation area.
EXPErIMEnTAL SETuP
Evaluation of sand morphological parameters
The mineralogical composition of sand under investiga-tion was determined by Amšiejus et al. (2010), where sand is found to contain ~85 % quartz and ~6 % feld-spar with remaining contribution of carbonate, mica and some other minerals. The sand sieving test (Fig. 2) has been performed to identify the governing fractions for evaluation of morphological parameters via scanning electronic microscope (SEM) analysis and the subse-quent creation of discrete models of sand grains.
Fig. 3 presents the identified and further investi-gated fractions of grains with SEM: the panoramic view in the top picture and the magnification of 2.00–1.18 mm sand fraction (corresponding the marked area in panoramic view) in the bottom picture. Note that smaller fractions within the 0.0063–0.15 mm are omitted in the panoramic view as due to the lack of place for picturing.
The main morphological parameters for 2D view analysis of sand grains are as follow (Kavrus, Skuo-dis 2012; Prušinskienė 2012):
• area, mm2;• equivalent diameter, mm;
Fig. 2 Soil grading curve according to LST EN ISO 14688–2:2007.

36
• sphericity;• circularity;• form coefficient;• angularity.
33 different sand grains, corresponding basic nine sand fractions (according to LST EN ISO 14688-2:2007) have been examined, the total number of ex-amined grains being 297. Morphological parameters
Fig. 3 Soil 2D investigation with SEM: pictures of pan-oramic view (top) and magnification of marked area (bot-tom).
Fig. 4 Actual (left) and computed (right) 2D morphologi-cal parameters with STIMAN (Kavrus, Skuodis 2012).
calculated applying the specialised software STI-MAN (STIMAN 2010). The input data for the calcu-lation program of STIMAN are the views of pictures (Fig. 4) that determines the selected morphological pa-rameters according to the developed algorithm. Such direct automatic sequence: view analysis process-ing – preparing input data – calculation – output of determined parameters, ensures the accuracy of obtained values (Allonso-Marroquin 2008; CEGEO et al. 2012) as it is not necessary to apply any addi-tional calculations (Blott, Pye 2008; Charpentier et al. 2013; Roussillon et al. 2009; Montenegro et al. 2013; Tafesse 2013) for determining the final magnitudes of investigated morphological parameters.
The morphological parameters have been deter-mined for all grains of selected sand fractions. An analysis of the determined morphological parameters within each fraction has shown that the shape of all grains is rather similar, i.e. the grains differ princi-pally only in size. Therefore, in the case of analysed sand sample it is sufficient to create the single gener-alised (typical) shape discrete model of a particle of different sizes in fractures.
A development of the discrete model for the typi-cal shape particle requires determine the mean mor-phological parameters. The obtained mean 2D mor-phological parameters of the particle are given in Table 1.
Table 1 Mean morphological parameters (2D case). Com-piled by Š. Skuodis 2013.
Morphological parameter Mean value
Area (mm2) 0.1122Equivalent diameter (mm) 0.340Sphericity 0.836Circularity 0.515Form coefficient 0.702Angularity 0.410
Particle shape
The mean shape (Table 1) of investigated sand grain has been determined using Krumbein and Slos (1951) and Cho et al. (2006) given solutions for sand shape characterisation according to the particle sphericity and roundness. In this case, it is not neces-sary to use Fourier descriptors (Mollon, Zhao 2013).
Sand compression test
The air-dry sand samples have been prepared for ex-perimental analysis (oedometer test). The compression tests have been performed by the universal oedom-
37
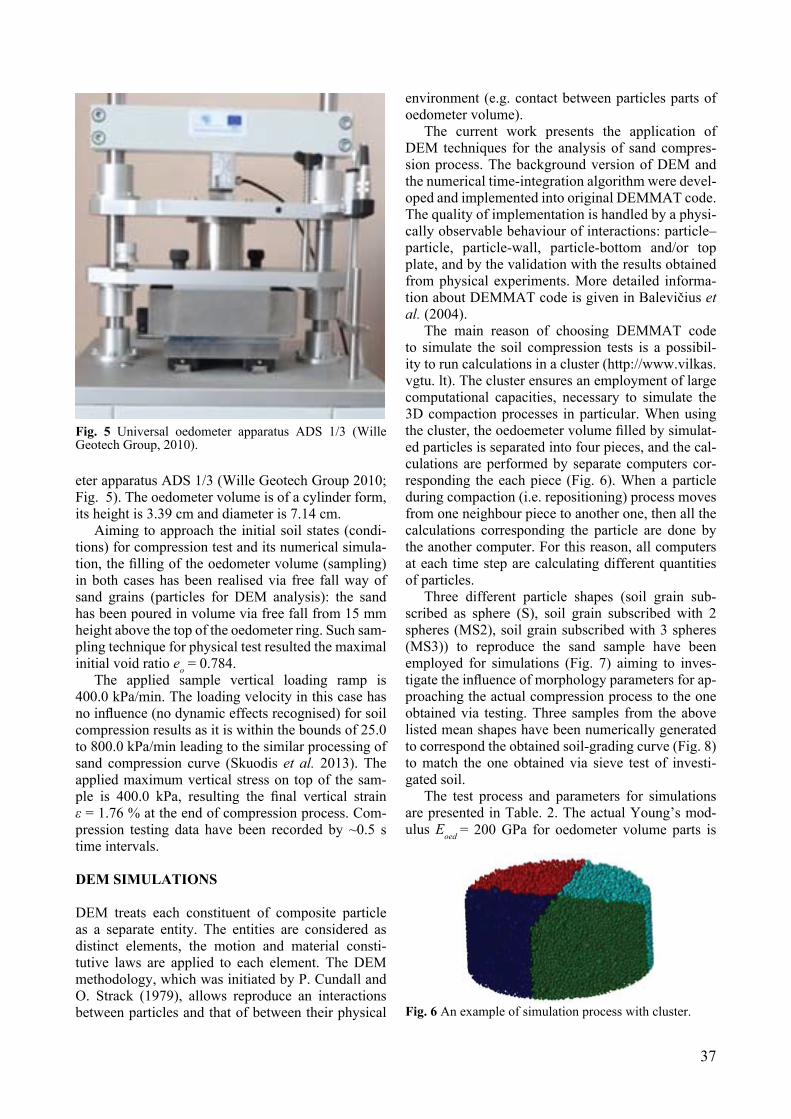
eter apparatus ADS 1/3 (Wille Geotech Group 2010; Fig. 5). The oedometer volume is of a cylinder form, its height is 3.39 cm and diameter is 7.14 cm.
Aiming to approach the initial soil states (condi-tions) for compression test and its numerical simula-tion, the filling of the oedometer volume (sampling) in both cases has been realised via free fall way of sand grains (particles for DEM analysis): the sand has been poured in volume via free fall from 15 mm height above the top of the oedometer ring. Such sam-pling technique for physical test resulted the maximal initial void ratio eo = 0.784.
The applied sample vertical loading ramp is 400.0 kPa/min. The loading velocity in this case has no influence (no dynamic effects recognised) for soil compression results as it is within the bounds of 25.0 to 800.0 kPa/min leading to the similar processing of sand compression curve (Skuodis et al. 2013). The applied maximum vertical stress on top of the sam-ple is 400.0 kPa, resulting the final vertical strain ε = 1.76 % at the end of compression process. Com-pression testing data have been recorded by ~0.5 s time intervals.
dEM SIMuLATIonS
DEM treats each constituent of composite particle as a separate entity. The entities are considered as distinct elements, the motion and material consti-tutive laws are applied to each element. The DEM methodology, which was initiated by P. Cundall and O. Strack (1979), allows reproduce an interactions between particles and that of between their physical
environment (e.g. contact between particles parts of oedometer volume).
The current work presents the application of DEM techniques for the analysis of sand compres-sion process. The background version of DEM and the numerical time-integration algorithm were devel-oped and implemented into original DEMMAT code. The quality of implementation is handled by a physi-cally observable behaviour of interactions: particle–particle, particle-wall, particle-bottom and/or top plate, and by the validation with the results obtained from physical experiments. More detailed informa-tion about DEMMAT code is given in Balevičius et al. (2004).
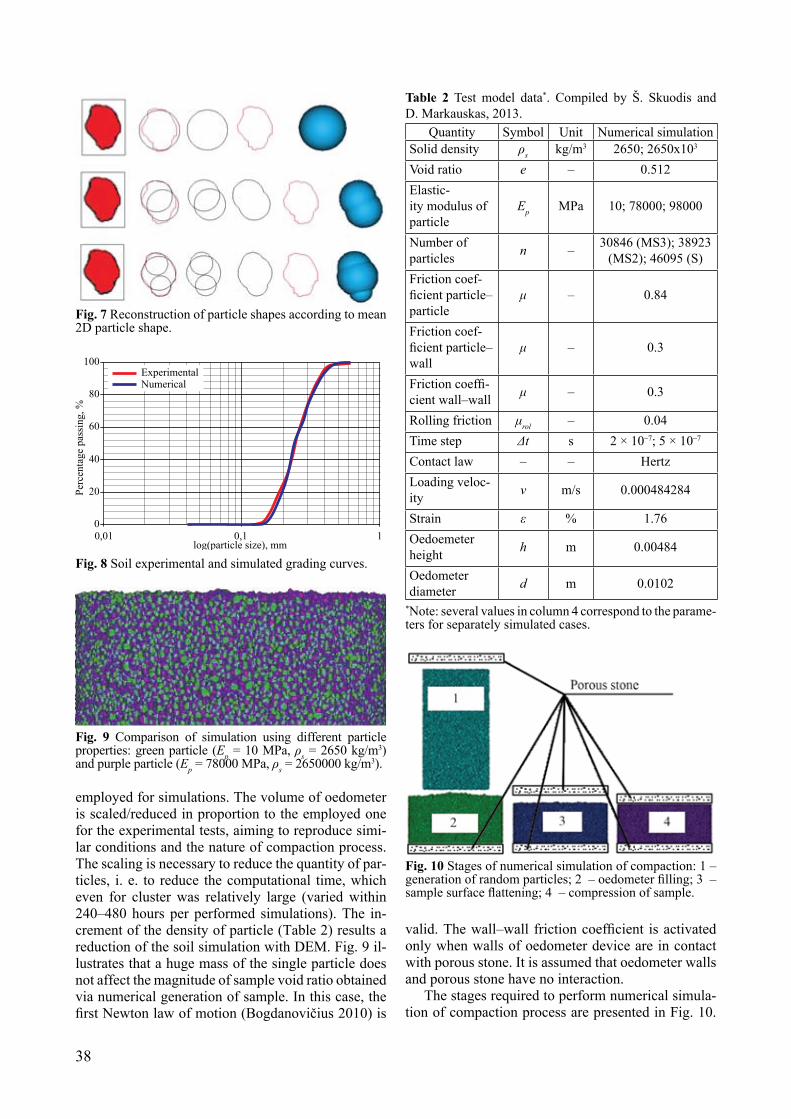
The main reason of choosing DEMMAT code to simulate the soil compression tests is a possibil-ity to run calculations in a cluster (http://www.vilkas.vgtu. lt). The cluster ensures an employment of large computational capacities, necessary to simulate the 3D compaction processes in particular. When using the cluster, the oedoemeter volume filled by simulat-ed particles is separated into four pieces, and the cal-culations are performed by separate computers cor-responding the each piece (Fig. 6). When a particle during compaction (i.e. repositioning) process moves from one neighbour piece to another one, then all the calculations corresponding the particle are done by the another computer. For this reason, all computers at each time step are calculating different quantities of particles.
Three different particle shapes (soil grain sub-scribed as sphere (S), soil grain subscribed with 2 spheres (MS2), soil grain subscribed with 3 spheres (MS3)) to reproduce the sand sample have been employed for simulations (Fig. 7) aiming to inves-tigate the influence of morphology parameters for ap-proaching the actual compression process to the one obtained via testing. Three samples from the above listed mean shapes have been numerically generated to correspond the obtained soil-grading curve (Fig. 8) to match the one obtained via sieve test of investi-gated soil.
The test process and parameters for simulations are presented in Table. 2. The actual Young’s mod-ulus Eoed = 200 GPa for oedometer volume parts is
Fig. 5 Universal oedometer apparatus ADS 1/3 (Wille Geotech Group, 2010).
Fig. 6 An example of simulation process with cluster.
38
employed for simulations. The volume of oedometer is scaled/reduced in proportion to the employed one for the experimental tests, aiming to reproduce simi-lar conditions and the nature of compaction process. The scaling is necessary to reduce the quantity of par-ticles, i. e. to reduce the computational time, which even for cluster was relatively large (varied within 240–480 hours per performed simulations). The in-crement of the density of particle (Table 2) results a reduction of the soil simulation with DEM. Fig. 9 il-lustrates that a huge mass of the single particle does not affect the magnitude of sample void ratio obtained via numerical generation of sample. In this case, the first Newton law of motion (Bogdanovičius 2010) is
valid. The wall–wall friction coefficient is activated only when walls of oedometer device are in contact with porous stone. It is assumed that oedometer walls and porous stone have no interaction.
The stages required to perform numerical simula-tion of compaction process are presented in Fig. 10.
Fig. 9 Comparison of simulation using different particle properties: green particle (Ep = 10 MPa, ρs = 2650 kg/m3) and purple particle (Ep = 78000 MPa, ρs = 2650000 kg/m3).
Fig. 8 Soil experimental and simulated grading curves.
Fig. 7 Reconstruction of particle shapes according to mean 2D particle shape.
Table 2 Test model data*. Compiled by Š. Skuodis and D. Markauskas, 2013.
Quantity Symbol Unit Numerical simulationSolid density ρs kg/m3 2650; 2650x103
Void ratio e – 0.512Elastic-ity modulus of particle
Ep MPa 10; 78000; 98000
Number of particles n – 30846 (MS3); 38923
(MS2); 46095 (S)Friction coef-ficient particle–particle
μ – 0.84
Friction coef-ficient particle–wall
μ – 0.3
Friction coeffi-cient wall–wall μ – 0.3
Rolling friction μrol – 0.04Time step Δt s 2 × 10⁻⁷; 5 × 10⁻⁷
Contact law – – HertzLoading veloc-ity v m/s 0.000484284
Strain ε % 1.76Oedoemeter height h m 0.00484
Oedometer diameter d m 0.0102
*Note: several values in column 4 correspond to the parame-ters for separately simulated cases.
Fig. 10 Stages of numerical simulation of compaction: 1 – generation of random particles; 2 – oedometer filling; 3 – sample surface flattening; 4 – compression of sample.

39
The stages 1–3 are the preparatory ones, each re-quiring time-consuming stage–by–stage solutions of complex problems. Note that the stage 1 results random position and orientation of particles. The sur-face flattening is simulated by deleting the unneces-sary particles. The heights of samples of stage 3 and stage 4 differ insignificantly as compressions process yields small strain magnitude of 1.76 % (the same as in physical test). The vertical stress applied on top of porous stone is computed by dividing the sum of con-tact normal forces to the area of porous stone.
rESuLTS
The influence of scaling factor via different magni-tudes of Young’s modulus (Ep) of particles to simu-late the compaction curve (reaching the same vertical strain magnitude of 1.76 % obtained by experimen-tal test) has been analysed via performed simula-tions. As for example, Fig. 11 shows DEM simu-lation process of sample compression using discrete model of particles, created from three spheres (MS3) for Ep = 10 MPa. One can find in Fig. 11 that verti-cal stress (of top porous stone) σ = 1.93 kPa is very small to reach the same strain magnitude as in physi-cal experiment (corresponding σ = 400.0 kPa. Despite the good matching of the compression curve with the experimental test, one must emphasize that it does not reproduce the actual process, i.e. the nature of re-organisation of particles during compaction process. An analysis of the simulated process yields that parti-cles have a very high overlap (mean particle overlap is ε = 5.28·10-6 m) on each other during compaction.
Fig. 11 Vertical stress versus strain, soil of MS3 particles (Ep = 10 GPa).
Therefore, it corresponds a case of large elastic de-formations and a small amount of rearrangements that is in contrary of actual compaction processes prescribed in principal by a repositioning of particles and only infini-tesimally small elastic deformations of particles. This, as well as many other performed numerical simulations for other magnitudes, has yielded that applications of Ep
below 10.0 MPa in concert with the relevant reduced loading stress magnitude is essentially time consuming, problematic, and non-efficient and the hardly handled approach aiming to “catch” the nature of the actual com-paction process via repositioning of particles.
The identified minimum magnitude of Young’s modulus for single particle is Ep = 78.0 GPa. This magnitude ensures only infinitesimally small overlaps of particles during compaction process. The verti-cal strain magnitude of 1.76 % is reached for vertical stress σ = 327.03 kPa for this magnitude, versus the 400.0 kPa corresponding the experimental test one (the difference comparing with test is 18.2 %). The com-paction curve for this case is presented in Fig. 12.
Fig. 12 Vertical stress versus strain (MS3, Ep = 78 GPa).
The analogous simulations of soil compaction have been performed also for larger Ep magnitudes. The view of compaction curve for the actual Young’s modulus of particle Ep = 78.0 and 98.0 GPa, is pre-sented in Fig. 13. The criterion for choosing the 78.0 or 98.0 GPa magnitudes is based by the reference (www.almazoptics.com/Quartz.htm) where given for quartz the Young’s modulus are 76.5 GPa and 97.2 GPa for perpendicular directions, respectively. The constant isotropic parameter versus anisotropic pa-rameters of elasticity modulus has been chosen for the reason that it has no principle influence for repo-sitioning process of particles.
Simulation of the compaction process for fixed strain magnitude (ε = 1.76 %) and Ep = 98.0 GPa, has resulted the vertical stress σ = 374.31 kPa, that is 6.4 % less than the obtained one from experimental test. Note, that almost no overlap between particles for both magnitudes of Ep is identified, they corre-spond the vertical stress magnitudes, close to each other and to the test one. One must also keep in mind that numerical simulation represents an ideal and scaled model of sample, while the testing device load distribution method to sample, the actual rigidity of parts and the measurement method also contributes some inaccuracy in determining of exact values.
Only after when the magnitudes of Ep, ensuring the actual compaction process are identified, one can

40
investigate the influence of particle shape aiming to obtain the compaction curve close to that of the test. Fig. 14 presents the compaction curves from test (ex-periment) one and the simulated ones for Ep = 78 GPa for three different discrete models of particles (see Fig. 7), namely: sphere (S) particles, 2 sphere (MS2) particles and 3 sphere (MS3) particles.
One can find that the shapes of compaction curves, including the stress jumps observed in Figs. 12–14, corresponding to the test and the numerical simula-tion results differ, but they all lead to the same strain magnitude at the end of compaction process. Note, that simulated compaction time is not actual (as in test), but scaled for reducing computational resources.
The magnitude of elasticity modulus of particle Ep influences the velocity of repositioning of particles. The cases of Ep = 78.0 GPa and Ep = 98.0 GPa have been analysed. The repositioning process of particles of a higher elasticity modulus (Ep = 98.0 GPa) is faster than that for less stiff particles (Ep = 78.0 GPa). When a repositioning velocity of particles is faster that of the porous stone (transmitting the top loading stress to sample), it results the stress jumps recorded by simu-lated compaction curve. An example of this phenom-enon for a single particle is illustrated in Fig. 15. The jumps usually appear until the assembly of all particles goes to a final repositioning. The repositioning dis-
tance of particles is very small comparing with the one for the vertical stress magnitudes above ~200 kPa, id. est. after a major reduction of void volume in previ-ous loading stages. One must note that the stress jumps can be recognised also in experimental testing. How-ever, these stress jumps are not so dramatically high, because loading velocity of porous stone of oedometer (the pressure increment velocity is constrained due the technical capacities of device) is much lower than the one realised via numerical simulation.
Fig. 15 Repositioning phases: (a) particle is in contact with force (F) established by porous stone; and (b) temporary gap between porous stone and new particle position.
A more detailed description of the observed stress jumps in simulated compaction curves (see Fig. 13) is presented below for the case of MS3 particles of Ep = 98.0 GPa (Fig. 16). Find that the stress jump appears for the strain ε ~0.014. That means that re-positioning of particles is very high at this strain. The view of reorganisation of particles of compaction process via the vectors of velocities for strain incre-ments, corresponding the 3-time step calculations for strain magnitudes ε = 0.01385; 0.01391 and 0.01396 (i.e. in vicinity of ε ~0.014) are given in Fig. 17.
One can find from Fig. 17 that major repositioning of particles is observed near the top of sample (main concentration of velocity vectors). A small quantity (volume) of the particles was cut from simulated oed-ometer test sample for more detailed investigation of repositioning of particles. The repositioning of particles of this volume (Fig. 18) has been analysed for three different strains at the stress jump vicinity (see Fig. 16 and 17).
Having performed the analysis of views in Fig. 18, one can conclude, that the main repositioning amount is in vicinity of the top of a sample, and less amount of repositioning of particles (especially of larger size ones) is detected per remaining height of sample. One can state that all sample particles work as an assem-bly. Even if only few particles change this position, it causes the subsequent reorganisations of all remain-ing particles. The character of repositioning process has a high influence for total vertical stress magnitude on top of the sample. One must note that quantity of
Fig. 13 Vertical stress versus strain: 1 – MS3, Ep = 78.0 GPa; 2 – MS3, Ep = 98.0 GPa.
Fig. 14 Vertical stress versus strain curves of experimental test (1) and simulated (Ep = 78.0 GPa) for spherical (2), 2–sphere (3) and 3–sphere (4) discrete models.

41
particles has a significant influence on the simulated vertical stress magnitude on top of the sample and on the character of reorganisation of particles as well. Therefore, ten rows of particles of sample height were found to be a minimum one for the analysis of the compaction nature.
Discretization of sand grain by maximum three spheres is compatible only from 2D view morphol-ogy analysis results. If the grain discrete model is cre-ated from larger number of spheres, e. g. five spheres,
the particle shape conforms only one projection (2D model), while in other projections (3D model) the shape will differ (Fig. 19).
The deformation modulus E of a soil sample can be calculated from the stress–strain curve. The secant soil deformation modulus has been calculated using the formula: E = (Δσ/Δε)β, where β for sand is equal to 0.8 (Statkus, Martinkus 2013). Comparison of secant deformation modulus magnitudes calculated from compaction curves are given in Fig. 20. The results given in Fig. 20 clearly show, that particle shape has small influence for secant soil deformation modulus in case of high magnitude of Young’s modulus (Ep = 78 GPa) of particle. However, in separate cases when eg. the process of deformation (variation of deforma-tion modulus E versus different stages of loading) is necessary for considering, one must choose more complex discrete model of particle to reproduce the actual stress-strain curve (see Fig. 14).
concLuSIonS
The numerical simulation of sand compressibility via DEM techniques is powerful and efficient method. It should be emphasised, that actually it is the only available tool to reproduce and describe the mecha-nism of actual processes for granular strata, so far. It allows identify proper soil response values employed in engineering practice. However, it requires deep knowledge and skills in geotechnical engineering, DEM modelling, laboratory testing, analysing and validating of the obtained results for identifying the
Fig. 19 Particle shape reconstruction.
Fig. 16 Stress jump detailing during compression simula-tion.
Fig. 17 Velocity vectors: green – ε = 0.01385; blue – ε = 0.01385; yellow – ε = 0.01385.
Fig. 18 Simulated repositioning of particles at the different strains: (a) all simulated particles of oedometer sample; (b) cut out small volume of particles of oedometer sample; and (c) cut out particles repositioning at the stress jump when ε = 0.01385; 0.01391 and 0.01396.
Fig. 20 Deformation modulus from test and simulations results: (1) experimental test; (2) MS3 of Ep = 78 GPa; (3) MS3 of Ep = 98 GPa; (4) Spherical particle of Ep = 78 GPa; and (5) MS2 of Ep = 78 GPa.

42
governing factors, conditioning the nature of com-pressibility. These factors can be divided into two groups, namely: first, those related to soil behaviour and second, those related to testing and measurement procedures and inaccuracies/peculiarities of testing and numerical modelling.
The current research concentrated on detailed investigation of several of the factors met in both groups, their contribution in modelling of the com-paction process. The main findings, conclusions and future trends and perspectives are listed below:
The influence of discretised shape of particles is less sensitive versus Young’s modulus of particle for determining the soil secant deformation modulus. For determining the magnitudes via DEM close to the test one, one must employ the large magnitudes of Young’s modulus of particle, approaching the ac-tual one (Ep = 78~98 GPa). In this case, simulation time increases significantly, comparing the reduced (scaled) one, but it ensures the actual repositioning of particles during compaction process.
A simultaneous “fictitious” increment of particle density and keeping the real Young’s modulus of par-ticle is amongst the tools to save the computational resources. It allows an escaping of high overlapping (id. est. large elastic deformations of separate par-ticles), which are not met in the actual compaction process.
One cannot arbitrarily reduce the number of par-ticles aiming to save computational resources, as the actual interaction of soil sample with oedometer vol-ume (boundary conditions) as well as the reorganisa-tion of particles could be not relevant for reproducing the test. The “rational” minimal member of particles for simulation could be a trend for further investiga-tions.
The discrete models of sand grains were created basing on 2D SEM view analysis. This approach, re-ducing the efforts, comparing with that of 3D analysis is not general, but sufficient in investigated case as related with “quite regular” natural shape of typical Klaipėda environs sand grains. Surely, the analysis of other types of sand grains could lead for neces-sity of 3D view analysis and the necessity of creation of discrete models of particles from larger number of spheres. An employment of multi-spherical particles increases significantly computational resources; there-fore, possibilities to reduce them should be analyzed and properly validated with the tests, e.g. applying smaller number of spheres for creating discrete model of particle in concert with a relevant “correction” of friction properties and/or applying other techniques. This approach also can be perspective for further in-vestigations.
The influence of the creating discrete models for each fraction versus the mean one for all fractures
should be investigated in future. Due to experience of authors, the peculiarities of testing device, both in transmitting the loading to soil sample, gaps, rigidity of device parts, measurement peculiarities, etc. also contribute the accuracy of testing, therefore should be evaluated in mathematical model of the process. The influence of the above-mentioned factors, contribut-ing the accuracy of numerical modelling is a future trend.
Acknowledgements
The authors express their gratitude to Dr. Lumir Mica (Brno), Dr. Krzystof Szarf (Gdańsk) and Dr. Petras Šinkūnas (Vilnius) for useful remarks and valuable comments made on the manuscript. The equipment and infrastructure of Civil Engineering Research Centre of Vilnius Gediminas Technical University were employed for this investigation.
references
Abbas, A., Masad, E., Papagiannakis, T., Shenoy, A., 2005. Modelling asphalt mastic stiffness using discrete element analysis and micromechanics-based models. Interna-tional Journal of Pavement Engineering 6 (2), 137–146. http://dx.doi.org/10.1080/10298430500159040
Amšiejus, J., Kačianauskas, R., Norkus, A., Tumonis, L., 2010. Investigation of sand porosity via oedometric testing. The Baltic Journal of Road and Bridge En-gineering 5 (3), 139–147. http://dx.doi.org/10.3846/bjrbe.2010.20
Allonso-Marroquin, F., 2008. Spheropolygons: A new method to simulate conservative and dissipative in-teractions between 2D complex–shaped rigid bodies. EPL (Europhysics Letters) 83 (1), 14001.http://dx.doi.org/10.1209/0295-5075/83/14001
Arasan, S., Akbulut, S., Hasiloglu, A. S., 2011. Effect of particle size and shape on the grain size distribution us-ing Image analysis. International Journal of Civil and Structural Engineering 1 (4), 968–985.
Balevičius, R., Džiugys, A., Kačianauskas, R., 2004. Dis-crete element method and its application to the analysis of penetration into granular media. Journal of Civil En-gineering and Management 10 (1), 3–14.http://dx.doi.org/10.1080/13923730.2004.9636280
Berg, S., Johannsmann, D., 2003. Nonlinearities in contact mechanics experiments with quartz crystal resonators. Surface Science 541 (2003), 225–233.http://dx.doi.org/10.1016/S0039-6028(03)00929-4
Blott, S. J., Pye, K., 2008. Particle shape: a review and new methods of characterization and classification. Sedi-mentology 55 (1), 31–63.
Bogdanovičius, A., 2010. Fizikos pagrindai inžinerijoje, 1 dalis: vadovėlis [Fundamentals of Physics Engineer-ing, Part 1: Handbook]. Vilnius, Technika, 340 pp. [In Lithuanian].

43
Calvetti, F., 2008. Discrete modelling of granular materials and geotechnical problems. European Journal of Envi-ronmental and Civil Engineering 12 (7–8), 951–965. http://dx.doi.org/10.1080/19648189.2008.9693055
Cavarretta, I., 2009. The influence of particle characteris-tics on the engineering behavior of granular materials. PhD thesis. London, London Imperial College, 420 pp.
CEGEO, Saint-Cyr, B., Szarf, K., Voivret, C., Azéma, E., Richefeu, V., Delenne, J.–Y., Combe, G., Nouguier-Lehon, C., Villard, P., Sornay, P., Chaze M., Radjaï, F., 2012. Particle shape dependence in 2D granular media, EPL (Europhysics Letters) 98 (4), 44008.
Charpentier, I., Sarocchi, D., Rodriguez Sedano, L. A. 2013. Particle shape analysis of volcanic clast sam-ples with the Matlab tool MORPHEO. Computers & Geosciences 51, 172–181.http://dx.doi.org/10.1016/j.cageo.2012.07.015
Chen, Y., Zhou, Q., 2012. A scale–adaptive DEM for multi-scale terrain analysis. International Journal of Geographical Information Science (2012), 1–20.
Cho, G., Dodds, J., Santamarina, J., 2006. Particle shape effects on packing density, stiffness and strength: natural and crushed sands. Journal of Geotechnical and Geoenvironmental Engineering 132 (5), 591–602.http://dx.doi.org/10.1061/(ASCE)1090-0241-(2006)132:5(591)
Cundall, P. A., Strack, O. D. L., 1979. A discrete numerical model for granular assemblies. Geotechnique 29, 47–65. http://dx.doi.org/10.1680/geot.1979.29.1.47
Dundulis, K., Gadeikis, S., Gadeikytė, S., Račkauskas, V., 2006. Sand soils of Lithuanian coastal area and their geotechnical properties. Geologija 53, 47–51.
Dundulis, K., Gadeikis, S., Ignatavičius V., 2004. Kvartero nuogulų inžinerinių geologinių sąlygų formavimasis [Engineering geological conditions formation of Qua-ternary sediments]. Lietuvos gelmių raida ir ištekliai. Spec. “Litosferos” leidinys, Vilnius, 318–331. [In Lith-uanian].
Fakhri, M., Kheiry, P. T., Mirghasemi, A. A., 2012. Modeling of permanent deformation characteristics of SMA mixtures using discrete element method. Road Materials and Pavement Design 13 (1), 67–84. http://dx.doi.org/10.1080/14680629.2011.644080
Geng, Y., Yu, H. S., McDowell, G. R., 2012. Discrete ele-ment modelling of cavity expansion and pressuremeter test. Geomechanics and Geoengineering: An Interna-tional Journal 8 (3), 179–190.
Gadeikis, S., Repečka, M., 1999. Geotechnical properties of the Baltic Sea bottom sediments (Lithuanian near shore zone). Baltica Special Publication 12, 11–14.
Gudelis, V., 1992. The Baltic: Sea and Coasts. Contribu-tion of Lithuanian scientists. Science, Arts and Lithu-ania 2–3, 10–18.
Gulbinskas, S., Trimonis, E., 1999. Distribution and com-position of bottom sediments on the underwater slope at the Lithuanian coast of the Baltic Sea. Baltica Spe-cial Publication 12, 32–37.
Yohannes, B., Tan, D., Khazanovich, L., Hill, K. M., 2013.
Mechanistic modelling of tests of unbound granular materials. International Journal of Pavement Engi-neering (2013), 1–15.
Jasevičius, R., Tomas, J., Kačianauskas, R., 2011. Simulation of normal impact of ultrafine silica par-ticle on substrate. Particulate Science and Tech-nology: An International Journal 29 (2), 107–126. http://dx.doi.org/10.1080/02726351.2010.511662
Kavrus, A., Skuodis, Š., 2012. Smėlinių gruntų morfologinių parametrų nustatymas [Investigation of morphological parameters for sand soil]. In Proceedings of the 15th Conference for Junior Researchers “Science – Future Lithuania”, 22–24 May, Vilnius, Lithuania, 1–8. [In Lithuanian].
Khanal, M., Tomas, J., 2008. Interparticle collision of particle composites–finite and discrete element simu-lations. Particulate Science and Technology: An In-ternational Journal 26 (5), 460–466.http://dx.doi.org/10.1080/02726350802367720
Kruggel-Emden, H., Rickelt, S., Wirtz, S., Scherer, S., 2008. A study on the validity of the multi-sphere Discrete Element Method. Powder Technology 188, 153–165. http://dx.doi.org/10.1016/j.powtec.2008.04.037
Krumbein, W., Slos, L., 1951. Stratigraphy and Sedimen-tation. A series of books in geology. San Francisco, W. H. Freeman and Co, 497 pp.
Lewandowska, J., Pilawski, M., 2012. Experiments and micromechanical modelling of a compos-ite geomaterial. European Journal of Environ-mental and Civil Engineering 16 (2), 121–140. http://dx.doi.org/10.1080/19648189.2012.667694
Lim, W. L., McDowell, G. R., 2008. A limit analysis of the kinematics of void collapse using the discrete element method. Geomechanics and Geoengineering: An Inter-national Journal 3 (1), 41–58.
Lin, J., Wu, W., 2012. Numerical study of miniature pene-trometer in granular material by discrete element meth-od. Philosophical Magazine 92 (28–30), 3474–3482. http://dx.doi.org/10.1080/14786435.2012.706373
LST EN ISO 14688–2:2007. Geotechniniai tyrinėjimai ir bandymai. Gruntų atpažintis ir klasifikavimas. 2 dalis: Klasifikavimo principai (ISO 146882–2:2004) [Geo-technical investigation and testing – Identification and classification of soil – Part 2: Principles for classifica-tion (ISO 146882–2:2004)]. LSD, 14 pp.
Luding, S., 2008. Introduction to discrete element meth-ods. European Journal of Environmental and Civil En-gineering 12 (7–8), 785–826.http://dx.doi.org/10.1080/19648189.2008.9693050
Markauskas, D., Kačianauskas R., 2006. Compacting of particles for biaxial compression test by the discrete el-ement method. Journal of Civil Engineering and Man-agement 12 (2), 153–161.
Modenese, C., Utili, S., Houlsby, G. T., 2012. A numeri-cal investigation of quasi–static conditions for granu-lar media. In Proceedings of the International Sym-posium on Discrete Element Modelling of Particulate Media, University of Birmingham, 29–30 March 2012. http://dx.doi.org/10.1039/9781849735032-00187

44
Mollon, G., Zhao, J., 2013. Generating realistic 3D sand par-ticles using Fourier descriptors. Granular Matter 15 (1), 95–108.http://dx.doi.org/10.1007/s10035-012-0380-x
Montenegro Ríos, A., Sarocchi, D., Nahmad-Molinari, Y., Borselli, L., 2013. Form From Projected Shadow (FFPS): An algorithm for 3D shape analysis of sedimen-tary particles. Computers and Geosciences 60, 98–108. http://dx.doi.org/10.1016/j.cageo.2013.07.008
Prisco, C., Galli, A., 2011. Mechanical behaviour of geo–encased sand columns: small scale experimental tests and numerical modelling. Geomechanics and Geoengi-neering: An International Journal 6 (4), 251–263.
Prušinskienė, S., 2012. Smėlio gruntų ypatumai ir jų tyrimo metodai. Mokomoji knyga [Sand soil pe-culiarities and investigation methods. Instructional book], Vilnius, Technika, 183 pp. [In Lithuanian]. http://dx.doi.org/10.3846/1314-S
Renouf, M., Dubois, F., Alart, P., 2006. Numerical inves-tigations of fault propagation and forced-fold using a non smooth discrete element method. European Jour-nal of Computational Mechanics/Revue Européenne de Mécanique Numérique 15 (5), 549–570.
Repečka, M., 1999. Quaternary sediments on the bottom surface of the south-eastern Baltic Sea. Baltica Special Publication 12, 93–98.
Roussillon, T., Piégay, H., Sivignon, I., Tougne, L., Lavi-gne, F., 2009. Automatic computation of pebble round-ness using digital imagery and discrete geometry. Com-puters and Geosciences 35, 1992–2000.http://dx.doi.org/10.1016/j.cageo.2009.01.013
Safronov, D., Nikrityuk, P., Meyer, B., 2012. Fixed–grid method for the modelling of unsteady par-tial oxidation of a spherical coal particle. Com-bustion Theory and Modelling 16 (4), 589–610. http://dx.doi.org/10.1080/13647830.2011.643242
Singh, D., Zaman, M., Commuri, S., 2012. Inclusion of aggregate angularity, texture and form in estimat-ing dynamic modulus in asphalt mixtures. Road Materials and Pavement Design 12 (2), 327–344. http://dx.doi.org/10.1080/14680629.2011.650088
Skuodis, Š., Norkus, A., Tumonis, L., Amšiejus, J., Ak-samitauskas, Č., 2013. Experimental and numerical in-
vestigation of sand compression peculiarities. Journal of Civil Engineering and Management 19 (1), 78–85. http://dx.doi.org/10.3846/13923730.2013.756164
Statkus, T., Martinkus, V., 2013. The results of correlation between cone tip resistance, push-In pressure load cells and a compression device, Science – Future of Lithu-ania 5 (5), 525–529. [In Lithuanian].
STIMAN. 2010. Structural image analysis. Moscow State University. Moscow, 156 pp.
Tafesse, S., Robison Fernlund, J. M., Sun, W., Bergholm, F., 2013. Evaluation of image analysis methods used for quan-tification of particle angularity. Sedimentology 60, 1100–1110.http://dx.doi.org/10.1111/j.1365-3091.2012.01367.x
Tong, F., Yin, J. H., 2011. Nonlinear creep and swell-ing behavior of bentonite mixed with different sand contents under oedometric condition. Marine Geo-resources and Geotechnology 29 (4), 346–363. http://dx.doi.org/10.1080/1064119X.2011.560824
Tordesillas, A., Zhang, J., Behringer, R., 2009. Buckling force chains in dense granular assemblies: physical and numerical experiments. Geomechanics and Geoengi-neering: An International Journal 4 (1), 3–16.
Tumonis, L., Kačianauskas, R., Norkus, A., Žilionienė, D., 2012. Comparison study of spherical and multi–spheri-cal particles under cyclic uniaxial compression. Journal of Civil Engineering and Management 18 (4), 537–545. http://dx.doi.org/10.3846/13923730.2012.702127
Vittorias, E., Kappl, M. Butt, H. J., 2010. Studying mechani-cal microcontacts of fine particles with the quartz crystal microbalance. Powder Technology 203 (2010), 489–502. http://dx.doi.org/10.1016/j.powtec.2010.06.011
Wille Geotec Group, 2010. Universal oedometer test de-vice ADS 1/3. Göttingen, Germany, 36 pp.
Wu, J., Collop, A., McDowell, G., 2009. Discrete element modelling of monotonic compression tests in an idea-lised asphalt mixture. Road Materials and Pavement Design 10 (supp1.), 211–232.
Zhu, H. P., Zhou, Z. Y., Yang, R. Y., Yu, A. B., 2008. Discrete particle simulation of particulate systems: A review of major applications and findings. Chemical Engineering Science 63 (23), 5728–5770.http://dx.doi.org/10.1016/j.ces.2008.08.006


![fyFkq,fu;k dk nwrkokl] ubZ fnYYkh - URM...FORMER GOOGLE CEO PLANS TO INVEST $ MILLIONS IN LITHUANIA by Arnoldas Lukošius Published on lrytas.lt 2014-05-23 15:03 “I hope to find](https://static.fdocuments.us/doc/165x107/609c64c255599d72462c1687/fyfkqfuk-dk-nwrkokl-ubz-fnyykh-urm-former-google-ceo-plans-to-invest-.jpg)