Testing and Analysis of Consolidated Sludge Samples … · Testing and Analysis of Consolidated...
65
PNNL-13341 Testing and Analysis of Consolidated Sludge Samples from the 105 K East Basin Floor and Canisters P.R. Bredt C. H. Delegard A. J. Schmidt K. L. Silvers December 1999 Prepared for Fluor Hanford Work supported by the U.S. Department of Energy under Contract DE-AC06-76RL0 1830 . . Pacific Northwest National Laboratory Richland, Washington 99352
Transcript of Testing and Analysis of Consolidated Sludge Samples … · Testing and Analysis of Consolidated...

PNNL-13341
Testing and Analysis of Consolidated SludgeSamples from the 105 K East Basin Floor andCanisters
P.R. BredtC. H. DelegardA. J. SchmidtK. L. Silvers
December 1999
Prepared forFluor Hanford
Work supported bythe U.S. Department of Energyunder Contract DE-AC06-76RL0 1830
. .
Pacific Northwest National LaboratoryRichland, Washington 99352

DISCLAIMER
This report was preparedas an accountof work sponsoredby an agencyof theUnited States Government. Neither the United States Government nor any agencythereof, nor Battelle Memorial Institute, nor any of their employees, makes anywarranty, express or implied, or assumes any legal liability or responsibility forthe accuracy, completeness, or usefulness of any information, apparatus,product, or process disclosed, or represents that its use would not infringeprivately owned rights. Reference herein to any specific commercial product,process, or service by trade name, trademark, manufacturer, or otherwise does notnecessarily constitute or imply its endorsement, recommendation, or favoring by theUnited States Government or any agency thereof, or Battelle Memorial Institute.The views and opinions of authors expressed herein do not necessarily state orreflect those of the United States Government or any agency thereof.
PACIFIC NORTHWEST NATIONAL LABORATORYoperatedbyBATTELLE
for theUNITED STATES DEPARTMENT OF ENERGY
under ContractDE-AC06-76RLO1830
Printed in the United States of America
Available to DOE and DOE contractors from theOffice of Scientific and Technical Information,
P.O. Box 62, Oak Ridge, TN 37831-0062;ph: (865) 576-8401fax: (865) 576-5728
email: rworts’~ladonis.osti.zov
Available to the public from the National Technical Information Service,U.S. Department of Commerce, 5285 Port Royal Rd., Springfield, VA 22161
ph: (800) 553-6847fax: (703) 605-6900
email: orders@ ntis.fedworld.govonline ordering: http://\v\v\v.tlfis. gov/[)rderitlz.lltnl
@ This documentwasprintedon recycledpaper.(8/00)

DISCLAIMER
Portions of this document may be illegiblein electronic image products. Images areproduced from the best available originaldocument.

Abstract
The testing reported here was performed on K East Basin consolidated sludge samples to generate dataneeded for the evaluation and design of the systems that will be used to disposition the K Basin sludge toT-Plant for interim storage. The tests were conducted by Pacific Northwest National Laboratory fromMay through November 1999 under the direction of the Spent Nuclear Fuel (SNT) Project. The samplesused in the work discussed here were collected by the SNF Characterization Project from the KE Basinfloor and canisters during March and April 1999. These samples (3 from the floor and 3 from thecanisters) were shipped to the storage pool at the Postirradiation Testing Laboratory (327 Building) andlater transferred to the PNNL Radiochemical Processing Laboratory (325 Building), where they wererecovered for testing and analysis.
Testing activities presented in this report include particle size measurement via wet sieving, sludgesettling and sludge density measurements, sludge shear strength measurement, and measurement ofsludge dissolution enthalpy to ascertain the uranium metal content of the sludge. Section 1.0 provides thesummary and conclusions to date. Section 2.0 describes the consolidated sample container system, thesample collection and transfer, inspection, and recovery of the samples for testing. Section 3.0 describesthe testing methodologies and presents the results and analyses.
I
...111
------ ,<,,.. ‘, ...,., -.-.
Contents
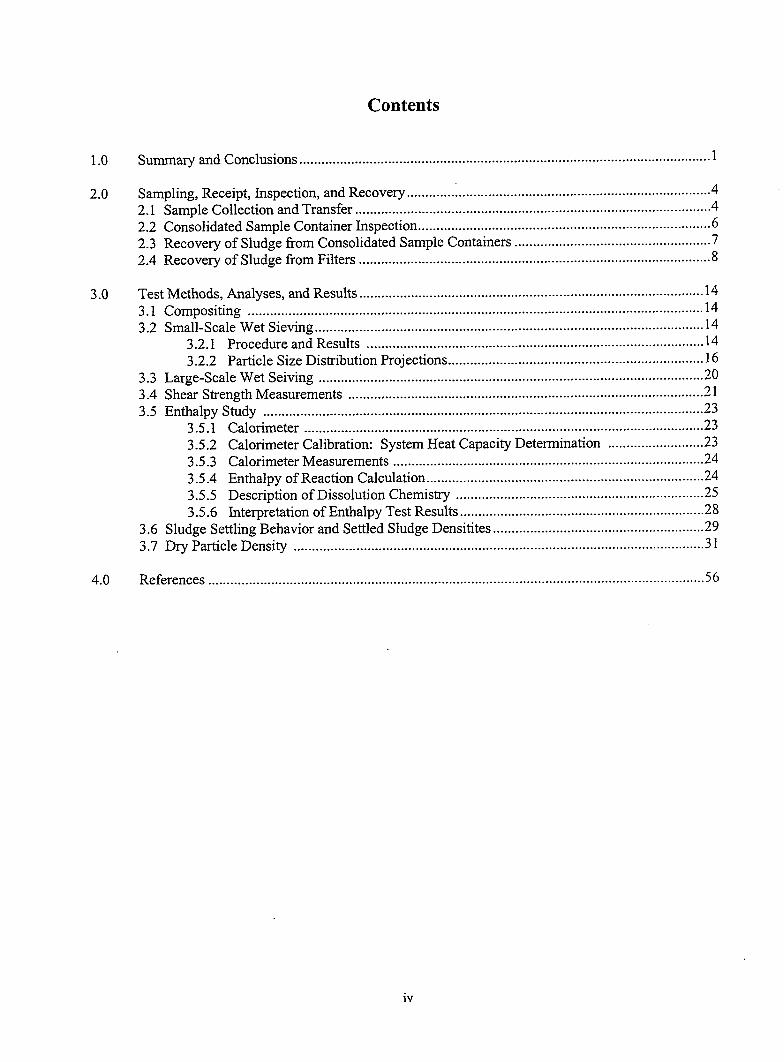
1.0 Summary and Conclusions ...............................................................................................................1
2.0 Sampling, Receipt, Inspection, and Recove~ ..................................................................................42.1 Sample Collection and Transfer ................................................................................................4
2.2 Consolidated Sample Container Inspection ...............................................................................62.3 Recovery of Sludge from Consolidated Sample Containers .....................................................72.4 Recovery of Sludge from Filters ...............................................................................................8
3.0 Test Methods, Analyses, and Results .............................................................................................l43.1 Compositing .................................................................#........................................................l43.2 Small-Scale Wet Sieving .........................................................................................................l4
3.2.1 Procedure and Results ...........................................................................................l43.2.2 Particle Size Distribution Projections ..................................................................... 16
3.3 Large-Scale Wet Seiving ........................................................................................................2o3.4 Shear Strength Measurements ................................................................................................2l3.5 Enthalpy Study .......................................................................................................................23
3.5.1 Calorimeter ............................................................................................................233.5.2 Calorimeter Calibration: System Heat Capacity Determination ..........................233.5.3 Calorimeter Measurements ....................................................................................243.5.4 Enthalpy of Reaction Calculation ...........................................................................243.5.5 Description of Dissolution Chemistry ...................................................................253.5.6 Interpretation of Enthalpy Test Results ..................................................................28
3.6 Sludge Settling Behavior and Settled Sludge Densitites .........................................................293.7 Dry Particle Densi~ ...............................................................................................................3l
4.0 References ......................................................................................................................................56
iv

Figures
1
2
3
4
5
6
7
8
9
10
11
12
13
14
15
16
17
18
19
Solids Retained on the Filter fi-omCanister KC-2 ...........................................................................9
Solids Retained on the Filter from Canister KC-3 .........................................................................l O
Solids Retained on the Filter from Canister KC-4 .........................................................................l 1
Solids Retained on the Filter from Canister KC-5 .........................................................................l2
Solids Retained on the Filter from Canister KC-6 .........................................................................l3
Small-scale Sieving of Material fi-omKC-1 ...................................................................................33
Small-scale Sieving of the KC-2/3 Composite ...............................................................................34
Small-scale Sieving of Material fi-omCanister KC-3 ....................................................................35
Small-scale Sieving of Material from Canister KC-4 ....................................................................36
Small-scale Sieving of Material from Canister KC-5 ....................................................................37
Comparison of Sieving Results for K Basin Sludges and Consolidated Sludgeon a Dry Weight Basis ....................................................................................................................38
Weight Percent Particle Size Distribution for K East Fueled Canister and Floor SludgeWithout Consolidated Sludge Samples ..........................................................................................39
Comparison of Volume Percent and Weight Percent Particle Size Distributionsfor K East Basin Consolidated Samples .........................................................................................4O
Weight Percent Particle Size Distribution for K East Fueled Canister and Floor SludgeIncluding Consolidated Sludge Samples ........................................................................................4l
Volume Percent Particle Size Distribution for K East Fueled Canister and FloorSludge Without Consolidated Sludge Samples ..............................................................................42
Volume Percent Particle Size Distribution for K East Fueled Canister and FloorSludge Including Consolidated Sludge Samples ............................................................................43
Calorimeter in the Fume Hood During Calibration ........................................................................44
Temperature Versus Time for Addition of Stainless Steel Coupons to Calorimeter ......................45
Insoluble Residue from the >250 pm Fraction of the KC-2/3 Sludge CompositeAfter Treatment in 16 ~ Nitric Acid at -25°C ..............................................................................46
v
- m., , . . . . . ---l-—r,.K-., .,., ..,...,-, ---?.>- :. f i.-,.:,.v,mp—%--~,~,..../....’.. . ...>....< ., :x-,.. . . . . . . , ., . .. . .. . . . . . .<./; ,.: ,.. . .. . . . . ,’--. -.— .-

—
Figures (continued)
20 Insoluble Residue from the >250 pm Fraction of KC-5 After Reaction with16 ~ Nitric Acid at -25°C. ............................................................................................................47
21 Insoluble Residue from the >250 pm Fraction of the KC-4 Sludge CompositeAfter Treatment in 16 ~ Nitric Acid at -25°C ..............................................................................48
22 Temperature Versus Time for Dissolution of Samples fi-omKC-4 P250 ......................................49
23 Temperature Versus Time for Dissolution of Samples fi-omKC-5 P250 ......................................50
24 Temperature Versus Time for Dissolution for First Two Samples fi-omKC-2/3 P250 .................51
25 Temperature Versus Time for Dissolution of Final Samples from KC-2/3 P250 ..........................52
26 Volume Percent Settled Solids Versus Time for K East Basin Consolidated Samples ..................53
27 Settling Velocity for K East Basin Consolidated Sludge ...............................................................54
28 Samples from Settling S~dies ........................................................................................................55
vi
1
2
3
4
5
6
7
8
9
10
11
12
13
14
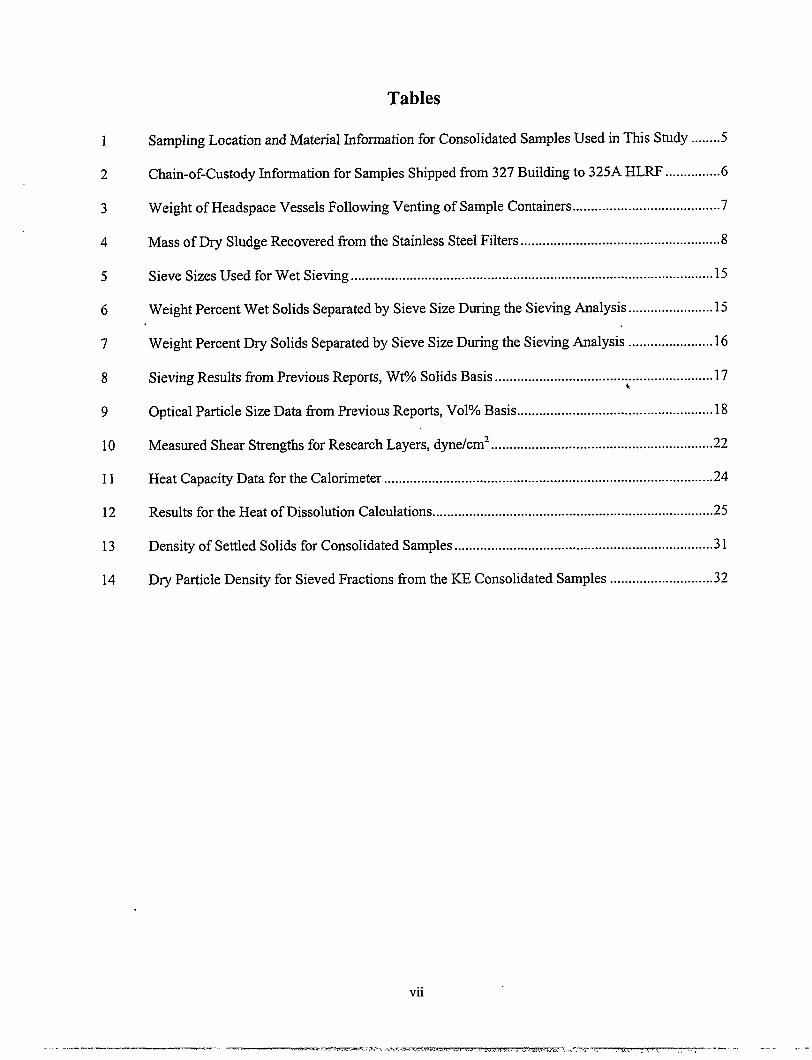
Sampling Location and Material Information for Consolidated Samples Used in This Study ........5
Chain-of-Custody Information for Samples Shipped from 327 Building to 325A HLRF ...............6
Weight of Headspace Vessels Following Venting of Sample Containers ........................................7
Mass of Dry Sludge Recovered from the Stainless Steel Filters ......................................................8
Sieve Sizes Used for Wet Sieting ..................................................................................................l5
Weight Percent Wet Solids Separated by Sieve Size During the Sieving Analysis .......................15.
Weight Percent Dry Solids Separated by Sieve Size During the Sieving Analysis .......................16
Sieving Results from Previous Reports, Wt% Solids Basis .................................... ......................l7
Optical Particle Size Data from Previous Reports, VOIYOBasis .....................................................l8
Measured Shear Strengths for Research Layers, d~e/cm2 ............................................................22
Heat Capacity Data for the Calorimeter .........................................................................................24
Results for the Heat of Dissolution Calculations ............................................................................25
Density of Settled Solids for Consolidated Samples ......................................................................3l
Dry Particle Density for Sieved Fractions from the KE Consolidated SampIes ............................32
vii
-. . ..-..- _____ --=*. -:7... .+-.. - Z,.-.-a ....-..: ,,~,,, J.,

1.0 Summary and Conclusions
This report describes testing performed on KE Basin consolidated sludge samples to generate data neededfor the evaluation and design of the systems that will be used to disposition the K Basin sludge to T-Plantfor interim storage. The Pacific Northwest National Laboratory (PNNL) conducted the work in Maythrough November 1999 under the direction of the Spent Nuclear Fuel (SNF) Sludge Project. The SNFCharacterization Project collected six samples for these analyses and tests from the ICEBasin floor(3 samples) and fuel canisters (3 samples) in March through April 1999 using a consolidated samplingtechnique. These samples were then shipped to the storage pool at the Postirradiation Testing Laboratory(327 Building) and later transfemed to and recovered at PNNL’s Radiochemical Processing Laboratory(325 Building).
After sample recovery, a series of tests were conducted to provide time-sensitive data required tounderstand the characteristics of the consolidated sludge samples that are important to developing thesystems for shipping and storing the K Basin sludge in T-Plant. Because the uranium metal component(and other reactive components) in the sludge samples undergoes oxidation reactions, the composition ofthe sludge changes with time. In the radiological shielded processing cells within the 325 Building, thesludge samples are stored at about 30”C, while the sludge in the K Basin pools is maintained at about10°C. This temperature differential, as well as sludge handling, can result in degradation of the samplesover time. This aging can affect many of the properties of the sludge. As a result, for the testing initiatedin FY 1999, efforts were focused on the most important time-dependent testing. These testing activitiesinclude particle size measurement via wet sieving; sludge settling and sludge density measurements;sludge shear strength measurement; and the measurement of sludge dissolution enthalpy to ascertain theuranium metal content of the sludge. The tests were performed in accordance with the direction providedin the Sample and halysis Plan for the consolidated sludge samples (Baker et al. 1999). The results ofthese tests are summarized below.
Consolidated Sludge Sample Receiving and Recovery
Sludge containers were transferred to the 325 Building’s High Level Radiochemistry Facility (325AHLRF) between May 7 and May 13, and were inspected for indications of excessive gas generationduring shipping. No evidence for excessive gas generation was observed. Samples were then recoveredfrom the large consolidated sample containers (10.3 L) into smaller, more convenient containers. Toprovide the necessary quantities of sludge for the testing activities, two consolidated sludge samples,collected from the KE fuel canisters, were combined into a composite sample (consolidated canistersludge composite).
Wet Sieving
Sieving is a technique that uses meshes or perforated membranes to separate particles within a materialinto unique particle size fractions. In wet sieving, an aqueous fluid is introduced on top of the material.The fluid aids in the transport of the particles from one mesh to the next, as well as preventing theparticles from drying out. For the consolidated sludge samples, two sieving campaigns were conducted:small-scale sieving to characterize the particle size distribution, and large-scale sieving to generatesufficient quantities of test material. In addition, dry particle density measurements were made on someof the particles horn the discrete fractions of the sieved sludge.

. .
Green and yellow particles were observed in all of the samples. During work on samples collected fromprevious KE Basin characterization campaigns, these colors were associated with samples containing highlevels of uranium oxide. Sieving of one of the consolidated floor sludge samples (KC-5) revealed organicion exchange resin beads on several of the sieves. Since sample KC-5 was collected from locations inthe basin that were away from both highly corroded fiel and away from organic ion exchange beads, thepresence of organic ion exchange resin beads was not anticipated.
The dry particle density measurements showed that, for the canister composite sludge, particle densitydistinctly increases with decreasing particles size (i.e., the smaller particles are more dense). The findingthat dry particle density changes with particle size is very significant. In a previous report on the particlesize distribution of the various K Basin sludge types (Bredt et al. 1999), it was assumed that the sludgedensity was uniform across all particle size ranges.
Results from the wet sieving and particle density measurements were compared and integrated withprevious particle size distribution data. In the previous analysis (Bredt et al. 1999), sludge from the KEfuel canisters was found to be relatively coarse material with roughly50wtYobelow710 ~m. However,the consolidated canister sludge composite was much finer, with approximately 90 wt’%. below 500 pm.While one of the consolidated floor sludge samples closely agreed with the previous floor sludge data(-92 wt%, below 500 pm), sample KC-5 is much coarser, with only 46 wt% below 500 ~m. In summary,integrating the new data with the earlier data leads to revised particle size distribution curves, in which thefloor sludge appeared coarser and the canister sludge appeared finer than previously projected.
Results from the analysis of the sieving data are being incorporated into a revision of the K BasinMaterials Design Basis Feed Document (Pearce et al. 1998).
Settling Rates and Settled Sludge Density Measurements
The consolidated sludge samples were place in graduated cylinders, mixed with K Basin water, andallowed to settle. The settling rates and the densities of the settled sludge were measured. The settledsludge density measurements will be used to refine KE Basin sludge invento~ projections. Settling rateinformation provides insight into what can be expected in the K Basin pool, in terms of water clarity,when fiel canisters and sludge are moved.
The settling rate and settled sludge density data from the consolidated sludge samples agree reasonablywell with previous data from KE floor sludge samples (Makenas et al. 1996) and KE canister sludgesamples (Makenas et al. 1997).
For sample KC-2/3, the settled sludge density of particles greater than 250 pm was essentially identical tothe settled sludge density of the particles less than 250 pm. This finding was unexpected, as dry particledensity was shown to change significantly with particle size.
Shear Strength Measurements
The sludge shear strength was measured to provide information on how much shear will be required tomobilize the sludge for transport and to understand how the sludge sample will retain and release gasbubbles. Reactive components in the sludge (e.g., uranium metal) generate gas, which is primarily made
2

up of hydrogen. Radiolysis of water will also generate some hydrogen gas. Depending upon the shearstrength of the sludge, the gas bubbles will either quickly pass through the sludge and be released, or thegas bubbles will be retained in the sludge and be released episodically. An additional possibility is thatspanning gas bubbles can form and push the sludge up the storage vessel as a plug. The gas retention andgas release behavior of the sludge will affect the design of the systems used to transport and store thesludge in T-Plant.
Results from the shear strength measurements suggest that K Basin sludges can form spanning bubblesduring storage unless steps are taken to mitigate this hazard. The shear strength measurement can also beused to develop surrogates for testing bubble mitigation design features.
Dissolution Enthalpy Measurements
Fractions of sludge samples containing particles greater than 250 pm (designated as P250) were placed ina calibrated calorimeter and dissolved in nitric acid. The enthalpy of the dissolution was determined andcompared with known enthalpies of dissolution of uranium metal and U02 in nitric acid. The measuredenthalpies of the samples were compared with the known enthalpies and used to estimate uranium metalcontent of the sludge samples. The uranium metal content and the particle size distribution of theuranium metal largely determine amount and rates of gas and heat generation within the sludge. In turn,the heat and gas generation rates affect the design and cost of the sludge transportation and storagesystems.
The measured enthalpies of reaction strongly suggest the presence of uranium metal in the P250 canistercomposite sludge (4 to 9 WtO/O uranium metal, settled sludge basis). The data do not provide evidence ofuranium metal in one of the ffoor samples, which was collected between fiel canister samples. However,for the other floor sample evaluated (KC-5 P250), collected away from the fiel canisters, the data suggestsome uranium may be present (0.7 WtO/O uranium metal, settled sludge basis). In estimating the quantityof uranium metal present, it was assumed that the sludge samples were made up entirely of uranium metaland U02. For the KE canister sludge, this is a reasonable assumption, as previous data have shown thesludge to be 80 to 90 WtO/O uranium (dry weight basis) (Makenas et al. 1997). However, previous datashow that the floor sludge is only 3 to 33 WtO/O uranium (Makenas et al. 1996). If it was assumed that70% of the floor sludge was inert in nitric acid (e.g., Si02), then the projected uranium metal content ofthe KC-5 P250 sample would be 2.3%.
3
r., —., —~. . .-, ,,, ., . . . . . .. . . . . . . . . . ... . . ,,. ——. - - — .-

2.0 Sampling Receipt, Inspection, and Recovery
This section describes the consolidated sample container system used for obtaining and shipping sludgesamples, inspections conducted when the samples were received at 325 Building, and activities conductedto recover samples from the containers. The sample containers were inspected to assess the condition ofthe samples and any gas generation during transport. Gas generation within the sample container fromthe reaction of uranium metal with water was anticipated. Previous observations with similar sludgematerial indicated that agitation of the sludge during handling and shipping can result in hydrogen gasgeneration.
2.1 Sample Collection and Transfer
The samples used for the testing discussed here were collected from the KE Basin floor and fuel canistersby the SNF Characterization Project (Table 1). The samples were collected during March and April 1999using the Consolidated Sludge Sampling System described inHecht(1999). Consolidated sample KC- 1was collected using the consolidated sludge sampling system in the “single pull” mode. A vacuum wasapplied to the head of a 10.3-L stainless steel container, drawing sludge into the container until it was fullenough to activate a check valve and stop the sampling process. In the consolidated sampling mode usedto collect the remaining samples (KC-2 through KC-6), a 5-pm stainless steel filter replaced the checkvalve, with the same vacuum technique employed to draw sludge and basin water into a 10.3-L container.In this mode, the filter causes sludge to be trapped in the canister while the excess water is returned to thebasin. Consequently, much larger amounts of sludge from several different sampling locations can beconsolidated within one 10.3-L container. This system is an economical method for providing largerepresentative sludge samples (Petersen 1999). Pitner (1999) provides a detailed discussion of thesampling process and general observations made during sludge sample collection operations.
After collection, the consolidated samples were stored in the 327 Building storage pool and shipped to the325A HLRF between May 7 and 13, 1999. Table 2 provides information listed in the chain-of-custodythat accompanied the samples to the 325 Building, along with other sampling information and theestimated mass of sludge recovered from each container. Some K Basin water also remained in thecontainer, even with the filter in place. Work conducted on these samples is documented in testinstructions and Battelle Northwest Laboratory Record Book 56479.
4

Table 1. Sampling Location and Material Information for Consolidated Samples Used in This Study
Container Material TypeSamplingLocations
KC-l(’) Canister Sludge From 4569EHighly Damaged Fuel
KC-2 Canister Sludge From 668E & w
KC-3
Highly Damaged Fuel 2229E4571E6071W
Canister Sludge From 4850WModerately Damaged Fuel 4869E
3125W2905E450E455W
KC-4LD) Floor Sludge From Between 0549Slotted Canister Barrels 4573Containing Highly 5465Damaged Fuel_
KC-5(CJ I Floor Sludge From Areas of I 4648Deep Slud~eTypically 3133Away from Highly 0548CorrodedFuel and Areaswith High ConcentrationsofIXM B;ads
Kc-6~c) Floor Sludge Containing 6758High Concentrations of
I IXM Beads I‘ Sample KC-1 was collected with the consolidated sampli
5
.-,-.. ,., ....,,..-’-. -mm= .. . -,.,..,-- ,,-,-=—. ..4 ..., ...- .,— —- ---- --
Fuel Canister Type
Mark O
Mark OMark OModifiedCo-ProductMark OMark OMark OMark OMark OMark OMark OModifiedCo-ProductModifiedCo-ProductModifiedCo-Product
Mark IIMark OModifiedCo-Product
Mark O
systemoperatedin the’. . . .
Barrel Material
Aluminum
Aluminum
Aluminum
Aluminum
StainlessSteelAluminumAluminum
Aluminum
ingle-pull”mode.D Sample KC-4 was collected from the floor of the bash, however, the samphng locabons were near Modified
Co-Product barrels.c Samples KC-5 and KC-6 were collected from the basin floor, but barrels were previously in these locations.

——
Table 2. Chain-of-Custody Information for Samples Shipped from 327 Building to 325A HLRF.The estimated amount of sludge recovered from the container is also listed.
Container
KC-1
KC-2
KC-3
KC-4
KC-5
Kc-6
‘ Estirnatet
SamplingLocations
4569E
668E &w2229E4571E6071W4850W4869E3125W2905E450E455W054945735465
464831330548
67586758
CollectionDate
4/12/99
314/993/8/993/9/993113/99
4/1/994/6/994/7/99417/994/8/994/8/993/30/993/3 1/993/3 1/99
3/29/993129/993/30/99
3/13/993/26/99
nass and/orvolume of sluwere not collected in all cases. Thes
CollectionTime
11:47
14:2014:4013:2809:54
13:4010:0113:5015:0813:0813:5514:2710:5914:17
11:0413:4210:04
15:3910:09
;erecovered
ContainerSerial Number
99-OI-A-V(Lid)99-01-B-V(Body)99-03-A-F(Lid)99-03-B-F(Body)
99-08-A-F(Lid)99-08-B-F(Body)
99-04-A-F(Lid)99-04-B-F(Body)99-05-A-F(Lid)99-05-B-F(Body)99-07-A-F(Lid)99-07-B-F(Body)
Estimated(’)Sludge
250 ml
2,200 g
-1 L950 g
2t03L,2,600 g
1,300 g
6L7,400 g
CheckValve (CV)or Filter (F)Cv
F
F
F
F
. .]m the shipping containers. Mass and volume d;
lata should not be used to estimate sludge densities. Because of the
.
a
relatively large sample and container masses, a limited precision scale (*100 g) was used (in accordancewith the approved test plan). Therefore, the mass values in this table are for indication only.
2.2 Consolidated Sample Container Inspection
Within 4 hours of receipt at 325A, the 1O.3-Lcontainers were vented by rotating the brass stem valvethree complete turns. The technicians noted that, upon venting, water leaked out of the vent stems onthree of the containers: KC-2, KC-3, and KC-4. The volume of water released was estimated to beapproximately 2 ml, 3 ml, and 10 ml, respectively. The containers had been sealed under approximate y20 t? of water in the 327 Building pool basin, while the 325 Building hot cells were at ambient pressure,which could explain this small amount of pressurization. Therefore, no strong indications of gasgeneration were evident in any of the consolidated sludge samples during transport between the 327 and325 buildings.
A fixed-volume (-400 ml) stainless steel headspace vessel was attached to the top of each 10.3-Lconsolidated sample container to mitigate a pressurization and/or flammable gas hazard. These fixed-
6

volume vessels were purged with an inert gas before being attached. The goal of these headspace vesselswas to prevent overpressurization by providing volume for gas generated during shipment. Purging theheadspace vessels with inert gas also reduced the potential flammability hazard.
Following the venting described above, the headspace vessels were removed from the containers andweighed. These weights are listed in Table 3. All of the headspace vessels had approximately the sameweight, with the exception of KC-1. Therefore, it was assumed that only the KC-1 headspace vesselcontained any sample material. Subtracting the mass of the KC-1 headspace vessel from the averagemass of the remaining five vessels suggests the KC-1 headspace vessel retained -290 g of material. TheKC-1 headspace vessel was drained and found to contain basin water. In the single pull mode used forsample KC- 1, the sampling container utilizes a float valve that prevents water from exiting the containerwhile it is in an upright position. During shipping, this container was laid on its side, and the float valvelikely opened, allowing water to enter the headspace vessel.
Table 3. Weight of Headspace Vessels Following Venting of Sample Containers
Consolidated Sample Headspace Headspace VesselContainer ID Vessel ID Mass, g
KC-1 1 1254.67KC-2 2 958.09KC-3 3 968.13KC-4 .4 960.17KC-5 5 966.25,Kc-6 6’ 965.82
Average (KC-2 through KC-6) 963.69
2.3 Recovery of Sludge from Consolidated Sample Containers
Sludge was recovered from the sample containers between May 26 and June 5, 1999. The sludge wasvacuum transferred out of the containers using a probe made of 3/8-in. stainless steel tubing connected toa collection vessel by nylon-reinforced silicone tubing. Collection vessels included 500-ml glass jars, 2-Lglass graduated cylinders, and 1O-Lglass carboys, depending on the volume of sludge anticipated.
A 10-L glass carboy was used during the first step of the recovery. Vacuum was applied to the vacuumtrain, and the probe was then slowly lowered into the sample container. The first material through thetrain was clear K Basin water. The clarity of water transferred to the collection vessel was monitored.For sample KC-6, all material in the shipping canister was transferred to the 10-L glass carboy. For theother samples, as soon as the water clarity dropped, indicating the probe was nearing the settled solidslayer, the carboy was removed and a smaller collection vessel was used to collect the solids. The solidsrecovered from sample KC-1 were transfen-ed to a 1-L glass jar. For samples KC-2 through KC-5, solidswere transferred to 6-L stainless steel pressure cookers. Pressure cookers were chosen for severalreasons: 1) given the sample size, a large metal container provided safer storage than a large glass vessel;2) the seal on the pressure cooker was sufficient to prevent evaporation; and 3) the pressure cooker sealprovided a passive mechanism to prevent overpressurization that could result from anticipated hydrogengeneration.
Following recovery, samples were monitored (and continue to be monitored) on a regular basis,approximately weekly, to assure standing liquid remained on the solids. During previous K Basin
7
,------- ... . .. .. . ... . .-,7>—7.- ,.rm. ,. ..... - .:<+*,>-.,,, —.---- .....
sampling campaigns, it was observed that most samples vessels did not seal and tended to dry over aperiod of weeks to months. Although several different rewetting techniques were attempted oncompletely dry samples (no visible liquid), complete drying tended to irreversibly alter the physicalproperties of the sludge. In most cases, the completely dried sludge formed hard chunks that could onlybe reconstituted by stirring and sonication (40 Watts for several minutes). However, even after veryaggressive rewetting efforts, the behavior of the reconstituted sludge was altered relative to the freshsludge.
For the testing with the consolidated sludge samples described here, standing liquid is removed from themother samples before removing subsamples. This liquid is returned a few minutes later minus somewater left in transfer containers and syringes. When needed, additional water from the respective carboysis transferred to the solids to prevent drying. As a result of this subsampling and sample handlingprotocol, it is not possible to determine the extent of evaporative loss for these samples.
2.4 Recovery of Sludge from Filters
When sample containers KC-2 through KC-6 were opened, the 5-pm stainless steel filters were found tobe caked with sludge. Attempts to remove the wet sludge using brushes and agitation were unsuccessful,so the filters were allowed to dry at ambient hot cell temperatures (-32°C). Consequently, the residualsludge on the dried filters could be removed using a stainless steel brush. Table 4 lists the mass of sludgerecovered from each of the filters. The dried sludge was added to the rest of the wet sludge recoveredfrom the containers. Figures 1 through 5 show the filters before and after cleaning. It is not known howwell the clumps of dried sludge fines (Figures 1 through 5) rewetted and de-agglomerated after beingadded back to the wet sludge. It is possible that some of these clumps retained their size and upwardlyskewed the results from the sieving analysis (Section 3.2).
Table 4. Mass of Dry Sludge Recovered fi-omthe Stainless Steel Filters
Sample Container I Dry Sludge Mass, gKC-2 15.31
8

i

—.— ..—. —-
(a)
(b)
me 2. Solids Retained on the Filter from Canister KC-3.(a) wet solids on the filter, and(b) solids recovered from the airdried filter using a stainless steel brush.
10

b
(a)
Figure 3.
(b)
Solids Retained on the Filter from Canister KC+.(a) wet solids on the filter, and(b) same filter and solids airdried.
11

(a)
(b)
Figure 4. Solids Retained on the Filter from Canister KC-5.(a) wet solids on the filter, and(b) solids recovered from the air-dried filter using a stainless steel brush.
12

(a)
#
13
,. . -------- . .... .. ..... .... . ... , .>.. .... ..,--- ......T..-f...-. ..,.,.,., . ,.’...>..........:r.:?Tar-c--- , ,-,.-.-, --.- --- . ,.-
. . ,.
Figure 5.
(b)
Solids Retained on the Filter from Canister KC-6.(a) wet solids on the filter, and(b) solids recovered from the air-dried filter using a stainless steel brush.

3.0 Test Methods, Analyses, and Results
For the FY 1999 testing, efforts were focused on the most important time-dependent testing. Oncecollected, sludge samples continue to age with time and change further from the sludge as contained inthe K Basin. Testing activities conducted to analyze the consolidated sludge sample characteristicsincluded particle size measurement via wet sieving, sludge settling and sludge density measurements,sludge shear strength measurement, and the measurement of sludge dissolution enthalpy to ascertain theuranium metal content of the sludge.
3.1 Compositing
Early in the testing, it was determined that two of the consolidated sludge samples collected from fuelcanisters would need to be combined (composite) to provide the necessary sludge fractions for allplanned testing activities. All available materials from samples KC-2 and KC-3 were composite.Sample KC-2 was composed of sludge collected from KE Basin canisters containing highly damagedfuel. Sample KC-3 was composed of sludge collected from ICEBasin canisters containing moderatelydamaged fbel. Sample KC-1, collected from a KE fuel canister using the single pull mode, was left as aunique sample and not added to the composite. Sample KC-1 is a comprehensive sludge sample, with noinfluence of filtering excess water through a 5-pm filter. It provides a comparison for the KC-2 and KC-3samples where excess water (and potentially some very fine sludge) was exhausted through the S-pmfilter.
The composite sample is referred to here as the KC-2/3 composite. An limited-precision scale with a unitsensitivity of-1 00 g was used in preparing the composite (see footnote on Table 2). Approximately2100 g of settled sludge from sample KC-2 were added to the composite and approximately 860 g settledsludge from sample KC-3. No attempt was made to determine the water content of the sludges prior tocompositing, so the actual ratio of solids in the composite is not known.
3.2 Small-Scale Wet Sieving
Samples of material from Canisters KC-1, KC-3, KC-4, KC-5, and the KC-2/3 composite were sieved toassess the particle size distribution in the sludge. Through the use of meshes or perforated membranes,sieving separates particles within a material into unique particle size fractions. Since K Basin processingoperations are planned to be performed on wet material, a wet sieving technique was used. In wetsieving, an aqueous fluid is introduced on top of the material. The fluid aids in the transport of theparticles from one mesh to the next, as well as preventing the particles fi-omdrying out. After completingthe wet sieving, the results were compared and integrated with previous particle size distribution data.
3.2.1 Procedure and Results
The wet sieving procedure used in this work was adapted from ASTM D546, “Sieve Analysis of MineralFiller for Road and Paving Materials.” Minor deviations were made from ASTM D546. Thesedeviations included drying the material at 60°C after sieving instead of 11O“C,and using K Basinsupematant instead of tap water as the aqueous fluid. Table 5 lists the Tyler sieve sizes used, along with
14

the U.S.A. size equivalents and sieve openings. All sieves used in this work were stainless steel andmanufactured by W.S. Tyler in conformance to ASTM El 1, ANSI, and 1S0 5653310-1 standards.
Table 5. Sieve Sizes Used for Wet Sieving
Tyler Size U.S.A. Equivalent Sieve Opening Sieve Opening (mm)(inches)
5 5 0.157 4.0012 14 0.0555 1.4132 35 0.0197 0.50060 60 0.0098 0.250
The sieve set, nested with the Tyler 5 on top followed by the Tyler 12, Tyler 32, and Tyler 60, was placedon a stainless steel bottom pan equipped with a drain ruining to a 250-ml or 500-ml receiver jar. Thepreweighed subsample was rinsed onto the Tyler 5 sieve using K Basin supematant from the respectivesample. K Basin supematant was then used to rinse as much of the sample as possible through themeshes. A remote video camera, providing color images, was used to inspect the mesh and determinewhen all particles remaining on the sieve exceeded the mesh size. The sieve was removed, and thematerial on the next sieve was rinsed in the same manner. All particles that passed through the Tyler 60sieve either flowed into the receiver jar or were rinsed into the receiver jar at the conclusion of sieving.
Following the rinsing step, the materials retained on each of the sieves were weighed. The mass of wetsolids in the receiver was then calculated by subtracting the mass of material in all of the sieves from theoriginal sample mass. A wt’XO wet solids was calculated for each fraction by dividing the mass of thefraction by the mass of the original sample. Table 6 lists the wt% wet solids separated in each sieve andreceiver.
Table 6. Weight Percent Wet Solids Separated by Sieve Size During the Sieving Analysis
Sample Tyler 5 Tyler 12 Tyler 32 Tyler 60 Receiver
KC- 1 “ 0.0 1.0 4.5 5.8 88.7KC-213 0.6 2.2 4.0 15.5 77.7KC-3 1.7 14.7 12.2 8.4 62.9KC-4 0.2 0.7 3.4 5.5 90.2KC-5 1.3 21.2 8.1 5.6 63.8
Table 6 shows that KC-1, collected in the single-pull mode, contains a higher fraction of fine particlesthan the other canister sludge samples (KC-2/3 and KC-3). It is possible that some fine particulate waslost through the 5-pm filter during the collection of KC-2 and KC-3.
Figures 6 though 10 provide photographs of the material retained on each of the sieves. These figuresshow that for KC- 1 and the KC-2/3 composite, the fine material (<250 pm) passing through the Tyler 60sieve was dark gray/green in color, while for the remaining samples the fine material was brown. Thefine brown material in KC-3 suggests that the fines from KC-2 are responsible for the dark gray color inthe KC-213 composite.
Green and yellow particles were observed in all of the samples. During work on samples collected fromprevious KE Basin characterization campaigns, these colors were associated with samples containing high
15
——. . . .. . . . .—— —-..——.
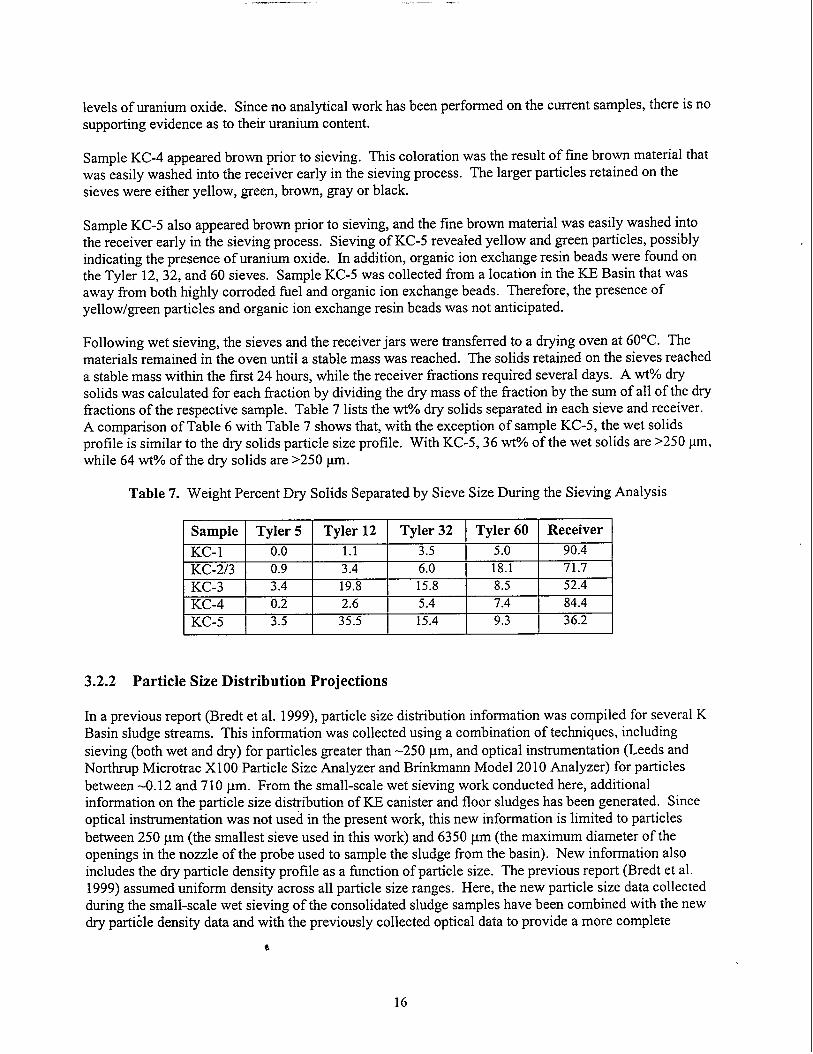
levels of uranium oxide. Since no analytical work has been performed on the current samples, there is nosupporting evidence as to their uranium content.
Sample KC-4 appeared brown prior to sieving. This coloration was the result of fine brown material thatwas easily washed into the receiver early in the sieving process. The larger particles retained on thesieves were either yellow, green, brown, gray or black.
Sample KC-5 also appeared brown prior to sieving, and the fine brown material was easily washed intothe receiver early in the sieving process. Sieving of KC-5 revealed yellow and green particles, possiblyindicating the presence of uranium oxide. In addition, organic ion exchange resin beads were found onthe Tyler 12, 32, and 60 sieves. Sample KC-5 was collected from a location in the KE Basin that wasaway from both highly corroded fiel and organic ion exchange beads. Therefore, the presence ofyellow/green particles and organic ion exchange resin beads was not anticipated.
Following wet sieving, the sieves and the receiver jars were transfened to a drying oven at 60”C. Thematerials remained in the oven until a stable mass was reached. The solids retained on the sieves reacheda stable mass within the first 24 hours, while the receiver fractions required several days. A wtO/odrysolids was calculated for each fkaction by dividing the dry mass of the fraction by the sum of all of the dryfractions of the respective sample. Table 7 lists the WWO dry solids separated in each sieve and receiver.A comparison of Table 6 with Table 7 shows that, with the exception of sample KC-5, the wet solidsprofile is similar to the dry solids particle size profile. With KC-5,36 wt~o of the wet solids are >250 pm,while 64 WtO/O of the dry solids are >250 pm.
Table 7. Weight Percent Dry Solids Separated by Sieve Size During the Sieving Analysis
Sample Tyler 5 Tyler 12 Tyler 32 Tyler 60 Receiver
KC-1 0.0 1.1 3.5 5.0 90.4
KC-213 0.9 3.4 6.0 18.1 71.7KC-3 3.4 19.8 15.8 8.5 52.4KC-4 0.2 2.6 5.4 7.4 84.4KC-5 3.5 35.5 15.4 9.3 36.2
3.2.2 Particle Size Distribution Projections
In a previous report (Bredt et al. 1999), particle size distribution information was compiled for several KBasin sludge streams. This information was collected using a combination of techniques, includingsieving (both wet and dry) for particles greater than -250 pm, and optical instrumentation (Leeds andNorthrup Microtrac Xl 00 Particle Size Analyzer and Brinkmann Model 2010 Analyzer) for particlesbetween -0.12 and 710 ~m. From the small-scale wet sieving work conducted here, additionalinformation on the particle size distribution of KE canister and floor sludges has been generated. Sinceoptical instrumentation was not used in the present work, this new information is limited to particlesbetxveen 250pm (the smallest sieve used in this work) and 6350pm (the maximum diameter of theopenings in the nozzle of the probe used to sample the sludge from the basin). New information alsoincludes the dry particle density profile as a fimction of particle size. The previous report (Bredt et al.1999) assumed uniform density across all particle size ranges. Here, the new particle size data collectedduring the small-scale wet sieving of the consolidated sludge samples have been combined with the newdry parti;le density data and with the previously collected optical data to provide a more complete
6
16

estimate of the particle size distribution anticipated for the canister and floor sludge waste streams.. Theseestimates are required to predict the volumes of sludge that will result from separation operations to beperformed in the K Basin prior to transfer of sludge to T-Plant.
In previous work, canister sludge samples 96-04 and 96-06 were characterized for particle sizedistribution (Makenas et al. 1997). These samples were designated as “research” samples followingsettling work, and collected in layers from the settling vessels. Sample 96-04 was divided into an upper(U) and lower (L) layer, while sample 96-06 was divided into an upper (U), middle (M) and lower (L)layer, In most cases, interface layers were also collected (i.e., sample 96-04 U/Lisa sample collected atthe interface between the upper and lower layers in sample 96-04). Floor sampleKES-M-13 was alsocharacterized for particle size distribution in previous work. This sample was also designated as aresearch sample following settling, and collected in layers fi-om~he settling vessel. Sample ICES-M-13was divided into an upper (Top) and lower (Bottom) layer. Layers were uniquely characterized forparticle size distribution. In some cases there was insufficient sample to characterize all layers by alltechniques.
The wet sieving results for layers from samples 96-04, and 96-06 are presented in Table 8. There wasinsufficient material to perform wet sieving on theKES-M-13 sample, but a KE floor composite sample(Schmidt et al. 1999) was dry sieved during process development work (results shown in Table 8). ThisKE floor composite was prepared by combining remaining and archived KE floor samples in proportionsthat do not necessarily reflect the volumes of sludge in the various areas on the actual KE Basin floor.Although most of the sieving was performed on wet sludge, after sieving the sludge retained on the sievesand receiver was air-dried before weighing. Therefore, the weight percent distributions shown in Table 8are reported on a dry-sludge basis.
In Figure 11, the sieving results from Table 8 are plotted, along with the sieving results for theconsolidated samples from Table 7, as well as results for several other KE Basin samples previouslyreported. As noted in this figure, three of the consolidated samples (KC-1, KC-2/3, and KC-5) did notcompare well with results from previous samples. In the previous analyses, sludge from canisters wasfound to be relatively coarse material with roughly 50 W% below 710 pm. Sample KC-3 fits thisdistribution, but KC-1 and the KC-2/3 composite were much finer, with at least 90 wt’%. below 500 pm.In addition, previous analyses showed the floor sludge to be fine material with 98 wtYoof the materialbelow 500 pm. Sample KC-4 (collected from the floor) compares well with this <90Y0distribution,containing -92 wt’Yo below 500 pm. However, sample KC-5 (also collected 13-omthe floor) is thecoarsest material examined, with only 45.5 WtO/O below 500 ~m.
Table 8. Sieving Results from Previous Reports, Wt% Solids Basis (Dry Sludge Basis)
Sample MethodTyler 6 Tyler 8 Tyler 14 Tyler 24 Tyler 32 Tyler 42 Tyler 60 Receiver
(3350 ym) (2360 ~m) (1180 pm) (710 pm) (500 pm) (335 ~m) (250 pm) PanKE Floor m o 0.1 0.2 0.4 0.5 NA 18 81Comp
96-04 L Wet o 12 22 9 NA NA NA96-06 M
56Wet 5 6 20 11 NA NA
96-06 LNA 58
Wet 3 3 15 22 NA NA NA 58
Table 9 presents the results from previous optical analyses of the canister and floor sludge samples. Theoptical data are in the form of a cumulative percent (for example, the value of 97.62 in the 44-~m columnof 96-04 U/L Sample 1 indicates that 97.620/. of the sample volume is composed of particles below44 pm). For a detailed explanation of the values in Table 9, refer to Bredt et al. (1999).

The particle size distribution calculations were performed to combine the sieving data with the opticaldata. This calculation was performed by multiplying the vol% data reported from the Microtrac Xl 00 bythe mass fraction of material passing through the finest sieve. For example, sample 96-06 M contained58 wt% (0.58 mass fraction) particles below 710 ~m according to sieving data. The Microtrac Xl 00 data(Sample 1) indicate that, of the particles less than -700 pm, 4.88 vol% of the particles are below0.972 pm. Therefore, combining the two data sets, the percentage of particles below 0.972 ~m is 2.83?40(4.88 x 0.58= 2.83). As stated previously, this calculation is only valid by assuming the density of theparticles above 710 pm are the same as the density of the particles below 710 ~m. Since wtYoand VOIYOare the same for a sample with uniform density, the results are then both WtO/O and VOlO/O.On a settledsludge basis, this assumption is generally valid.
Table 9. Optical Particle Size Data from Previous Reports, VOIYOBasis
Sample 0.972 pm 5.5 ~m 9.25 ~m 22 pm 44pm 104 ~m96-04 U/L Sample 1 7.65 50.58 68.94 89.58 97.62 1Oc96-04 U/L Sample 2 0.79 20.12 38.74 72.8 94.05 10C96-04 U/L Sample 3 0 8.64 18.24 45.97 70.15 96.0796-04 L Sample 1 0 8.24 17.02 41.99 57.92 88.1396-04 L Sample 2 3.75 20.44 26.53 39.52 53.56 76.7796-06 Carboy 5.55 14.81 24.31 72.04 91.48 1Oc96-06 M Sample 1 “ 4.88 38.18 52.11 69 89 9796-06 M Sample 2 1.53 18.75 28.34 47.34 68.81 93.9996-06 L Sample 1 8.96 35.54 44.26 60.71 74.59 89.85ICES-M-13 Top 5.23 28.7 44.91 76.07 94.35 100Sample 1ICES-M-13 Top 5.25 28.64 44.87 75.86 94.39 100Sample 2KES-M-13 Bottom 3.79 22.31 33.91 56.7 79.01 96.08Sample 1KES-M-13 Bottom 3.85 22.27 33.67 55.92 76.89 94.84Sample 2
176 pm100100
99.294.7785.87
10099.1498.3294.05
100
7 100
1 98.88
1
In some cases, sieving data were not available for all the samples analyzed using the Microtrac Xl 00.Sample 96-04 U/L was not sieved, so the 96-04 L sieving results were used for calculations involvingsample 96-04 U/L. For calculations involving sample KES-M- 13, also not sieved, the ICEFloor Compsieving results were used. Use of the ICEFloor Comp sieving results should also reduce errors in sampleinhomogeneity, since the KE Floor Comp represents a much larger material mass (-120 g versus 1.5 g ofKES-M-13 sieved).
Since samples 96-04,96-06, and ICES-M-13 were split into research layers, average curves were preparedfor each of the three samples by combining the research layers in proportion to the estimated volumepercent in each layer (see Bredt et al. 1999 for details on this calculation).
No particle size distribution data were available for the upper layers of the KE canister research samples;therefore, the following assumptions were made. For calculation of sample 96-04, the 96-04 U/L layerwas assumed to be representative of the upper layer of 96-04. For sample 96-06, the 96-06 Carboy
18

sample was assumed to be representative of the upper layer of 96-06. Average particle sludgedistributions were then calculated for the different sludge types (ICEcanister sludge and KE floor sludge)using the average sample curves. The particle size distributions for samples 96-04 and 96-06 wereaveraged to generate an average particle size distribution for KE canister sludge from canisters containingfuel elements, and KES-M-13 was used to determine the average KE floor sludge.
he resulting particle size distributions for the different sludge types are presented in Figure 12. Theerror bars in these figures indicate the highest and lowest value for each range (high-low bars). A line isused to connect the points, but this line is only provided to guide the eye to the next point and should notbe used to interpolate values between points.
As stated above, Figure 12 was calculated using sieving data based on mass and optical data, which arebased on volume using the assumption of uniform density across all particle size ranges. Table 13illustrates that this assumption is reasonable for the floor sludge sample, which had a relatively flatdensity profile (2.63 to 3.14 g/ml). However, for the canister sludge, the density varied significantly withparticle size. For the coarsest particles (400-6350 #m), the density was approximately 2.2 g/ml andincreased with decreasing particle size, reaching 7.6 g/ml for the smallest particles (0-250 ~m).
The results of the dry particle density analysis were applied to the wtYodata in Table 7 to derive particlesize distributions based on volume over the entire range. This calculation was performed by assumingthat the density profile for KC-2/3 could be applied to samples KC-1, KC-2/3, and KC-3, and that theprofile for KC-5 could be applied to KC-4 and KC-5. Since not every size fraction for sample KC-5 wasanalyzed for density, the value of 2.63 g/ml was applied to the Tyler 5, 12, and 32 fractions; the value of2.71 g/ml was applied to the Tyler 60 ii-action; and the value of 3.14 g/ml was applied to the receiverfraction.
The particle size distributions for samples KC-1, KC-2/3, KC-3, KC-4, and KC-5 are plotted on both aVOlO/Oand WtO/Obasis in Figure 13. Figure 13 shows that going fi-oma WtO/Obasis to a VOlO/Obasis shifts thecurves down. .Therefore, on a VOlO/Obasis, there are more larger particles than on a WtO/Obasis. Forstorage at T-Plant, converting to a VOlO/Obasis will increase the size estimate of material in the largerparticle fractions (>250 pm).
The sieving data from the consolidated samples, on a wtYobasis, were then averaged with the previoussamples (curves in Figure 12) to derive average particle size distributions for the different sludge types(KE canister sludge and KE floor sludge). The particle size distributions for samples KC-2/3, KC-3,96-04, and 96-06 were averaged to generate an average particle size distribution for KE canister sludgefrom canisters containing fuel elements, and KC-4, KC-5, and KES-M-13 were used to determine theaverage KE floor sludge. The results are plotted in Figure 14 on a WtO/Obasis.
The dry particle density data were also applied to the data in Figure 12 to convert the previous wW. datato a VOIYObasis. The results of this calculation are presented in Figure 15. Comparing Figures 12 and 15shows the curves are pushed downward towards coarser material. As expected, this change is mostpronounced in the canister sludge that had a much more significant densi~ change with particle size.
The sieving data from the consolidated samples, on a VOIYObasis, were then averaged with the curves inFigure 15 to generate a new average particle sludge distribution, also on a VOIYObasis, for the differentsludge types. The results of this calculation are plotted in Figure 16.

Comparing Figure 15 and 16 indicates that, for the canister sludge, the consolidated sludge data pushedthe curve up. This is the result of the fine nature of KC-1 and the KC-2/3 composite, as previously notedin Figure 11. The fine nature of KC-1 and the KC-2/3 composite is also the cause of a significantincrease in the high-low bars. For the floor sludge, the consolidated sludge data pushed the curve down,and also increased the high-low bars. This change is the result of the coarse nature of the KC-5 sample.
In summary, Figure 12 represents the average particle size distribution data available prior to theconsolidated sludge sampling. Figure 12 shows fine particulate floor sludge with approximate y 98°/0ofthe sludge below 500 pm. Comparing the floor sludge in Figure 12 with Figure 16, the consolidateddensity profile pushed the vol% curve to a coarser distribution and including samples KC-4 and KC-5pushed the curve to a significantly more coarse distribution. Figure 12 shows that before the consolidatedsamples were included the canister sludge was coarser than the floor sludge, with -5 8°/0of the particlesbelow 710 pm. Using the density data to convert to a VOI%basis increased the coarse nature of thematerial, but as Figure 16 shows, this change is minor compared with the influence of the fine nature ofKC- 1 and the KC-2/3 composite. The result is the fine floor material now appears on average to becoarser than originally considered, and the coarse canister material now appears to be finer. Comparingthe floor sludge and the canister sludge in Figure 16 suggests that the floor sludge may contain moreparticles between 1 and 100 pm. The averages suggest that the floor sludge may also be finer above100 ~m as well; however, there is sufficient variability above 250 pm (indicated by the high-low bars)that the particle size distributions appear roughly the same in this range.
3.3 Large-Scale Wet Sieving
Large samples from KC-4, KC-5, and the KC-2/3 composite were wet sieved through a Tyler 60 mesh,250-pm openings. This sieving was performed to separate the samples into >250-~m fractions and<250-pm fractions in preparation for process testing. The material >250 ~m retained on the sieve is
referred to here as “P[plus]250;” and the material passing through the sieves as “M[minus]250” (e.g., theKC-4 material that passed through the sieves is referred to as KC-4 M250, while the material retained onthe sieves is referred to as KC-4 P250). In addition to the testing described in this report, the large-scalesieve was also used to prepare test material for large- and small-scale gas generation testing. Note: Whenthe large-scale sieving was conducted, the sludge retrieval plans for KE Basin sludge had the fuel canisterand fuel wash sludge split into two streams (>250 pm and <250 pm). These two streams were handledseparately; the M250 sludge was combined with the floor sludge, and the P250 canister and fuel sludgewas segregated. Since this testing was conducted, the strategy for handling the KE Basin fuel canisterand fuel wash sludge is being revised. Under the new evolving strategy, the fuel canister and fuel washsludge will likely be separated and segregated into streams at 500 pm rather than 250 pm.
The volume of sample for sieving was determined from the volume of each fraction required for theprocess testing, results from the small-scale sieving, and the volume of material available. Ultimate] y,1000 g of KC-4, 50 g of KC-5, and all of the KC-2/3 composite were wet sieved using the Tyler 60 mesh.
Large-scale wet sieving involved placing a portion of a sample on top of the Tyler 60 sieve. The loadedsieve was then raised and lowered repeatedly into a Pyrex pan filled with supematant taken from therespective shipping canister. As the sieve was raised, particles below 250 pm drained into the Pyrex pan.After the separation appeared complete, the material on the sieve was rinsed with a stream of supematantfi-oma spray bottle. The runoff from this rinsing went into a 500-ml jar. The material in the 500-ml jarwas later combined with the material in the Pyrex pan. The solids on the sieve were immediatelytransfen-ed to a large vessel filled with clean supematant to keep the sludge wet at all times. A new
20
portion of material was then added to the sieve, and this process was repeated until all of the sample wassieved.
3.4 Shear Strength Measurements
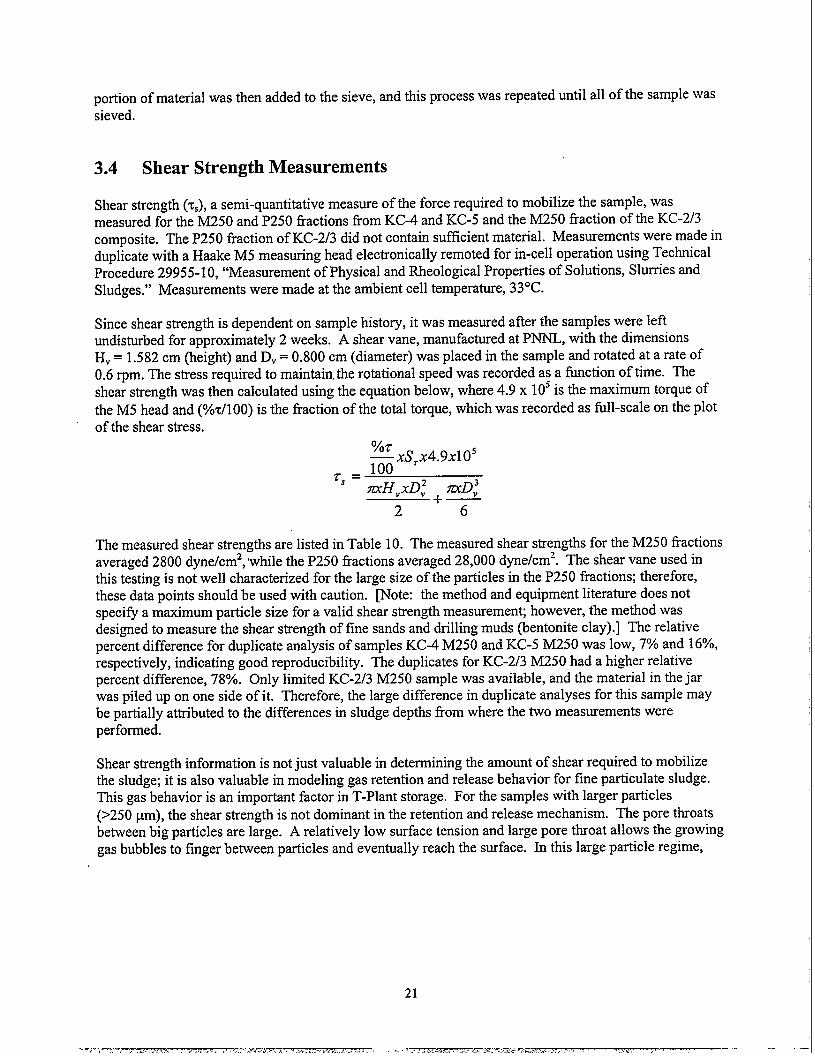
Shear strength (z,), a semi-quantitative measure of the force required to mobilize the sample, wasmeasured for the M250 and P250 fractions from KC-4 and KC-5 and the M250 fraction of the KC-2/3composite. The P250 fraction of KC-2/3 did not contain sufficient material. Measurements were made induplicate with a Haake M5 measuring head electronically remoted for in-cell operation using TechnicalProcedure 29955-10, “Measurement of Physical and Theological Properties of Solutions, Slurries andSludges.” Measurements were made at the ambient cell temperature, 33°C.
Since shear strength is dependent on sample history, it was measured after the samples were leftundisturbed for approximately 2 weeks. A shear vane, manufactured at PNNL, with the dimensionsH.= 1.582 cm (height) and D. = 0.800 cm (diameter) was placed in the sample and rotated at a rate of0.6 rpm. The stress required to maintain. the rotational speed was recorded as a fhnction of time. Theshear strength was then calculated using the equation below, where 4.9 x 10⁵is the maximum torque ofthe M5 head and (Yod100) is the fraction of the total torque, which was recorded as fill-scale on the plotof the shear stress.
0/07—xsrx4.9xlo5
r,= 100nxHvxD; mD:
2 ‘6
The measured shear strengths are listed in Table 10. The measured shear strengths for the M250 fractionsaveraged 2800 dyne/cm2, ‘while the P250 ilactions averaged 28,000 dyne/cm2. The shear vane used inthis testing is not well characterized for the large size of the particles in the P250 fractions; therefore,these data points should be used with caution. mote: the method and equipment literature does notspecify a maximum particle size for a valid shear strength measurement; however, the method wasdesigned to measure the shear strength of fine sands and drilling muds (bentonite clay).] The relativepercent difference for duplicate analysis of samples KC-4 M250 and KC-5 M250 was low, 7’XOand 16’XO,respectively, indicating good reproducibility. The duplicates for KC-2/3 M250 had a higher relativepercent difference, 78%. Only limited KC-2/3 M250 sample was available, and the material in the jarwas piled up on one side of it. Therefore, the large difference in duplicate analyses for this sample maybe partially attributed to the differences in sludge depths from where the tsvo measurements wereperformed.
Shear strength information is not just valuable in determining the amount of shear required to mobilizethe sludge; it is also valuable in modeling gas retention and release behavior for fine particulate sludge.This gas behavior is an important factor in T-Plant storage. For the samples with larger particles(>250 Mm),the shear strength is not dominant in the retention and release mechanism. The pore throatsbetween big particles are large. A relatively low surface tension and large pore throat allows the growinggas bubbles to finger between particles and eventually reach the surface. In this large particle regime,

- ...-
Table 10. Measured Shear Strengths for Research Layers, dyne/cmz
Sample Run 1 Run 2 AverageRelative Percent
DifferenceKC-213 M250 1,700 3,900 2,800 78KC-4 P250 36,000 20,000 28,000’ 57KC-4 M250 3,100 2,900 3,000 7KC-5 P250 23,000 31,000 27,000’ 32KC-5 M250 2,500 2,900 2,700 16
aMethod is not well characterized for particles of this size.
depending on the dimension of the pore throats and packing of particles, the gas in the sludge will reachsome ftaction and then be steadily released from the sludge(a).
For increasingly smaller particles, the forces preventing fingering of the growing bubble between theparticles increase, and gas bubbles are more easily retained. As bubbles grow in these finer materials, thebubbles are forced to displace particles. However, displacement of the particles is hindered by the shearstrength of the material. Studies on fine bentonite clays have shown that as the shear strength of thematerials increase, bubbles shapes change from round to oblong to slits (Gauglitz et al. 1996). Besidesbubble shape, shear strength also affects bubble release mechanisms. For low shear strength materials,the buoyancy of the bubble is enough to overcome the cohesive forces in the material, and bubbles simplyrise to the surface. For materials with moderate shear strengths, bubbles are retained until the waste-gasmatrix becomes neutrally buoyant. The buoyant mixture then rises to the surface, possibly leading tolarge and sudden gas release events as observed in Hanford Tank241-SY-101 prior to mixer pumpoperations. For high shear strength materials, interconnected slit-shaped bubble networks can form.These networks can provide a mechanism for continuous release.
Between the moderate and high shear strength ranges, vessel-spanning bubbles are possible. This wasobserved in samples of canister sludge from both ICEand K West (KW) Basins (Makenas et al. 1997,1998). In this regime, the shear strength of the material is not high enough to form a network to thesurface, but is high enough to support spanning bubbles. In the case of canister sludge, the spanningbubbles formed in the graduated cylinders containing a layer of settled solids under a layer of liquid. Thebubbles pushed up the solids as a plug. If corrective action had not been taken, these spanning bubbleswould have forced the liquid, and probably the solids, out the top of the graduated cylinder.
Sample 96-06 was a canister sludge sample from the KE Basin in which spanning bubbles were observed.The shear strengths of 96-06 subsamples were measured between 1700 and 4700 dyne/cm2. Thesemeasurements compare well with the shear strengths measured for the M250 fractions in this work,approximately 2800 dyne/cm2. Since the samples in this work represent both floor and canister sludges,these results suggest that both types should have a high probability of forming spaming bubbles.Therefore, any storage vessel used in T-Plant should be designed to mitigate the associated hazards.These hazards include flammable gas retention with the possibility of sudden release, and sludge growth
‘a) The modified Bond number criterion in Gauglitz et al. (1996) is a fimction of two ratios, gravitationalforcelsurface tension force and pore-scale strength forcelsurface tension force. With -200-pm glass beads in water,mostly particle displacing bubbles were observed, while at >500 ~m, interstitial liquid displacing bubbles wereobserved. Therefore a transition at >250 pm is appropriate, especially given the large difference in density betweenK Basin water (1.00 ghnl) and sludge (2 to >8 g/ml).
22

that could overrun the storage vessels. Gas retention of any sort will have an adverse effect on the abilityof the sludge to transfer heat generated fi-omchemical reactions and radiolysis.
It should also be noted that while the current models would not initially predict the formation of spanningbubbles in the larger particle stream (>250 pm), this could change as the sludge ages. As the sludge ages,the larger particles could oxidize to yield smaller particles. The extent of this change in particle sizedepends on several factors, including the uranium metal content. If a sufficient fraction of small particlesis formed, spanning bubble formation could become a hazard during the T-Plant storage of the largeparticle fraction.
With respect to gas retention in the large particle sludge, it is important to understand the packingefficiency of the sludge to model the potential gas retention. For both size ranges (c250 and >250 pm ),spanning bubbles could be successfidly mitigated by vessel design, such as modi~ing the vessel shape toinclude a conical taper that prevents the formation of a stable plug.
3.5 Enthalpy Study
Enthalpy tests were conducted to estimate the total metallic uranium content of the P250 fraction of theconsolidated sludge samples. The uranium metal content of the sludge is needed to calculate the quantityand rate of heat and hydrogen gas that can be generated from oxidation reactions during sludge transportand storage. The enthalpy data were acquired by dissolving sludge samples in nitric acid in a calibratedadiabatic calorimeter. Dissolution enthalpy data were then used to discriminate between metallic uranium(-3750 J/g in nitric acid) and uranium oxide (-394 J/gin nitric acid). The testing protocols and datareduction methodologies provided in this test procedure were previously employed to determine theenthalpy of dissolution of KW Basin canister sludge (Bredt, P. R., C. H. Delegard, B. M. Thornton, andK. L..Silvers. 1998. Heat of Reaction in Nitric Acid and Oxidation in Boiling Water of Suspended Metalor Hydride Sludge. PNNL Letter Report Number 29317-18 to Numatec Hanford Corporation).
The enthalpy of dissolution in nitric acid for the resulting three sieved samples (KC-4 P250, KC-5 P250,and KC-2/KC-3 P250) was examined; the study and results are further described below.
3.5.1 Calorimeter
A calorimeter was assembled as shown in Figure 17. A 100-ml glass beaker cut off at the 80-ml markwas used to contain the 16 M nitric acid. The beaker was wrapped in insulating foam and inserted into aglass vacuum dewar flask. ‘me dewar flask was covered with a piece of foam, and the temperature of thesolution in the calorimeter was measured by a mercury thermometer. The thermometer penetrated thefoam and into the acid to a fixed depth.
3.5.2 Calorimeter Calibration: System Heat Capacity Determination
The heat capacity of the calorimeter (Cp) was measured by placing a heated stainless steel coupon intothe calorimeter and measuring the resulting temperature change. Three measurements of the heatcapacity were made. The steel coupons were all heated to 105-107°C. Table 11 lists the results for theheat capacity measurements. It was assumed that the heat capacity for stainless steel was 0.469 J/g-K,and that the heat capacity of the calorimeter and the stainless steel do not change over the temperature
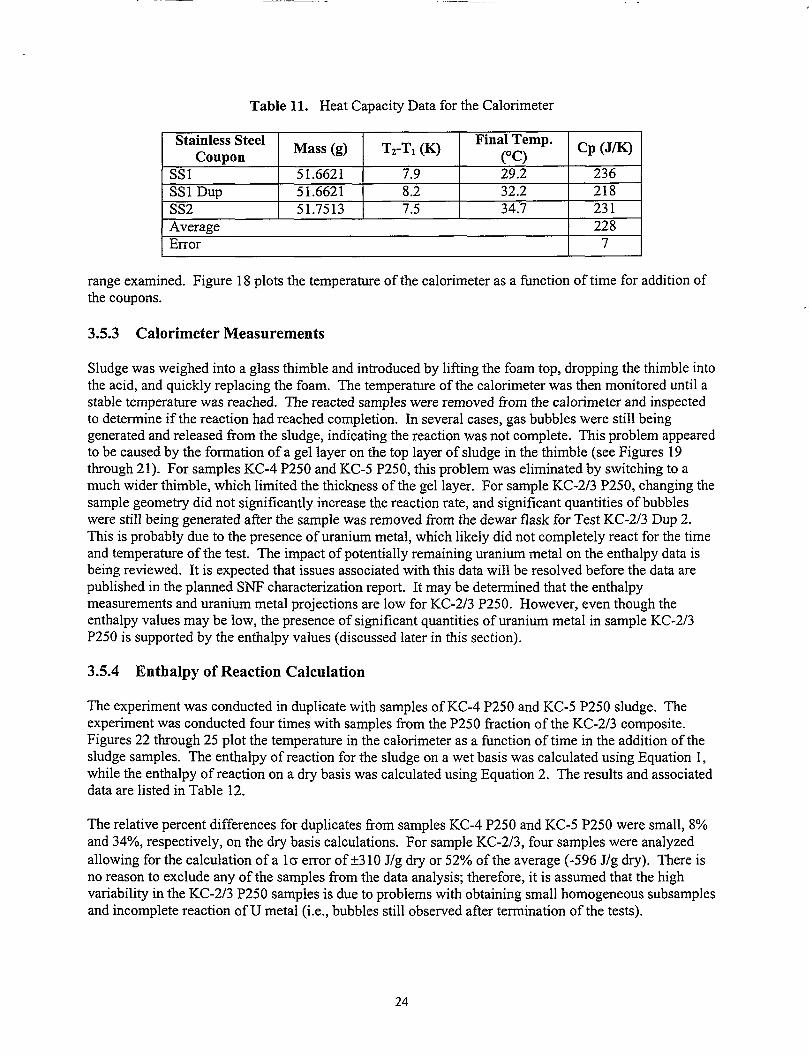
Table 11. Heat Capacity Data for the Calorimeter
Stainless SteelMass (g) T*-T~(K)
Final Temp.Coupon (“c)
Cp (J/K)
SS1 51.6621 7.9 29.2 236SS1 Dup 51.6621 8.2 32.2 218SS2 51.7513 7.5 34:7 231Average 228Error 7
range examined. Figure 18 plots the temperature of the calorimeter as a function of time for addition ofthe coupons.
3.5.3 Calorimeter Measurements
Sludge was weighed into a glass thimble and introduced by lifting the foam top, dropping the thimble intothe acid, and quickly replacing the foam. The temperature of the calorimeter was then monitored until astable temperature was reached. The reacted samples were removed from the calorimeter and inspectedto determine if the reaction had reached completion. In several cases, gas bubbles were still beinggenerated and released from the sludge, indicating the reaction was not complete. This problem appearedto be caused by the formation of a gel layer on the top layer of sludge in the thimble (see Figures 19through 21). For samples KC-4 P250 and KC-5 P250, this problem was eliminated by switching to amuch wider thimble, which limited the thickness of the gel layer. For sample KC-2/3 P250, changing thesample geometry did not significantly increase the reaction rate, and significant quantities of bubbleswere still being generated atler the sample was removed fi-omthe dewar flask for Test KC-2/3 Dup 2.This is probably due to the presence of uranium metal, which likely did not completely react for the timeand temperature of the test. The impact of potentially remaining uranium metal on the enthalpy data isbeing reviewed. It is expected that issues associated with this data will be resolved before the data arepublished in the planned SNF characterization report. It maybe determined that the enthalpymeasurements and uranium metal projections are low for KC-2/3 P250. However, even though theenthalpy values maybe low, the presence of significant quantities of uranium metal in sample KC-2/3P250 is supported by the enthalpy values (discussed later in this section).
3.5.4 Enthalpy of Reaction Calculation
The experiment was conducted in duplicate with samples of KC-4 P250 and KC-5 P250 sludge. Theexperiment was conducted four times with samples from the P250 fraction of the KC-2/3 composite.Figures 22 through 25 plot the temperature in the calorimeter as a function of time in the addition of thesludge samples. The enthalpy of reaction for the sludge on a wet basis was calculated using Equation 1,while the enthalpy of reaction on a dry basis was calculated using Equation 2. The results and associateddata are listed in Table 12.
The relative percent differences for duplicates from samples KC-4 P250 and KC-5 P250 were small, 8!4.and 34°/0,respectively, on the dry basis calculations. For sample KC-2/3, four samples were analyzedallowing for the calculation of a 1cserror of*310 J/g dry or 52°/0of the average (-596 J/g dry). There isno reason to exclude any of the samples fi-omthe data analysis; therefore, it is assumed that the highvariability in the KC-2/3 P250 samples is due to problems with obtaining small homogeneous subsamplesand incomplete reaction of U metal (i.e., bubbles still observed after termination of the tests).
24
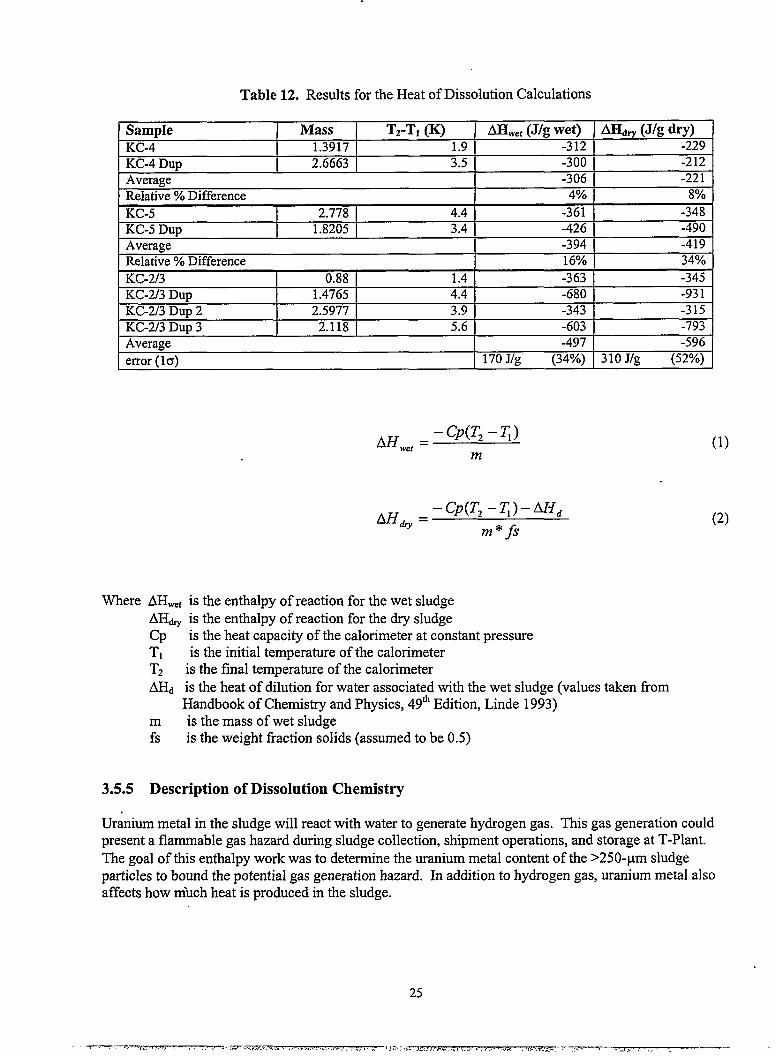
Table 12. Results for the Heat of Dissolution Calculations
Sample Mass T*-T~(K) AHW,,(J/g wet) ~w (Jk dry)KC-4 1.3917 1.9 -312 -229
KC-4 Dup 2.6663 3.5 -300 -212
Average -306 -221
Relative ‘YoDifference 4% 8’%
KC-5 I 2.778 I 4.4 -361 -348KC-5 Dup 1.8205 I 3.4 -426 -490Average -394 -419Relative ‘%0 Difference 16% 34’%0
KC-213 0.88 1.4 -363 -345KC-2/3 Dup 1.4765 4.4 -680 -931KC-2/3 Dup 2 2.5977 3.9 -343 -315KC-2/3 Dup 3 2.118 5.6 -603 -793Average -497 -596
error (1cr) 170 J/g (34%) 310 J/g (52%)
AHwe, =– cp(z”,–<)
m
~ .–cP(TX–q)–~ddry
m*fs
Where AHW.Iis the enthalpy of reaction for the wet sludgeAH@ is the enthalpy of reaction for the dry sludgeCpT,T2A?&
mfs
is the heat capacity of the calorimeter at constant pressureis the initial temperature of the calorimeter
is the final temperature of the calorimeteris the heat of dilution for water associated with the wet sludge (values taken fromHandbook of Chemistry and Physics, 49ti Edition, Linde 1993)is the mass of wet sludgeis the weight fraction solids (assumed to be 0.5)
3.5.5 Description of Dissolution Chemistry
(1)
(2)
Uranium metal in the sludge will react with water to generate hydrogen gas. This gas generation couldpresent a flammable gas hazard during sludge collection, shipment operations, and storage at T-Plant.The goal of this enthalpy work was to determine the uranium metal content of the >250-pm sludgeparticles to bound the potential gas generation hazard. In addition to hydrogen gas, uranium metal alsoaffects how m’uchheat is produced in the sludge.
25

The heat evolved by dissolution of uranium metal in nitric acid has been calculated based on theenthalpies of formation of the participating reactants and products (Swanson et al. 1985). For the reactioncarried out in Hanford reprocessing plant fiel dissolvers
the enthalpy (evolved heat) is -3750 J/g uranium (-213 kcal/mole uranium). Reactions at other productmole ratios are linear combinations of the enthalpies found for pure NO product -4190 J/g uranium(-238 kcal/mole uranium) and pure N02 product -3030 J/g uranium (-172 kcal/mole uranium).
The enthalpy of the oxygen-augmented reaction in pilot-plant metal dissolutions
was estimated to be -4640 J/g uranium (-264 kcal/mole uranium) and measured to be -4750+1 060 J/guranium (-270 *6O kcal/mole uranium) (Blaine 1960).
Based on published enthalpy of formation data (Wagman et al. 1982), the dissolution of uranium hydridein nitric acid is similarly energetic
UH3 (s)+ 5 HN03 (,o -+ UOZ(NOS)Z(a~+ 3 No (~)+ 4 H20 (])
yielding -3100 J/g uranium (-176. 1 kcal/mole uranium) to give N02 and -4780 J/g uranium(-271.7 kcal/mole uranium) for NO.
The heats evolved in the dissolution of U02 in nitric acid are much lower on a per gram basis thanuranium metal and uranium hydride
U02 ~,,+ 4 HN03 (.O+ U02(N03)2 ~,. + 2 NOZ(~)+ 2 HZO(1, -66 J/g UOZ(-4.2 kcal/mole)
UOZ~,,+ 8/3 HNOS~,~)+ UOZ(N03)2~,~)+ 2/3 NO (~)+ 4/3 HZO(i, -394 J/g UOZ(-25.4 kcal/mole)
The enthalpy of the oxygen-augmented dissolution
UOZ(,)+3 HN03 (a~)+ 1/4 Oz(g)+’ U02(N03)Z (q) + N02 (g) + 312’20 O)
was reported to be -267 J/g U02 (-17.2 kcal/mole uranium) (Blaine 1960).
The distribution of the NOX(NO and N02) reaction products in the oxidative dissolution of UOZhas beenshown to be dependent. on the acid concentration, temperature, and dilution of the NO. (Herrmann 1984).This distribution is determined by the equilibrium
26

For a given HNOJ concentration, the equilibrium constant expression maybe reduced to the equilibriumratios of the NO and NOZpartial pressures
A numerical expression for the value of K] has been derived based on measurements of the equilibriumbetween N02, NO, and HN03 solution at various temperatures and acid concentrations (Tereschenko etal. 1968)
log K, =2.188x10⁷ T2”58- 4.571x10² T]’4Z4CmoJ
where T is temperature in Kelvin and cmo3 is nitric acid concentration in weight percent. For theexperimental conditions used in the enthalpy measurements, T is about 308 K (35”C) and CI.INOJis 70 wt’XO(16 ~ HNO~). Calculating, K, is 14.5 atm-’.
It is assumed that the total NO. pressure in the calorimeter at the end of the reaction is 1 atmosphere.That is, the calorimeter vapor space is filled with NOXat the end of reaction. This assumption isreasonable given the amounts of sludge used (at least 1 g U02), the calorimeter vapor space (60 ml), andthe projected amount of NO, generated (at least 62 ml NO). Thus, p~oz+ pNo= 1. To satisfi theexpression for K1= 14.5 atm-2,pNozis calculated to be 0.35 atm and pNoto be 0.65 atm.
The oxidative dissolution of 1 mole of U02 to form U02(N03)2 is a No-electron change. The amount ofHNOj to be reduced, forming N02 and NO, must also be a two-electron change. Reduction of 1 mole ofHN03 to N02 is a one-electron change and to NO is a three-electron change. The amount of HNO~required to oxidize 1 mole of U02, given the relative amounts of N02 and NO, is
Moles HNOS = 2 electrons / (0.35 N02 “ 1 electron/mole + 0.65 NO ● 3 electrons/mole)= 0.87
The U02 oxidation therefore will require
0.87 ● 0.35= 0.30 moles N02
and 0.87 ● 0.65 = 0.57 moles NO
The oxidative dissolution reaction of U02 thus is the sum of the two reactions giving, respectively, thespecified amounts of N02 and NO gas products. Based on the stoichiometries presented earlier for UOZoxidative dissolution and the amounts of N02 and NO produced in the oxidative dissolution,
0.60 HNO~ + 0.15 U02 + 0.15 U02(N03)2 + 0.30 N02 + 0.30 HZO
and
2.27 HN03 + 0.85 U02 + 0.85 U02(NOJ)2 + 0.57 NO+ 1.14 H20
or, summing,
27
.-,------ - -7-7?7— ,,:...,,.,... -m- . - -.—.. -..

2.87 HNOS + U02 -+ UOZ(NOS)Z+ 0.30 NOZ+ 0.57 NO + 1.44 HZO
The enthalpy of the net reaction to oxidatively dissolve 1 mole of U02 is the sum of the enthalpies of thereactions to produce 0.30 moles NOZand 0.57 moles NO,
0.15 (-4.2 kcal/mole UOZ)+ 0.85 (-25.4 kcal/mole U02) = -22.2 kcal/mole UOZ’= -366 J/g UO*
3.5.6 Interpretation of Enthalpy Test Results
The measured enthalpy of reaction for consolidated sludge samples KC2/3 P250, KC-4 P250, andKC-5 P250 was -596,-221 and -419 J/g, respectively, on a dry basis. The value for KC-4 P250 is withinthe range expected for U02, i.e., between -66 and -394 J/g. The value for KC-5 P250 is approximately15’XOabove the range for U02 dissolution. It is possible that a small quantity of the uranium in the sludgeis metallic or hydride, resulting in this slightly higher value. The value and observations for KC-2/3 P250strongly suggest the presence of uranium metal.
The measured enthalpy for two samples fi-omKC-213 P250 were -793 J/g and -931 J/g. These values areapproximately 2.2 to 2.5 times higher than expected for pure U02. Assuming that the material in thesesamples is only a combination of UOZand uranium metal, uranium metal content of the samples can beestimated using the relations,
Mass Fraction U02 (366 J/g)+ Mass Fraction U metal (3750 J/g)= Measured Enthalpy J/g
and
Mass Fraction UOZ+ Mass Fraction U Metal = 1,
and a uranium metal content of 17.0 wtYoand 12.8 wt’%0for samples KC-2/3 Dup and KC-2/3 Dup 3,respectively, can be estimated. These are conservatively low measurements since not all of the materialin the samples was U or U02. For example, if 30 wt’XOof the material in the sample was inert in nitricacid (e.g., SiOz), the projected uranium metal content for sample KC-2/3 Dup would increase from 17.0wt!40to 24.3 wtYo. In addition, the observation that bubbling continued after the samples were removedfrom the dewar flask indicates the reaction was not complete and, therefore, the measured enthalpy valuesare biased low.
With respect to storing the sludge at T-Plant, it is probably most appropriate to estimate the uraniummetal content by averaging all of the results for sample KC-2/3. Averaging the results limits the errorsassociated with sample inhomogeneity. Four samples from KC-2/3 were subjected to enthalpymeasurements with a total mass of 7.0722 g. Of these four samples, two samples showed no uraniummetal, one showed 17.0 WtO/O,and the last 12.9 WtO/O.The average was 7.5 (*8.8) WtO/O.
For KC-5 P250 (measured enthalpy -419 J/g), the calculated uranium metal content was 1.6% on a dryweight basis. Previous analyses of KE floor sludge show that the total uranium content (all uraniumcompounds) ranges from 3°/0to 33°/0on a dry solids basis (Makenas et al. 1996). If it was assumed that70’%0of KC-5 P250 was inert (e.g., Si02), then the uranium metal content estimated would increase from1.6 wt?40to about 9.1 wt’?40.
28

Since the sludge will be recovered and initially stored wet, it is of value to calculate the wt% uraniummetal content on a wet basis as well. Two subsamples were collected from the same KC-2/3 P250 settledsludge used for enthalpy testing. The two samples were dried until a stable mass was reached. The dryweights were used to calculate the weight fraction solids in the settled sludge. These results are onlyapplicable to the enthalpy subsamples, since each time subsamples were removed from the bulk samplepots varying amounts of water were added to the pots to prevent drying. Drying of these subsamplesyielded weight fraction solids values of 0.51 and 0.57. The average was 0.54. Multiplying the WWOuranium metal on a dry basis (17.0 wtYoand 12.9 WtO/O)by the weight fractions solids (0.54) yields thewtYouranium metal on a wet basis: 9.2 wtYoand 7.0 wtYo. The average for the four samples was 4.0(*4.8) W% uranium metal on a wet basis. Using the weight fraction solids value of 0.43 for KC-5, on awet solids basis, the uranium metal content for KC-5 is 0.69 wt”jo.
3.6 Sludge Settling Behavior and Settled Sludge Densities
The settling study was conducted on the solids from samples KC-1, KC-2/3 M250, KC-4, and KC-5. Thestudy on samples KC-2/3, KC-4, and KC-5 was started on October 19, 1999, while the study on KC- 1was started on November 15. For these studies, solids from each sample were transferred into 2-L glassgraduated cylinders, 41 cm high and 8.0 cm in diameter. Additional supematant was transfemed into thegraduated cylinders to bring the total volume in each cylinder to approximately 1.6 L. Supematantcollected from shipping contziiner KC-5 was used for samples KC-1 and KC-5; supematant from shippingcontainer KC-2 was used for sample KC-2/3; and supematant from shipping container KC-4 was used forsample KC-4. The KC-2 supernatant was gray and slightly opaque before being added to the graduatedcylinder. The remaining supematants were clear.
The solids in the graduated cylinders were sparged with inert gas for 10 minutes to mobilize the solidlayer and obtain a homogeneous slurry. Ultra high purity N2 was used for sparging on October 19, and Arwas used on November 15. The volume of settled solids was recorded every 5 minutes for the first half-hour, every 10 minutes for the next half-hour, and then every 20 minutes for the rest of the day. Thesettled solids volume was then monitored occasionally for the next 2 days. For both studies, a videocamera was used to collect real time and time lapse images over the 3-day period. During both sets ofsettling studies, the cell temperature was approximately 32°C.
For samples KC-1, KC-4, and KC-5, the mobilized solids settled over time, creating a clear liquid layerabove and a dark settling slurry layer below. The interface between these layers was monitored as afunction of time, and settling velocities were calculated for each. The volume percent settled solids as afunction of time are plotted in Figure 26, and the settling velocities as a fimction of time are plotted inFigure 27. With the exception of sample KC-2/3 M250, all of the samples reached a stable settled volumewithin the first 4 hours. The supematant in the graduated cylinder containing sample KC-2/3 M250remained opaque for the duration of the settling study, so it was not possible to observe the settlingbehavior.
As seen in Figure 27, the settling rates for samples KC-1, KC-4, and KC-5 were between 0.8 and1.0 crn/min during the first 30 minutes. After 30 minutes, hindered settling dominated, as indicated by asharp drop in the settling rate between 30 minutes and 60 minutes. The settling rate for all three samplesdecreased to approximately 0.03 crn/min after 60 minutes. It is anticipated that in the basin, during fueland sludge recovery, solids loading will not be high enough to cause hindered settling. Therefore, thisstudy suggests that in the main basin a value of behveen 0.8 and 1.0 crdmin should be applied. As the
,
29
..- ----- mm ,. ,,.., ;T-A-m-.,.@,.-,,, .. >..,. .... .. . ., . . ... .. .......=..........<., .. .... .. .. .-. . .. . . ..-.-—..1...=>.>.. ---- .> 7,..!.

sludge is collected in large quantities in the associated pits and settling tanks, hindered settling will be thedominant settling mechanism. In the pits, a value of 0.03 crnhin or less should be applied. .
The results of this study compare with results from the 1996 KE Basin canister sludge campaign(Makenas et al. 1997). During the previous study, an unhindered settling rate of between 0.5 and 3cm/min was observed. Most of the samples settled within approximately 1 hour, after which the settlingvelocities decreased rapidly.
The settling rate data for KC-4 and KC-5 are similar to settling data obtained for KE floor and Weasel Pitsamples (Makenas et al. 1996). For the KE floor and Weasel Pit samples, settling was essentiallycomplete within 1 to 3 hours (Makenas et al. 1996). During settling tests with single-pull samplesconducted in 1999, settling of a composite representative of general KE floor sludge required between 10and 25 hours [personal communication to D. A. Dodd (Numatec Hanford) from D. B. Bechtold (NumatecHanford), KE Basin Core Sample Characterization FY 1999 Status, September 20, 1999].
A very different settling behavior was observed during the KW canister sludge campaign, where onlythree of eight samples were observed to settle with visible interfaces. These samples had settling rates ofbetween 0.04 and 0.02 crdmin; unlike the KE samples, the liquid layer above the interface on these threesamples was cloudy. This cloudy liquid took up to 7 days to clear and for one sample never cleared. Thissettling behavior compares with the behavior of sample KC-2/3 M250 in the present study.
Figure 28 shows the samples following settling. No coarse material was visible in the KC-1 settledsolids, and no layered structure was observed. The KC-4 and KC-5 samples settled with a coarse layer onthe bottom composed of light-colored chunks and a finer upper layer. In both KC-4 and KC-5, the fineupper layer was a light brown color. These colors match the colors observed for the P250 and M250fraction separated during the sieving study. The supernatant associated with the KC-2/3 M250 settledsolids did not clarifi during this study, so the settling behavior over time could not be observed.Figure 28d shows the sample settled with two distinct layers. The upper layer was a light green color,while the bottom layer was a much darker green. Both layers appear to be fine, as would be expected formaterial sieved through a 250-pm mesh.
FoIlowing the settling study, standing supematant was removed for the graduated cylinders containing thesettled solids from samples KC-4, and KC-5. The mass and volume of settled solids was recorded. Thesettled solids densities were then calculated by dividing the mass by the volume. The density results forall consolidated sludge samples are listed in Table 13.
The settled solids densities for KC-4 and KC-5 agree reasonably well with previous KE floor sludge. Themean settled sludge density of 14 floor sludge samples (Makenas et al. 1996) is 1.32 g/ml (Pearce et al.1998).
The solids in KC-1 were not weighed in the graduated cylinder. The settled solids were transferred to a1-L glass jar and re-settled for approximately 2 weeks. Standing liquid was then removed from the jar,and the mass of solids was recorded. The density was then calculated by dividing the mass of settledsolids in the j ar by the volume of solids in the graduated cylinder before the transfer was made.
Sample KC-2/3 M250 did not contain enough solids to quantifi the volume using the 2-L graduatedcylinder. The solids from KC-2/3 M250, as well as the solids from KC-2/3 P250, were transferred to250-pm graduated cylinders and left to settle for approximately 3 weeks. After 3 weeks, the supernatant
30
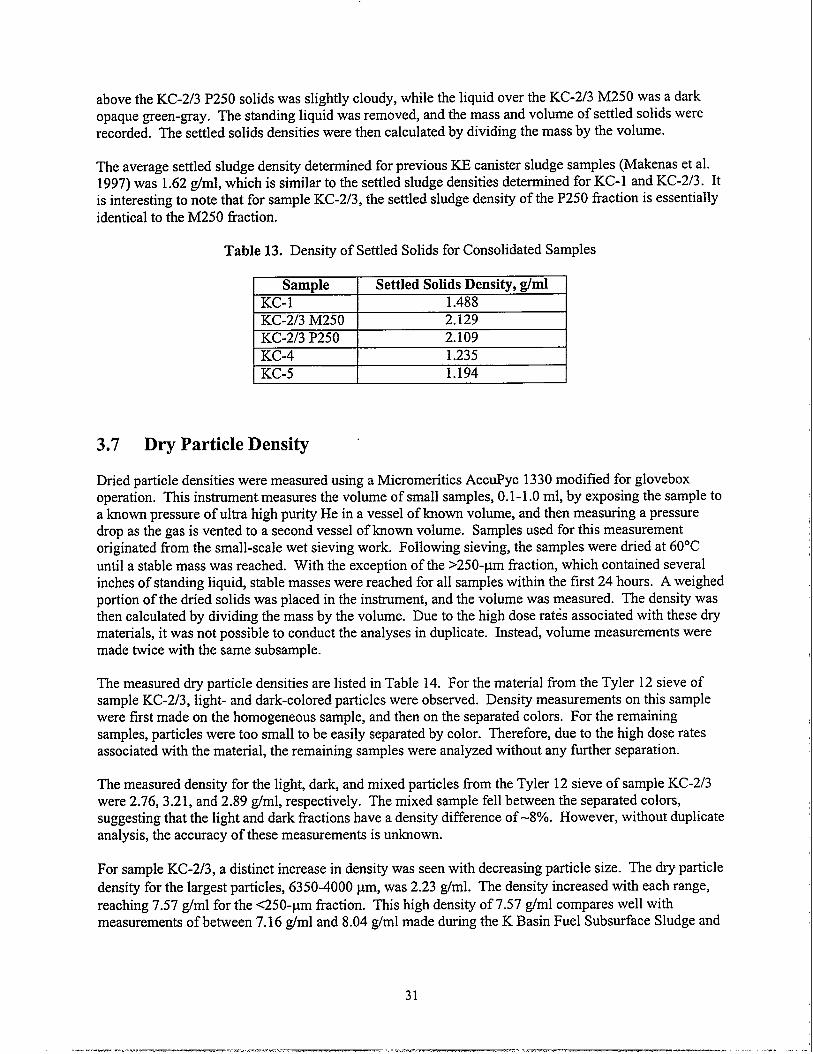
above the KC-2/3 P250 solids was slightly cloudy, while the liquid over the KC-2/3 M250 was a darkopaque green-gray. The standing liquid was removed, and the mass and volume of settled solids wererecorded. The settled solids densities were then calculated by dividing the mass by the volume.
The average settled sludge density determined for previous KE canister sludge samples (Makenas et al.1997) was 1.62 g/ml, which is similar to the settled sludge densities determined for KC-1 and KC-2/3. Itis interesting to note that for sample KC-2/3, the settled sludge density of the P250 fraction is essentiallyidentical to the M250 fraction.
Table 13. Density of Settled Solids for Consolidated Samples
Sample Settled Solids Density, ghnlKC-1 1.488KC-2/3 M250 2.129KC-2/3 P250 2.109KC-4 1.235KC-5 1.194
3.7 Dry Particle Density
Dried particle densities were measured using a Micromeritics AccuPyc 1330 modified for gloveboxoperation. This instrument measures the volume of small samples, 0.1- 1.0 ml, by exposing the sample toa known pressure of ultra high purity He in a vessel of known volume, and then measuring a pressuredrop as the gas is vented to a second vessel of known volume. Samples used for this measurementoriginated fi-om the small-scale wet sieving work. Following sieving, the samples were dried at 60”C
until a stable mass was reached. With the exception of the >250-pm fraction, which contained severalinches of standing liquid, stable masses were reached for all samples within the first 24 hours. A weighedportion of the dried solids was placed in the instrument, and the volume was measured. The density wasthen calculated by dividing the mass by the volume. Due to the high dose rates associated with these drymaterials, it was not possible to conduct the analyses in duplicate. Instead, volume measurements weremade twice with the same subsample.
The measured dry particle densities are listed in Table 14. For the material from the Tyler 12 sieve ofsample KC-2/3, light- and dark-colored particles were observed. Density measurements on this samplewere first made on the homogeneous sample, and then on the separated colors. For the remainingsamples, particles were too small to be easily separated by color. Therefore, due to the high dose ratesassociated with the material, the remaining samples were analyzed without any further separation.
The measured density for the light, dark, and mixed particles from the Tyler 12 sieve of sample KC-2/3were 2.76, 3.21, and 2.89 g/ml, respectively. The mixed sample fell between the separated colors,suggesting that the light and dark fractions have a density difference of -8°/0. However, without duplicateanalysis, the accuracy of these measurements is unknown.
For sample KC-2/3, a distinct increase in density was seen with decreasing particle size. The dry particledensity for the largest particles, 6350-4000 pm, was 2.23 g/ml. The density increased with each range,reaching 7.57 g/ml for the <250-pm fraction. This high density of 7.57 g/ml compares well withmeasurements of between 7.16 g/ml and 8.04 g/ml made during the K Basin Fuel Subsurface Sludge and
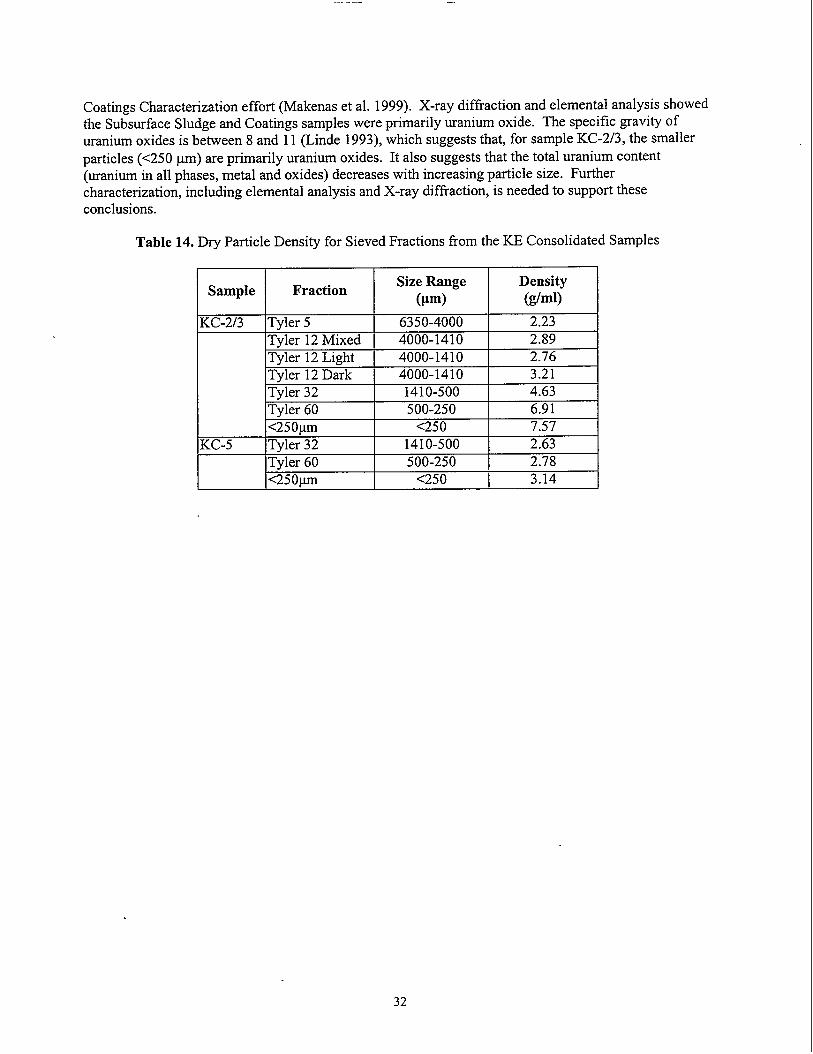
Coatings Characterization effort (Makenas et al. 1999). X-ray diffraction and elemental analysis showedthe Subsurface Sludge and Coatings samples were primarily uranium oxide. The specific gravity ofuranium oxides is between 8 and 11 (Linde 1993), which suggests that, for sample KC-2/3, the smallerparticles (<250 pm) are primarily uranium oxides. It also suggests that the total uranium content(uranium in all phases, metal and oxides) decreases with increasing particle size. Furthercharacterization, including elemental analysis and X-ray diffraction, is needed to support theseconclusions.
Table 14. Dry Particle Density for Sieved Fractions from the KE Consolidated Samples
Sample FractionSize Range Density
(pm) (g/ml)
KC-2/3 Tyler 5 6350-4000 2.23Tyler 12 Mixed 4000-1410 2.89
Tyler 12 Light 4000-1410 2.76Tvler 12 Dark -tUuu-l-tlu I J.L1 I
lT~ler 601 I
500-250 6.91 1
I,4nnn lAln 2 91—,––– –——-–––
ITvler 32I I
1410-500 4.63
I lti50um1 ,
<250 7.57IKC-5
IlTyle{ 32 1410-500 2.63Tiler 60 500-250 2.78Q50pm <250 3.14
32

.- - ..,...- ---- ------
:>’
(b) (c)
Figure 6.
(d)
%iEP.
(e)
Small-scale Sieving of Material from KC-1.(a) no material was retained on the Tyler 5,(b) through (d) material retained on the Tyler 12,32 and 60 meshes, respectively, and(e) Q50 pm fraction that passed through the Tyler 60 mesh.
33

(a) (b)
(c) (d)
(e)
.-
—
(f)
Figure 7. Small-scale Sieving of the KC-2/3 Composite.(a) material on the sieve stack prior to rinsing,(b) through (e) material retained on the Tyler 5, 12,32 and 60 meshes, respectively, and(f) -Q50 pm fraction that passed through the Tyler 60 mesh.
34

(a)
“!
!
35
.—.s .,,. .. ... ~...-.Y-..,......... .. -7.T —- .. —-. ...-+. - .-
(b)
(c)
(e)
(d)
(f)
Figure 8. Small-scale Sieving of Material from Canister KC-3.(a) material on the sieve stack prior to rinsing,(b) through (e) material retained on the Tyler 5, 12,32 and 60 meshes, respectively, and(f) <250 pm fraction that passed through the Tyler 60 mesh.

(c)
(e)
(d)
—
(f)
Figure 9. Small-scale Sieving of Material from Canister KC-4.(a) material on the sieve stack prior to rinsing,(b) through (e) material retained on the Tyler 5, 12,32 and 60 meshes, respectively, and(f) -Q50 pm fraction that passed through the Tyler 60 mesh.
36

(a) (b)
(c) (d)
- .......,-. :
(0(e)
Figure 10. Small-scale Sieving of Material from Canister KC-5.(a) material on the sieve stack prior to rinsing,
(b) through (e) material retained on the Tyler 5,12,32 and 60 meshes, respectively.Several organic ion exchange beads are circled in (c) and (d), and(9 -Q50 pm fraction that passed through the Tyler 60 mesh.

Figure 11. Comparison of Sieving Results for K East Basin Sludges and Consolidated Sludge on a Dry Weight Basis
100,0
90.0
80.0
50.0
/
# - Previous Floor Sludge
8
* KC-5 Floor Sludge
Previous Canister Sludge From K East Fueled Canisters
d#
KC-2/3 Canister Sludge I
40.0I30.0 1 # , 1 1 I I
o 1000 2000 3000 4000 5000 6000 7000
Particle Size (urn)
KC-1
m * KC-2/3
“ ~ KC-3
“ & KC-4
‘- KC-5
~ KE Floor Comp
~ KE Pit Comp
~ KES-S-19
— KES-T-20Bottom
~ 96-04 L
~ 96-06 M
~ 96-06 L
—o-96-11 L
KW Average

I
\I
II 1
\
\
I
tI I I I I I I I I
8 , ,
—.—...— -.

100.0
90.0
80.0
70.0
60,0
50.0
40.0
30.0
20.0
10.0
0.0
Comparison of Volume Percent and Weight Percent Particle Size Distributions for K East BasinConsolidated Samples
—
—
—
—
—
—
—
—
—
—
—
~ KC-1 vd~o
- -@– KC-I k’it~O
~ KC-2/3 VOl~o
+— KC-2/3 kvt~O
~ KC-3 VOl~o
–-9– KC-3 ti?’O
~ KC-4 VOI%
—A— KC-4 ti?’fO
~ KC-5 VOl~o
—X— KC-5 wt~O
100 1000
Particle Size (urn)

IDN
vi
41
00:
000
00F
o
....._ —_-_7—7-- ! ..%.7-.,. , , ,,, .. .. . . . . . . . . . . .. . . . v3><.,Lw- ,, ,. , ., . ..= . ,. . ...” .,. - -.,zmn r.:.-T Y.- ., , , . . —------ .- –. -

0.1
100
90
80
70
60
50
40
30
20
10
0
Volume Percent Particle Size Distribution for K East Fueled Canister and Floor Sludge Without ConsolidatedSludge Samples
1 10 100
Particle Size (urn)
—
f
—
—
—
—
—
—
—
—
1000
P-
—
1!————————
r---~K East Fueled Canister
+K East Floor

.
XY
S4
1I I t I I I 1 t II I I I I I I I II I 1 I I ! !
I Ih I I
t w I . 1 I
Ii ● I ● I I I. h , I I Y t I 9 I
I II tI t I \l 1 x 1 + ,
I II I I K I \ I II I
1 I I I I \ I ,, 1 ,
t
I 1 I I \
I I I I I I 1 p+.. \ Ir I i
\ \
\
I I I I I I I I II I I I I I I 1 1
43
..—. — .— ...-— . . ..-— .—— - .— ——

. . :. 4 ,. .
Figure 17. Calorimeter in the Fume Hood During Calibration
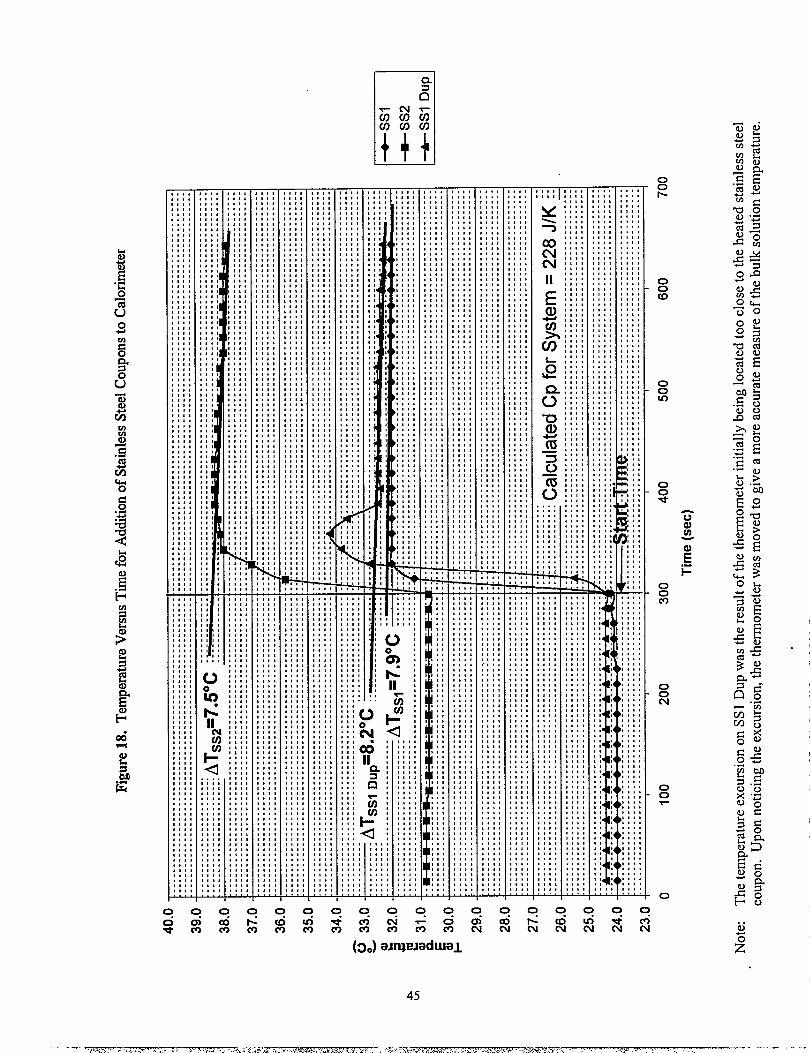
mx3mCNN
:~u)
s&
snaJ~
~
8:::,,,,,,,,,,,,,,,,,,,,,,,,,,,,,,,!,
,,i
,,,
,,,
,,,
,,,
,,,
,,,
,,,
,,,
,,,
,,,
,,,
,,,
,,,
,,,
,,,
,,,
,,,
,,,
l,,,,,i,,,,,,,,,,,,,,,,,
,,, ,,,,
,,, ,!,, ,!,, ,
,,, ,
!,, ,
,,, ,
,,, ,
,,, ,
,,, ,
!,, ,
,,, ,
,,, ,
,,, ,
,,, ,
,,, ,
0E
o0(0
o0m
o0*
o0m
o0N
o0
0
,,, ,II, ,,,, ,,,, ,
,,, ,,,, ,,,, ,,,, ,,,, ,,,, ,,,, ,,,, !
,,, ,,,, ,,,, ,,!, ,,,, ,,,, ,,,, ,,,, ,,,, ,
,,,1,,, ,,,$,
,,, ,
,,, ,
,,, ,
,,, ,
!,, ,,,, ,!,, ,,,, ,,,, ,,,, ,
,,, ,,
; ;n,,,,,,,,,,,,,,,,,,,,1,,,II,,,,,,,(,,,,,,,,!),,!,,!,,,,,,,,,,1,,,II
,,
,,
,,
,,
,,
,,
,,
,,
,,
,,
,!
,,
,,
,,
,,
,,
,,
,,
1,
,,
,,
,,
t,
,,
,,
,!,,,,,,t,,,,,,,,,,,,,,,,’,,,,,,,0,,,,
,!,,,,,,,,,,,$,,,,,),,,!,!,,,,,,,,,,,,,,,,,,,,,!,,,,,!,,,,,,,!,!
,,
,!
,,
,,
,,
,,
,,
,,
,,
,,
,,
,,
,,
,,
,,
,,
,,
,,
,,
,,
,,
,,
,,
,!,,,,
n,,,,,,,,,),,,!,,,,,,,,,,,,,!,,,1IL,,,,,,,3
,,
,,
,,
,,
,,
,,
,,
,,
,,
,,
,,
,,
1,II
,,
,,
,,
,,
,,
,,
,,
,,
!,
,,
,,
,,
,,
,,
,,
,,
.,
,,
,,
,,
,,
,,
,,
,,
,,
t,
,,
,,
,1
,,
,,
,,
,,
,,
~
,,
,,
,,
,,
,,
,,
,,
,,
,,
,,
,,
,!,,,,,,,,,,,,,,1,
,,
,,
,,
,,
,,
1,1,,,,!,!,!,!,,,,,!,!!,,,,,,,,,,!,,,,,,1,,,,,,,,,,!,,,!,,,!‘,
,,
,,
,,
,,
,,
1,,,
,,,,,,,,,,,,,,,,!,,,!,,,,,,,,,,,,,1,,,,,,,,,,,1,
,,
,,
,,
,,
,,
,,
,,
,,
,,
,,
,,
!,
,,
,,
,,
,,
,,
,,
,,
,,
,,
,,,,,,
t,
,,,,,,II,,,,,,,,,,,,,,,,!,
,,
,,
,,
,,
,,
,,
,,
,,
,,
,,
,,
,,
,,
,,
,,
,,
,,
1,
,,
,,
,,
,,
,,
,,
,,
,,
,,
,,
,,
,,
,,
,,
,,,,,,,,
,,,
,,,,,,,,,,,,,,,,,,,,,,,,,,,1,,,,,,,,,,,,1,1,
,,
,,
,,
,,
,,
,,
,,
,,
,,
,,
,,
,,
,,
,,
,,
,,,,,,,,,,,!
,,
,,
,,
,,
,,
,,
,,
,,
,,
,,
,,
,,
,,
,,
,,
,,
,,
,,
,,
,,
,,
,!,,,,1,
,,
,,
,,
,,
,,
,,
,,
,,
,,
,,
,,
,,
,,
,,
,,
,,
!,,,,,,,,,,,,,,,,,,,,,,,,,u,,n
,,
,,,,,,,,,,,,,,,,,,,,,,,,,,,,,,,,,,1,
,,
,,
,,
,,
,,
,,
,,
,,
,,
,,
,,
1,,,,,,,,,I ,,
,,
,,
,,
,,
,,
!,,,,!
,,
,,
,,
,,
,,
,,
,,
,,
,,
,,
,,
,,
,,
it
,!
,,
,,
,,
,,
,,
,,
,,
,,
,,
,,
,,
,,
,,
1,,,1,,1,,,’,,,,t,,,,,,)
,,
,,
,,
,,
,,
,,
,,
,,
,,
,,
,,
,,
,,
,,
,!4,,,,!!,
,,
,,,,,, ,,, , !
,,, , ,,, , ,
,,, , ,,, , ,,, ,
,,, , ,,, ! iii,
,,, , ,,, , ,,, ,
,,, , ,,, , ,,, ,
,,, , ,,, , ,,, ,
,,, , ,,, , ,,, ,
,,, , ,!, , Iii!
,,, , ,,, , iii,
,,, , ,,, , ,,, ,
,,, , ,,, , ,,, ,
,,, , ,,, , ,,, ,
,,, , ,,, , ,,, ,
,,, , ,,, , ,,, ,
,,, , ,,, , ,,, ,
,,, , ,,, i iii,
,,, , ,,, , ,,, ,
,,, , ,,, , ,,, ,
,,, , ,,, , ,,, !
,,, , ,,, , ,,, ,
,,, , ,,, , ,,, ,
,,, , ,,, , ,,, i
,,, , ,,, , ,,, ,
,,, ,,, ,
,,, , ,,
u ,, ,,, , ,,, ,,, L,,, , ,,, , 1,, ,
,, ,,, , ,!, ,
, ,, ,,, , ,,, ,
,, ,,, , ,,, ,
,, ,,, , ,,, ,
, ,,, ,,, , ,,, ,
., ,,, , ,,, ,
,, ,,, , ,,, ,
,, ,,, , ,,, ,
,, ,,, , ,,, ,
,, ,,, , ,,, ,
,, ,,, , ,,, ,
,, ,,, , ,,, ,
,,, ,,, ! ,,00,, ,,, , ,., ,4,, ,,, , ,,,0
, ,,, ,,, , ,,, ,
,, ,,, , ,,, ,
,, ,’, , Iii.
, ,,, ,,, , ,,, ,
,, ,,, , ,,, ,
,, ,,, , ,,, ,
, ,,, ,,, , ,,, ,
,, ,,, , ,,, ,
,, ,,, , ,,, ,
, ,,, ,,, , ,,!,
,, ,,, , ,,, ,
,, ,,, , ,,, ,
, ,,, ,,, , ,,, ,
,, ,,, , ,,, ,
,, ,,, , ‘,, ,
, ,,, ,,, , ,,, ,
,, ,,, , ),, ,
,, ,,, , ,,, ,
, ,,, ,,, , ,,, ,
,, ,,, , ,,, ,
,, ,,, , ,,, i
, ,,, ,,, , ,,, ,
,, ,,, , ,,, ,
,, ,,, , ,,, ,
,,, t,, , iii.
,,, 1,, , ,,, ,
,,, ,,, , ,,, ,
,,, ,,, , ,,, ,
,,, ,,, , ,,, ,
,,, ,,, , ,,, ,
,,, ,,, , ,,, i
,,, ,,, , ,,, ,
,!, ,,, , ,,, ,
,,, ,,, , ,,, ,
,,, ,,, , ,,, ,
,,, ,,, , ,,, ,
,,, ,,, , ,,, ,
,,, ,,, , ,,, ,
,,, ,,, , ,,, ,
,,, ,,, , ,,, ,
,,, ,,!, ,,, ,
,,, ,,, , ,,, ,
,,, , ,,, , ,,, ,
,,,
,,, ,,,, ,,,, ,,,!!
,,, ,
,,, ,
,,, ,
,!, ,,,, ,,!, ,
,,, ,
,,, ,
,,, ,
,,, ,
,,, ,
,,, ,
,,, ,
,,, ,
,,, ,
,,, ,
,,, ,
,,, ,
,,, ,
,,, ,
,,!,
,,, ,
,,, ,
,,, ,
,,, ,
,,, ,
,,, .
,,, ,
,,, ,
,,, ,
,s, ,S,, ,
i,, ,
,,, ,
,,, ,
i,, ,,
;,, ,,
1,, ,,,,, ,,,, ,,,, ,,,, ,,,, ,,,, ,,,, ,,,!,,,,1
,,, ,
,,, ,
,,, ,
,,, ,
,,, ,
,,, ,
,,, ,
-
- ..
Ll,,,,,$ ,,, ,i,,, ,,,,, ,,,,, ,,
Q: ::::3 8 ,08,
n ,,, ,,,,, ,,F:::::(n : ::::u) : ::::
l=- ,,, ,,4
,,, ,,,,, ,,,,, ,,,C, ,,, ,,i
,,, ,,, ,,,
,,, ,,, ,,,
,,, ,,, ,,,
,,, ,,, ,!,
,,, ,,, ,,,
,,, ,,, ,,,
,,, ,,, ,,,
,,, ,,, ,,,
,,, ,,, ,,,
c1;;,,,,‘,
,,
,,
,,
,,
,,
,,
,,
,,
,,
,,
,,
,,
,,
,,
,,
,,
,,
,, L,,,,,,,,,,,,,,,,,,,,,,,,,,,,,,,,,,,,,,,,,,,!
,,, ,,, ,,
,,, ,,, ,,
,,, ,, !,,
,,, ,,, ,,
,,, ,,, ,,
,,, ,,, ,,
,,, ,,, ,,
,,, ,,, ,!
,,, ,,, ,!
000.0000 0.00.00.00. 0.?00
o.cncor.&mul* mNd-mm c9coc9Lmco
Ommbcom-r mZC90JNNNN NN
(~o) aJ~I?JadLUi31
45
.--, -v<. . .. .. . ,..,N,,.i,-T .,7, . ---

----
(a)
(b)
Figure 19. Insoluble Residue from the >250 pm Fraction of the KC-2/3 Sludge CompositeAfter Treatment in 16 ~ Nitric Acid at -25°C.(a) shows sludge remained in the thimble following dissolution and someunreacted sludge may be trapped at the bottom, while(b) shows sludge was ejected from the thimble and well reacted.
46

(a)
Figure 20.
(c)
-._.
(b)
(d)
Insoluble Residue from the >250 pm Fraction of KC-5 After Reaction with 16 ~ Nitric Acid at-25”C.(a) shows unreacted black material trapped under a light colored layer (probably silicate gel);bubbles are continually released as the black material reacts with the acid.(b) and (c) show duplicate samples analyzed using a wider thimble with no unreacted sludge.(d) shows organic ion exchange resin floating on top of the acid following analysis of the thirdsample; organic ion exchange resin was observed following all three KC-5+250 ~m analyses.
47
—.—. ....... ,.... ....- ,, -. ...,.—= —-.. .. . ..... . ---- ,.-..— -— -— .. . . . . . .

J- . . . .
..
(a)
.
Figure 21.
(b)
Insoluble Residue from the >250-pm Fraction of the KC-4 Sludge CompositeAfler Treatment in 16 ~ Nitric Acid at -25°C. Both photographs showapproximately 50°/0of the sludge remained in the thimble followingdissolution but no evidence of unreacted sludge.
48

Figure 22. Temperature Versus Time for Dissolution of Samples fkom KC-4 P250
28.00 . . . . . . . . . . . . . . . . ------- . . . . . . . . . . . . . . -------- . . . . . . . . . . . . . . . . . . . . . . . . . ..- . . . . . . . . . . . . . . . . . . . . . . . . . . . . . . . . . . . . . . . . . . . . . . . . . . . . . . . . ----. . . . . . . . . . . . ---- . . . . . . . . ..- . . . . . . . . . . . . . . ------------------------ --------------- ---------------- -------------- ------------ -------------------- .- . . . . . . . . . . . . . . . . . . . . . . . . . . . . . . . . . . . . . . . . . . . . . . . . . . . . . . . . . . . . . . . . . . . . . . . . . . . . . . . . . ---------- -------- -------- ------------ ------------ . . . . . . . . .. ----- . . . . . . . . . . . . . . -------- . . . . . . . . . . . . . . . . . . . . . . . . . . . . . . . . . . . . . . . . . . . . . . . . . . . . . . . . . . . . . . . . -------- ---------- ------
27.50--------- ------
------- -------- . . . . . . . . . . . . . . . . . . . . . . . . . . -------- . . . . . . . . . . . . . . . .27.00- . . . . . . . . . . ..- . . . . . . . . . . . . . . . . . . . . . AT~~-4~up=3.50c.........................--------.............--------........- ...........--------.-------...........................................................................................................----------------------------..........----------------------------------------------------26.50-
---------- ---------- ---------- ---------- ----. . . . . . . . . . . . . . . . . . . . . . . . . . . . . . . -------- ---------- -------- -------- ------- ------- ---------- ---------- ----- -
-------- ------------ -------- -------- ------- -------- ------- -------- ---------- ------- ---- -
~ 26.00~
. . . . . . . . ..- ----------- . . . . . . . . . . . ----------- ------- -------- -------- . . . . . . . . . . . -. . . . . . . . . ..- . . . . . . . . . . . . . . . . . . . . . . . . . . . . . . . . . . . . . . . . . . . . . -
a! . . . . . . . . . . . . . ------------- ------------- ------------- ------------- --------------- --- -. . . . . . . . . . . . . . . . . . . . . . ------------- ----------- ----------- ------------ ----------- ----- . . . . . .
#! 25.00 - . . . . . . . . . . . . . . . . . . . _--...--....--.AT~~4=l.9°c ---------------------------------------------------------------~-.....-..........- ..........------------------------------------............--------------------..............................................--------..............................................................................-------.........---------------------------------------------------------24.50 - . . . . . . . . . . . . ---- -------- ------- . . ----- . . . . . . . . . . . . . . . . . . . . . . . . . . . . . . . . . . . . . . . . . . . . . . . . . . . . . . . . . . . . . . . . . . . . -------- . . . . . . . . . . . . . . . -
. . . . . . . . . . . . . . .
. .. ----- -. . . . . . . .-- . . . . . . . . . . . . . . . . . . . . . . . . . . . . . . . . . . . . . . . . -------- . . . . . . . . . . . . . . . . . . . . . . . . . . . . . . . . . . . . . . . . . . . . . . . . . . . . . . . . . . . . . . . .
. . . . . . . . . . . . . . . . . . . . . . . . . . . . . . . . . . . . . . . . . . . . . . . . . . . . . . . . . . . . . . . . . . . . . . . . . . . . . . . . . . -------- . . . . . . . . . . . . . . . . . . . . . . . . . . . . . . . . . . . . . ---- .24.00 - . . . . . . . . . . . . . . ------- . . . . . . . . . . . . . . -------- ------- ------- ------- ------- ------- ------- -------- ------- --------- ------- -------- . . . . . . . . . . . . . . . . . . . . . . . . . . . . . . . . . . . . . . . . . . . . . . . . . . . . . . . . . . . . . . . . . . . . . . . . . . . . . . . . . . . . . . . . . . . . . . . . . . . . . ------- - -
. . . . . . . . . . . . . . . . .. . ---- . .. ---- . . . . . . . . . . . . . . . . . . . . . . . . . . . . . . . . . . . . . . . . . . . . . . . . . . . ------- . . . . . . . ------- . . . . . . . . . . . . . . . . -------- ------- .-- . . . . . . . . . . . . . . . . . . . . . . . . . . . . . . . . . . . . . . . . . . . . . . . . . . . . . ------------ -------------- . . --------- ----------- ----------- ----------- ------- -
23.50 . . . . . . . ..- . . . . . . .. . ------- . ------- . . . . . . . . . . . . . . . . . . . . . . -------- . . . . . . . . . . . . . . . . . . . . . . . . . . . . . . . . . . . . ---------- --- -------- . . . . . . . . . --- Start Time --------------------------------------------------------------------------------------..........----------------- -----.---------.......----...................................-----....................-...............-......-.....-.........................................................-------........--------------------------------
23,00 4 1 I
0 500 1000
Time (see)
1500 2000 2500
1==1
. .. . .-. . . . . . .

Figure 23. Temperature Versus Time for Dissolution of Samples from KC-5 P250
WIo
29.00
[ .- . ..-. . . . . . . . . . . . . . . . . . . . . . . . . . . . . . . . . . . . . . . . . . . . . . . . . . . . . . . . . . . . . . . -------- . . . . . . . . . . . . . . . . . . . . . . . . . . . . . . . . . . . . . . . . . . . . . . . . . . . . . . . .
. . ----- ---
~i----.-...-.................................-------.......... -----.........-..........
28.00- AT~~.5=4.4°c‘---------------------..............-------....-------... .................-------............................----------------..............------
[ 1/...-----------...----...................-------.............................--------........--------..............-------.............-----.......-------....................................................................-------...................................---...................-------...........--------........--------------.....................-------........--------..................
27.00 I 11 I
25.00
-- . . . . . . . . . . . . . . . . . . . . . . . . . . . . . . .. ------- ------- . . ----- . . . . . . . -
I ---4-......--------....................................----.......-------........----------..-------............ .................... ATKC-5DUP=3,40C -----------------
I [{.............................-----...................................--------.......-------..........---------------.............-------..........................------..................................................--------------.......--------------------...............................................--------------.......---------------------.......-------..............--------------....----.....................------...................................-------..............-------............................--..--1 v.....-......................------............................--------------........-------...............----------------------....-----...............................................------.....................-----------..........................------------....l--------------------------------M----------------------------------------------------------------------------------------------------l
. . . ..-. . . . . . . . . . . . . . . . . . . . . . . . . . . . . . . . . . . . ------- . . . . . . . . . . . . . . . . . . . . . . ------- . . . . . . . . . . . . . . ------- .
24.00-. . . . . . . . . . . . . . . . . . . . . ------- . . . . . . . . . . . . . . . . . . . ---------- . . . . . . . . . . . . . . . . . . . . . . . . . . . . . . . . . . . . . . . . . . . . . . . . . ------- ------- . . . . . . . . . . . . .
L . . . ..-. . . . . . . . . . . . . . . . . . . . . . . . . .. ----- . . . . . . . . . . . . . . . . . . . . . . . . . . . . . . . . . . . . . . . . . . . . . . . . . . . . . . . . . . . . . . . ------- . . . . . . . . . . . . . . ------- . . .
‘“------------------------------ ---v-- Start Time --------------------------------------------------------------------............. .....-.........................................................-----23.00 , 1 1 , , ,
0 200 400 600 800 1000 1200
Time (see)
-+- KC-5
* KC-5 t)up

t1
,.,
Figure 24. Temperature Versus Time for Dissolution for First Two Samples from KC-2/3 P250
LA
29.00,.._.. . . . . . . . . . . . . . . . . . . . . . ..- ,.-... . . . . . . . . -------- . . . . . . . . . . . . . . . . . . . . . . . . . . . . . . . . . . . . . . . . . . . . . . . . . . . . . . . . . . . . . . . . . . . . . . . . . . . .. . . . . . . . . . . . . ..- . . . . . . . . . . . . . . . . . . . . . . . . . . . . . ..- . . . . . . . . . . ---------- . . . . . . . . . . . . . . . . . . . . . . . . . . . . . . . . . . . . . . . . . . . . . . . . . . -..---
28.00
27.00
25.00
24.00
23,00
. . . . . . . . . ..- . . . . . . . . . . . . . . . . . . . . . . . . . ------- . .-. . . ..- . ------ . . . . . . . . . . . . . . . . . . . . . . . . . . . . . . . . . . . . . . . . . . . . . . . . . . . --------
------- . . . . . . . . . . . . . . . . . . . . .-
I...........----------........
II.-...-...............----------.......................................................................--------.........................................................--------..............--------------..............................................-----------------------------........................--------.....................................................--------........----.......----------------..-----..-......................--------------...............................------..................---1 14/-------........................ .......................-------........................--------..................................-. . ..-. . . . . . . . . . . . . . . ------- . . . . .-. . ---------- . . ----- . . . . . . . . . . . . . . . . . . . . . . . . . . . . . .. . . . . . . . . . . . . . . . . . . . . . . . . . . . . . . .. ----- . . . . . . . . . . . . . . -------- .
b ‘--------------ATKc.a3=l.40C“-------------------............................... .-.......---------........................ .----
L-. . ..--- .----- .----------------n---- 4---------------------------------------------------------------------------------------------------- . . . . . . . . . . . . . . ------- . . . . . . . . . . . . . . . . . . . . . . . . . . . . . . . . . . . . . -------- . . . . . . . . -------- -.
1 I
t t.- . ..-. . . . . . . . ------- . . . . . . . . . . . . . . . . . . . . . . . . . . . . . . . . . . . . . . . . . . . . . . . . . . . . . . . . . . . . . . . . . . . . . . . . . . . . . . . . . . . . . . . . ------- . . . . . . . . . . . . .
t -1.--...................------------------------------.......-------..............................................................~--------- ------Start Time ------------------------------------------------------------------------..-----................. ............. -------...-------------------------.......-------................
0 200 400 600
Time (see)
800 1000 1200
EEE2
.-, . . . . .

Figure 25. Temperature Versus Time for Dissolution of Final Sample from KC-2/3 P250
uN
. . . . ..- . . . . . . . . . . . . . . . . . . . . . . . . . . . . . . . . . . . ------- . . . . . . . ------- ------- ------- ------- ------- ------- ------- ------- ------- ------- -. . . . . .
. . . . . . . . . . . . . . . . . . . . . . . . . . . . . . . . . . . . . . . . . . . . . . . . . . . . . . . . . . . . . . . . . . . . . . . . . . . . ----------- ------------ ----------- ------------ -----------
. .. ---- . . . . . . . . . ..- . . . . . . . . . . . ------------ . . . . . . . . . . . . . . . . . . . . . . . . . . . . . . . . . . . ------------ ------------ ------------ ------------ --------
. . . . . . . . . . . . . . . . . . . . . . . . . . . . . . . . . . . . . . . . ----------- ------------ ------------ ------------ ------------ ----------- ----------- ------------
. . . . . . . . . . . . . . . . . . . . . . . . . . . . . ------- ------- ------- ------- ------- ------- ------- ------- ------- ------- ------- ------- ------- ------- - . . . . . .
1...................................-------... ............-----------............----------.-...-.......................................ATKC.2~Dup~=4.5or5.6°C ---------------------------------------------1. . . . . . . . . . . . . . . . . . . . . . ------- ------- ------- --- .. ---- ------ . . . . . . . . . . . . . . . . ----- . . . . . . ------
. . . . . . .. ---- . . . . . . . . . . . . . . . . . . . . . . . . . . . . ------- ------- ------- ------- ------- ------- ------- ------- ------- ------- ------- ------- -------.- . . . . . . -.. ------- ------- . . . . . . . . . . . . . . . . . . . . . ------- . . . . . . . . . . . . . . . . . . . . . . . . . . . . . . . . . . . . . . . . . . ------- . . . . . . . . . . . . . . . . . . . -------. . . . . . . . .- . . . . . . . . . . . . . . . . . . . . . . . . . . . . . . . . . . . . . . . . . . . . . . . . . . ----- ----- ----- ----- ----- ------ ------ ------ ----- ----- ------ ------ ------ . . . . . . .. ---- . . . . . . . . . . . . . . . . . . . . . --- . .. ---- . . . . . . . ------- . . . . . . . . . . . . . . . . . . . . . . . . . . . . . . . . . . . . . . . . . . . . . . . . . . . . . . . . . . . . . . . . . ----
. .. ---- . -- . . . . . ------- -------- ------- ------- ------- ------- ------- -- . . . . . . . . ..- . . . . . . . . . . . . . . . . . . . . . . . . . . . . . . ---------- ----------
------- ------- . . . . . . . ------ . . . . . . . . . . . . . . . . . . . . . . . . . . . . ------- . . . . . . . ------- ----- . . . . . . . . . . . . . . . . ------ . . . . . .. ------ . .- . . ..- ------- . . -. . . . . . . . . . . . . -----
+ KC2/3 Dllp 3. ..-. . . . .- . ..- . . . . . . . . . . . . . . . . . . . . . . . . . . . . . . . . . . . . . . . . . . . . . . . . . . . . . . . . . . . . . . . . . . . ----------- ----------- ----------- ----------- ------
. . . . . . . . . . . . . . . . . . . . . . . . . . . . . . . . . . . -------- ------- ------- ------- ------- ------- ------- -------- ------- ------- ------- -----
------- . - . ----- ----- . . . . . . . . . . . . . . . . . . . . . . . . . . . . . . . . . . . . . . . . ----- . . . . . . ----- . . . . . . ----- ----- ----- -------- ----- ----- ----- ----- -. . . . . . .
-------. . . . . . . . . . . ----- . . . . . .
. . . . . . . . . . . . . . . . . . . . . . . . . . . . . . . ------------ ------------ ------------ ----------- ----------- ------------ ----------- ----------- ----------
. .. ---- . . . . . . . . . . . . . . . . . . . . . . . . . . . . . . . . . . . . . . . . . . . . . . . . . . . . . . . . . . . . ----------- . . . . . . . . . . . . ------------ . . . . . . . . . . . ----------- ---------
. . . ..-. . . . . . . . ------- ------- ------- ------- ------- ------- ------- ------- ------- ------- ------- ------- ------- ------- ------- -------
‘~ sta~ Time :::::::::::::::::::::::~::::~::::~:::::I::::::::::::::: I:::I::::I:::::::::1::::::1:::::1: I:::l:.- .. . . . .. ...-. . . .. .. ---- .. . . . . . ------- ------ ------- ------- ------- ------- ------- ------- ------- ------- ------- ------- ------- ------- ------- -------
0 500 1000 1500 2000 2500 3000 3500 4000 4500 5000

I I I I I I 1
!
II I
p I,,
u
1=
——
o0
M
1111111111111 I JFlI I ! I I I I I I I I I
I I I 1 1 a ,
I I I! I I I I I I
I I II I [ I I I I
I I I I I I I I I I I 1 1
I I I I I I I I I I I b
I
.7” --~>, .. .’%. + .-. . ..<’. ., . -. ..%—,.,..~ . r=: .-. ,<-. .. . . . , . . .. . ..T--..,.2!Z?.-..WF!6, ., ,“. ,. —-------- -
//
/
/ ‘(
o 0“0 o 0 0 0 0 0cm co b u) a e C9 N-
(%IOA) SP!IOS PalUaS
53
-1
1

/ -
7- 0“ 0“ o- 0“ 0“;yg) aw~ofiu!jna;
54

(a)
—
(b)
------- -
—
(d)
Figure 28. Samples from Settling Studies.(a) KC-1 showed no layering following settling,(b) a coarse layer settled on the bottom of KC-4,(c) a similar coarselayer settled on the bottom of KC-5, and(d) a light-colored layer is visible on top of a layer of darker-coloredmaterial from KC-2/3 M250. The supernatant in KC-2/3 M250 did notclear after approximately 2 weeks.
55

4.0 References
Baker, R. B., A. L. Pitner, T. L. Welsh, B. J. Makenas, and K. L. Pearce. 1999. Sampling and AnalysisPlan for Consolidated Sludge Samples from the Canisters and Floor of the 105-K East Basin.HNF-40 16, Rev. O. Duke Engineering& Services Hanford, Inc., Richland, Washington.
Blaine, H. T. 1960. Dissolution of Power Reactor Fuel Cores. HW-66320, Hanford Atomic ProductsOperation, Richland, Washington.
Bredt, P. R., J. M. Tingey, and A. J. Schmidt. 1999. “Compilation and Integration of K Basin SludgeParticle Size Analysis Data.” PNNL-13376 Pacific Northwest National Laboratory, Richland,Washington.
Gauglitz, P. A., S. D. Rassat, P. R. Bredt, J. H. Konynenbelt, S. M. Tingey, and D. P. Mendoza. 1996.Mechanism of Gas Bubble Retention and Release: Results for Hanford Waste Tanks 241-S-102 and 241-SY-103 and Single-Shell Tank Simulants. PNNL-1 1298, Pacific Northwest National Laboratory, RichlandWashington.
Hecht, S. L. 1999. System Design Description for the Consolidated Sludge Sampling System for K BasinsFloor and Fuel Canisters. HNF-3971, Rev. O.Duke Engineering& Services Hanford, Richland,Washington.
Herrmann B. 1984. Auflosung unbestrahlter UOz-Peliets in Salpetersaure. KfK 3673,Kemforschungszentrum Karlsruhe, Karlsrune, Germany.
Linde, D. R. 1993. Handbook of Chemist~ and Physics, 49ti ed. CRC Press, Ann Arbor, Michigan 1993.
Makenas, B. J., T. L. Welsh, P.R. Bredt, G. R. Golcar, A. J. Schmidt, K. L. Silvers, J. M. Tingey, A. H.Zacher, and R. B. Baker. 1999. Analysis of Internal Sludge and Cladding Coatings from N-Reactor FuelStored in Hanford K Basins. HNT-3589, Rev. O,Fluor Daniel Hanford, Richland, Washington.
Makenas, B. J., T. L. Welsh, R. B. Baker, G. R. Golcar, P. R. Bredt, A. J. Schmidt, and J. M. Tingey.1998. Analysis of Sludge from Hanford K West Basin Canisters. HNF- 1728, Fluor Daniel Hanford,Richland, Washington.
Makenas, B. J., T. L. Welsh, R. B. Baker, E. W. Hoppe, A. J. Schmidt, J. Abrefah, J. M. Tingey, P. R.Bredt, and G. R. Golcar. 1997. “Analysis of Sludge from Hanford K East Basin Canisters.” HNF-SP-1201, DE&S Hanford, Inc., Richland, Washington.
Makenas, B. J., T. L. Welsh, R. B. Baker, D. R. Hansen, and G. R. Golcar. 1996. “Analysis of Sludgefrom Hanford K East Basin Floor and Weasel Pit.” WHC-SP-1 182, Westinghouse Hanford Company,Richland, Washington.
Pearce, K. L., S. C. Klimper, and T. A. Flament. 1998. 105-K Basin Material Design Basis FeedDescription for Spent Nuclear Fuel Project Facilities, Volume 2, Sludge. HNF-SD-T1-009, Vol. 2, Rev.2. Numatec Hanford Corporation, Richland, Washington.
Petersen, C. A., A. J. Schmidt, and R. B. Baker. 1999. Revised Sampling Campaigns to Provide Sludgefor Treatment Process Testing. HNF-4015. Numatec Hanford Corporation, Richland, Washington.
56
Pitner, A. L. 1999. K East Basin Sludge/Sampling 1999 Campaigns. HNF-4746, Rev. O. NumatecHanford Corporation, Richland, Washington.
Swanson J. L., L. A. Bray, H. E. Kjarmo, J. L. Ryan, C. L. Matsuzaki, S. G. Pitman, and J. H. Haberman.1985. Laboratory Studies of Shear/Leach Processing of Zircaloy Clad Metallic Uranium Reactor Fuel.PNL-5708, Pacific Northwest National Laboratory, Richland, Washington.
Tereschenko, L. T. et al. 1968. “Equilibrium Between Nitrogen Oxides and Nitric Acid Solutions.”Zhurnal Priladnoi Khimii 41(3):487.
Wagman D. D., W. H. Evans, V. B. Parker, R. H. Schumm, I. Halow, S. M. Bailey, K. L. Chumey, andR. L. Nuttall. 1982. “The NBS Tables of Chemical Thermodynamic Properties.” Journal of Physical andChemical Reference Data 11, Supplement Number 2.
57
--x- .7-..--,--- —------- -.—