Testbeds - rewerse.net · Testbeds Fabian Abel1, Aitor Arnaiz Irigaray2, Matteo Baldoni3, Cristina...
131
A3-D11 Testbeds Project title: Reasoning on the Web with Rules and Semantics Project acronym: REWERSE Project number: IST-2004-506779 Project instrument: EU FP6 Network of Excellence (NoE) Project thematic priority: Priority 2: Information Society Technologies (IST) Document type: D (deliverable) Nature of document: R (report) Dissemination level: PU (public) Document number: IST506779/Turin/A3-D11/D/PU/b1 Responsible editors: M. Baldoni, C. Baroglio, V. Patti Reviewers: Daniel Krause (internal) Contributing participants: Hannover, Teckniker, Turin, Warsaw Contributing workpackages: all partners Contractual date of deliverable: February 29, 2008 Actual submission date: 14 February 2008 Abstract This deliverable reports the most recent advancements of research activity carried on within the A3 working group, particularly concerning the testbeds. More specifically, the report fo- cusses on the BEATCA application and on curricula modeling, planning and validation. We also briefly describe the DYNAWeb platform for component integration and reuse. Keyword List semantic web, personalization, testbeds, clustering, elearning, web services Project co-funded by the European Commission and the Swiss Federal Office for Education and Science within the Sixth Framework Programme. c REWERSE 2008.
Transcript of Testbeds - rewerse.net · Testbeds Fabian Abel1, Aitor Arnaiz Irigaray2, Matteo Baldoni3, Cristina...
A3-D11
Testbeds
Project title: Reasoning on the Web with Rules and SemanticsProject acronym: REWERSEProject number: IST-2004-506779Project instrument: EU FP6 Network of Excellence (NoE)Project thematic priority: Priority 2: Information Society Technologies (IST)Document type: D (deliverable)Nature of document: R (report)Dissemination level: PU (public)Document number: IST506779/Turin/A3-D11/D/PU/b1Responsible editors: M. Baldoni, C. Baroglio, V. PattiReviewers: Daniel Krause (internal)Contributing participants: Hannover, Teckniker, Turin, WarsawContributing workpackages: all partnersContractual date of deliverable: February 29, 2008Actual submission date: 14 February 2008
AbstractThis deliverable reports the most recent advancements of research activity carried on withinthe A3 working group, particularly concerning the testbeds. More specifically, the report fo-cusses on the BEATCA application and on curricula modeling, planning and validation. Wealso briefly describe the DYNAWeb platform for component integration and reuse.
Keyword Listsemantic web, personalization, testbeds, clustering, elearning, web services
Project co-funded by the European Commission and the Swiss Federal Office for Education and Science within
the Sixth Framework Programme.
c© REWERSE 2008.

ii

Testbeds
Fabian Abel1, Aitor Arnaiz Irigaray2, Matteo Baldoni3, Cristina Baroglio3, IngoBrunkhort1, Nicola Henze1, Mieczyslaw A. Klopotek4, Vivana Patti3, Slawomir
Wierzchon4
1 L3S Research Center, University of Hannover, GermanyEmail: [email protected]
2 Fundacion Tekniker, SpainEmail: [email protected]
3 Dipartimento di Informatica, Universita degli Studi di Torino ItalyEmail: {baldoni,baroglio,patti}@di.unito.it
4 Instytut Podstaw Infornmatyki Polskiej Akademii Nauk, WarszawaPoland
Email: [email protected],[email protected]
14 February 2008
AbstractThis deliverable reports the most recent advancements of research activity carried on withinthe A3 working group, particularly concerning the testbeds. More specifically, the report fo-cusses on the BEATCA application and on curricula modeling, planning and validation. Wealso briefly describe the DYNAWeb platform for component integration and reuse.
Keyword Listsemantic web, personalization, testbeds, clustering, elearning, web services

iv
Contents
1 Introduction 1
2 The BEATCA application 22.1 Clustering Space . . . . . . . . . . . . . . . . . . . . . . . . . . . . . . . . . . . . 22.2 Clustering Space Approximation . . . . . . . . . . . . . . . . . . . . . . . . . . . 62.3 Architecture . . . . . . . . . . . . . . . . . . . . . . . . . . . . . . . . . . . . . . . 82.4 Data Structures . . . . . . . . . . . . . . . . . . . . . . . . . . . . . . . . . . . . . 82.5 Personalization and Recommendation . . . . . . . . . . . . . . . . . . . . . . . . 9
3 Curriculum modelling, planning and validation 123.1 Curricula representation and reasoning . . . . . . . . . . . . . . . . . . . . . . . . 14
3.1.1 Learning resources and curricula . . . . . . . . . . . . . . . . . . . . . . . 143.1.2 DCML: A Declarative Curricula Model Language . . . . . . . . . . . . . . 153.1.3 Representing curricula as activity diagrams . . . . . . . . . . . . . . . . . 18
3.2 Planning and Validation . . . . . . . . . . . . . . . . . . . . . . . . . . . . . . . . 203.3 Implementation in the Personal Reader Framework . . . . . . . . . . . . . . . . . 22
3.3.1 Metadata Description of Courses . . . . . . . . . . . . . . . . . . . . . . . 233.3.2 The User Interface and Syndication Service . . . . . . . . . . . . . . . . . 243.3.3 The Curriculum Planning PService . . . . . . . . . . . . . . . . . . . . . . 253.3.4 The Curriculum Validation PService . . . . . . . . . . . . . . . . . . . . . 263.3.5 Conclusions . . . . . . . . . . . . . . . . . . . . . . . . . . . . . . . . . . . 29
4 DYNAWeb 324.1 Ontology . . . . . . . . . . . . . . . . . . . . . . . . . . . . . . . . . . . . . . . . 334.2 Semantic web services . . . . . . . . . . . . . . . . . . . . . . . . . . . . . . . . . 33
5 Conclusion 34
6 Appendix 35
v

vi
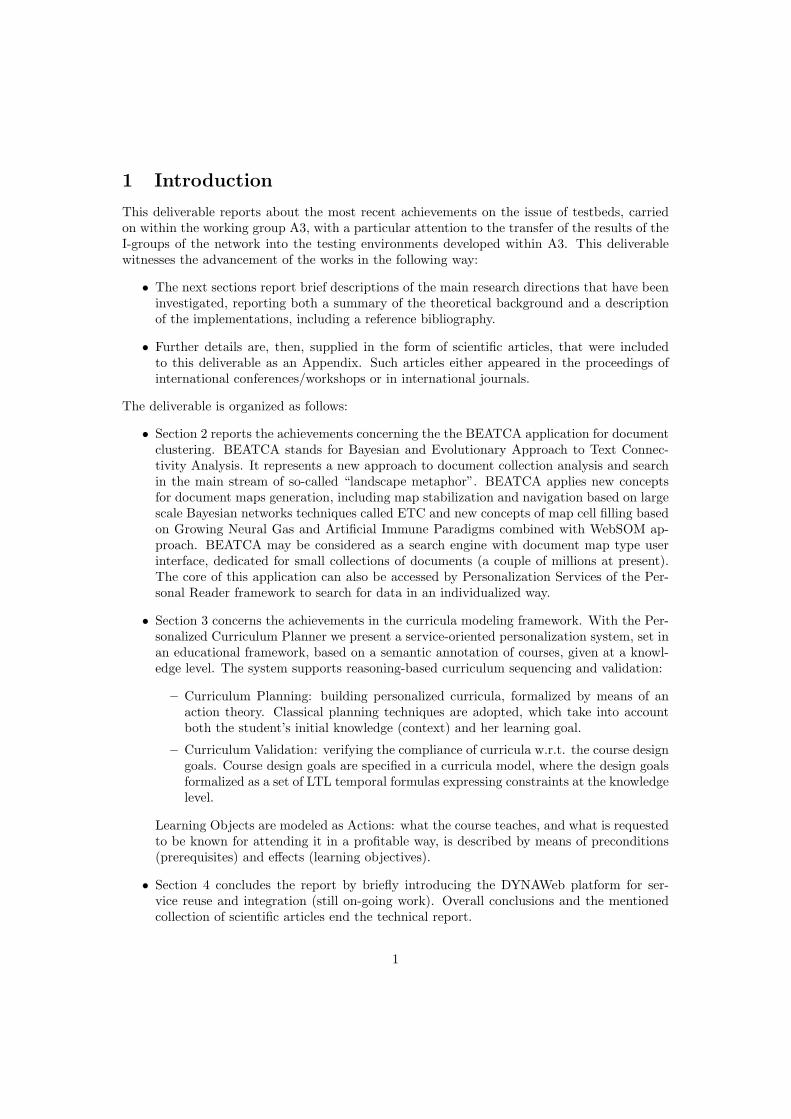
1 Introduction
This deliverable reports about the most recent achievements on the issue of testbeds, carriedon within the working group A3, with a particular attention to the transfer of the results of theI-groups of the network into the testing environments developed within A3. This deliverablewitnesses the advancement of the works in the following way:
• The next sections report brief descriptions of the main research directions that have beeninvestigated, reporting both a summary of the theoretical background and a descriptionof the implementations, including a reference bibliography.
• Further details are, then, supplied in the form of scientific articles, that were includedto this deliverable as an Appendix. Such articles either appeared in the proceedings ofinternational conferences/workshops or in international journals.
The deliverable is organized as follows:
• Section 2 reports the achievements concerning the the BEATCA application for documentclustering. BEATCA stands for Bayesian and Evolutionary Approach to Text Connec-tivity Analysis. It represents a new approach to document collection analysis and searchin the main stream of so-called “landscape metaphor”. BEATCA applies new conceptsfor document maps generation, including map stabilization and navigation based on largescale Bayesian networks techniques called ETC and new concepts of map cell filling basedon Growing Neural Gas and Artificial Immune Paradigms combined with WebSOM ap-proach. BEATCA may be considered as a search engine with document map type userinterface, dedicated for small collections of documents (a couple of millions at present).The core of this application can also be accessed by Personalization Services of the Per-sonal Reader framework to search for data in an individualized way.
• Section 3 concerns the achievements in the curricula modeling framework. With the Per-sonalized Curriculum Planner we present a service-oriented personalization system, set inan educational framework, based on a semantic annotation of courses, given at a knowl-edge level. The system supports reasoning-based curriculum sequencing and validation:
– Curriculum Planning: building personalized curricula, formalized by means of anaction theory. Classical planning techniques are adopted, which take into accountboth the student’s initial knowledge (context) and her learning goal.
– Curriculum Validation: verifying the compliance of curricula w.r.t. the course designgoals. Course design goals are specified in a curricula model, where the design goalsformalized as a set of LTL temporal formulas expressing constraints at the knowledgelevel.
Learning Objects are modeled as Actions: what the course teaches, and what is requestedto be known for attending it in a profitable way, is described by means of preconditions(prerequisites) and effects (learning objectives).
• Section 4 concludes the report by briefly introducing the DYNAWeb platform for ser-vice reuse and integration (still on-going work). Overall conclusions and the mentionedcollection of scientific articles end the technical report.
1
2 The BEATCA application
Clustering of Web documents, especially in large and heterogeneous collections, is a challengingtask, both in terms of processing time complexity and clustering quality. But the most chal-lenging part is the way how the clustering information is conveyed to the end user and how itmeets his expectations (personalization).
Note that a text document is usually a very complex information structure from the pointof view of human beings dealing with this document. But actually a computer system fullyunderstanding the document contents is beyond technological possibilities. Therefore somekinds of approximation to the content are done. Documents are frequently treated as a bag ofwords in computer models, and the documents are viewed as points in term-document vectorspace, but this approach turns out to be insufficient, hence more complex representations, bothof the content of a single document and their collections are investigated.
In the recent years, various projects (WebSOM, [11, 12, 13, 7], Themescape etc.) were aimedat developing a new form of cluster description – a visual document map representation. Ina two-dimensional space, consisting of quadratic or hexagonal cells, the split into clusters isrepresented as an assignment of documents to cells in such a way, that documents assigned tocells are as homogenous as possible and cells (clusters) containing similar documents are placedclose to one another on the map, and map regions are labeled with best-fitting terms from thedocuments. An inversion of the clustering (that is clustering of terms instead of documents) isalso possible.
It is generally believed that individual information needs of users may differ and there is ageneral feeling that therefore also the data processing results should accommodate to the profileof the user. Countless methods and ways of user profile representation and acquisition have beendesigned so far. The problem with map-like representation of document collections, however,lies in the pretty expensive processing / high complexity (in terms of time and space) so that apersonalized ad-hoc representation is virtually impossible. With the BEATCA project we havemade essential steps to contest this view and claim that personalization of map representationof large scale document collections is possible by a careful separation of the concept of individualneeds from the concept of common knowledge. This leads to the possibility of separation ofcomputationally intense tasks of identification of the structure of clustering space from therelatively less resource consuming pure presentation part.
2.1 Clustering Space
It is usually assumed that personalization is needed because of cultural, ethnical etc. differencesthat influence the world of values, the attitudes and the views. So, in the particular case ofclustering, the distances (or more strictly speaking dissimilarities) between the objects maychange from person to person. So a personalization under this assumption would be reducedto a total re-clustering of the objects.
We disagree with this assumption. While avoiding here a deeper philosophical discussionof the issue, let us point at some issues significant for the text processing task. Human beingspossess to a large extent an objective world which they describe with a common set of concepts(a vocabulary) that is intended for them to communicate to other human beings. So the vastmajority of concepts is shared and their meaning not determined by values, attitudes etc. Whatdiffers the human beings is the current task they are interested in. So if discussing e.g. an issuein biology, one does not care about concepts important for chemical engineering. Hence it is
2

not the personal attitude, but rather the context in which an issue is discussed that impactsthe feeling of dissimilarity of opinions (in this case documents).
Therefore, in our opinion, the proper approach to personalization has to be well founded onthe proper representation of document information.
It has been generally agreed that the processing of textual information, especially at largescale, requires a simplification of the document representation. So a document is treated as abag of words (without bothering about sentence structure). It is represented in the space ofdocuments (with dimensions being spread by words and phrases, that is terms) as a point withcoordinates being a function of the frequency of each term in the document. The similaritybetween two documents is measured as a cosine of the angle between the vectors drawn fromthe original of the coordinate system to these points. Furthermore, dimensionality reductionmay be of high importance [6]
So the weight of a term in the document is calculated as the so-called tfidf (term frequencytimes the inverse document frequency) computed according to the formula:
wt,d = ft,d × log|D|f
(t)D
(1)
where ft,d is the number of occurrences of term t in document d, |D| is the cardinality of theset of documents, and f
(t)D is the number of documents in collection D containing at least one
occurrence of term t.A document d is described by a vector d = (wt1 , . . . , wt|T |), where T is the set of terms.
Usually, the document is turned into a normalized form di = (wit1 , . . . , wit|T |) where di has aunit length.
We notice immediately that the weights of terms in a document are influenced by theirdistribution in entire document collection. If we look, however, at any process of clustering, weimmediately notice that weights calculated by the very same method, but within any reasonable(homogenous) cluster, not being a random subsample of the whole collection, would exhibitconsiderable differences to the global weighing scheme. However, this fact is actually ignoredby most researchers.
So our first methodological step is to resign from the rigid term weighing scheme for the sakeof local differentiation of term weighing taking into account the local context (of the identifiedcluster). Though this vision of document similarity works quite well in practice, agreeing withhuman view of text similarity, it has been early recognized, that some terms should be weighedmore than other. One should reject the common words (stop-words) appearing frequently inall documents, as well as those which appear quite seldom.
But we do not want to replace global term weighing scheme with a global weighing scheme.Rather than this, we reconsider the impact of the documents that are far away from clustercore, on the term weighing. Another important point is that terms specific for a given clustershould weigh more than terms not specific for any cluster. Last not least, let us relax thenotion of a cluster to the concept of clustering space. Let us speak of a point p in the documentspace (a point of an unit hyper-sphere) as a vector p = (wit1 , O,wit|T |) where ||p|| = 1 (unitlength). Each such a point can be treated as cluster center in a (continuous) clustering space.We can then define, for each document d, a membership function md,C(p) in the style of fuzzyset membership function [2], for example as
md,C(p) =∑t∈T
wit(di) · wit(p) (2)
3
that is the dot product of vectors di and p.Given this concept, we can define the specificity st,C of a term t in a cluster C(p) as
st,C(p) = |C(p)| ·∑
d∈D
(ft,d ·md,C(p)
)ft,D ·
∑d∈D md,C(p)
(3)
where ft,d is (as earlier) the number of occurrences of term t in document d, ft,D is the number ofoccurrences of term t in document collection D, and |C(p)| is the fuzzy cardinality of documentsat point p, defined as
|C(p)| =∑d∈D
µd,C(p) (4)
where µd,C is the normalized membership:
µd,C(p) =md,C(p)∫
p∈HSmd,C(p)
and HS is the unit hyper-sphere.In this way we arrive at a new (contextual [5]) term weighing formula for term t in the
document d from the point of view of the
wt,d,C(p) = st,C(p) × ft,d × log|C(p)|f
(t)C(p)
(5)
where f(t)C(p) is the fuzzy count of documents in collection C(p) containing at least one occurrence
of term t,f
(t)C(p) =
∑{d:ft,d>0}
md,C(p) (6)
For consistency, if f(t)C(p) = 0 we define wt,d,C(p) = 0.
The universal weight tfidf given by equation (1) will be replaced by the concept of anaveraged local weight
wt,d =
∫p∈HS
md,C(p) · wt,d,C(p)∫p∈HS
md,C(p)
(7)
where HS is the unit hyper-sphere.Note that the definition of term weights wt,d becomes recursive in this way (md,C(p) is used
here, which is computed in equation (2) based on wt,d itself) and the fixpoint of this recursionis the intended meaning of term weight.
Our further concern is the way how typical hierarchical (or other multistage) algorithmshandle lower level clusters. The cluster is viewed as a kind of averaged document, eventuallyannotated with standard deviation of term frequencies and/or term weights. In our opinion, thedistribution (approximated in our approach by a discrete histogram) of the term weight (treatedas a random variable) reflects much better the linguistic nature of data. The clusters should beformed not as hyperspheres around some center, but rather as collections of documents withterms used in a similar way. This was confirmed by our reclassification experiments [4], showinghigher stability of histogram-based cluster description versus centroid-based representation1.
1reclassification measure evaluates consistency of the model-derived clustering with the histogram-basedclustering space description (cf. [4])
4
So for any point p in the clustering space and any term t we define a term-weight distributionas one approximated by the histogram in the following manner: Let ∆(wi, t) be a discretizationof the normalized weights for the term t, assigning a weight for a term the integer identifierof the interval it belongs to (higher interval identifiers denote higher weights). Let χ(d, t, q, p)be the characteristic function of the term t in the document d and the discretization intervalidentifier q at point p, equal to md,C(p) if q = ∆(wit,d,C(p), t), and equal zero otherwise. Thenthe histogram h(t, p, q) is defined as
h(t, p, q) =∑d∈D
χ(d, t, q, p) (8)
With hi we denote a histogram normalized in such a way that the sum over all intervals q fora given t and p is equal 1:
h′(t, p, q) =h(t, p, q)∑q h(t, p, q)
(9)
We can easily come to the conclusion, when looking at typical term histograms that termssignificant for a cluster would be ones that do not occur too frequently nor too rarely, havediversified range of values and have many non-zero intervals, especially with high indices.
Hence the significance of a term t for the clustering point p may be defined as
mt,C =
∑q [q · log (hi(t, p, q))]
Qt(10)
where Qt is the number of intervals for the term t under discretization.Let us denote with H(t, p, q) the right cumulative histograms, that is H(t, p, q) =
∑k≥q h(t, p, k).
The right cumulative histograms are deemed to reflect the idea, that terms with more weightshould be more visible. For technical reasons Hi is a histogram normalized in the same way ashi.
Let us measure the divergence between clustering points pi, pj with respect to term t as(Hellinger divergence, called also Hellinger-Matsushita-Bhattacharya divergence, [1])
Hellk(pi, pj , t) =√∑
q
(Hi(t, pi, q)(1/k)nHi(t, pj , q)(1/k)
)k (11)
Finally let us measure the divergence between clustering points pi, pj as such as
dst(pi, pj) =∑
t∈T mt,C(pi),C(pj) ·Hellk(pi, pj , t)∑t∈T mt,C(pi),C(pj)
(12)
wheremt,C(pi),C(pj) =
√(mt,C(pi
+ 1) · (mt,,C(pj) + 1)− 1
With this definition, we can speak of a general notion of a cluster as islands in the clusteringspace such that the divergence within them differs not significantly, and there exist at least ndocuments belonging predominantly to such an island. Thus, it can be treated as a dissimilaritymeasure.
It may be easily deduced that equation (10) gives also interesting possibilities of labeling ofcluster space with meaningful sets of terms (concepts).
5
User-related sources of information Let us now turn to the user related information.Some documents may be pre-labeled by the user (with category, liking, etc.), there may be pastqueries available etc.
Note that the contextual document space, as described in the previous section, may beviewed as a pure space with some material objects causing a kind of curvature of this space.
The user-related sources can be viewed as consisting of two types of documents: materialobjects (all the positively perceived, relevant information) and the anti-material objects (all thenegatively perceived information).
The user-related documents may be also represented in a clustering space, in at least twodifferent ways:
• in separate user-material, user-anti-material and proper document clustering spaces - inthis case a superposition of these spaces would serve as an additional labeling of the properdocument space, beside the original labels derived from document collection content.
• in a joint space >n in this case user-related information will transform the documentspace of the document collection.
While the second approach may be considered as a stronger personalization, it will be moreresource consuming and raises the issue of pondering the impact of user related documentsagainst the entire collection, and also that of the relation between positive and negative userinformation. The first approach will be for sure much less resource consuming, because theprocessing of the big entire document collection has to be done only once, and the user relatedinformation is usually of marginal size and can be processed in a speedy way.
2.2 Clustering Space Approximation
If we look at the clustering space as a continuum, it is obvious, that we cannot consider clustersin isolation, but we want to take relationships between them into account. It is also obvious thatneed to provide a finite, discrete approximation of this continuum. To achieve it, the usuallywide areas of clustering space of next to zero proximity to the documents will be ignored, aswell as those terms that within the given subspace are of marginal significance. This is causedby the fact that each document modifies the space close to it having marginal impact of therest. So the space may be greedy subdivided into non-empty subspaces that are deemed to belinked if they adhere to one another, and not, if they are of next to zero similarity.
The process, that we apply to approximate the clustering space [10], which we call AdaptiveClustering Algorithm, starts with splitting of the document collection into a set of roughlyequally sized sub-collections using the expression (1) as an approximation of term weights fordocument similarity computation in a traditional clustering algorithm. We work in a hierarchi-cal divisive mode, using the algorithm to split the collection in a small number of subcollectionsand apply further splitting to sub-collections of too big size. At the end too small clusters aremerged with most similar ones. As a next iteration for each sub-collection, being now treatedas a context (as it is now feasible), an iterative recomputation of term weights according toequation (7) with respect to cluster center, making the simplifying assumption that documentsfrom other contexts have no impact. Within each context, the dictionaries of terms are reducedremoving insignificant terms in a given context (different terms may be zeroed in different con-texts). Subsequently the inter-document structure is formed. For this purpose one of the knownnetworking clustering algorithms is used, either the growing neural gas [8] or idiotypic (artifi-cial immune) network [14, 3]. Finally we turn back to the global set of contexts and apply a
6
networking clustering algorithm to representatives of each context. This time, the histogramsof contexts are applied to compute a measure of similarity between contexts >n see equation(12). While applying the networking clustering, we additionally compute so-called major topics,that is a split of the (sub)collection into up to 6 sub-clusters, the representatives of which aredeemed to be major topics of the collection.
In this way, an approximation of the clustering space is obtained. In case of visualization, theWebSOM algorithm is applied to context representatives, in case one wants to view the globalmap, and to neural gas cells, or immune network cells in case of detailed view of a context. Thecomputation of the map given the clustering space model is drastically simplified because e.g.with a collection of 12,000,000 documents we need to cluster only 400 representatives. So givensuch a cluster network, its projection onto a flat rigid document map structure, with treatingeach whole cluster as a single document, is a dramatically simpler task than the map creationprocess for individual documents.
Our implementation of WebSOM differs from the original one in a number of ways, acceler-ating the processing significantly. One of the features is the topic-sensitive initialization. WhileWebSOM assigns random initial cluster centers for map cells, we distribute evenly the vectorsof major topics over the map and initialize the remaining cells with in-between values (withslight noise). In this way the maps are learned usually quicker and are more stable (no drasticchanges from projection to projection).
We have demonstrated in our earlier work [3, 4, 5, 10] that such an approach to documentspace modeling is stable, scalable and can be run in an incremental manner.
Exploiting user-related sources With this background we can explain our approach topersonalization. We treat the document collection as a piece of knowledge that is esteemedby any user in the same way. So the identified clusters and the identified interrelationshipsbetween them are objective, independent of the user. The user at a given moment may be,however, interested to view the collection from a different direction. So the personalization maybe reduced to the act of projection of the cluster network onto the flat map, that is, contraryto projection of document collection, a speedy process, to be managed within seconds. In thisprocess, we can proceed in two distinct ways:
• instead of using the topical vectors of a context / global collection, the user profile topicalvector is applied, or
• the user related documents are attached to the collection clusters prior to projection (andmay or may not influence the projection process) and serve as a source of additionallabeling.
Another view of the Adaptive Clustering Algorithm Our incremental textual dataclustering algorithm relies on merging two known paradigms of clustering: the fuzzy clusteringand the subspace clustering. The method differs essentially from Fuzzy C-Means in that it isdesigned solely for text data and is based on contextual vector representation and histogram-based description of vector subspaces.
Like Fuzzy-C-Means, we start with an initial split into subgroups, represented by a matrixU(τ0), rows of which represent documents, and columns representing groups, they are assignedto. Iteratively, we adapt (a) the document representation, (b) the histogram description ofcontextual groups, (c) membership degree of documents and term significance in the individualgroups.
7
These modifications can be viewed as a recursive relationship leading to a precise descriptionof a contextual subspace in terms of the membership degree of documents and significance ofterms in a context and on the other hand improving the understanding of document similarity.
So we can start without any knowledge of document similarity, via a random assignment ofdocuments to a number of groups and global term weighing. But through the iterative processsome terms specific for a group would be strengthened, so that class membership of documentswould be modified, hence also their vector representation and indirectly similarity definition.
So we can view the algorithm as a kind of reinforcement learning. The usage of histogramapproach makes this method incremental.
2.3 Architecture
Our research convcepts have been validated by creating a full-fledged search engine (with aworking name BEATCA) for collections of up to million documents, capable of representingon-line replies to queries in a graphical form on a document map. We followed the generalarchitecture for search engines, where the preparation of documents for retrieval is carriedout by an indexer, which turns the HTML etc. representation of a document into a vector-space model representation. After that the map creator is applied, turning the vector-spacerepresentation into a form appropriate for on-the-fly generation of the map, which is then usedby the query processor responding to user’s queries.
Modular Structure The architecture of our system has been designed to allow for exper-imental analysis of various approaches to document map creation. The software consists ofessentially five types of modules, cooperating via common data structures. The types of mod-ules are as follows:
1. robot (spider, crawler), collecting documents for further processing,
2. indexer, transforming documents into a vector space representation,
3. optimizer, transforming the document space dictionary into more concise form,
4. document clustering, identifying compact groups of documents sharing similar topics,
5. mapper, transforming the vector space representation into a map form
6. search engine, responding to user queries, displaying the document maps in response tosuch queries.
Additionally, we have an experiment management module, that can be instructed to con-figure the search engine process out of selected modules, to repeat the execution of some partsof the process, and to collect various statistics about the execution of the other modules andon the quality of the final and the intermediate results.
2.4 Data Structures
The data structures interfacing the modules are of the following types:
1. HT Base [hypertext documents],
8
2. Vector Base [vector space representations],
3. DocGR Base [thematical document groups]
4. Map Base [repository of various maps],
5. CellGR Base [map areas (groups of cells)]
6. Base Registry [registry of all databases, parameters and evaluation results].
A HT Base is the result of a robot activity. We have currently two types of robots, onecollecting documents from the local disk space, and another from the Web. A robot collectsthe hypertext files walking through links connecting them and stores them in a local directoryand registers them in an SQL (actually MySQL) database. Standard information like download(update) date and time, original URL, summary (if extractable) , document language and thelist of links (together with information if already visited) is maintained by the robot.
A HT Base can be processed subsequently by an indexer and possibly an optimizer to forma Vector Base for the document collection. A Vector Base is a representation of a documentspace >n the space spanned by the words (terms) from the dictionary where the points in spacerepresent documents.
A Vector Base is then transformed to a document map by a mapper process. A mapis essentially a two-level clustering of documents: there are clusters of documents (stored inDocGR Base) and clusters of document clusters (stored in Map Base). Document clusters areassigned a graphical representation in terms of elementary ”pixels” (labeled by appropriatephrases) in a visual representation, whereas clusters of document clusters are assigned ”areas”consisting of ”pixels”. Note that in our approach we use a kind of multilevel maps, where higherlevels ”pixels” are ”expanded” into maps/map fragments at a detailed level.
Note that the same HT Base may be processed by various indexers and optimizers so thatout of a single HT Base many Vector bases may arise. Similarly one single Vector base may beprocessed by diverse mappers to form distinct maps. To keep track of the various descendantsof the same HT Base, the Base Registry has been designed. The search engine makes use of allthe maps representing the same HT Base choosing the one most appropriate for a given userquery.
The search engine has been explicitly designed as a test-bed for various algorithmic solutionsto constituent search engine components. Hence an important additional feature is a databasekeeping track of results of experiments (constituting of selections of process components anddata sets as well as quality evaluation procedures). The database of experiments is filled (andused in case of continued experiments) by the special experiment management module.
2.5 Personalization and Recommendation
The outlined approach to document map oriented clustering enables personalization amongothers along the following lines:
• personalized topic -oriented initialization of map like visualization of the selected docu-ment space model (also rebuilding of a component model is possible, treating the userprofile as a modifier of term weights of all documents);
• personalized identification of key words, document space / map cell labeling, query ex-pansion;
9
• document recommendation based on document membership degree in client profile con-text;
• recommendation of map cells;
• recommendation of other users (measuring the histogram distances between user profiles);
• clustering of users as well as users and contexts.
Present day search engines are characterized by a static information model. This meansthat textual data bases are updated in a heavily discontinuous way which results in abruptchanges of query results (after each cycle of indexing new documents). On the other hand thedata organization and search model does not take into account the user profile information forthe given document base and the given user query. Hence the reply is frequently identical,independent of the user.
The experimental search engine BEATCA [10] exhibits several capabilities that can becomea starting point for a radical change of this situation.
• reduced processing time, scalability of the adaptive contextual approach, reduced memoryrequirements of the implemented clustering algorithms (contextual reduction of the vectorspace) and search (inverted lists compression);
• possibility of construction and maintenance of multiple models/maps representing diverseviews of the same document collection (and fitting the map to the query);
• possibility of inclusion of system-user interaction history into the algorithm of map ini-tialization (e.g. by strengthening / weakening of terms from documents evaluated by theuser as more or less interesting);
• possibility of inclusion of user preference profiles into the modeling process itself by takinginto account the automatically collected information on user walk through the collectionor provided externally.
We presented a new concept of document cluster characterization via term (importance)distribution histograms. This idea allows the clustering process to have a deeper insight intothe role played by the term in formation of a particular cluster. So a full profit can be taken fromour earlier idea of ”contextual clustering”, that is of representing different document clusters indifferent subspaces of a global vector space. We have also elaborated incremental methods ofdocument cluster models based both on GNG model properties and histogram-based contextadaptation. Such an approach to mining high dimensional datasets proved to be an effectivesolution to the problem of massive data clustering. The contextual approach appears to be fast,of good quality and scalable (with the data size and dimension). Additionally, the histogram-based characterization of document clusters proved to be a stabilizing factor in creating theclustering structure, and well suited for document classification. As a side effect, a new internalcluster quality measure, based on histograms, has been developed.
We believe that the idea of histogram-based subspace identification and evaluation can beefficiently applied not only to textual, but also other challenging high dimensional datasets(especially those characterized by attributes from heterogeneous or correlated distributions).
10
Contextual approach leads to many interesting research issues, such as context-dependentdictionary reduction and keywords identification, topic-sensitive document summarization, sub-jective model visualization based on particular user’s information requirements, dynamic adap-tation of the document representation and local similarity measure computation. Especially,the user-oriented, contextual data visualization can be a major step on the way to informationretrieval personalization in search engines.
The main lesson from our research is that personalization related to any Web data processingrequires
• optimization of the entire process itself,
• a clear conceptual separation of the aspects that are objective (common for all envisagedusers, not depending on their personal characteristics) from those that are really relatedto personal experience, balancing towards reduction of the latter ones in favour for thefirst ones,
• a data process level separation of procedures related to these two aspects,
• special care for optimization of processes driven by the person-related aspects of the dataprocessing,
• personalization related processing should be always conceptually separated from groupexperience processing as that latter does not need to be run on-line, whereas the formerto a large extent has to.
Our further research on personalization in document maps will be directed towards:
• chronology (sequence) of visiting the documents by the user versus the incremental growthof document collection;
• capturing the relationship between contexts and users and identification of topical trendsversus random walk;
• exploitation of link structure (between documents and contexts) as modifiers of clusteringspace.
References
[1] A. Basu, I. R. Harris, and S. Basu. Minimum distance estimation: The approach usingdensity-based distances. In G. S. Maddala and C. R. Rao, editors, Handbook of Statistics,volume 15, pages 21-48. North-Holland, 1997.
[2] J.C. Bezdek, S.K. Pal, Fuzzy Models for Pattern Recognition: Methods that Search forStructures in Data, IEEE, New York, 1992
[3] K. Ciesielski, S. Wierzchon, M. Klopotek, An Immune Network for Contextual Text DataClustering, in: H.Bersini, J.Carneiro (Eds.), 5th International Conference on ArtificialImmune Systems (ICARIS-2006), Oeiras, LNCS 4163, Springer-Verlag, 2006, pp.432-445
11

[4] K. Ciesielski, M. Klopotek, Towards Adaptive Web Mining: Histograms and Contexts inText Data Clustering, to appear in: M.R.Berthold, J.Shawe-Taylor (Eds.), Intelligent DataAnalysis – Proceedings of IDA-2007, Ljulbjana, September 2007, Springer-Verlag, LNCS4723, pp.284-295
[5] K. Ciesielski, M. Klopotek, Text Data Clustering by Contextual Graphs, in: L.Todorovski,N.Lavrac, K.P.Jantke, 9th International Conf. on Discovery Science (ALT/DS 2006),Barcelona, LNAI 4265, Springer-Verlag, 2006, pp.65-76
[6] S.C. Deerwester, S.T. Dumais, T.K. Landauer, G.W. Furnas, R.A. Harshman, Indexingby Latent Semantic Analysis, Journal of the American Society of Information Science,41(1990)6, ppp. 391-407, citeseer.nj.nec.com/deerwester90indexing.html
[7] M. Dittenbach, A. Rauber, D. Merkl, Uncovering hierarchical structure in data using theGrowing Hierarchical Self-Organizing Map. Neurocomputing 48 (1-4)2002, pp. 199-216.
[8] B. Fritzke, A growing neural gas network learns topologies, in: G. Tesauro, D.S. Touretzky,and T.K. Leen (Eds.) Advances in Neural Information Processing Systems 7, MIT PressCambridge, MA, 1995, pp. 625-632.
[9] C. Hung, S. Wermter, A constructive and hierarchical self-organising model in a non-stationary environment, Int.Joint Conference in Neural Networks, 2005
[10] M. Klopotek, S. Wierzchon, K. Ciesielski, M. Draminski, D. Czerski, Techniques andTechnologies Behind Maps of Internet and Intranet Document Collections, in: Lu, Jie;Ruan, Da; Zhang, Guangquan (Eds.): E-Service Intelligence – Methodologies, Technologiesand Applications. Springer-Verlag Series: Studies in Computational Intelligence, Vol. 37,2007, X, 711 p., 190 illus., Hardcover, ISBN-10: 3-540-37015-3, ISBN-13: 978-3-540-37015-4
[11] T. Kohonen, Self-Organizing Maps, Springer Series in Information Sciences, vol. 30,Springer-Verlag, 2001
[12] T. Kohonen, S. Kaski, P. Somervuo, K. Lagus, M. Oja, V. Paatero, Self-organization ofvery large document collections, Helsinki University of Technology technical report, 2003,http://www.cis.hut.fi/research/reports/biennial02-03
[13] A. Rauber, Cluster Visualization in Unsupervised Neural Networks, Diplomarbeit, Tech-nische Universitat Wien, Austria, 1996
[14] J. Timmis, aiVIS: Artificial Immune Network Visualization, in: Proceedings of EuroGraph-ics UK 2001 Conference, Univeristy College London 2001, pp.61-69
3 Curriculum modelling, planning and validation
The birth of the Semantic Web brought along standard models, languages, and tools for repre-senting and dealing with machine-interpretable semantic descriptions of Web resources, givinga strong new impulse to research on personalization. The introduction of machine-processablesemantics makes the use of a variety of reasoning techniques, for implementing personalizationfunctionalities, possible, thus widening the range of the forms that personalization can assume.
12
So far, reasoning in the Semantic Web is mostly reasoning about knowledge, expressed insome ontology. However personalization may involve also other kinds of reasoning and repre-sentations of knowledge, that conceptually lie at the logic and proof layers of the Semantic Webtower. Moreover, the next Web generation promises to deliver Semantic Web Services, that canbe retrieved and combined in a way that satisfies the user. This perspective opens the way tomany forms of service-oriented personalization. In fact, web services provide an ideal infras-tructure for enabling interoperability among personalization applications and for constructingPlug&Play-like environments, where the user can select and combine the kinds of services he orshe prefers. Personalization can be obtained by taking different approaches, e.g. by developingservices that offer personalization functionalities as well as by personalizing the way in whichservices are selected, and composed in order to meet specific user’s requirements.
In the last years we have carried on a research in the educational domain, focussing onsemantic web representations of learning resources and on automated reasoning techniques forenabling different and complementary personalization functionalities, such as curriculum se-quencing [5, 4] and the verification of the compliance of a curriculum against some “coursedesign” goals [6]. Our current aim is to implement such results in an organic system, wheredifferent personalization services, that exploit reasoning over semantic web representations oflearning resources, can be combined to support the user in the task of building a personalizedcurriculum.
While in early times learning resources were simply considered as “contents”, which requireda specific platform to be used, recently, greater and greater attention has been posed on theissues of: (1) the re-use of learning resources, and (2) the development of standards that allowa cross-platform usage. The solution that we propose is to adopt a semantic annotation ofcontents based on standard languages, e.g. RDF and LOM. Hereafter, we will consider alearning resource as formed by educational contents plus semantic meta-data, which supplyinformation on the resources at a knowledge level, i.e. on the basis of concepts, which havebeen taken from an ontology describing the educational domain. In particular, we rely on theinterpretation of learning resources as actions discussed in [5, 4]: the meta-data captures thelearning objectives of the learning resource and its pre-requisites. By doing so, one can rely ona classical theory of actions and apply different reasoning methods –like planning– for buildingpersonalized curricula [5, 4].
Curriculum planning and validation offer a useful support in many practical contexts and canfruitfully be combined for helping students as well as educational institutions. Often a studentknows what competency he/she would like to acquire but has no knowledge of which courseswill help acquiring it. Moreover, taking courses at different Universities is becoming more andmore common in Europe. As a consequence, building a curriculum might become a complicatedtask for students, who must deal with an enormous set of courses across the European countries,each described in different languages and on the basis of different keywords.
The need of personalizing the sequencing of learning resource, w.r.t. the student’s interestsand context, has often to be combined with the ability to check that the resulting curriculumcomplies to some abstract specification, which encodes the curricula-design goals, expressed bythe teachers or by the institution offering the courses. One possible scenario is the following:a student builds a personalized curriculum, either by modifying a curriculum, which has beensuggested by the institution or by an automatic goal-driven system, or by writing one by him-/herself, based on personal criteria. In both cases, the obtained (personalized) curriculum isto be proved consistent, from an educational point of view. To this aim, it would be helpfulto give the curriculum in input to some validation service, and check its compliance to the
13
desired curricula model. Generally speaking, curricula models specify general rules for buildinglearning paths. We interpret curricula models as constraints, designed by the University (orother institution) for guaranteeing the acquisition of certain competencies. These constraintsare to be expressed in terms of knowledge elements, and maybe also on features that characterizethe resources. Consider, now, a University, which needs to certify that the curricula, offered byit for acquiring certain competencies (built upon the courses offered locally by the Universityitself), respect the latest guidelines supplied by the European Community. Also in this case, wecould define the guidelines as a set of constraints posed on the set of offered competencies. Giventhis representation, the verification could be performed automatically, by means of a properreasoner. Finally, the automatic checking of compliance combined with curriculum planningcould be used for implementing processes like cooperation among institutes in curricula designand integration, which are actually the focus of the so called Bologna Process [10], promotedby the EU. Given our requirements, it is a natural choice to settle our implementation inthe Personal Reader (PR) framework [18]. The PR relies on a service-oriented architectureenabling personalization, via the use of semantic Personalization Services. Each service offersa different personalization functionality, e.g. recommendations tailored to the needs of specificusers, pointers to related (or interesting or more detailed/general) information, and so on.These semantic web services communicate solely based on RDF documents. In the followingwe present our achievements both from a theoretical point of view, and by presenting theimplementation of a Planning service and a Validation service, which can interoperate withinthe PR Framework [18].
3.1 Curricula representation and reasoning
Let us begin with the introduction of our approach to the representation of learning resources,curricula, and curricula models. The basic idea is to describe all the different kinds of objects,that we need to tackle and that we will introduce hereafter, on the basis of a set of predefinedcompetencies, i.e. terms identifying specific knowledge elements. We will use the two termsas synonyms. Competencies can be thought of, and implemented, as concepts in a sharedontology. In particular, for what concerns the application system described here, competencieswere extracted by means of a semi-automatic process and stored as an RDF file (see Section3.3.1 for details).
Given a predefined set of competencies, the initial knowledge of a student can be representedas a set of such concepts. This set changes, typically it grows, as the student studies and learns.In the same way, a user, who accesses a repository of learning resources, does it with the aimof finding materials that will allow him/her to acquire some knowledge of interest. Also thisknowledge, that we identify by the term learning goal, can be represented as a set of knowledgeelements. The learning goal is to be taken into account in a variety of tasks. For instance, theconstruction of a personalized curriculum is, actually, the construction of a curriculum whichallows the achievement of a learning goal expressed by the user. In Section 3.3 we will describea curricula planning service for accomplishing this task.
3.1.1 Learning resources and curricula
A curriculum is a sequence of learning resources that are homogeneous in their representation.Based on work in [5, 4], we rely on an action theory, and take the abstraction of resources assimple actions. More specifically, a learning resource is modelled as an action for acquiring
14

some competencies (called effects). In order to understand the contents supplied by a learningresource, the user is sometimes required to own other competencies, that we call preconditions.Both preconditions and effects can be expressed by means of a semantic annotation of thelearning resource [4]. In the following we will often refer to learning resources as “courses”because in our work we have focussed on the specific case of University curricula. As a simpleexample of “learning resource as action”, let us, then, report the possible representation (in aclassical STRIPS-like notation) of the course “databases for biotechnologies” (db for biotech forshort):
ACTION: db for biothec(),PREREQ: relational db, EFFECTS: scientific db
The prequisites to this action is to have knowledge about relational databases. Its effect is tosupply knowledge about scientific databases.
Given the above interpretation of learning resources, a curriculum can be interpreted as aplan, i.e. as a sequence of actions, whose execution causes transitions from a state to another,until some final state is reached. The initial state contains all the competences that we supposeavailable before the curriculum is taken, e.g. the knowledge that the student already has. Thisset can also be empty. The final state is sometimes required to contain specific knowledgeelements, for instance, all those that compose the user’s learning goal. Indeed, often curriculaare designed so to allow the achievement of a well-defined learning goal. A transition betweentwo states is due to the application of the action corresponding to a learning resource. Of course,for an action to be applicable, its preconditions must hold in the state to which it should beapplied. The application of the action consists in an update of the state.
We assume that competences can only be added to states. Formally, this amount to assumethat the domain is monotonic. The intuition behind this assumption is that the act of using anew learning resource (e.g. attending a course) will not erase from the student’s memory theconcepts acquired so far. Knowledge grows incrementally.
3.1.2 DCML: A Declarative Curricula Model Language
Let us, now, describe the Declarative Curricula Model Language (DCML, for short), a graph-ical language that we have developed to represent the specification of curricula models. Theadvantage of a graphical language is that the fact of drawing, rather than writing, constraintsfacilitates the user, who needs to represent curricula models, allowing a general overview ofthe relations between concepts. We present here, the most general version of DCML, in whicha distinction is made between the terms competence and competency. These two terms arerespectively used, in the literature concerning professional curricula and e-learning, to denotethe “effective performance within a domain at some level of proficiency” and “any form ofknowledge, skill, attitude, ability or learning objective that can be described in a context oflearning, education or training”. Previous versions can be found in [6, 9].
DCML is inspired by DecSerFlow, the Declarative Service Flow Language to specify, enact,and monitor web service flows by van der Aalst and Pesic [1]. DCML, as well as DecSerFlow,is grounded in Linear Temporal Logic [13] and allows a curricula model to be described inan easy way maintaining at the same time a rigorous and precise meaning given by the logicrepresentation. LTL includes temporal operators such as next-time (©ϕ, the formula ϕ holdsin the immediately following state of the run), eventually (3ϕ, ϕ is guaranteed to eventuallybecome true), always (2ϕ, the formula ϕ remains invariably true throughout a run), until
15

Figure 1: An example of curricula model in DCML.
(α U β, the formula α remains true until β), see also [19, Chapter 6]. The set of LTL formulasobtained for a curricula model are, then, used to verify whether a curriculum will respect it [6].
As an example, Fig. 1 shows a curricula model expressed in DCML. Every box contains atleast one competence. Boxes/competences are connected by arrows, which represent (mainly)temporal constraints among the times at which they are to be acquired. Altogether the con-straints describe a curricula model.
DCML, as mentioned, includes the representation of the proficiency level at which a compe-tency is owned or supplied. To this aim, we associate to each competency a variable k, havingthe same name as the competency, which can be assigned natural numbers as values. The valueof k denotes the proficiency level; zero means absence of knowledge. Therefore, k encodes acompetence, Fig. 2(a).
On top of competences, in DCML it is possible to define three basic constraints. The “levelof competence” constraint, Fig. 2(c), imposes that a certain competency k must be acquired atleast at level l. It is represented by the LTL formula 3(k ≥ l). Similarly, a course designer canimpose that a competency must never appear in a curriculum with a proficiency level higherthan l. This is possible by means of the “always less than level” constraint, shown in Fig. 2(d).The LTL formula 2(k < l) expresses this fact (it is the negation of the previous one). As aspecial case, when the level l is one (2(k < 1)), the competency k must never appear in acurriculum.
The third constraint, represented by a double box, see Fig. 2 (b), specifies that k mustbelong to the initial knowledge with, at least, level l. In other words, the simple logic formula(k ≥ l) must hold in the initial state.
To specify relations among concepts, other elements are needed. In particular, in DCML it ispossible to represent Disjunctive Normal Form (DNF) formulas as conjunctions and disjunctionsof concepts. For lack of space, we do not describe the notation here, however, an example canbe seen in Fig. 1.
16
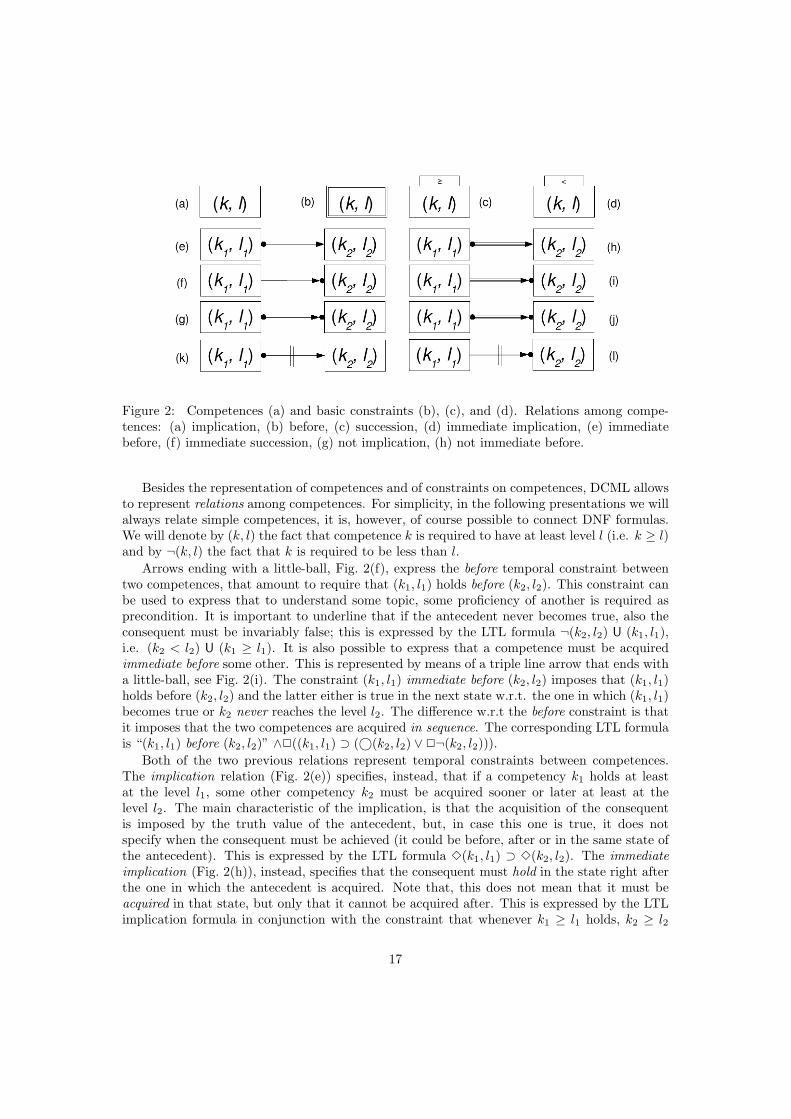
Figure 2: Competences (a) and basic constraints (b), (c), and (d). Relations among compe-tences: (a) implication, (b) before, (c) succession, (d) immediate implication, (e) immediatebefore, (f) immediate succession, (g) not implication, (h) not immediate before.
Besides the representation of competences and of constraints on competences, DCML allowsto represent relations among competences. For simplicity, in the following presentations we willalways relate simple competences, it is, however, of course possible to connect DNF formulas.We will denote by (k, l) the fact that competence k is required to have at least level l (i.e. k ≥ l)and by ¬(k, l) the fact that k is required to be less than l.
Arrows ending with a little-ball, Fig. 2(f), express the before temporal constraint betweentwo competences, that amount to require that (k1, l1) holds before (k2, l2). This constraint canbe used to express that to understand some topic, some proficiency of another is required asprecondition. It is important to underline that if the antecedent never becomes true, also theconsequent must be invariably false; this is expressed by the LTL formula ¬(k2, l2) U (k1, l1),i.e. (k2 < l2) U (k1 ≥ l1). It is also possible to express that a competence must be acquiredimmediate before some other. This is represented by means of a triple line arrow that ends witha little-ball, see Fig. 2(i). The constraint (k1, l1) immediate before (k2, l2) imposes that (k1, l1)holds before (k2, l2) and the latter either is true in the next state w.r.t. the one in which (k1, l1)becomes true or k2 never reaches the level l2. The difference w.r.t the before constraint is thatit imposes that the two competences are acquired in sequence. The corresponding LTL formulais “(k1, l1) before (k2, l2)” ∧2((k1, l1) ⊃ (©(k2, l2) ∨2¬(k2, l2))).
Both of the two previous relations represent temporal constraints between competences.The implication relation (Fig. 2(e)) specifies, instead, that if a competency k1 holds at leastat the level l1, some other competency k2 must be acquired sooner or later at least at thelevel l2. The main characteristic of the implication, is that the acquisition of the consequentis imposed by the truth value of the antecedent, but, in case this one is true, it does notspecify when the consequent must be achieved (it could be before, after or in the same state ofthe antecedent). This is expressed by the LTL formula 3(k1, l1) ⊃ 3(k2, l2). The immediateimplication (Fig. 2(h)), instead, specifies that the consequent must hold in the state right afterthe one in which the antecedent is acquired. Note that, this does not mean that it must beacquired in that state, but only that it cannot be acquired after. This is expressed by the LTLimplication formula in conjunction with the constraint that whenever k1 ≥ l1 holds, k2 ≥ l2
17
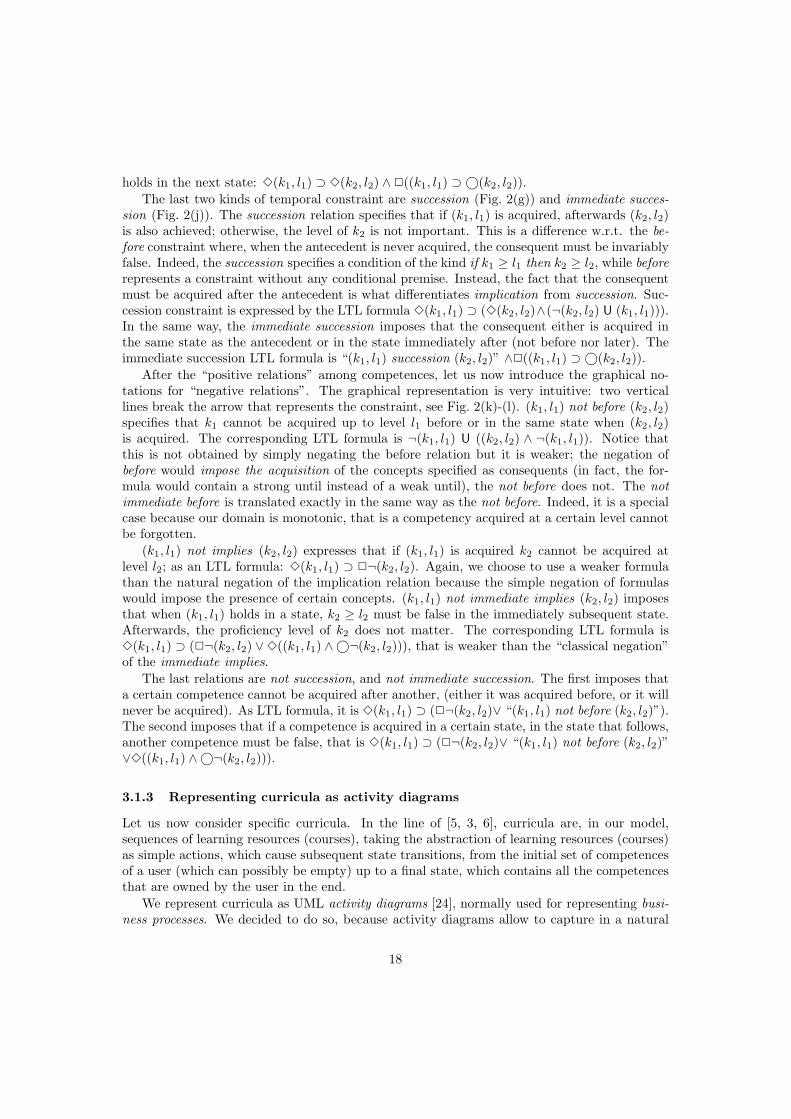
holds in the next state: 3(k1, l1) ⊃ 3(k2, l2) ∧2((k1, l1) ⊃ ©(k2, l2)).The last two kinds of temporal constraint are succession (Fig. 2(g)) and immediate succes-
sion (Fig. 2(j)). The succession relation specifies that if (k1, l1) is acquired, afterwards (k2, l2)is also achieved; otherwise, the level of k2 is not important. This is a difference w.r.t. the be-fore constraint where, when the antecedent is never acquired, the consequent must be invariablyfalse. Indeed, the succession specifies a condition of the kind if k1 ≥ l1 then k2 ≥ l2, while beforerepresents a constraint without any conditional premise. Instead, the fact that the consequentmust be acquired after the antecedent is what differentiates implication from succession. Suc-cession constraint is expressed by the LTL formula 3(k1, l1) ⊃ (3(k2, l2)∧(¬(k2, l2) U (k1, l1))).In the same way, the immediate succession imposes that the consequent either is acquired inthe same state as the antecedent or in the state immediately after (not before nor later). Theimmediate succession LTL formula is “(k1, l1) succession (k2, l2)” ∧2((k1, l1) ⊃ ©(k2, l2)).
After the “positive relations” among competences, let us now introduce the graphical no-tations for “negative relations”. The graphical representation is very intuitive: two verticallines break the arrow that represents the constraint, see Fig. 2(k)-(l). (k1, l1) not before (k2, l2)specifies that k1 cannot be acquired up to level l1 before or in the same state when (k2, l2)is acquired. The corresponding LTL formula is ¬(k1, l1) U ((k2, l2) ∧ ¬(k1, l1)). Notice thatthis is not obtained by simply negating the before relation but it is weaker; the negation ofbefore would impose the acquisition of the concepts specified as consequents (in fact, the for-mula would contain a strong until instead of a weak until), the not before does not. The notimmediate before is translated exactly in the same way as the not before. Indeed, it is a specialcase because our domain is monotonic, that is a competency acquired at a certain level cannotbe forgotten.
(k1, l1) not implies (k2, l2) expresses that if (k1, l1) is acquired k2 cannot be acquired atlevel l2; as an LTL formula: 3(k1, l1) ⊃ 2¬(k2, l2). Again, we choose to use a weaker formulathan the natural negation of the implication relation because the simple negation of formulaswould impose the presence of certain concepts. (k1, l1) not immediate implies (k2, l2) imposesthat when (k1, l1) holds in a state, k2 ≥ l2 must be false in the immediately subsequent state.Afterwards, the proficiency level of k2 does not matter. The corresponding LTL formula is3(k1, l1) ⊃ (2¬(k2, l2) ∨3((k1, l1) ∧©¬(k2, l2))), that is weaker than the “classical negation”of the immediate implies.
The last relations are not succession, and not immediate succession. The first imposes thata certain competence cannot be acquired after another, (either it was acquired before, or it willnever be acquired). As LTL formula, it is 3(k1, l1) ⊃ (2¬(k2, l2)∨ “(k1, l1) not before (k2, l2)”).The second imposes that if a competence is acquired in a certain state, in the state that follows,another competence must be false, that is 3(k1, l1) ⊃ (2¬(k2, l2)∨ “(k1, l1) not before (k2, l2)”∨3((k1, l1) ∧©¬(k2, l2))).
3.1.3 Representing curricula as activity diagrams
Let us now consider specific curricula. In the line of [5, 3, 6], curricula are, in our model,sequences of learning resources (courses), taking the abstraction of learning resources (courses)as simple actions, which cause subsequent state transitions, from the initial set of competencesof a user (which can possibly be empty) up to a final state, which contains all the competencesthat are owned by the user in the end.
We represent curricula as UML activity diagrams [24], normally used for representing busi-ness processes. We decided to do so, because activity diagrams allow to capture in a natural
18

Figure 3: Activity diagram representing a set of eight different curricula. Notice that Logicand Java Programming I can be attended in any order (even in parallel), as well as AdvancedJava Programming and Lab DB, while Introduction to DB will be considered only if the guardTransaction and Data Recovery is false.
way the simple sequencing of courses as well as the possibility of attending courses in parallelor in possibly conditioned alternatives.
An example is reported in Fig. 3. Besides the initial and the final nodes, the graphicalelements used in an activity diagram are: activity nodes (rounded rectangle) that representactivities (attending courses) that occur; flow/edge (arrows) that represent activity flows; fork(black bar with one incoming edge and several outgoing edges) and join nodes (black barwith several incoming edges and one outgoing edge) to denote parallel activities; and decision(diamonds with one incoming edge and several outgoing edges) and merge nodes (diamondswith several incoming edges and one outgoing edge) to choose between alternative flows.
In the modeling of learning processes, we use activities to represent the act of attendingcourses (or using learning resources). For example, by fork and join nodes we represent the factthat two (or more) courses or sub-curricula are not related and, it is possible for the student toattend them in parallel. This is the case of Java Programming I and Logic, as well as AdvancedJava Programming and Lab. of DB showed in Fig. 3. Till all parallel branches have not beenattended successfully, the student cannot attend other courses, even if some of the parallelbranches have been completed. Parallel branches can also be used when we want to expressthat the order among courses of different branches does not matter.
Decision and merge nodes can be used to represent alternative paths. The student willfollow only one of the possible branches. Alternative paths can also be conditioned, in thiscase a guard, a boolean condition, is added at the beginning of the branch. Guards shouldbe mutually exclusive. In our domain, the conditions are expressed in terms of concepts thatmust hold, otherwise a branch is not accessible. If no guard is present, the student can chooseone (and only one) of the possible paths. In the example in Fig. 3, the guard consists of twocompetences: Transaction and Data Recovery. If one of these does not hold the student has toattend the course Introduction to DB, otherwise he/she does not.
19
3.2 Planning and Validation
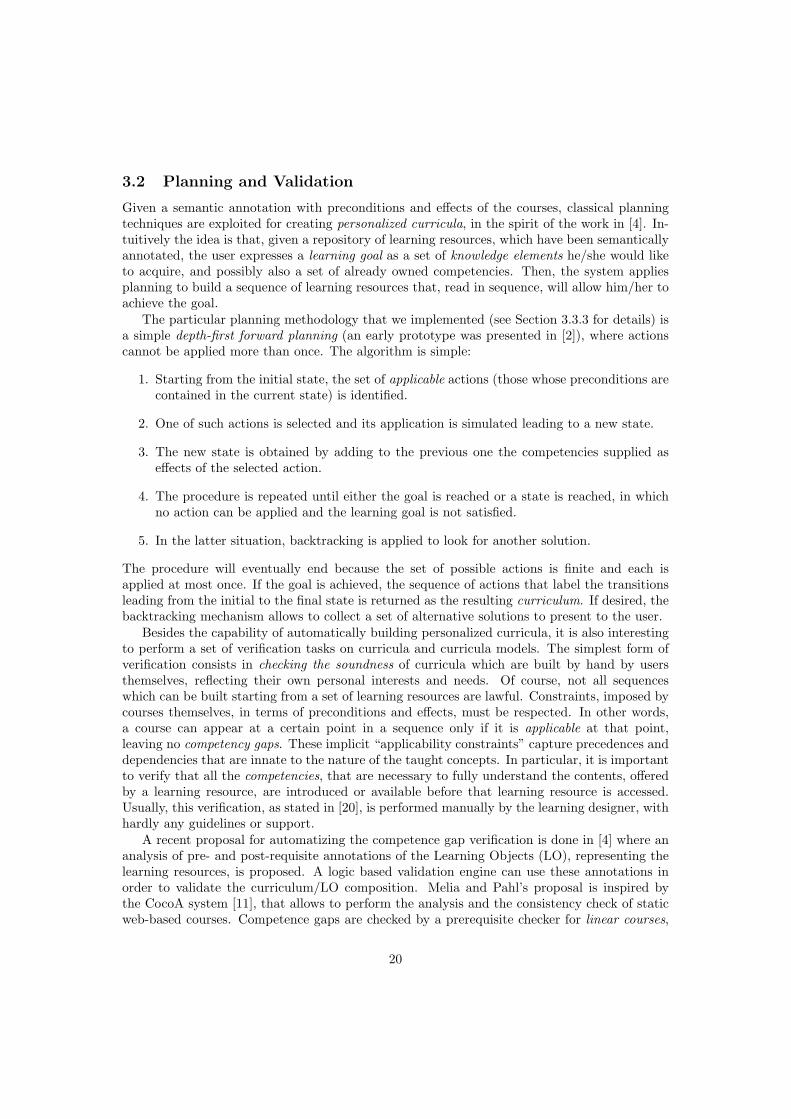
Given a semantic annotation with preconditions and effects of the courses, classical planningtechniques are exploited for creating personalized curricula, in the spirit of the work in [4]. In-tuitively the idea is that, given a repository of learning resources, which have been semanticallyannotated, the user expresses a learning goal as a set of knowledge elements he/she would liketo acquire, and possibly also a set of already owned competencies. Then, the system appliesplanning to build a sequence of learning resources that, read in sequence, will allow him/her toachieve the goal.
The particular planning methodology that we implemented (see Section 3.3.3 for details) isa simple depth-first forward planning (an early prototype was presented in [2]), where actionscannot be applied more than once. The algorithm is simple:
1. Starting from the initial state, the set of applicable actions (those whose preconditions arecontained in the current state) is identified.
2. One of such actions is selected and its application is simulated leading to a new state.
3. The new state is obtained by adding to the previous one the competencies supplied aseffects of the selected action.
4. The procedure is repeated until either the goal is reached or a state is reached, in whichno action can be applied and the learning goal is not satisfied.
5. In the latter situation, backtracking is applied to look for another solution.
The procedure will eventually end because the set of possible actions is finite and each isapplied at most once. If the goal is achieved, the sequence of actions that label the transitionsleading from the initial to the final state is returned as the resulting curriculum. If desired, thebacktracking mechanism allows to collect a set of alternative solutions to present to the user.
Besides the capability of automatically building personalized curricula, it is also interestingto perform a set of verification tasks on curricula and curricula models. The simplest form ofverification consists in checking the soundness of curricula which are built by hand by usersthemselves, reflecting their own personal interests and needs. Of course, not all sequenceswhich can be built starting from a set of learning resources are lawful. Constraints, imposed bycourses themselves, in terms of preconditions and effects, must be respected. In other words,a course can appear at a certain point in a sequence only if it is applicable at that point,leaving no competency gaps. These implicit “applicability constraints” capture precedences anddependencies that are innate to the nature of the taught concepts. In particular, it is importantto verify that all the competencies, that are necessary to fully understand the contents, offeredby a learning resource, are introduced or available before that learning resource is accessed.Usually, this verification, as stated in [20], is performed manually by the learning designer, withhardly any guidelines or support.
A recent proposal for automatizing the competence gap verification is done in [4] where ananalysis of pre- and post-requisite annotations of the Learning Objects (LO), representing thelearning resources, is proposed. A logic based validation engine can use these annotations inorder to validate the curriculum/LO composition. Melia and Pahl’s proposal is inspired bythe CocoA system [11], that allows to perform the analysis and the consistency check of staticweb-based courses. Competence gaps are checked by a prerequisite checker for linear courses,
20
simulating the process of teaching with an overlay student model. Pre- and post-requisites arerepresented as “concepts”.
Together with the verification of consistence gaps, there are other kinds of verification.Brusilovsky and Vassileva [11] sketch some of them. In our opinion, two are particularly im-portant: (a) verifying that the curriculum allows to achieve the users’ learning goals, i.e. thatthe user will acquire the desired knowledge, and (b) verifying that the curriculum is compliantagainst the course design goals. Manually or automatically supplied curricula, developed toreach a learning goal, should match the “design document”, a curricula model, specified by theinstitution that offers the possibility of personalizing curricula. Curricula models specify generalrules for designing sequences of learning resources (courses). We interpret them as constraints,that are expressed in terms of concepts and, in general, are not directly associated to learningresources, as instead is done for pre-requisites. They constrain the process of acquisition ofconcepts, independently from the resources.
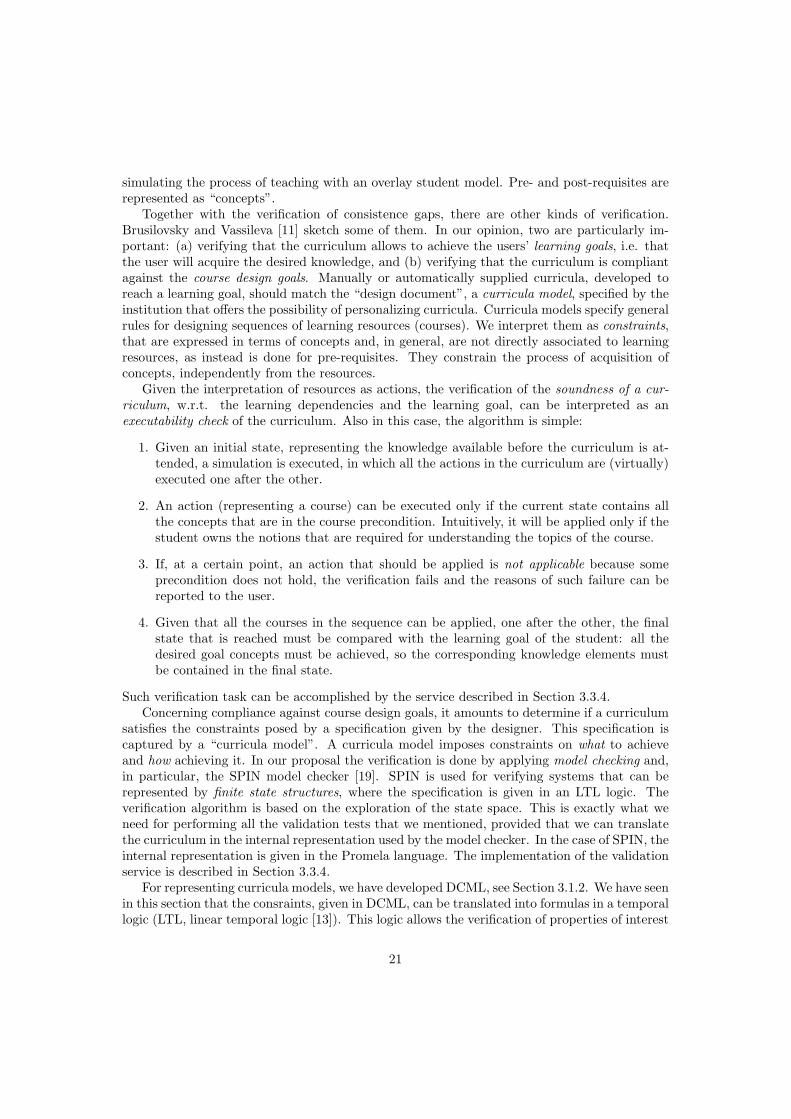
Given the interpretation of resources as actions, the verification of the soundness of a cur-riculum, w.r.t. the learning dependencies and the learning goal, can be interpreted as anexecutability check of the curriculum. Also in this case, the algorithm is simple:
1. Given an initial state, representing the knowledge available before the curriculum is at-tended, a simulation is executed, in which all the actions in the curriculum are (virtually)executed one after the other.
2. An action (representing a course) can be executed only if the current state contains allthe concepts that are in the course precondition. Intuitively, it will be applied only if thestudent owns the notions that are required for understanding the topics of the course.
3. If, at a certain point, an action that should be applied is not applicable because someprecondition does not hold, the verification fails and the reasons of such failure can bereported to the user.
4. Given that all the courses in the sequence can be applied, one after the other, the finalstate that is reached must be compared with the learning goal of the student: all thedesired goal concepts must be achieved, so the corresponding knowledge elements mustbe contained in the final state.
Such verification task can be accomplished by the service described in Section 3.3.4.Concerning compliance against course design goals, it amounts to determine if a curriculum
satisfies the constraints posed by a specification given by the designer. This specification iscaptured by a “curricula model”. A curricula model imposes constraints on what to achieveand how achieving it. In our proposal the verification is done by applying model checking and,in particular, the SPIN model checker [19]. SPIN is used for verifying systems that can berepresented by finite state structures, where the specification is given in an LTL logic. Theverification algorithm is based on the exploration of the state space. This is exactly what weneed for performing all the validation tests that we mentioned, provided that we can translatethe curriculum in the internal representation used by the model checker. In the case of SPIN, theinternal representation is given in the Promela language. The implementation of the validationservice is described in Section 3.3.4.
For representing curricula models, we have developed DCML, see Section 3.1.2. We have seenin this section that the consraints, given in DCML, can be translated into formulas in a temporallogic (LTL, linear temporal logic [13]). This logic allows the verification of properties of interest
21
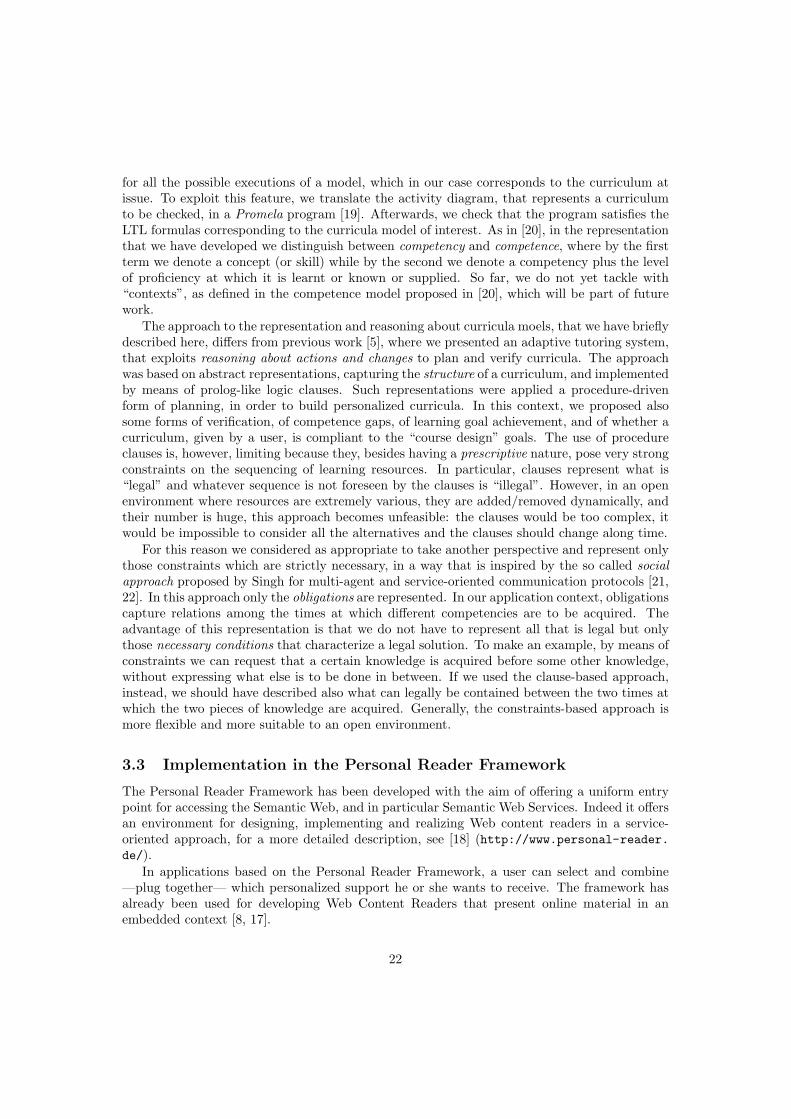
for all the possible executions of a model, which in our case corresponds to the curriculum atissue. To exploit this feature, we translate the activity diagram, that represents a curriculumto be checked, in a Promela program [19]. Afterwards, we check that the program satisfies theLTL formulas corresponding to the curricula model of interest. As in [20], in the representationthat we have developed we distinguish between competency and competence, where by the firstterm we denote a concept (or skill) while by the second we denote a competency plus the levelof proficiency at which it is learnt or known or supplied. So far, we do not yet tackle with“contexts”, as defined in the competence model proposed in [20], which will be part of futurework.
The approach to the representation and reasoning about curricula moels, that we have brieflydescribed here, differs from previous work [5], where we presented an adaptive tutoring system,that exploits reasoning about actions and changes to plan and verify curricula. The approachwas based on abstract representations, capturing the structure of a curriculum, and implementedby means of prolog-like logic clauses. Such representations were applied a procedure-drivenform of planning, in order to build personalized curricula. In this context, we proposed alsosome forms of verification, of competence gaps, of learning goal achievement, and of whether acurriculum, given by a user, is compliant to the “course design” goals. The use of procedureclauses is, however, limiting because they, besides having a prescriptive nature, pose very strongconstraints on the sequencing of learning resources. In particular, clauses represent what is“legal” and whatever sequence is not foreseen by the clauses is “illegal”. However, in an openenvironment where resources are extremely various, they are added/removed dynamically, andtheir number is huge, this approach becomes unfeasible: the clauses would be too complex, itwould be impossible to consider all the alternatives and the clauses should change along time.
For this reason we considered as appropriate to take another perspective and represent onlythose constraints which are strictly necessary, in a way that is inspired by the so called socialapproach proposed by Singh for multi-agent and service-oriented communication protocols [21,22]. In this approach only the obligations are represented. In our application context, obligationscapture relations among the times at which different competencies are to be acquired. Theadvantage of this representation is that we do not have to represent all that is legal but onlythose necessary conditions that characterize a legal solution. To make an example, by means ofconstraints we can request that a certain knowledge is acquired before some other knowledge,without expressing what else is to be done in between. If we used the clause-based approach,instead, we should have described also what can legally be contained between the two times atwhich the two pieces of knowledge are acquired. Generally, the constraints-based approach ismore flexible and more suitable to an open environment.
3.3 Implementation in the Personal Reader Framework
The Personal Reader Framework has been developed with the aim of offering a uniform entrypoint for accessing the Semantic Web, and in particular Semantic Web Services. Indeed it offersan environment for designing, implementing and realizing Web content readers in a service-oriented approach, for a more detailed description, see [18] (http://www.personal-reader.de/).
In applications based on the Personal Reader Framework, a user can select and combine—plug together— which personalized support he or she wants to receive. The framework hasalready been used for developing Web Content Readers that present online material in anembedded context [8, 17].
22
UMService
Connector
Connector PersonalizationContent Syndication andUser-Interface Provision
PService
CurriculumPlanningPService
CurriculumSynService
RDF RDF
User
Servlets,JSP-Pages:
login,input,
results...
SynServiceUser
Interface
CurriculumValidationPService
Curriculum Planningand Validation Application
User Model
Figure 4: Personal Reader Framework Overview
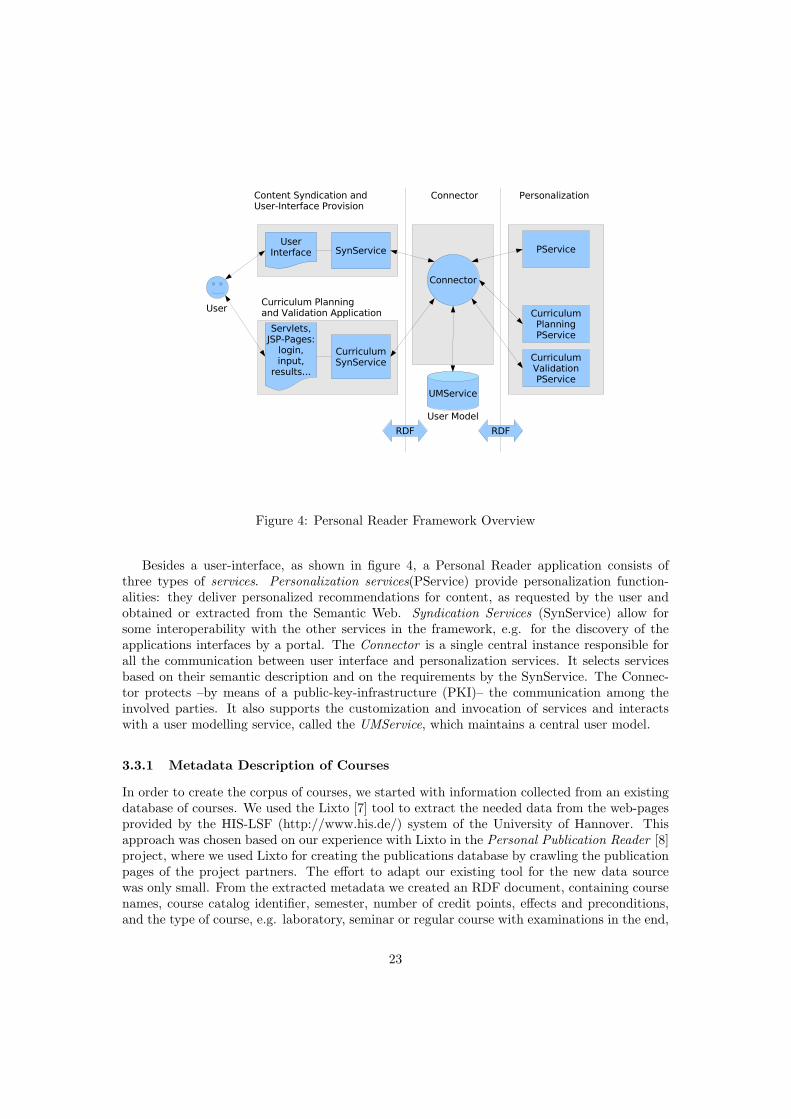
Besides a user-interface, as shown in figure 4, a Personal Reader application consists ofthree types of services. Personalization services(PService) provide personalization function-alities: they deliver personalized recommendations for content, as requested by the user andobtained or extracted from the Semantic Web. Syndication Services (SynService) allow forsome interoperability with the other services in the framework, e.g. for the discovery of theapplications interfaces by a portal. The Connector is a single central instance responsible forall the communication between user interface and personalization services. It selects servicesbased on their semantic description and on the requirements by the SynService. The Connec-tor protects –by means of a public-key-infrastructure (PKI)– the communication among theinvolved parties. It also supports the customization and invocation of services and interactswith a user modelling service, called the UMService, which maintains a central user model.
3.3.1 Metadata Description of Courses
In order to create the corpus of courses, we started with information collected from an existingdatabase of courses. We used the Lixto [7] tool to extract the needed data from the web-pagesprovided by the HIS-LSF (http://www.his.de/) system of the University of Hannover. Thisapproach was chosen based on our experience with Lixto in the Personal Publication Reader [8]project, where we used Lixto for creating the publications database by crawling the publicationpages of the project partners. The effort to adapt our existing tool for the new data sourcewas only small. From the extracted metadata we created an RDF document, containing coursenames, course catalog identifier, semester, number of credit points, effects and preconditions,and the type of course, e.g. laboratory, seminar or regular course with examinations in the end,
23
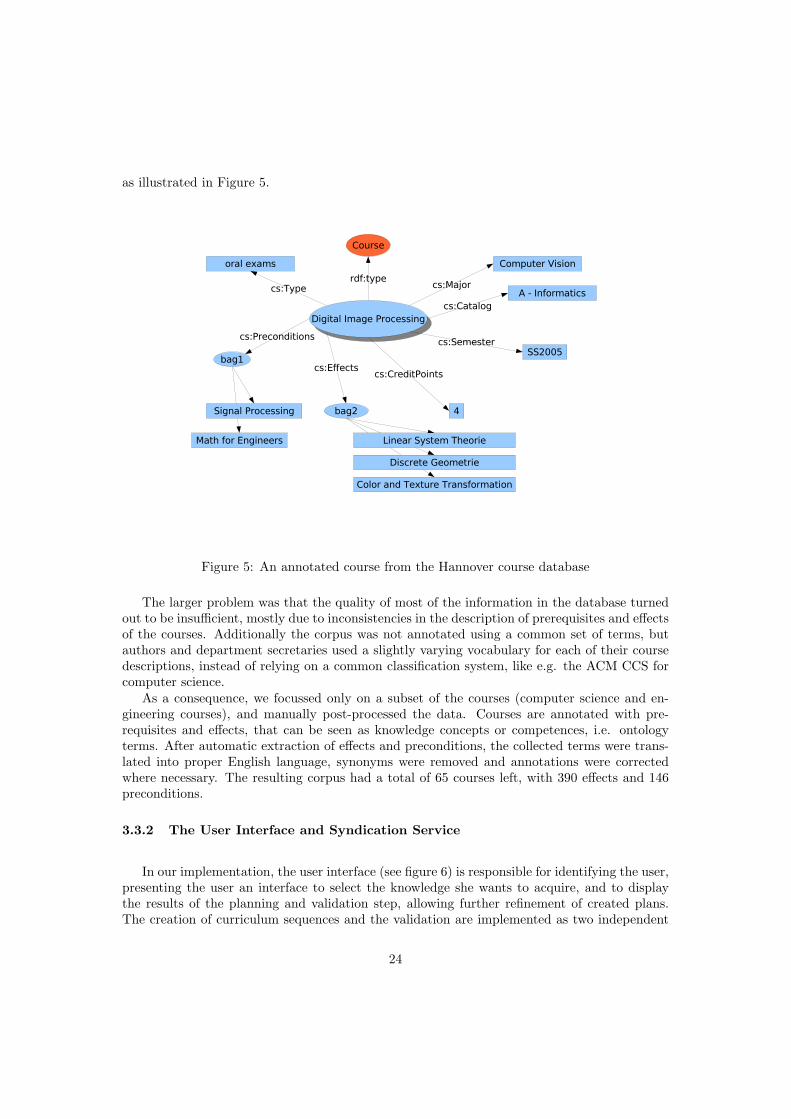
as illustrated in Figure 5.
Computer Vision
Digital Image Processing
Course
rdf:typecs:Major
A - Informaticscs:Catalog
SS2005cs:Semester
4
cs:CreditPoints
oral exams
cs:Type
bag1
bag2
cs:Preconditions
cs:Effects
Math for Engineers
Signal Processing
Color and Texture Transformation
Linear System Theorie
Discrete Geometrie
Figure 5: An annotated course from the Hannover course database
The larger problem was that the quality of most of the information in the database turnedout to be insufficient, mostly due to inconsistencies in the description of prerequisites and effectsof the courses. Additionally the corpus was not annotated using a common set of terms, butauthors and department secretaries used a slightly varying vocabulary for each of their coursedescriptions, instead of relying on a common classification system, like e.g. the ACM CCS forcomputer science.
As a consequence, we focussed only on a subset of the courses (computer science and en-gineering courses), and manually post-processed the data. Courses are annotated with pre-requisites and effects, that can be seen as knowledge concepts or competences, i.e. ontologyterms. After automatic extraction of effects and preconditions, the collected terms were trans-lated into proper English language, synonyms were removed and annotations were correctedwhere necessary. The resulting corpus had a total of 65 courses left, with 390 effects and 146preconditions.
3.3.2 The User Interface and Syndication Service
In our implementation, the user interface (see figure 6) is responsible for identifying the user,presenting the user an interface to select the knowledge she wants to acquire, and to displaythe results of the planning and validation step, allowing further refinement of created plans.The creation of curriculum sequences and the validation are implemented as two independent
24
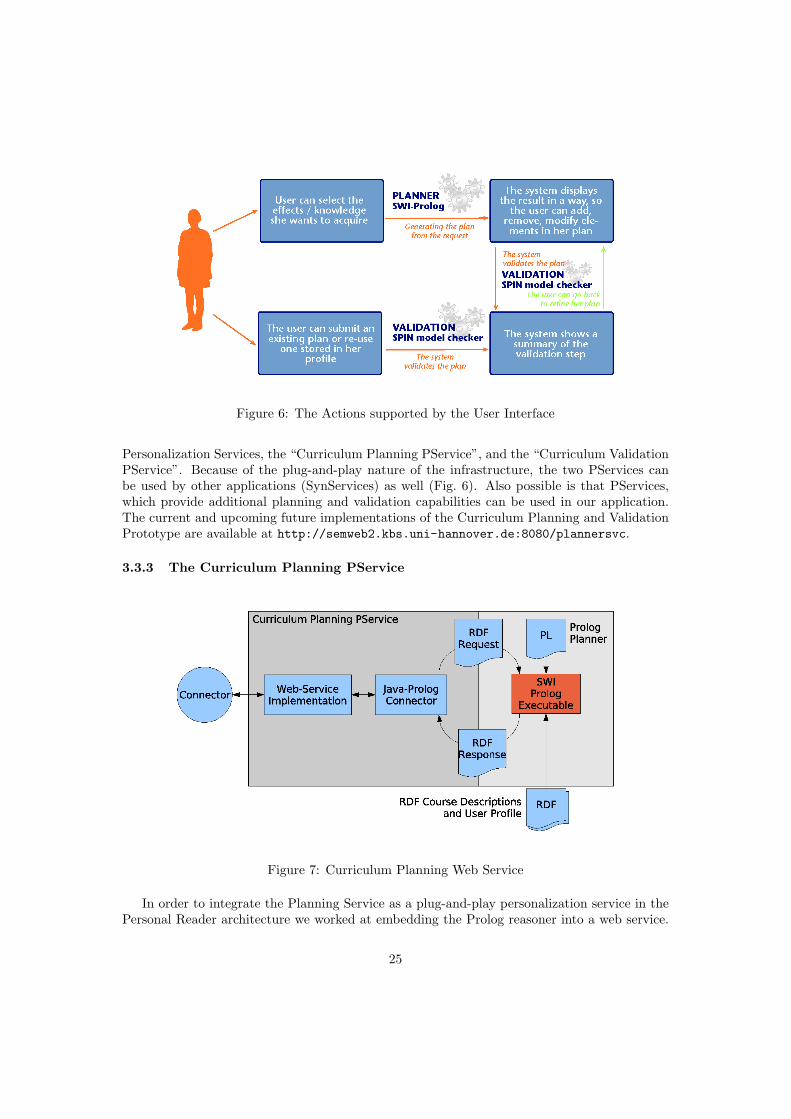
Figure 6: The Actions supported by the User Interface
Personalization Services, the “Curriculum Planning PService”, and the “Curriculum ValidationPService”. Because of the plug-and-play nature of the infrastructure, the two PServices canbe used by other applications (SynServices) as well (Fig. 6). Also possible is that PServices,which provide additional planning and validation capabilities can be used in our application.The current and upcoming future implementations of the Curriculum Planning and ValidationPrototype are available at http://semweb2.kbs.uni-hannover.de:8080/plannersvc.
3.3.3 The Curriculum Planning PService
Figure 7: Curriculum Planning Web Service
In order to integrate the Planning Service as a plug-and-play personalization service in thePersonal Reader architecture we worked at embedding the Prolog reasoner into a web service.
25

Figure 7 gives an overview over the components in the current implementation. The webservice implements the Personalization Service (PService [18]) interface, defined by the PersonalReader framework, which allows for the processing of RDF documents and for inquiring aboutthe services capabilities. The Java-to-Prolog Connector runs the SWI-Prolog executable in asub-process; essentially it passes the RDF document containing the request as-is to the Prologsystem, and collects the results, already represented as RDF.
The curriculum planning task itself is accomplished by a reasoning engine, which has beenimplemented in SWI Prolog2. The interesting thing of using SWI Prolog is that it contains asemantic web library allowing to deal with RDF statements. Since all the inputs are sent tothe reasoner in a RDF request document, it actually simplifies the process of interfacing theplanner with the Personal Reader. In particular the request document contains: a) links to theRDF document containing the database of courses, annotated with metadata, b) a referenceto the user’s context c) the user’s actual learning goal, i.e. a set of knowledge concepts thatthe user would like to acquire, and that are part of the domain ontology used for the semanticannotation of the actual courses. The reasoner can also deal with information about creditsprovided by the courses, when the user sets a credit constraint together with the learning goal.
Given a request, the reasoner runs the Prolog planning engine on the database of coursesannotated with prerequisites and effects. The initial state is set by using information aboutthe user’s context, which is maintained by the User Modelling component of the PR. In factsuch user’s context includes information about what is considered as already learnt by thestudent (attended courses, learnt concepts) and such information is included in the requestdocument. The Prolog planning engine has been implemented by using a classical depth-firstsearch algorithm. This algorithm is extremely simple to implement in declarative languages asProlog.
At the end of the process, a RDF response document is returned as an output. It contains alist of plans (sequences of courses) that fulfill the user’s learning goals and profile. The maximumnumber of possible solutions can be set by the user in the request document. Notice that furtherinformation stored in the user profile is used at this stage for adapting the presentation of thesolutions, here simple hints are used to rank higher those plans that include topics that the userhas an expressed special interest in.
3.3.4 The Curriculum Validation PService
In this section we discuss how to validate a curriculum. As explained, three kinds of verificationshave to be performed: (1) verifying that a curriculum does not have competence gaps, (2)verifying that a curriculum supplies the user’s learning goals, and (3) verifying that a curriculumsatisfies the course design goals, i.e. the constraints imposed by the curricula model. To dothis, we use model checking techniques [12].
By means of a model checker, it is possible to generate and analyze all the possible states ofa program exhaustively to verify whether no execution path satisfies a certain property, usuallyexpressed by a temporal logic, such as LTL. When a model checker refuses the negation of aproperty, it produces a counterexample that shows the violation. SPIN, by G. J. Holzmann [19],is the most representative tool of this kind. Our idea is to translate the activity diagram, thatrepresents a set of curricula, in a Promela (the language used by SPIN) program, and, then toverify whether it satisfies the LTL formulas that represents the curricula model.
2http://www.swi-prolog.org/
26

In the literature, we can find some proposals to translate UML activity diagrams intoPromela programs, such as [14, 16]. However, these proposals have a different purpose thanours and they cannot be used to perform the translation that we need to perform the verifica-tions we list above. Generally, their aim is debugging UML designs, by helping UML designersto write sound diagrams. The translation proposed in the following, instead, aims to simulate,by a Promela program the acquisition of competencies by attending courses contained into thecurricula represented by an activity diagram.
Given a curriculum as an activity diagram, we represent all the competences involved byits courses as integer variables. In the beginning, only those variables that represent the initialknowledge owned by the student are set to a value greater than zero. Courses are represented asactions that can modify the value of such variables. Since our application domain is monotonic,the value of a variable can only grow.
The Promela program consists of two main processes: one is called CurriculumVerificationand the other UpdateState. While the former contains the actual translation of the activitydiagram and simulates the acquisition of the competences for all curricula represented by thetranslated activity diagram, the latter contains the code for updating the state, i.e. the com-petences achieved so far, according to the definition in terms of preconditions and effects ofeach course. The processes CurriculumVerification and UpdateState communicate by means ofthe channel attend. The notation attend!courseName represents the fact that the course withname “courseName” is to be attended. On the other hand, the notation attend?courseNamerepresents the possibility for a process of receiving a message. For example, the process Cur-riculumVerification for the activity diagram of Fig. 3 is defined as follows:
proctype CurriculumVerification() {
activity_forkjoin_1();
course_java_programming_II();
activity_decisionmerge_1();
course_database_I();
course_database_II();
activity_forkjoin_2();
course_lab_of_web_services();
attend!stop;
}
If the simulation of all its possible executions end, then, there are no competence gaps; at-tend!stop communicates this fact and starts the verification of user’s learning goal, that, ifpassed, ends the process. Each course is represented by its preconditions and its effects. Forexample, the course “Laboratory of Web Services” is as follows:
inline preconditions_course_lab_of_web_services() {
assert(N_tier_architectures >= 4 && sql >= 2);
}
inline effects_course_lab_of_web_services() {
SetCompetenceState(jsp, 4); [...]
SetCompetenceState(markup_language, 5);
}
inline course_lab_of_web_services() {
attend!lab_of_web_services;
}
27
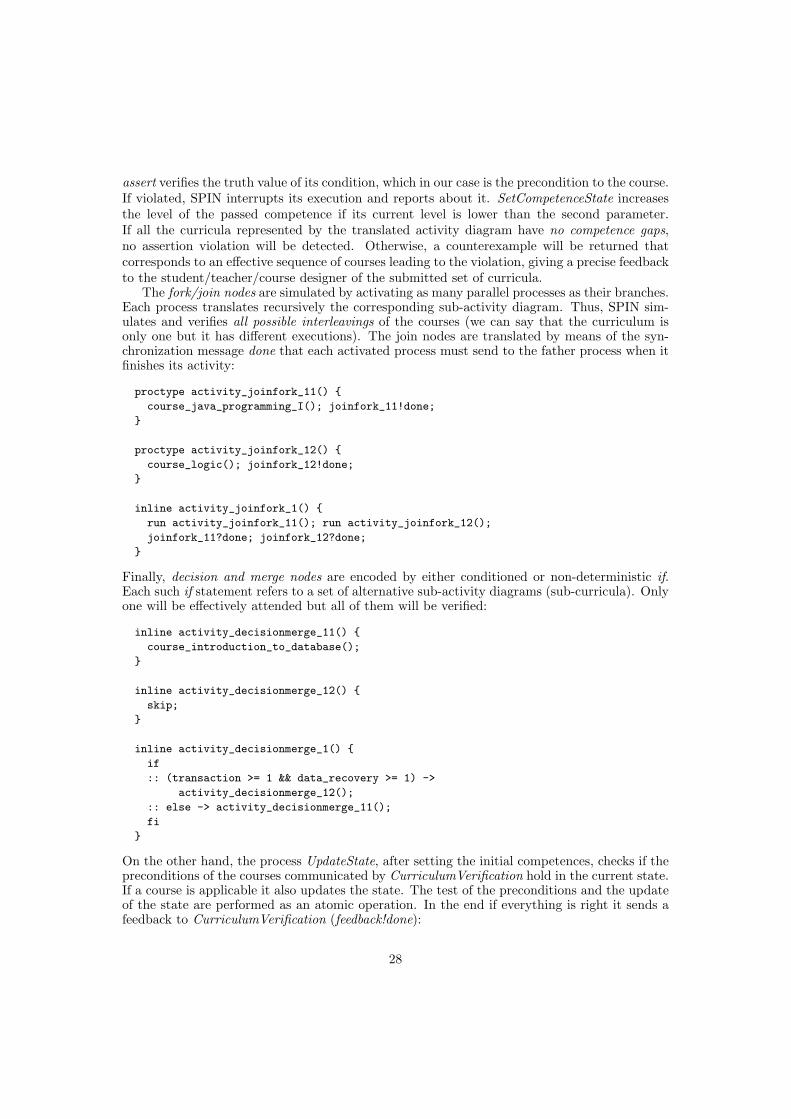
assert verifies the truth value of its condition, which in our case is the precondition to the course.If violated, SPIN interrupts its execution and reports about it. SetCompetenceState increasesthe level of the passed competence if its current level is lower than the second parameter.If all the curricula represented by the translated activity diagram have no competence gaps,no assertion violation will be detected. Otherwise, a counterexample will be returned thatcorresponds to an effective sequence of courses leading to the violation, giving a precise feedbackto the student/teacher/course designer of the submitted set of curricula.
The fork/join nodes are simulated by activating as many parallel processes as their branches.Each process translates recursively the corresponding sub-activity diagram. Thus, SPIN sim-ulates and verifies all possible interleavings of the courses (we can say that the curriculum isonly one but it has different executions). The join nodes are translated by means of the syn-chronization message done that each activated process must send to the father process when itfinishes its activity:
proctype activity_joinfork_11() {
course_java_programming_I(); joinfork_11!done;
}
proctype activity_joinfork_12() {
course_logic(); joinfork_12!done;
}
inline activity_joinfork_1() {
run activity_joinfork_11(); run activity_joinfork_12();
joinfork_11?done; joinfork_12?done;
}
Finally, decision and merge nodes are encoded by either conditioned or non-deterministic if.Each such if statement refers to a set of alternative sub-activity diagrams (sub-curricula). Onlyone will be effectively attended but all of them will be verified:
inline activity_decisionmerge_11() {
course_introduction_to_database();
}
inline activity_decisionmerge_12() {
skip;
}
inline activity_decisionmerge_1() {
if
:: (transaction >= 1 && data_recovery >= 1) ->
activity_decisionmerge_12();
:: else -> activity_decisionmerge_11();
fi
}
On the other hand, the process UpdateState, after setting the initial competences, checks if thepreconditions of the courses communicated by CurriculumVerification hold in the current state.If a course is applicable it also updates the state. The test of the preconditions and the updateof the state are performed as an atomic operation. In the end if everything is right it sends afeedback to CurriculumVerification (feedback!done):
28
proctype UpdateState() {
SetInitialSituation();
do [ ... ]
:: attend?lab_of_web_services -> atomic {
preconditions_course_lab_of_web_services();
effects_course_lab_of_web_services(); }
:: attend?stop -> LearningGoal(); break;
od
}
When attend?stop (see above) is received, the check of the user’s learning goal is performed.This just corresponds to a test on the knowledge in the ending state:
inline LearningGoal() {
assert(advanced_java_programming>=5 && N_tier_architectures
>= 4 && relational_algebra>=2 && ER_language>=2);
}
To check if the curriculum complies to a curricula model, we check if every possibly sequenceof execution of the Promela program satisfies the LTL formulas, now transformed into neverclaims directly by SPIN. For example, the curriculum shown in Fig. 3 respects all the constraintsimposed by the curricula model described in Fig. 1, taking into account the description of thecourses supplied at the URL above. The assertion verification takes very few seconds on anold notebook; the automaton generated from the Promela program on that example has morethan four-hundred states, indeed, it is very tractable. Also the verification of the temporalconstraints is not hard if we check the constraints one at the time.
3.3.5 Conclusions
We have described the work carried on in the last years about the representation of and reasoningapplied curricula, reporting also the current state of advancement of the integration of semanticpersonalization web services for Curriculum Planning and Validation within the Personal ReaderFramework.
We have introduced a graphical language to describe curricula models as temporal con-straints posed on the acquisition of competences (supplied by courses), therefore, taking intoaccount both the concepts supplied/required and the proficiency level. We have also shownhow model checking techniques can be used to verify that a curriculum complies to a curriculamodel, and also that a curriculum both allows the achievement of the user’s learning goalsand that it has no competence gaps. This use of model checking is inspired by [1], whereLTL formulas are used to describe and verify the properties of a composition of Web Services.Another recent work, though in a different setting, that inspired this proposal is [23], wheremedical guidelines, represented by means of the GLARE graphical language, are translated ina Promela program, whose properties are verified by using SPIN. Similarly to [23], the use ofSPIN, gives an automa-based semantics to a curriculum (the automaton generated by SPINfrom the Promela program) and gives a declarative, formal, representation of curricula models(the set of temporal constraints) in terms of a LTL theory that enables other forms of reason-ing. In fact, as for all logical theories, we can use an inference engine to derive other theoremsor to discovery inconsistencies in the theory itself. The presented proposal is an evolution ofearlier works [4, 3, 5], where we applied semantic annotations to learning objects, with theaim of building compositions of new learning objects, based on the user’s learning goals and
29
exploiting planning techniques. That proposal was based on a different approach that relied onthe experience of the authors in the use of techniques for reasoning about actions and changeswhich, however, suffers of the limitations discussed in the introduction.
We have also reported about the integration of the above approach into the Personal ReaderFramework [18]. In this latter context, the goal of personalization is to create sequences ofcourses that fit the specific context and the learning goal of individual students. Despite somemanual post-processing for fixing inconsistencies, we used real information from the HannoverUniversity database of courses for extracting the meta-data. Currently the courses are an-notated also by meta-data concerning the schedule and location of courses, like for instanceroom-numbers, addresses and teaching hours. As a further development, it would be interest-ing to let our Curriculum Planning Service to make use also of such metadata in order to finda solution that fits the desires and the needs of the user in a more complete way.
The Curriculum Planning Service has been integrated as a new plug-and-play personaliza-tion service in the Personal Reader framework. The Curriculum Validation Service has beendesigned. An early prototype of the validation system based on the model checker SPIN hasbeen developed [6] and is currently being embedded in the same framework. The PersonalReader Platform provides a natural framework for implementing a service-oriented approach topersonalization in the Semantic Web, allowing to investigate how (semantic) web service tech-nologies can provide a suitable infrastructure for building personalization applications, thatconsist of re-usable and interoperable personalization functionalities. The idea of taking a ser-vice oriented approach to personalization is quite new and was born within the personalizationworking group of the Network of Excellence REWERSE.
References
[1] W. M. P. van der Aalst and M. Pesic. DecSerFlow: Towards a Truly Declarative ServiceFlow Language. In Mario Bravetti and Gialuigi Zavattaro, editors, Proc. of WS-FM, LNCS,Vienna, September 2006. Springer.
[2] M. Baldoni, C. Baroglio, I. Brunkhorst, N. Henze, E. Marengo, and V. Patti. A Personal-ization Service for Curriculum Planning. In E. Herder and D. Heckmann, editors, Proc. ofthe 14th Workshop on Adaptivity and User Modeling in Interactive Systems, ABIS 2006,pages 17-20, Hildesheim, Germany, October 2006.
[3] M. Baldoni, C. Baroglio, and N. Henze. Personalization for the Semantic Web. In N.Eisinger and J. Maluszynski, editors, Reasoning Web, First International REWERSE Sum-mer School 2005, volume 3564 of LNCS Tutorials, pages 173-212. Springer-Verlag, Malta,July 2005.
[4] M. Baldoni, C. Baroglio, V. Patti, and L. Torasso. Reasoning about learning object meta-data for adapting SCORM courseware. In L. Aroyo and C. Tasso, editors, AH 2004:Workshop Proceedings, Part I, International Workshop on Engineering the Adaptive Web,EAW’04: Methods and Technologies for personalization and Adaptation in the Seman-tic Web, pages 4-13, Eindhoven, The Netherlands, August 2004. Technische UniversiteitEindhoven.
[5] M. Baldoni, C. Baroglio, and V. Patti. Web-based adaptive tutoring: an approach based onlogic agents and reasoning about actions. Artificial Intelligence Review, 22(1):3-39, 2004.
30
[6] M. Baldoni, C. Baroglio, A. Martelli, V. Patti, and L. Torasso. Verifying the complianceof personalized curricula to curricula models in the semantic web. In M. Bouzid and N.Henze, editors, Proc. of the Semantic Web Personalization Workshop, held in conjuctionwith the 3rd European Semantic Web Conference, pages 53-62, Budva, Montenegro, 2006.
[7] R. Baumgartner and S. Flesca and G. Gottlob. Visual Web Information Extraction withLixto. The VLDB Journal, 119–128, 2001.
[8] R. Baumgartner, N. Henze, and M. Herzog: The Personal Publication Reader: IllustratingWeb Data Extraction, Personalization and Reasoning for the Semantic Web. EuropeanSemantic Web Conference ESWC 2005, Heraklion, Greece, May 29 - June 1 2005.
[9] M. Baldoni and E. Marengo. Curriculum Model Checking: Declarative Representation andVerification of Properties. In E. Duval, R. Klamma, and M. Wolpers, editors, Proc. of EC-TEL 2007 - Second European Conference on Technology Enhanced Learning, number 4753in LNCS, pages 432-437. Springer, 2007.
[10] European Commission, Education and Training: The BOLOGNA Process, url-http://europa.eu.int/comm/education/policies/educ/bologna/bologna en.html
[11] P. Brusilovsky and J. Vassileva. Course sequencing techniques for large-scale web-basededucation. Int. J. Cont. Engineering Education and Lifelong learning, 13(1/2):75-94, 2003.
[12] O. E. M. Clarke and D. Peled. Model checking. MIT Press, Cambridge, MA, USA, 2001.
[13] E. A. Emerson. Temporal and model logic. In Handbook of Theoretical Computer Science,volume B, pages 997-1072. Elsevier, 1990.
[14] M. del Mar Gallardo, P. Merino, and E. Pimentel. Debugging UML Designs with ModelChecking. Journal of Object Technology, 1(2):101¿117, July-August 2002.
[15] N. Guelfi and A. Mammar. A Formal Approach for the Veri¿cation of E-business Pro-cesses Using The Promela Language. Technical Report TR-SE2C-04-10, SE2C, SoftwareEngineering Competence Center, University of Luxembourg, 2004.
[16] N. Guelfi and A. Mammar. A Formal Semantics of Timed Activity Diagrams and itsPROMELA Translation. In Proc. of the 12th Asia-Pacific Software Engineering Conference(APSEC’05), pages 283-290. IEEE Computer Society, 2005.
[17] N. Henze: Personal Readers: Personalized Learning Object Readers for the SemanticWeb. 12th al Conference on Artificial Intelligence in Education, AIED’05, 18-22 July 2005,Amsterdam, The Netherlands.
[18] N. Henze and D. Krause. Personalized access to web services in the semantic web. In The3rd International Semantic Web User Interaction Workshop (SWUI, collocated with ISWC2006, November 2006.
[19] G. J. Holzmann. The SPIN Model Checker, Primer and Reference Manual. Addison-Wesley,2003.
31
[20] J. L. De Coi, E. Herder, A. Koesling, C. Lofi, D. Olmedilla, O. Papapetrou, and W. Siberski.A model for competence gap analysis. In WEBIST 2007, Proceedings of the Third Interna-tional Conference on Web Information Systems and Technologies: Internet Technology /Web Interface and Applications, Barcelona, Spain, Mar 2007. INSTICC Press.
[21] M. P. Singh. Agent communication languages: Rethinking the principles. IEEE Computer,31(12):40-47, 1998.
[22] M. P. Singh. A social semantics for agent communication languages. In In Issues in AgentCommunication, number 1916 in LNCS, pages 31-45. Springer, 2000.
[23] P. Terenziani, L. Giordano, A. Bottrighi, S. Montani, and L. Donzella. SPIN Model Check-ing for the Verification of Clinical Guidelines. In Proc. of ECAI 2006 Workshop on AItechniques in healthcare: evidence-based guidelines and protocols, Riva del Garda, August2006.
[24] Unified Modeling Language: Superstructure, version 2.1.1. OMG, Object ManagementGroup, February 2007.
4 DYNAWeb
Industrial maintenance is one of the most important tasks in the industry because its cost istoo high, usually due to poor maintenance decisions. Traditionally, corrective maintenanceand preventive maintenance are performed, but both of them, the excessive and the lackingmaintenance can be harmful. In the last years, CBM (Condition Based Maintenance) technologyor predictive maintenance has appeared in order to establish whether the system will fail duringsome future period and then take actions to avoid consequences.
Within these years, we have developed the e-maintenance platform DYNAWeb, which isalso part of DYNAMITE project. DYNAWeb develops a CBM system based on OSA-CBMstandard over MIMOSA comprising many capabilities, like sensing and data acquisition, signalprocessing, health assessment, and prognosis.
This platform ensures the integration of all the components (software and hardware) usingdifferent technologies (e.g. sensor technologies, wireless communication technologyand provid-ing them with agents and (Semantic) Web Services to allow the integration and the reuse amongdifferent applications.
The DYNAMITE vision aims at promoting a major change in the focus of condition basedmaintenance, essentially taking full advantage of recent advanced information technologies, thatare related to hardware, software and semantic information modelling. Special attention is alsogiven to the identification of cost-effectiveness related to the upgraded CBM strategies, as wellas to the inclusion of innovative technologies within CBM. It is expected that the combinationof the use of new technologies with a clear indication of cost-benefit trade-off will facilitatethe upgrade into CBM, in many cases where non-critical machinery exists, and especially forthe vast majority of SME companies that feel the distance between planned maintenance andcondition based is too wide.
In order to provide the most convenient analysis flow, information processing is understoodas a distributed and collaborative system, where three different levels of entities can undertakeintelligence tasks. At the lower end, sensors can provide certain degree of reasoning, taking intoaccount the “local” scope of this processing. At a medium level, smart PDAs (mobile agents) will
32
provide higher communication interfaces with sensors, intermediate processing capabilities anda smart end for human interface to remote web services centres that will compose a distributedweb platform system at the higher end of the processing hierarchy [1]. Finally, wireless datatransmission between sensor devices and information processing layers will be implemented.
4.1 Ontology
The real challenge is to match the semantic web concept to the maintenance function. In thisway, information used over internet must be specified in ontologies. The ontology representsthe knowledge in internet [3], defining in a formal way the concepts of the different domains andrelationships, with ability to perform reasoning over this knowledge. The definition of this on-tologies has been performed starting from the standard CRIS (Common Relational InformationSchema) defined by MIMOSA 3 (Machinery Information Management Open System Alliance).
CRIS represents a static view of the data produced by a CBM system, where every OSA-CBM layer has been associated to an ontology [2]. OSA-CBM was developed around MIMOSACRIS (Common Relational Information Schema) that provides coverage of the information(data) that will be managed within a condition based maintenance system. It defines a re-lational database schema with about 200 of tables approximately for machinery maintenanceinformation. In short, CRIS is the core of MIMOSA which aim is the development and publica-tion of open conventions for information exchange between plant and machinery maintenanceinformation system. In this sense DYNAMITE investigate the way to improve these ontologiesdefined in XML language to other richer semantic ontology languages as RDF or OWL.
4.2 Semantic web services
DYNAWeb (Semantic Web) Services are the core software modules which support the e- main-tenance platform and provide a services oriented functionality for the Semantic Web. Thedescription of these services goes far beyond the idea of an interface since we may find internalreasoning, state handling and many other elements. The set of DYNAWeb Web Services hasbeen divided into different groups of Web Services depending on associated OSA-CBM layer,so it has defined three types of different Web Services (condition monitoring, diagnosis andprognosis). All of these Web Services could be invoked by PDAs or CMOpS. The conditionmonitoring will perform in sensors and PDAs but Web Services have been designed to providethis service in case not having information. So, PDA or CMOpS could request the Web Serviceand depending on data received by this, it could be performed four different functions relatedto condition monitoring:
• Absolute: this function retrieves alerts depending on fixed limits. The limits define subsetswhich belong to specific alert regions.
• Relative: this function issued alerts by means of the deviations between the measuredcurrent values and a reference values. Depending on the variation, it is issued an alertwith a specific severity.
• Two Dimensions: the limits which define the alert regions depend on another parameter.
• Dynamic Limits: this function calculates the mean and standard deviation of historicvalues within it is possible to define the interval of confidence.
33
The Web Services for diagnosis assess the health of the component. There are five differentservices for diagnosis:
• Spindle Diagnosis: this function applies Bayesian Network to retrieve a list of failureswith probabilities associated using vibration information.
• Hydraulic System: this function uses CLIPS expert system to retrieve diagnosis statusby means of oil information.
• Cogenerator Diagnosis: this function uses means of vibration, oil and efficiency parameterswithin FMECA and retrieves diagnosis status.
• Reciprocating Engine Diagnosis: this function retrieves diagnosis status using CLIPSexpert system within means of vibration and oil information.
• Reliability Diagnosis: this function is able to perform a diagnosis by means of FTA (Faulttree Analysis) information of the component.
Finally, prognosis Web Services implements functionality to compute the remaining usefullife of the component submitted to a degradation mode. The design of these Web Services isfocused on two specific cases of prognosis based on:
• Reliability: this function uses a degradation model based on reliability;
• Condition monitoring: this function applies a data modelling approach (trend analysis,pattern recognition, etc).
References
[1] A. Arnaiz, C. Emmanouilidis, B. Iung, and E. Jantunen (2006). Mobile Maintenance Man-agement. Journal of International Technology and Information Management, Vol 15 (4)11-22
[2] M. Lebold, K. Reichard, C. S. Byington, R. Orsagh. OSA-CBM Architecture Developmentwith Emphasis on XML Implementations. MARCON 2002.
[3] A. Lozano: Ontologies in the semantic web. Jornadas de Ingenierıa web. (2001)
[4] M. Melia and C. Pahl. Automatic Validation of Learning Object Compositions. In Infor-mation Technology and Telecommunications Conference IT&T’2005: Doctoral Sympo-sium, Carlow, Ireland, 2006.
5 Conclusion
This deliverable accounts for the most recent advancement of the research line on Testbeds ofthe working group A3. The presented testbeds are at different development stages; in particu-lar, the work on the DYNAWeb platform is still in an early phase. The other two applications,instead, are quite at an advanced stage and witness the integration, within the Personal Readerframework, of Personalization services that base upon totally different theoretical bases (unsu-pervised neural networks and temporal reasoning in the specific case). These integration come
34
out as being, nevertheless, pretty easy, thanks to the service-oriented nature of the PersonalReader framework and to the choice of decoupling as much as possible the application logic ofthe personalization services from the interaction with the user and the interface components,as well as from the fact that all the components of the system interact with one another basedon a semantics basis. Indeed, all information (e.g. encoding the user profiles) are kept andexchanged in the form of RDF documents.
Acknowledgement
This research has been co-funded by the European Commission and by the Swiss Federal Officefor Education and Science within the 6th Framework Programme project REWERSE num-ber 506779 (cf. http://rewerse.net).
6 Appendix
Hereafter you will find included the following scientific papers:
1. Scalability and evaluation of contextual immune model for Web mining, S.T. Wierzchon,K. Ciesielski, M.A. Klopotek. In:, Aboul-Ella Hassanien Janusz Kacprzyk, Ajith Abra-ham (eds): Computational Intelligence in Multimedia Processing: Recent Advances, SoftComputing Series, Springer, 2008.
2. Term Distribution-based Initialization of Fuzzy Text Clustering, K. Ciesielski, M.A. Klopotek,S.T. Wierzcho’n. To appear in Proc. 17th Int. Symposium on Methodologies for Intelli-gent Systems (ISMIS’08), Toronto, Canada, May 20-23, 2008, LNAI, Springer.
3. A Service-Oriented Approach for Curriculum Planning and Validation, by Matteo Bal-doni, Cristina Baroglio, Ingo Brunkhorst, Elisa Marengo, Viviana Patti, in the Proc. ofMALLOW-AWESOME 2007.
4. Curricula Modeling and Checking, by Matteo Baldoni, Cristina Baroglio, and Elisa Marengo,in the Proc. of AI*IA 2007, LNAI 4733, Springer, 2007.
5. Web Services System for distributed technology upgrade within an e-maintenance frame-work, by Eduardo Gilabert, Susana Ferreiro, Aitor Arnaiz, OTM Workshops, 2007.
6. Semantic Web Services for advanced maintenance strategies, by S. Ferreiro, E. Gilabert,A. Arnaiz, 2007.
35
Scalability and Evaluation of ContextualImmune Model for Web Mining
SÃlawomir T. Wierzchon1,2, Krzysztof Ciesielski1, and MieczysÃlaw A.KÃlopotek1,3
1 Institute of Computer Science, Polish Academy of Sciences,Ordona 21, 01-237 Warszawa,Polandstw,kciesiel,[email protected]
2 Faculty of Mathematics, Physics and Informatics, Gdansk University,Wita Stwosza 57, 80-952 Gdansk-Oliwa
3 Institute of Computer Science, University of Podlasie,Konarskiego 2, 08-110 Siedlce
Summary. In this chapter we focus on some problems concerning application ofan immune-based algorithm to extraction and visualization of cluster structure.Particularly a hierarchical, topic-sensitive approach is proposed; it appears to be arobust solution to the problem of scalability of document map generation process(both in terms of time and space complexity). This approach relies upon extractionof a hierarchy of concepts, i.e. almost homogenous groups of documents describedby unique sets of terms. To represent the content of each context a modified versionthe aiNet [9] algorithm is employed; it was chosen because of its natural abilityto represent internal patterns existing in a training set. Careful evaluation of theeffectiveness of the novel text clustering procedure is presented in section reportingexperiments.
1 Introduction
When analyzing the number of terms per query in one billion accesses to theAltavista site, [12], extraordinary results were observed by Alan Gilchrist: (a)in 20.6% queries no term was entered, (b) in almost 25% queries only one termwas used in a search, and (c) the average was not much higher than two terms!This justifies our interest in looking for a more ”user-friendly” interfaces toweb-browsers.
A first stage in improving the effectiveness of Information Retrieval (IR)systems was to apply the idea of clustering inspired by earlier studies of Salton,[21], and reinvigorated by Rijsbergen’s Cluster Hypothesis [24]. According tothis hypothesis, relevant documents tend to be highly similar to each other,and therefore tend to appear in the same clusters. Thus, it is possible to re-duce the number of documents that need to be compared to a given query,

2 SÃlawomir T. Wierzchon, Krzysztof Ciesielski, and MieczysÃlaw A. KÃlopotek
as it suffices to match the query against cluster representatives first. How-ever such an approach offers only technical improvement in searching relevantdocuments. A more radical improvement can be gained by using so-calleddocument maps, [2], where a graphical representation allows additionally toconvey information about the relationships of individual documents or groupof documents. Document maps are primarily oriented towards visualizationof a certain similarity of a collection of documents, although other usage ofsuch the maps is possible – consult Chapter 5 in [2] for details.
The most prominent representative of this direction is the WEBSOMproject4. Here the Self-Organizing Map, or SOM, algorithm [19] is used toorganize miscellaneous text documents onto a 2-dimensional grid so that re-lated documents appear close to each other. Each grid unit contains a setof closely related documents. The color intensity reflects dissimilarity amongneighboring units: the lighter shade the more similar neighboring units are.Unfortunately this approach is time and space consuming, and rises questionsof scaling and updating of document maps (although some improvements arereported in [20]). To overcome some of these problems the DocMINER systemwas proposed in [2]. It composes a number of methods from explorative dataanalysis to support effectively information access for knowledge managementtasks. Particularly, a given collection of documents represented as vectors inhighly dimensional vector space is moved – by a multidimensional scaling algo-rithm – to so-called semantic document space in which document similaritiesare reinforced. Then the topological structure of the semantic document spaceis mapped to a 2-dimensional grid using the SOM algorithm.
Still, the profound problem of map-like representation of document collec-tions is the issue of scalability which is strongly related to high dimensionality.While multidimensional scaling and other specialized techniques, like PCA,versions of SVD etc., reduce the dimensionality of the space formally, theymay result in increased complexity of document representation (which had alow number of non-zero coordinates in the high-dimensional space, and hasmore non-zero coordinates in the reduced space). So some other way of dimen-sionality reduction, via feature selection and not feature construction, shouldbe pursued.
Note that the map of documents collection is a new kind of clustering,where not only the documents are split into groups, but also there exists astructural relationship between clusters, reflected by the topology of a map.We can say we have to do with a cluster networking. This affects the closelyrelated issue of evaluation of the quality of the obtained clusters. Usually thequality evaluation function is a driving factor behind the clustering algorithmand hence partially determines its complexity and success. While the conven-tional external and internal cluster evaluations criteria (like class purity, classuniformity, inter-class dissimilarity) are abundant, they are primarily devised
4 Details and full bibliography concerning WEBSOM can be found at the web-pagehttp://websom.hut.fi/websom/.
Scalability and Evaluation of Contextual Immune Model for Web Mining 3
to evaluate the sets of independent (not linked) clusters, there exist no sat-isfactory evaluation criteria for cluster network quality. Beside SOM, thereare other clustering methods like growing neural gas (GNG) [11] or artificialimmune systems (AIS) [9], [25] that face similar problems.
In our research project BEATCA, [18], oriented towards exploration andnavigation in large collections of documents a fully-fledged search engine capa-ble of representing on-line replies to queries in graphical form on a documentmap has been designed and constructed [16]. A number of machine-learningtechniques, like fast algorithm for Bayesian networks construction [18], SVDanalysis, (GNG) [11], SOM algorithm, etc., have been employed to realize theproject. BEATCA extends the main goals of WEBSOM by a multilingual ap-proach, new forms of geometrical representation (besides rectangular maps,projections onto sphere and torus surface are possible).
The process of document map creation is rather complicated and consistsof the following main stages: (1) document crawling, (2) indexing, (3) topicsidentification, (4) document grouping, (5) group-to-map transformation, (6)map region identification, (7) group and region labeling, and finally, (8) visu-alization. At each of theses stages various decisions should be made implyingdifferent views of the document map.
Within such a framework, in this chapter we propose a new solution to theproblem of scalability and of evaluation of the quality of the cluster network.In particular, the contribution of this chapter concerns: (1) invention of a newartificial immune algorithm for handling large-scale document collections, toreplace the traditional SOM in document map formation, (2) invention of anew representation of the document space, in which instead of single pointstatistics of terms their distributions (histograms) are exploited, (3) inventionof a measure of quality of networked clustering of document collections, whichis based on the above-mentioned histograms, and which evaluates the qualityof both the clustering of documents into the groups as well as usefulness ofthe inter-group links. These new features are of particular value within ourframework of contextual document space representation, described in earlierpublications, allowing for a more radical intrinsic dimensionality reduction,permitting efficient and predominantly local processing of documents.
In section 2 we present our hierarchical, topic-sensitive approach, whichappears to be a robust solution to the problem of scalability of map generationprocess (both in terms of time complexity and space requirements). It reliesupon extraction of a hierarchy of concepts, i.e. almost homogenous groups5 ofdocuments. Any homogenous group is called here a ”context”, in which furtherdocument processing steps – like computation of term-frequency related mea-sures, keyword extraction, and dimensionality reduction – are carried out, sothat each context is described by unique set of terms. To represent the contentof each context a modified version of the aiNet algorithm [10] was employed –
5 By a homogegous group we understand hereafter a set of documents belongingto a single cluster after a clustering process.
4 SÃlawomir T. Wierzchon, Krzysztof Ciesielski, and MieczysÃlaw A. KÃlopotek
see section 3. This algorithm was chosen because of its ability of representinginternal patterns existing in a training set. More precisely, the aiNet producesa compressed data representation for the vectors through the process resem-bling data edition. Next this reduced representation is clustered; the originalaiNet algorithm uses hierarchical clustering, [10], while we propose originaland much more efficient procedure.
Further, the method of representing documents and groups of documentsin the vector space was enriched: Instead of traditional single point measurewe apply the histograms of term occurrence distributions in some conceptualspace so that the document content patterns would be matched in a morerefined way – see section 4 for details.
To evaluate the effectiveness of the novel text clustering procedure it hasbeen compared to the aiNet and SOM algorithms in section 5. In the experi-mental sections 5.6 – 5.8 we have also investigated issues such as evaluation ofimmune network structure and the influence of the chosen antibody/antigenrepresentation on the resulting immune memory model. Final conclusions aregiven in section 7.
1.1 Document maps
Before going into details let us devote a little bit attention to the conceptof a document map as such. Formally, a document map can be understoodas a 2-dimensional rectangle (or any other geometrical figure) split into dis-joint areas, usually squares or hexagons6, called ”cells”. To each cell a set ofdocuments is assigned, thus a single cell may be viewed as a kind of docu-ment cluster. The cells are frequently clustered into so-called regions on theground of similarity of their content. The cells (and regions) are labeled bythe keywords best-describing cell/region content, where ”best-describing” isintended to mean entire characteristic of the cell/region, but distinguishing itfrom surrounding cells/regions. A document map is visualized in such a waythat cell colors (or textures) represent the number of documents it contains,or the degree of similarity to the surrounding cells, the importance of docu-ments (e.g. PageRank), the count of documents retrieved in the recent query,or any other feature significant from the point of view of the user. The labelsof some cell/region are also displayed, but with a ”density” not prohibitingthe overall readibility. Optionally, labels may be displayed in ”mouse-over”fashion.
2 Contextual local networks
In our approach – like in many traditional IR systems – documents are mappedinto T -dimensional term vector space. The points (documents) in this space
6 For non-Euclidian geometries other possibilities exist – cf. [18]

Scalability and Evaluation of Contextual Immune Model for Web Mining 5
are of the form (w1,d, ..., wT,d) where T stands for the number of terms, andeach wt,d is a weight for term t in document d, so-called term frequency/inversedocument frequency, tfidf, weight:
wt,d = w(t, d) = ftd · log(
N
ft
)(1)
where ftd is the number of occurrences of term t in document d, ft is the num-ber of documents containing term t and N is the total number of documents.
The vector space model has been criticized for some disadvantages, pol-ysemy and synonymy, among others, [3]. To overcome these disadvantages acontextual approach has been proposed [18] relying upon dividing the set ofdocuments into a number of homogenous and disjoint subgroups (clusters).During the dimensionality reduction process, each of the clusters, called also”contexts” (for reasons obvious later), will be described by a unique subset ofterms.
In the sequel we will distinguish between hierarchical and contextual modelof documents treatment. In the former the dimensionality reduction process isrun globally, for the whole collection of documents, so that the terms used fordocument description are identical for each subgroup of documents, and thecomputation of tfidf weights, defined in equation (1) is based on the wholedocument collection. In the later model, for each subgroup the dimensionalityreduction process is run separately, so that each subgroup may be describedby a different subset of terms weighted in accordance with the equation (4).Finally, whenever we do not carry out a clustering of documents and weconstruct a single, ”flat”, representation for entire collection – we will speakabout a global model. 7
The contextual approach consists of two main stages. At first stage a hier-archical model is built, i.e. a collection D of documents is recurrently divided– by using Fuzzy ISODATA algorithm [4] – into homogenous groups consistingof approximately identical number of elements. Such a procedure results in ahierarchy represented by a tree of clusters. The process of partitioning haltswhen the number of documents inside each group meets predefined criteria8.To compute the distance dist(d, v) of a document d from a cluster centroid v,the cosine distance was used:
dist(d, v) = 1−<d/||d||, v/||v||> = 1− (d/‖d‖)T(v/‖v‖) (2)
where the symbol < ·, · > stands for the dot-product of two vectors. GivenmdG, the degree of membership of a document d to a group G, (obtained via
7 The principal difference between the ”hierarchical” and the ”global” models isthat in the hierarchical model we distinguish a number of clusters, while in theglobal model we treat the whole collection as a single cluster.
8 Currently a single criterion saying that the cardinality ci of i-th cluster cannotexceed a given boundaries [cmin, cmax]. This way the maps created for each groupat the same level of a given hierarchy will contain similar number of documents.

6 SÃlawomir T. Wierzchon, Krzysztof Ciesielski, and MieczysÃlaw A. KÃlopotek
the Fuzzy-ISODATA algorithm) this document is assigned to the group withhighest value of mdG.
The second phase of contextual document processing relies upon divisionof terms space (dictionary) into – possibly overlapping – subspaces of termsspecific to each context (i.e. the group extracted in previous stage). The fuzzymembership level, mtG, representing importance of a particular term t in agiven context G is computed as:
mtG =∑
d∈G (ftd ·mdG)fG ·
∑d∈G mdG
(3)
where fG is the number of documents in the cluster G, mdG is the degree ofmembership of document d to group G, ftd is the number of occurrences ofterm t in document d. We assume that a term t is relevant for a given contextG if mtG > ε, where ε is a parameter.
Removing non-relevant terms leads to the topic-sensitive reduction of thedimension of the terms space. This reduction results in a new vector repre-sentation of documents; each component of the vector is computed accordingto the equation:
wtdG = ftd ·mtG · log(
fG
ftG ·mtG
)(4)
where ftG is the number of documents in the group G containing term t.To depict similarity relation between contexts (represented by a set of con-
textual models), additional ”global” map is required. Such a model becomesthe root of contextual maps hierarchy. Main map is created in a manner sim-ilar to previously created maps with one distinction: an example in trainingdata is a weighted centroid of referential vectors of the corresponding con-textual model: vi =
∑c∈Ci
(|c| · vc), where Ci is the set of antibodies 9 ini-th contextual model (obtained from Fuzzy-ISODATA), |c| is the density ofthe antibody, i.e. the number of assigned documents and vc is its referentialvector.
The whole process of learning contextual model (summarized in the pseu-docode 1) is to some extent similar to the hierarchical learning [13]. However,in our approach each constituent model, and the corresponding contextualmap, can be processed independently (particularly, in parallel). Also a partialincremental update of such a model appears to be much easier to perform,both in terms of model quality, stability and time complexity. The possibilityof incremental learning stems from the fact that the very nature of the learningprocess is iterative. So if new documents come, we can consider the learningprocess as having been stopped at some stage and it is resumed now with allthe documents. We claim that it is not necessary to start the learning processfrom scratch neither in the case that the new documents ”fit” the distribution9 This notion is explained in section 3.1.
Scalability and Evaluation of Contextual Immune Model for Web Mining 7
of the previous ones nor when their term distribution is significantly different.This claim is supported by experimental results presented e.g in [18].
Algorithm 1 Scheme of the meta-algorithm of contextual processing1. Index the whole set of documents and collect global frequency statistics for
terms2. Create global vector representation of documents and identify globally signifi-
cant terms (global reduction of dimensionality)3. Identify major themes in the document collection4. Based on global representation and major themes carry out fuzzy splitting of
the document collection and reduce the term space5. Create initial contextual groups and compute contextual statistics for the terms6. Identify locally significant terms and create contextual vector representation for
the individual groups7. Create the contextual model (a hierarchy of network models, based on local
vector representations)8. Create map-like visualization of the contextual model and find labels for docu-
ment groups (network nodes and map cells)9. Adapt the existing model in response to changes of objective factors (data
changes) or subjective factors (personalization, response to changes in user pro-file):
a) Modify local statistics of individual contexts and modify vector representa-tions taking into account the significance of terms.
b) Modify the existent split into contextsc) Start incremental learning of existing contextual modelsd) Create a new map-like visualization of the modified contextual model and
update the group and cell labels
3 Immune approach to text data clustering
One of main goals of the BEATCA project was to create multidimensionaldocument maps in which geometrical vicinity would reflect conceptual close-ness of documents in a given document set. Additional navigational informa-tion (based on hyperlinks between documents) can be introduced to visualizedirections and strength of between-group topical connections.
Clustering and content labeling is the crucial issue for understanding thetwo-dimensional map by a user. We started our research with the WEBSOMapproach which, appeared to be unsatisfactory: both speed and clusteringstability were not very encouraging.
In SOM algorithm, [19] each unit of an K × K grid contains so-calledreference vector vi, whose dimension agrees with the dimension of trainingexamples. The training examples are repeatedly presented to the network
8 SÃlawomir T. Wierzchon, Krzysztof Ciesielski, and MieczysÃlaw A. KÃlopotek
until a termination criterion is satisfied. When an example x(t) is presentedat time t to the network, its reference vectors are updated according to therule
vi(t + 1) = vi(t) + αi(t) · (x(t)− vi(t)) , i = 1, ..., |K| × |K| (5)
where αi(t) is so-called learning rate varying according to the equation:
αi(t) = ε(t) · exp(−dist(i, w)
σ2(t)
)(6)
Here ε(t) and σ(t) are two user defined monotone decreasing functions of timecalled, respectively, step size (or cooling schedule) and neighborhood radius.The symbol dist(i, w) stands for the distance (usually Manhattan distance)between i-th unit and so-called winner unit (i.e. the unit which referencevector is most similar to the example x(t)).
The main deficiencies of SOM are (cf. [1]): (a) it is order dependent, i.e. thecomponents of final weight vectors are affected by the order in which trainingexamples are presented, (b) the components of these vectors may be severelyaffected by noise and outliers, (c) the size of the grid, the step size and the sizeof the neighborhood must be tuned individually for each data-set to achieveuseful results, (d) high computational complexity.
GNG [11] uses the same equation (5) to update reference vectors but withfixed learning rate α. Further its output is rather graph and not a grid. Themain idea is such that starting from very few nodes (typically, two), one newnode is inserted ever λ iterations near the node featuring the local local errormeasurement. There is also a possibility to remove nodes: every λ iterationsthe node with lowest utility for error reduction is removed. The main disad-vantages of GNG are (cf. [1]): (a) in comparison with SOM it requires largernumber of control parameters which should be tuned, (b) because of fixedlearning rate it lacks stability, (c) rather elaborated technique for visualizingresulting graph must be invented.
An immune algorithm is able to generate the reference vectors (calledantibodies) each of which summarizes basic properties of a small group ofdocuments treated here as antigens10. This way the clusters in the immunenetwork spanned over the set of antibodies will serve as internal images, re-sponsible for mapping existing clusters in the document collection into net-work clusters. In essence, this approach can be viewed as a successful instanceof exemplar-based learning giving an answer to the question ”what examplesto store for use during generalization, in order to avoid excessive storage andtime complexity, and possibly to improve generalization accuracy by avoidingnoise and overfitting”, [26].
10 Intuitively by antigens we understand any substance threatening proper function-ing of the host organism while antibodies are protein molecules produced to bindantigens. A detailed description of these concepts can be found in [9].

Scalability and Evaluation of Contextual Immune Model for Web Mining 9
3.1 aiNet algorithm for data clustering
The artificial immune system aiNet [10] mimics the processes of clonal selec-tion, maturation and apoptosis [9] observed in the natural immune system.Its aim is to produce a set of antibodies binding a given set of antigens (i.e.documents). The efficient antibodies form a kind of immune memory capableto bind new antigens sufficiently similar to these from the training set.
Like in SOM and GNG, the antigens are repeatedly presented to the mem-ory cells (being matured antibodies) until a termination criterion is satisfied.More precisely, a memory structure M consisting of matured antibodies isinitiated randomly with few cells. When an antigen agi is presented to thesystem, its affinity aff (agi, abj) to all the memory cells is computed. The valueof aff (agi, abj) expresses how strongly the antibody abj binds the antigen agi.From a practical point of view aff (agi, abj) can be treated as a degree of sim-ilarity between these two cells11. The greater affinity aff (agi, abj), the morestimulated abj is.
The idea of clonal selection and maturation translates into next steps (hereσd, and σs are parameters). The cells which are most stimulated by the antigenare subjected to clonal selection (i.e. each cell produces a number of copiesproportionally to the degree of its stimulation), and each clone is subjectedto mutation (the intensity of mutation is inversely proportional to the degreeof stimulation of the mother cell). Only clones cl which can cope successfullywith the antigen (i.e. aff (agi, cl) > σd) survive. They are added to a tentativememory, Mt, and the process of clonal suppression starts: an antibody abj toosimilar to another antibody abk (i.e. aff (abj , abk) > σs) is removed from Mt.Remaining cells are added to the global memory M .
These steps are repeated until all antigens are presented to the system.Next the degree of affinity between all pairs abj , abk ∈ M is computed andagain too similar – in fact: redundant – cells are removed from the memory.This step represents network suppression of the immune cells. Lastly r% (onemore parameter) of the worst individuals in M are replaced by freshly gen-erated cells. This ends one epoch, and next epoch begins until a terminationcondition is met.
Among all the parameters mentioned above the crucial one seems to bethe σs as it critically influences the size of the global memory. Each memorycell can be viewed as an exemplar which summarizes important features of”bundles” of antigens stimulating it.11 In practical applications this measure can be derived from any metric dissimi-
larity measure dist as aff (agi, abj) =dmax−dist(agi,abj)
dmax, where dmax stands for
the maximal dissimilarity between two cells. Another possibility – used in ourapproach – is to assume that the affinity is inversely proportional to the distancebetween corresponding molecules.

10 SÃlawomir T. Wierzchon, Krzysztof Ciesielski, and MieczysÃlaw A. KÃlopotek
3.2 Identification of redundant antibodies
Clonal suppression stage requires |Mt| ·(|Mt|−1)/2 calculations of the affinitybetween all pairs of the cells in Mt. To reduce time complexity of this stepwe refer to the agglomerative clustering approach. The crucial concept hereis to manage matrix of distances in a smart way and to update only thosedistances which have really changed after merging two clusters. Among manypossible solutions, we have applied so-called partial similarity matrix andupdate algorithm presented in [14]. Authors have shown that the expectedcomplexity of a single-step update is of order of O(2·N ·G·g), where N isthe number of objects, G is the maximum number of clusters, g << G isthe maximal number of column rescanning and modifications after clustersmerging step. It is significantly less than the O(N3) complexity of a naiveapproach. Finally, the reduced antibodies are replaced by a single cell beingthe center of gravity of the set of removed antibodies. Thus, we not only reducethe size of the immune network, but presumably compress an informationcontained in a set of specialized antibodies to the new, universal antibody.
3.3 Robust construction of mutated antibodies
In case of high-dimensional data, such as text data represented in vector space,calculation of stimulation level is quite costly (proportional to the number ofdifferent terms in dictionary). Thus, the complexity of an immune algorithmcan be significantly reduced if we could restrict the number of required expen-sive recalculations of stimulation level. The direct, high-dimensional calcula-tions can be replaced by operations on scalar values on the basis of the simplegeometrical observation that a stimulation of a mutated antibody clone canbe expressed in terms of original antibody stimulation.
Such an optimization is based on the generalized Pythagoras theorem: if v1,v2, v3 are the sides of a triangle (v1 +v2 +v3 = 0) then |v3|2 = |v1|2 + |v2|2−2 ·|v1| · |v2| ·cos(v1, v2). We can define mutated clone m as: m = κ ·d+(1−κ) · c,where c is cloned antibody, d is antigen (document) and κ is the randommutation level.
Taking advantage of equation (5) and Pythagoras theorem (where v1 :=d′ = κ · d, v2 := c′ = (1 − κ) · c, v3 := −m) and having calculated originalantibody stimulation aff (c, d), we can calculate mutated clone stimulationlevel aff (m, d) as follows. Let
P = cos(c′, d′) = cos(c, d) = 1− aff(c, d) (7)
and the scalar product
〈c, d〉 = P · |c| · |d| (8)
Then the norm of the mutated antibody is

Scalability and Evaluation of Contextual Immune Model for Web Mining 11
|m|2 = |d′|2+|c′|2+2·P ·|c′|·|d′| = κ2 ·|d|2+(1−κ)2 ·|c|2+2·κ·(1−κ)·P ·|c|·|d|(9)
Let us further define
s = κ · |d|2 + (1− κ) · |c| · |d| = κ|d|2 + (1− κ) · P · |c| · |d| (10)
Finally,
aff(m, d) =s
|m| · |d| (11)
Dually, we can find mutation threshold κ so that mutated antibody clonestimulation aff (m, d) < σd. Precisely, we are looking for constant value K suchthat aff(m, d) = σd. Subsequently K can be used to create mutated antibodyfor random mutation level κ ∈ (0,K). The advantage of such an approachis the reduction of the number of inefficient (too specific) antibodies, whichwould be created and immediately removed from the clonal memory.
Analogically to the previous inference, if we define
p = aff(c, d)
x = −p · |d|+ p2 · |c|+ σ2d · (p · |d| − c)
y = |d|2 − 2 · p · |c| · |d|+ p2 · |c|2 − σ2d · (|d|2 − |c|2 + 2 · p · |c| · |d|)
z = σd · |d|√
(p2 − 1) · (σ2d − 1)
then the sought value of mutation threshold K is
K =|c| · (x + z)
y(12)
3.4 Stabilization via time-dependent parameters
Typical problem with immune based algorithms is the stabilization of the sizeof the memory cells set. This explains why we decided to use time dependentparameters. For each parameter p, we defined its initial value p0 and the finalvalue p1 as well as the time-dependent function f(t), such that p(t) = f(t)and p(0) = p0, p(T ) = p1 where T is the number of learning iterations.
In particular, both σs(t) and σd(t) are reciprocally increased, while mb(t)– the number of clones produced by a cell – is linearly decreased with time:σ(t) = σ0 + (σ1 − σ0) · t·(T+1)
T ·(t+1) and mb(t) = m0 + m1−m0T · t, where σ0 = 0.05,
σ1 = 0.25 for σs(t); σ0 = 0.1, σ1 = 0.4 for σd(t); m0 = 3, m1 = 1 for mb(t).

12 SÃlawomir T. Wierzchon, Krzysztof Ciesielski, and MieczysÃlaw A. KÃlopotek
3.5 Robust antibody search in immune network
One of the most computationally demanding parts of any AIS algorithm isthe search for the best fitted (most stimulated) antibodies. Especially, in ap-plication to web documents, where both the text corpus size and the numberof cells in the immune, called also idiotypic, network is huge, the cost of evena single global search phase in the network is prohibitive.
Unfortunately, experiments showed that neither local search method (i.e.searching through the graph edges of the idiotypic network from last-iteration’sstarting cell) nor joint-winner search method (our own approach devoted toSOM learning [16]) are directly applicable to idiotypic networks.
We propose a replacement of the global search approach with a modifiedlocal search12. The modification relies upon remembering most stimulatedcell for more than one connected component of the idiotypic network and toconduct in parallel a single local-winner search thread for each component.Obviously, it requires one-for-iteration recalculation of connected components,but this is not very expensive: the complexity of this process is of order O(V +E), where V is the number of cells and E is the number of connections (graphedges).
A special case is the possibility of an antibody removal during the t-thlearning iteration. When the previous iteration’s most stimulated antibodyfor a given document (antigen) has been removed from the model (i.e. currentsystem’s memory), we activate search processes (in parallel threads) from eachof its direct neighbors in the previous iteration’s graph.
We have developed another, slightly complicated, but more accuratemethod. It exploits well-known Clustering Feature Tree (CF-Tree, [27]) togroup similar network cells in dense clusters. Antibody clusters are arrangedin the hierarchy and stored in a balanced search tree. Thus, finding moststimulated (similar) antibody for a document requires O(logtV ) comparisons,where t is the tree branching factor (refer to [27] for details). Amortized treestructure maintenance cost (insertion and removal) is also proportional toO(logtV ).
3.6 Adaptive visualization of the AIS network
Despite many advantages over SOM approach, AIS networks have one seri-ous drawback: high-dimensional networks cannot be easily visualized. In ourapproach the immune cells are projected onto a regular Kohonen grid. To ini-tialize such a grid properly, a given group of documents is divided into smallnumber of disjoint group (main topics) by using fast ETC Bayesian tree [15].The centers of the main topics are uniformly spread over the map surface,12 In such a procedure searching for the most stimulated antibody in t-th iteration
starts from the most stimulated antibody identified in (t−1)-th iteration and nextthe graph edges of the idiotypic network are traversed appropriately.
Scalability and Evaluation of Contextual Immune Model for Web Mining 13
and remaining cells of the grid are initialized with intermediate topics calcu-lated as the weighted average of main topics, with the weight proportional tothe Euclidean distance from the corresponding cells representing main topics.This way geographical neighborhood on he grid corresponds to the graphicalneighborhood in the immune network.
After initialization, the map is learned with the standard SOM algorithm[19]. Finally, we adopt attraction-repelling algorithm [23] to adjust the posi-tion of AIS antibodies on the SOM projection map, so that the distance onthe map reflects as close as possible the similarity of the adjacent cells. Thetopical initialization of the map is crucial here to assure the stability of thefinal visualization [16]. The resulting map visualizes AIS network with reso-lution depending on the SOM size (a single SOM cell can gather more thanone AIS antibody).
4 Histograms in Vector Spaces
As has been said in previous sections, the coordinate value referring to theterm ti in the vector dj representing the whole document is equal to thevalue of the pondering (term-weighting) function f(ti, dj). This function mayponder the term globally, like tfidf defined in Eq. (1)), or locally, like thecontextual function fG(ti, dj) = wtdG, defined in Eq. (4).
In the following subsection we will extend this representation by an in-formation about the distribution of pondering function values for individualdimensions in the vector space. Subsequently we will describe possible appli-cations of this information.
4.1 Distributions of the function pondering the terms
Properties of each term can be considered individually (for a single document),or in the broader context of a given (sub)set of documents D. In the lattercase we can consider the values of the pondering function for a given term tfor each document d ∈ D as observed values of a random variable with un-derlying continuous probability distribution. In practical cases the continuousdistribution will be approximated by a discrete one, so that the informationabout the random variable distribution for the term t can be summarized asa histogram Ht,D.
Let us consider the document d ∈ D and the pondering function f . Weshall represent this document by a normalized vector d =
[f ′0,d, . . . , f
′T,d
],
where f ′t,d = ‖d‖−1 · ft,d for t = 0, . . . , T . After normalization, all the docu-ments are located within the unit hypercube [0, 1]T .
For a fixed number Qt,D of intervals of the histogram Ht,D we define thediscretization ∆t,D : [0, 1] 7→ {0, . . . , Qt,D − 1}, i.e. the transformation of thenormalized pondering function into the index of interval.
14 SÃlawomir T. Wierzchon, Krzysztof Ciesielski, and MieczysÃlaw A. KÃlopotek
In the simplest case it can be a uniform split of the interval [0, 1] intosegments of equal length ∆t,D(f ′t,d) = b(Qt,D − 1) · f ′t,dc. An efficient dis-cretization, however, should take into account the fact, that the ponderingfunction for a fixed term takes values in only a subset of the unit interval(like in the case of splitting the set of documents into homogenous subsets, asdone in contextual approach). Optimal discretization should also approximatequantile-based split of the underlying pondering function distribution.
Having defined the discretization ∆t,D and a fixed interval q, let us definethe characteristic function:
χ(∆t,D
(f ′t,d
), q
)=
{1 if ∆t,D
(f ′t,d
)= q
0 otherwise(13)
Then we compute the value assigned to the interval q of the histogram Ht,D
for the term t in document collection D as:
Ht,D(q) =∑
d∈D
χ(∆t,D
(f ′t,d
), q
)(14)
So individual intervals of the histogram Ht,D represent the number of oc-currences of a discretized value of the pondering function f for the term t inthe document collection D. The interval values can be in turn transformedto relative frequencies via the plain normalization H ′
t,D(q) = Ht,D(q)/Tt,D,where Tt,D =
∑i∈Θ Ht,D(q) is the total number of documents d ∈ D con-
taining the term t. The frequency distribution approximates the probabilitydistribution of the unknown variable describing the weight of occurrence ofterm t in a randomly chosen document d ∈ D. A term not occurring in anydocument of the collection will be represented by an ”empty histogram”, hav-ing zero frequencies assigned to all intervals.
Note that the definition of the characteristic function (13) can be gener-alized to a more elaborated variant in which adding a document into to acontext will be associated with:
• the degree of similarity of the document to the context (cf. section 4.4)• document quality (as an aggregation of quality values for terms contained
in a document)• both above-mentioned factors
In this general case instead of unit counts, the respective counts related tointervals of individual histograms would be increased by a quantity propor-tional to document quality and the degree of membership to a given context.Such an approach allows also to take into account the fuzzy membership ofsome documents, prohibiting from assignment to a unique context.
4.2 Practical aspects of usage of histograms
The collection of histograms H(t,D) for t ∈ TD, obtained from the documentcollection D, via the previously described transformation, can be treated as
Scalability and Evaluation of Contextual Immune Model for Web Mining 15
an aggregated information on the (sub)space, in which the documents reside.Subsequently we show how this information can be exploited.
First we shall stress that the maintenance of the histograms is not a bigburden for the computer memory even for large document collections, due to:
• initial reduction of term space dimensionality [17]• additional reduction and clustering of terms in case of contextual process-
ing• compact carrier (set of non-zero valued histogram elements) for majority
of terms dla
This implies that histograms may be represented by by sparse matrices or(in a still more efficient way) by) by cyclic tables, indexing all intervals withnon-zero frequencies (carrier compactness assumption). For example a fullhistogram description (histograms with the dictionary) for 20000 documentsfrom the 20NewsGroups collection divided into 20 contextual groups requiresas little as 6 MB RAM (about 300 KB for a single context, the number ofterms spanning the vector space: 7030).
4.3 Significance of a term in a context
With the rapid growth of dictionary size T , the most important task is theidentification of the most significant terms, most strongly affecting clusteringand classification of documents as well as the description of the resultingclusters (keywords extraction). Also the impact of irrelevant terms needs tobe bounded, since their number grows much more rapidly than the numberof significant terms.
The first stage in differentiation of the term significance is the dictionaryreduction process. It is a kind of ”binary” differentiation: non-significant termsare simply removed from further stages of document processing. The dictio-nary reduction can be conducted in two phases: the global and contextual.
Beside dictionary reduction (removal of least important terms), introduc-tion of contextual pondering function (see Eq. (4) in section 2) leads alsoto diversification of the significance of the remaining terms. We are inter-ested also in similar diversification expressed as a function of features of termhistograms. The advantage of such a term description, as we will see in sub-sequent sections, is not only an effective application in tasks like documentclassification or identification of keywords for clusters of documents and con-texts, but also the possibility of dynamic adaptation understood here as thechange of the pondering function (hence also of the vector representation ofdocuments) parallel to the process of incremental clustering.
Intuitively, less significant terms are represented by histograms with thefollowing features:
• high value of curtosis (a histogram with high peaks), which is especiallyvisible for terms that are frequent and occur uniformly in the documentcollection, hence are less characteristic
16 SÃlawomir T. Wierzchon, Krzysztof Ciesielski, and MieczysÃlaw A. KÃlopotek
• the domain (the carrier) of the histogram is relatively ”compact”, havingfew intervals with non-zero coordinates meaning low variability of ponder-ing function values
• non-zero values occur only for intervals with low indices (corresponding tolow values of pondering function)
• appear in just a few documents or, in almost every document (e.g. functionwords)
Dually, the significant terms are those that are not too common (but alsonot to rare), have high variability of values of the pondering function, withmany non-zero intervals, and at the same time the pondering function valuesare high (non-zero values of intervals with high indices).
Therefore, we define the significance of a term t in a given context, deter-mined by the set of documents D, as follows:
wt,D =1
Qt,D
∑
q∈Θ
(q + 1) · log (Ht,D(q)) (15)
The weight wt,D takes its values in the interval[0,
∑q∈Θ log (Ht,D(q))
]being
a subset of [0, Tt,D].The above measure has an additional advantage that it can be computed
at the low computational cost and can be updated in O(|d|) (where |d| is thenumber of distinct terms in the document d) when a document appear in ordisappear from a given subspace or context. It is very important propertyin case of incremental clustering of dynamically changing text/web data (seealso section 4.5).
4.4 Determining the degree of membership of a document to acontext
A document fits well to a given contextual subspace if the distribution of somemeasurable features of term occurrence is typical for the ”majority” of docu-ments in this space. Generally, we can look here at features like correlationsor co-occurrences of some terms or location-based statistics (e.g. deviation ofdistances between repeated occurrences of a term in the document contentfrom the expected number of occurrences under the assumption of term in-difference from a given context; key terms occurrence patterns should differfrom those of functional words).
Qualitative features could potentially be taken into account, like style char-acteristics (dominant usage of a synonym or non-typical inflection) or evenfeatures not directly related to the textual content (e.g. link structure betweenhypertext documents). In this paper we restrict ourselves to the analysis offrequency of term occurrence and to a definition of ”typicality” based on his-tograms of pondering function for individual terms in a given context. Hence
Scalability and Evaluation of Contextual Immune Model for Web Mining 17
we can talk about an approach similar to statistical maximum likelihood esti-mation, in which, based on observed values, we construct a parametric func-tion approximating parameters of an unknown conditional probability distri-bution f ∝ P (D|Θ). The likelihood function should maximize the probabilityof observed data, and on the other hand it should highly valuate unseen datasimilar to ones in the training sample (the ”generalization” capability of themodel). We proceed the same way in our case. A document is considered as”typical” for which the values of the pondering function for the majority ofterms are frequent ones in the given context.
Additionally, to avoid domination of the aggregated term-based functionevaluating document ”typicality” by less important (but more numerous)terms, the aggregation should take into account the formerly defined termsignificance in a given context. Therefore, the similarity (degree of member-ship) of the document d to the context determined by the document collectionD is defined as follows:
mf (d′, D) =
∑t∈d′ wt,D ·H ′
t,D(q)∑t∈d′ wt,D
(16)
where wt,D is the significance of a term (eq.(15)), H ′t,D is the normalized his-
togram for the term t (see section 4.1), and q = ∆t,D (fDt, d′) is the sequentialindex of the interval, determined for a fixed normalized pondering functionfD and discretization ∆t,D (which transforms the value fDt, d′ into the indexq). The function mf (d′, D) takes its values in [0, 1].
It should be noted that the cost of computing the similarity functionmf (d′, D) is O(|d′|), and it is proportional to the number of distinct terms inthe document and equal to the complexity of the cosine measure calculation.
Having determined the similarity of a document to individual contextsin the contextual model, we obtain the vector of fuzzy memberships of adocument to the contexts, similarly to known methods of fuzzy clustering(e.g. Fuzzy-ISODATA). In the next section we explain, how such a vector isused to achieve incremental updates of the contextual clustering model.
4.5 Incremental adaptation of contexts
While the topic distribution within the stream of documents is dynamicallychanging in time (e.g. some Internet or intranet documents appear, disappearor have its content modified) also the contextual clustering models have to beadapted correspondingly. Such adaptation is performed both on the level ofindividual documents and the document clusters, represented by antibodies(or GNG cells, in case of GNG-based model). So a new document can beassigned to a context, and within it to an antibody. A modified documentmay be moved from one antibody to another, in the same, or in anothercontext. As a result, antibodies may not fit their original contextual immunemodel and it may be necessary to move them elsewhere, as a side effect of theso-called reclassification.
18 SÃlawomir T. Wierzchon, Krzysztof Ciesielski, and MieczysÃlaw A. KÃlopotek
When a single new document is appearing, its similarity to every existingcontext is calculated by equation (16) and the document is assigned to its”most similar” context13. Whenever document context is modified, it mayeventually be removed from its previous context and assigned to a new one.
Important aspect of context adaptation is that the measure of contextualterm importance (cf. Eq.(15)) can be efficiently updated as documents areadded or removed from a given context. Constant-time update of the impor-tance of each term t which appears in document d requires only to keep sep-arately numerator and denumerator from equation (15) and to update themadequately. Denominator is increased or decreased by one, while nominatorby i+1, where i is the index of the updated interval in the histogram Ht,D(q).Index i is computed by the discretization ∆t,D (ft,d′) (conf. section 4.1).
After any of the contextual models has converged to a stable state, the re-classification procedure is applied. Each document group is represented by ref-erence vector within an antibody, which can be treated as a pseudo-documentdvi
. The similarity of dvito every other (temporally fixed) context is cal-
culated (eq.(16)). If the ”most similar” context is different from the currentcontext then the antibody (with assigned documents) is relocated to corre-sponding contextual model. The relocated antibody is connected to the moststimulated antibody in the new immune model (and eventually merged withit in the subsequent phases).
There is no room to go into details, so we only mention that also the wholecontext can be eventually incorporated within some other context, on the ba-sis of our between-context similarity measure, based on Hellinger divergence.Finally, we obtain incremental text data meta-clustering model, based bothon adaptive properties of modified clustering model (within-context adapta-tion, [8]) and on dynamically modified contexts, which allows for clusteringscalability and adaptation also on inter-context level.
5 Experimental results
In the following sections, the overall experimental design as well as qualitymeasures are described. Since immune network can be treated both as a clus-tering and a meta-clustering (clusters of clusters) model, beside commonlyused clustering quality measures (unsupervised and supervised), we have alsoinvestigated immune network structure. The discussion of results is given inSect. 5.4 – 5.8.
5.1 Quality Measures of the Clustering
Various measures of quality have been developed in the literature, coveringdiverse aspects of the clustering process. The clustering process is frequently13 One could also consider assignment of a single document to more than one context,
i.e. fuzzy assignment.
Scalability and Evaluation of Contextual Immune Model for Web Mining 19
referred as ”learning without a teacher”, or ”unsupervised learning”, and isdriven by some kind of similarity measure.
The optimized criterion is intended to reflect some esthetic preferences,like: uniform split into groups (topological continuity) or appropriate split ofdocuments with known a priori categorization. As the criterion is somehowhidden, we need tests if the clustering process really fits the expectations.In particular, we have accommodated for our purposes and investigated thefollowing well known quality measures of clustering [28, 6]:
Average Document Quantization: average cosine distance (dissimilarity)for the learning set between a document and the cell it was classified into.The goal is to measure the quality of clustering at the level of a single cell:AvgDocQ = 1
|C|∑
c∈C
(1|Dc|
∑d∈Dc
dist(d, c)), where Dc is the set of docu-
ments assigned to the cell c.
This measure has values in the [0,1] interval, the lower values correspondrespectively to more ”smooth” inter-cluster transitions and more ”compact”clusters. The two subsequent measures evaluate the agreement between theclustering and the a priori categorization of documents (i.e. particular news-group in case of newsgroups messages).
Average Weighted Cluster Purity: average ”category purity” of a cell(cell weight is equal to its density, i.e. the number of assigned documents):AvgPurity = 1
|D|∑
c∈C maxk (|Dk,c|), where D is the set of all documents inthe corpus and Dk,c is the set of documents from category k assigned to thecell c. Similarly, Average Weighted Cluster Entropy measure can be calculated,where the Dk,c term is replaced with the entropy of the categories frequencydistribution.
Normalized Mutual Information: the quotient of the entropy with respectto the categories and clusters frequency to the square root of the product ofcategory and cluster entropies for individual clusters [6].
NMI =
∑C∈C
∑k∈K |Dk,c| log
(|Dk,c| |D||Dc| |Dc|
)√(∑
c∈C |Dc| log(|Dc||D|
))(∑k∈K |Dk| log
(|Dk||D|
)) (17)
where N is the set of graph cells, D is the set of all documents in the corpus,Dc is the set of documents assigned to the cell c, Dk is the set of all documentsfrom category k and Dk,c is the set of documents from category k assigned tothe cell c.
Again, both measures have values in the [0,1] interval. The higher the valueis, the better agreement between clusters and a priori given categories.
20 SÃlawomir T. Wierzchon, Krzysztof Ciesielski, and MieczysÃlaw A. KÃlopotek
5.2 Quality of the Immune Network
Beside the clustering structure represented by cells, idiotypic network shouldbe also treated as a meta-clustering model. Similarity between individual clus-ters is expressed by graph edges, linking referential vectors in antibodies. Thus,there is a need to evaluate quality of the structure of the edges.
There is a number of ways to evaluate idiotypic model structure. In thispaper we present the one which we have found to be the most clear for inter-pretation. This approach is based on the analysis of the edge lengths of theminimal spanning tree (MST) constructed over the set of antibodies, in eachiteration of the learning process.
5.3 Histogram-based reclassification measures
Each contextual model (as well as subgraph or map area) represents sometopically consistent (meta-)cluster of documents. Traditionally, such a clus-ter is represented by a single element (e.g. centroid, medoid, reference vectorin GNG/SOM, antibody in immune model). Alternative representation of agroup of documents have been presented in section 4. It has been shown in sec-tion 4.2 that both computational and space complexity of such representationis low. It has numerous advantages such as abandoning of the assumption ofspherical shape of clusters and efficient adaptation during incremental learn-ing on dynamically modified data sets. It also allows for the construction ofvarious measures for subspace clusters evaluation. Here we focus only on onesuch measure, evaluating reclassification properties of contextual groups.
Reclassification aims at measuring stability of the existing structure ofthe clustering model (both on the meta-level of contexts and on the level ofdocument groups in some subgraphs and map areas). Reclassification mea-sures also the consistency of the histogram-based subspace description withthe model-based clustering. For the fixed clustering structure (e.g. some splitof the document collection into contexts) we can describe each cluster by aset of histograms, like in section 4.1. Having such histograms built, we canclassify each document to its ”most similar” histogram-based space, like insection 4.4. Finally, we can investigate the level of agreement between original(model-based) and the new (histogram-based) grouping.
In the ideal case we expect both groupings to be equal. To assess how farfrom ideal agreement two groupings are, we construct contingency table. Sincethe group indexes in original and the new grouping are left unchanged, cor-rectly reclassified objects appear in the diagonal elements of the contingencymatrix. Finally, we can calculate measures traditionally used for evaluation ofclassifiers performance (precision, recall, F-statistics, etc.).
In general case, to take the meta-clustering information into account, wediscriminate between different kind of misclassifications. Since contexts andsubspaces are also similar on meta-level and this similarity is reflected by the
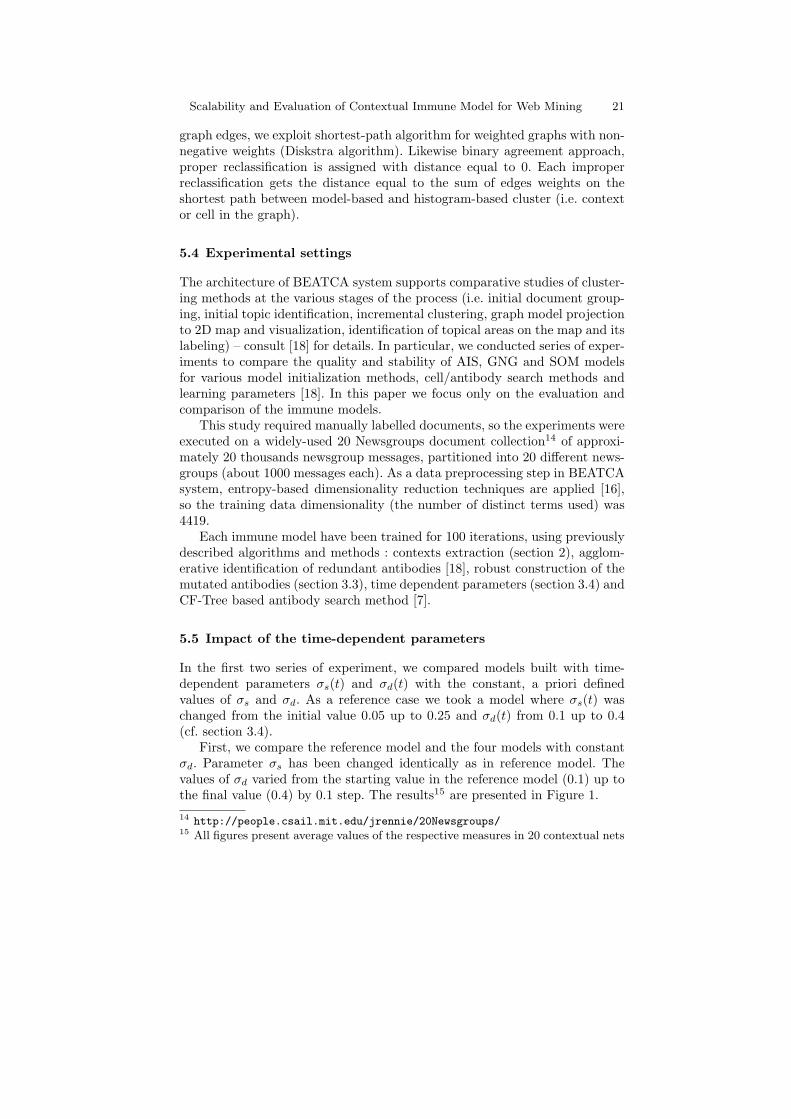
Scalability and Evaluation of Contextual Immune Model for Web Mining 21
graph edges, we exploit shortest-path algorithm for weighted graphs with non-negative weights (Diskstra algorithm). Likewise binary agreement approach,proper reclassification is assigned with distance equal to 0. Each improperreclassification gets the distance equal to the sum of edges weights on theshortest path between model-based and histogram-based cluster (i.e. contextor cell in the graph).
5.4 Experimental settings
The architecture of BEATCA system supports comparative studies of cluster-ing methods at the various stages of the process (i.e. initial document group-ing, initial topic identification, incremental clustering, graph model projectionto 2D map and visualization, identification of topical areas on the map and itslabeling) – consult [18] for details. In particular, we conducted series of exper-iments to compare the quality and stability of AIS, GNG and SOM modelsfor various model initialization methods, cell/antibody search methods andlearning parameters [18]. In this paper we focus only on the evaluation andcomparison of the immune models.
This study required manually labelled documents, so the experiments wereexecuted on a widely-used 20 Newsgroups document collection14 of approxi-mately 20 thousands newsgroup messages, partitioned into 20 different news-groups (about 1000 messages each). As a data preprocessing step in BEATCAsystem, entropy-based dimensionality reduction techniques are applied [16],so the training data dimensionality (the number of distinct terms used) was4419.
Each immune model have been trained for 100 iterations, using previouslydescribed algorithms and methods : contexts extraction (section 2), agglom-erative identification of redundant antibodies [18], robust construction of themutated antibodies (section 3.3), time dependent parameters (section 3.4) andCF-Tree based antibody search method [7].
5.5 Impact of the time-dependent parameters
In the first two series of experiment, we compared models built with time-dependent parameters σs(t) and σd(t) with the constant, a priori definedvalues of σs and σd. As a reference case we took a model where σs(t) waschanged from the initial value 0.05 up to 0.25 and σd(t) from 0.1 up to 0.4(cf. section 3.4).
First, we compare the reference model and the four models with constantσd. Parameter σs has been changed identically as in reference model. Thevalues of σd varied from the starting value in the reference model (0.1) up tothe final value (0.4) by 0.1 step. The results15 are presented in Figure 1.
14 http://people.csail.mit.edu/jrennie/20Newsgroups/15 All figures present average values of the respective measures in 20 contextual nets

22 SÃlawomir T. Wierzchon, Krzysztof Ciesielski, and MieczysÃlaw A. KÃlopotek
20 40 60 80 100
0.0
00.0
50
.10
0.1
50.2
0
Iterations
Valu
e
sigma (t)sigma=0.1sigma=0.2sigma=0.3sigma=0.4
20 40 60 80 100
05
0100
15
020
0
Iterations
Valu
e
sigma (t)sigma=0.1sigma=0.2sigma=0.3sigma=0.4
20 40 60 80 100
0.0
0.2
0.4
0.6
0.8
1.0
Iterations
Valu
e
sigma (t)sigma=0.1sigma=0.2sigma=0.3sigma=0.4
20 40 60 80 100
02
46
810
Iterations
Valu
e
sigma (t)sigma=0.1sigma=0.2sigma=0.3sigma=0.4
Fig. 1. Time-dependent σd: (a) edge length variance (b) network size (c) quantiza-tion error (d) learning time
Fig. 1(a) presents variance of the edge length in the minimal spanning treebuilt over the set of antibodies in the immune memory in ith iteration of thelearning process. At first glance one can notice instability of this measure forhigh values of σd. Comparing stable values, we notice that the variance for thereference network has the highest value. It means that the idiotypic networkcontains both short edges, connecting clusters of more similar antibodies andlonger edges, linking more distant antibodies, probably stimulated by differentsubsets of documents (antigens). Such meta-clustering structure is desirableand preferred over networks with equidistant antibodies (and, thus, low edgelength variance).
Comparing network sizes, Fig. 1(b), and quantization error, Fig. 1(c), weobserve that for the highest values of σd, the set of antibodies reduces to justa few entities; on the other hand - for the lowest values almost all antibodies(universal and over-specialized) are retained in the system’s memory. It is notsurprising that the quantization error for a huge network (e.g. σd = 0.1) ismuch lower than for smaller nets. Still, the time-dependent σd(t) gives simi-larly low quantization error for moderate network size. Also, both measuresstabilize quickly during learning process. Learning time, Figure 1(d), is – tosome extent – a function of network size. Thus, for the reference model, it isnot only low but very stable over all iterations.
In the next experiment – dually – we compare reference model and anotherfive models with constant σs (and varying σd). Analogically to the first case,the values of σs varied from the initial value 0.05 up to the final value in thereference model 0.25 by 0.05 step. The results are presented in Fig. 2. Due tothe space limitations, we restrict the discussion of the results to the conclusionthat also in this case time-dependent parameter σs(t) had a strong, positiveinfluence on the resulting immune model.
A weakness of the approach seems to be the difficulty in selecting appro-priate values of the parameters for a given dataset. We investigated indepen-dently changes to the values of both parameters, but it turns out that theyshould be changed ”consistently”; that is the antibodies should not be re-moved too quickly, nor aggregated too quickly. However, once found, there is

Scalability and Evaluation of Contextual Immune Model for Web Mining 23
20 40 60 80 100
0.0
00.0
20.0
40.0
60
.08
0.1
0
Iterations
Valu
e
sigma (t)sigma=0.05sigma=0.10sigma=0.15sigma=0.20sigma=0.25
20 40 60 80 100
050
100
150
200
250
30
0
Iterations
Valu
e
sigma (t)sigma=0.05sigma=0.10sigma=0.15sigma=0.20sigma=0.25
20 40 60 80 100
0.0
0.1
0.2
0.3
0.4
0.5
Iterations
Valu
e
sigma (t)sigma=0.05sigma=0.10sigma=0.15sigma=0.20sigma=0.25
20 40 60 80 100
02
46
810
12
Iterations
Valu
e
sigma (t)sigma=0.05sigma=0.10sigma=0.15sigma=0.20sigma=0.25
Fig. 2. Time-dependent σs: (a) edge length variance (b) network size (c) quantiza-tion error (d) learning time
a justified hope that for an incrementally growing collection of documents theparameters do not need to be sought anew, but rather gradually adopted.
5.6 Scalability and comparison with global models
Comparing hierarchical and contextual models described in section 2, witha ”flat”, global model the most noticeable difference is the learning time16.The total time for 20 contextual networks accounted for about 10 minutes,against over 50 minutes for hierarchical network and almost 20 hours (sic!) fora global network. Another disadvantage of the global model is high varianceof the learning time at single iteration as well as the size of the network.The learning time varied from 150 seconds to 1500 seconds (10 times more!)and the final network consisted of 1927 antibodies (two times more than forcontextual model). It should also be noted that in our experimental setting,each model (local and global) has been trained for 100 iterations, but it canbe seen (e.g. Figure 5) that the local model stabilizes much faster. Recallingthat each local network in the hierarchy can be processed independently andin parallel, it makes contextual approach robust and scalable17 alternative tothe global immune model.
One of the reasons for such differences of the learning time is the rep-resentation of antibodies in the immune model. The referential vector in anantibody is represented as a balanced red-black tree of term weights. If a singlecell tries to occupy ”too big” portion of a document-term vector space (i.e. itcovers documents belonging to different topics), many terms which rarely co-occur in a single document have to be represented by a single red-black tree.Thus, it becomes less sparse and - simply - bigger. On the other hand, betterseparation of terms which are likely to appear in various topics and increasing”crispness” of topical areas during model training leads to faster convergence16 By learning time we understand the time needed to create an immune memory
consisting of the set of antibodies representing the set of antigens (documents).17 Especially with respect to growing dimensionality of data, what - empirically -
seem to be the most difficult problem for immune-based approach

24 SÃlawomir T. Wierzchon, Krzysztof Ciesielski, and MieczysÃlaw A. KÃlopotek
and better models, in terms of previously defined quality measures. While thequantization error is similar for global and contextual model (0.149 versus0.145, respectively), then both supervised measures - showing correspondencebetween documents labels (categories) and clustering structure - are in favorto contextual model. The final value of the Normalized Mutual Informationwas 0.605 for the global model and 0.855 for the contextual model and AverageWeighted Cluster Purity: 0.71 versus 0.882 respectively.
One can also observe the positive impact of homogeneity of the distributionof term frequencies in documents grouped to a single antibody. Such homo-geneity is - to some extent - acquired by initial split of a document collectioninto contexts. Another cause of the learning time reduction is the contextualreduction of vector representation dimensionality, described in the section 2.
It can be seen that model stabilizes quite fast; actually, most models con-verged to final state in less than 20 iterations. The fast convergence is mainlydue to topical initialization. It should also be noted here that the proper top-ical initialization can be obtained for well-defined topics, which is the case incontextual model.
20 40 60 80 100
02
00
40
06
00
80
01
00
0
Iterations
Va
lue
u−su−.5suu+.5su+s
20 40 60 80 100
0.0
0.2
0.4
0.6
0.8
1.0
Iterations
Va
lue
idiotype netclique graph
20 40 60 80 100
0.0
0.1
0.2
0.3
0.4
0.5
Iterations
Va
lue
20 40 60 80 100
05
00
10
00
15
00
Iterations
Va
lue
Fig. 3. Global model: (a) edge length distribution (b) clique average edge length(c) quantization error (d) learning time
We have also executed experiments comparing presented immune approachwith SOM models: flat (i.e. standard, global Kohonen’s map) and our ownvariant of contextual approach - the hierarchy of contextual maps (C-SOM).To compare immune network structure, with the static grid of SOM model,we have built minimal spanning tree on the SOM grid. Summary of the resultscan be seen in Figure 4. Again, global model turned out to be of lower qualitythan both contextual SOM and contextual AIS model. Similarly to the globalimmune model, also in this case the learning time (over 2 hours) was signifi-cantly higher than for the contextual models. Surprisingly, the average edgein contextual SOM model was much longer than in case of contextual immunenetwork and standard SOM, what may be the result of the limitations of therigid model topology (2D grid). The discussion of the edge length distribution(Figure 4(b)) we defer to the section 5.8.
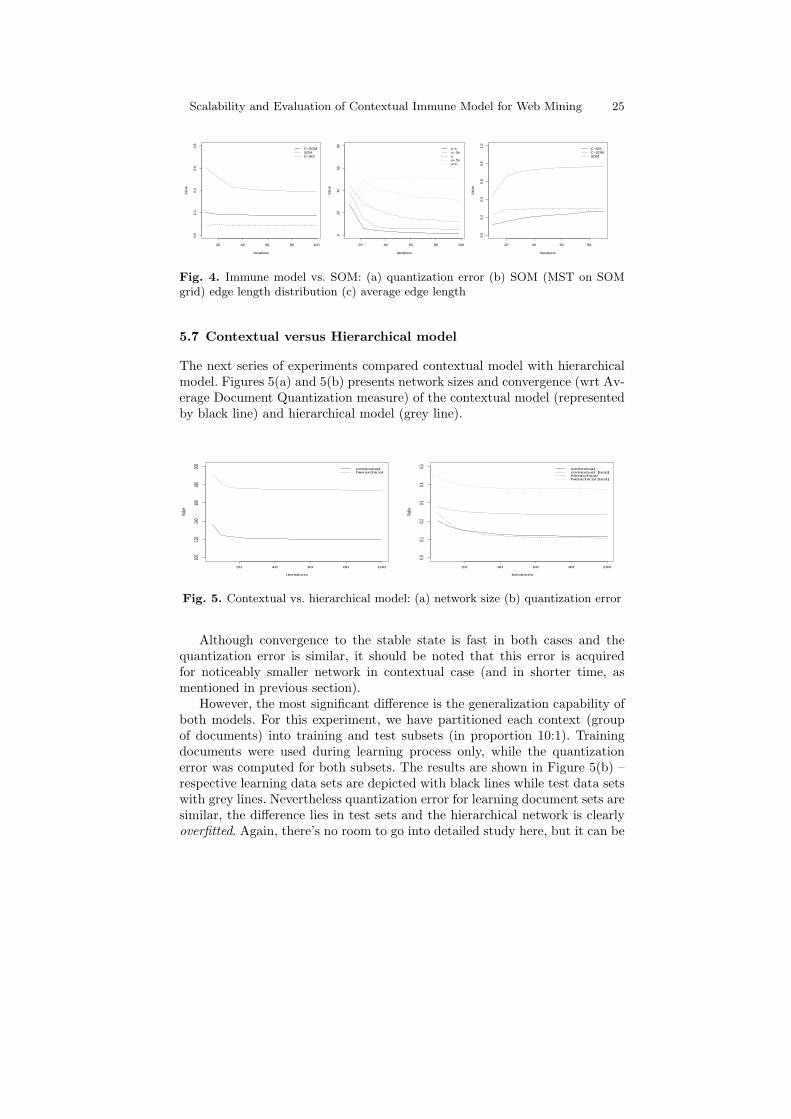
Scalability and Evaluation of Contextual Immune Model for Web Mining 25
20 40 60 80 100
0.0
0.2
0.4
0.6
0.8
Iterations
Val
ue
C−SOMSOMC−AIS
20 40 60 80 100
020
4060
80
Iterations
Val
ue
u−su−.5suu+.5su+s
20 40 60 80
0.0
0.2
0.4
0.6
0.8
1.0
Iterations
Val
ue
C−AISC−SOMSOM
Fig. 4. Immune model vs. SOM: (a) quantization error (b) SOM (MST on SOMgrid) edge length distribution (c) average edge length
5.7 Contextual versus Hierarchical model
The next series of experiments compared contextual model with hierarchicalmodel. Figures 5(a) and 5(b) presents network sizes and convergence (wrt Av-erage Document Quantization measure) of the contextual model (representedby black line) and hierarchical model (grey line).
20 40 60 80 100
100
120
140
160
180
200
Iterations
Value
contextualhierarchical
20 40 60 80 100
0.00.1
0.20.3
0.40.5
Iterations
Value
contextualcontextual [test]hierarchicalhierachical [test]
Fig. 5. Contextual vs. hierarchical model: (a) network size (b) quantization error
Although convergence to the stable state is fast in both cases and thequantization error is similar, it should be noted that this error is acquiredfor noticeably smaller network in contextual case (and in shorter time, asmentioned in previous section).
However, the most significant difference is the generalization capability ofboth models. For this experiment, we have partitioned each context (groupof documents) into training and test subsets (in proportion 10:1). Trainingdocuments were used during learning process only, while the quantizationerror was computed for both subsets. The results are shown in Figure 5(b) –respective learning data sets are depicted with black lines while test data setswith grey lines. Nevertheless quantization error for learning document sets aresimilar, the difference lies in test sets and the hierarchical network is clearlyoverfitted. Again, there’s no room to go into detailed study here, but it can be
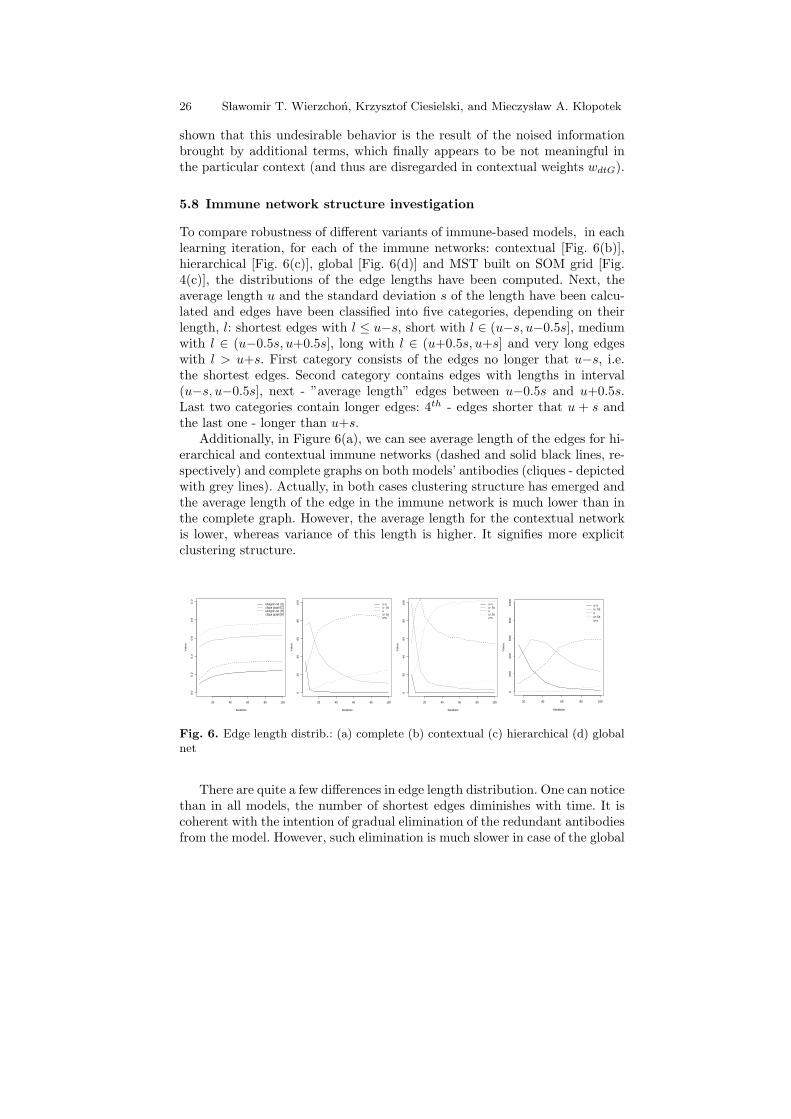
26 SÃlawomir T. Wierzchon, Krzysztof Ciesielski, and MieczysÃlaw A. KÃlopotek
shown that this undesirable behavior is the result of the noised informationbrought by additional terms, which finally appears to be not meaningful inthe particular context (and thus are disregarded in contextual weights wdtG).
5.8 Immune network structure investigation
To compare robustness of different variants of immune-based models, in eachlearning iteration, for each of the immune networks: contextual [Fig. 6(b)],hierarchical [Fig. 6(c)], global [Fig. 6(d)] and MST built on SOM grid [Fig.4(c)], the distributions of the edge lengths have been computed. Next, theaverage length u and the standard deviation s of the length have been calcu-lated and edges have been classified into five categories, depending on theirlength, l: shortest edges with l ≤ u−s, short with l ∈ (u−s, u−0.5s], mediumwith l ∈ (u−0.5s, u+0.5s], long with l ∈ (u+0.5s, u+s] and very long edgeswith l > u+s. First category consists of the edges no longer that u−s, i.e.the shortest edges. Second category contains edges with lengths in interval(u−s, u−0.5s], next - ”average length” edges between u−0.5s and u+0.5s.Last two categories contain longer edges: 4th - edges shorter that u + s andthe last one - longer than u+s.
Additionally, in Figure 6(a), we can see average length of the edges for hi-erarchical and contextual immune networks (dashed and solid black lines, re-spectively) and complete graphs on both models’ antibodies (cliques - depictedwith grey lines). Actually, in both cases clustering structure has emerged andthe average length of the edge in the immune network is much lower than inthe complete graph. However, the average length for the contextual networkis lower, whereas variance of this length is higher. It signifies more explicitclustering structure.
20 40 60 80 100
0.0
0.2
0.4
0.6
0.8
1.0
Iterations
Va
lue
idiotypic net [C]clique graph [C]idiotypic net [H]clique graph [H]
20 40 60 80 100
02
04
06
08
01
00
Iterations
Va
lue
u−su−.5suu+.5su+s
20 40 60 80 100
02
04
06
08
01
00
Iterations
Va
lue
u−su−.5suu+.5su+s
20 40 60 80 100
02
00
40
06
00
80
01
00
0
Iterations
Va
lue
u−su−.5suu+.5su+s
Fig. 6. Edge length distrib.: (a) complete (b) contextual (c) hierarchical (d) globalnet
There are quite a few differences in edge length distribution. One can noticethan in all models, the number of shortest edges diminishes with time. It iscoherent with the intention of gradual elimination of the redundant antibodiesfrom the model. However, such elimination is much slower in case of the global
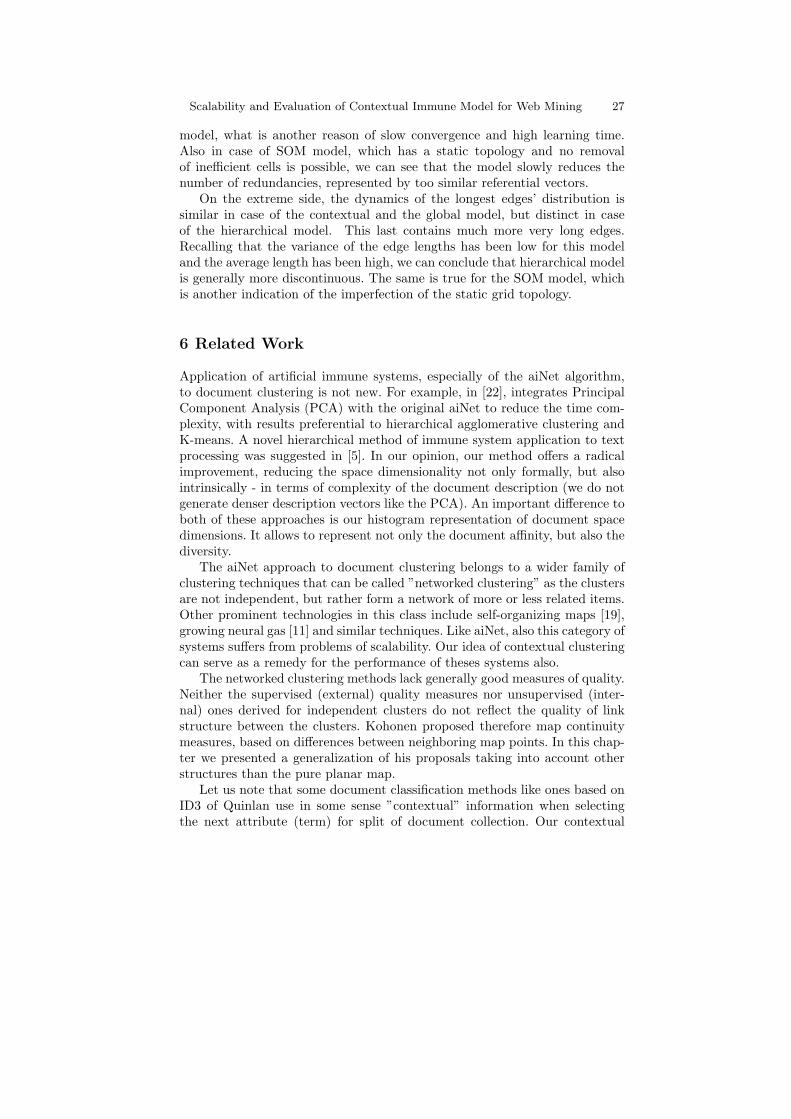
Scalability and Evaluation of Contextual Immune Model for Web Mining 27
model, what is another reason of slow convergence and high learning time.Also in case of SOM model, which has a static topology and no removalof inefficient cells is possible, we can see that the model slowly reduces thenumber of redundancies, represented by too similar referential vectors.
On the extreme side, the dynamics of the longest edges’ distribution issimilar in case of the contextual and the global model, but distinct in caseof the hierarchical model. This last contains much more very long edges.Recalling that the variance of the edge lengths has been low for this modeland the average length has been high, we can conclude that hierarchical modelis generally more discontinuous. The same is true for the SOM model, whichis another indication of the imperfection of the static grid topology.
6 Related Work
Application of artificial immune systems, especially of the aiNet algorithm,to document clustering is not new. For example, in [22], integrates PrincipalComponent Analysis (PCA) with the original aiNet to reduce the time com-plexity, with results preferential to hierarchical agglomerative clustering andK-means. A novel hierarchical method of immune system application to textprocessing was suggested in [5]. In our opinion, our method offers a radicalimprovement, reducing the space dimensionality not only formally, but alsointrinsically - in terms of complexity of the document description (we do notgenerate denser description vectors like the PCA). An important difference toboth of these approaches is our histogram representation of document spacedimensions. It allows to represent not only the document affinity, but also thediversity.
The aiNet approach to document clustering belongs to a wider family ofclustering techniques that can be called ”networked clustering” as the clustersare not independent, but rather form a network of more or less related items.Other prominent technologies in this class include self-organizing maps [19],growing neural gas [11] and similar techniques. Like aiNet, also this category ofsystems suffers from problems of scalability. Our idea of contextual clusteringcan serve as a remedy for the performance of theses systems also.
The networked clustering methods lack generally good measures of quality.Neither the supervised (external) quality measures nor unsupervised (inter-nal) ones derived for independent clusters do not reflect the quality of linkstructure between the clusters. Kohonen proposed therefore map continuitymeasures, based on differences between neighboring map points. In this chap-ter we presented a generalization of his proposals taking into account otherstructures than the pure planar map.
Let us note that some document classification methods like ones based onID3 of Quinlan use in some sense ”contextual” information when selectingthe next attribute (term) for split of document collection. Our contextual
28 SÃlawomir T. Wierzchon, Krzysztof Ciesielski, and MieczysÃlaw A. KÃlopotek
method exploits the split much more thoroughly, extracting more valuablelocal information about the term collection.
Many document clustering techniques suffer from the tendency of formingspherical clusters. The histogram-based characterization of clusters allows fordeparting from this shortcoming not only in case of artificial immune systems.
7 Concluding remarks
The contextual model described in this paper admits a number of interestingand valuable features in comparison with global and hierarchical models usedtraditionally to represent a given collection of documents. Further, when ap-plying immune algorithm to clustering the collection of documents, a numberof improvements was proposed. These improvements obey:
• Identification of redundant antibodies by means of the fast agglomerativeclustering algorithm [18].
• Fast generation of mutated clones without computation of their stimula-tion by currently presented antigen. These mutants can be characterizedby presumed ability of generalization (cf. section 3.3).
• Time-dependent parameters σd and σs. In general we have no a recipeallowing to tune both the parameters to a given dataset. In original ap-proach [10] a trial-and-error method was suggested. We observed that inhighly dimensional space the value of σd is almost as critical as the valueof σs. Hence we propose a ”consistent” tuning of these parameters – cf.section 3.4. The general recipe is: carefully (i.e. not to fast) remove weaklystimulated and too specific antibodies and carefully splice redundant (toosimilar) antibodies.
• Application of the CF-trees [27] for fast identification of winners (moststimulated memory cells) [7].
With these improvements we proposed a new approach to mining highdimensional datasets. The contextual approach described in section 2 appearsto be fast, of good quality (in term of indices introduced in sections 5.1 and5.2) and scalable (with the data size and dimension).
Clustering high dimensional data is both of practical importance and atthe same time a big challenge, in particular for large collections of text docu-ments. The paper presents a novel approach, based on artificial immune sys-tems, within the broad stream of map type clustering methods. Such approachleads to many interesting research issues, such as context-dependent dictio-nary reduction and keywords identification, topic-sensitive document summa-rization, subjective model visualization based on particular user’s informationrequirements, dynamic adaptation of the document representation and localsimilarity measure computation. We plan to tackle these problems in our fu-ture work. It has to be stressed that not only textual, but also any other highdimensional data may be clustered using the presented method.
Scalability and Evaluation of Contextual Immune Model for Web Mining 29
Acknowledgements
This research was partially supported by the European Commission and bythe Swiss Federal Office for Education and Science with the 6th FrameworkProgramme project REWERSE no. 506779 ”Reasoning on the Web with Rulesand Semantics” (cf. http://rewerse.net). Krzysztof Ciesielski was partiallysupported by MNiSW grant no. N516 005 31/0646.
References
1. A. Baraldi and P. Blonda. A survey of fuzzy clustering algorithms for patternrecognition. IEEE Trans. on Systems, Man and Cybernetics, 29B:786–801, 1999.
2. A. Becks. Visual knowledge management with adaptable document maps. GMDresearch series, 15, 2001.
3. M.W. Berry, Z. Drmac, and E.R. Jessup. Matrices, vector spaces and informa-tion retrieval. SIAM Review, 41(2):335–362, 1999.
4. J.C. Bezdek and S.K. Pal. Fuzzy Models for Pattern Recognition: Methods thatSearch for Structures in Data. IEEE, New York, 1992.
5. G. B. P. Bezerra, T. V. Barra, M. F. Hamilton, and F. J. von Zuben. Ahierarchical immune-inspired approach for text clustering. In Proc. Informa-tion Processing and Management of Uncertainty in Knowledge-Based Systems(IPMU’2006), volume 1, pages 2530–2537, 2006.
6. C. Boulis and M. Ostendorf. Combining multiple clustering systems. In Proc.of 8th European Conference on Principles and Practice of Knowledge Discoveryin Databases (PKDD-2004), pages 63–74. Springer-Verlag, LNAI 3202, 2004.
7. K. Ciesielski, M. Draminski, M. KÃlopotek, D.Czerski, and S.T. Wierzchon.Adaptive document maps. In Proceedings of the Intelligent Advances in SoftComputing 5, pages 109–120. Springer-Verlag, 2006.
8. K. Ciesielski and M. KÃlopotek. Text data clustering by contextual graphs. InL. Todorovski, N. Lavrac, and K.P. Jantke, editors, Discovery Science, pages65–76. Springer-Verlag, LNAI 4265, 2006.
9. L.N. de Castro and J. Timmis. Artificial Immune Systems: A New Computa-tional Intelligence Approach. Springer, 2002.
10. L.N. de Castro and F.J. von Zuben. An evolutionary immune network for dataclustering. In SBRN’2000, pages 84–89. IEEE Computer Society Press, 2000.
11. B. Fritzke. Some competitive learning methods, 1997. http://www.
neuroinformatik.ruhr-uni-bochum.de/ini/VDM/research/gsn/JavaPaper.12. M. Gilchrist. Taxonomies for business: Description of a research project. In 11
Nordic Conference on Information and Documentation, Reykjavik, Iceland, May30 - June 1 2001. http://www.bokis.is/iod2001/papers/Gilchrist_paper.
doc.13. C. Hung and S. Wermter. A constructive and hierarchical self-organising model
in a non-stationary environment. In Int. Joint Conference in Neural Networks,pages 2948–2953, 2005.
14. S.Y. Jung and K. Taek-Soo. An incremental similarity computation methodin agglomerative hierarchical clustering. Journal of Fuzzy Logic and IntelligentSystem, December 2001.
30 SÃlawomir T. Wierzchon, Krzysztof Ciesielski, and MieczysÃlaw A. KÃlopotek
15. M. KÃlopotek. A new bayesian tree learning method with reduced time and spacecomplexity. Fundamenta Informaticae, 49(4):349–367, 2002.
16. M. KÃlopotek, M. Draminski, K. Ciesielski, M. Kujawiak, and S.T. Wierzchon.Mining document maps. In M. Gori, M. Ceci, and M. Nanni, editors, Proc. ofStatistical Approaches to Web Mining Workshop (SAWM) at PKDD’04, pages87–98, Pisa, Italy, 2004.
17. M. KÃlopotek, S. Wierzchon, K. Ciesielski, M. Draminski, and D. Czerski. E-Service Intelligence – Methodologies, Technologies and Applications. Part II:Methodologies, Technologies and Systems, volume 37 of Studies in Computa-tional Intelligence, chapter Techniques and technologies behind maps of Internetand Intranet document collections. Springer, 2007.
18. M. KÃlopotek, S. Wierzchon, K. Ciesielski, M. Draminski, and D. Czerski. Con-ceptual Maps of Document Collections in Internet and Intranet. Coping with theTechnological Challenge. IPI PAN Publishing House, Warszawa 2007.
19. T. Kohonen. Self-Organizing Maps, volume 30 of Springer Series in InformationSciences. Springer, Berlin, Heidelberg, New York, 2001.
20. K. Lagus, S. Kaski, and T. Kohonen. Mining massive document collections bythe WEBSOM method. Information Sciences, 163/1-3:135–156, 2004.
21. G. Salton. The SMART Retrieval System – Experiments in Automatic DocumentProcessing. Prentice-Hall, Upper Saddle River, NJ, USA, 1971.
22. N. Tang and V. R. Vemuri. An artificial immune system approach to documentclustering. In Proceedings of the 2005 ACM symposium on Applied ComputingSanta Fe, New Mexico, pages 918–922, 2005.
23. J. Timmis. aiVIS: Artificial immune network visualization. In Proceedings ofEuroGraphics UK 2001 Conference, pages 61–69. Univeristy College, London,2001.
24. C.J. van Rijsbergen. Information Retrieval. Butterworths, London, 1979. http://www.dcs.gla.ac.uk/Keith/Preface.html.
25. S.T. Wierzchon. Artificial immune systems. Theory and applications (in Polish).Akademicka Oficyna Wydawnicza EXIT Publishing, Warszawa, 2001.
26. D.R. Wilson and T.R. Martinez. Reduction techniques for instance-based learn-ing algorithms. Machine Learning, 38:257–286, 2000.
27. T. Zhang, R. Ramakrishan, and M. Livny. Birch: Efficient data clusteringmethod for large databases. In Proc. ACM SIGMOD Int. Conf. on Data Man-agement, pages 103–114, 1997.
28. Y. Zhao and G. Karypis. Criterion functions for document clustering: Experi-ments and analysis. http://www-users.cs.umn.edu/~karypis/publications/ir.html.
Index
aiNet, 9idiotypic network visualization, 12redundant antibodies, 10robust antibody construction, 10stimulated antibody search, 12time-dependent parameters, 11
artificial immune system, see aiNet
contextual networks, 4
histograms, 13context adaptation, 17contextual document membership, 16contextual term significance, 15
incremental adaptation, 17
pondering function distribution, seehistograms

Term Distribution-based Initializationof Fuzzy Text Clustering
Krzysztof Ciesielski1, MieczysÃlaw A. KÃlopotek1,3, SÃlawomir T. Wierzchon1,2
1 Institute of Computer Science, Polish Academy of Sciences,ul. Ordona 21, 01-237 Warszawa, Poland
2 Institute of Informatics, Univ. of Gdansk, Wita Stwosza 57, 80-952 Gdansk.3 Institute of Informatics, Univ. of Podlasie in Siedlce.
kciesiel,klopotek,[email protected]
Abstract. We investigate the impact of an initialization strategy on thequality of fuzzy-based clustering, applied to creation of maps of text doc-ument collection. In particular, we study the effectiveness of bootstrap-ping as compared to traditional ”randomized” initialization. We showthat the idea is effective both for traditional Fuzzy K-Means algorithmand for a new one, applying histogram-based cluster description.
1 Introduction
In this research clustering is proposed as a tool allowing to reveal the internalstructure of a collection, e.g., we are interested in grouping documents by topics,subtopics, etc. When using clustering we subsume so-called cluster hypothesis,according to which the documents in the same cluster behave similarly withrespect to relevance to information needs.
A common approach to document representation and processing relies upontreating each textual document as a set of terms, i.e. words or phrases extractedautomatically from the documents themselves. Then to each term in a givendocument we assign a numeric weight , representing an estimate of this termusefulness when distinguishing the document from other documents in the samecollection. The weights assigned to the terms in a given document d can then beinterpreted as the coordinates of d in the document space, i.e. d = (w1, . . . , w|T |)is a point in |T |-dimensional document space D; here |T | is the cardinality ofthe set of terms T . Among many existing weighting schemes the most popularis so-called tfidf scheme, see Sect. 3 for details. Here tf, i.e. term frequency, is adocument-specific statistic, while the inverse document frequency idf is a globalstatistics characterizing a given term within an entire collection of documents.To get a deeper insight into the nature of different sub-collections of documents,we propose a context dependent weighting scheme; besides the two statistics so-called term specificity is additionally introduced. This allows to characterize thedocuments by a varying sets of weights (w1, . . . , w|C(T )|) in different contexts4;
4 By a context one shall intuitively understand a sufficiently large (for statistics sake)set of documents with sufficiently uniform topics.

here |C(T )| stands for the cardinality of the set of terms specific for a context C.In this paper we will examine the usefulness of this new ”contextual” weightingscheme against the ”global” scheme expressed by the tfidf weights.
With the vector representation we can adopt any clustering algorithm toreveal the internal structure of the documents collection. A popular approachto clustering relies upon minimizing an objective function expressing (weighted)distance between objects from a given cluster (group) and a characteristic pointof this group (e.g. its center of gravity). Although simple and efficient, thesealgorithms heavily depend on the initial partition subjected further modification.In this paper we present a new, boosting-like, initialization scheme.
The paper is organized as follows: in section 2, fuzzy clustering approach andits drawbacks are briefly outlined. In section 3 the concept of clustering space ispresented. Following that concept, FKH clustering algorithm is proposed. Thekey contribution of this paper is boosting-like initialization algorithm, describedin section 4. Section 5 gives experimental results on FKH algorithm and proposedinitialization method. Section 6 summarizes the paper.
2 Fuzzy clustering algorithm
Let D = {d1, . . . , dn} be a set of objects (documents in our case). Each objectis described by a set of real-valued features, di = (wi,1, . . . , wi,|T |), i.e. it can beviewed as a point in |T |-dimensional Euclidean space, <|T |. The aim of clusteranalysis is to partition the set D into a (usually predefined) number K > 1 ofhomogenous groups. The notion of homogeneity is understood in such a way thattwo objects assigned to the same class are much more similar one to another thanany two objects assigned to different classes. Usually the similarity between pairsof objects is measured in terms of a distance metrics. Such an approach causestroubles in highly dimensional feature spaces, however, because, as shown in [1],with increasing dimensionality, the ”contrast”, i.e. relative difference between theclosest and the farthest neighbor, is decreasing. In case of documents groupingthe cosine measure is commonly used; it can be converted to a distance by themapping dist(di, dj) = 1− cos(di, dj).
In such a context, when similarity between pairs of objects is measured interms of their mutual distance, a natural method for inducing partition of theset D is to use the objective function [2]
Jα =∑
d∈D
K∑
j=1
dist2(d, vj)uαd,C(vj)
(1)
where ud,C(vj) is a degree of membership of object d to j-th class, vj is a char-acteristic of group C, usually defined as a (weighted) center of gravity calledcentroid, and α ≥ 1 is a parameter. Assuming that ud,C(vj) ∈ {0, 1}, α = 1and that we are searching for the minimum of Jα, we obtain well known crispK-means algorithm. When ud,C(vj) ∈ [0, 1] and α > 1, minimization of the indexJα leads to the fuzzy K-means algorithm, called hereafter FKM for brevity [2].
Both these algorithms iteratively improve the initial partition matrix U =[ud,C(vj)] by modifying the centroids after the objects have been reassigned tothe groups5 computed and new cluster centers are determined. The quality ofresulting partition is measured e.g. in terms of the index [2]
FK (U) =1n· trace
(U · UT
)(2)
measuring the degree of fuzziness of the partition represented by the matrix U .This measure decreases when documents belong to more than one class and takesthe lowest value for documents belonging to the same degree to all the classes.
An attractive feature of these algorithms is their numerical simplicity andlinear time complexity with respect to the number of objects, what allows toprocess large collections of objects. They admit a number of drawbacks, however,like: (a) final partition heavily depends on the data order and on the initial datapartition, (b) the algorithms are sensitive to the outliers, (c) the number ofclusters must be known in advance, and finally, (d) these algorithm can be usedonly in case of numerical data representation.
To cope with the first drawback a number of approaches was proposed, like[6], [8], or [7]. In this paper a new method (inspired by the boosting algorithmused in machine learning) is proposed. It is especially useful when processinglarge datasets since it clusters only a sample of objects and re-clustering is per-formed when there are objects which do not fit to the existing partition. Beforeintroducing this method, some remarks on contextual clustering are needed.
3 Clustering Space
Recall first, that when processing text documents the entries of the vectors di
are so-called tfidf indices defined as, see e.g. [9]:
wt,d = ft,d × logn
f(D)t
(3)
where n is the number of documents in the collection D, ft,d is the numberof occurrences of the term t in the document d, and f
(D)t is the number of
documents in the collection D containing at least one occurrence of the term t.The scheme (3) assumes that all the terms are weighted from the same
(global) perspective. But it is obvious that the weight of a term can vary ac-cording to the context in which it is used. Hence we left the notion of clustercenter, and we assume ”relativistic” point of view treating the collection D asa continuous space, called hereafter clustering space, where each point p can beviewed as a cluster center. In such a space we define a proximity relationshipamong the documents, and µd,C(p) quantifies a normalized degree of member-ship of document d to the cluster C(p) with center p, where normalization is5 More precisely, for a given partitioning group centers vj , j = 1, . . . , K are calculated
and the objects are assigned to the groups with most similar centroids. Then thecycle repeats: centers vj are updated and the objects are reassigned to the groups.
over all C(p) [5]. Thus, µd,C(p) plays role analogous to ud,C(p) in fuzzy clusteringapproach. Denoting |C(p)| = ∑
d∈D µd,C(p) the fuzzy cardinality of this cluster,and combining it with ft,d and µd,C(p), we introduce a notion of specificity st,C(p)
of the term t in the cluster C(p) as st,C(p) = f−1t,D ·∑d∈D ft,d · µd,C(p) , where
ft,D is the total frequency of term t in the collection D. With these notions weintroduce new contextual term weighting formula
wt,d,C(p) = st,C(p) × ft,d × log|C(p)|ft,C(p)
(4)
where ft,C(p) =∑{d:ft,d>0} µd,C(p) is the fuzzy count of documents in the col-
lection C(p) containing at least one occurrence of the term t; we assume thatwt,d,C(p) = 0 if ft,C(p) = 0.
Now, the context-free weight tfidf given by the equation (3) is replaced byan averaged local weight
wt,d = l ·∑
p∈HS
(µd,C(p) · wt,d,C(p)
)(5)
where HS is the unit hyper-sphere and l is a normalizing constant placing thedocument d on the unit hyper-sphere.
3.1 Histograms of term weights
Furthermore, we can consider properties of each term individually (for a singledocument), or in a broader context of a given subset of documents, e.g. clus-ter C(p) as a whole. In the latter case, the values of the weight w for a giventerm t for each document d ∈ C(p) 6 are treated as observed values of a ran-dom variable with underlying continuous probability distribution. In practicalcases, the continuous distribution will be approximated by a discrete one, sothat the information about the random variable distribution for the term t canbe summarized as a histogram ht,C
7.Single interval of a histogram ht,C represents the number of occurrences
of a discretized value of the term weighting function w for the term t in thedocument collection C. The interval values can be in turn transformed to therelative frequencies via the plain normalization h′t,C(q) = f−1
t,C · ht,C(q), whereft,C =
∑Qi=1 ht,C(q) is the total number of documents d ∈ C containing term t.
The normalized frequency distribution approximates the probability distributionof an unknown variable describing the weight of occurrence of the term t inrandomly chosen document d ∈ C.
3.2 Histogram-based clustering algorithm
Finally, we can define histogram-based document membership in a given context.A document d fits well to a given context (represented by a fuzzy cluster C) if its6 where fuzzy cluster C(p) is defined as C(p) = {d ∈ D : µd,C(p) > 0}7 a deeper discussion of the histograms of term weights is given in [5]

observed term weights wt,d are typical for the ”majority” of documents in spaceC, i.e. the histogram-based probability of the weights observed in d is high. Weexpect such a document to follow some topic-specific term distribution. Thus,instead of fuzzy degree of membership u, defined in section 2 on the basis ofdistance from the single fuzzy center of gravity, we can define histogram-based(unnormalized) degree of membership md,C(p):
md,C(p) =∑
t∈d mt,C(p) · ht,C(p)(q)∑t∈d mt,C(p)
(6)
where mt,C(p) is some measure of term significance in context C(p)8, ht,C(p) is ahistogram for term t and histogram index q is computed by discretization ∆ ofterm weight wt,d,C(p) (i.e. q = ∆
(wt,d,C(p)
)). After normalization over all C(p),
unnormalized degrees md,C(p) become µd,C(p).Such a distribution-based degree of membership, computed for every context
C(p), after normalization gives us a vector of fuzzy-like probabilities µd,C(p),analogously to ud,C(p) from section 2. In section 4, we will use a matrix U of thenormalized distribution-based contextual membership µd,C(p) to produce set ofclusters covering diverse topical aspects of the whole document collection D.
Enriched fuzzy clusters description, based on sets of term histograms, areemployed in an incremental clustering algorithm, see Algorithm 1, called FuzzyK-Histograms, or FKH for brevity that we propose in this paper. It joins twoknown paradigms of clustering: the fuzzy clustering and the subspace clustering.The method differs essentially from fuzzy clustering in that it is designed solelyfor text data and is based on contextual vector representation and histogram-based description of vector subspaces.
Algorithm 1 Fuzzy K-Histograms, FKH1. Fix the number of clusters, K ≥ 2 and initialize the fuzzy partition matrix U(τ0),
µd,C(τ0) ∈ [0, 1]2. Repeat steps 3-5 until the partition matrix stabilizes, i.e. ||U(τ)− U(τ − 1)|| =
maxd,C |µd,C(τ)− µd,C(τ − 1)| ≤ ε)3. For each term t in the document d, having fixed matrix U(τ), compute a new
vector representation wt,d,C in current context C = C(τ).4. For each context C(τ) construct a new histogram description {ht,C : t = 1, . . . , T}5. Calculate new degrees of membership md,C and normalize them to µd,C in order
to get new partition matrix U(τ + 1)
Like FKM, the FKH algorithm starts with an initial split into subgroups,represented by a matrix U(τ0), rows of which represent documents, and columnsrepresent topical groups. Iteratively, we adapt (a) the document representation,(b) the histogram description of contextual groups, and (c) membership degree ofdocuments and term significance in the individual groups. These modifications8 In the simplest case, term significance could be equal to one for every term t. How-
ever, since majority of terms in a given context is expected to be irrelevant, in [5] wepropose another measure, proportional to the weighted field under histogram plot.

recursively lead to a precise description of a contextual subspace in terms ofthe membership degree of documents and significance of terms in a particularcontext; further an insight into the documents similarity is offered. So we canview the algorithm as a kind of reinforcement learning.
Both FKM and FKH algorithms are very sensitive to the choice of the initialfuzzy clusters memberships µd,C . We can start without any knowledge of docu-ment similarity, via a random assignment of documents to a number of groupsand global term weighing. But through the iterative process some terms specificfor a group would be strengthened, so that class membership of documents wouldbe modified, hence also their vector representation and, indirectly, similarity def-inition. As experimental results show, FKH initialized with the sampling-basedmethod presented in the next section behaves much more stable (i.e. clustersare retained over different cross-validated document subsets) and it outperformsFKM algorithm in terms of supervised cluster quality (cf. section 5).
4 Sampling-based initialization algorithm
Let us return to the main idea of boosting-like initialization algorithm. It startsfrom a random sample of documents drawn from the set D in case of global clus-tering, or from a contextual group C in case of contextual clustering. The samplesize is M = min(1000, 0.1n) and the documents are drawn from the uniform dis-tribution. The sample is clustered into K groups, where K is a parameter.
Surely, the sample drawn in such a way may appear to be too arbitrary.Thus, in case of the FKM algorithm the values of Jα and of FK , defined inequations (1) and (2) respectively, are computed and a decision is made if theresulting partition can be accepted. It was assumed that the sample is rejectedif |FK(Uend)−FK(Ustart)| ≤ ε, where Ustart is an initial partition matrix, whileUend is the partition matrix returned by the algorithm.
Next, for each cluster a corresponding histogram description is created andthe spanning-tree of clusters is constructed.The tree plays a control role, e.g. itis used when the clusters are merged or their number is reduced.
If the distance (measured in terms of so-called Hellinger’s divergence9) be-tween any two clusters is less than a pre-specified threshold value ε – theseclusters are merged. The resulting set of clusters S is saved. This ends a singlestep of the algorithm.
In the subsequent steps new samples of documents are drawn randomly, butthis time the probability of including drawn document d into new sample equals:
P (d) = 1−max{md,C(p): C(p) ∈ S} (7)
9 which is – contrary to Kullback-Leibler measure – a symmetric distance measurebetween the two distributions, cf. e.g. A.Basu, I.R.Harris, S.Basu, Minimum distanceestimation: The approach using density-based distances. Handbook of Statistics, 15,1997, pp. 21–48.

where S the set of clusters computed in previous step, and md,C(p) is the degreeof membership of the document d into the cluster C(p), computed according tothe contextual weighting scheme [4].
This way new sample is formed by the documents with low degree of mem-bership to the existing set of clusters. The aim of such a procedure is recurrentimprovement of the partition which should represent all the themes from thecollection D.
Surely, this new sample is subjected to clustering and new clusters are addedto the set S. Then both the contextual descriptions and the spanning tree ofclusters are updated. The procedure terminates after a given number of steps orwhen the set S stabilizes, i.e. no cluster is modified and no new cluster is added.
5 Experimental results
In this section we briefly comment our experiments concerning the quality ofthe contextual clustering by means of the Fuzzy K Means (FKM) algorithm andadaptive histogram-based algorithm (FKH). Further, we compare the influenceof the boosting-like initialization on both algorithms.
In these experiments we use the following sets of documents: 20 News-groups10, 12 Newsgroups11, WebKb12 and Reuters13. The box-and-whisker plotdepicted on Figures 1 and 2 illustrates the process of global clustering of theReuters data. Here a single box presents the distribution of the FK index de-fined in equation (2) in subsequent iterations with respect to different divisionsinto training and testing sets (10-fold cross-validation). The horizontal bars rep-resent median and the lower and upper sides of the box represent 25% and 75%quartiles; lastly the ”whiskers” represent lower and upper extreme values andthe dots – the outliers.
Let us comment variations of the FK measure in consecutive iterations ofparticular clustering algorithms. In case of the FKM with random initialization(Fig. 1(a)) the algorithm almost immediately get stuck in a local minima. An-other consequence of random initialization is large variance of this measure forparticular validating data sets. Similar phenomena, although in a smaller scaleis observed in case of the FHC algorithm, see Fig. 2(a), where we observe minorimprovements of the FK measure, but the results are saddled with large varianceand highly depend on the content of the sets created during cross-validation.
The quality of the results improves remarkably when we use our boosting-likeinitialization. However even in this case we observe rather large variation of thedegree of fuzziness characterizing particular clusters. Similar behavior has beenobserved for the remaining test sets.
10 http://people.csail.mit.edu/jrennie/20Newsgroups/11 a sample of 8094 messages from 12 groups; sizes vary from 326 to 1000 messages12 http://www.cs.cmu.edu/~TextLearning/datasets.html13 http://www.ics.uci.edu/~kdd/databases/reuters21578/reuters21578.html

1 4 7 11 15 19 23 27 31 35 39 43 47
0.10
0.11
0.12
0.13
0.14
0.15
Iterations
FK v
alue
1 4 7 11 15 19 23 27 31 35 39 43 47
0.3
0.4
0.5
0.6
Iterations
FK v
alue
Fig. 1. Distribution of the FK measure in consecutive iterations of FKM algorithmtested on Reuters data set: (a) random initialization (b) boosting-like initialization.
1 4 7 11 15 19 23 27 31 35 39 43 47
0.10
0.12
0.14
0.16
0.18
0.20
Iterations
FK v
alue
1 4 7 11 15 19 23 27 31 35 39 43 47
0.5
0.6
0.7
0.8
0.9
Iterations
FK v
alue
Fig. 2. Distribution of the FK measure in consecutive iterations of FKH algorithmtested on Reuters data set: (a) random initialization (b) boosting-like initialization
Tables 1 and 2 present final values of the normalized mutual information(cf. e.g. [3]), measuring agreement between a priori given document categoriesand the identified clusters for respective test datasets. By random we denotevariant in which cross-validated samples are not initialized at all (i.e. initial fuzzypartition, represented by matrix U is random). On the other hand, initializedmeans initialization via the sampling algorithm described in section 4. We also
NMI K-Means 12News 20News Reuters WebKb
random/direct 0.135± 0.09 0.146± 0.08 0.102± 0.08 0.19± 0.09
initialized/direct 0.323± 0.06 0.364± 0.02 0.151± 0.02 0.621± 0.08
random/recursive 0.161± 0.08 0.176± 0.08 0.111± 0.1 0.189± 0.1
initialized/recursive 0.371± 0.04 0.329± 0.01 0.128± 0.03 0.674± 0.05
Table 1. Normalized Mutual Information for the contextual groups generated by FKM
NMI Histograms 12News 20News Reuters WebKb
random/direct 0.197± 0.07 0.208± 0.06 0.125± 0.08 0.587± 0.04
initialized/direct 0.392± 0.02 0.457± 0.01 0.326± 0.04 0.752± 0.02
random/recursive 0.256± 0.08 0.371± 0.06 0.117± 0.07 0.634± 0.04
initialized/recursive 0.453± 0.01 0.495± 0.01 0.306± 0.03 0.727± 0.02
Table 2. Normalized Mutual Information for the contextual groups generated by FKH
considered two strategies of partitioning the data: a direct one, where for bothFKM and FKH algorithms the number K of clusters was given as an inputparameter, and recursive one, where the recursive splitting of large clusters intosmaller ones was driven by the external criterion of thematic homogeneity. Thecriterion, exploiting Hellinger divergence between respective term distributionsin the clusters of documents, relaxes the requirement of fixing in advance thenumber K of clusters. In case of four variants displayed in tables, one shouldnote the influence of the initialization on the final results. Recurrent methodsprove their advantage over the direct methods with respect to the mean valueand the variance of the final result.
The robustness of the proposed approach is confirmed by in-depth anal-ysis of the interrelationships among topical clusters identified by FKH algo-rithm and the document categories of examplary 20 Newsgroups collection.The number of clusters identified by the FKH algorithm is lower than the to-tal number of newsgroups in the collection (9 vs. 20), however, one can no-tice that a single cluster gathers documents from categories (i.e. newsgroups)which are closely related. For instance, one cluster is comprised mostly ofdocuments related to religion (e.g. alt.atheism, talk.religion.misc, talk.politics.mideast), the other cluster contains the documents related to com-puter issues (comp.graphics, comp.os.ms-windows.misc, comp.sys.ibm.pc.hardware, comp.sys.mac.hardware, comp.windows.x), and other clusters con-sist of predominantly sport-related, motorization-related and science-relateddocuments. In BEATCA search engine14, clusters identified by FKH algorithmare used later on to construct thematical maps and visualize more subtle inter-topical proximities in graphical form. Thus, the property of grouping similarnewsgroups together is an additional advantage, since all of the thematicallyrelated messages will be presented on a single map (so-called contextual map).
6 Conclusions
In this paper we explore the consequences of document cluster characterizationvia term (importance) distribution histograms . This idea offers a deeper insightinto the role played by the terms in formation of a particular cluster. So a fullprofit can be taken from our earlier idea of ”contextual clustering”, that is ofrepresenting different document clusters in different subspaces of a global vectorspace. Histogram-based approach leads to many efficient algorithms for textual
14 cf. e.g. http://www.ipipan.eu/~klopotek/BEATCA/pdf/AIMSA2006.pdf
data processing purposes, to mention only vector space dimensionality reductionor keyword and keyphrases identification. In this paper we focus on the proposalof a fuzzy text clustering algorithm based on local (”contextual”) document-to-cluster similarity and fuzzy clustering initialization via iterative sampling-basedmethod in the vein of boosting.
We have observed the following properties of the presented algorithms:
– advantage of quality and stability of clustering structure identified by ourFKH over the known FKM algorithm, both in direct and in recursive variantof these algorithms
– positive impact of proposed initialization method on clustering stability (i.e.reduction of variance over cross-validated data samples), in case of bothFKM and FKH algorithm
– positive impact of proposed initialization method on supervised clusteringquality (agreement between a priori given labels and identified clusters)
– positive impact of recursive variant of FKH algorithm on thematical homo-geneity clustered together as a single contextual group
Acknowledgements: research partly supported by the Polish state grant No.N516 01532/1906 and co-financed with the 6FP project REWERSE no. 506779.
References
1. C.C. Aggarwal, A. Hinneburg, and D.A. Keim. On the surprising behavior of dis-tance metrics in high dimensional space. In Proc. 8th International ConferenceDatabase Theory (ICDT 2001), pages 420–430. Springer-Verlag, LNCS 1973, 2001.
2. J.C. Bezdek and S.K. Pal. Fuzzy models for pattern recognition: Methods thatsearch for structures in data. IEEE, New York, 1992.
3. C. Boulis and M. Ostendorf. Combining multiple clustering systems. In Proc. of8th European Conference on Principles and Practice of Knowledge Discovery inDatabases (PKDD-2004), pages 63–74. Springer-Verlag, LNAI 3202, 2004.
4. K. Ciesielski and M. KÃlopotek. Text data clustering by contextual graphs. InL. Todorovski, N. Lavrac, and K.P. Jantke, editors, Discovery Science (DS-2006),pages 65–76, Barcelona, Spain, 2006. Springer-Verlag, LNAI 4265.
5. K. Ciesielski and M. KÃlopotek. Towards adaptive web mining: Histograms andcontexts in text data clustering. In M.R. Berthold and J. Shawe-Taylor, editors, In-telligent Data Analysis (IDA-2007), pages 284–295, Ljubljana, Slovenia, September2007. Springer-Verlag, LNCS 4723.
6. E. Forgy. Cluster analysis of multivariate data: Efficiency versus interpretability ofclassification. Biometrics, 21:768–780, 1965.
7. L. Kaufman and P.J. Rousseeuw. Finding groups in data: an introduction to clusteranalysis. Wiley series in probability and mathematical statistics : Applied proba-bility and statistics. Wiley, New York, 1990.
8. J.B. MacQueen. Some methods for classification and analysis of multivariate obser-vations. In Proceedings of 5-th Berkeley Symposium on Mathematical Statistics andProbability, pages 281–297, Berkeley, 1967. University of California Press.
9. G. Salton and M.J. McGill. Introduction to Modern Information Retrieval. McGraw-Hill, New York, 1983.
A Service-Oriented Approach forCurriculum Planning and Validation
Matteo Baldoni1, Cristina Baroglio1, Ingo Brunkhorst2,Elisa Marengo1, Viviana Patti1
1 Dipartimento di Informatica — Universita degli Studi di Torinoc.so Svizzera, 185, I-10149 Torino (Italy)
{baldoni,baroglio,patti}@di.unito.it, [email protected] L3S Research Center, University of Hannover
D-30539 Hannover, [email protected]
Abstract. We present a service-oriented personalization system, set inan educational framework, based on a semantic annotation of courses,given at a knowledge level (what the course teaches, what is requested toknow for attending it in a profitable way). The system supports users inbuilding personalized curricula, formalized by means of an action theory.It is also possible to verify the compliance of curricula w.r.t. a model,expressing constraints at a knowledge level. For what concerns the firsttask, classical planning techniques are adopted, which take into accountboth the student’s initial knowledge and her learning goal. Instead, cur-ricula validation is done against a model, formalized as a set of temporalconstraints. We have developed a prototype of the planning and valida-tion services, by using -as reasoning engines- SWI-Prolog and the SPINmodel checker. Such services will be supplied and combined as plug-and-play personalization services in the Personal Reader framework.
1 Introduction and Motivation
The birth of the Semantic Web brought along standard models, languages, andtools for representing and dealing with machine-interpretable semantic descrip-tions of Web resources, by giving a strong new impulse to research on personal-ization. The introduction of machine-processable semantics makes the use of avariety of reasoning techniques for implementing personalization functionalitiespossible, widening the range of the forms that personalization can assume. Sofar, reasoning in the Semantic Web is mostly reasoning about knowledge ex-pressed in some ontology. However personalization may involve also other kindsof reasoning and knowledge representation, that conceptually lie at the logic andproof layers of the Semantic Web tower.
Moreover, the next Web generation promises to deliver Semantic Web Ser-vices, that can be retrieved and combined in a way that satisfies the user. It opensthe way to many forms of service-oriented personalization. Web services providean ideal infrastructure for enabling interoperability among personalization appli-cations and for constructing Plug&Play-like environments, where the user can
select and combine the kinds of services he or she prefers. Personalization canbe obtained by taking different approaches, e.g. by developing services that of-fer personalization functionalities as well as by personalizing the way in whichservices are selected, and composed in order to meet specific user’s requirements.
In the last years we carried on a research in the educational domain, by fo-cussing on semantic web representations of learning resources and on automatedreasoning techniques for enabling different and complementary personalizationfunctionalities, e.g. curriculum sequencing [6, 7] and verification of the compli-ance of a curriculum against some course design goals [5]. Our current aim is toimplement such results in an organic system, where different personalization ser-vices, that exploit semantic web reasoning, can be combined to support the userin the task of building a curriculum, based on learning resources that representcourses.
While in early times learning resources were simply considered as “contents”,strictly tied to the platform used for accessing them, recently, greater and greaterattention has been posed on the issue of re-use and of a cross-platform use ofeducational contents. The proposed solution is to adopt a semantic annotationof contents based on standard languages, e.g. RDF and LOM. Hereafter, we willconsider a learning resource as formed by educational contents plus semanticmeta-data, which supply information on the resources at a knowledge level, i.e.on the basis of concepts taken from an ontology that describes the educationaldomain. In particular we rely on the interpretation of learning resources as ac-tions discussed in [6, 7]: the meta-data captures the learning objectives of thelearning resource and its pre-requisites. By doing so,one can rely on a classicaltheory of actions and apply different reasoning methods -like planning- for build-ing personalized curricula [6, 7]. The modeling of learning resources as actionsalso enables the use of model checking techniques for developing a validationservice that detects if a user-given curriculum is compliant w.r.t an abstractmodel, given as a set of constraints. In the following we present our achieve-ments in the implementation of a Planning service and a Validation service thatcan interoperate within the Personal Reader Framework [18].
Curriculum planning and validation offer a useful support in many practicalcontexts and can be fruitfully combined for helping students or teaching insti-tutions. Often a student knows what competency he/she would like to acquirebut has no knowledge of which courses will help him/her acquiring it. Moreover,taking courses at different Universities is becoming more and more common inEurope. As a consequence, building a curriculum might become a complicatedtask for students, who must deal with an enormous set of courses across theEuropean countries, each described in different languages and on the basis ofdifferent keywords.
The need of personalizing the sequencing of learning resource, w.r.t. the stu-dent’s interests and context, has often to be combined with the ability to checkthat the resulting curriculum complies against some abstract curricula specifi-cation, which encodes the curricula-design goals expressed by the teachers orby the institution offering the courses. Consider a student, who wants to build
a valid curriculum with the support of our automatic system. The student caneither use as a basis the suggestion returned by the system or he/she can designthe curriculum by hand, based on own criteria. In both cases a personalizedcurriculum is obtained and can be given in input to the validation service forchecking the compliance against a curricula model. Curricula models specifygeneral rules for building learning paths and can be interpreted as constraintsdesigned by the University for guaranteeing the achievement of certain learninggoals. These constraints are to be expressed in terms of knowledge elements, andmaybe also on features that characterize the resources.
Consider now a university which needs to certify that the specific curricula,that it offers for achieving a certain educational goal, and that are built upon thecourses offered locally by the university itself, respect some European guidelines.In this case, we could, in fact, define the guidelines as a set of constraints at anabstract level, i.e. as relations among a set of competencies which should beoffered in a way that meets some given scheme. At this point the verificationcould be performed automatically, by means of a proper reasoner. Finally, theautomatic checking of compliance combined with curriculum planning could beused for implementing processes like cooperation among institutes in curriculadesign and integration, which are actually the focus of the so called BolognaProcess [15], promoted by the EU.
While SCORM [2] and Learning Design [19, 20] represent the most impor-tant steps in the direction of managing and using e-learning based courses andworkflows among a group of actors participating in learning activities, most ofthe available tools lack the machine-interpretable information about the learningresources, and as a result they are not yet open for reasoning-based personaliza-tion and automatic composition and verification. Given our requirements, it is anatural choice to settle our implementation in the Personal Reader (PR) frame-work. The PR relies on a service-oriented architecture enabling personalization,via the use of semantic Personalization Services. Each service offers a differ-ent personalization functionality, e.g. recommendations tailored to the needs ofspecific users, pointers to related (or interesting or more detailed/general) infor-mation, and so on. These semantic web services communicate solely based onRDF documents.
The paper is organized as follows. Section 2 describes our approach to therepresentation and reasoning about learning resources, curricula, and curriculamodels. The implementation of the two services and their integration into thePR Framework is discussed in section 3. We finish with conclusions and hints onfuture work in Section 4.
2 Curricula representation and reasoning
Let us begin with the introduction of our approach to the representation of learn-ing resources, curricula, and curricula models. The basic idea is to describe allthe different kinds of objects, that we need to tackle and that we will introducehereafter, on the basis of a set of predefined competencies, i.e. terms identifying

specific knowledge elements. We will use the two terms as synonyms. Competen-cies can be thought of, and implemented, as concepts in a shared ontology. Inparticular, for what concerns the application system described here, competen-cies were extracted by means of a semi-automatic process and stored as an RDFfile (see Section 3.1 for details).
Given a predefined set of competencies, the initial knowledge of a studentcan be represented as a set of such concepts. This set changes, typically it grows,as the student studies and learns. In the same way, a user, who accesses a repos-itory of learning resources, does it with the aim of finding materials that willallow him/her to acquire some knowledge of interest. Also this knowledge, thatwe identify by the term learning goal, can be represented as a set of knowl-edge elements. The learning goal is to be taken into account in a variety oftasks. For instance, the construction of a personalized curriculum is, actually,the construction of a curriculum which allows the achievement of a learning goalexpressed by the user. In Section 3 we will describe a curricula planning servicefor accomplishing this task.
2.1 Learning resources and curricula
A curriculum is a sequence of learning resources that are homogeneous in theirrepresentation. Based on work in [6, 7], we rely on an action theory, and take theabstraction of resources as simple actions. More specifically, a learning resourceis modelled as an action for acquiring some competencies (called effects). Inorder to understand the contents supplied by a learning resource, the user issometimes required to own other competencies, that we call preconditions. Bothpreconditions and effects can be expressed by means of a semantic annotation ofthe learning resource [7]. In the following we will often refer to learning resourcesas “courses” due to the particular application domain that we have considered(university curricula).
As a simple example of “learning resource as action”, let us, then, reportthe possible representation (in a classical STRIPS-like notation) of the course“databases for biotechnologies” (db for biotech for short):
ACTION: db for biothec(),PREREQ: relational db, EFFECTS: scientific db
The prequisites to this action is to have knowledge about relational databases.Its effect is to supply knowledge about scientific databases.
Given the above interpretation of learning resources, a curriculum can beinterpreted as a plan, i.e. as a sequence of actions, whose execution causes tran-sitions from a state to another, until some final state is reached. The initial statecontains all the competences that we suppose available before the curriculumis taken, e.g. the knowledge that the student already has. This set can also beempty. The final state is sometimes required to contain specific knowledge ele-ments, for instance, all those that compose the user’s learning goal. Indeed, oftencurricula are designed so to allow the achievement of a well-defined learning goal.
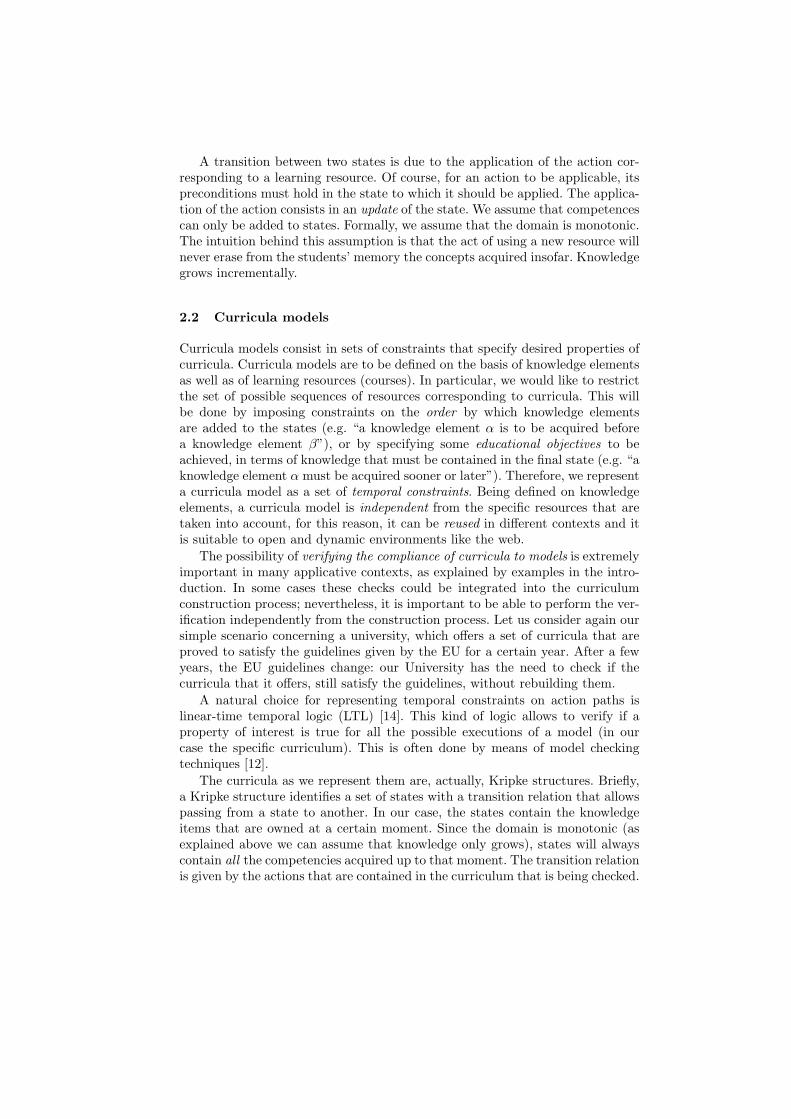
A transition between two states is due to the application of the action cor-responding to a learning resource. Of course, for an action to be applicable, itspreconditions must hold in the state to which it should be applied. The applica-tion of the action consists in an update of the state. We assume that competencescan only be added to states. Formally, we assume that the domain is monotonic.The intuition behind this assumption is that the act of using a new resource willnever erase from the students’ memory the concepts acquired insofar. Knowledgegrows incrementally.
2.2 Curricula models
Curricula models consist in sets of constraints that specify desired properties ofcurricula. Curricula models are to be defined on the basis of knowledge elementsas well as of learning resources (courses). In particular, we would like to restrictthe set of possible sequences of resources corresponding to curricula. This willbe done by imposing constraints on the order by which knowledge elementsare added to the states (e.g. “a knowledge element α is to be acquired beforea knowledge element β”), or by specifying some educational objectives to beachieved, in terms of knowledge that must be contained in the final state (e.g. “aknowledge element α must be acquired sooner or later”). Therefore, we representa curricula model as a set of temporal constraints. Being defined on knowledgeelements, a curricula model is independent from the specific resources that aretaken into account, for this reason, it can be reused in different contexts and itis suitable to open and dynamic environments like the web.
The possibility of verifying the compliance of curricula to models is extremelyimportant in many applicative contexts, as explained by examples in the intro-duction. In some cases these checks could be integrated into the curriculumconstruction process; nevertheless, it is important to be able to perform the ver-ification independently from the construction process. Let us consider again oursimple scenario concerning a university, which offers a set of curricula that areproved to satisfy the guidelines given by the EU for a certain year. After a fewyears, the EU guidelines change: our University has the need to check if thecurricula that it offers, still satisfy the guidelines, without rebuilding them.
A natural choice for representing temporal constraints on action paths islinear-time temporal logic (LTL) [14]. This kind of logic allows to verify if aproperty of interest is true for all the possible executions of a model (in ourcase the specific curriculum). This is often done by means of model checkingtechniques [12].
The curricula as we represent them are, actually, Kripke structures. Briefly,a Kripke structure identifies a set of states with a transition relation that allowspassing from a state to another. In our case, the states contain the knowledgeitems that are owned at a certain moment. Since the domain is monotonic (asexplained above we can assume that knowledge only grows), states will alwayscontain all the competencies acquired up to that moment. The transition relationis given by the actions that are contained in the curriculum that is being checked.
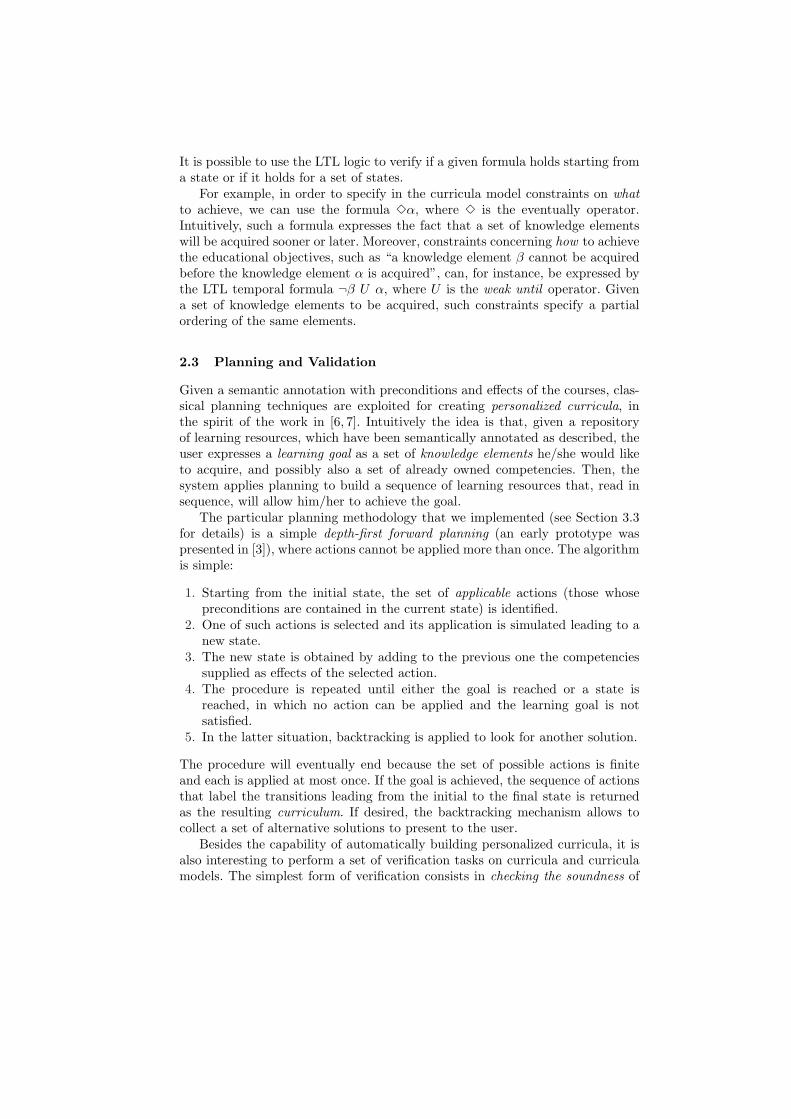
It is possible to use the LTL logic to verify if a given formula holds starting froma state or if it holds for a set of states.
For example, in order to specify in the curricula model constraints on whatto achieve, we can use the formula 3α, where 3 is the eventually operator.Intuitively, such a formula expresses the fact that a set of knowledge elementswill be acquired sooner or later. Moreover, constraints concerning how to achievethe educational objectives, such as “a knowledge element β cannot be acquiredbefore the knowledge element α is acquired”, can, for instance, be expressed bythe LTL temporal formula ¬β U α, where U is the weak until operator. Givena set of knowledge elements to be acquired, such constraints specify a partialordering of the same elements.
2.3 Planning and Validation
Given a semantic annotation with preconditions and effects of the courses, clas-sical planning techniques are exploited for creating personalized curricula, inthe spirit of the work in [6, 7]. Intuitively the idea is that, given a repositoryof learning resources, which have been semantically annotated as described, theuser expresses a learning goal as a set of knowledge elements he/she would liketo acquire, and possibly also a set of already owned competencies. Then, thesystem applies planning to build a sequence of learning resources that, read insequence, will allow him/her to achieve the goal.
The particular planning methodology that we implemented (see Section 3.3for details) is a simple depth-first forward planning (an early prototype waspresented in [3]), where actions cannot be applied more than once. The algorithmis simple:
1. Starting from the initial state, the set of applicable actions (those whosepreconditions are contained in the current state) is identified.
2. One of such actions is selected and its application is simulated leading to anew state.
3. The new state is obtained by adding to the previous one the competenciessupplied as effects of the selected action.
4. The procedure is repeated until either the goal is reached or a state isreached, in which no action can be applied and the learning goal is notsatisfied.
5. In the latter situation, backtracking is applied to look for another solution.
The procedure will eventually end because the set of possible actions is finiteand each is applied at most once. If the goal is achieved, the sequence of actionsthat label the transitions leading from the initial to the final state is returnedas the resulting curriculum. If desired, the backtracking mechanism allows tocollect a set of alternative solutions to present to the user.
Besides the capability of automatically building personalized curricula, it isalso interesting to perform a set of verification tasks on curricula and curriculamodels. The simplest form of verification consists in checking the soundness of
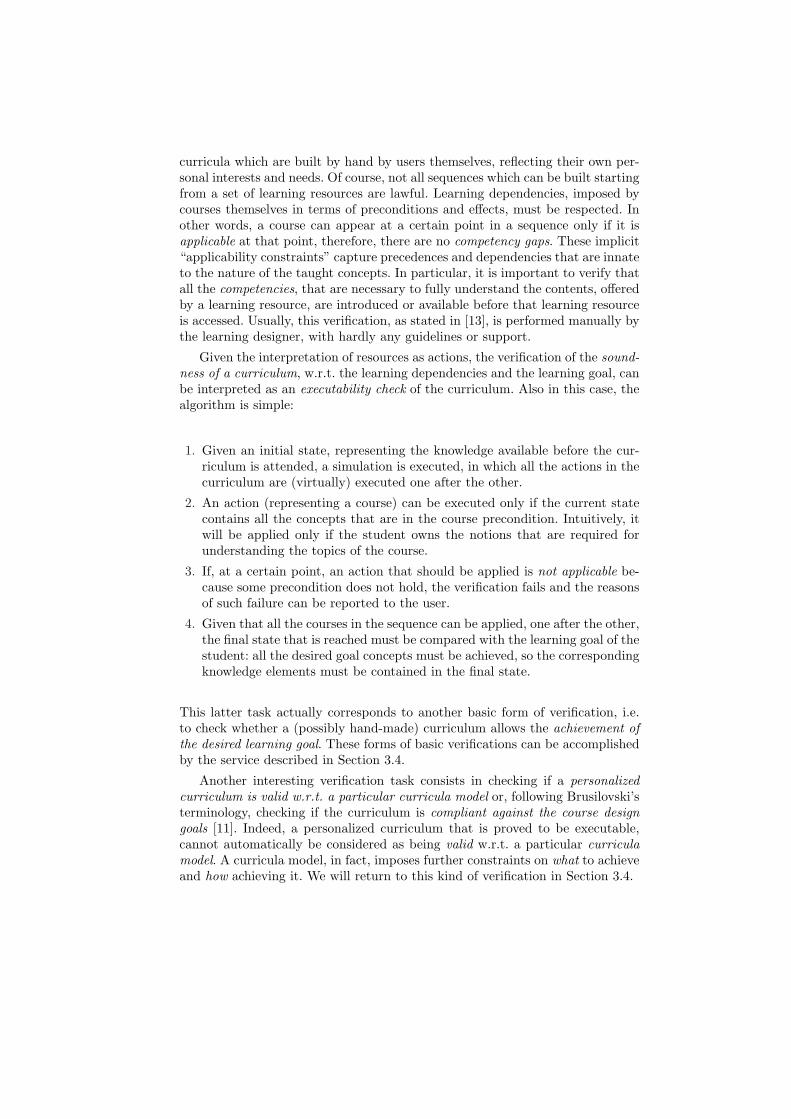
curricula which are built by hand by users themselves, reflecting their own per-sonal interests and needs. Of course, not all sequences which can be built startingfrom a set of learning resources are lawful. Learning dependencies, imposed bycourses themselves in terms of preconditions and effects, must be respected. Inother words, a course can appear at a certain point in a sequence only if it isapplicable at that point, therefore, there are no competency gaps. These implicit“applicability constraints” capture precedences and dependencies that are innateto the nature of the taught concepts. In particular, it is important to verify thatall the competencies, that are necessary to fully understand the contents, offeredby a learning resource, are introduced or available before that learning resourceis accessed. Usually, this verification, as stated in [13], is performed manually bythe learning designer, with hardly any guidelines or support.
Given the interpretation of resources as actions, the verification of the sound-ness of a curriculum, w.r.t. the learning dependencies and the learning goal, canbe interpreted as an executability check of the curriculum. Also in this case, thealgorithm is simple:
1. Given an initial state, representing the knowledge available before the cur-riculum is attended, a simulation is executed, in which all the actions in thecurriculum are (virtually) executed one after the other.
2. An action (representing a course) can be executed only if the current statecontains all the concepts that are in the course precondition. Intuitively, itwill be applied only if the student owns the notions that are required forunderstanding the topics of the course.
3. If, at a certain point, an action that should be applied is not applicable be-cause some precondition does not hold, the verification fails and the reasonsof such failure can be reported to the user.
4. Given that all the courses in the sequence can be applied, one after the other,the final state that is reached must be compared with the learning goal of thestudent: all the desired goal concepts must be achieved, so the correspondingknowledge elements must be contained in the final state.
This latter task actually corresponds to another basic form of verification, i.e.to check whether a (possibly hand-made) curriculum allows the achievement ofthe desired learning goal. These forms of basic verifications can be accomplishedby the service described in Section 3.4.
Another interesting verification task consists in checking if a personalizedcurriculum is valid w.r.t. a particular curricula model or, following Brusilovski’sterminology, checking if the curriculum is compliant against the course designgoals [11]. Indeed, a personalized curriculum that is proved to be executable,cannot automatically be considered as being valid w.r.t. a particular curriculamodel. A curricula model, in fact, imposes further constraints on what to achieveand how achieving it. We will return to this kind of verification in Section 3.4.

3 Implementation in the Personal Reader Framework
The Personal Reader Framework has been developed with the aim of offering auniform entry point for accessing the Semantic Web, and in particular SemanticWeb Services. Indeed it offers an environment for designing, implementing andrealizing Web content readers in a service-oriented approach, for a more detaileddescription, see [18] (http://www.personal-reader.de/).
In applications based on the Personal Reader Framework, a user can se-lect and combine —plug together— which personalized support he or she wantsto receive. The framework has already been used for developing Web ContentReaders that present online material in an embedded context [10, 1, 17]. Besides
Fig. 1. Personal Reader Framework Overview
a user-interface, as shown in figure 1, a Personal Reader application consistsof three types of services. Personalization services (PService) provide personal-ization functionalities: they deliver personalized recommendations for content,as requested by the user and obtained or extracted from the Semantic Web.Syndication Services (SynService) allow for some interoperability with the otherservices in the framework, e.g. for the discovery of the applications interfaces bya portal. The Connector is a single central instance responsible for all the com-munication between user interface and personalization services. It selects servicesbased on their semantic description and on the requirements by the SynService.The Connector protects –by means of a public-key-infrastructure (PKI)– thecommunication among the involved parties. It also supports the customizationand invocation of services and interacts with a user modelling service, called theUMService, which maintains a central user model.
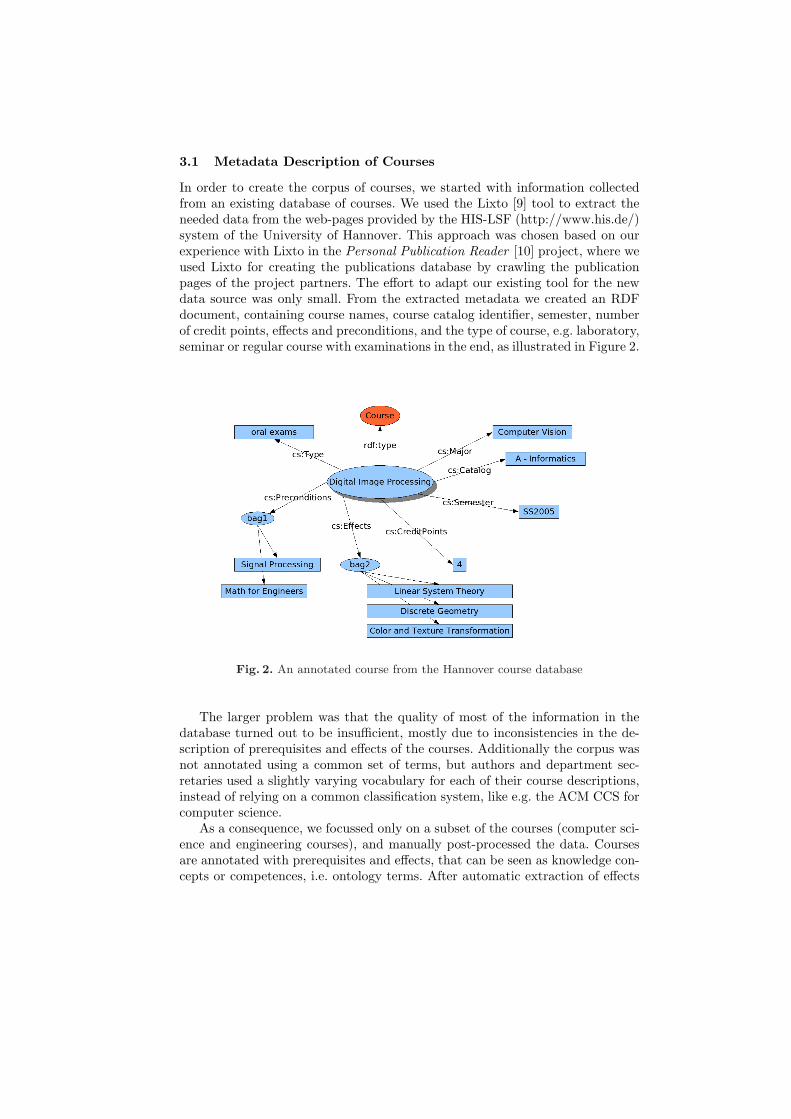
3.1 Metadata Description of Courses
In order to create the corpus of courses, we started with information collectedfrom an existing database of courses. We used the Lixto [9] tool to extract theneeded data from the web-pages provided by the HIS-LSF (http://www.his.de/)system of the University of Hannover. This approach was chosen based on ourexperience with Lixto in the Personal Publication Reader [10] project, where weused Lixto for creating the publications database by crawling the publicationpages of the project partners. The effort to adapt our existing tool for the newdata source was only small. From the extracted metadata we created an RDFdocument, containing course names, course catalog identifier, semester, numberof credit points, effects and preconditions, and the type of course, e.g. laboratory,seminar or regular course with examinations in the end, as illustrated in Figure 2.
Fig. 2. An annotated course from the Hannover course database
The larger problem was that the quality of most of the information in thedatabase turned out to be insufficient, mostly due to inconsistencies in the de-scription of prerequisites and effects of the courses. Additionally the corpus wasnot annotated using a common set of terms, but authors and department sec-retaries used a slightly varying vocabulary for each of their course descriptions,instead of relying on a common classification system, like e.g. the ACM CCS forcomputer science.
As a consequence, we focussed only on a subset of the courses (computer sci-ence and engineering courses), and manually post-processed the data. Coursesare annotated with prerequisites and effects, that can be seen as knowledge con-cepts or competences, i.e. ontology terms. After automatic extraction of effects
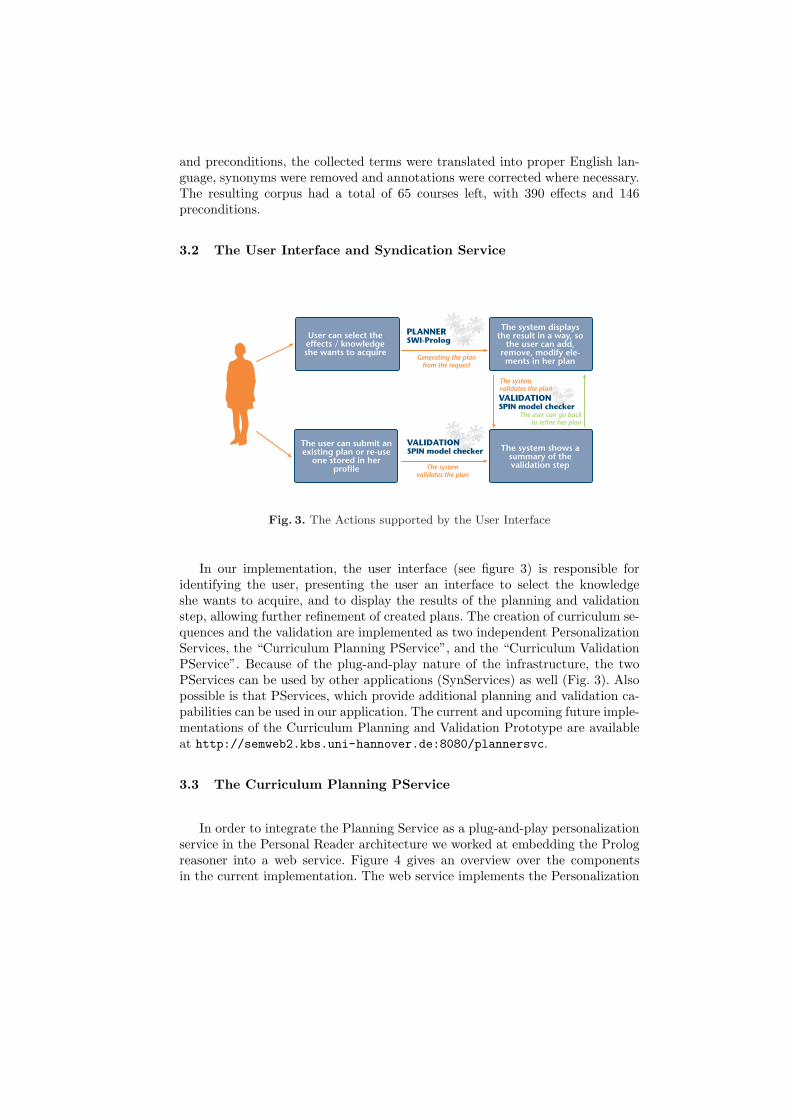
and preconditions, the collected terms were translated into proper English lan-guage, synonyms were removed and annotations were corrected where necessary.The resulting corpus had a total of 65 courses left, with 390 effects and 146preconditions.
3.2 The User Interface and Syndication Service
User can select theeffects / knowledgeshe wants to acquire
The system displaysthe result in a way, so
the user can add,remove, modify ele-ments in her plan
The user can submit anexisting plan or re-use
one stored in herprofile
The system shows asummary of thevalidation step
PLANNERSWI-Prolog
The systemvalidates the plan
The systemvalidates the plan
Generating the planfrom the request
The user can go backto refine her plan
VALIDATIONSPIN model checker
VALIDATIONSPIN model checker
Fig. 3. The Actions supported by the User Interface
In our implementation, the user interface (see figure 3) is responsible foridentifying the user, presenting the user an interface to select the knowledgeshe wants to acquire, and to display the results of the planning and validationstep, allowing further refinement of created plans. The creation of curriculum se-quences and the validation are implemented as two independent PersonalizationServices, the “Curriculum Planning PService”, and the “Curriculum ValidationPService”. Because of the plug-and-play nature of the infrastructure, the twoPServices can be used by other applications (SynServices) as well (Fig. 3). Alsopossible is that PServices, which provide additional planning and validation ca-pabilities can be used in our application. The current and upcoming future imple-mentations of the Curriculum Planning and Validation Prototype are availableat http://semweb2.kbs.uni-hannover.de:8080/plannersvc.
3.3 The Curriculum Planning PService
In order to integrate the Planning Service as a plug-and-play personalizationservice in the Personal Reader architecture we worked at embedding the Prologreasoner into a web service. Figure 4 gives an overview over the componentsin the current implementation. The web service implements the Personalization
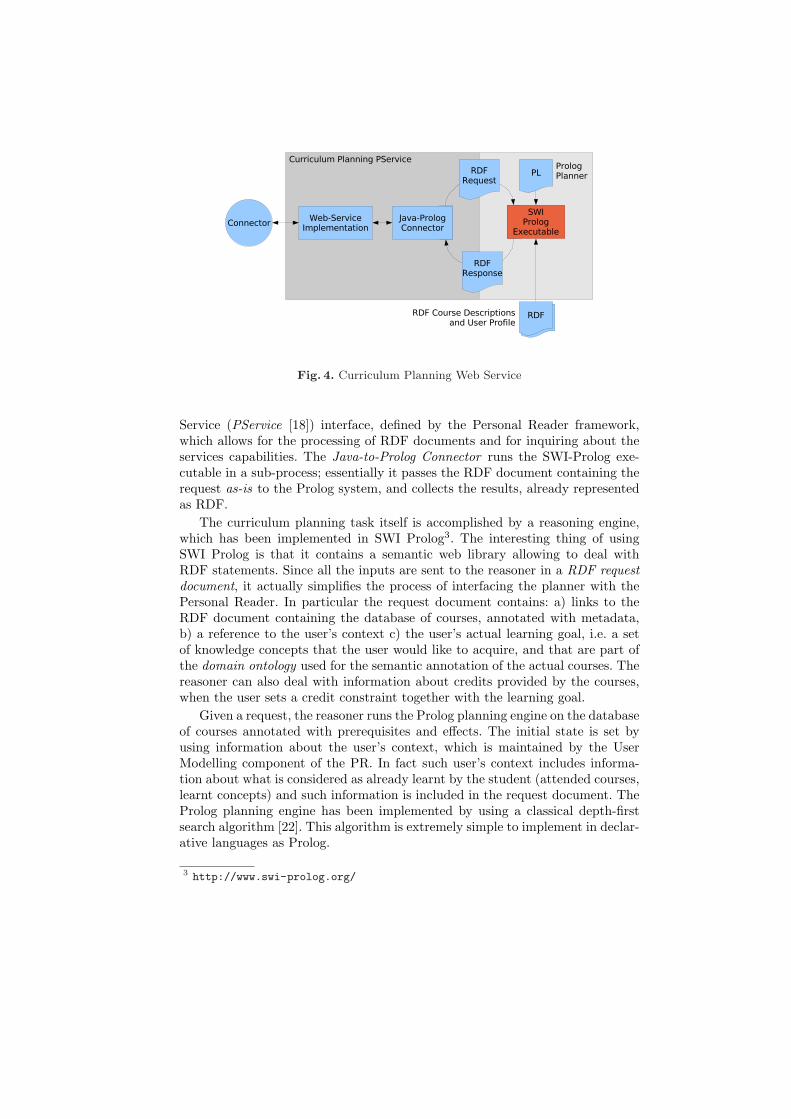
Fig. 4. Curriculum Planning Web Service
Service (PService [18]) interface, defined by the Personal Reader framework,which allows for the processing of RDF documents and for inquiring about theservices capabilities. The Java-to-Prolog Connector runs the SWI-Prolog exe-cutable in a sub-process; essentially it passes the RDF document containing therequest as-is to the Prolog system, and collects the results, already representedas RDF.
The curriculum planning task itself is accomplished by a reasoning engine,which has been implemented in SWI Prolog3. The interesting thing of usingSWI Prolog is that it contains a semantic web library allowing to deal withRDF statements. Since all the inputs are sent to the reasoner in a RDF requestdocument, it actually simplifies the process of interfacing the planner with thePersonal Reader. In particular the request document contains: a) links to theRDF document containing the database of courses, annotated with metadata,b) a reference to the user’s context c) the user’s actual learning goal, i.e. a setof knowledge concepts that the user would like to acquire, and that are part ofthe domain ontology used for the semantic annotation of the actual courses. Thereasoner can also deal with information about credits provided by the courses,when the user sets a credit constraint together with the learning goal.
Given a request, the reasoner runs the Prolog planning engine on the databaseof courses annotated with prerequisites and effects. The initial state is set byusing information about the user’s context, which is maintained by the UserModelling component of the PR. In fact such user’s context includes informa-tion about what is considered as already learnt by the student (attended courses,learnt concepts) and such information is included in the request document. TheProlog planning engine has been implemented by using a classical depth-firstsearch algorithm [22]. This algorithm is extremely simple to implement in declar-ative languages as Prolog.
3 http://www.swi-prolog.org/
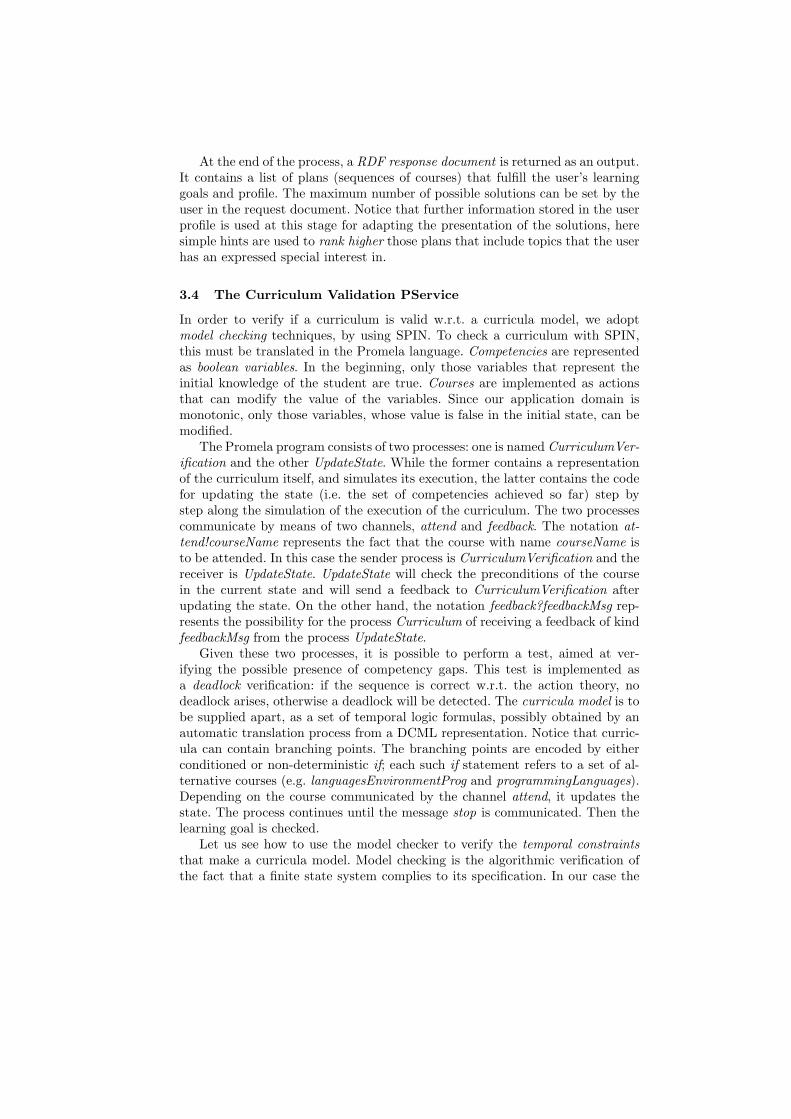
At the end of the process, a RDF response document is returned as an output.It contains a list of plans (sequences of courses) that fulfill the user’s learninggoals and profile. The maximum number of possible solutions can be set by theuser in the request document. Notice that further information stored in the userprofile is used at this stage for adapting the presentation of the solutions, heresimple hints are used to rank higher those plans that include topics that the userhas an expressed special interest in.
3.4 The Curriculum Validation PService
In order to verify if a curriculum is valid w.r.t. a curricula model, we adoptmodel checking techniques, by using SPIN. To check a curriculum with SPIN,this must be translated in the Promela language. Competencies are representedas boolean variables. In the beginning, only those variables that represent theinitial knowledge of the student are true. Courses are implemented as actionsthat can modify the value of the variables. Since our application domain ismonotonic, only those variables, whose value is false in the initial state, can bemodified.
The Promela program consists of two processes: one is named CurriculumVer-ification and the other UpdateState. While the former contains a representationof the curriculum itself, and simulates its execution, the latter contains the codefor updating the state (i.e. the set of competencies achieved so far) step bystep along the simulation of the execution of the curriculum. The two processescommunicate by means of two channels, attend and feedback. The notation at-tend!courseName represents the fact that the course with name courseName isto be attended. In this case the sender process is CurriculumVerification and thereceiver is UpdateState. UpdateState will check the preconditions of the coursein the current state and will send a feedback to CurriculumVerification afterupdating the state. On the other hand, the notation feedback?feedbackMsg rep-resents the possibility for the process Curriculum of receiving a feedback of kindfeedbackMsg from the process UpdateState.
Given these two processes, it is possible to perform a test, aimed at ver-ifying the possible presence of competency gaps. This test is implemented asa deadlock verification: if the sequence is correct w.r.t. the action theory, nodeadlock arises, otherwise a deadlock will be detected. The curricula model is tobe supplied apart, as a set of temporal logic formulas, possibly obtained by anautomatic translation process from a DCML representation. Notice that curric-ula can contain branching points. The branching points are encoded by eitherconditioned or non-deterministic if; each such if statement refers to a set of al-ternative courses (e.g. languagesEnvironmentProg and programmingLanguages).Depending on the course communicated by the channel attend, it updates thestate. The process continues until the message stop is communicated. Then thelearning goal is checked.
Let us see how to use the model checker to verify the temporal constraintsthat make a curricula model. Model checking is the algorithmic verification ofthe fact that a finite state system complies to its specification. In our case the
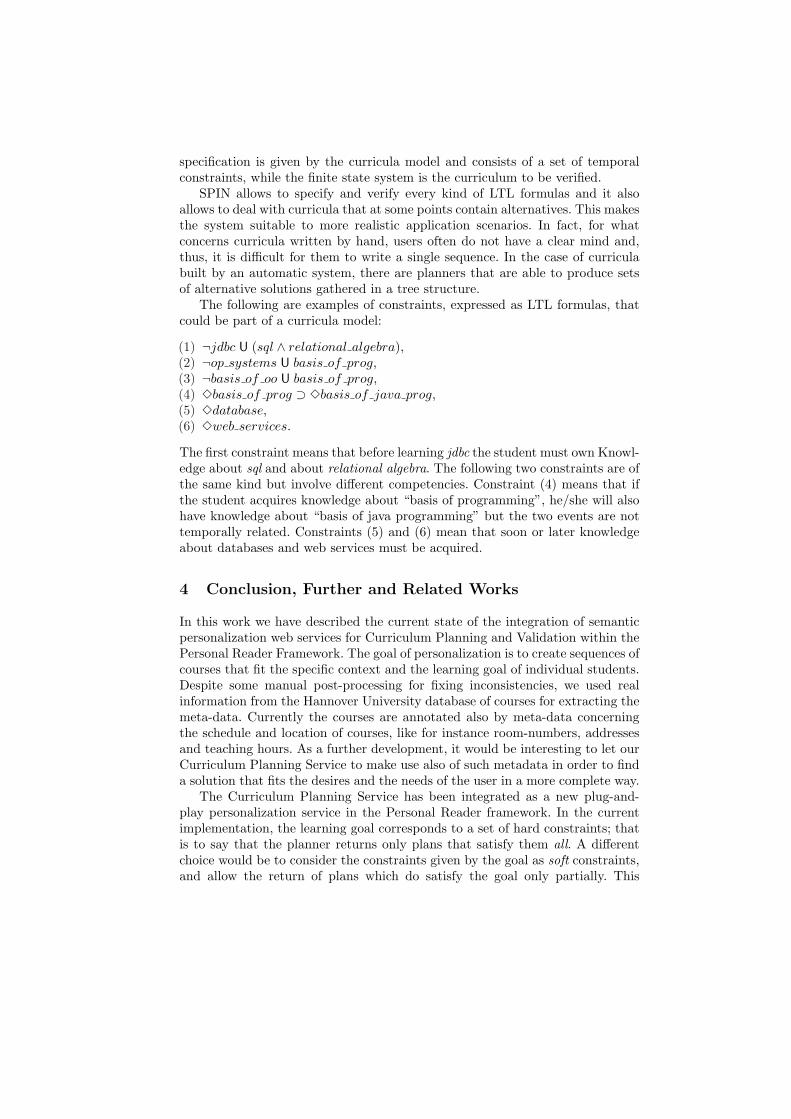
specification is given by the curricula model and consists of a set of temporalconstraints, while the finite state system is the curriculum to be verified.
SPIN allows to specify and verify every kind of LTL formulas and it alsoallows to deal with curricula that at some points contain alternatives. This makesthe system suitable to more realistic application scenarios. In fact, for whatconcerns curricula written by hand, users often do not have a clear mind and,thus, it is difficult for them to write a single sequence. In the case of curriculabuilt by an automatic system, there are planners that are able to produce setsof alternative solutions gathered in a tree structure.
The following are examples of constraints, expressed as LTL formulas, thatcould be part of a curricula model:
(1) ¬jdbc U (sql ∧ relational algebra),(2) ¬op systems U basis of prog,(3) ¬basis of oo U basis of prog,(4) 3basis of prog ⊃ 3basis of java prog,(5) 3database,(6) 3web services.
The first constraint means that before learning jdbc the student must own Knowl-edge about sql and about relational algebra. The following two constraints are ofthe same kind but involve different competencies. Constraint (4) means that ifthe student acquires knowledge about “basis of programming”, he/she will alsohave knowledge about “basis of java programming” but the two events are nottemporally related. Constraints (5) and (6) mean that soon or later knowledgeabout databases and web services must be acquired.
4 Conclusion, Further and Related Works
In this work we have described the current state of the integration of semanticpersonalization web services for Curriculum Planning and Validation within thePersonal Reader Framework. The goal of personalization is to create sequences ofcourses that fit the specific context and the learning goal of individual students.Despite some manual post-processing for fixing inconsistencies, we used realinformation from the Hannover University database of courses for extracting themeta-data. Currently the courses are annotated also by meta-data concerningthe schedule and location of courses, like for instance room-numbers, addressesand teaching hours. As a further development, it would be interesting to let ourCurriculum Planning Service to make use also of such metadata in order to finda solution that fits the desires and the needs of the user in a more complete way.
The Curriculum Planning Service has been integrated as a new plug-and-play personalization service in the Personal Reader framework. In the currentimplementation, the learning goal corresponds to a set of hard constraints; thatis to say that the planner returns only plans that satisfy them all. A differentchoice would be to consider the constraints given by the goal as soft constraints,and allow the return of plans which do satisfy the goal only partially. This
would be approapriate, for instance, in the case in which a student would liketo acquire a range of competencies of interest but it is not possible to build, ontop of a given repository of course descriptions, a curriculum for achieving themall. Nevertheless, it would be possible to build a curriculum for achieving partof them. In some circumstances, it would anyway be helpful for the student toreceive this information as a feedback. Of course, in this case many questionsarise, e.g. the issue of ranking the goals based on the actual interest of therequestor, so to know what can possibly be discarded and what is mandatory.From an implementation perspective, the spirit of the SOA infrustructure givento the Personal Reader is, indeed, meant to easily allow extensions by addingnew Personalization Services. We can, therefore, think to develop and add a soft-goal planning service, to be used in these circumstances. The new planner wouldinherit the wrapping and interaction part from the current planning service butimplement an algorithm like for instance [16].
The Curriculum Validation Service has been designed. An early prototype ofthe validation system based on the model checker SPIN has been developed [5]and is currently being embedded in the same framework. The choice of relyingon SPIN, rather than developing a simpler and ad hoc checking system, is dueto the need of rapidly developing a prototype. For this reason we have decidedto rely on already exisiting and well-established technology. The engineeringof the developed services should be tailored to the specific kinds of constraintthat can be used to design the model. Analogous considerations can be donefor the planning algorithm. The one that has been used is the simplest that canbe thought of. Of course, there are many possible optimizations and extensions(e.g. the adoption of soft goals mentioned above) that could be done, and manyalgorithms are already available in the literature. Our choice has been motivatedby the desire of quickly testing our ideas rather than developing a system thoughtfor real use.
The Personal Reader Platform provides a natural framework for implement-ing a service-oriented approach to personalization in the Semantic Web, allowingto investigate how (semantic) web service technologies can provide a suitable in-frastructure for building personalization applications, that consist of re-usableand interoperable personalization functionalities. The idea of taking a serviceoriented approach to personalization is quite new and was born within the per-sonalization working group of the Network of Excellence REWERSE (Reasoningon the Web with Rules and Semantics, http://rewerse.net).
Writing curricula models directly in LTL is not an easy task for the user.For this reason, we have recently developed a graphical language, called DCML(Declarative Curricula Model Language) [8, 4], inspired by DecSerFlow, the Declar-ative Service Flow Language by van der Aalst and Pesic [23]. DCML allows toexpress the temporal relations between the times of acquisition of the concepts.The advantage of a graphical language is that drawing, rather than writing, con-straints facilitates the user, who needs to represent curricula models, allowinga general overview of the relations which exist between concepts. At the sametime, a rigorous and precise meaning is also given, due to the logic grounding of
the language. Moreover, in [4] we represent curricula as UML activity diagramsand include the possibility of handling the concurrent attending of courses. Alsoin this case curricula can be translated in Promela programs so that it becomespossible to perform all the kinds of verification that we have described.
DCML, besides being a graphical language, has also a textual representation.We are currently working at an integration of this new more sophisticated solu-tion into the Personal Reader Framework by implementing an automatic systemfor translating DCML textual representations into LTL, for translating curricula(activity diagrams) in Promela, and then run the checks.
Another recent proposal for automatizing the competency gap verification isdone in [21] where an analysis of pre- and post-requisite annotations of the Learn-ing Objects (LO), representing the learning resources, is proposed. In this ap-proach, whenever an error will be detected by the validation phase, a correctionengine will be activated. This engine will use a “Correction Model” to producesuggestions for correcting the wrong curriculum, by means of a reasoning-by-cases approach. The suggestions will, then, be presented to the course devel-oper, who is in charge to decide which ones to adopt (if any). Once a curriculumwill have been corrected, it will have to be validated again, because the cor-rections might introduce new errors. Melia and Pahl’s proposal is inspired bythe CocoA system [11], that allows to perform the analysis and the consistencycheck of static web-based courses. Competency gaps are checked by a prerequi-site checker for linear courses, simulating the process of teaching with an overlaystudent model. Pre- and post-requisites are represented by knowledge elements.
Acknowledgement This research has partially been funded by the EuropeanCommission and by the Swiss Federal Office for Education and Science withinthe 6th Framework Programme project REWERSE number 506779 (cf. http://rewerse.net).
References
1. F. Abel, I. Brunkhorst, N. Henze, D. Krause, K. Mushtaq, P. Nasirifar, andK. Tomaschweski. Personal reader agent: Personalized access to configurable webservices. Technical report, Distributed Systems Institute, Semantic Web Group,University of Hannover, 2006.
2. Advanced Distributed Learning Network. SCORM: The sharable content objectreference model, 2001. http://www.adlnet.org/Scorm/scorm.cfm.
3. M. Baldoni, C. Baroglio, I. Brunkhorst, N. Henze, E. Marengo, and V. Patti. APersonalization Service for Curriculum Planning. In E. Herder and D. Heckmann,editors, Proc. of the 14th Workshop ABIS, pages 17–20, Hildesheim, Germany,October 2006.
4. M. Baldoni, C. Baroglio, and E. Marengo. Curricula Modeling and Checking. InProc. of AI*IA 2007: Advances in Artificial Intelligence, volume 4733 of LNAI,pages 471–482. Springer, 2007.
5. M. Baldoni, C. Baroglio, A. Martelli, V. Patti, and L. Torasso. Verifying the com-pliance of personalized curricula to curricula models in the semantic web. In Proc.

of the Semantic Web Personalization Workshop, pages 53–62, Budva, Montenegro,2006.
6. M. Baldoni, C. Baroglio, and V. Patti. Web-based adaptive tutoring: An approachbased on logic agents and reasoning about actions. Artificial Intelligence Review,1(22):3–39, 2004.
7. M. Baldoni, C. Baroglio, V. Patti, and L. Torasso. Reasoning about learning objectmetadata for adapting SCORM courseware. In L. Aroyo and C. Tasso, editors,Int. Workshop on Engineering the Adaptive Web, EAW’04, pages 4–13, 2004.
8. M. Baldoni and E. Marengo. Curriculum Model Checking: Declarative Represen-tation and Verification of Properties. In Proc. of 2nd Eur. Conf. EC-TEL, volume4753 of LNCS, pages 432–437. Springer, 2007.
9. R. Baumgartner, S. Flesca, and G. Gottlob. Visual web information extractionwith lixto. In Peter M. G. Apers, Paolo Atzeni, Stefano Ceri, Stefano Paraboschi,Kotagiri Ramamohanarao, and Richard T. Snodgrass, editors, VLDB, pages 119–128. Morgan Kaufmann, 2001.
10. R. Baumgartner, N. Henze, and M. Herzog. The personal publication reader:Illustrating web data extraction, personalization and reasoning for the semanticweb. In ESWC, pages 515–530, 2005.
11. P. Brusilovsky and J. Vassileva. Course sequencing techniques for large-scaleweb-based education. Int. J. Cont. Engineering Education and Lifelong learning,13(1/2):75–94, 2003.
12. O. E. M. Clarke and D. Peled. Model checking. MIT Press, Cambridge, MA, USA,2001.
13. Juri L. De Coi, Eelco Herder, Arne Koesling, Christoph Lofi, Daniel Olmedilla,Odysseas Papapetrou, and Wolf Sibershi. A model for competence gap analysis.In Proc. of WEBIST 2007, 2007.
14. E. A. Emerson. Temporal and model logic. In Handbook of Theoretical ComputerScience, volume B, pages 997–1072. Elsevier, 1990.
15. European Commission, Education and Training. The Bologna process. http:
//ec.europa.eu/education/policies/educ/bologna/bologna en.html.16. E. Giunchiglia and M. Maratea. SAT-based planning with minimal-]actions plans
and “soft” goals. In Proc. of AI*IA 2007: Advances in Artificial Intelligence,volume 4733 of LNAI. Springer, 2007.
17. N. Henze. Personal readers: Personalized learning object readers for the semanticweb. In 12th International Conference on Artificial Intelligence in Education,AIED05, Amsterdam, The Netherlands, 2005.
18. N. Henze and D. Krause. Personalized access to web services in the semanticweb. In The 3rd International Semantic Web User Interaction Workshop (SWUI,collocated with ISWC 2006, November 2006.
19. IMSGlobal. Learning design specifications. Available at http://www.imsglobal.
org/learningdesign/.20. R. Koper and C. Tattersall. Learning Design: A Handbook on Modelling and De-
livering Networked Education and Training. Springer Verlag, 2005.21. M. Melia and C. Pahl. Automatic Validation of Learning Object Compositions. In
Information Technology and Telecommunications Conference IT&T’2005: DoctoralSymposium, Carlow, Ireland, 2006.
22. S. Russel and P. Norvig. Artificial Intelligence: A Modern Approach. Prentice Hall,1995.
23. W. M. P. van der Aalst and M. Pesic. DecSerFlow: Towards a Truly DeclarativeService Flow Language. In Mario Bravetti and Gialuigi Zavattaro, editors, Proc.of WS-FM, LNCS, Vienna, September 2006. Springer.
Curricula Modeling and Checking
Matteo Baldoni, Cristina Baroglio, and Elisa Marengo
Dipartimento di Informatica — Universita degli Studi di TorinoC.so Svizzera, 185 — I-10149 Torino (Italy)
{baldoni,baroglio}@di.unito.it, [email protected]
Abstract. In this work, we present a constrained-based representationfor specifying the goals of “course design”, that we call curricula model,and introduce a graphical language, grounded into Linear Time Logic,to design curricula models which include knowledge of proficiency levels.Based on this representation, we show how model checking techniquescan be used to verify that the user’s learning goal is supplied by a cur-riculum, that a curriculum is compliant to a curricula model, and thatcompetence gaps are avoided.
1 Introduction and Motivations
As recently underlined by other authors, there is a strong relationship betweenthe development of peer-to-peer, (web) service technologies and e-learning tech-nologies [17]. The more learning resources are freely available through the Web,the more modern e-learning management systems (LMSs) should be able to takeadvantage from this richness: LMSs should offer the means for easily retrievingand assembling e-learning resources so to satisfy specific users’ learning goals,similarly to how (web) services are retrieved and composed [12]. As in a com-position of web services it is necessary to verify that, at every point, all theinformation necessary to the subsequent invocation will be available, in a learn-ing domain, it is important to verify that all the competencies, i.e. the knowledge,necessary to fully understand a learning resource are introduced or available be-fore that learning resource is accessed. The composition of learning resources, acurriculum, does not have to show any competence gap. Unfortunately, this veri-fication, as stated in [10], is usually performed manually by the learning designer,with hardly any guidelines or support.
A recent proposal for automatizing the competence gap verification is donein [17] where an analysis of pre- and post-requisite annotations of the LearningObjects (LO), representing the learning resources, is proposed. A logic based val-idation engine can use these annotations in order to validate the curriculum/LOcomposition. Melia and Pahl’s proposal is inspired by the CocoA system [8],that allows to perform the analysis and the consistency check of static web-based courses. Competence gaps are checked by a prerequisite checker for linearcourses, simulating the process of teaching with an overlay student model. Pre-and post-requisites are represented as “concepts”.
R. Basili and M.T. Pazienza (Eds.): AI*IA 2007, LNAI 4733, pp. 471–482, 2007.c© Springer-Verlag Berlin Heidelberg 2007
472 M. Baldoni, C. Baroglio, and E. Marengo
Together with the verification of consistence gaps, there are other kinds of ver-ification. Brusilovsky and Vassileva [8] sketch some of them. In our opinion, twoare particularly important: (a) verifying that the curriculum allows to achievethe users’ learning goals, i.e. that the user will acquire the desired knowledge,and (b) verifying that the curriculum is compliant against the course designgoals. Manually or automatically supplied curricula, developed to reach a learn-ing goal, should match the “design document”, a curricula model, specified by theinstitution that offers the possibility of personalizing curricula. Curricula modelsspecify general rules for designing sequences of learning resources (courses). Weinterpret them as constraints, that are expressed in terms of concepts and, ingeneral, are not directly associated to learning resources, as instead is done forpre-requisites. They constrain the process of acquisition of concepts, indepen-dently from the resources.
More specifically, in this paper we present a constraint-based representationof curricula models. Constraints are expressed as formulas in a temporal logic(LTL, linear temporal logic [11]) represented by means of a simple graphicallanguage that we call DCML (Declarative Curricula Model Language). This logicallows the verification of properties of interest for all the possible executions ofa model, which in our case corresponds to the specific curriculum. Curriculaare represented as activity diagrams [1]. We translate an activity diagram, thatrepresents a curriculum, in a Promela program [16] and we check, by means ofthe well-known SPIN Model Checker [16], that it respect the model by verifyingthat the set of LTL formulas are satisfied by the Promela program. Moreover,we check that learning goals are achieved, and that the curriculum does notcontain competence gaps. As in [10], we distinguish between competency andcompetence, where by the first term we denote a concept (or skill) while by thesecond we denote a competency plus the level of proficiency at which it is learntor known or supplied. So far, we do not yet tackle with “contexts”, as definedin the competence model proposed in [10], which will be part of future work.
This approach differs from previous work [5], where we presented an adaptivetutoring system, that exploits reasoning about actions and changes to plan andverify curricula. The approach was based on abstract representations, capturingthe structure of a curriculum, and implemented by means of prolog-like logicclauses. Such representations were applied a procedure-driven form of planning,in order to build personalized curricula. In this context, we proposed also someforms of verification, of competence gaps, of learning goal achievement, and ofwhether a curriculum, given by a user, is compliant to the “course design” goals.The use of procedure clauses is, however, limiting because they, besides havinga prescriptive nature, pose very strong constraints on the sequencing of learningresources. In particular, clauses represent what is “legal” and whatever sequenceis not foreseen by the clauses is “illegal”. However, in an open environment whereresources are extremely various, they are added/removed dynamically, and theirnumber is huge, this approach becomes unfeasible: the clauses would be toocomplex, it would be impossible to consider all the alternatives and the clausesshould change along time.
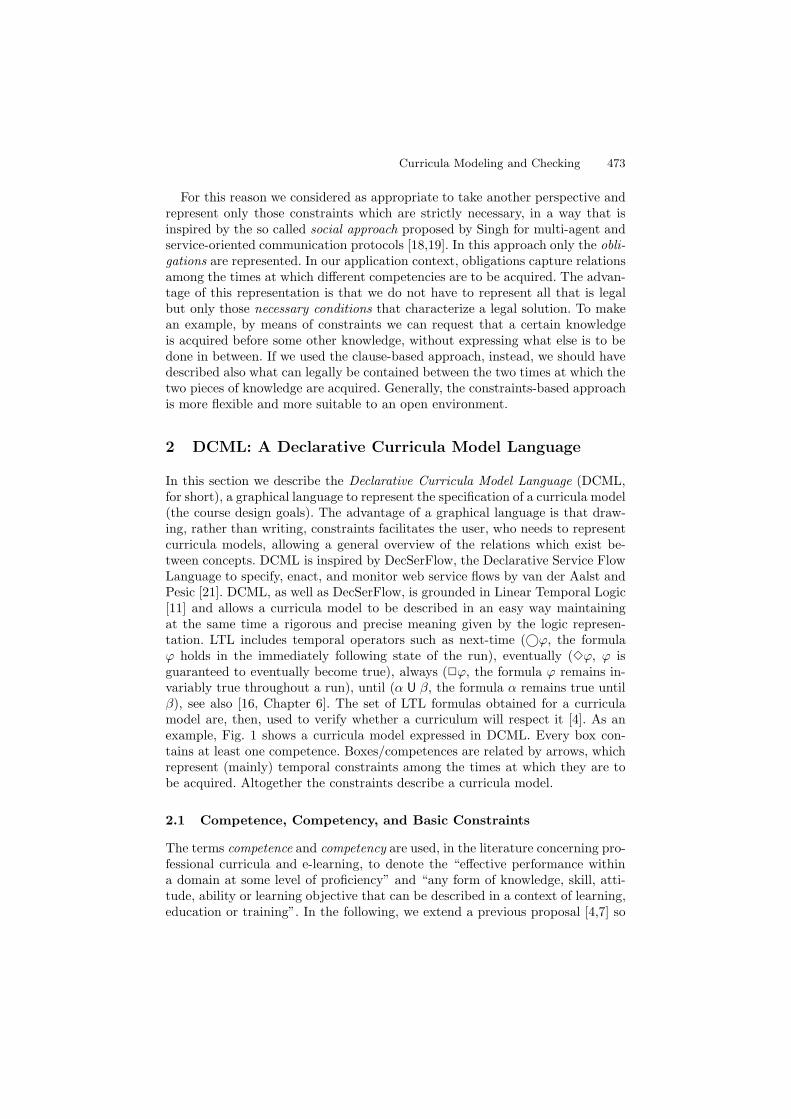
Curricula Modeling and Checking 473
For this reason we considered as appropriate to take another perspective andrepresent only those constraints which are strictly necessary, in a way that isinspired by the so called social approach proposed by Singh for multi-agent andservice-oriented communication protocols [18,19]. In this approach only the obli-gations are represented. In our application context, obligations capture relationsamong the times at which different competencies are to be acquired. The advan-tage of this representation is that we do not have to represent all that is legalbut only those necessary conditions that characterize a legal solution. To makean example, by means of constraints we can request that a certain knowledgeis acquired before some other knowledge, without expressing what else is to bedone in between. If we used the clause-based approach, instead, we should havedescribed also what can legally be contained between the two times at which thetwo pieces of knowledge are acquired. Generally, the constraints-based approachis more flexible and more suitable to an open environment.
2 DCML: A Declarative Curricula Model Language
In this section we describe the Declarative Curricula Model Language (DCML,for short), a graphical language to represent the specification of a curricula model(the course design goals). The advantage of a graphical language is that draw-ing, rather than writing, constraints facilitates the user, who needs to representcurricula models, allowing a general overview of the relations which exist be-tween concepts. DCML is inspired by DecSerFlow, the Declarative Service FlowLanguage to specify, enact, and monitor web service flows by van der Aalst andPesic [21]. DCML, as well as DecSerFlow, is grounded in Linear Temporal Logic[11] and allows a curricula model to be described in an easy way maintainingat the same time a rigorous and precise meaning given by the logic represen-tation. LTL includes temporal operators such as next-time (©ϕ, the formulaϕ holds in the immediately following state of the run), eventually (�ϕ, ϕ isguaranteed to eventually become true), always (�ϕ, the formula ϕ remains in-variably true throughout a run), until (α U β, the formula α remains true untilβ), see also [16, Chapter 6]. The set of LTL formulas obtained for a curriculamodel are, then, used to verify whether a curriculum will respect it [4]. As anexample, Fig. 1 shows a curricula model expressed in DCML. Every box con-tains at least one competence. Boxes/competences are related by arrows, whichrepresent (mainly) temporal constraints among the times at which they are tobe acquired. Altogether the constraints describe a curricula model.
2.1 Competence, Competency, and Basic Constraints
The terms competence and competency are used, in the literature concerning pro-fessional curricula and e-learning, to denote the “effective performance withina domain at some level of proficiency” and “any form of knowledge, skill, atti-tude, ability or learning objective that can be described in a context of learning,education or training”. In the following, we extend a previous proposal [4,7] so
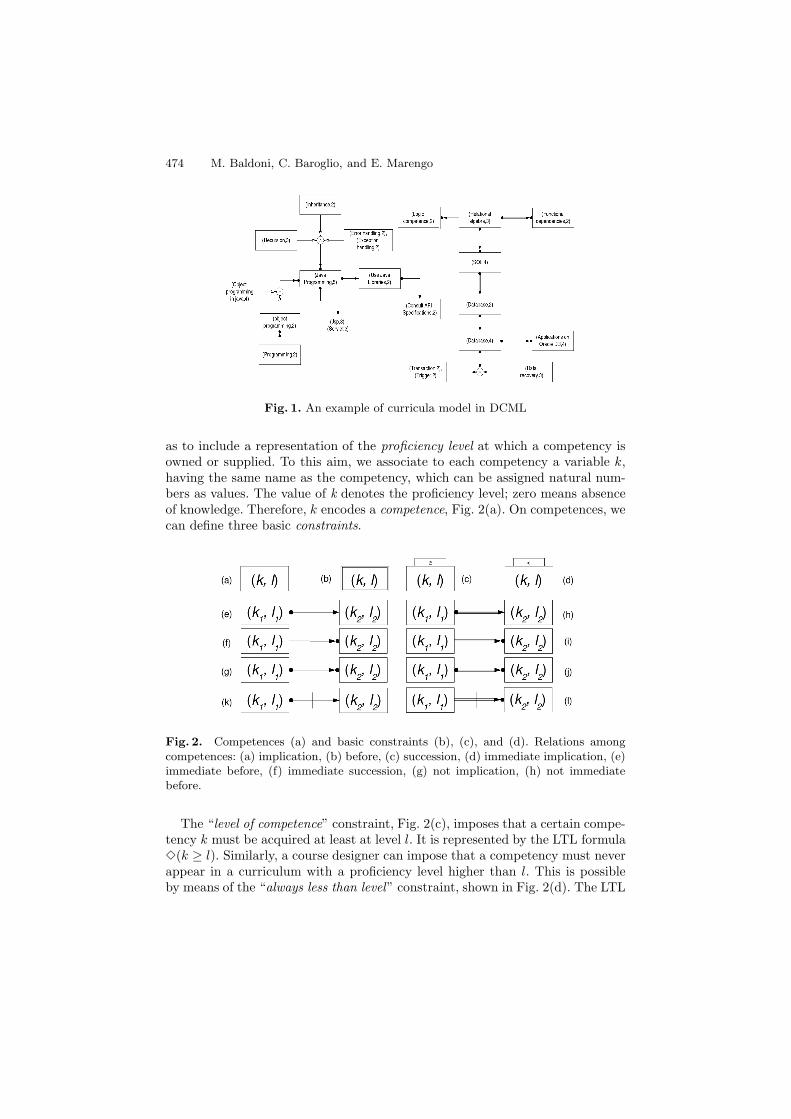
474 M. Baldoni, C. Baroglio, and E. Marengo
Fig. 1. An example of curricula model in DCML
as to include a representation of the proficiency level at which a competency isowned or supplied. To this aim, we associate to each competency a variable k,having the same name as the competency, which can be assigned natural num-bers as values. The value of k denotes the proficiency level; zero means absenceof knowledge. Therefore, k encodes a competence, Fig. 2(a). On competences, wecan define three basic constraints.
Fig. 2. Competences (a) and basic constraints (b), (c), and (d). Relations amongcompetences: (a) implication, (b) before, (c) succession, (d) immediate implication, (e)immediate before, (f) immediate succession, (g) not implication, (h) not immediatebefore.
The “level of competence” constraint, Fig. 2(c), imposes that a certain compe-tency k must be acquired at least at level l. It is represented by the LTL formula�(k ≥ l). Similarly, a course designer can impose that a competency must neverappear in a curriculum with a proficiency level higher than l. This is possibleby means of the “always less than level” constraint, shown in Fig. 2(d). The LTL
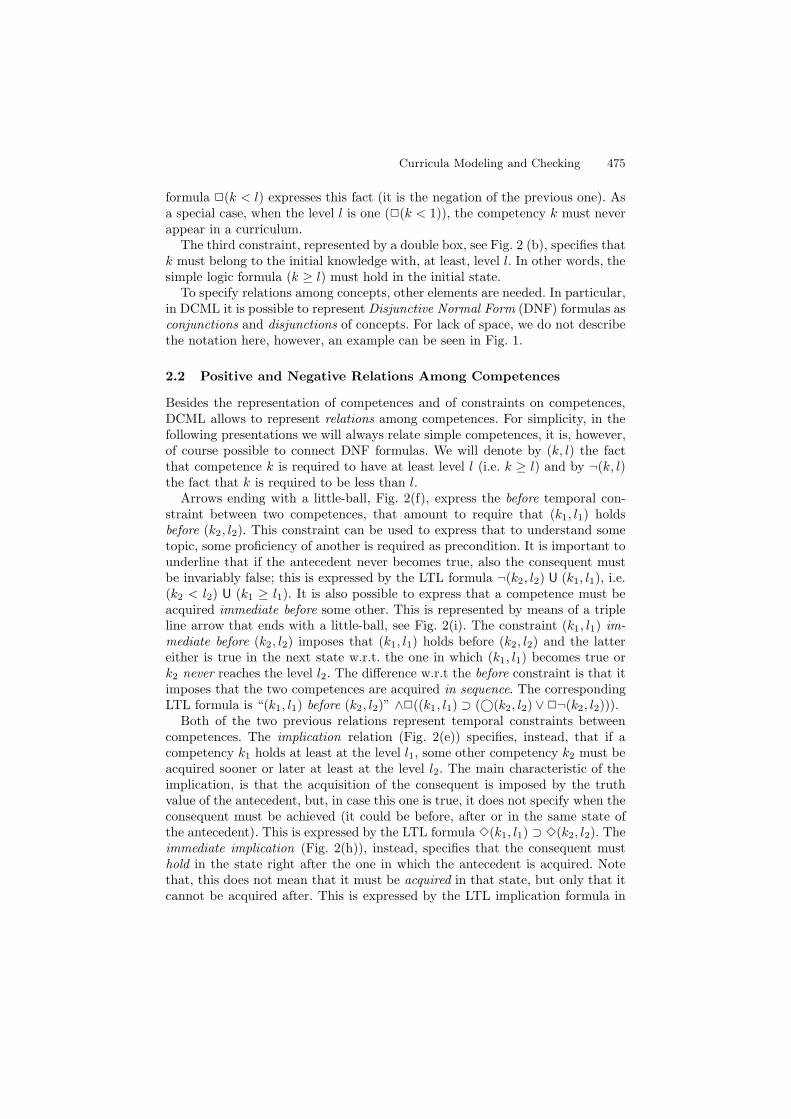
Curricula Modeling and Checking 475
formula �(k < l) expresses this fact (it is the negation of the previous one). Asa special case, when the level l is one (�(k < 1)), the competency k must neverappear in a curriculum.
The third constraint, represented by a double box, see Fig. 2 (b), specifies thatk must belong to the initial knowledge with, at least, level l. In other words, thesimple logic formula (k ≥ l) must hold in the initial state.
To specify relations among concepts, other elements are needed. In particular,in DCML it is possible to represent Disjunctive Normal Form (DNF) formulas asconjunctions and disjunctions of concepts. For lack of space, we do not describethe notation here, however, an example can be seen in Fig. 1.
2.2 Positive and Negative Relations Among Competences
Besides the representation of competences and of constraints on competences,DCML allows to represent relations among competences. For simplicity, in thefollowing presentations we will always relate simple competences, it is, however,of course possible to connect DNF formulas. We will denote by (k, l) the factthat competence k is required to have at least level l (i.e. k ≥ l) and by ¬(k, l)the fact that k is required to be less than l.
Arrows ending with a little-ball, Fig. 2(f), express the before temporal con-straint between two competences, that amount to require that (k1, l1) holdsbefore (k2, l2). This constraint can be used to express that to understand sometopic, some proficiency of another is required as precondition. It is important tounderline that if the antecedent never becomes true, also the consequent mustbe invariably false; this is expressed by the LTL formula ¬(k2, l2) U (k1, l1), i.e.(k2 < l2) U (k1 ≥ l1). It is also possible to express that a competence must beacquired immediate before some other. This is represented by means of a tripleline arrow that ends with a little-ball, see Fig. 2(i). The constraint (k1, l1) im-mediate before (k2, l2) imposes that (k1, l1) holds before (k2, l2) and the lattereither is true in the next state w.r.t. the one in which (k1, l1) becomes true ork2 never reaches the level l2. The difference w.r.t the before constraint is that itimposes that the two competences are acquired in sequence. The correspondingLTL formula is “(k1, l1) before (k2, l2)” ∧�((k1, l1) ⊃ (©(k2, l2) ∨ �¬(k2, l2))).
Both of the two previous relations represent temporal constraints betweencompetences. The implication relation (Fig. 2(e)) specifies, instead, that if acompetency k1 holds at least at the level l1, some other competency k2 must beacquired sooner or later at least at the level l2. The main characteristic of theimplication, is that the acquisition of the consequent is imposed by the truthvalue of the antecedent, but, in case this one is true, it does not specify when theconsequent must be achieved (it could be before, after or in the same state ofthe antecedent). This is expressed by the LTL formula �(k1, l1) ⊃ �(k2, l2). Theimmediate implication (Fig. 2(h)), instead, specifies that the consequent musthold in the state right after the one in which the antecedent is acquired. Notethat, this does not mean that it must be acquired in that state, but only that itcannot be acquired after. This is expressed by the LTL implication formula in

476 M. Baldoni, C. Baroglio, and E. Marengo
conjunction with the constraint that whenever k1 ≥ l1 holds, k2 ≥ l2 holds inthe next state: �(k1, l1) ⊃ �(k2, l2) ∧ �((k1, l1) ⊃ ©(k2, l2)).
The last two kinds of temporal constraint are succession (Fig. 2(g)) and im-mediate succession (Fig. 2(j)). The succession relation specifies that if (k1, l1)is acquired, afterwards (k2, l2) is also achieved; otherwise, the level of k2 is notimportant. This is a difference w.r.t. the before constraint where, when the an-tecedent is never acquired, the consequent must be invariably false. Indeed, thesuccession specifies a condition of the kind if k1 ≥ l1 then k2 ≥ l2, while be-fore represents a constraint without any conditional premise. Instead, the factthat the consequent must be acquired after the antecedent is what differen-tiates implication from succession. Succession constraint is expressed by theLTL formula �(k1, l1) ⊃ (�(k2, l2) ∧ (¬(k2, l2) U (k1, l1))). In the same way,the immediate succession imposes that the consequent either is acquired in thesame state as the antecedent or in the state immediately after (not before norlater). The immediate succession LTL formula is “(k1, l1) succession (k2, l2)”∧�((k1, l1) ⊃ ©(k2, l2)).
After the “positive relations” among competences, let us now introduce thegraphical notations for “negative relations”. The graphical representation is veryintuitive: two vertical lines break the arrow that represents the constraint, seeFig. 2(k)-(l). (k1, l1) not before (k2, l2) specifies that k1 cannot be acquired up tolevel l1 before or in the same state when (k2, l2) is acquired. The correspondingLTL formula is ¬(k1, l1) U ((k2, l2) ∧ ¬(k1, l1)). Notice that this is not obtainedby simply negating the before relation but it is weaker; the negation of beforewould impose the acquisition of the concepts specified as consequents (in fact,the formula would contain a strong until instead of a weak until), the not beforedoes not. The not immediate before is translated exactly in the same way as thenot before. Indeed, it is a special case because our domain is monotonic, that isa competency acquired at a certain level cannot be forgotten.
(k1, l1) not implies (k2, l2) expresses that if (k1, l1) is acquired k2 cannot beacquired at level l2; as an LTL formula: �(k1, l1) ⊃ �¬(k2, l2). Again, we chooseto use a weaker formula than the natural negation of the implication relationbecause the simple negation of formulas would impose the presence of certainconcepts. (k1, l1) not immediate implies (k2, l2) imposes that when (k1, l1) holdsin a state, k2 ≥ l2 must be false in the immediately subsequent state. Afterwards,the proficiency level of k2 does not matter. The corresponding LTL formulais �(k1, l1) ⊃ (�¬(k2, l2) ∨ �((k1, l1) ∧ ©¬(k2, l2))), that is weaker than the“classical negation” of the immediate implies.
The last relations are not succession, and not immediate succession. The firstimposes that a certain competence cannot be acquired after another, (eitherit was acquired before, or it will never be acquired). As LTL formula, it is�(k1, l1) ⊃ (�¬(k2, l2)∨ “(k1, l1) not before (k2, l2)”). The second imposes thatif a competence is acquired in a certain state, in the state that follows, anothercompetence must be false, that is �(k1, l1) ⊃ (�¬(k2, l2)∨ “(k1, l1) not before(k2, l2)” ∨�((k1, l1) ∧ ©¬(k2, l2))).
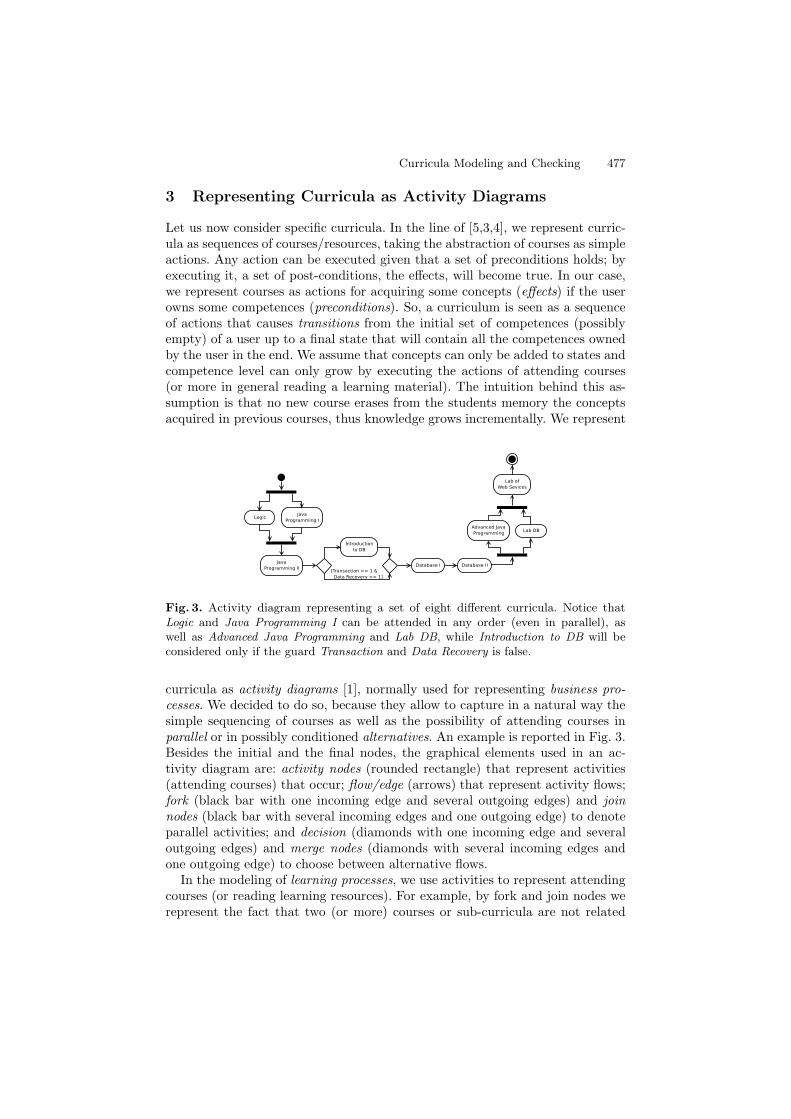
Curricula Modeling and Checking 477
3 Representing Curricula as Activity Diagrams
Let us now consider specific curricula. In the line of [5,3,4], we represent curric-ula as sequences of courses/resources, taking the abstraction of courses as simpleactions. Any action can be executed given that a set of preconditions holds; byexecuting it, a set of post-conditions, the effects, will become true. In our case,we represent courses as actions for acquiring some concepts (effects) if the userowns some competences (preconditions). So, a curriculum is seen as a sequenceof actions that causes transitions from the initial set of competences (possiblyempty) of a user up to a final state that will contain all the competences ownedby the user in the end. We assume that concepts can only be added to states andcompetence level can only grow by executing the actions of attending courses(or more in general reading a learning material). The intuition behind this as-sumption is that no new course erases from the students memory the conceptsacquired in previous courses, thus knowledge grows incrementally. We represent
Fig. 3. Activity diagram representing a set of eight different curricula. Notice thatLogic and Java Programming I can be attended in any order (even in parallel), aswell as Advanced Java Programming and Lab DB, while Introduction to DB will beconsidered only if the guard Transaction and Data Recovery is false.
curricula as activity diagrams [1], normally used for representing business pro-cesses. We decided to do so, because they allow to capture in a natural way thesimple sequencing of courses as well as the possibility of attending courses inparallel or in possibly conditioned alternatives. An example is reported in Fig. 3.Besides the initial and the final nodes, the graphical elements used in an ac-tivity diagram are: activity nodes (rounded rectangle) that represent activities(attending courses) that occur; flow/edge (arrows) that represent activity flows;fork (black bar with one incoming edge and several outgoing edges) and joinnodes (black bar with several incoming edges and one outgoing edge) to denoteparallel activities; and decision (diamonds with one incoming edge and severaloutgoing edges) and merge nodes (diamonds with several incoming edges andone outgoing edge) to choose between alternative flows.
In the modeling of learning processes, we use activities to represent attendingcourses (or reading learning resources). For example, by fork and join nodes werepresent the fact that two (or more) courses or sub-curricula are not related
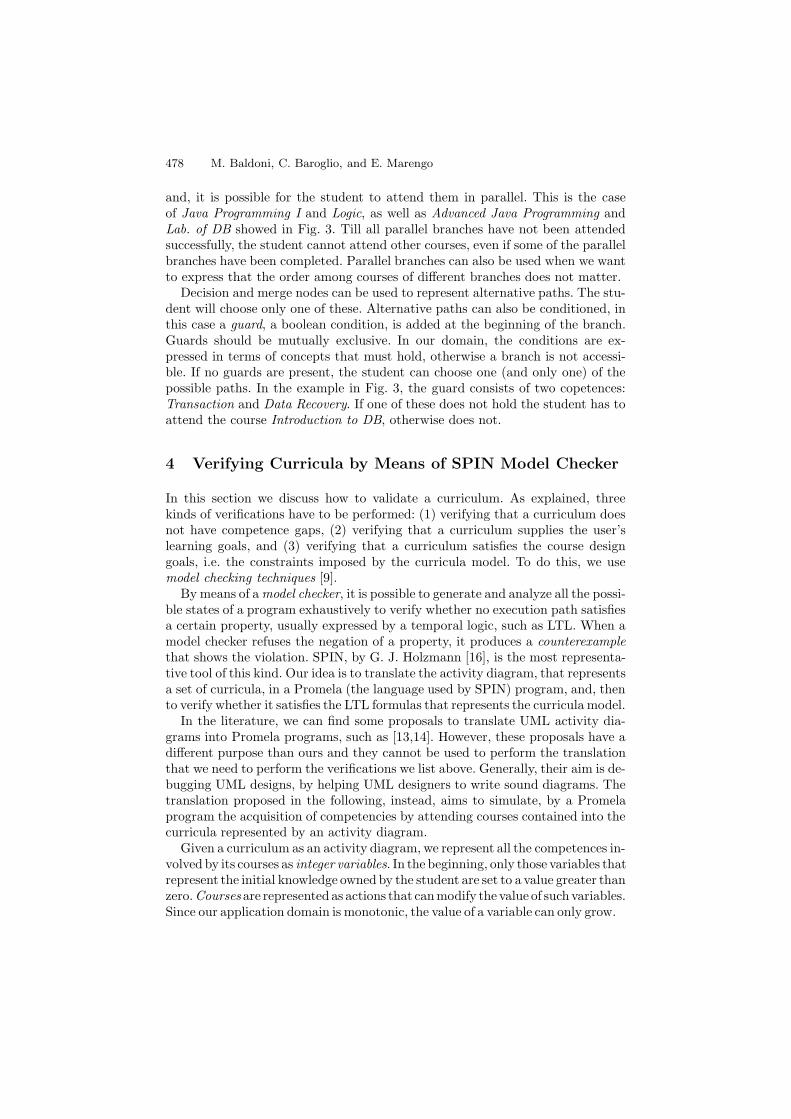
478 M. Baldoni, C. Baroglio, and E. Marengo
and, it is possible for the student to attend them in parallel. This is the caseof Java Programming I and Logic, as well as Advanced Java Programming andLab. of DB showed in Fig. 3. Till all parallel branches have not been attendedsuccessfully, the student cannot attend other courses, even if some of the parallelbranches have been completed. Parallel branches can also be used when we wantto express that the order among courses of different branches does not matter.
Decision and merge nodes can be used to represent alternative paths. The stu-dent will choose only one of these. Alternative paths can also be conditioned, inthis case a guard, a boolean condition, is added at the beginning of the branch.Guards should be mutually exclusive. In our domain, the conditions are ex-pressed in terms of concepts that must hold, otherwise a branch is not accessi-ble. If no guards are present, the student can choose one (and only one) of thepossible paths. In the example in Fig. 3, the guard consists of two copetences:Transaction and Data Recovery. If one of these does not hold the student has toattend the course Introduction to DB, otherwise does not.
4 Verifying Curricula by Means of SPIN Model Checker
In this section we discuss how to validate a curriculum. As explained, threekinds of verifications have to be performed: (1) verifying that a curriculum doesnot have competence gaps, (2) verifying that a curriculum supplies the user’slearning goals, and (3) verifying that a curriculum satisfies the course designgoals, i.e. the constraints imposed by the curricula model. To do this, we usemodel checking techniques [9].
By means of a model checker, it is possible to generate and analyze all the possi-ble states of a program exhaustively to verify whether no execution path satisfiesa certain property, usually expressed by a temporal logic, such as LTL. When amodel checker refuses the negation of a property, it produces a counterexamplethat shows the violation. SPIN, by G. J. Holzmann [16], is the most representa-tive tool of this kind. Our idea is to translate the activity diagram, that representsa set of curricula, in a Promela (the language used by SPIN) program, and, thento verify whether it satisfies the LTL formulas that represents the curricula model.
In the literature, we can find some proposals to translate UML activity dia-grams into Promela programs, such as [13,14]. However, these proposals have adifferent purpose than ours and they cannot be used to perform the translationthat we need to perform the verifications we list above. Generally, their aim is de-bugging UML designs, by helping UML designers to write sound diagrams. Thetranslation proposed in the following, instead, aims to simulate, by a Promelaprogram the acquisition of competencies by attending courses contained into thecurricula represented by an activity diagram.
Given a curriculum as an activity diagram, we represent all the competences in-volved by its courses as integer variables. In the beginning, only those variables thatrepresent the initial knowledge owned by the student are set to a value greater thanzero.Courses are represented as actions that canmodify the value of suchvariables.Since our application domain is monotonic, the value of a variable can only grow.
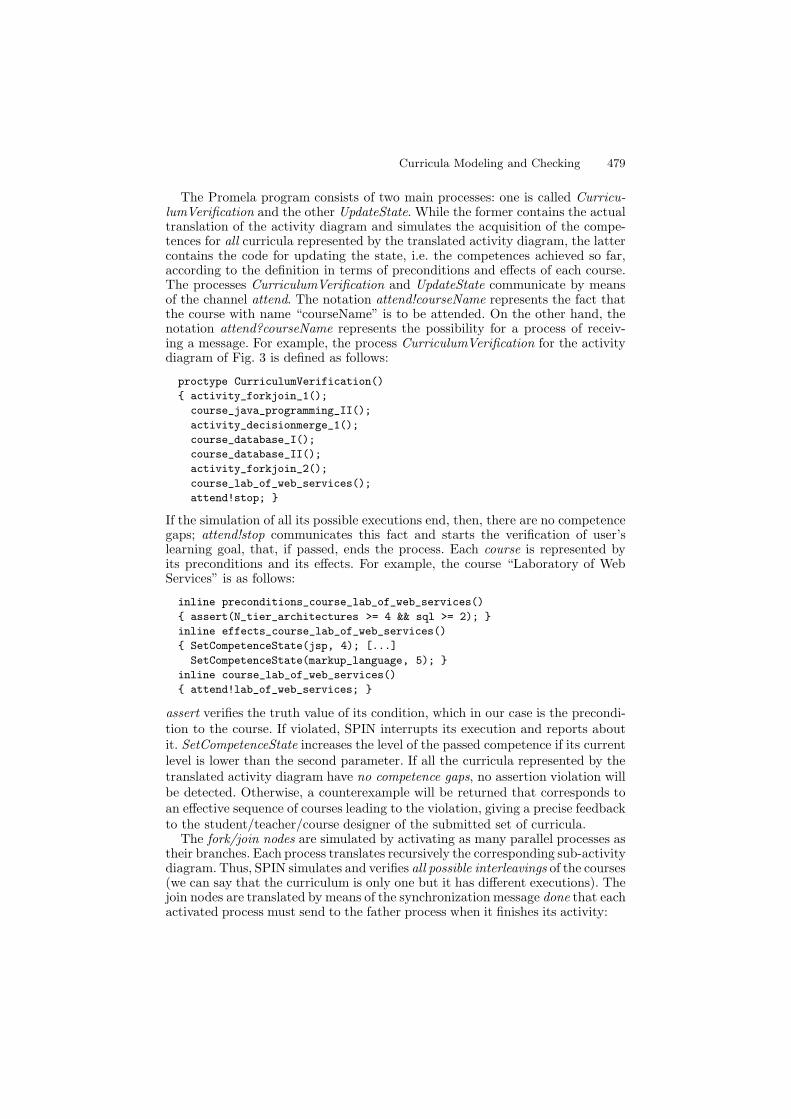
Curricula Modeling and Checking 479
The Promela program consists of two main processes: one is called Curricu-lumVerification and the other UpdateState. While the former contains the actualtranslation of the activity diagram and simulates the acquisition of the compe-tences for all curricula represented by the translated activity diagram, the lattercontains the code for updating the state, i.e. the competences achieved so far,according to the definition in terms of preconditions and effects of each course.The processes CurriculumVerification and UpdateState communicate by meansof the channel attend. The notation attend!courseName represents the fact thatthe course with name “courseName” is to be attended. On the other hand, thenotation attend?courseName represents the possibility for a process of receiv-ing a message. For example, the process CurriculumVerification for the activitydiagram of Fig. 3 is defined as follows:
proctype CurriculumVerification(){ activity_forkjoin_1();
course_java_programming_II();activity_decisionmerge_1();course_database_I();course_database_II();activity_forkjoin_2();course_lab_of_web_services();attend!stop; }
If the simulation of all its possible executions end, then, there are no competencegaps; attend!stop communicates this fact and starts the verification of user’slearning goal, that, if passed, ends the process. Each course is represented byits preconditions and its effects. For example, the course “Laboratory of WebServices” is as follows:
inline preconditions_course_lab_of_web_services(){ assert(N_tier_architectures >= 4 && sql >= 2); }inline effects_course_lab_of_web_services(){ SetCompetenceState(jsp, 4); [...]
SetCompetenceState(markup_language, 5); }inline course_lab_of_web_services(){ attend!lab_of_web_services; }
assert verifies the truth value of its condition, which in our case is the precondi-tion to the course. If violated, SPIN interrupts its execution and reports aboutit. SetCompetenceState increases the level of the passed competence if its currentlevel is lower than the second parameter. If all the curricula represented by thetranslated activity diagram have no competence gaps, no assertion violation willbe detected. Otherwise, a counterexample will be returned that corresponds toan effective sequence of courses leading to the violation, giving a precise feedbackto the student/teacher/course designer of the submitted set of curricula.
The fork/join nodes are simulated by activating as many parallel processes astheir branches. Each process translates recursively the corresponding sub-activitydiagram. Thus, SPIN simulates and verifies all possible interleavings of the courses(we can say that the curriculum is only one but it has different executions). Thejoin nodes are translated by means of the synchronization message done that eachactivated process must send to the father process when it finishes its activity:

480 M. Baldoni, C. Baroglio, and E. Marengo
proctype activity_joinfork_11(){ course_java_programming_I(); joinfork_11!done; }proctype activity_joinfork_12(){ course_logic(); joinfork_12!done; }inline activity_joinfork_1(){ run activity_joinfork_11(); run activity_joinfork_12();
joinfork_11?done; joinfork_12?done; }
Finally, decision and merge nodes are encoded by either conditioned or non-deterministic if. Each such if statement refers to a set of alternative sub-activitydiagrams (sub-curricula). Only one will be effectively attended but all of themwill be verified:
inline activity_decisionmerge_11(){ course_introduction_to_database(); }inline activity_decisionmerge_12() { skip; }inline activity_decisionmerge_1(){ if
:: (transaction >= 1 && data_recovery >= 1) ->activity_decisionmerge_12();
:: else -> activity_decisionmerge_11();fi }
On the other hand, the process UpdateState, after setting the initial competences,checks if the preconditions of the courses communicated by CurriculumVerifi-cation hold in the current state. If a course is applicable it also updates thestate. The test of the preconditions and the update of the state are performedas an atomic operation. In the end if everything is right it sends a feedback toCurriculumVerification (feedback!done):
proctype UpdateState() { SetInitialSituation();do [ ... ]:: attend?lab_of_web_services -> atomic {
preconditions_course_lab_of_web_services();effects_course_lab_of_web_services(); }
:: attend?stop -> LearningGoal(); break;od }
When attend?stop (see above) is received, the check of the user’s learning goal isperformed. This just corresponds to a test on the knowledge in the ending state:
inline LearningGoal(){ assert(advanced_java_programming>=5 && N_tier_architectures
>= 4 && relational_algebra>=2 && ER_language>=2); }
To check if the curriculum complies to a curricula model, we check if everypossibly sequence of execution of the Promela program satisfies the LTL for-mulas, now transformed into never claims directly by SPIN. For example, thecurriculum shown in Fig. 3 respects all the constraints imposed by the curriculamodel described in Fig. 1, taking into account the description of the coursessupplied at the URL above. The assertion verification takes very few secondson an old notebook; the automaton generated from the Promela program on
Curricula Modeling and Checking 481
that example has more than four-hundred states, indeed, it is very tractable.Also the verification of the temporal constraints is not hard if we check the con-straints one at the time. The above example is available for download at theURL http://www.di.unito.it/~baldoni/DCML/AIIA07.
5 Conclusions
In this paper we have introduced a graphical language to describe curricula mod-els as temporal constraints posed on the acquisition of competences (supplied bycourses), therefore, taking into account both the concepts supplied/required andthe proficiency level. We have also shown how model checking techniques can beused to verify that a curriculum complies to a curricula model, and also that acurriculum both allows the achievement of the user’s learning goals and that ithas no competence gaps. This use of model checking is inspired by [21], whereLTL formulas are used to describe and verify the properties of a composition ofWeb Services. Another recent work, though in a different setting, that inspired thisproposal is [20], where medical guidelines, represented by means of the GLAREgraphical language, are translated in a Promela program, whose properties areverified by using SPIN. Similarly to [20], the use of SPIN, gives an automa-basedsemantics to a curriculum (the automaton generated by SPIN from the Promelaprogram) and gives a declarative, formal, representation of curricula models (theset of temporal constraints) in terms of a LTL theory that enables other formsof reasoning. In fact, as for all logical theories, we can use an inference engine toderive other theorems or to discovery inconsistencies in the theory itself.
The presented proposal is an evolution of earlier works [6,3,5], where we ap-plied semantic annotations to learning objects, with the aim of building compo-sitions of new learning objects, based on the user’s learning goals and exploitingplanning techniques. That proposal was based on a different approach that reliedon the experience of the authors in the use of techniques for reasoning aboutactions and changes which, however, suffers of the limitations discussed in theintroduction. We are currently working on the automatic translation from a tex-tual representation of DCML curricula models into the corresponding set of LTLformulas and from a textual representation of an activity diagram, that describesa curriculum (comprehensive of the description of all courses involved with theirpreconditions and effects), into the corresponding Promela program. We are alsogoing to realize a graphical tool to define curricula models by means of DCML.We think to use the Eclipse framework, by IBM, to do this. In [2], we discussthe integration into the Personal Reader Framework [15] of a web service thatimplements an earlier version of the techniques explained here, which does notinclude proficiency levels.
Acknowledgements. The authorswould like to thankVivianaPatti for the help-ful discussions. This research has partially been funded by the 6th Framework Pro-gramme project REWERSE number 506779 and by the Italian MIUR PRIN 2005.
482 M. Baldoni, C. Baroglio, and E. Marengo
References
1. Unified Modeling Language: Superstructure, version 2.1.1. OMG (February 2007)2. Baldoni, M., Baroglio, C., Brunkhorst, I., Marengo, E., Patti, V.: Curriculum Se-
quencing and Validation: Integration in a Service-Oriented Architecture. In: Proc.of EC-TEL’07. LNCS, Springer, Heidelberg (2007)
3. Baldoni, M., Baroglio, C., Henze, N.: Personalization for the Semantic Web. In:Eisinger, N., Ma�luszynski, J. (eds.) Reasoning Web. LNCS, vol. 3564, pp. 173–212.Springer, Heidelberg (2005)
4. Baldoni, M., Baroglio, C., Martelli, A., Patti, V., Torasso, L.: Verifying the com-pliance of personalized curricula to curricula models in the semantic web. In: Proc.of Int.l Workshop SWP’06, at ESWC’06, pp. 53–62 (2006)
5. Baldoni, M., Baroglio, C., Patti, V.: Web-based adaptive tutoring: an approachbased on logic agents and reasoning about actions. Artificial Intelligence Re-view 22(1), 3–39 (2004)
6. Baldoni, M., Baroglio, C., Patti, V., Torasso, L.: Reasoning about learning objectmetadata for adapting SCORM courseware. In: Proc. of Int.l Workshop EAW’04,at AH 2004, Eindhoven, The Netherlands, August 2004, pp. 4–13 (2004)
7. Baldoni, M., Marengo, E.: Curricula model checking: declarative representationand verification of properties. In: Proc. of EC-TEL’07. LNCS, Springer, Heidelberg(2007)
8. Brusilovsky, P., Vassileva, J.: Course sequencing techniques for large-scale web-based education. Int. J. Cont. Engineering Education and Lifelong learning 13(1/2),75–94 (2003)
9. Clarke, O.E.M., Peled, D.: Model checking. MIT Press, Cambridge (2001)10. De Coi, J.L., Herder, E., Koesling, A., Lofi, C., Olmedilla, D., Papapetrou, O., Siber-
shi, W.: A model for competence gap analysis. In: Proc. of WEBIST 2007 (2007)11. Emerson, E.A.: Temporal and model logic. In: Handbook of Theoretical Computer
Science, vol. B, pp. 997–1072. Elsevier, Amsterdam (1990)12. Farrell, R., Liburd, S.D., Thomas, J.C.: Dynamic assebly of learning objects. In:
Proc. of WWW 2004, New York, USA (May 2004)13. del Mar Gallardo, M., Merino, P., Pimentel, E.: Debugging UML Designs with
Model Checking. Journal of Object Technology 1(2), 101–117 (2002)14. Guelfi, N., Mammar, A.: A Formal Semantics of Timed Activity Diagrams and its
PROMELA Translation. In: Proc. of APSEC’05, pp. 283–290 (2005)15. Henze, N., Krause, D.: Personalized access to web services in the semantic web. In:
The 3rd Int.l Workshop SWUI, at ISWC 2006 (2006)16. Holzmann, G.J.: The SPIN Model Checker. Addison-Wesley, Reading (2003)17. Melia, M., Pahl, C.: Automatic Validation of Learning Object Compositions. In:
Proc. of IT&T’2005: Doctoral Symposium, Carlow, Ireland (2006)18. Singh, M.P.: Agent communication languages: Rethinking the principles. IEEE
Computer 31(12), 40–47 (1998)19. Singh, M.P.: A social semantics for agent communication languages. In: Dignum,
F.P.M., Greaves, M. (eds.) Issues in Agent Communication. LNCS, vol. 1916, pp.31–45. Springer, Heidelberg (2000)
20. Terenziani, P., Giordano, L., Bottrighi, A., Montani, S., Donzella, L.: SPIN ModelChecking for the Verification of Clinical Guidelines. In: Proc. of ECAI 2006 Work-shop on AI techniques in healthcare, Riva del Garda (August 2006)
21. van der Aalst, W.M.P., Pesic, M.: DecSerFlow: Towards a Truly Declarative ServiceFlow Language. In: Bravetti, M., Nunez, M., Zavattaro, G. (eds.) WS-FM 2006.LNCS, vol. 4184, Springer, Heidelberg (2006)
Web Services System for distributed technology upgrade within an e-maintenance framework.
Eduardo Gilabert, Susana Ferreiro, Aitor Arnaiz
Fundación Tekniker, Av. Otaola 20, 20600 Eibar, Spain
{egilabert, sferreiro, aarnaiz}@tekniker.es
Abstract. Nowadays, industrial maintenance is one of the most important tasks in the industry because its cost is too high, usually due to poor maintenance decisions. Traditionally, corrective maintenance and preventive maintenance are performed, but both of them, the excessive and the lacking maintenance can be harmful. In the last years, CBM (Condition Based Maintenance) technology or predictive maintenance has appeared in order to establish whether the system will fail during some future period and then take actions to avoid consequences. This paper shows the e-maintenance platform nicknamed DYNAWeb which is part of DYNAMITE project. DYNAWeb develops a CBM system based on OSA-CBM standard over MIMOSA comprising broad of capabilities like sensing and data acquisition, signal processing, health assessment, prognosis... This platform ensures the integration of all the components (software and hardware) using different technologies (sensor technologies, wireless communication technology…) and providing them with agents and (Semantic) Web Services to allow the integration and the reuse among different applications.
Keywords: e-maintenance, CBM, OSA-CBM, MIMOSA, ontology, semantic web services, agent.
1 Introduction
Nowadays, maintenance is going through major changes. The industry is realising that the efficient use of industrial assets is a key issue in supporting our current standard of living. In this context, efficiency means producing good quality products without interrupting the production for unnecessary breakdowns.
A demand for improvements on system productivity, availability and safety is
increasing, as well as product quality and customer satisfaction. Taking into account the trend for decrease in profit margins, the importance of implementing efficient maintenance strategies becomes unquestionable. In this picture the maintenance function plays a critical role in a company’s ability to compete on the basis of cost, quality and delivery performance and maintenance is taken into account in production requirements: [1],[2].

To support this role, the maintenance concept must undergone through several major developments involving proactive considerations, which require changes in transforming traditional “fail and fix” maintenance practices to “predict and prevent” e-maintenance strategies. Such an approach takes into account the potential impact on service to customer, product quality and cost reduction [3].
E-Maintenance provides the opportunity for the 3rd generation maintenance and is
a sub-concept of e-manufacturing and e-business for supporting next generation manufacturing practices (NGMS). The success of this NGMS is based on the inclusion and application of right support technologies to lower the set up costs as well as to facilitate the integration of such technologies with existing material and personal resources. As a consequence, one of the main aims of the new EU-funded Integrated Project DYNAMITE - Dynamic Decisions in Maintenance, is to bring together a series of technologies that can be integrated in a structured way, yet flexible enough to allow the selection of a particular subset of the technologies. The DYNAWeb concept is then a platform that designs an operational interaction between technologies in the framework of a distributed information scenario, where technologies of interest may vary from a company to another.
The organisation of this paper is as follows. First, it introduces OSA-CBM
architecture, a non proprietary standard to standardize a condition based maintenance system. Next it is detailed a global view of DYNAWeb, a standardization of a new framework to be developed in DYNAMITE (Dynamic Decisions and Maintenance). DYNAWeb is based on Semantic Web Services for the e-maintenance, and its architecture concerning communication view is presented. Finally, it is included a description of main components interacting in DYNAWeb Platform: HMI, agents and Web Services, supported by ontologies.
2 OSA-CBM architecture
OSA-CBM1 (Open System Architecture for Condition Based Maintenance) is designed as an open non-proprietary CBM communications framework to provide a functional platform flexible enough to suit a broad range of applications. Standardization of a networking protocol within the community of CBM developers and users will, ideally, drive CBM suppliers to produce interchangeable hardware and software components.
The goal of OSA-CBM is the development of architecture (and data exchange conventions) that enables interoperability of CBM components. Specifications are written in different languages, such as the Unified Modelling Language and correspond to a standard architecture for moving information in a condition-based maintenance system for software engineers. The basics of the architecture are described according to seven functional layers [4]:
1 http://www.osacbm.org

Fig. 1: OSA-CBM architecture defined in 7 layers
The implementation of a CBM system usually requires the integration of a variety
of hardware and software components. Therefore, a complete CBM system may be composed of a number of functional layers or capabilities:
Layer 1 – Data Acquisition: it provides the CBM system with digitized sensor or
transducer data. Layer 2 – Data Manipulation: it performs signal transformations. Layer 3 – Condition monitoring: it receives data from sensor modules, compares
data with expected values or operations limits and generates alerts based on these limits.
Layer 4 – Health assessment: it receives data from condition monitoring and
prescribes if the health in the monitoring component, sub-system or system is degraded. Besides, it is able to generate diagnostic (based upon trends in the health history, operational status and loading and maintenance history) and propose fault possibilities too.
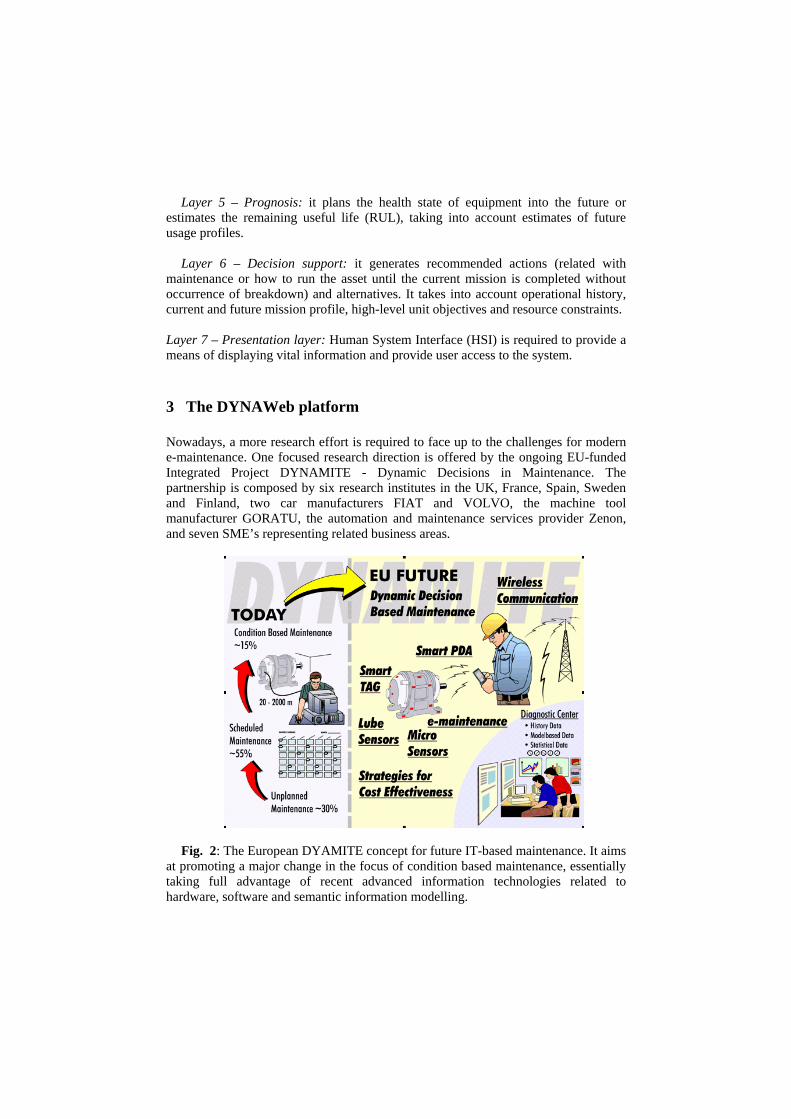
Layer 5 – Prognosis: it plans the health state of equipment into the future or estimates the remaining useful life (RUL), taking into account estimates of future usage profiles.
Layer 6 – Decision support: it generates recommended actions (related with
maintenance or how to run the asset until the current mission is completed without occurrence of breakdown) and alternatives. It takes into account operational history, current and future mission profile, high-level unit objectives and resource constraints.
Layer 7 – Presentation layer: Human System Interface (HSI) is required to provide a means of displaying vital information and provide user access to the system.
3 The DYNAWeb platform
Nowadays, a more research effort is required to face up to the challenges for modern e-maintenance. One focused research direction is offered by the ongoing EU-funded Integrated Project DYNAMITE - Dynamic Decisions in Maintenance. The partnership is composed by six research institutes in the UK, France, Spain, Sweden and Finland, two car manufacturers FIAT and VOLVO, the machine tool manufacturer GORATU, the automation and maintenance services provider Zenon, and seven SME’s representing related business areas.
Fig. 2: The European DYAMITE concept for future IT-based maintenance. It aims at promoting a major change in the focus of condition based maintenance, essentially taking full advantage of recent advanced information technologies related to hardware, software and semantic information modelling.

The main technologies expected to facilitate this upgrade are wireless devices, such as smart tags and hand-held computing devices, micro-size MEMS sensors especially designed for maintenance purposes, and low-cost on-line lubrication analysis sensors. Inside DYNAMITE project, the DYNAWeb platform [8] refers to the ICT architecture concerning software web services and communication architecture that intends to provide support to the new maintenance concept, related mainly to the lower maintenance layer indicated in next figure.
The system architecture has been defined using the standard UML2 (Unified
modelling language). In particular, use case diagrams (UCDs) have been used to describe the system functionality, and the interactions between actors and the required functions.
Fig. 3 : Use case diagram for Data acquisition & manipulation. It covers layers 1 and 2 of OSA-CBM standard: Sensor Module, which provides the system with digitized or transducer data, and Signal Processing, that receives signals and data from the sensor layer and the output includes digitally filtered sensor data, frequency spectra, virtual sensor signals and other CBM features.
In order to provide the most convenient analysis flow, information processing is understood as a distributed and collaborative system, where there are different levels of entities can undertake intelligence tasks. The UCD for data acquisition &
2 http://www.uml.org

manipulation (see Fig. 3 : Use case diagram for Data acquisition & manipulation. It covers layers 1 and 2 of OSA-CBM standard) depicts the lower end of the system architecture. It corresponds to the machine and identifies sensors and smart tags associated to this level of interoperation. It is expected to perform some intelligence tasks. Sensors can provide certain degree of reasoning, taking into account the ‘local’ scope of this processing. It is also expected that sensors hold temporal information concerning current condition values, with little or no historical information attached. On the other hand, it is argued that PDAs can hold temporal information concerning operator activities and input values, and that the Conditional Maintenance Operational System (CMOpS) will hold historical records on selected condition information.
Smart PDAs will provide higher communication interfaces with sensors, intermediate processing capabilities and a smart end for human interface to remote web services centres that will compose a distributed web platform system at the higher end of the processing hierarchy [5]. Finally, wireless data transmission between sensor devices and information processing layers will be implemented.
Another UCD has been defined for Operation, Evaluation and execution of Tasks (see Fig. 4: Use case diagram for Operation, Evaluation and Execution. It covers 3 layers of OSA-CBM standard: Condition Monitoring, health assessment and Prognostics. The diagram sets the relationships among actors and expected functionality.). The specification of this UCD includes 3 layers or modules of OSA-CBM standard [4]:
• Condition monitoring: The condition monitor receives data from the sensor modules, the signal processing modules and other condition monitors. Its primary focus is to compare data with expected values. The condition monitor should also be able to generate alerts based on preset operational limits.
• Health Assessment: it receives data from different condition monitors or from heath assessment modules. The primary focus of the health assessment module is to prescribe if the health in the monitored component, sub-system or system has degraded. The health assessment layer should be able to generate diagnosis records and propose fault possibilities. The diagnosis should be based upon trends in the health history, operational status and loading and maintenance history.
• Prognostics: this module should have the possibility to take account data from all the prior layers. The primary focus of the prognostic module is to calculate the future health of an asset, with account taken to the future usage profiles. The module should report the failure health status of a specified time or the remaining useful life (RUL)
Another important operation is “Schedule work orders”. CMMS schedules work
orders based on component predictions. After that it has to distribute work orders to different operators (PDAs). PDA need read the smart tags to know component environment.
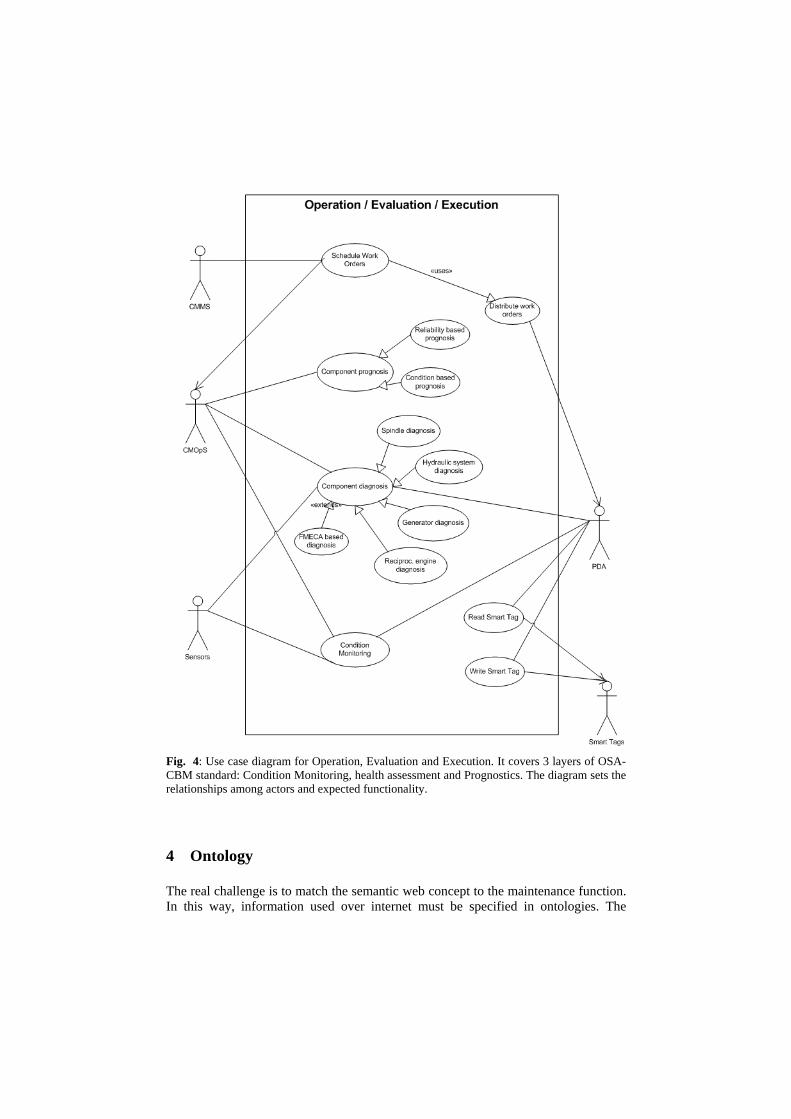
Fig. 4: Use case diagram for Operation, Evaluation and Execution. It covers 3 layers of OSA-CBM standard: Condition Monitoring, health assessment and Prognostics. The diagram sets the relationships among actors and expected functionality.
4 Ontology
The real challenge is to match the semantic web concept to the maintenance function. In this way, information used over internet must be specified in ontologies. The

ontology represents the knowledge in internet [6], defining in a formal way the concepts of the different domains and relationships, with ability to perform reasoning over this knowledge. The definition of this ontologies has been performed starting from the standard CRIS (Common Relational Information Schema) defined by MIMOSA3 (Machinery Information Management Open System Alliance).
CRIS represents a static view of the data produced by a CBM system, where every
OSA-CBM layer has been associated to an ontology [7]. OSA-CBM was developed around MIMOSA CRIS (Common Relational Information Schema) that provides coverage of the information (data) that will be managed within a condition based maintenance system. It defines a relational database schema with about 200 of tables approximately for machinery maintenance information. In short, CRIS is the core of MIMOSA which aim is the development and publication of open conventions for information exchange between plant and machinery maintenance information system.
In this sense DYNAMITE investigate the way to improve these ontologies defined
in XML language to other richer semantic ontology languages as RDF or OWL.
5 Semantic web services
Web services4 are a well known technology and widely extended which is becoming to be used in industrial environments. They provide interoperability between independent software applications over internet by means of SOAP protocol which enables the communication.
With regard to the usage of these web services, there are defined three main
elements which take part in the communication: • HMI’s actor, that is, the CMOpS, PDA or other software allocated at plant
level which interacts with operators or management staff and need the performance of a web service.
• Agent for communicating with DYNAWeb web services. Agent is able to get needed data from other sources, translating it into the ontology language. In this way, Agent acts as an interface between HMI and Web service.
• Web service, performing the requested service, supported by ontologies. A basic web service for the different OSA-CBM levels is being developed, to
demonstrate feasibility, including several implementations for different components and information coming from different sensor technologies. It is also designed a group of several agents an HMI ‘patches’ or ‘add-ins’ to show feasibility of communications and interfacing with legacy systems already in companies.
3 http://www.mimosa.org 4 http://en.wikipedia.org/wiki/Web_services

6 Distributed Agents
Associated to the actors, there are agents which perform the operations related to the communications with the semantic web services, supported by ontologies. According to this, the main functionalities of the agent in DYNAWeb are:
• Collect data from different distributed databases in the plant. • Translate data to Ontology language (XML, RDF, OWL) • Request an operation to a web service, sending the data needed. • Translate results from ontology language to normal data. • Store data results into the appropriate databases • Communication with other agents
Fig. 5: Main components in DYNAWeb: HMIs, Agents and Web Services.
In this sense, the agent acts as a link between HMI of different software installed on the plant or management offices and the semantic web services supported by ontologies. In conclusion, the agent would be associated to a specific actor (PDA, CMOpS, CMMS) inside the plant, whereas the web services would be as generic as possible, covering a functionality for a wide range of different companies.
7 Conclusions
This paper has show the DYNAWeb platform refers to the ICT architecture concerning software web services and communication architecture that intends to provide support to the new maintenance concept, in DYNAMITE project. The aim is to be able to extend the use of a selected set of rising technologies within the area of maintenance activities. This effort is performed within a flexible architecture concept to provide flexible data and information management, where core concepts such as e-maintenance and OSA-CBM architecture are followed. Web services provide generic functionalities supported by ontologies. At client side, the agents act as links among actors and the semantic web services.
Acknowledgments. The authors gratefully acknowledge the support of the European Commission Sixth Framework programme for Research and Technological Development. This paper summarises work performed as part of FP6 Integrated Project IP017498 DYNAMITE "Dynamic Decisions in Maintenance".
References
1. Al-Najjar B., Alsyouf I.: Selecting the most efficient maintenance approach using fuzzy multiple criteria decision making. International Journal of Production Economics 84, 85-100 (2003)
2. Crespo Marquez A., Gupta J.N.D.: Contemporary Maintenance Management: Process,
Framework and Supporting Pillars. Omega. 34/3, 325-338 (2006) 3. Lee J.: A framework for web-enabled e-Maintenance Systems. Proceedings of the second
international symposium on environmentally conscious design and inverse manufacturing. EcoDesign 2001.
4. Bengtsson M.: Standardization issues in condition based maintenance. Department of
Innovation, Design and Product Development, Mälardalen University, Sweden (2003). 5. Arnaiz A., Emmanouilidis C., Iung B. and Jantunen E.: Mobile Maintenance Management.
Journal of International Technology and Information Management, Vol 15 (4) 11-22 (2006). 6. Lozano A.: Ontologies in the semantic web. Jornadas de Ingeniería web. (2001) 7. Lebold M., Reichard K., S.Byington C., Orsagh R.. OSA-CBM Architecture Development
with Emphasis on XML Implementations. MARCON 2002. 8. Arnaiz A. Iung B., Jantunen E., Levat E., Gilabert E.: DYNAWeb. A web platform for
flexible provision of e-maintenance services. Harrogate. 2007.
1
Semantic Web Services for advanced maintenance strategies Authors: S. Ferreiro, E. Gilabert, A. Arnaiz Abstract: Nowadays industrial maintenance activity is mainly driven by traditional corrective strategies, combined with preventive time-based. Moreover, the cost of industries maintenance is too high and about 20% of this cost is wasted because of a poor maintenance. During the last decades ‘Condition Based Maintenance (CBM)’ strategy has appeared with the purpose to eliminate breakdowns and adjust better the maintenance intervals. Its standardization ‘Open System Architecture for Condition Based Maintenance (OSA-CBM)’ divides a CBM system in seven different layers in order to facilitate the integration and interoperability between CBM components. This paper presents the development of a (Semantic) Web Services platform which provides several intelligent processing capabilities to carry out some tasks. This platform is being developed according to OSA-CBM standard using an XML based implementation, from Condition Monitoring to Prognosis, and according to MIMOSA CRIS specification that provides broad coverage of the data types for machinery maintenance managed within CBM. Moreover, this software platform has a flexible communication infrastructure, where a generic wireless device is being also developed between sensors and some company areas where other communication options are not available. Finally, based on this architecture, a small research about several existing possibilities is presented in order to add more semantics to these Web Services in the future. This development nicknamed DYNAWeb Core, is still ongoing and it forms part of DYNAMITE project. Keywords: E-maintenance, Semantic Web, Web Services, CBM, OSA-CBM, MIMOSA CRIS, UML, ontology, XML, RDF, OWL. 1. Introduction Today maintenance is going through major changes. The industry and also the public are realising that the efficient use of industrial assets is a key issue in supporting our current standard of living. In this context, efficiency means producing good quality products without interrupting the production for unnecessary breakdowns. There is a growing demand for improvements on system productivity, availability and safety, product quality and customer satisfaction In this setting the maintenance function becomes a critical task in a company’s ability to compete on the basis of cost, quality and delivery performance (Al-Najjar and Alsyouf 2003). To support this task, the maintenance concept must undergone through several major developments involving proactive considerations, which require changes in transforming traditional “fail and fix” maintenance practices to “predict and prevent” e-maintenance strategies (Iung and Crespo 2006). Such an approach takes into account the potential impact on service to customer, product quality and cost reduction (Lee 2004). The key advantage is that maintenance is performed only when a certain level of equipment deterioration occurs rather than after a specified period of time or usage. In other words, there is a shift away from current mean-time-between failure (MTBF) practices to mean-time-between-degradation (MTBD) technologies. E-Maintenance provides the opportunity for the 3rd generation maintenance and is a sub-concept of e-manufacturing and e-business for supporting next generation manufacturing practices. The success of this 3rd generation maintenance in a wide range of companies with non-critical machinery is based on the inclusion and application of right support technologies to lower the set up costs as well as to facilitate the integration of such technologies with existing material and personal resources. As a consequence, one of the main aims of the new EU-
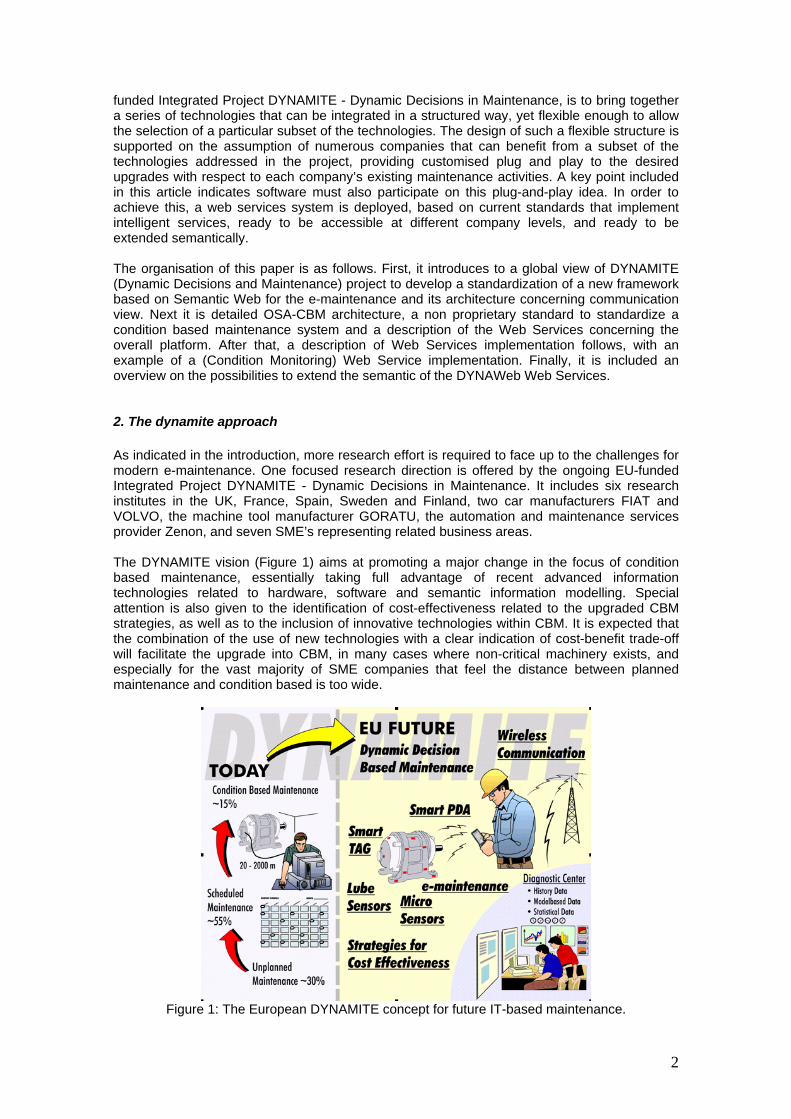
2
funded Integrated Project DYNAMITE - Dynamic Decisions in Maintenance, is to bring together a series of technologies that can be integrated in a structured way, yet flexible enough to allow the selection of a particular subset of the technologies. The design of such a flexible structure is supported on the assumption of numerous companies that can benefit from a subset of the technologies addressed in the project, providing customised plug and play to the desired upgrades with respect to each company’s existing maintenance activities. A key point included in this article indicates software must also participate on this plug-and-play idea. In order to achieve this, a web services system is deployed, based on current standards that implement intelligent services, ready to be accessible at different company levels, and ready to be extended semantically. The organisation of this paper is as follows. First, it introduces to a global view of DYNAMITE (Dynamic Decisions and Maintenance) project to develop a standardization of a new framework based on Semantic Web for the e-maintenance and its architecture concerning communication view. Next it is detailed OSA-CBM architecture, a non proprietary standard to standardize a condition based maintenance system and a description of the Web Services concerning the overall platform. After that, a description of Web Services implementation follows, with an example of a (Condition Monitoring) Web Service implementation. Finally, it is included an overview on the possibilities to extend the semantic of the DYNAWeb Web Services. 2. The dynamite approach As indicated in the introduction, more research effort is required to face up to the challenges for modern e-maintenance. One focused research direction is offered by the ongoing EU-funded Integrated Project DYNAMITE - Dynamic Decisions in Maintenance. It includes six research institutes in the UK, France, Spain, Sweden and Finland, two car manufacturers FIAT and VOLVO, the machine tool manufacturer GORATU, the automation and maintenance services provider Zenon, and seven SME’s representing related business areas. The DYNAMITE vision (Figure 1) aims at promoting a major change in the focus of condition based maintenance, essentially taking full advantage of recent advanced information technologies related to hardware, software and semantic information modelling. Special attention is also given to the identification of cost-effectiveness related to the upgraded CBM strategies, as well as to the inclusion of innovative technologies within CBM. It is expected that the combination of the use of new technologies with a clear indication of cost-benefit trade-off will facilitate the upgrade into CBM, in many cases where non-critical machinery exists, and especially for the vast majority of SME companies that feel the distance between planned maintenance and condition based is too wide.
Figure 1: The European DYNAMITE concept for future IT-based maintenance.
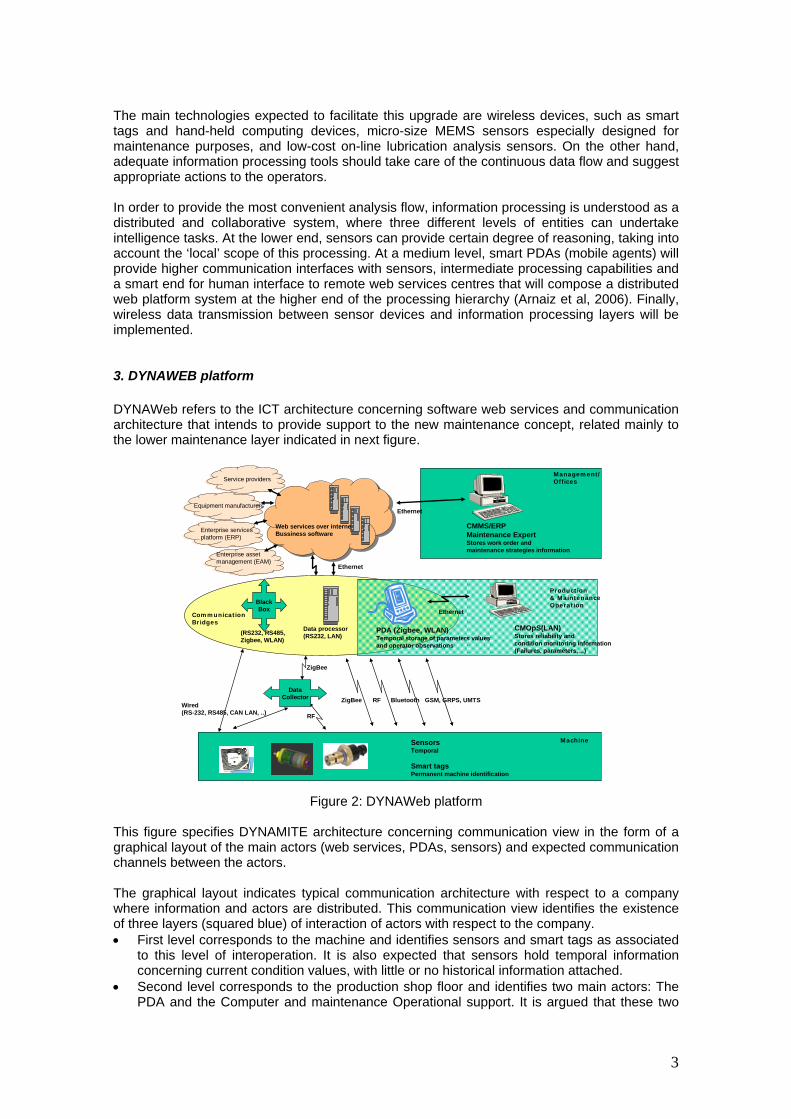
3
The main technologies expected to facilitate this upgrade are wireless devices, such as smart tags and hand-held computing devices, micro-size MEMS sensors especially designed for maintenance purposes, and low-cost on-line lubrication analysis sensors. On the other hand, adequate information processing tools should take care of the continuous data flow and suggest appropriate actions to the operators. In order to provide the most convenient analysis flow, information processing is understood as a distributed and collaborative system, where three different levels of entities can undertake intelligence tasks. At the lower end, sensors can provide certain degree of reasoning, taking into account the ‘local’ scope of this processing. At a medium level, smart PDAs (mobile agents) will provide higher communication interfaces with sensors, intermediate processing capabilities and a smart end for human interface to remote web services centres that will compose a distributed web platform system at the higher end of the processing hierarchy (Arnaiz et al, 2006). Finally, wireless data transmission between sensor devices and information processing layers will be implemented. 3. DYNAWEB platform DYNAWeb refers to the ICT architecture concerning software web services and communication architecture that intends to provide support to the new maintenance concept, related mainly to the lower maintenance layer indicated in next figure.
Service providers
Equipment manufacturers
Enterprise services platform (ERP)
Enterprise asset management (EAM)
Black Box
ZigBee
Ethernet
Web services over internetBussiness software
CMOpS(LAN)Stores reliability and condition monitoring information(Failures, parameters,…)
CMMS/ERPMaintenance ExpertStores work order and maintenance strategies information
Ethernet
Wired(RS-232, RS485, CAN LAN, ..) RF
SensorsTemporal
Smart tagsPermanent machine identification
Management/Offices
Production & MaintenanceOperation
Data processor(RS232, LAN)
PDA (Zigbee, WLAN)Temporal storage of parameters valuesand operator observations
Machine
Data Collector
CommunicationBridges
ZigBee
(RS232, RS485, Zigbee, WLAN)
Ethernet
Bluetooth GSM, GRPS, UMTSRF
Figure 2: DYNAWeb platform
This figure specifies DYNAMITE architecture concerning communication view in the form of a graphical layout of the main actors (web services, PDAs, sensors) and expected communication channels between the actors. The graphical layout indicates typical communication architecture with respect to a company where information and actors are distributed. This communication view identifies the existence of three layers (squared blue) of interaction of actors with respect to the company. • First level corresponds to the machine and identifies sensors and smart tags as associated
to this level of interoperation. It is also expected that sensors hold temporal information concerning current condition values, with little or no historical information attached.
• Second level corresponds to the production shop floor and identifies two main actors: The PDA and the Computer and maintenance Operational support. It is argued that these two

4
PDAs can hold temporal information concerning operator activities and input values, and that CMOpS will hold historical records on selected condition information.
• Third level corresponds to headquarters and management staff, where both tactical and strategic decisions are made. CMMS as well as Maintenance expert agents are located at this level, together with information concerning scheduled operations and maintenance strategies.
4. OSA_CBM architecture The implementation of a CBM system usually requires the integration of a variety of hardware and software components. Therefore, a complete CBM system may be composed of a number of functional blocks or capabilities: sensing and data acquisition, data manipulation, condition monitoring, health assessment/diagnostics, prognostics, and decision reasoning. In addition, some form of a Human System Interface (HSI) is required to provide a means of displaying vital information and provide user access to the system. Thus, there is a broad range of system level requirements that include: communication and integration with legacy systems, protection of proprietary data and algorithms, need for upgradeability, and reduction of engineering design time and costs. With these requirements in mind, OSA-CBM1 (Open System Architecture for Condition Based Maintenance) is designed as an open non-proprietary CBM communications framework to provide a functional platform flexible enough to suit a broad range of applications. Standardization of a networking protocol within the community of CBM developers and users will, ideally, drive CBM suppliers to produce interchangeable hardware and software components. The goal of OSA-CBM is the development of architecture (and data exchange conventions) that enables interoperability of CBM components. This primer is intended to cross the gap between computer scientists and program managers and systems integrators. The basis of the architecture is described according to seven functional layers (Bengtsson 2003): Layer 1 – Data Acquisition: it provides the CBM system with digitized sensor or transducer data. Layer 2 – Data Manipulation: it performs signal transformations. Layer 3 – Condition monitoring: it receives data from sensor modules, compares data with expected values or operation limits and generates alerts based on these limits. Layer 4 – Health assessment: it receives data from condition monitoring and prescribes if the health in the monitoring component, sub-system or system is degraded. Besides, it is able to generate diagnostic (based upon trends in the health history, operational status and loading and maintenance history) and propose fault possibilities too. Layer 5 – Prognosis: it plans the health state of equipment into the future or estimates the remaining useful life (RUL), taking into account estimates of future usage profiles. Layer 6 – Decision support: it generates recommended actions (related with maintenance or how to run the asset until the current mission is completed without occurrence of breakdown) and alternatives. It takes into account operational history, current and future mission profile, high-level unit objectives and resource constraints. Layer 7 – Presentation layer
1 http://www.osacbm.org
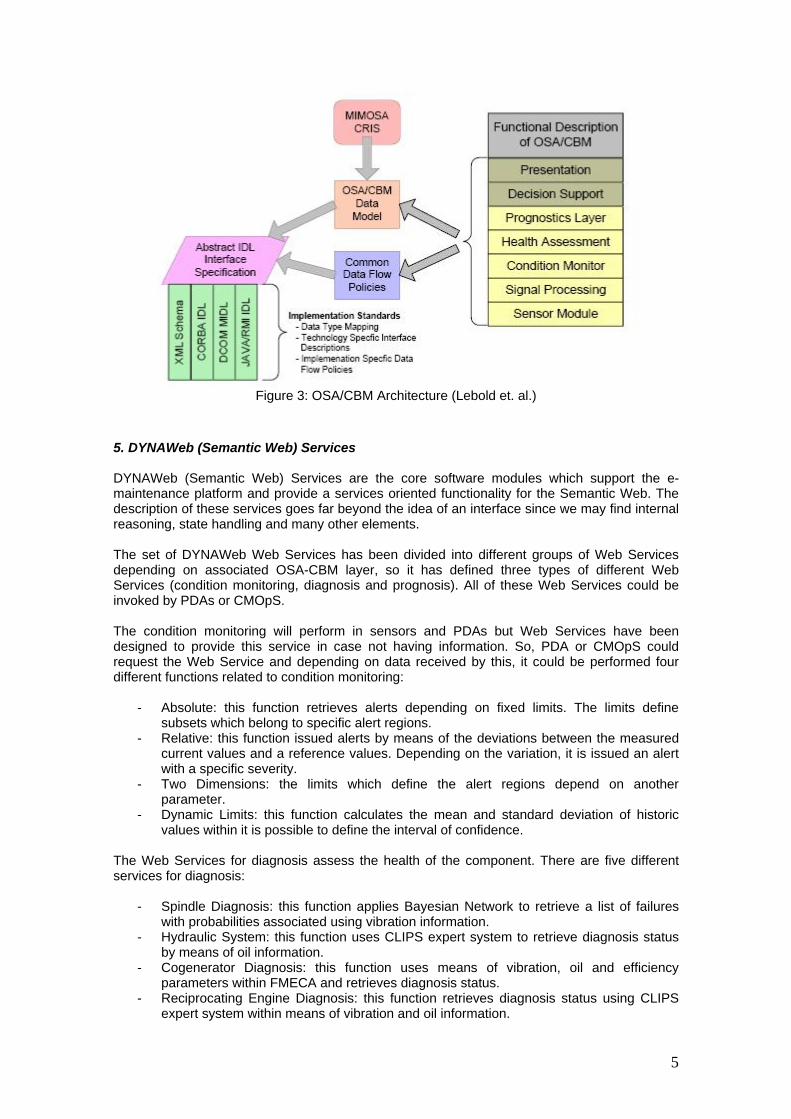
5
Figure 3: OSA/CBM Architecture (Lebold et. al.)
5. DYNAWeb (Semantic Web) Services DYNAWeb (Semantic Web) Services are the core software modules which support the e-maintenance platform and provide a services oriented functionality for the Semantic Web. The description of these services goes far beyond the idea of an interface since we may find internal reasoning, state handling and many other elements. The set of DYNAWeb Web Services has been divided into different groups of Web Services depending on associated OSA-CBM layer, so it has defined three types of different Web Services (condition monitoring, diagnosis and prognosis). All of these Web Services could be invoked by PDAs or CMOpS. The condition monitoring will perform in sensors and PDAs but Web Services have been designed to provide this service in case not having information. So, PDA or CMOpS could request the Web Service and depending on data received by this, it could be performed four different functions related to condition monitoring:
- Absolute: this function retrieves alerts depending on fixed limits. The limits define subsets which belong to specific alert regions.
- Relative: this function issued alerts by means of the deviations between the measured current values and a reference values. Depending on the variation, it is issued an alert with a specific severity.
- Two Dimensions: the limits which define the alert regions depend on another parameter.
- Dynamic Limits: this function calculates the mean and standard deviation of historic values within it is possible to define the interval of confidence.
The Web Services for diagnosis assess the health of the component. There are five different services for diagnosis:
- Spindle Diagnosis: this function applies Bayesian Network to retrieve a list of failures with probabilities associated using vibration information.
- Hydraulic System: this function uses CLIPS expert system to retrieve diagnosis status by means of oil information.
- Cogenerator Diagnosis: this function uses means of vibration, oil and efficiency parameters within FMECA and retrieves diagnosis status.
- Reciprocating Engine Diagnosis: this function retrieves diagnosis status using CLIPS expert system within means of vibration and oil information.
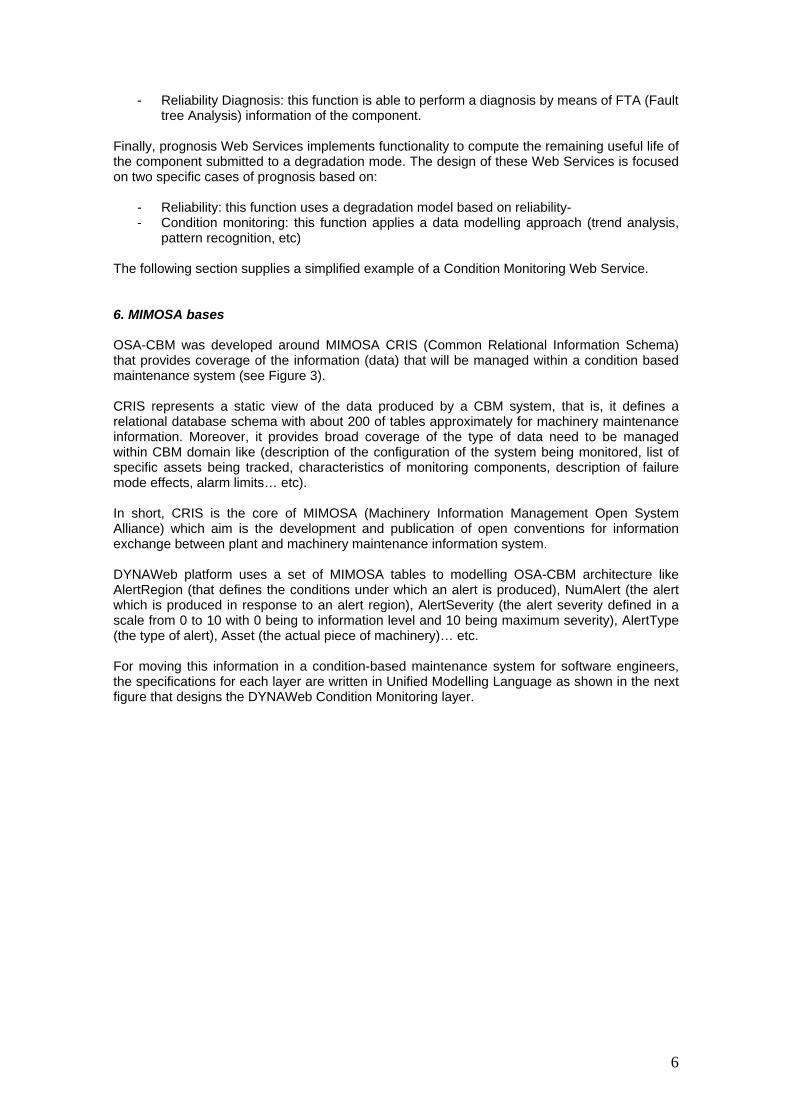
6
- Reliability Diagnosis: this function is able to perform a diagnosis by means of FTA (Fault tree Analysis) information of the component.
Finally, prognosis Web Services implements functionality to compute the remaining useful life of the component submitted to a degradation mode. The design of these Web Services is focused on two specific cases of prognosis based on:
- Reliability: this function uses a degradation model based on reliability- - Condition monitoring: this function applies a data modelling approach (trend analysis,
pattern recognition, etc) The following section supplies a simplified example of a Condition Monitoring Web Service. 6. MIMOSA bases OSA-CBM was developed around MIMOSA CRIS (Common Relational Information Schema) that provides coverage of the information (data) that will be managed within a condition based maintenance system (see Figure 3). CRIS represents a static view of the data produced by a CBM system, that is, it defines a relational database schema with about 200 of tables approximately for machinery maintenance information. Moreover, it provides broad coverage of the type of data need to be managed within CBM domain like (description of the configuration of the system being monitored, list of specific assets being tracked, characteristics of monitoring components, description of failure mode effects, alarm limits… etc). In short, CRIS is the core of MIMOSA (Machinery Information Management Open System Alliance) which aim is the development and publication of open conventions for information exchange between plant and machinery maintenance information system. DYNAWeb platform uses a set of MIMOSA tables to modelling OSA-CBM architecture like AlertRegion (that defines the conditions under which an alert is produced), NumAlert (the alert which is produced in response to an alert region), AlertSeverity (the alert severity defined in a scale from 0 to 10 with 0 being to information level and 10 being maximum severity), AlertType (the type of alert), Asset (the actual piece of machinery)… etc. For moving this information in a condition-based maintenance system for software engineers, the specifications for each layer are written in Unified Modelling Language as shown in the next figure that designs the DYNAWeb Condition Monitoring layer.
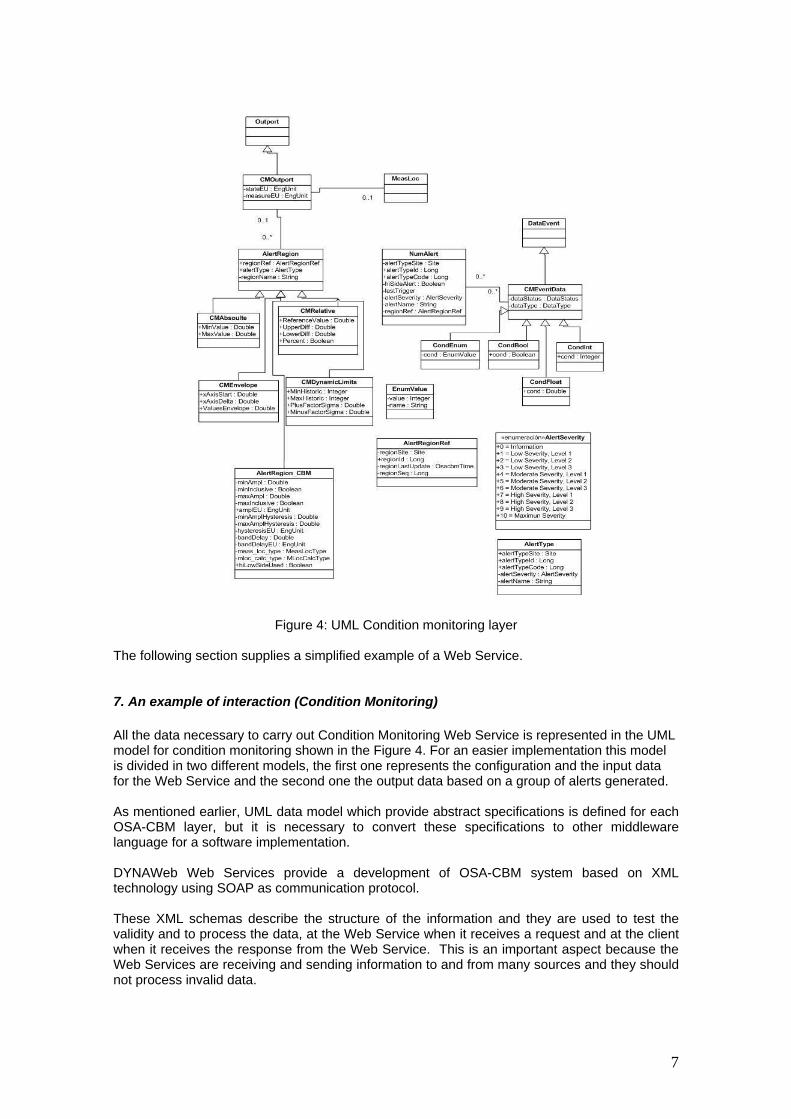
7
Figure 4: UML Condition monitoring layer The following section supplies a simplified example of a Web Service. 7. An example of interaction (Condition Monitoring) All the data necessary to carry out Condition Monitoring Web Service is represented in the UML model for condition monitoring shown in the Figure 4. For an easier implementation this model is divided in two different models, the first one represents the configuration and the input data for the Web Service and the second one the output data based on a group of alerts generated. As mentioned earlier, UML data model which provide abstract specifications is defined for each OSA-CBM layer, but it is necessary to convert these specifications to other middleware language for a software implementation. DYNAWeb Web Services provide a development of OSA-CBM system based on XML technology using SOAP as communication protocol. These XML schemas describe the structure of the information and they are used to test the validity and to process the data, at the Web Service when it receives a request and at the client when it receives the response from the Web Service. This is an important aspect because the Web Services are receiving and sending information to and from many sources and they should not process invalid data.
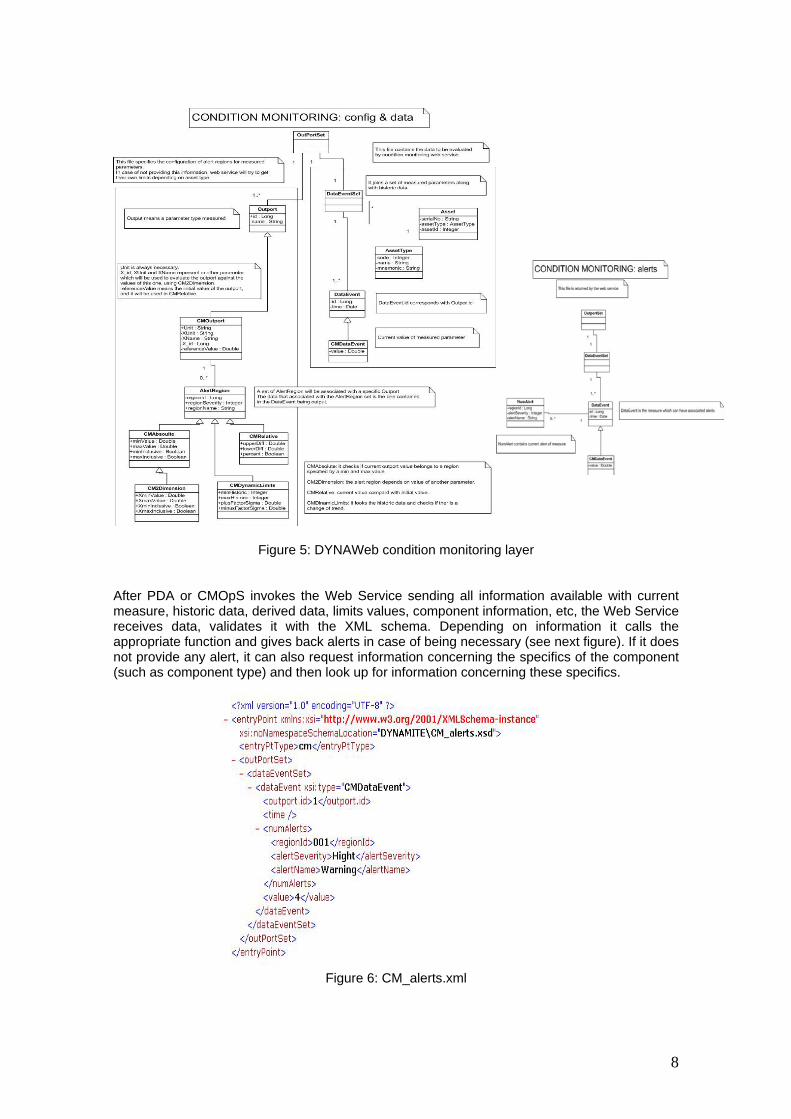
8
Figure 5: DYNAWeb condition monitoring layer
After PDA or CMOpS invokes the Web Service sending all information available with current measure, historic data, derived data, limits values, component information, etc, the Web Service receives data, validates it with the XML schema. Depending on information it calls the appropriate function and gives back alerts in case of being necessary (see next figure). If it does not provide any alert, it can also request information concerning the specifics of the component (such as component type) and then look up for information concerning these specifics.
Figure 6: CM_alerts.xml
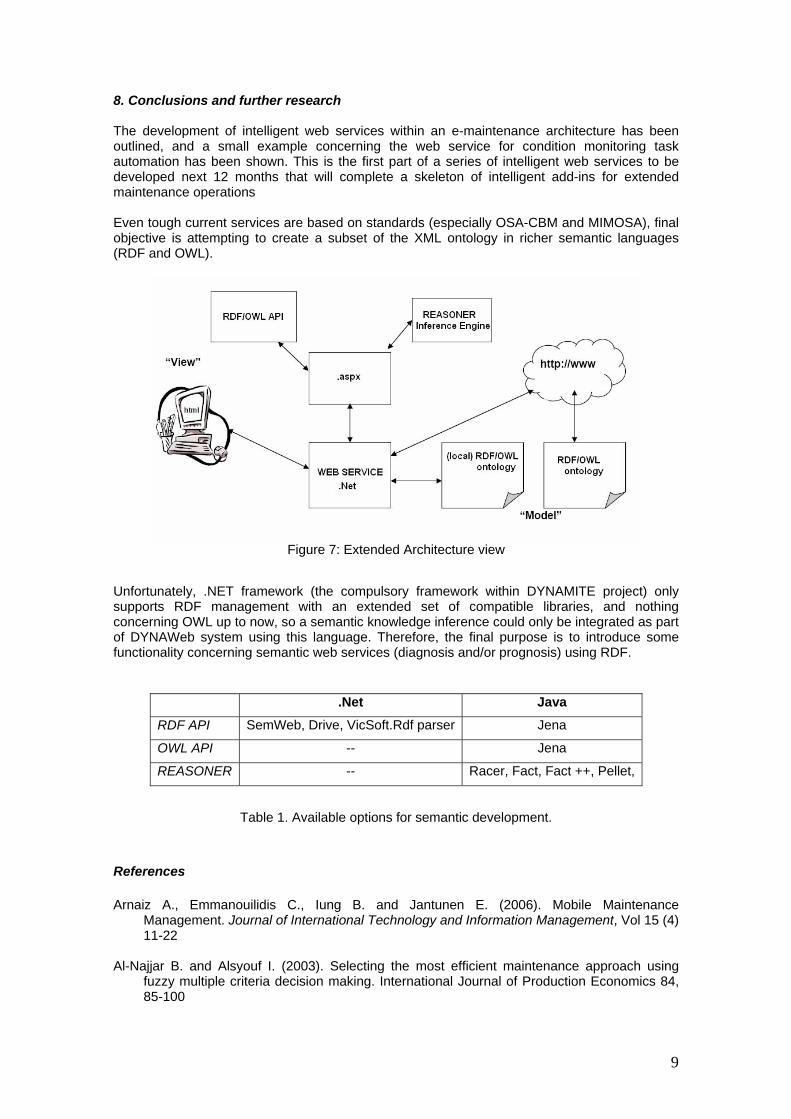
9
8. Conclusions and further research The development of intelligent web services within an e-maintenance architecture has been outlined, and a small example concerning the web service for condition monitoring task automation has been shown. This is the first part of a series of intelligent web services to be developed next 12 months that will complete a skeleton of intelligent add-ins for extended maintenance operations Even tough current services are based on standards (especially OSA-CBM and MIMOSA), final objective is attempting to create a subset of the XML ontology in richer semantic languages (RDF and OWL).
Figure 7: Extended Architecture view
Unfortunately, .NET framework (the compulsory framework within DYNAMITE project) only supports RDF management with an extended set of compatible libraries, and nothing concerning OWL up to now, so a semantic knowledge inference could only be integrated as part of DYNAWeb system using this language. Therefore, the final purpose is to introduce some functionality concerning semantic web services (diagnosis and/or prognosis) using RDF.
.Net Java RDF API SemWeb, Drive, VicSoft.Rdf parser Jena
OWL API -- Jena
REASONER -- Racer, Fact, Fact ++, Pellet,
Table 1. Available options for semantic development.
References Arnaiz A., Emmanouilidis C., Iung B. and Jantunen E. (2006). Mobile Maintenance
Management. Journal of International Technology and Information Management, Vol 15 (4) 11-22
Al-Najjar B. and Alsyouf I. (2003). Selecting the most efficient maintenance approach using
fuzzy multiple criteria decision making. International Journal of Production Economics 84, 85-100
10
Bengtsson M. (2003). “Standardization issues in condition based maintenance”, Department of Innovation, Design and Product Development, Mälardalen University, Sweden.
Crespo Marquez A. and Gupta J.N.D. (2006). Contemporary Maintenance Management:
Process, Framework and Supporting Pillars. Omega. 34/3, 325-338 Egea-Lopez E., Martinez-Sala A., Vales-Alonso J., Garcia-Haro J., Malgosa-Sanahuja J. (2005)
Wireless communications deployment in industry: a review of issues, options and technologies, Computers in Industry, Volume 56, Issue 1, January 2005, pp 29-53.
Harnett B.M., Doarn C.R., Zhao X., Merrell R.C. (2004) Redundant wireless communication
technologies for real-time surveillance, Telematics and Informatics, Volume 21, Issue 4, November 2004, pp 375-386.
Iung B., Crespo Marquez A. (2006), Special issue on emaintenance, Computers in Industry,
57(6), pp. 473-606 Komonen K. (2005). Käynnissä- ja kunnossapidon kehitys 2000-luvulla Suomessa
[Development of availability and maintenance in Finland in the present decade]. Kunnossapito 2, 52-55. (in Finnish)
Lee J., J. Ni, D. Djurdjanovic, H. Qiu and H. Liao (2006), Intelligent prognostics tools and e-
maintenance, Computers in Industry, Special issue on e-maintenance, 57(6), pp 476489 Lee J. (2001). A framework for web-enabled e-Maintenance Systems. Proceedings of the
second international symposium on environmentally conscious design and inverse manufacturing, EcoDesign’01
Wang, H. (2002). A survey of maintenance policies of deteriorating systems. European Journal
of Operational Research, 139, p. 469-489. Takata S., F. Kimura, F.J.A.M. van Houten, E. Westkämper, M. Shpitalni, D. Ceglarek, J. Lee
(2004), Maintenance: Changing Role in Life Cycle Management, Annals of the CIRP, 53/2, pp 643 – 656
Van Houten, F.J.A.M., Tomiyama, T. and Salomons, O.W. (1998). Product modelling for
model-based maintenance, Annals of the CIRP, 47/1, p. 123–129. Adolfo Lozano. (2001). Ontologies in the semantic web. Jornadas de Ingeniería web. Mitchell Lebold, Karl Reichard, Carl S.Byington, Rolf Orsagh. OSA-CBM Architecture Development with Emphasis on XML Implementations. Mitchell Lebold, Michael Thurston. Open Standards for Condition-Based Maintenance and Prognostic Systems.