Test Standard and Seismic Qualification Requirements for ...
15
1 TEST STANDARD AND SEISMIC QUALIFICATION REQUIREMENTS FOR SUSPENDED CEILINGS Amir S. J. Gilani 1 and Shakhzod M. Takhirov 2 ABSTRACT The building codes have prescriptive construction and installation requirements for suspended ceilings. Alternatively, ASCE-SEI 7 allows seismic qualification of nonstructural components by shake table testing. Such approach has been used extensively by the major manufacturers in recent years in the United States for the purpose of qualification of their products. The tests to date have followed mainly the protocol of ICC-ES AC-156, developed for a wide array of nonstructural components. However, to date, there has not been a consensus on the specific test standard for suspended ceilings that is acceptable to the manufacturers, engineers, and evaluation authorities. Such standard must address the pertinent parameters specific to the suspended ceilings such as the regularly spaced attachment points at specimen top (vs. bottom for other components), provide test results that correlate with earthquake surveys, and are applicable for a wide range of building framing and footprints. INTRODUCTION Earthquake simulator tests of suspended ceilings have been underway in the past several years. ASCE-SEI 7-05 (ASCE 2005) allows such evaluation in lieu of the code’s analytical procedure. Provisions of ICC-ES AC-156 (ICC 2007) have been used for the tests by the three major manufacturers of grid components in the United States. This test standard is primarily written for nonstructural components that are connected at a single or limited number of attachment points to the ground by a nearly rigid support. Suspended ceilings deviate from such installation in two major ways: they are attached to the ceiling and they have multiple and regular attachment points. Given these major exceptions, these components might not experience the same type of input histories as other equipment or nonstructural components as envisioned by the acceptance criterion. In the past several years, the ASTM E-06.11.18 task group has been charged with the development of a specific test standard for earthquake simulator testing of suspended ceilings. Such standard will serve several purposes, including providing uniformity in testing, and allowing evaluation organization such as ICC to have a benchmark in assessing and/or approving new products. While reviewing various versions of this document, we have formulated the opinion that with the current state of knowledge, it will not be practical to develop a robust ASTM test standard. Hence, we have recommended the adoption of a non-mandatory guideline for the time being to allow testing to continue. This review also pointed us to the direction that we believe should be followed and the steps that are necessary for the development of an acceptable test standard. 1 Miyamoto International, West Sacramento, CA 2 PEER center, University of California, Berkeley, CA
Transcript of Test Standard and Seismic Qualification Requirements for ...
1
TEST STANDARD AND SEISMIC QUALIFICATION REQUIREMENTS FOR SUSPENDED CEILINGS
Amir S. J. Gilani1 and Shakhzod M. Takhirov2
ABSTRACT
The building codes have prescriptive construction and installation requirements for suspended ceilings. Alternatively, ASCE-SEI 7 allows seismic qualification of nonstructural components by shake table testing. Such approach has been used extensively by the major manufacturers in recent years in the United States for the purpose of qualification of their products. The tests to date have followed mainly the protocol of ICC-ES AC-156, developed for a wide array of nonstructural components. However, to date, there has not been a consensus on the specific test standard for suspended ceilings that is acceptable to the manufacturers, engineers, and evaluation authorities. Such standard must address the pertinent parameters specific to the suspended ceilings such as the regularly spaced attachment points at specimen top (vs. bottom for other components), provide test results that correlate with earthquake surveys, and are applicable for a wide range of building framing and footprints.
INTRODUCTION
Earthquake simulator tests of suspended ceilings have been underway in the past several years. ASCE-SEI 7-05 (ASCE 2005) allows such evaluation in lieu of the code’s analytical procedure. Provisions of ICC-ES AC-156 (ICC 2007) have been used for the tests by the three major manufacturers of grid components in the United States. This test standard is primarily written for nonstructural components that are connected at a single or limited number of attachment points to the ground by a nearly rigid support. Suspended ceilings deviate from such installation in two major ways: they are attached to the ceiling and they have multiple and regular attachment points. Given these major exceptions, these components might not experience the same type of input histories as other equipment or nonstructural components as envisioned by the acceptance criterion. In the past several years, the ASTM E-06.11.18 task group has been charged with the development of a specific test standard for earthquake simulator testing of suspended ceilings. Such standard will serve several purposes, including providing uniformity in testing, and allowing evaluation organization such as ICC to have a benchmark in assessing and/or approving new products. While reviewing various versions of this document, we have formulated the opinion that with the current state of knowledge, it will not be practical to develop a robust ASTM test standard. Hence, we have recommended the adoption of a non-mandatory guideline for the time being to allow testing to continue. This review also pointed us to the direction that we believe should be followed and the steps that are necessary for the development of an acceptable test standard.
1 Miyamoto International, West Sacramento, CA 2 PEER center, University of California, Berkeley, CA
2
Such standard would rely on the test results from a large test frame (Reinhorn 2009), once that data becomes available as well as analytical simulations and strong motion data recorded in past earthquakes. We will present our proposed outline of such standard in this paper. Obviously, we were unable to complete, or even take on a major step towards, the completion of such standard. Nonetheless, we undertook some preliminary steps in that direction. These findings are also presented.
RECENT EXPERIMENTAL INVESTIGATIONS
Overview
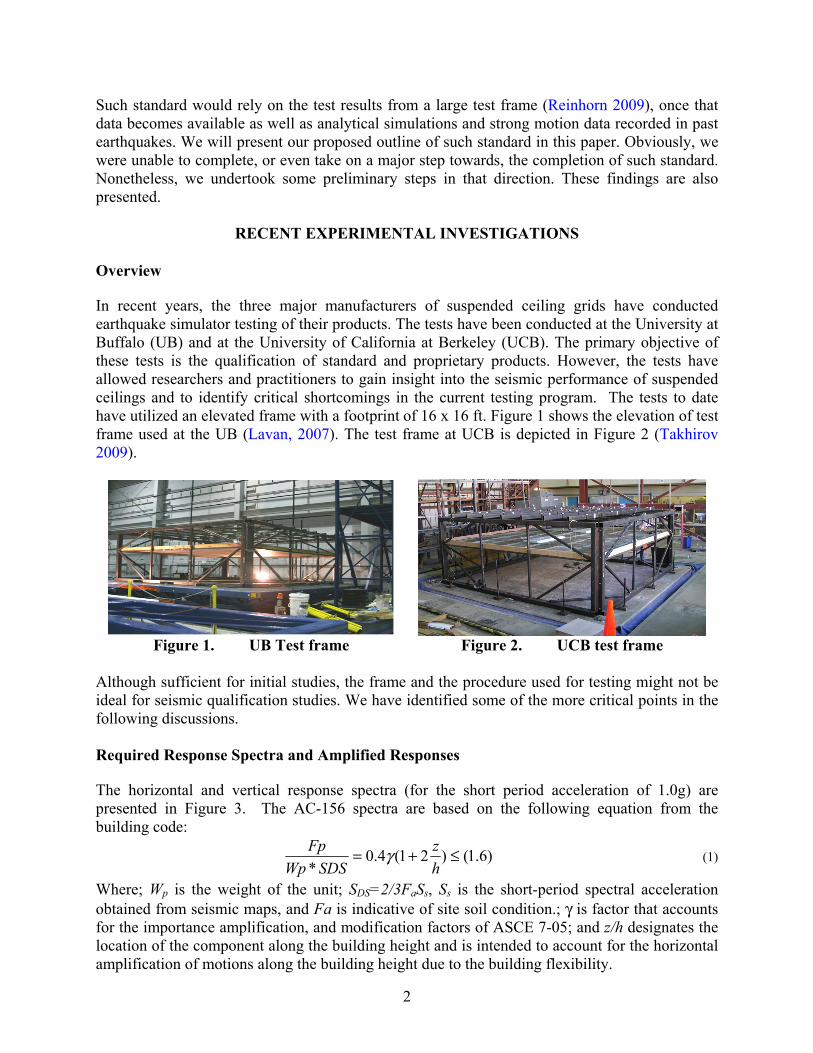
In recent years, the three major manufacturers of suspended ceiling grids have conducted earthquake simulator testing of their products. The tests have been conducted at the University at Buffalo (UB) and at the University of California at Berkeley (UCB). The primary objective of these tests is the qualification of standard and proprietary products. However, the tests have allowed researchers and practitioners to gain insight into the seismic performance of suspended ceilings and to identify critical shortcomings in the current testing program. The tests to date have utilized an elevated frame with a footprint of 16 x 16 ft. Figure 1 shows the elevation of test frame used at the UB (Lavan, 2007). The test frame at UCB is depicted in Figure 2 (Takhirov 2009).
Figure 1. UB Test frame Figure 2. UCB test frame
Although sufficient for initial studies, the frame and the procedure used for testing might not be ideal for seismic qualification studies. We have identified some of the more critical points in the following discussions.
Required Response Spectra and Amplified Responses
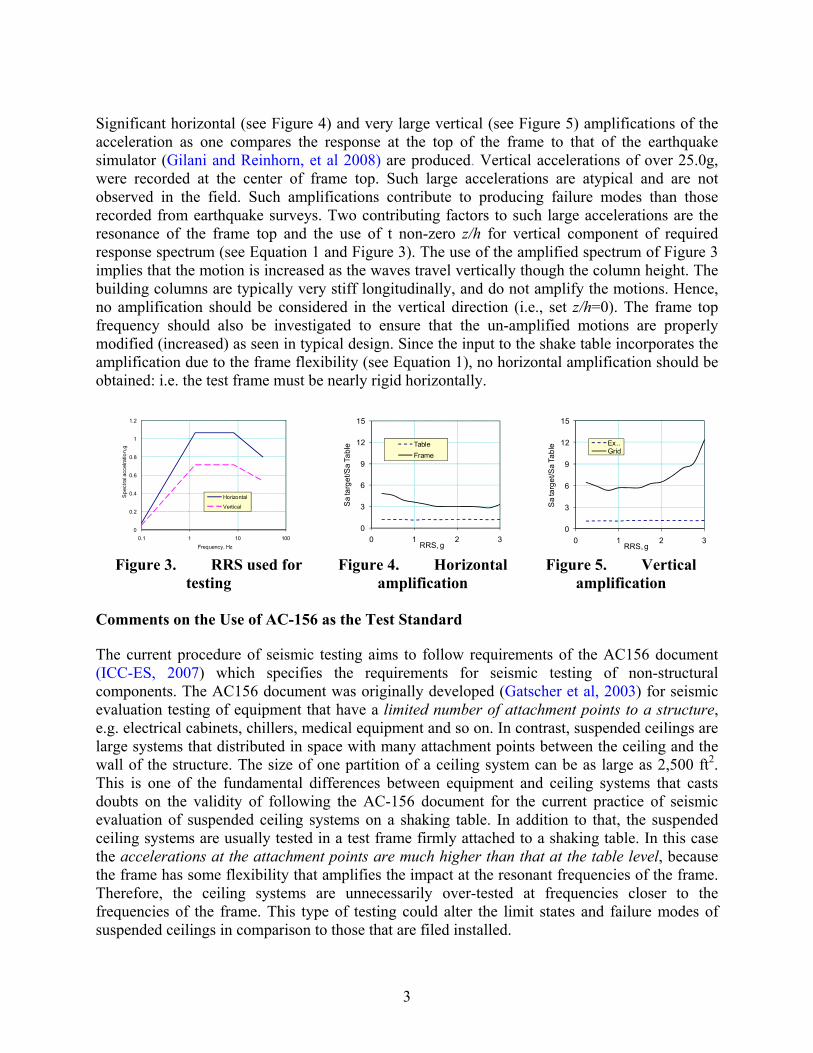
The horizontal and vertical response spectra (for the short period acceleration of 1.0g) are presented in Figure 3. The AC-156 spectra are based on the following equation from the building code:
)6.1()21(4.0*
≤+=hz
SDSWpFp γ (1)
Where; Wp is the weight of the unit; SDS=2/3FaSs, Ss is the short-period spectral acceleration obtained from seismic maps, and Fa is indicative of site soil condition.; γ is factor that accounts for the importance amplification, and modification factors of ASCE 7-05; and z/h designates the location of the component along the building height and is intended to account for the horizontal amplification of motions along the building height due to the building flexibility.
3
Significant horizontal (see Figure 4) and very large vertical (see Figure 5) amplifications of the acceleration as one compares the response at the top of the frame to that of the earthquake simulator (Gilani and Reinhorn, et al 2008) are produced. Vertical accelerations of over 25.0g, were recorded at the center of frame top. Such large accelerations are atypical and are not observed in the field. Such amplifications contribute to producing failure modes than those recorded from earthquake surveys. Two contributing factors to such large accelerations are the resonance of the frame top and the use of t non-zero z/h for vertical component of required response spectrum (see Equation 1 and Figure 3). The use of the amplified spectrum of Figure 3 implies that the motion is increased as the waves travel vertically though the column height. The building columns are typically very stiff longitudinally, and do not amplify the motions. Hence, no amplification should be considered in the vertical direction (i.e., set z/h=0). The frame top frequency should also be investigated to ensure that the un-amplified motions are properly modified (increased) as seen in typical design. Since the input to the shake table incorporates the amplification due to the frame flexibility (see Equation 1), no horizontal amplification should be obtained: i.e. the test frame must be nearly rigid horizontally.
0
0.2
0.4
0.6
0.8
1
1.2
0.1 1 10 100
Spe
ctra
l acc
elra
tion,
g
Frequency, Hz
Horizontal
Vertical
0
3
6
9
12
15
0 1 2 3
Sa
targ
et/S
a Ta
ble
RRS, g
TableFrame
0
3
6
9
12
15
0 1 2 3S
a ta
rget
/Sa
Tabl
eRRS, g
Ex…Grid
Figure 3. RRS used for testing
Figure 4. Horizontal amplification
Figure 5. Vertical amplification
Comments on the Use of AC-156 as the Test Standard
The current procedure of seismic testing aims to follow requirements of the AC156 document (ICC-ES, 2007) which specifies the requirements for seismic testing of non-structural components. The AC156 document was originally developed (Gatscher et al, 2003) for seismic evaluation testing of equipment that have a limited number of attachment points to a structure, e.g. electrical cabinets, chillers, medical equipment and so on. In contrast, suspended ceilings are large systems that distributed in space with many attachment points between the ceiling and the wall of the structure. The size of one partition of a ceiling system can be as large as 2,500 ft2. This is one of the fundamental differences between equipment and ceiling systems that casts doubts on the validity of following the AC-156 document for the current practice of seismic evaluation of suspended ceiling systems on a shaking table. In addition to that, the suspended ceiling systems are usually tested in a test frame firmly attached to a shaking table. In this case the accelerations at the attachment points are much higher than that at the table level, because the frame has some flexibility that amplifies the impact at the resonant frequencies of the frame. Therefore, the ceiling systems are unnecessarily over-tested at frequencies closer to the frequencies of the frame. This type of testing could alter the limit states and failure modes of suspended ceilings in comparison to those that are filed installed.
4
It is worthy to note that the AC-156 document (ICC-ES, 2007) requires the measurement of anchoring loads at each attachment point. Since the number of attachment points of suspended ceiling systems is very large and the method of attachment is quite complex the current practice does not measure the anchoring loads at each attachment point. The aim of this section of the paper is to demonstrate shortcomings of the current practice of suspended ceiling systems’ seismic testing. This section is based on a case study of typical seismic testing conducted at PEER, the University of California, Berkeley.
Comments on the Test Frame and Its Flexibility
Suspended ceiling systems are commonly tested in a test frame firmly attached to a shaking table. A 16 ft. (4.88 m) by 16 ft. (4.88 m) square steel frame for testing suspended ceiling systems was developed at the University at Buffalo, Buffalo, New York (Gulec and Whittaker, 2007). A similar frame was built at the PEER center (Takhirov 2009) which was used in series of testing of suspended ceiling systems (reference here). The global view of the frames attached to the shaking table and ready for installation of suspended ceiling system is shown in Figure 1 and Figure 2. The test frame has relative rigid walls and somewhat flexible roof system. The frequencies of the frame with and without the ceiling system measured at certain locations are presented in Table 1. Note that the addition of the ceiling weight alters the vertical frequency significantly.
Table 1. Resonant test frame frequencies (Hz) with and without suspended ceiling Location West Center North
Configuration X Y Z X Y Z X Y Z Frame alone NA NA NA 21.4 20.1 13.6 NA NA NA
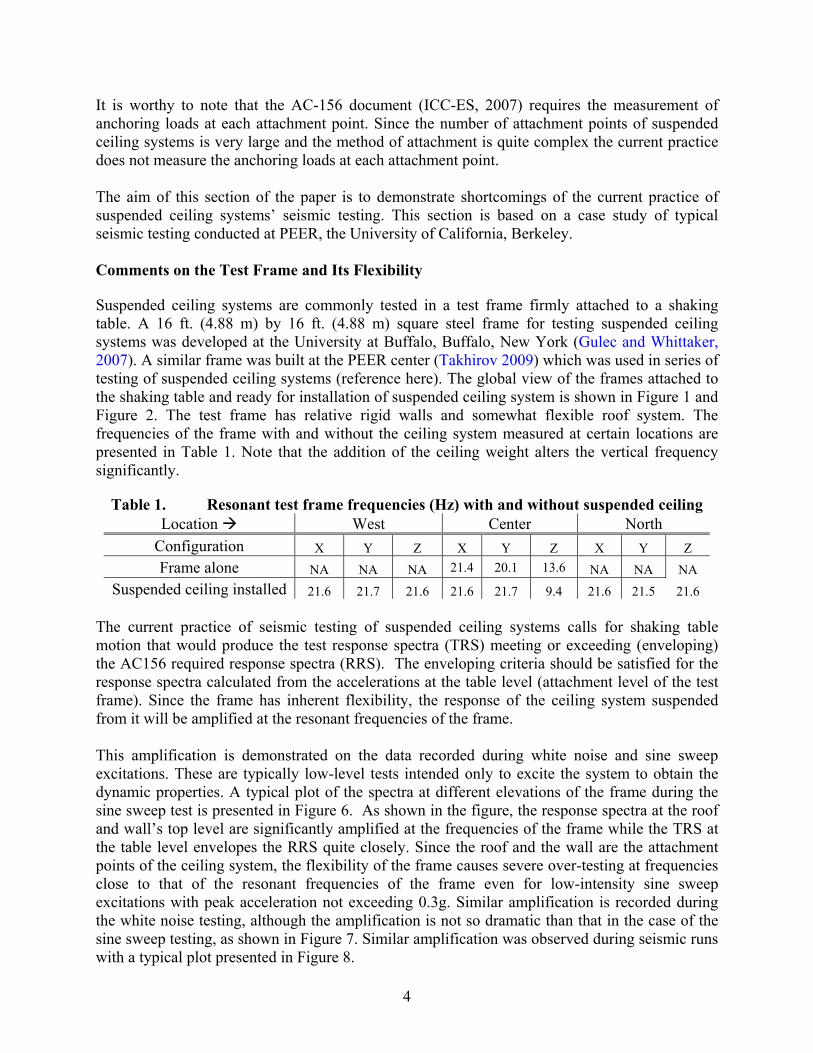
Suspended ceiling installed 21.6 21.7 21.6 21.6 21.7 9.4 21.6 21.5 21.6 The current practice of seismic testing of suspended ceiling systems calls for shaking table motion that would produce the test response spectra (TRS) meeting or exceeding (enveloping) the AC156 required response spectra (RRS). The enveloping criteria should be satisfied for the response spectra calculated from the accelerations at the table level (attachment level of the test frame). Since the frame has inherent flexibility, the response of the ceiling system suspended from it will be amplified at the resonant frequencies of the frame. This amplification is demonstrated on the data recorded during white noise and sine sweep excitations. These are typically low-level tests intended only to excite the system to obtain the dynamic properties. A typical plot of the spectra at different elevations of the frame during the sine sweep test is presented in Figure 6. As shown in the figure, the response spectra at the roof and wall’s top level are significantly amplified at the frequencies of the frame while the TRS at the table level envelopes the RRS quite closely. Since the roof and the wall are the attachment points of the ceiling system, the flexibility of the frame causes severe over-testing at frequencies close to that of the resonant frequencies of the frame even for low-intensity sine sweep excitations with peak acceleration not exceeding 0.3g. Similar amplification is recorded during the white noise testing, although the amplification is not so dramatic than that in the case of the sine sweep testing, as shown in Figure 7. Similar amplification was observed during seismic runs with a typical plot presented in Figure 8.
5
100
101
0
1
2
3
4
5
6
7
8
9
10Sp
ectra
l acc
eler
atio
n, g
Frequency, Hz
Direction: X
100
101
0
0.5
1
1.5
2
2.5
3
3.5
4
Frequency, Hz
Spec
tral a
ccel
erat
ion,
g
Direction: Z
AC156
TableFrame: North
Frame: Center
10
010
10
0.2
0.4
0.6
0.8
1
1.2
1.4
1.6
1.8
2
Spec
tral a
ccel
erat
ion,
g
Frequency, Hz
Direction: X
100
101
0
0.1
0.2
0.3
0.4
0.5
0.6
0.7
0.8
0.9
1
Frequency, Hz
Spec
tral a
ccel
erat
ion,
g
Direction: Z
AC156
TableFrame: North
Frame: Center
Figure 6. Amplification of response
spectra due to frame properties (sine-sweep tests)
Figure 7. Amplification of response spectra due to frame properties (White-
noise tests) The flexibility of the frame fails to follow the main idea behind the AC156 development (Gatscher et al, 2003) which is to test non-structural components rigidly attached to the shaking table. In this methodology, amplified motions are input to the shake table to account for the flexibility of the mounting frame. The amplified motions were intended to envelop all possible effects of building’s dynamic properties and flexibility, and hence simulate the amplification during an earthquake. In our opinion, the sine sweep excitation is more effective in resonant frequency estimation because the frequency of the excitation is time dependent and it slowly sweeps from low to high frequencies. In this case, the vibrations of different elements of the system can be clearly separated in time both numerically and visually. For instance, the resonant frequencies of the grid and the frame can be clearly isolated while it is difficult to do so in white noise tests because the signal is randomly generated. Since the sine sweep imposes several cycles of the same frequency and is harsh on non-structural components, we recommend limiting the amplitude of the target peak acceleration to 0.1 g for this resonance search test in order to avoid damage to components in the current test method.
Comments on the Grid Resonance Frequencies
Figure 9 shows the resonant frequencies of the grid compared to that of the walls during sine sweep excitation. The grid acceleration and grid’s displacement relative to the south wall have the same peak spectral Fast Fourier Transform (FFT) amplitudes at 13.5 Hz, whereas the south and north walls’ resonant frequencies are close to 21.5 Hz (all for X-direction). It is noted that he measured damping in the grid is larger than that of the walls, as expected.

6
100
101
0
1
2
3
4
5
6
7
8
9
Spec
tral a
ccel
erat
ion,
g
Frequency, Hz
Direction: X
100
101
0
1
2
3
4
5
6
7
8
Frequency, HzSp
ectra
l acc
eler
atio
n, g
Direction: Z
AC156
TableFrame: North
Frame: Center
100
101
0
50
100
150
200
250
300
350
400
450
Frequency, Hz
FF
Ts
of a
ccel
erat
ions
and
dis
plac
emen
ts
AccGridX
AccSouthXDispX:Grid vs. South(x10)
Figure 8. Amplification of response
spectra due to frame properties (Ss = 1.75 test)
Figure 9. Fourier transform of the grid acceleration, grid displacement
relative to south wall, and south walls
Comments on the Cycle Counts in Grid Displacement.
The ASTM cycle counting procedure (ASTM, 1997 and Downing et al, 1982) is used to count number of cycles in the relative displacement record. The position transducer was recording displacement of the grid relative to the south wall in the X direction. The plot for Ss=1.75 is shown in Figure 10, whereas Figure 11 shows the cycle count for Ss=2.30 run. Both plots show that the grid experiences quite a large number of small amplitude cycles and a limited number of large amplitude cycles. In the practice of component testing of the suspended ceiling systems a detailed study on cycle counts is necessary to develop an appropriate test loading protocol of the components.
0 0.2 0.4 0.6 0.8 10
5
10
15
20
25
30
35
40
45
50
Cycle magnitude: ratio to max displacement recorded at 0.146-in
Num
ber o
f cyc
les
0 0.2 0.4 0.6 0.8 1
0
10
20
30
40
50
60
70
Cycle magnitude: ratio to max displacement recorded at 0.224-in
Num
ber o
f cyc
les
Figure 10. Cycle counts at Ss=1.75. Figure 11. Cycle counts at Ss=2.30.
Comments on the Force Estimate in Grid
The data obtained during the sine sweep test was very valuable for estimation of force versus displacement relationship for the cross tee on which the position transducer was installed. Since no strain gages were installed on the grid and load in the tee was not directly measured during the test, the inertia force imposed on the tee can be estimated based on the difference between the frame wall (floating side) acceleration and grid acceleration.
7
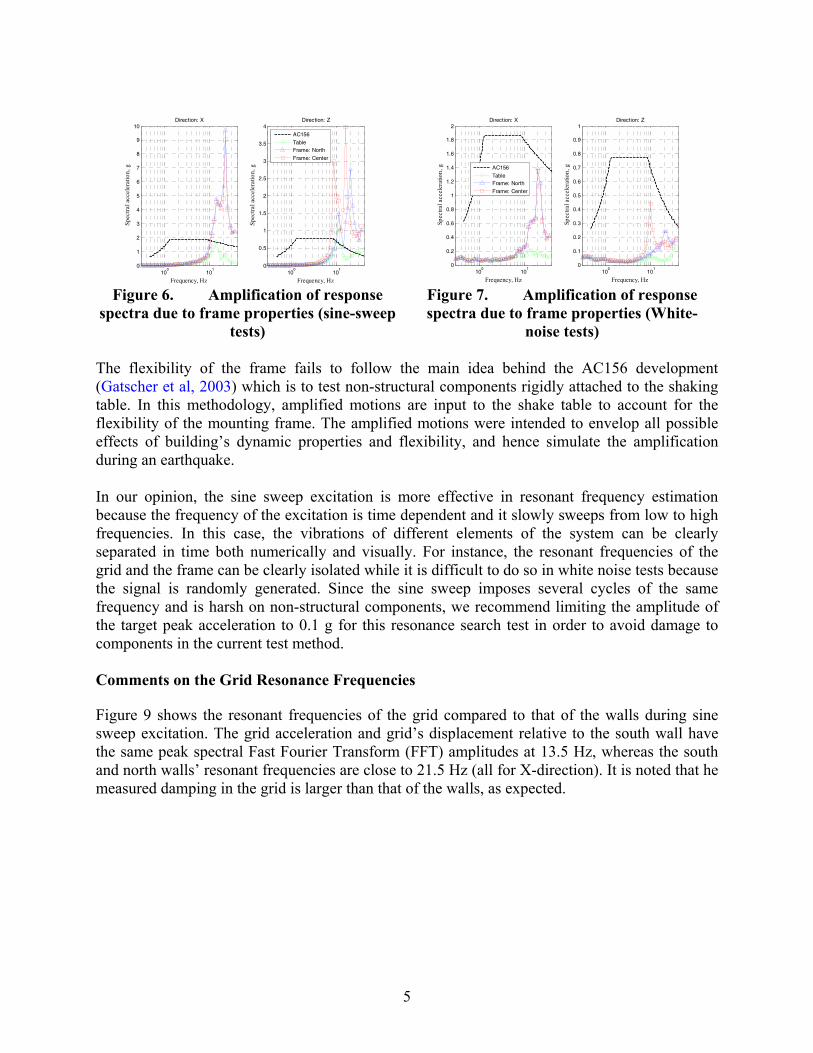
The portion of the grid displacement time history which had clear and regular cycles at 13.5 Hz (resonance frequency of the grid displacement) was selected from the grid displacement record for further analysis. The displacement versus relative acceleration curves for a single cycle and several cycles at this frequency are shown in Figure 12. The curves show that the cycles are quite regular and repeat themselves within some tolerance. Similar displacement-acceleration plots were extracted from the triaxial seismic tests. Two sets of results are derived from two different tests with Ss=1.75 and Ss=2.30 are presented in Figure 13. As it can be seen from the plots the acceleration exceeds 3.0g for Ss=1.75 test and 4.0g for Ss=2.30 test. For common 2.5 psf tiles, the total weight of the suspended ceiling would be approximately 800 lbs, including the weight of the grids and light fixtures. On each floating side, there were 8 Tees, the inertia force to each tee would be about 100 lbs at 1.0g accelerations. In the Ss=1.75 test it would be at least 3 times greater (300 lbs), and in Ss=2.30 test it would be at least 4 times larger (400 lbs). Correlation of such estimated forces with the building code prescribed values would be useful.
-0.06 -0.04 -0.02 0 0.02 0.04 0.06-1.5
-1
-0.5
0
0.5
1
1.5Single cycle
Grid relative displacement, in
Grid
acc
eler
atio
n re
lativ
e to
flo
atin
g w
all,
G
-0.06 -0.04 -0.02 0 0.02 0.04 0.06-1.5
-1
-0.5
0
0.5
1
1.5Many cycles
Grid relative displacement, in -0.1 -0.05 0 0.05 0.1 0.15
-3
-2
-1
0
1
2
3
Ss=1.75
Grid relative displacement, in
Grid
acc
eler
atio
n re
lativ
e to
flo
atin
g w
all,
G
-0.2 -0.1 0 0.1 0.2
-4
-3
-2
-1
0
1
2
3
4
Ss=2.3
Grid relative displacement, in Figure 12. Displacement cycles at 13.5
Hz (sine sweep excitation). Figure 13. Displacement cycles in seismic
tests at Ss=1.75 (left) and Ss=2.30 (right).
COMPONENTS OF A TEST PROTOCOL AND QUALIFICATION STANDARD
Overview
We propose that the following steps—and seek input from other researchers—be considered when a test standard for the seismic qualification of the suspended ceilings is developed.
• Test methodology o Dynamic shake table, cyclic, etc.
• Design of the mounting frame size and properties. o Although not anticipated that the frame will simulate a particular building type, it
should conservatively, but realistically envelope the expected performance of various structure types both horizontally and vertically.
• Development of a test response spectra and horizontal amplification factor. • Requirement for the floor and frame vertical properties. • Procedure for development of input histories. • Performance targets and qualification levels. • Qualification type.
o We envisage a single pass-fail qualification to a level predetermined based on performance levels and the expected ground or spectral intensity at a site. Several
8
qualification levels such as low, moderate, and high can be established. This type of testing will be used in lieu of comparative testing.
• Number of tests. o We recommend allowing both single-level qualification and incremental testing
that will assist researchers develop proper fragility data. • Collection of sufficient data to assess qualification. • Ability to represent field observations.
o Experimental failures and performance needs to correlate with field reconnaissance reports of similar ceiling design and installation.
• Correlation of qualification levels with the requirements of the building code. o The performance targets and qualification level need to correspond (with a factor
of safety) to the code prescribed failure limits and capacity requirements for system components.
• Procedure for evaluation of proprietary or alternative components.
Proposed Procedure for Development
To meet the requirements listed above, literature survey, analysis, and experimentation will be required. This will involve collaboration between practitioners, researchers, test facility personnel, and industry representatives. We do not have sufficient analytical or experimental data to tackle the tasks outlined in the previous section. Nonetheless, in the following sections, we will be using limited analysis and data from recently conducted tests to illustrate some of the critical points enumerated above with the goal of this serving as the first step towards such standard development.
EXPERIMENTAL PHASE
To address the current deficiencies regarding the test data, a NEES grand challenge has been approved to conduct full scale testing of suspended ceilings and other nonstructural components. This larger test frame is currently under design (Reinhorn 2009). The test results from this project will be used in the future to facilitate the development of a testing standard for suspended ceilings. The qualification tests conducted by the manufacturers since the early 2000’s have almost exclusively been done confidentially and for the purpose of qualification of proprietary components. While, we loud this effort as it provides us and other researchers insights regarding the seismic performance of suspended ceilings, such testing, by its scope and limitation, is narrowly focused, has limited number of data sensors, and is not readily available to public for critique and discuss. We recommend an industry-sponsored research and testing program conducted in the public domain, which will benefit all the manufacturers and result in better understanding of performance of systems, and better product innovation. Such task is similar to the effort undertaken in the 1980s. That effort and the resulting test data, helped introduce various seismic design and installation provisions to the editions of the building codes that followed. Our recommendation does not forestall the proprietary testing that can still be continued by individual manufactures for specialty and unique components.
9
ANALYTICAL PHASE
Overview
Analytical studies are performed to establish the required response spectra (RRS) seismic demand to be used for the laboratory tests of the suspended ceilings and other nonstructural components and equipment. The key parameters to determine are the spectral shape and the vertical and horizontal amplification of input histories. The horizontal amplification is the result of the flexibility of the lateral load elements, whereas, the floor flexibility results in amplification of vertical input. Various archetypes of buildings will be subjected to a suite of input histories. From analysis, the floor (and roof) response spectra can be developed. The mean or median of the data from the suite of records can then be determined. This data will next be averaged over the archetypes of selected structures to determine analytically the RRS. For design, instead of mean, mean plus two standard deviations can be used to have a high confidence in the conservatism of input records for tests. The proposed method is similar to the methodology proposed in ATC 63 (FEMA 2009) in establishing limit states for various types of buildings (Miyamoto, Gilani, and Wada, 2009). Although the approach is similar, the goal here is to develop the floor spectra and amplification factors to be used for testing.
Input Histories
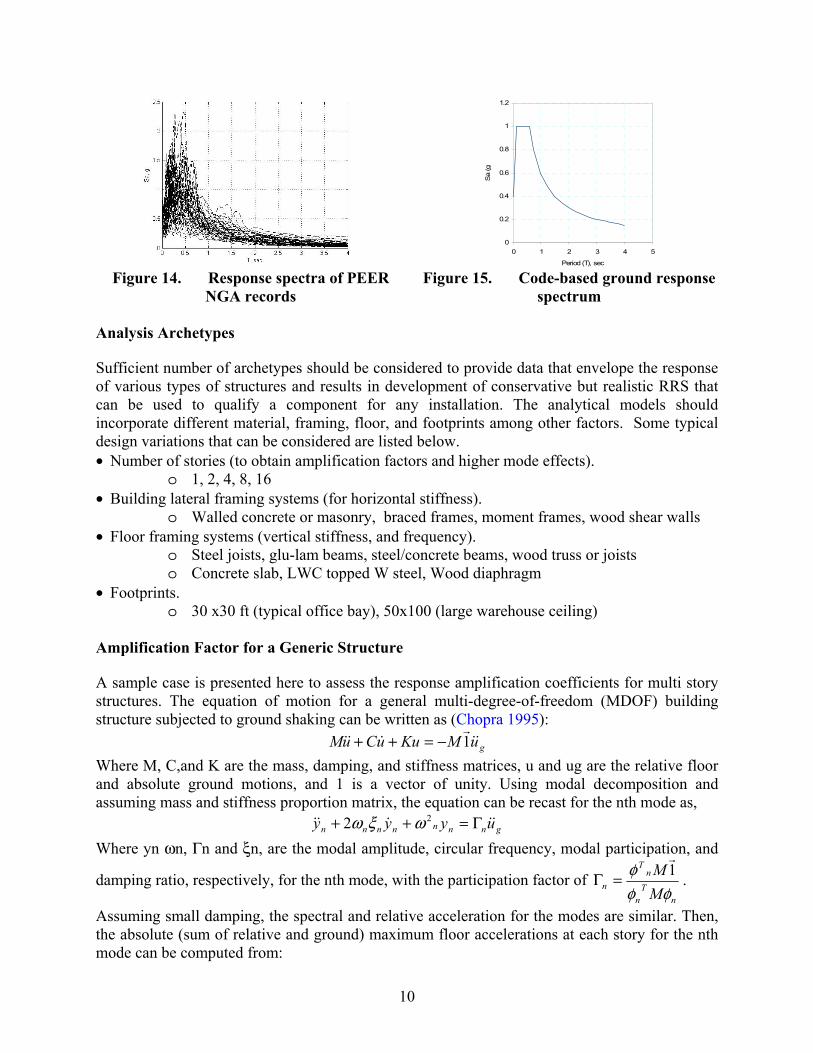
We recommend using a database for the development of input histories. One option is to use the ground motion data from the PEER NGA database (PEER 2004) for this investigation. A second alternative would be the use of the 32 records used to develop the input motion for the tests of high voltage substation equipment (Takhirov, et al 2004) Both sets of record data have sufficient energy up to a period of 4 sec (above a frequency of 0.25 Hz) to excite high frequency components. Yet, another alternative would be the use of a set of artificial motions. Figure 14 presents the response spectra for a set of 44 far-field PEER histories
Required Ground Spectrum
The records need to be further adjusted to match the required response spectrum (RRS). The RRS at the ground can be derived either for a typical case as shown in Figure 15, or for an envelope of code design spectrum for various soil condition, as is the current approach of ICC ES AC 156. The design seismic demand of Figure 15 is based on a typical location in the Los Angeles area with a mapped short period (Ss) and 1-second (s1) spectral accelerations of 1.5g and 0.6g, respectively.
10
0
0.2
0.4
0.6
0.8
1
1.2
0 1 2 3 4 5
Period (T), sec
Sa
(g
Figure 14. Response spectra of PEER
NGA records Figure 15. Code-based ground response
spectrum
Analysis Archetypes
Sufficient number of archetypes should be considered to provide data that envelope the response of various types of structures and results in development of conservative but realistic RRS that can be used to qualify a component for any installation. The analytical models should incorporate different material, framing, floor, and footprints among other factors. Some typical design variations that can be considered are listed below. • Number of stories (to obtain amplification factors and higher mode effects).
o 1, 2, 4, 8, 16 • Building lateral framing systems (for horizontal stiffness).
o Walled concrete or masonry, braced frames, moment frames, wood shear walls • Floor framing systems (vertical stiffness, and frequency).
o Steel joists, glu-lam beams, steel/concrete beams, wood truss or joists o Concrete slab, LWC topped W steel, Wood diaphragm
• Footprints. o 30 x30 ft (typical office bay), 50x100 (large warehouse ceiling)
Amplification Factor for a Generic Structure
A sample case is presented here to assess the response amplification coefficients for multi story structures. The equation of motion for a general multi-degree-of-freedom (MDOF) building structure subjected to ground shaking can be written as (Chopra 1995):
guMKuuCuM 1−=++ Where M, C,and K are the mass, damping, and stiffness matrices, u and ug are the relative floor and absolute ground motions, and 1 is a vector of unity. Using modal decomposition and assuming mass and stiffness proportion matrix, the equation can be recast for the nth mode as,
gnnnnnnn uyyy Γ=++ 22 ωξω Where yn ωn, Γn and ξn, are the modal amplitude, circular frequency, modal participation, and
damping ratio, respectively, for the nth mode, with the participation factor of n
Tn
nT
n MM
φφφ 1=Γ .
Assuming small damping, the spectral and relative acceleration for the modes are similar. Then, the absolute (sum of relative and ground) maximum floor accelerations at each story for the nth mode can be computed from:
11
),()1(max nnanntn Su ξωφΓ+= In typical cases, the acceleration distribution along the height differs from the inverted triangular shape outlined in the code. This is particularly the case, when higher mode effects are significant. Furthermore, when seismic protective devices (isolators and dampers) are utilized, the floor accelerations are significantly reduced. For these structures, the roof accelerations will be noticeably less than conventional structures. This further alters the profile of expected accelerations at various floors.
Example: Five Story Steel SMRF Buildings
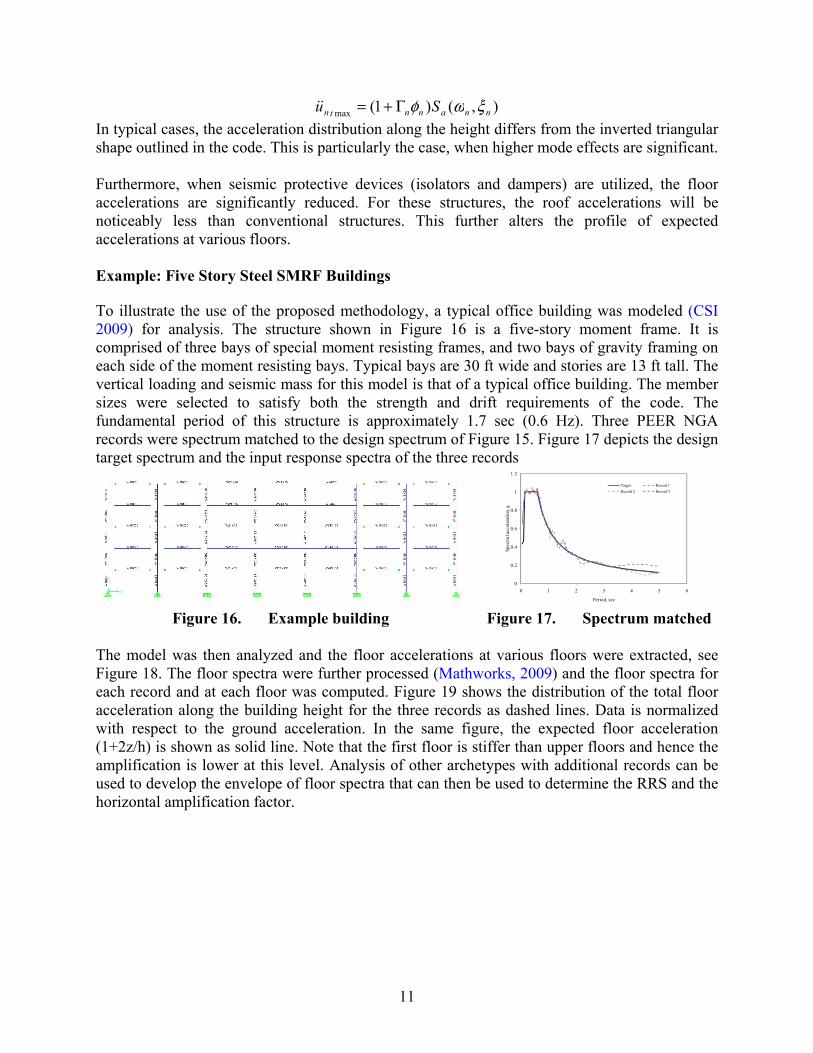
To illustrate the use of the proposed methodology, a typical office building was modeled (CSI 2009) for analysis. The structure shown in Figure 16 is a five-story moment frame. It is comprised of three bays of special moment resisting frames, and two bays of gravity framing on each side of the moment resisting bays. Typical bays are 30 ft wide and stories are 13 ft tall. The vertical loading and seismic mass for this model is that of a typical office building. The member sizes were selected to satisfy both the strength and drift requirements of the code. The fundamental period of this structure is approximately 1.7 sec (0.6 Hz). Three PEER NGA records were spectrum matched to the design spectrum of Figure 15. Figure 17 depicts the design target spectrum and the input response spectra of the three records
0
0.2
0.4
0.6
0.8
1
1.2
0 1 2 3 4 5 6
Spec
tral a
ccel
erat
ion,
g
Period, sec
Target Record 1Record 2 Record 3
Figure 16. Example building Figure 17. Spectrum matched
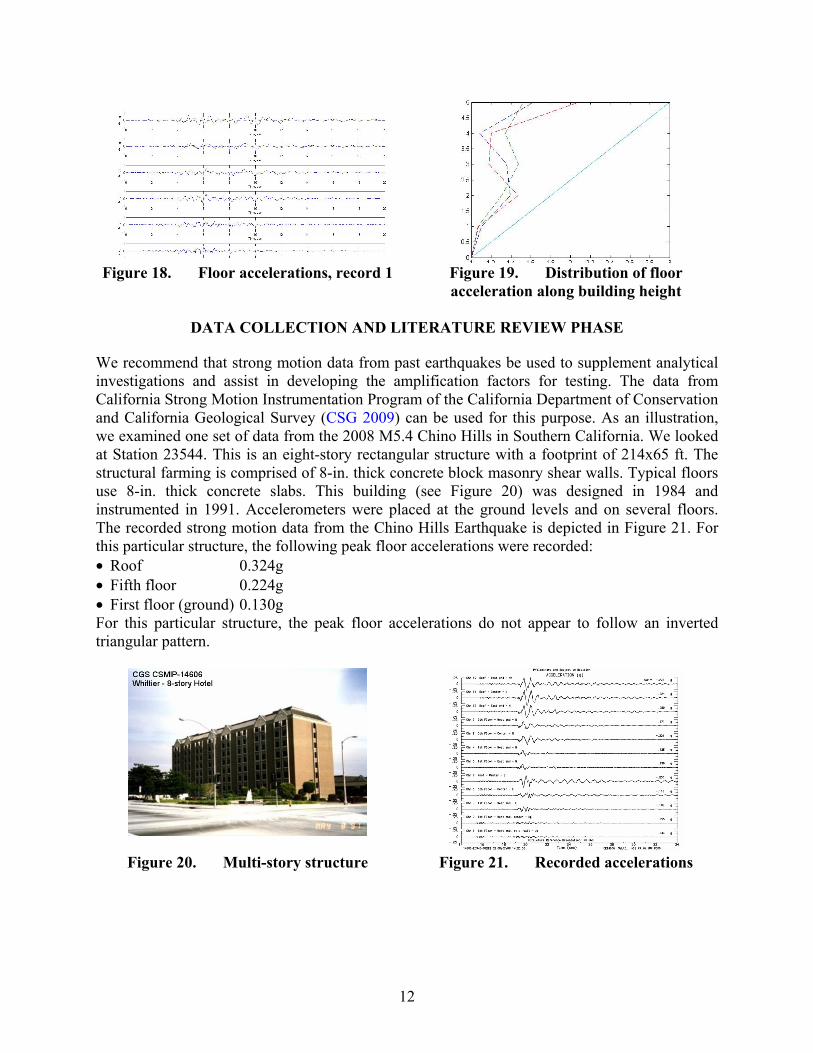
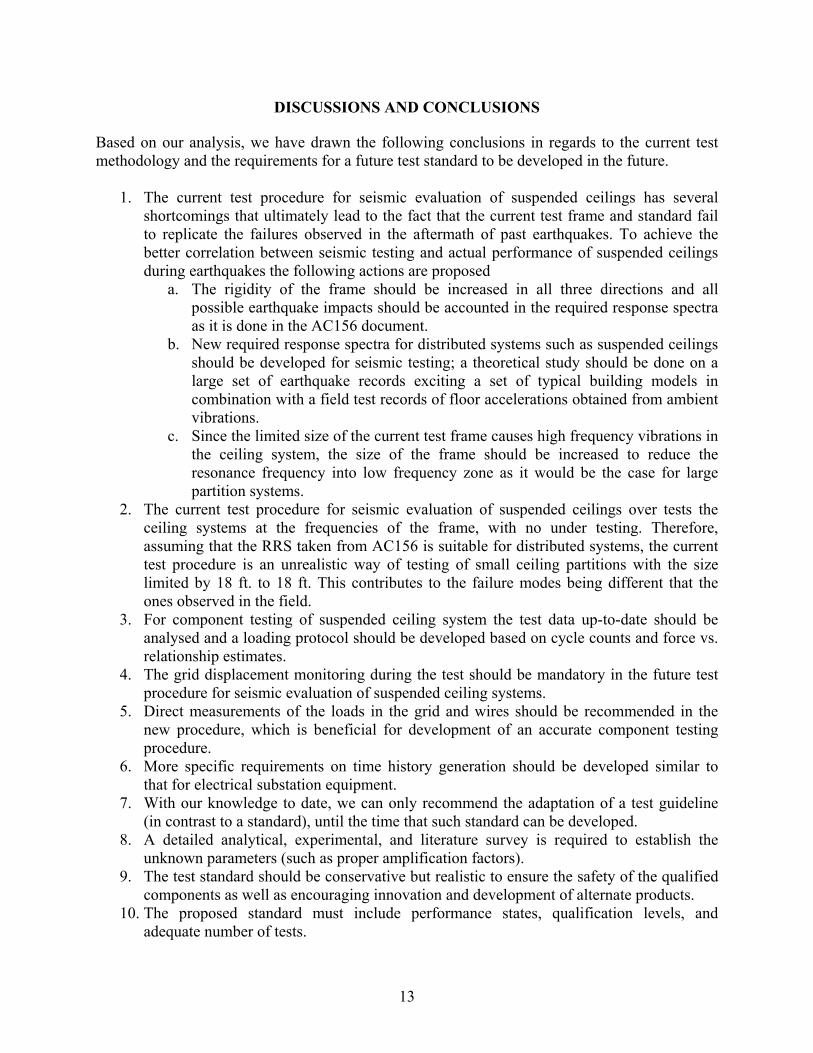
The model was then analyzed and the floor accelerations at various floors were extracted, see Figure 18. The floor spectra were further processed (Mathworks, 2009) and the floor spectra for each record and at each floor was computed. Figure 19 shows the distribution of the total floor acceleration along the building height for the three records as dashed lines. Data is normalized with respect to the ground acceleration. In the same figure, the expected floor acceleration (1+2z/h) is shown as solid line. Note that the first floor is stiffer than upper floors and hence the amplification is lower at this level. Analysis of other archetypes with additional records can be used to develop the envelope of floor spectra that can then be used to determine the RRS and the horizontal amplification factor.
12
Figure 18. Floor accelerations, record 1 Figure 19. Distribution of floor
acceleration along building height
DATA COLLECTION AND LITERATURE REVIEW PHASE
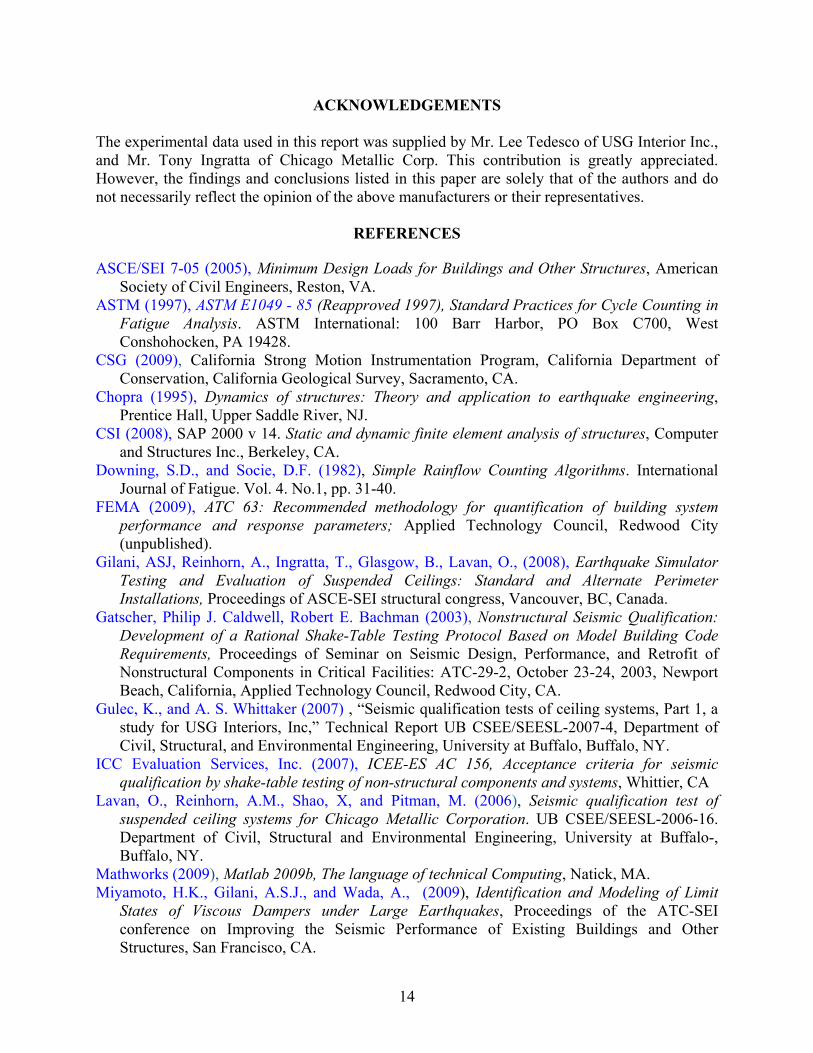
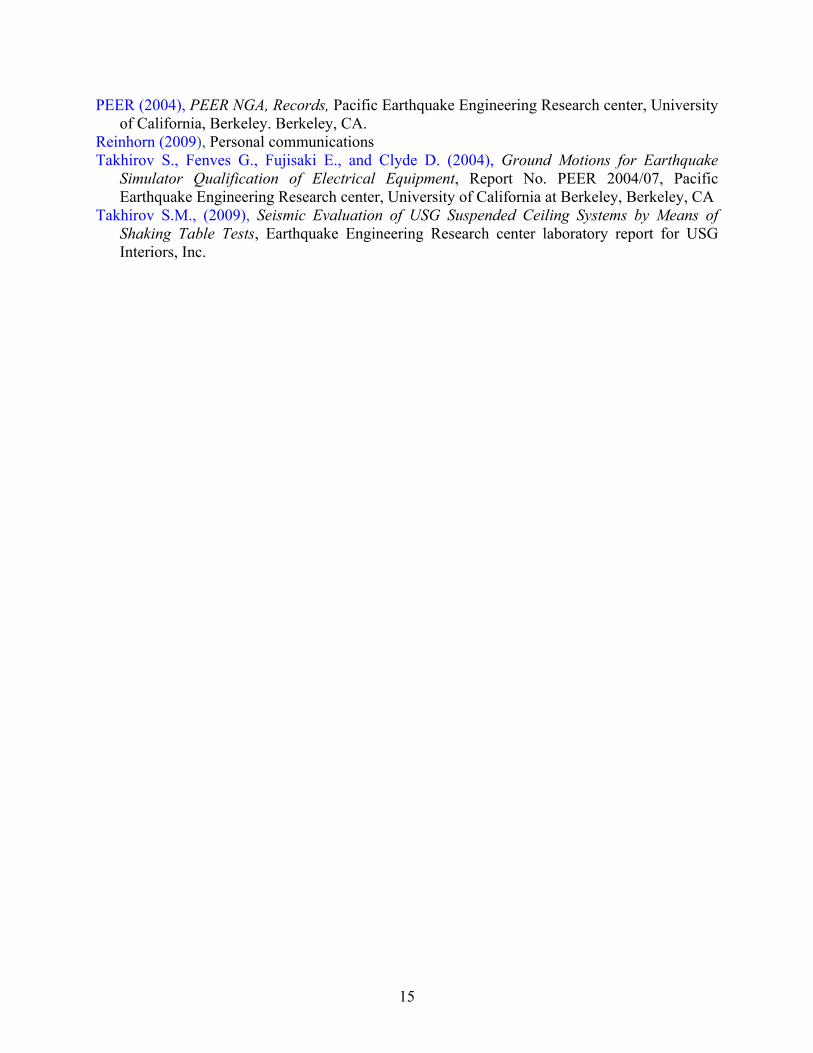
We recommend that strong motion data from past earthquakes be used to supplement analytical investigations and assist in developing the amplification factors for testing. The data from California Strong Motion Instrumentation Program of the California Department of Conservation and California Geological Survey (CSG 2009) can be used for this purpose. As an illustration, we examined one set of data from the 2008 M5.4 Chino Hills in Southern California. We looked at Station 23544. This is an eight-story rectangular structure with a footprint of 214x65 ft. The structural farming is comprised of 8-in. thick concrete block masonry shear walls. Typical floors use 8-in. thick concrete slabs. This building (see Figure 20) was designed in 1984 and instrumented in 1991. Accelerometers were placed at the ground levels and on several floors. The recorded strong motion data from the Chino Hills Earthquake is depicted in Figure 21. For this particular structure, the following peak floor accelerations were recorded: • Roof 0.324g • Fifth floor 0.224g • First floor (ground) 0.130g For this particular structure, the peak floor accelerations do not appear to follow an inverted triangular pattern.
Figure 20. Multi-story structure Figure 21. Recorded accelerations
13
DISCUSSIONS AND CONCLUSIONS
Based on our analysis, we have drawn the following conclusions in regards to the current test methodology and the requirements for a future test standard to be developed in the future.
1. The current test procedure for seismic evaluation of suspended ceilings has several shortcomings that ultimately lead to the fact that the current test frame and standard fail to replicate the failures observed in the aftermath of past earthquakes. To achieve the better correlation between seismic testing and actual performance of suspended ceilings during earthquakes the following actions are proposed
a. The rigidity of the frame should be increased in all three directions and all possible earthquake impacts should be accounted in the required response spectra as it is done in the AC156 document.
b. New required response spectra for distributed systems such as suspended ceilings should be developed for seismic testing; a theoretical study should be done on a large set of earthquake records exciting a set of typical building models in combination with a field test records of floor accelerations obtained from ambient vibrations.
c. Since the limited size of the current test frame causes high frequency vibrations in the ceiling system, the size of the frame should be increased to reduce the resonance frequency into low frequency zone as it would be the case for large partition systems.
2. The current test procedure for seismic evaluation of suspended ceilings over tests the ceiling systems at the frequencies of the frame, with no under testing. Therefore, assuming that the RRS taken from AC156 is suitable for distributed systems, the current test procedure is an unrealistic way of testing of small ceiling partitions with the size limited by 18 ft. to 18 ft. This contributes to the failure modes being different that the ones observed in the field.
3. For component testing of suspended ceiling system the test data up-to-date should be analysed and a loading protocol should be developed based on cycle counts and force vs. relationship estimates.
4. The grid displacement monitoring during the test should be mandatory in the future test procedure for seismic evaluation of suspended ceiling systems.
5. Direct measurements of the loads in the grid and wires should be recommended in the new procedure, which is beneficial for development of an accurate component testing procedure.
6. More specific requirements on time history generation should be developed similar to that for electrical substation equipment.
7. With our knowledge to date, we can only recommend the adaptation of a test guideline (in contrast to a standard), until the time that such standard can be developed.
8. A detailed analytical, experimental, and literature survey is required to establish the unknown parameters (such as proper amplification factors).
9. The test standard should be conservative but realistic to ensure the safety of the qualified components as well as encouraging innovation and development of alternate products.
10. The proposed standard must include performance states, qualification levels, and adequate number of tests.
14
ACKNOWLEDGEMENTS
The experimental data used in this report was supplied by Mr. Lee Tedesco of USG Interior Inc., and Mr. Tony Ingratta of Chicago Metallic Corp. This contribution is greatly appreciated. However, the findings and conclusions listed in this paper are solely that of the authors and do not necessarily reflect the opinion of the above manufacturers or their representatives.
REFERENCES
ASCE/SEI 7-05 (2005), Minimum Design Loads for Buildings and Other Structures, American Society of Civil Engineers, Reston, VA.
ASTM (1997), ASTM E1049 - 85 (Reapproved 1997), Standard Practices for Cycle Counting in Fatigue Analysis. ASTM International: 100 Barr Harbor, PO Box C700, West Conshohocken, PA 19428.
CSG (2009), California Strong Motion Instrumentation Program, California Department of Conservation, California Geological Survey, Sacramento, CA.
Chopra (1995), Dynamics of structures: Theory and application to earthquake engineering, Prentice Hall, Upper Saddle River, NJ.
CSI (2008), SAP 2000 v 14. Static and dynamic finite element analysis of structures, Computer and Structures Inc., Berkeley, CA.
Downing, S.D., and Socie, D.F. (1982), Simple Rainflow Counting Algorithms. International Journal of Fatigue. Vol. 4. No.1, pp. 31-40.
FEMA (2009), ATC 63: Recommended methodology for quantification of building system performance and response parameters; Applied Technology Council, Redwood City (unpublished).
Gilani, ASJ, Reinhorn, A., Ingratta, T., Glasgow, B., Lavan, O., (2008), Earthquake Simulator Testing and Evaluation of Suspended Ceilings: Standard and Alternate Perimeter Installations, Proceedings of ASCE-SEI structural congress, Vancouver, BC, Canada.
Gatscher, Philip J. Caldwell, Robert E. Bachman (2003), Nonstructural Seismic Qualification: Development of a Rational Shake-Table Testing Protocol Based on Model Building Code Requirements, Proceedings of Seminar on Seismic Design, Performance, and Retrofit of Nonstructural Components in Critical Facilities: ATC-29-2, October 23-24, 2003, Newport Beach, California, Applied Technology Council, Redwood City, CA.
Gulec, K., and A. S. Whittaker (2007) , “Seismic qualification tests of ceiling systems, Part 1, a study for USG Interiors, Inc,” Technical Report UB CSEE/SEESL-2007-4, Department of Civil, Structural, and Environmental Engineering, University at Buffalo, Buffalo, NY.
ICC Evaluation Services, Inc. (2007), ICEE-ES AC 156, Acceptance criteria for seismic qualification by shake-table testing of non-structural components and systems, Whittier, CA
Lavan, O., Reinhorn, A.M., Shao, X, and Pitman, M. (2006), Seismic qualification test of suspended ceiling systems for Chicago Metallic Corporation. UB CSEE/SEESL-2006-16. Department of Civil, Structural and Environmental Engineering, University at Buffalo-, Buffalo, NY.
Mathworks (2009), Matlab 2009b, The language of technical Computing, Natick, MA. Miyamoto, H.K., Gilani, A.S.J., and Wada, A., (2009), Identification and Modeling of Limit
States of Viscous Dampers under Large Earthquakes, Proceedings of the ATC-SEI conference on Improving the Seismic Performance of Existing Buildings and Other Structures, San Francisco, CA.
15
PEER (2004), PEER NGA, Records, Pacific Earthquake Engineering Research center, University of California, Berkeley. Berkeley, CA.
Reinhorn (2009), Personal communications Takhirov S., Fenves G., Fujisaki E., and Clyde D. (2004), Ground Motions for Earthquake
Simulator Qualification of Electrical Equipment, Report No. PEER 2004/07, Pacific Earthquake Engineering Research center, University of California at Berkeley, Berkeley, CA
Takhirov S.M., (2009), Seismic Evaluation of USG Suspended Ceiling Systems by Means of Shaking Table Tests, Earthquake Engineering Research center laboratory report for USG Interiors, Inc.