Test report for tests in the laboratory (Published in April 2015)
77
ECUC Deliverable D5.3-draft Due date: 30 th April 2015 FP7 TRANSPORT Contract No. 314244 1 September 2012 - 31 August 2015 Page 1 of 77 DELIVERABLE D.5.3 Test report for tests in the laboratory Contract number : 314244 Project acronym : ECUC Project title : EDDY CURRENT BRAKE COMPATIBILITY Deliverable number : D5.3 Nature : Dissemination level : PU Report date : 30 th June 2015 Author(s): Dr. Henry Lehmann (KB), Dr. Gavin Lancaster (Frauscher) Dr. Daniel Valderas (CEIT) Partners contributed : Dr. Gavin Lancester, Frauscher Dr. Daniel Valderas, CEIT Mr. Oliver Stark, Mrs. Silvia Eickstädt, DB Contact : Dr.-Ing. Henry Lehmann, Knorr-Bremse GmbH, Beethovengasse 43 – 45, A-2340 Mödling Tel.: +43 2236 409 2383, Email: [email protected] ECUC Eddy CUrrent brake Compatibility The ECUC project was funded by the European Commission under the 7 th Framework Programme (FP7) –Transport Coordinator: CEIT
Transcript of Test report for tests in the laboratory (Published in April 2015)

ECUC Deliverable D5.3-draft Due date: 30th April 2015
FP7 TRANSPORT Contract No. 314244 1 September 2012 - 31 August 2015 Page 1 of 77
DELIVERABLE D.5.3 Test report for tests in the laboratory
Contract number : 314244 Project acronym : ECUC Project title : EDDY CURRENT BRAKE COMPATIBILITY Deliverable number : D5.3 Nature : Dissemination level : PU
Report date : 30th June 2015 Author(s): Dr. Henry Lehmann (KB),
Dr. Gavin Lancaster (Frauscher) Dr. Daniel Valderas (CEIT)
Partners contributed : Dr. Gavin Lancester, Frauscher Dr. Daniel Valderas, CEIT Mr. Oliver Stark, Mrs. Silvia Eickstädt, DB
Contact : Dr.-Ing. Henry Lehmann, Knorr-Bremse GmbH, Beethovengasse 43 – 45, A-2340 Mödling Tel.: +43 2236 409 2383, Email: [email protected]
ECUC Eddy CUrrent brake Compatibility
The ECUC project was funded by the European Commission under the 7th Framework Programme (FP7) –Transport
Coordinator: CEIT

ECUC Deliverable D5.3 Due date: 30th April 2015
FP7 TRANSPORT Contract No. 314244 1 September 2012 - 31 August 2015 Page 2 of 77
TABLE OF CONTENTS List of Figures ................................................................................................................................. 4
List of Tables ................................................................................................................................... 6
Table of versions ............................................................................................................................. 7
Bibliography .................................................................................................................................... 8
Executive summary ......................................................................................................................... 9
1. Introduction ............................................................................................................................... 11
2. Physical parameters ................................................................................................................. 12
2.1 EM signals .......................................................................................................................... 12
2.2 Temperature ....................................................................................................................... 12
2.3 Mechanical parameters ....................................................................................................... 12
3. Laboratory test .......................................................................................................................... 13
3.1 EM signals .......................................................................................................................... 13
3.1.1 Passive interaction .................................................................................................. 13
3.1.1.1 Test site .................................................................................................................. 13
3.1.1.2 Test set-up ............................................................................................................. 14
3.1.1.2.1 Transversal and Fingerprint measurements .................................................... 14
3.1.1.2.1.1 Set-up 1 L4 Pole Cores only with Integral Beam .................................... 14 3.1.1.2.1.2 Set-up 2 L4 Poles, Coils open ................................................................ 16 3.1.1.2.1.3 Set-up 3 L4 Poles, Coils in series + Impedance Load ............................ 17 3.1.1.2.1.4 Set-up 4 L5 Poles, Coils in series + Impedance Load ............................ 17 3.1.1.2.1.5 Set-up 5 L4 Pole Cores, Signal Plates removed .................................... 18 3.1.1.2.1.6 Set-up 6 L4 Poles, no Integral Beam, manual ........................................ 18 3.1.1.2.1.7 Measurement procedure motorised ....................................................... 18 3.1.1.2.1.8 Measurement procedure manual ........................................................... 18
3.1.1.2.2 Standard Fingerprint ........................................................................................ 19
3.1.1.3 Test procedure ECB 154 R L4 ............................................................................... 20
3.1.1.3.1 Test (ECB 154 R L4) with RSR180 by Frauscher ........................................... 21
3.1.1.3.1.1 Influence of lateral displacements .......................................................... 21 3.1.1.3.1.2 Influence of grounding conditions ........................................................... 22 3.1.1.3.1.3 Influence of impedance load .................................................................. 22
3.1.1.3.2 Test (ECB 154 R L4) with RSR123 by Frauscher ........................................... 23
3.1.1.3.2.1 Influence of lateral displacements .......................................................... 23 3.1.1.3.2.2 Influence of grounding conditions ........................................................... 24 3.1.1.3.2.3 Influence of impedance load .................................................................. 24
3.1.1.3.3 Test (ECB 154 R L4) with ZP-43 ..................................................................... 25
3.1.1.4 Test procedure ECB 154 R L5 ............................................................................... 27
3.1.1.4.1 Test (ECB 154 R L5) with RSR180 and RSR123 ............................................ 28

ECUC Deliverable D5.3 Due date: 30th April 2015
FP7 TRANSPORT Contract No. 314244 1 September 2012 - 31 August 2015 Page 3 of 77
3.1.1.4.2 Test (ECB 154 R L5) with ZP-43 ..................................................................... 29
3.1.1.5 Test procedure new ECB ....................................................................................... 32
3.1.1.5.1 Test with RSR180 ............................................................................................ 34
3.1.1.5.2 Test with RSR123 ............................................................................................ 38
3.1.1.5.3 Test with ZP-43 ............................................................................................... 42
3.1.1.6 Summary of passive interaction ............................................................................. 44
3.1.2 Low frequency magnetic stray fields ....................................................................... 45
3.1.2.1 Test site .................................................................................................................. 45
3.1.2.2 Test set-up ............................................................................................................. 45
3.1.2.3 Test procedure ....................................................................................................... 47
3.1.2.4 Summary of low frequency interaction ................................................................... 51
3.1.3 High frequency magnetic fields and transfer function ............................................. 52
3.1.3.1 Test side ................................................................................................................. 52
3.1.3.2 Test set-up ............................................................................................................. 52
3.1.3.2.1 Test set-up “electric and magnetic properties of ECB” .................................... 52
3.1.3.2.2 Set-up 1 ........................................................................................................... 52
3.1.3.2.3 Set-up 2 ........................................................................................................... 54
3.1.3.2.4 Set-up 3 ........................................................................................................... 55
3.1.3.2.5 Set-up 4 ........................................................................................................... 55
3.1.3.2.6 Set-up 5 ........................................................................................................... 56
3.1.3.3 Test procedure ....................................................................................................... 57
3.1.3.3.1 Special test procedure for properties of ECB .................................................. 57
3.1.3.3.1.1 Single pole [6] ......................................................................................... 57 3.1.3.3.1.2 Two and four poles [6] ............................................................................ 61
3.1.3.3.2 Transfer Function with non-saturated cores .................................................... 69
3.1.3.3.3 Transfer function with partially saturated cores ............................................... 71
3.1.3.4 Summary of high frequency interaction .................................................................. 72
3.2 Mechanical parameters ....................................................................................................... 73
3.2.1 Fatigue test of components of ECB frame .............................................................. 73
3.2.1.1 Test site .................................................................................................................. 73
3.2.1.2 Test procedure ....................................................................................................... 74
3.2.1.3 Summary of fatigue test ......................................................................................... 75
3.2.2 Magnetic force of magnet poles .............................................................................. 75

ECUC Deliverable D5.3 Due date: 30th April 2015
FP7 TRANSPORT Contract No. 314244 1 September 2012 - 31 August 2015 Page 4 of 77
LIST OF FIGURES Figure 1: heuristic model of electromagnetic interferences .......................................................... 12
Figure 2: Physical setup and schematic for the ECB traversal measurements ............................ 15
Figure 3: The limits of movement for the rail ................................................................................. 16
Figure 4: Setup for second experiment with eight L4 poles .......................................................... 16
Figure 5: Setup for measurement of the integral beam with L5 poles .......................................... 17
Figure 6: integral beam with L5 poles and the pole protection plates and transmission link ........ 17
Figure 7: Setup for measurements with no signal plates in the pole cores ................................... 18
Figure 8: Setup for measurement using two poles without the integral beam .............................. 18
Figure 9: influence of lateral displacement ................................................................................... 21
Figure 10: influence of grounding ................................................................................................. 22
Figure 11: impact of impedance loads on interferences ............................................................... 22
Figure 12: influence of lateral displacement ................................................................................. 23
Figure 13: influence of grounding ................................................................................................. 24
Figure 14: impact of impedance loads on interferences ............................................................... 24
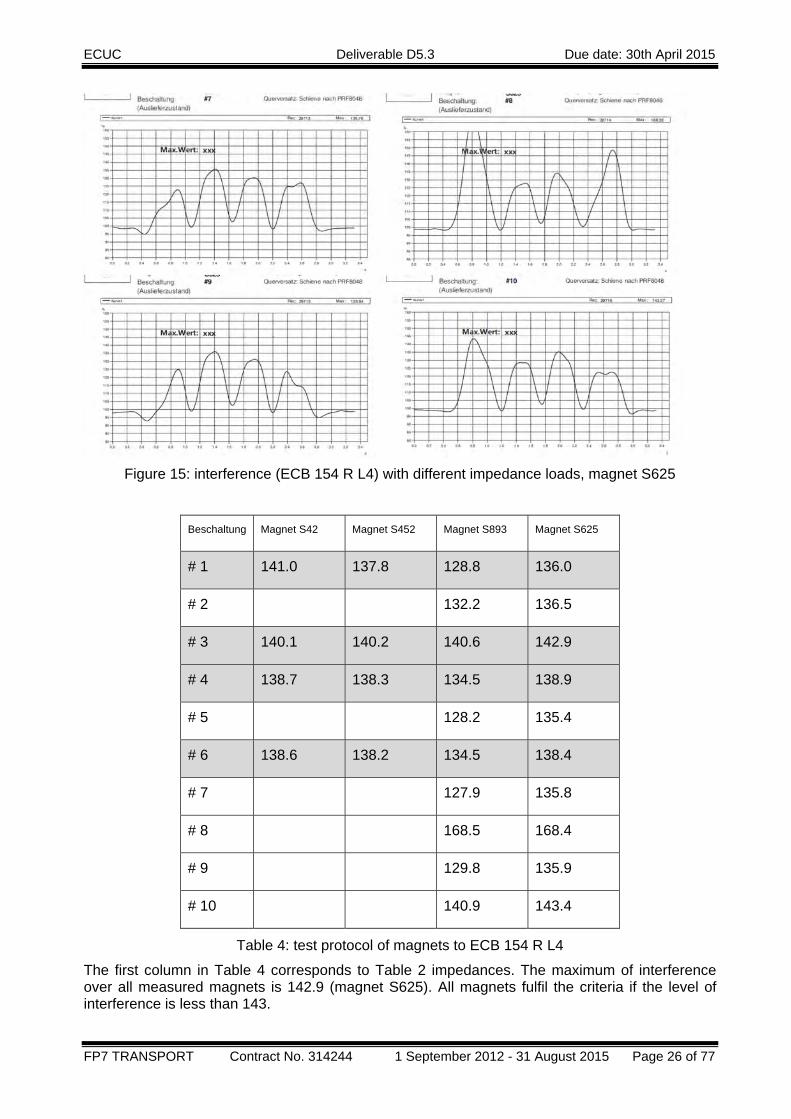
Figure 15: interference (ECB 154 R L4) with different impedance loads, magnet S625 .............. 26
Figure 16: comparison of EWB 154 L4 and EWB 154 L5, RSR180, maximum negative lateral displacement ......................................................................................................................... 28
Figure 17: comparison of EWB 154 L4 and EWB 154 L5, RSR123, maximum negative lateral displacement ......................................................................................................................... 28
Figure 18: interference (ECB 154 R L5) with different impedance loads, magnet S1038 ............ 30
Figure 19: sketch of configuration 1-2-3-4 .................................................................................... 32
Figure 20: influence of lateral displacement, without optimization and 7 mm air .......................... 34
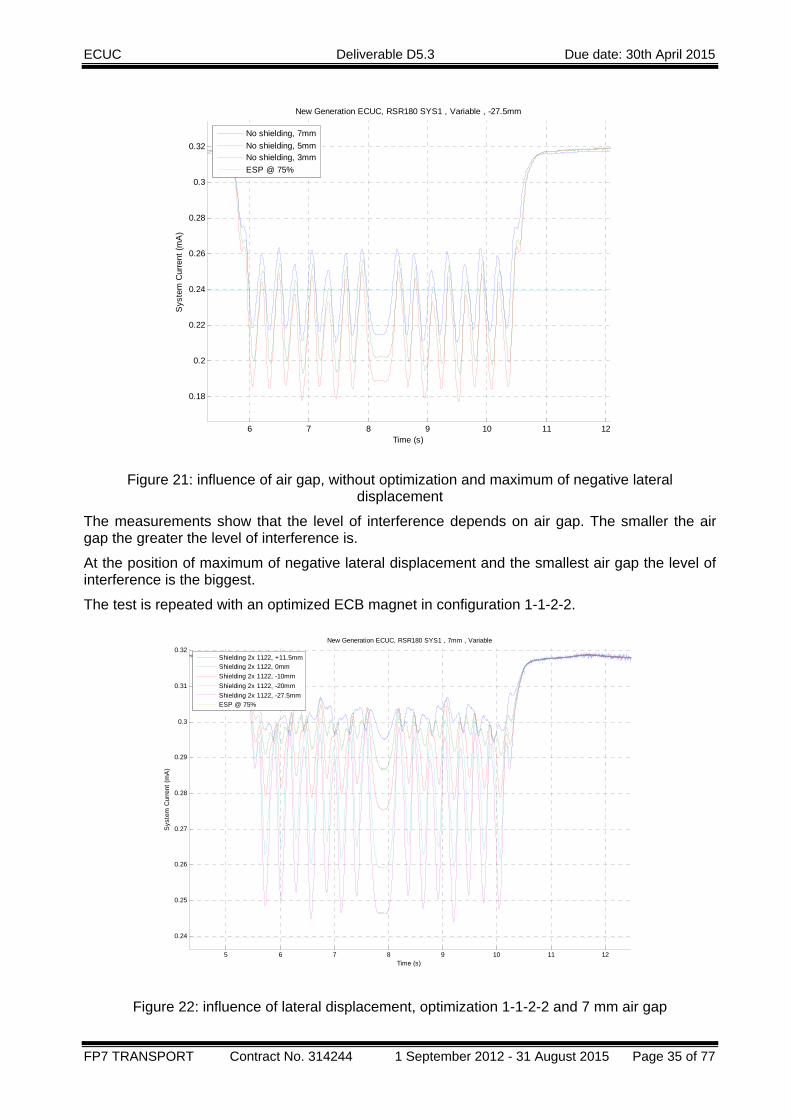
Figure 21: influence of air gap, without optimization and maximum of negative lateral displacement ......................................................................................................................... 35
Figure 22: influence of lateral displacement, optimization 1-1-2-2 and air gap 7 mm ................... 35
Figure 23: influence of lateral displacement, optimization 1-1-2-2 and air gap 3 mm ................... 36
Figure 24: influence of lateral displacement, optimization 1-2-3-4 and air gap 7 mm ................... 36
Figure 25: influence of lateral displacement, optimization 1-2-3-4 and air gap 3 mm ................... 37
Figure 26: influence of lateral displacement, without optimization, 7 mm air ................................ 38
Figure 27: influence of air gap, without optimization, maximum of negative lateral ...................... 38
Figure 28: influence of lateral displacement, optimization 1-1-2-2 and air gap 7 mm ................... 39
Figure 29: influence of lateral displacement, optimization 1-1-2-2 and air gap 3 mm ................... 39
Figure 30: influence of lateral displacement, optimization 1-2-3-4 and air gap 7 mm ................... 40
Figure 31: influence of lateral displacement, optimization 1-2-3-4 and air gap 3 mm ................... 40
Figure 32: comparison of level of interference depending on type of optimization ....................... 41
Figure 33: interference without any signalling optimization .......................................................... 42
Figure 34: maximum of interference with optimized design .......................................................... 42

ECUC Deliverable D5.3 Due date: 30th April 2015
FP7 TRANSPORT Contract No. 314244 1 September 2012 - 31 August 2015 Page 5 of 77
Figure 35: minimum of interference with optimized design ........................................................... 43
Figure 36: UIC60 rail and ECB magnet for stray field measurements .......................................... 45
Figure 37: one of the high capacity energy supplies ..................................................................... 46
Figure 38: raster of measurement in vertical and horizontal plane ............................................... 47
Figure 39: example of simulation Emergency brake application, air gap 5 mm, lateral displacement - 27.5 mm ........................................................................................................ 48
Figure 40: magnetic stray field in horizontal plane, brake test application, air gap 4 mm ............. 49
Figure 41: measurements into the raster in y-z plane, brake test application ............................... 50
Figure 42: measurements into the raster in y-z plane, emergency brake application ................... 50
Figure 43: measurements into the raster in y-z plane, emergency brake application ................... 51
Figure 44: Physical setup and schematic for experiment to measure the transfer function of two poles mounted on an integral beam. ..................................................................................... 53
Figure 45: Position and dimensions of the x, y and z antennas within the MNR Receiver housing. .............................................................................................................................................. 54
Figure 46: Physical setup for Setup 2. .......................................................................................... 54
Figure 47: Physical setup for Setup 3. .......................................................................................... 55
Figure 48: Physical setup for Setup 4. .......................................................................................... 55
Figure 49: Physical setup and electrical schematic for measurements of pole transfer function with saturated core. ............................................................................................................... 56
Figure 51: results of resonance measurements ............................................................................ 58
Figure 52: results of impedance measurements ........................................................................... 60
Figure 53: Impedance of a pair of L5 poles without core for original interconnection ................... 61
Figure 54: Impedance of a pair of L5 poles without core for different interconnection ................. 62
Figure 55: Impedance of a pair of L5 poles with core for different interconnections ..................... 65
Figure 56: Impedance of four L5 poles connected in series ......................................................... 66
Figure 57: influence of saturation on reactance of poles .............................................................. 69
Figure 58: symmetrically positioned, magnetic stray field vs. frequency ...................................... 70
Figure 59: asymmetrically positioned, magnetic stray field vs. on frequency ............................... 70
Figure 60: magnetic stray field depend on frequency ................................................................... 72
Figure 61: servo-hydraulic fatigue test bench ............................................................................... 73
Figure 62: adapter for component of self-sustained magnet beam with load cell ......................... 73
Figure 63: ECB fatigue test bench ................................................................................................ 74
Figure 64: test samples with dry surface ...................................................................................... 75
Figure 65: test samples with grease contaminated surface .......................................................... 75
Figure 66: basic test site for 1 magnet pole .................................................................................. 76
Figure 67: longitudinal configuration of 3 magnet poles (top view) ............................................... 77

ECUC Deliverable D5.3 Due date: 30th April 2015
FP7 TRANSPORT Contract No. 314244 1 September 2012 - 31 August 2015 Page 6 of 77
LIST OF TABLES Table 1: Mounting details of both Frauscher sensors ................................................................... 14
Table 2: List of impedances .......................................................................................................... 19
Table 3: template for test procedure of EWB 154 R L4 ................................................................ 20
Table 4: test protocol of magnets to ECB 154 R L4 ...................................................................... 26
Table 5: template for test procedure of ECB 154 R L5 ................................................................. 27
Table 6: test protocol ECB 154 R L5 ............................................................................................ 31
Table 7: test protocol new ECB serial number: ............................................................................. 43
Table 8: magnetic stray field near top of rail depend on air gap ................................................... 51
Table 9: simplified load cases ....................................................................................................... 74
Table 10: legend of parts of the basic test site ............................................................................. 76
ECUC Deliverable D5.3 Due date: 30th April 2015
FP7 TRANSPORT Contract No. 314244 1 September 2012 - 31 August 2015 Page 7 of 77
TABLE OF VERSIONS
Version Date Contributors Sections Affected
Draft 24th April 2015 KB, CEIT, Frauscher All
1 30th April KB, CEIT, All
2 25th June DB All

ECUC Deliverable D5.3 Due date: 30th April 2015
FP7 TRANSPORT Contract No. 314244 1 September 2012 - 31 August 2015 Page 8 of 77
BIBLIOGRAPHY
[] Standard / Label Version
[1] ECUC_signalinTest_ZP43_PWB.pdf
[2] CLC / TS50238-3
[3] Report 4060-1; ECB transfer function and passive “Fingerprint” measurements
[4] Report 4060-1; ECB transfer function and passive “Fingerprint” measurements, chapter 4.2 and 4.3
[5] Report 4145-1; Measurements of new generation ECUC ECB with shielding plates
[6] Report 3953-1; Description of ECB coil impedance measurements
ECUC Deliverable D5.3 Due date: 30th April 2015
FP7 TRANSPORT Contract No. 314244 1 September 2012 - 31 August 2015 Page 9 of 77
EXECUTIVE SUMMARY This document describes the test sites, test set ups and test procedures that should be realized for the validation of an ECB along with the results of those measurements conducted in two aspects: Electromagnetic Compatibility (EMC) with axle counters and mechanical testing. In relation to Electromagnetic Compatibility, some tests are included not for performance testing but to provide electrical and field validation for the verification of the Electromagnetic model of WP3. In this manner there exist consistency of the road map from design, calculation to the test.
For EM test, three interactions are tested: passive (disconnected) ECB in the presence of a signalling device that could be detected as a false wheel, low frequency interference (Hz) due to a DC source on the move, and high frequency interference (KHz) due to harmonics coming from the power supply.
For the passive case, the analysed axle counters can be divided in 2 groups.
RSR180 and RSR123 by Frauscher have the magnetic stray field at one side of the rail. They exhibit these common features:
• There is no observable difference between ECB 154 R L4 and ECB 154 R L5 • Changing the value of the impedance loads of a ECB has no effect on
interference. • The ground connection to the ECB magnet is irrelevant. • The greatest interference appeals in the position of maximum negative latera
displacement and the minimum of air gap.
ZP-43 is an example for the other group of sensors that have a magnetic stray field around the rail. In this case:
• The maximum of interference appears in the central position of rail of the ECB magnet.
• The impedance load has an important influence of the level of interference. The design of EWB L5 gives a higher immunity against changes of impedance loads and a greater secure signal- noise ratio.
The new ECB configuration 1-2-3-4 shows with all 3 types of analysed axle counters the lowest level of interference. A common consequence to all ECB is that it is possible to add massive metal bodies surrounding the ECBs to protect signalling devices against disturbing interferences.
For the low frequency interference the worst case conditions of maximum magnetic stray field density are divided in two areas below top of the rail or above top of rail. Based on the magnetic flux density it is possible to define a threshold in frequency range from static up to 500 Hz.
For the high frequency measurements, some conclusions can be extracted:
• The resonant frequencies of poles with iron core are lower than without iron core. • The resonant frequencies of poles type /L4 (45.0 kHz) are lower than type /L5
(56.5 KHz). • The peaks for maximum resistance (6 KΩ) and reactance (3 KΩ) are lower than
their no-core counterparts by a factor of 6. • The saturation of the core appears to have little effect on the magnetic stray field
intensity from 10 KHz to 1 MHz. A small increase in field intensity with increasing saturation is perceptible and is typically < 2 dB. As a consequence a threshold could be independent from brake force of ECB and could be verified easier.
ECUC Deliverable D5.3 Due date: 30th April 2015
FP7 TRANSPORT Contract No. 314244 1 September 2012 - 31 August 2015 Page 10 of 77
Fatigue test and attraction force characterization is also described in the present document. Based on test of components the concept of new ECB with a self-sustained magnet beam is feasible. As an overall conclusion, defined test sites, test set ups and test procedures can be the starting point to be considered by standardization bodies.
ECUC Deliverable D5.3 Due date: 30th April 2015
FP7 TRANSPORT Contract No. 314244 1 September 2012 - 31 August 2015 Page 11 of 77
1. INTRODUCTION The main objective of WP 5 is to define the test site, test procedure and test set-up for the measurement of the ECB emissions to carry out the relevant tests. This WP 5 will be divided in two main groups. On the one hand, the tests are carried out in the laboratory and on the other hand, a train equipped with ECB is tested in the track.
The main objective of this D5.3 is to define the test site, test procedure and test set-up for the measurement of the ECB emissions to carry out the relevant laboratory tests.
The laboratory tests have to include three types of physical parameters: EM signals, temperature and mechanical parameters.
The definitions of the test site, test procedure and the test set-up are defined respect to the findings from WP2 “Identification of the performance requirements, design parameters, and their relationships”, WP3 “ECB compatibility model design and implementation” and WP4 “worst case conditions”.
The laboratory tests are carried out into KB test facilities. Following are descripted all finished laboratory tests.

ECUC Deliverable D5.3 Due date: 30th April 2015
FP7 TRANSPORT Contract No. 314244 1 September 2012 - 31 August 2015 Page 12 of 77
2. PHYSICAL PARAMETERS
2.1 EM SIGNALS The heuristic model of electromagnetic interferences is divided into 3 effects. Details and definitions are descripted in D2.4 chapter 3.2 “signalling systems”. As the general basis of this heuristic model is the principle of superposition of the effects of passive interaction, active low frequency interaction and active mean- and high-frequency interaction. In work package 3 a systematic improvement of higher signal noise ratio based on the heuristic model is developed, see D3.1, and D3.3.The worst case conditions are descripted in D4. They will be the inputs of the requirements of the laboratory tests. A systematic analysis of combinations of different worst case conditions is possible only by simulations or in laboratory tests.
Figure 1: heuristic model of electromagnetic interferences
Therefore the EMC laboratory tests consist of 3 parts as is will show later.
2.2 TEMPERATURE The Laboratory tests represent the thermo-mechanical behaviour of the ECB in consideration of environmental conditions and thermal loads. The environmental conditions that are taken into account are the ones described in EN50125, part 1: Equipment on board rolling stock. See also explanations in D2.2 and D4.
The thermal loads of ECB depend on standardised brake cycles. The thermo-mechanical behaviour is also dependent on the principle of exciting of the magnetic field (electro-magnetic or permanent-magnetic).
2.3 MECHANICAL PARAMETERS The Laboratory tests represent the mechanical behaviour of the ECB in consideration of mechanical loads on the ECB and their interfaces.
ECUC Deliverable D5.3 Due date: 30th April 2015
FP7 TRANSPORT Contract No. 314244 1 September 2012 - 31 August 2015 Page 13 of 77
3. LABORATORY TEST The laboratory tests are arranged according to the following structure:
• Definition of a test site. • Definition of a test set‐up. • Definition of a test procedure.
3.1 EM SIGNALS The specific characteristic of the interferences of the passive interaction, the low frequency magnetic field effect and the high frequency magnetic field effect demand different test sites, test procedures and test set-ups.
3.1.1 Passive interaction The passive interactions are based on electromagnetic fields which are emitted from the active signalling devices and are affected by the presence of a metallic mass like the ECB one (ECB off). The EN50238 defines a zone of interaction on axle counters in appendix A figure A11. All parts of ECB are considered located in this space.
The range of frequency of these fields is defined from 10 kHz up to 1 MHz because of the minimum frequency of 10 kHz has no relation to the speed of ECB on results.
We have observed from movements of ECB due to the accelerations that they have no relation on results, in according to a frequency range of eigenmode of ECB up to 200 Hz.
3.1.1.1 Test site The test site is descripted in detail in D5.1 Chapter 4.1.1.1 “test site”.
During all tests an UIC-60 rail was installed on test bench for signalling devices.
The tests were carried out with 3 types of signalling devices:
• RSR180, • RSR123, • ZP‐43.

ECUC Deliverable D5.3 Due date: 30th April 2015
FP7 TRANSPORT Contract No. 314244 1 September 2012 - 31 August 2015 Page 14 of 77
3.1.1.2 Test set-up
3.1.1.2.1 Transversal and Fingerprint measurements The following section includes a particular implementation of the aforementioned procedure described in chapter 3.1.1 for passive effects. The influence of separated parts of the ECB poles on the wheel sensor readouts are analysed individually: only pole cores, pole cores of different types (L4 and L5), and a combination of diverse load impedances as boundary conditions describing ECB magnet electrical connections. The goal is to extract meaningful laboratory test results to pin down which is the part of the ECB that has the major negative impact on signalling system readouts. The following details come from Frauscher’s reports (D4060-1 section 4.1).
3.1.1.2.1.1 Set‐up:1L4PoleCoresonlywithIntegralBeamThe experimental setup is shown in Figure 2. A RSR180 and a RSR123 are mounted on a 2 meter length of UIC60 on the web of the rail using EXC10 bolts. Distances A and B are measured and shown in Table 1.
Sensor Type Distance A (mm) Distance B(mm)
RSR180 45 6
RSR123 47 6
Table 1: Mounting details of both Frauscher sensors
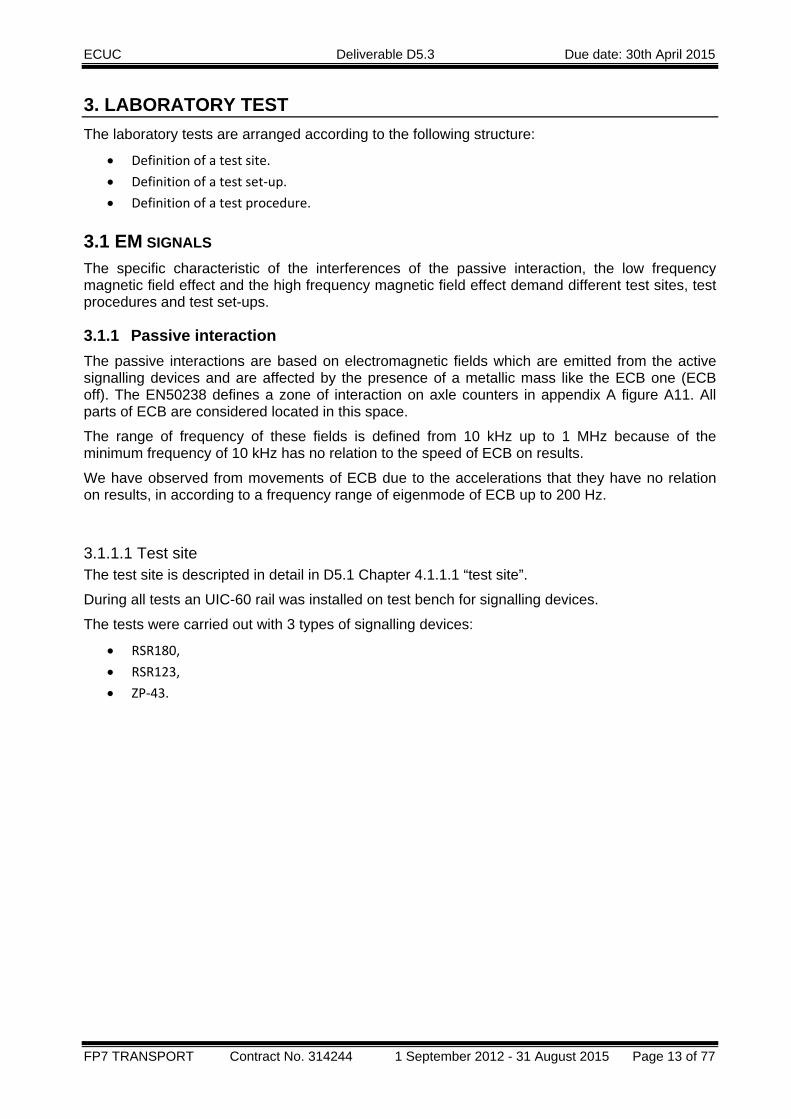
The positions of the two wheel sensors relative to the ends of the rail are shown in Figure 2. This rail was then placed on a series of runners which allowed the rail to move linearly in the x-direction. An electric motor and a toothed belt were used to drive the rail in both positive and negative x-directions. The range of the movement is however limited to the positions shown in Figure 3 which resulted in the respective signals for each sensor not returning to an undamped level at the reversal of direction for one end of the traversal. After mounting, both sensors were calibrated; the RSR180 using the IMC and the RSR123 using the AMB001 Adjustment and Maintenance Box.
Eight pole cores were mounted on the integral beam but were left electrically isolated (not connected to one another). The integral beam with cores was lifted using the ceiling crane and positioned over the rail. Two stiff, plastic boards were clamped to the integral beam on both ends using G-clamps. These were required to prevent the ECB from rotating and keeping it parallel to the rail. It also acted as a mechanical limit for defining the offset between the middle of the rail and the middle of the ECB, see Figure 2.
Offsets of -28mm, -10mm, 0mm, 10mm and 28mm were measured which are derived from the lateral tolerances of the position of the ECB over the rail. These ECB tolerances are directly governed by the wheel / rail tolerances and mounting position of the ECB on the bogie. The neutral position is 10mm towards the outside of the rail. A positive offset is equivalent to a displacement in the negative y-direction. The air gap between ECB and TOR was fixed to be 7 mm for all measurements.
The signals from the RSR180 and RSR123 sensors were fed to an IMC and an EIB respectively. The analogue output ports were utilised to extract the signals using 2mm banana plugs to BNC adapters and input into a Dewetron ADC. The digitised signals were then read by a DasyLab programme on a laptop PC at 1 kHz.

ECUC Deliverable D5.3 Due date: 30th April 2015
FP7 TRANSPORT Contract No. 314244 1 September 2012 - 31 August 2015 Page 15 of 77
Figure 2: Physical setup and schematic for the ECB traversal measurements
ECUC Deliverable D5.3 Due date: 30th April 2015
FP7 TRANSPORT Contract No. 314244 1 September 2012 - 31 August 2015 Page 16 of 77
Figure 3: The limits of movement for the rail
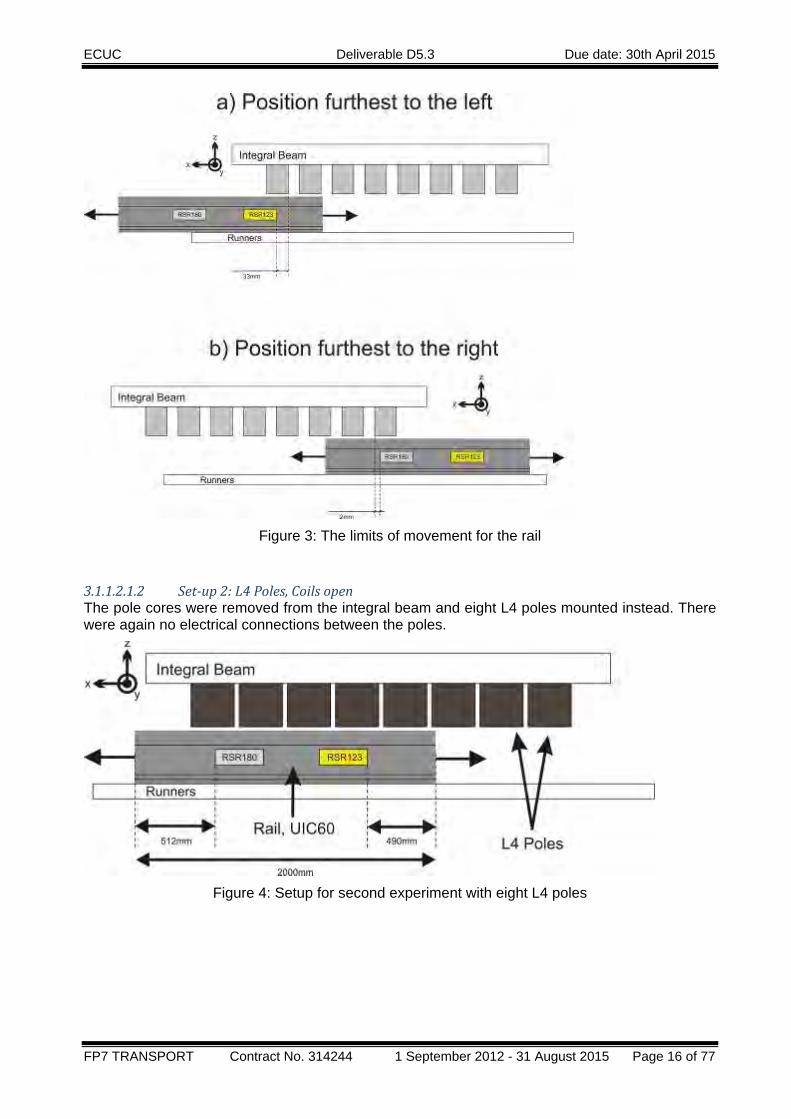
3.1.1.2.1.2 Set‐up2:L4Poles,CoilsopenThe pole cores were removed from the integral beam and eight L4 poles mounted instead. There were again no electrical connections between the poles.
Figure 4: Setup for second experiment with eight L4 poles
ECUC Deliverable D5.3 Due date: 30th April 2015
FP7 TRANSPORT Contract No. 314244 1 September 2012 - 31 August 2015 Page 17 of 77
3.1.1.2.1.3 Set‐up3:L4Poles,Coilsinseries+ImpedanceLoadThe setup is identical with the previous setup, setup 2, except all poles are connected in series and the two end contacts are connected to different impedance loads described in Table 2: List of impedances. Additionally, the integral beam is considered to be the ground reference for the system and is connected to the impedance loads. For some measurements this ground connection is disconnected to compare the signals to the grounded equivalent.
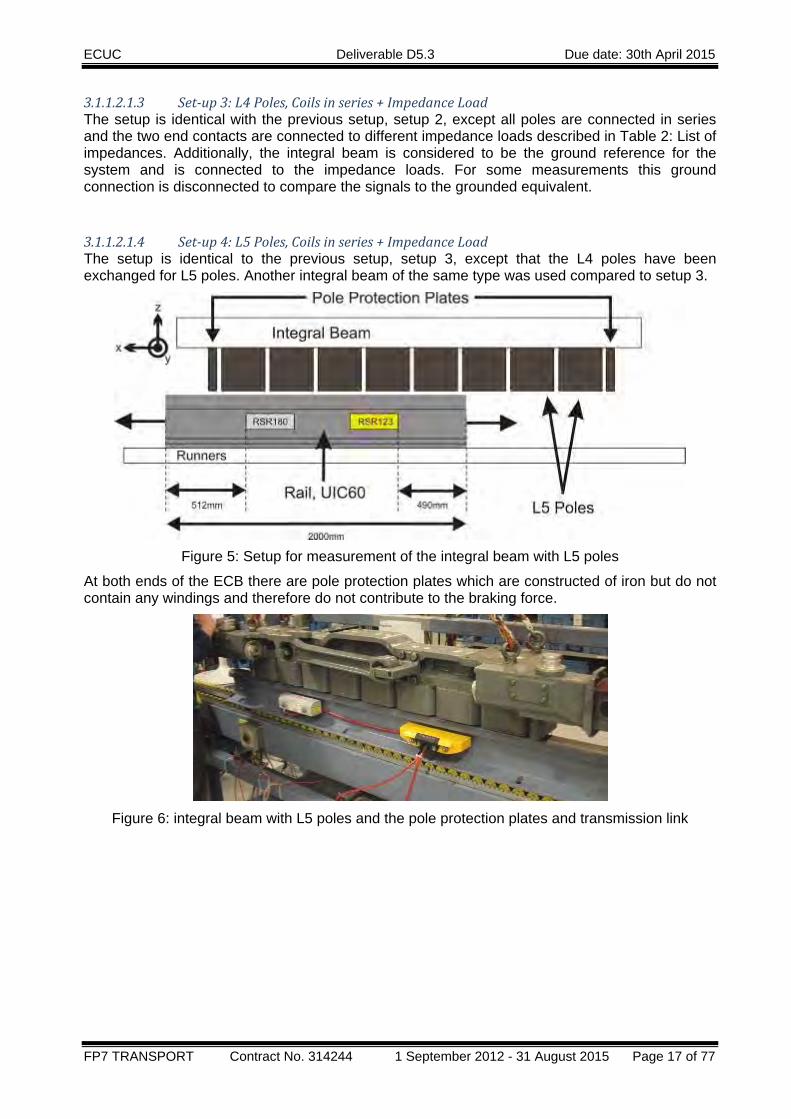
3.1.1.2.1.4 Set‐up4:L5Poles,Coilsinseries+ImpedanceLoadThe setup is identical to the previous setup, setup 3, except that the L4 poles have been exchanged for L5 poles. Another integral beam of the same type was used compared to setup 3.
Figure 5: Setup for measurement of the integral beam with L5 poles
At both ends of the ECB there are pole protection plates which are constructed of iron but do not contain any windings and therefore do not contribute to the braking force.
Figure 6: integral beam with L5 poles and the pole protection plates and transmission link
ECUC Deliverable D5.3 Due date: 30th April 2015
FP7 TRANSPORT Contract No. 314244 1 September 2012 - 31 August 2015 Page 18 of 77
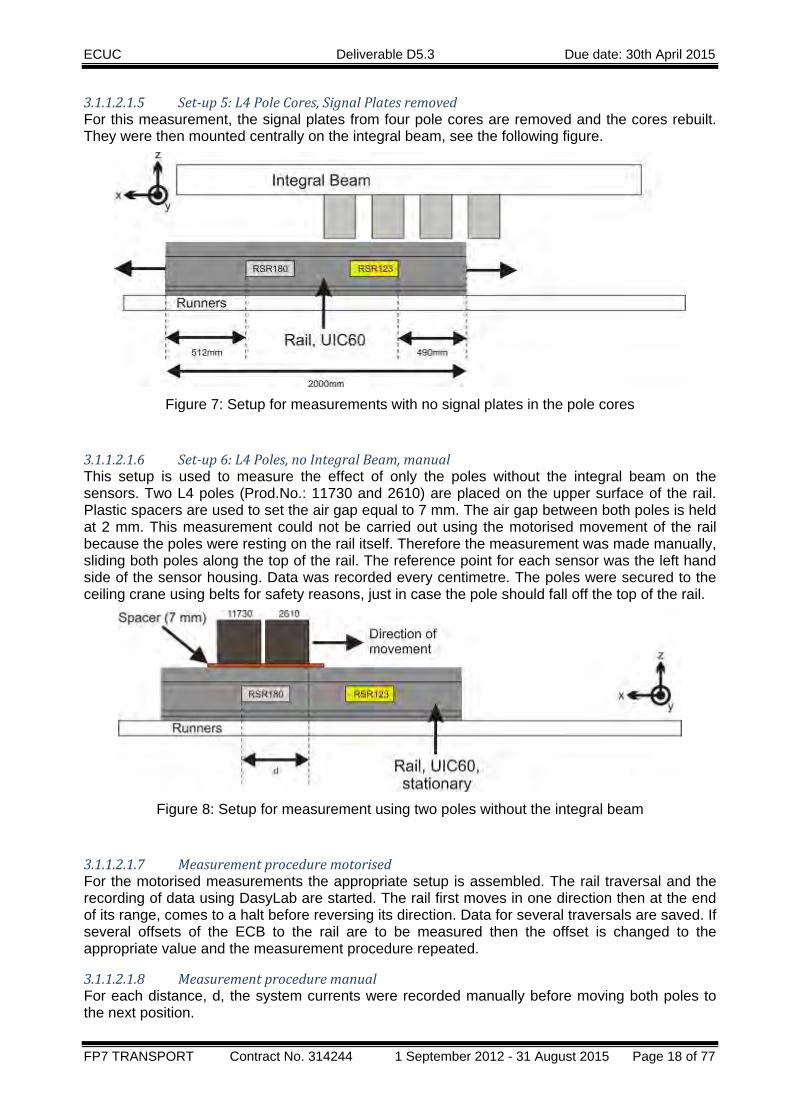
3.1.1.2.1.5 Set‐up5:L4PoleCores,SignalPlatesremovedFor this measurement, the signal plates from four pole cores are removed and the cores rebuilt. They were then mounted centrally on the integral beam, see the following figure.
Figure 7: Setup for measurements with no signal plates in the pole cores
3.1.1.2.1.6 Set‐up6:L4Poles,noIntegralBeam,manualThis setup is used to measure the effect of only the poles without the integral beam on the sensors. Two L4 poles (Prod.No.: 11730 and 2610) are placed on the upper surface of the rail. Plastic spacers are used to set the air gap equal to 7 mm. The air gap between both poles is held at 2 mm. This measurement could not be carried out using the motorised movement of the rail because the poles were resting on the rail itself. Therefore the measurement was made manually, sliding both poles along the top of the rail. The reference point for each sensor was the left hand side of the sensor housing. Data was recorded every centimetre. The poles were secured to the ceiling crane using belts for safety reasons, just in case the pole should fall off the top of the rail.
Figure 8: Setup for measurement using two poles without the integral beam
3.1.1.2.1.7 MeasurementproceduremotorisedFor the motorised measurements the appropriate setup is assembled. The rail traversal and the recording of data using DasyLab are started. The rail first moves in one direction then at the end of its range, comes to a halt before reversing its direction. Data for several traversals are saved. If several offsets of the ECB to the rail are to be measured then the offset is changed to the appropriate value and the measurement procedure repeated.
3.1.1.2.1.8 MeasurementproceduremanualFor each distance, d, the system currents were recorded manually before moving both poles to the next position.

ECUC Deliverable D5.3 Due date: 30th April 2015
FP7 TRANSPORT Contract No. 314244 1 September 2012 - 31 August 2015 Page 19 of 77
3.1.1.2.2 Standard Fingerprint According to the defined cross section of interaction - EN50238 - the measured magnets were in series configuration with all additional mounted parts which can occupy this cross section.
Parts outside of this cross section weren’t mounted.
The bodies of ECB and the test bench were grounded (electrically connected to the earth).
The serial connectors on ECB-magnet were connected up to the emulated power supply modelled by impedances.
Table 2: List of impedances
For more details see D5.1 chapter 4.1.1.2.1.
ECUC Deliverable D5.3 Due date: 30th April 2015
FP7 TRANSPORT Contract No. 314244 1 September 2012 - 31 August 2015 Page 20 of 77
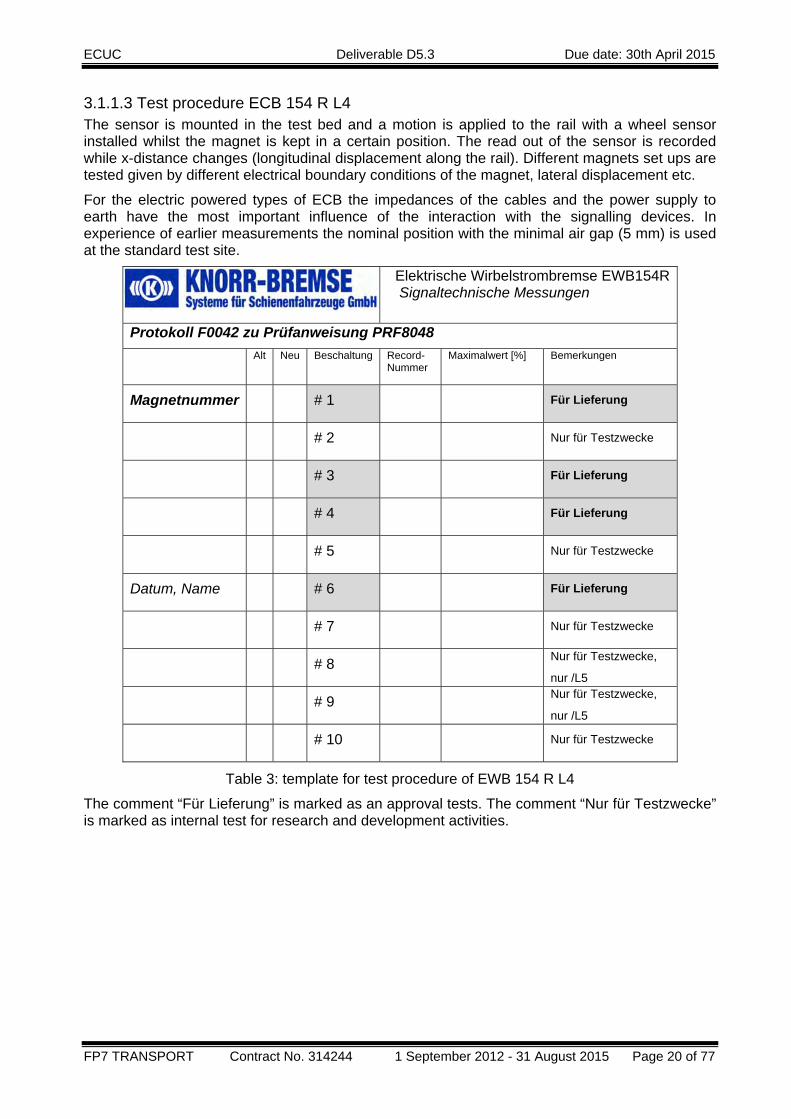
3.1.1.3 Test procedure ECB 154 R L4 The sensor is mounted in the test bed and a motion is applied to the rail with a wheel sensor installed whilst the magnet is kept in a certain position. The read out of the sensor is recorded while x-distance changes (longitudinal displacement along the rail). Different magnets set ups are tested given by different electrical boundary conditions of the magnet, lateral displacement etc.
For the electric powered types of ECB the impedances of the cables and the power supply to earth have the most important influence of the interaction with the signalling devices. In experience of earlier measurements the nominal position with the minimal air gap (5 mm) is used at the standard test site.
Elektrische Wirbelstrombremse EWB154R Signaltechnische Messungen
Protokoll F0042 zu Prüfanweisung PRF8048 Alt Neu Beschaltung Record-
Nummer Maximalwert [%] Bemerkungen
Magnetnummer # 1 Für Lieferung
# 2 Nur für Testzwecke
# 3 Für Lieferung
# 4 Für Lieferung
# 5 Nur für Testzwecke
Datum, Name # 6 Für Lieferung
# 7 Nur für Testzwecke
# 8 Nur für Testzwecke,
nur /L5
# 9 Nur für Testzwecke,
nur /L5
# 10 Nur für Testzwecke
Table 3: template for test procedure of EWB 154 R L4
The comment “Für Lieferung” is marked as an approval tests. The comment “Nur für Testzwecke” is marked as internal test for research and development activities.

ECUC Deliverable D5.3 Due date: 30th April 2015
FP7 TRANSPORT Contract No. 314244 1 September 2012 - 31 August 2015 Page 21 of 77
3.1.1.3.1 Test (ECB 154 R L4) with RSR180 by Frauscher For the axle counter RSR180 a type test acceptance criteria doesn’t exist before the current test. It was to analyse the common dependencies of the level of interference. Following section includes details from Frauscher report D4060-1 chapter 4.2. [4]
It is used the standard set-up EWB 154 R L4.
3.1.1.3.1.1 InfluenceoflateraldisplacementsThe influence of lateral displacement was the first parameter which has been analysed.
Figure 9: influence of lateral displacement
The lateral displacement respect to the rail (Y= -28 mm, -10 mm, 0 mm, 10 mm, 28 mm) has a significant influence on level of interference. Positive distance means moving away from the wheel sensor. Distance=0 mm equals to a symmetric position of the ECB respect to the rail. The greatest inference is measured in maximum negative lateral displacement.
The wheel detection threshold is typically set at 75% of the undamped current. In this case the undamped current equals approximately 3.2 mA and therefore the threshold for wheel detection is 2.4 mA.

ECUC Deliverable D5.3 Due date: 30th April 2015
FP7 TRANSPORT Contract No. 314244 1 September 2012 - 31 August 2015 Page 22 of 77
3.1.1.3.1.2 InfluenceofgroundingconditionsThe grounding conditions could also have an impact of interference. This parameter is analysed next.
Figure 10: influence of grounding
No difference in measurements was determined. The connection of the ECB magnet to the earth has no impact on interference.
3.1.1.3.1.3 InfluenceofimpedanceloadThe next parameter which could have an impact of interference is the impedance loads that mimic different position of the magnet along the train.
Figure 11: impact of impedance loads on interferences
Changing the impedance load had no effect on the interference. The example comparison is shown in Figure 11 which is identical with all other impedance load settings from #1 up to #10.
ECUC Deliverable D5.3 Due date: 30th April 2015
FP7 TRANSPORT Contract No. 314244 1 September 2012 - 31 August 2015 Page 23 of 77
3.1.1.3.2 Test (ECB 154 R L4) with RSR123 by Frauscher For the axle counter RSR123 doesn’t exist a type test acceptance criteria before. It was to analyse the common dependencies of the level of interference. Typically the threshold for positive wheel detection is defined to be approximately 3.75mA.
Following section includes details from Frauscher report D4060-1 chapter 4.2. [4] It is used the standard set-up EWB 154 R L4.
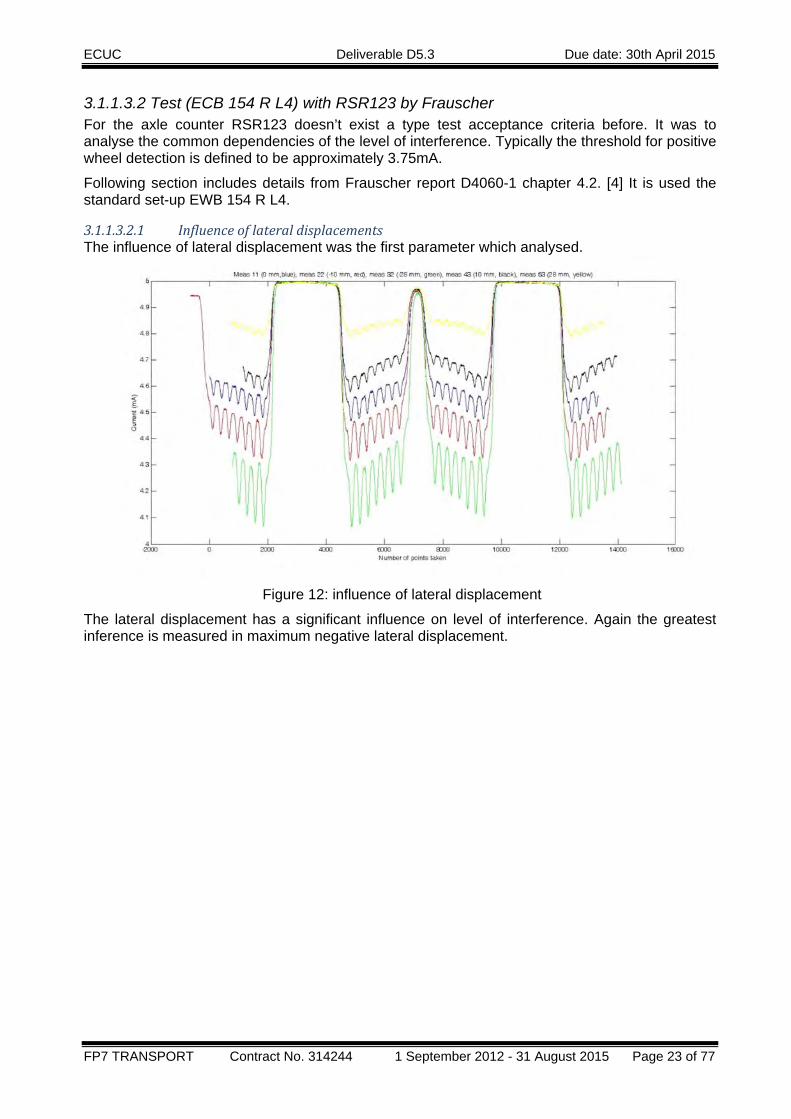
3.1.1.3.2.1 InfluenceoflateraldisplacementsThe influence of lateral displacement was the first parameter which analysed.
Figure 12: influence of lateral displacement
The lateral displacement has a significant influence on level of interference. Again the greatest inference is measured in maximum negative lateral displacement.
ECUC Deliverable D5.3 Due date: 30th April 2015
FP7 TRANSPORT Contract No. 314244 1 September 2012 - 31 August 2015 Page 24 of 77
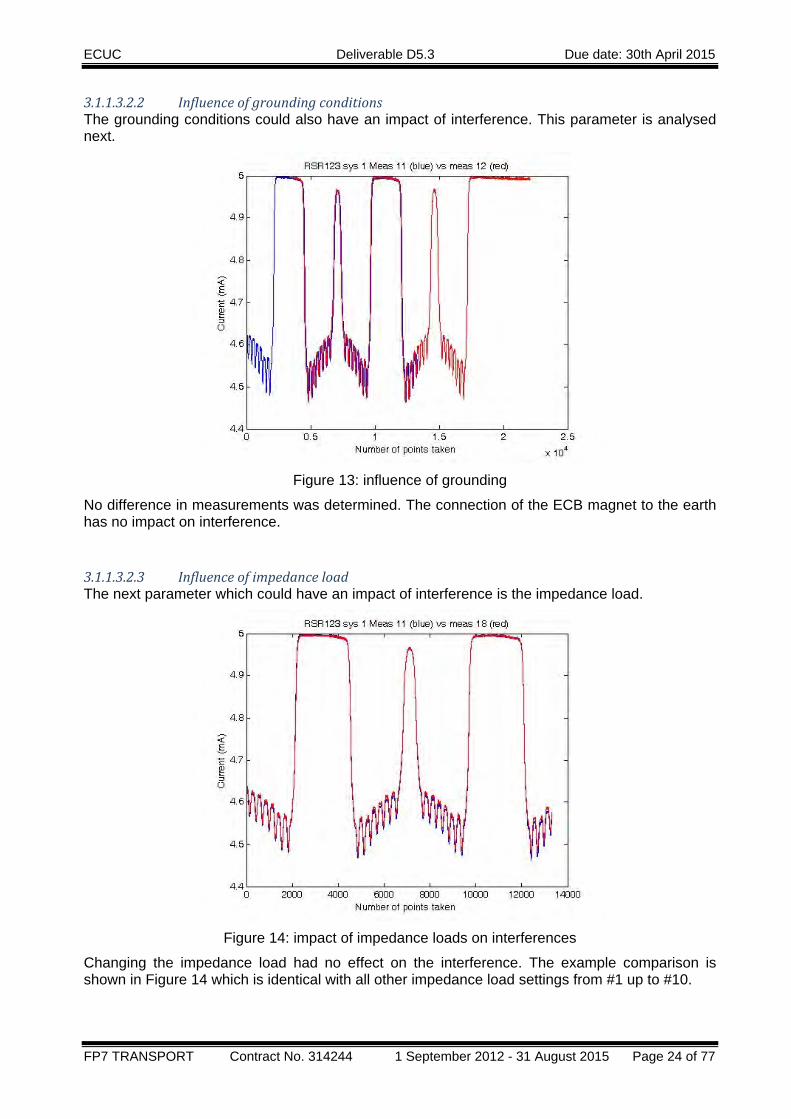
3.1.1.3.2.2 InfluenceofgroundingconditionsThe grounding conditions could also have an impact of interference. This parameter is analysed next.
Figure 13: influence of grounding
No difference in measurements was determined. The connection of the ECB magnet to the earth has no impact on interference.
3.1.1.3.2.3 InfluenceofimpedanceloadThe next parameter which could have an impact of interference is the impedance load.
Figure 14: impact of impedance loads on interferences
Changing the impedance load had no effect on the interference. The example comparison is shown in Figure 14 which is identical with all other impedance load settings from #1 up to #10.
ECUC Deliverable D5.3 Due date: 30th April 2015
FP7 TRANSPORT Contract No. 314244 1 September 2012 - 31 August 2015 Page 25 of 77
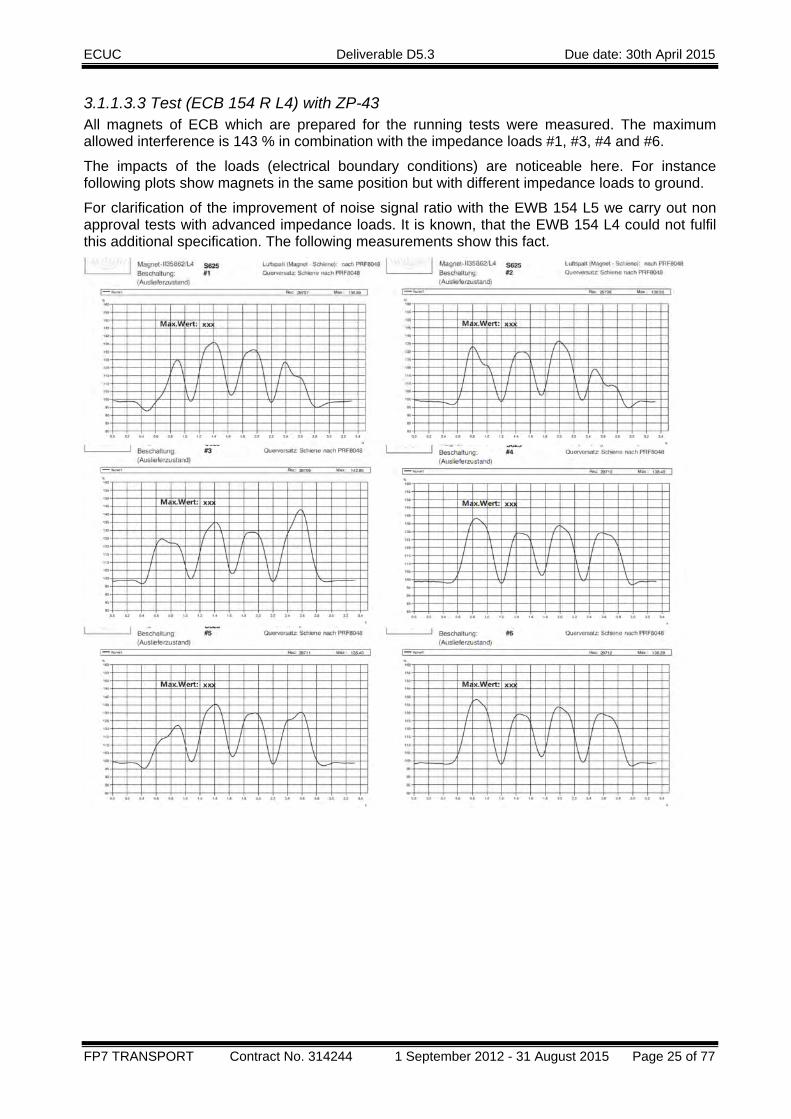
3.1.1.3.3 Test (ECB 154 R L4) with ZP-43 All magnets of ECB which are prepared for the running tests were measured. The maximum allowed interference is 143 % in combination with the impedance loads #1, #3, #4 and #6.
The impacts of the loads (electrical boundary conditions) are noticeable here. For instance following plots show magnets in the same position but with different impedance loads to ground.
For clarification of the improvement of noise signal ratio with the EWB 154 L5 we carry out non approval tests with advanced impedance loads. It is known, that the EWB 154 L4 could not fulfil this additional specification. The following measurements show this fact.
ECUC Deliverable D5.3 Due date: 30th April 2015
FP7 TRANSPORT Contract No. 314244 1 September 2012 - 31 August 2015 Page 26 of 77
Figure 15: interference (ECB 154 R L4) with different impedance loads, magnet S625
Beschaltung Magnet S42 Magnet S452 Magnet S893 Magnet S625
# 1 141.0 137.8 128.8 136.0
# 2 132.2 136.5
# 3 140.1 140.2 140.6 142.9
# 4 138.7 138.3 134.5 138.9
# 5 128.2 135.4
# 6 138.6 138.2 134.5 138.4
# 7 127.9 135.8
# 8 168.5 168.4
# 9 129.8 135.9
# 10 140.9 143.4
Table 4: test protocol of magnets to ECB 154 R L4
The first column in Table 4 corresponds to Table 2 impedances. The maximum of interference over all measured magnets is 142.9 (magnet S625). All magnets fulfil the criteria if the level of interference is less than 143.

ECUC Deliverable D5.3 Due date: 30th April 2015
FP7 TRANSPORT Contract No. 314244 1 September 2012 - 31 August 2015 Page 27 of 77
The load case #3 comes typical to the maximum interference. As the test procedure shows also another load case #1 can lead to a maximum interference.
On load case #8 the maximum of interference is raised from 142.9 to 168.4. The reason is the impedance (3 Ohm, phase -85°). This reconfirmed the knowledge that impedances have a big influence on interference with this type of axle counter.
3.1.1.4 Test procedure ECB 154 R L5 For the electric powered types of ECB the impedances of the cables and the power supply to earth have the most important influence on the interaction with the signalling devices. By experience of earlier measurements the nominal position with the minimal air gap (5 mm) is used at the test site.
Elektrische Wirbelstrombremse EWB154R Signaltechnische Messungen
Protokoll F0042 zu Prüfanweisung PRF12283 Alt Neu Beschaltung Record-
Nummer Maximalwert [%] Bemerkungen
Magnetnummer # 1 Für Lieferung
# 2 Nur für Testzwecke
# 3 Für Lieferung
# 4 Für Lieferung
# 5 Nur für Testzwecke
Datum, Name # 6 Für Lieferung
# 7 Nur für Testzwecke
# 8 Für Lieferung
# 9 Nur für Testzwecke,
nur /L5
# 10 Nur für Testzwecke
Table 5: template for test procedure of ECB 154 R L5

ECUC Deliverable D5.3 Due date: 30th April 2015
FP7 TRANSPORT Contract No. 314244 1 September 2012 - 31 August 2015 Page 28 of 77
3.1.1.4.1 Test (ECB 154 R L5) with RSR180 and RSR123 No measurable difference could be measured between EWB 154 L4 and EWB 154 L5 in the same ECB setting for RSR 123 and RSR 180. The difference in the signals shown in figures below is assumed to be due to the aforementioned imperfect parallel alignment of the ECB magnets to rail. Following section includes details from Frauscher report D4060-1 chapter 4.2. [4]
Figure 16: comparison of EWB 154 L4 and EWB 154 L5, RSR180, maximum negative lateral
displacement
Figure 17: comparison of EWB 154 L4 and EWB 154 L5, RSR123, maximum negative lateral
displacement

ECUC Deliverable D5.3 Due date: 30th April 2015
FP7 TRANSPORT Contract No. 314244 1 September 2012 - 31 August 2015 Page 29 of 77
3.1.1.4.2 Test (ECB 154 R L5) with ZP-43 All magnets of ECB prepared for the running tests were measured. The maximum allowed interference is 143 % in combination with the impedance loads #1, #3, #4, #6 and #8.
For instance following plots show magnet S1038 in the same position but with different impedance loads to ground.
For clarification of the improvement of noise signal ratio with the EWB 154 L5 we carried out non approval tests with advanced impedance loads.

ECUC Deliverable D5.3 Due date: 30th April 2015
FP7 TRANSPORT Contract No. 314244 1 September 2012 - 31 August 2015 Page 30 of 77
Figure 18: interference (ECB 154 R L5) with different impedance loads, magnet S1038
ECUC Deliverable D5.3 Due date: 30th April 2015
FP7 TRANSPORT Contract No. 314244 1 September 2012 - 31 August 2015 Page 31 of 77
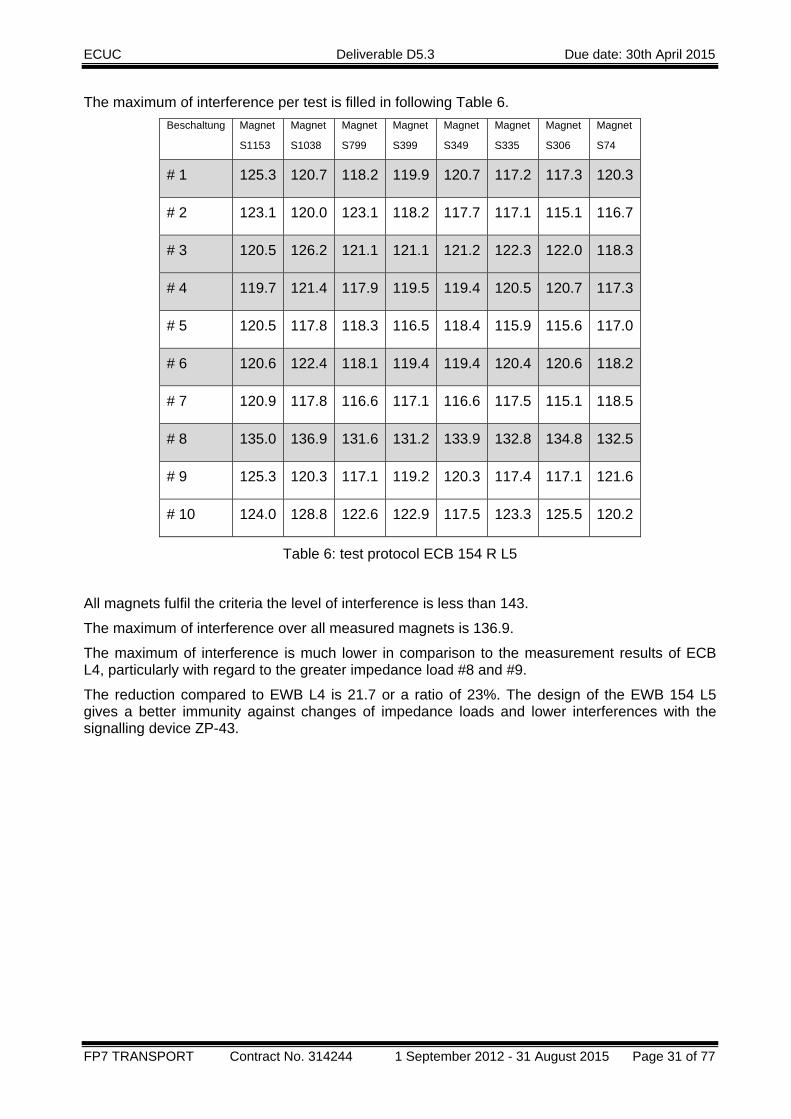
The maximum of interference per test is filled in following Table 6. Beschaltung Magnet
S1153
Magnet
S1038
Magnet
S799
Magnet
S399
Magnet
S349
Magnet
S335
Magnet
S306
Magnet
S74
# 1 125.3 120.7 118.2 119.9 120.7 117.2 117.3 120.3
# 2 123.1 120.0 123.1 118.2 117.7 117.1 115.1 116.7
# 3 120.5 126.2 121.1 121.1 121.2 122.3 122.0 118.3
# 4 119.7 121.4 117.9 119.5 119.4 120.5 120.7 117.3
# 5 120.5 117.8 118.3 116.5 118.4 115.9 115.6 117.0
# 6 120.6 122.4 118.1 119.4 119.4 120.4 120.6 118.2
# 7 120.9 117.8 116.6 117.1 116.6 117.5 115.1 118.5
# 8 135.0 136.9 131.6 131.2 133.9 132.8 134.8 132.5
# 9 125.3 120.3 117.1 119.2 120.3 117.4 117.1 121.6
# 10 124.0 128.8 122.6 122.9 117.5 123.3 125.5 120.2
Table 6: test protocol ECB 154 R L5
All magnets fulfil the criteria the level of interference is less than 143.
The maximum of interference over all measured magnets is 136.9.
The maximum of interference is much lower in comparison to the measurement results of ECB L4, particularly with regard to the greater impedance load #8 and #9.
The reduction compared to EWB L4 is 21.7 or a ratio of 23%. The design of the EWB 154 L5 gives a better immunity against changes of impedance loads and lower interferences with the signalling device ZP-43.
ECUC Deliverable D5.3 Due date: 30th April 2015
FP7 TRANSPORT Contract No. 314244 1 September 2012 - 31 August 2015 Page 32 of 77
3.1.1.5 Test procedure new ECB For the EMC full encapsulated magnet of the new type ECB the position is significant in reference to the signalling devices for the tests of passive effects. The principle of this type of axle counter is based on detection of the wheel flange. It is expected, that a negative lateral displacement of the ECB Magnet generates greater interferences than a positive lateral displacement.
The full encapsulated magnet shields the coils from the high-frequency magnetic fields, therefore the influence of the impedances of the coils to earth is neglected.
The influence of the kind of optimization is analysed by 3 types:
• Without any optimization, • Optimization 1-1-2-2, • Optimization 1-2-3-4.
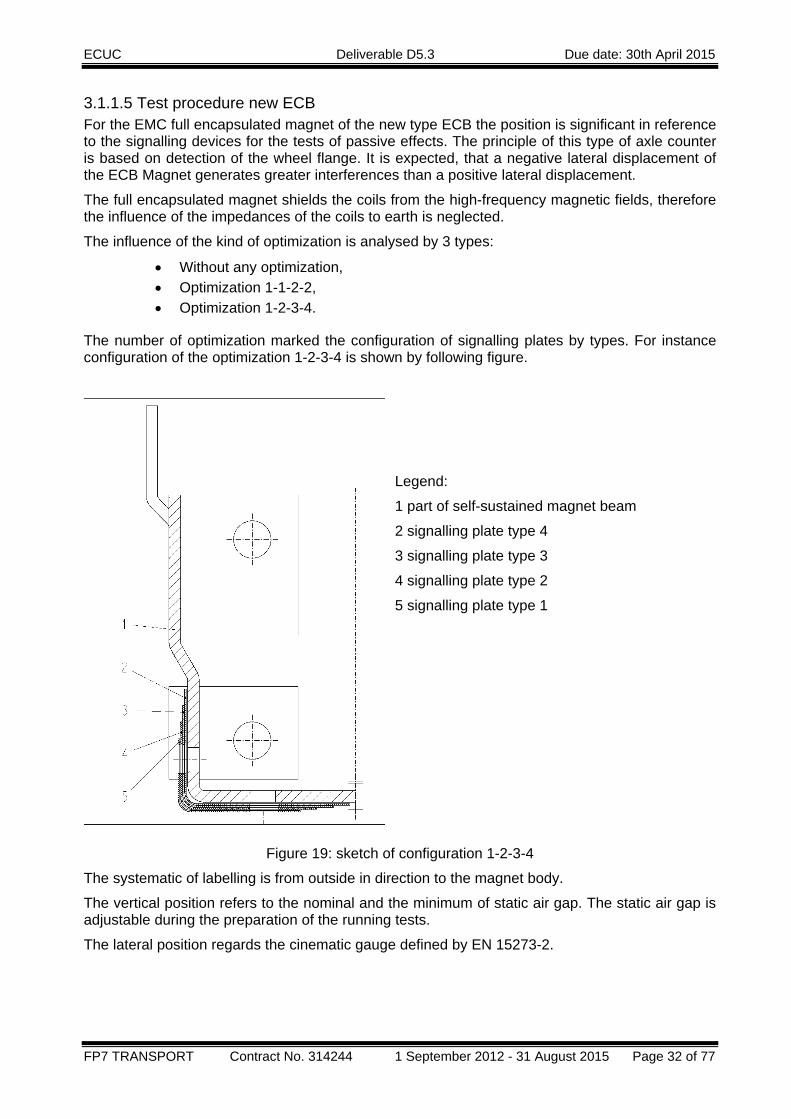
The number of optimization marked the configuration of signalling plates by types. For instance configuration of the optimization 1-2-3-4 is shown by following figure.
Legend:
1 part of self-sustained magnet beam
2 signalling plate type 4
3 signalling plate type 3
4 signalling plate type 2
5 signalling plate type 1
Figure 19: sketch of configuration 1-2-3-4
The systematic of labelling is from outside in direction to the magnet body.
The vertical position refers to the nominal and the minimum of static air gap. The static air gap is adjustable during the preparation of the running tests.
The lateral position regards the cinematic gauge defined by EN 15273-2.

ECUC Deliverable D5.3 Due date: 30th April 2015
FP7 TRANSPORT Contract No. 314244 1 September 2012 - 31 August 2015 Page 33 of 77
The parameters varied during the experiment to measure the interference to RSR180 and RSR123 are the:
• Vertical position (Air Gap) • 7 mm is the nominal air gap between ECB and the top of the rail. • 3 mm is the minimum static air gap.
Lateral position (displacement from the nominal position):
• +11.5 mm is the maximum of positive lateral displacement, • 0 is the nominal position, • -10 mm is the center of the rail position, • -20 mm a greater negative lateral displacement, • -27.5 mm is the maximum of negative lateral displacement.
Dependent on different principle of ZP43 the parameters varied during the experiment to measure the interference are:
Vertical position (Air Gap):
• 7 mm is the nominal air gap between ECB and the top of the rail. • 5 mm is the minimum static air gap.
Lateral position (displacement from the nominal position)
• +27.5 mm is the maximum of positive lateral displacement, • -10 mm is the center of the rail position, • 0 is the nominal position, • -27.5 mm is the maximum of negative lateral displacement.
In the following summaries of all tests divided by the type of signalling devices are given for a better overview.
ECUC Deliverable D5.3 Due date: 30th April 2015
FP7 TRANSPORT Contract No. 314244 1 September 2012 - 31 August 2015 Page 34 of 77
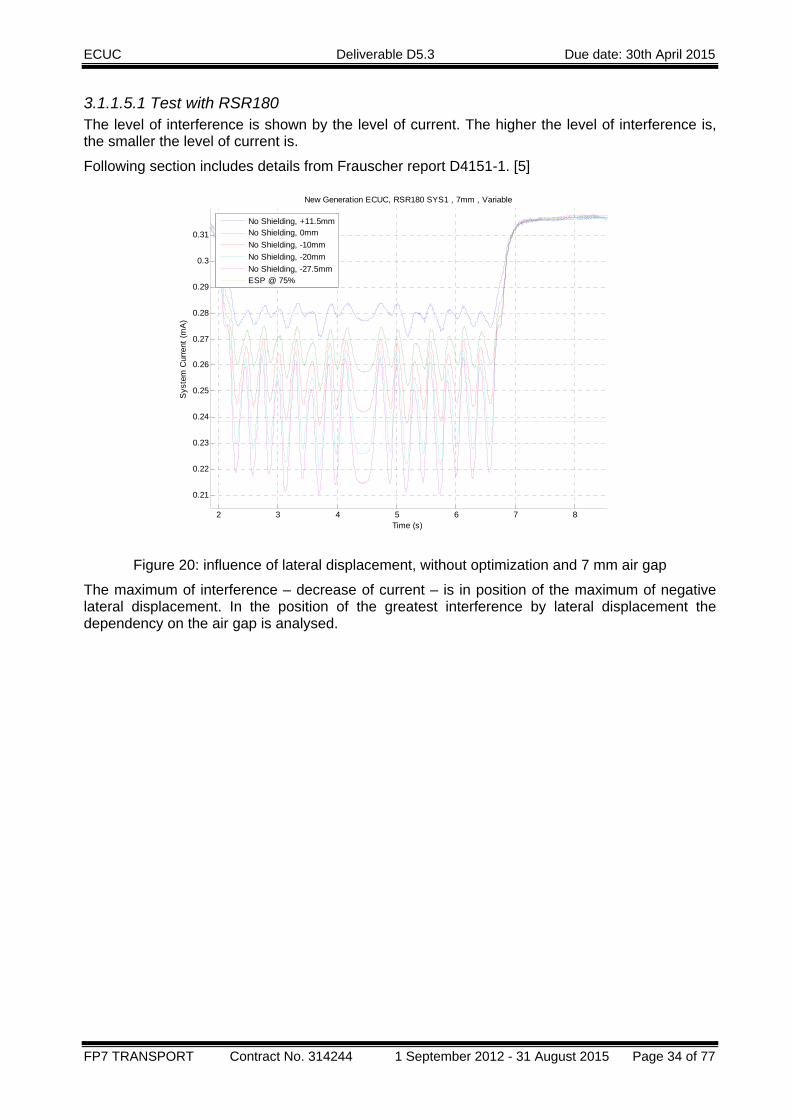
3.1.1.5.1 Test with RSR180 The level of interference is shown by the level of current. The higher the level of interference is, the smaller the level of current is.
Following section includes details from Frauscher report D4151-1. [5]
Figure 20: influence of lateral displacement, without optimization and 7 mm air gap
The maximum of interference – decrease of current – is in position of the maximum of negative lateral displacement. In the position of the greatest interference by lateral displacement the dependency on the air gap is analysed.
2 3 4 5 6 7 8
0.21
0.22
0.23
0.24
0.25
0.26
0.27
0.28
0.29
0.3
0.31
New Generation ECUC, RSR180 SYS1 , 7mm , Variable
Time (s)
Sys
tem
Cur
rent
(mA
)
No Shielding, +11.5mmNo Shielding, 0mmNo Shielding, -10mmNo Shielding, -20mmNo Shielding, -27.5mmESP @ 75%
ECUC Deliverable D5.3 Due date: 30th April 2015
FP7 TRANSPORT Contract No. 314244 1 September 2012 - 31 August 2015 Page 35 of 77
Figure 21: influence of air gap, without optimization and maximum of negative lateral
displacement
The measurements show that the level of interference depends on air gap. The smaller the air gap the greater the level of interference is.
At the position of maximum of negative lateral displacement and the smallest air gap the level of interference is the biggest.
The test is repeated with an optimized ECB magnet in configuration 1-1-2-2.
Figure 22: influence of lateral displacement, optimization 1-1-2-2 and 7 mm air gap
6 7 8 9 10 11 12
0.18
0.2
0.22
0.24
0.26
0.28
0.3
0.32
New Generation ECUC, RSR180 SYS1 , Variable , -27.5mm
Time (s)
Sys
tem
Cur
rent
(mA
)
No shielding, 7mmNo shielding, 5mmNo shielding, 3mmESP @ 75%
5 6 7 8 9 10 11 12
0.24
0.25
0.26
0.27
0.28
0.29
0.3
0.31
0.32New Generation ECUC, RSR180 SYS1 , 7mm , Variable
Time (s)
Sys
tem
Cur
rent
(mA
)
Shielding 2x 1122, +11.5mmShielding 2x 1122, 0mmShielding 2x 1122, -10mmShielding 2x 1122, -20mmShielding 2x 1122, -27.5mmESP @ 75%

ECUC Deliverable D5.3 Due date: 30th April 2015
FP7 TRANSPORT Contract No. 314244 1 September 2012 - 31 August 2015 Page 36 of 77
Figure 23: influence of lateral displacement, optimization 1-1-2-2 and 3 mm air gap
The dependency on lateral displacement and also on air gap is given. The optimization does reduce the level of interference from 0.178 to 0.223.
As next the optimization 1-2-3-4 is analysed.
Figure 24: influence of lateral displacement, optimization 1-2-3-4 and 7 mm air gap
8 9 10 11 12 13 14 15 16 17
0.23
0.24
0.25
0.26
0.27
0.28
0.29
0.3
0.31
0.32
New Generation ECUC, RSR180 SYS1 , 3mm , Variable
Time (s)
Sys
tem
Cur
rent
(mA
)
Shielding 2x 1122, +11.5mmShielding 2x 1122, 0mmShielding 2x 1122, -10mmShielding 2x 1122, -20mmShielding 2x 1122, -27.5mmESP @ 75%
5 6 7 8 9 10 11 12
0.24
0.25
0.26
0.27
0.28
0.29
0.3
0.31
0.32
New Generation ECUC, RSR180 SYS1 , 7mm , Variable
Time (s)
Sys
tem
Cur
rent
(mA
)
Shielding 2x 1234, +11.5mmShielding 2x 1234, 0mmShielding 2x 1234, -10mmShielding 2x 1234, -20mmShielding 2x 1234, -27.5mmESP @ 75%

ECUC Deliverable D5.3 Due date: 30th April 2015
FP7 TRANSPORT Contract No. 314244 1 September 2012 - 31 August 2015 Page 37 of 77
Figure 25: influence of lateral displacement, optimization 1-2-3-4 and 3 mm air gap
The optimization 1-2-3-4 does reduce the level of interference from 0,178 to 0,23. This is better than the optimization 1-1-2-2.
5 6 7 8 9 10 11 12
0.23
0.24
0.25
0.26
0.27
0.28
0.29
0.3
0.31
New Generation ECUC, RSR123 SYS2 , 3mm , Variable
Time (s)
Sys
tem
Cur
rent
(mA
)
Shielding 2x 1234, +11.5mmShielding 2x 1234, 0mmShielding 2x 1234, -10mmShielding 2x 1234, -20mmShielding 2x 1234, -27.5mm

ECUC Deliverable D5.3 Due date: 30th April 2015
FP7 TRANSPORT Contract No. 314244 1 September 2012 - 31 August 2015 Page 38 of 77
3.1.1.5.2 Test with RSR123 The level of interference is shown by the value of current. The higher the level of interference is, the smaller the level of current is. Following section includes details from Frauscher report D4151-1. [5]
Figure 26: influence of lateral displacement, without optimization, 7 mm air gap
Figure 27: influence of air gap, without optimization, maximum of negative lateral
6 7 8 9 10 11
0.38
0.4
0.42
0.44
0.46
0.48
New Generation ECUC, RSR123 SYS1 , 7mm , Variable
Time (s)
Sys
tem
Cur
rent
(mA
)
No shielding, +11.5mmNo shielding, 0mmNo shielding, -10mmNo shielding, -20mmNo shielding, -27.5mmESP@75%
1 2 3 4 5 6 7 8
0.38
0.4
0.42
0.44
0.46
0.48
0.5
New Generation ECUC, RSR123 SYS1 , Variable , -27.5mm
Time (s)
Sys
tem
Cur
rent
(mA
)
No shielding, 7mmNo shielding, 5mmNo shielding, 3mmESP @ 75%

ECUC Deliverable D5.3 Due date: 30th April 2015
FP7 TRANSPORT Contract No. 314244 1 September 2012 - 31 August 2015 Page 39 of 77
The measurements show that level of interference is dependent on the air gap. The smaller the air gap the greater the level of interference. In position of maximum of negative lateral displacement and the smallest air gap the level of interference is the biggest.
Important conclusion is that another type of axle counter but with a similar principle – detection of wheel flange – shows the same dependency by lateral displacement and air gap.
Following the test is repeated with an optimized ECB magnet in configuration 1-1-2-2.
Figure 28: influence of lateral displacement, optimization 1-1-2-2 and 7 mm air gap
Figure 29: influence of lateral displacement, optimization 1-1-2-2 and 3 mm air gap
1 2 3 4 5 6 7 8
0.38
0.4
0.42
0.44
0.46
0.48
0.5
New Generation ECUC, RSR123 SYS1 , 7mm , Variable
Time (s)
Sys
tem
Cur
rent
(mA
)
Shielding 2x 1122, +11.5mmShielding 2x 1122, 0mmShielding 2x 1122, -10mmShielding 2x 1122, -20mmShielding 2x 1122, -27.5mmESP @ 75%
5 6 7 8 9 10 11 12 13
0.38
0.4
0.42
0.44
0.46
0.48
0.5
New Generation ECUC, RSR123 SYS1 , 3mm , Variable
Time (s)
Sys
tem
Cur
rent
(mA
)
Shielding 2x 1122, +11.5mmShielding 2x 1122, 0mmShielding 2x 1122, -10mmShielding 2x 1122, -20mmShielding 2x 1122, -27.5mmESP @ 75%

ECUC Deliverable D5.3 Due date: 30th April 2015
FP7 TRANSPORT Contract No. 314244 1 September 2012 - 31 August 2015 Page 40 of 77
The dependency on lateral displacement and also on air gap is given. The optimization does reduce the level of interference from 0,37 to 0,398
As next the optimization 1-2-3-4 is analysed.
Figure 30: influence of lateral displacement, optimization 1-2-3-4 and 7 mm air gap
Figure 31: influence of lateral displacement, optimization 1-2-3-4 and 3 mm air gap
The optimization 1-2-3-4 does reduce the level of interference from 0.37 to 0.395.
2 3 4 5 6 7 8 9
0.38
0.4
0.42
0.44
0.46
0.48
0.5New Generation ECUC, RSR123 SYS1 , 7mm , Variable
Time (s)
Sys
tem
Cur
rent
(mA
)
Shielding 2x 1234, +11.5mmShielding 2x 1234, 0mmShielding 2x 1234, -10mmShielding 2x 1234, -20mmShielding 2x 1234, -27.5mmESP @ 75%
0 1 2 3 4 5 6 7 8 90.36
0.38
0.4
0.42
0.44
0.46
0.48
0.5New Generation ECUC, RSR123 SYS1 , 3mm , Variable
Time (s)
Sys
tem
Cur
rent
(mA
)
Shielding 2x 1234, +11.5mmShielding 2x 1234, 0mmShielding 2x 1234, -10mmShielding 2x 1234, -20mmShielding 2x 1234, -27.5mm

ECUC Deliverable D5.3 Due date: 30th April 2015
FP7 TRANSPORT Contract No. 314244 1 September 2012 - 31 August 2015 Page 41 of 77
The direct comparison of the level of interference between the variants of optimization is showed next figure.
Figure 32: comparison of level of interference depending on type of optimization
The optimization 1-2-3-4 – green line – shows the smallest level of interference.
1 2 3 4 5 6 7 8 9 10 11
0.38
0.4
0.42
0.44
0.46
0.48
0.5
New Generation ECUC, RSR123 SYS1 , 3mm , -27.5mm
Time (s)
Sys
tem
Cur
rent
(mA
)
No ShieldingShielding 2x 1234Shielding 2x 1122ESP @ 75%
ECUC Deliverable D5.3 Due date: 30th April 2015
FP7 TRANSPORT Contract No. 314244 1 September 2012 - 31 August 2015 Page 42 of 77
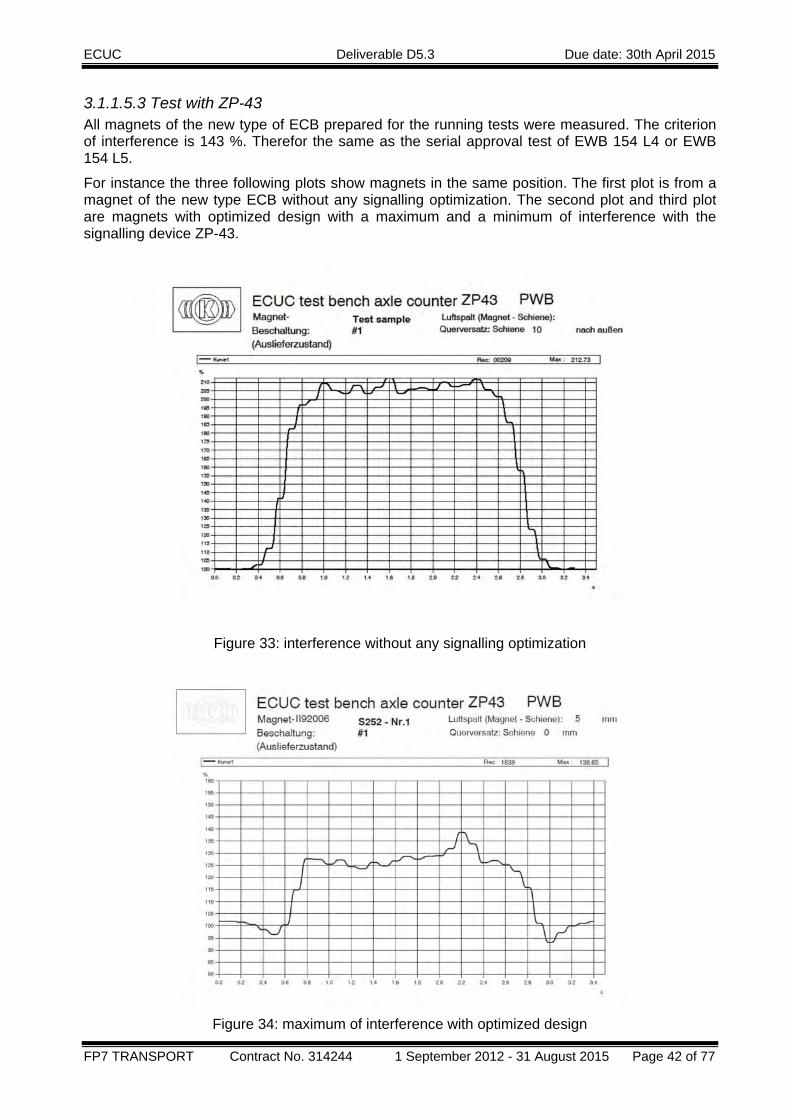
3.1.1.5.3 Test with ZP-43 All magnets of the new type of ECB prepared for the running tests were measured. The criterion of interference is 143 %. Therefor the same as the serial approval test of EWB 154 L4 or EWB 154 L5.
For instance the three following plots show magnets in the same position. The first plot is from a magnet of the new type ECB without any signalling optimization. The second plot and third plot are magnets with optimized design with a maximum and a minimum of interference with the signalling device ZP-43.
Figure 33: interference without any signalling optimization
Figure 34: maximum of interference with optimized design

ECUC Deliverable D5.3 Due date: 30th April 2015
FP7 TRANSPORT Contract No. 314244 1 September 2012 - 31 August 2015 Page 43 of 77
Figure 35: minimum of interference with optimized design
The maximum of interference per test is filled in following Table 7.
Air gap [mm] Maximum of interference 143 [%]
Min. Max.
Lateral position (y‐direction) relative to nominal position [mm] Number of magnet
Minimum Centre of rail
Nom. position Maximum
5 7 ‐27,5 ‐10 0 + 27,5
X 132 139 136 129 PWB 1 S252
X 132 137 135 128 PWB 1 S252
X 127 129 127 127 PWB 2 S184
X 126 127 126 125 PWB 2 S184
X 126 130 129 126 PWB 3 S2007
X 125 127 126 125 PWB 3 S2007
X 128 130 128 126 PWB 4 S551
X 126 128 126 125 PWB 4 S551
Table 7: test protocol new ECB serial number:
ECUC Deliverable D5.3 Due date: 30th April 2015
FP7 TRANSPORT Contract No. 314244 1 September 2012 - 31 August 2015 Page 44 of 77
All magnets fulfil the criteria the level of interference less than 143.
The minimum of interference is in position of maximum lateral displacement in direction to outside the track and independent on the level of air gap.
The maximum of interference is in position if the magnet symmetric over the rail (Centre of rail) and independent on the level of air gap.
The difference between the nominal position and the position (centre of rail) is 3. The ratio to the level of criteria (143) is about 2 %. This is independent on the level of air gap.
3.1.1.6 Summary of passive interaction The analysed axle counters can be divided in 2 groups.
RSR180 and RSR123 build the first group. They share a similar principle in the detecting of wheel flanges. Following conclusions can be drawn for the data: [3][5]
• There is no observable difference between ECB 154 R L4 and ECB 154 R L5 • Changing the value of the impedance loads of an ECB has no effect on
interference. • The ground connection to the ECB magnet is irrelevant. • The greatest interference appeals in the position of maximum negative lateral
displacement and the minimum air gap.
The other axle counter was ZP-43. He is an example for the other group of sensors. This group of sensors builds a magnetic stray field around the rail and the sensors are detecting the wheel (massive metal mass near the rail).
• The maximum of interference appears in the central position of rail of the ECB magnet.
• The impedance load has an important influence on the level of interference. • The optimization of coils of EWB 154R L5 shows a significant reduction of level of
interference.
The laboratory tests with 3 different types of axle counters show the possibility of optimization of the new type ECB to a smaller interference in relation to the passive effect. And this is not limited to the application of a new ECB only.
The new ECB configuration 1-2-3-4 shows with all 3 types of analysed axle counters the lowest level of interference. This variant will be used in running test for validation the laboratory measurements.
A common consequence to all ECB is that it is possible to add massive metal bodies surrounding the ECBs to protect signalling devices against disturbing interferences.
An outlook would be to define a normalized test body for standardised approval tests for axle counters.
Although the analysed axle counters are based on different principles, the optimization can be applicable to all of them.

ECUC Deliverable D5.3 Due date: 30th April 2015
FP7 TRANSPORT Contract No. 314244 1 September 2012 - 31 August 2015 Page 45 of 77
3.1.2 Low frequency magnetic stray fields The magnetic stray field is measured by Hall-sensor in standstill in different positions.
The displacement of rail and ECB for these tests is carried out in the same way as descripted in D5.1 chapter 4.1.1.1.
The magnet poles are activated during test measurement. This leads to high fatigue requirements at test site.
3.1.2.1 Test site The test site descripted in chapter 3.1.1.1 is used also for the measurement of magnetic stray field of ECB-magnet.
The magnetic flux density is measured by a Hall-sensor (MI-Teslameter 912T).
The ECB-magnet is connected with a DC-power supply. The air gap is defined by a paramagnetic and non-conductive layer which is located in the space between the ECB-Magnet and the rail.
The measurement of low frequency additional magnetic stray fields is carried out on test site described in following chapter 3.2.2.
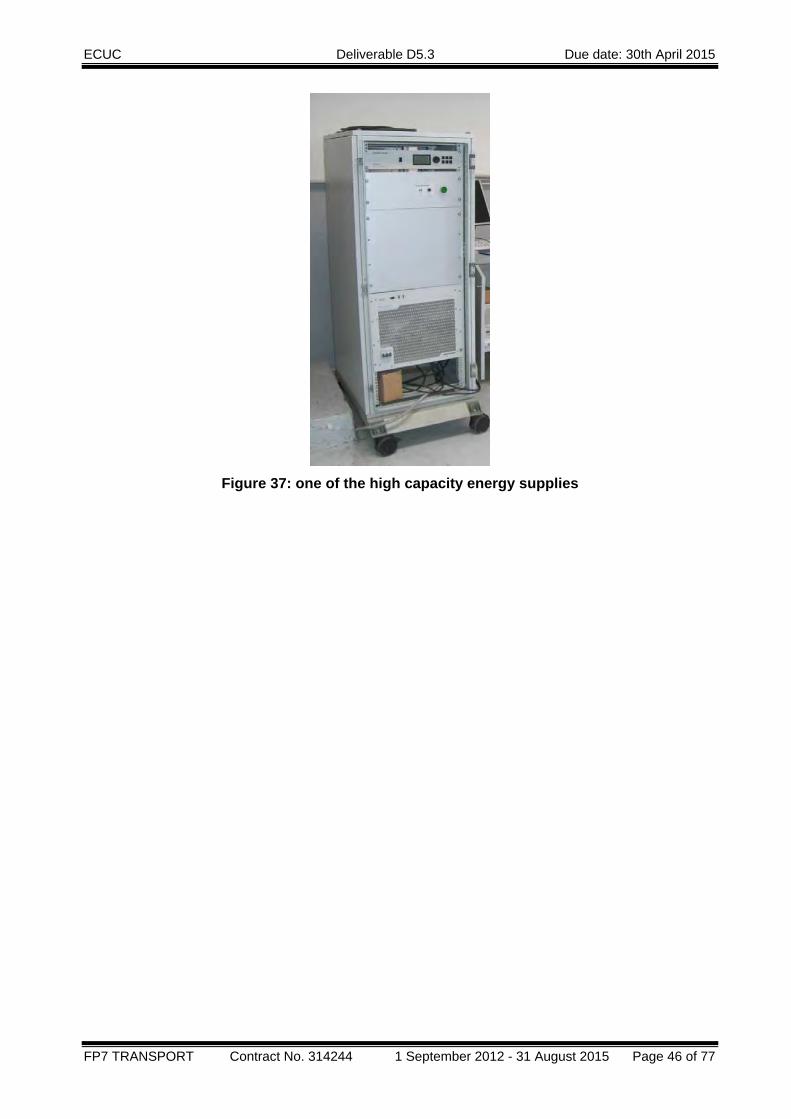
3.1.2.2 Test set-up The test set-up consists on one hand of the magnet poles or the complete magnet with 3 or more poles and on other hand of a high capacity energy supply with power control.
Figure 36: UIC60 rail and ECB magnet for stray field measurements
ECUC Deliverable D5.3 Due date: 30th April 2015
FP7 TRANSPORT Contract No. 314244 1 September 2012 - 31 August 2015 Page 46 of 77
Figure 37: one of the high capacity energy supplies

ECUC Deliverable D5.3 Due date: 30th April 2015
FP7 TRANSPORT Contract No. 314244 1 September 2012 - 31 August 2015 Page 47 of 77
3.1.2.3 Test procedure One aim of the FEM 3D magnetic stray field simulations is to consider that the speed has a significant influence on the magnetic stray field density. The orientation of the raster was horizontal or vertical.
The used Hall-sensor measured only one direction of magnetic flux density. On each point 3 directions (x,y, and z) were measured. Based on these components the magnitude was calculated. Following figures shown the magnitude of magnetic flux densitiy in the value of mT.
The distance between each measurement points were 50 mm.
Figure 38: raster of measurement in vertical and horizontal plane
50
Air gap:
4 or 80 mm
z
y x
y
Vertical plane Horizontal plane

ECUC Deliverable D5.3 Due date: 30th April 2015
FP7 TRANSPORT Contract No. 314244 1 September 2012 - 31 August 2015 Page 48 of 77
The first step was to validate the position of local maximum of magnetic stray field density.
Figure 39 shows a result of calculation. The red curve represented the measurement condition standstill (v=0 km/h) in the laboratory.
Figure 39: example of simulation Emergency brake application, air gap 5 mm, lateral
displacement - 27.5 mm
-150 -100 -50 0 50 100 1500
20
40
60
80
100
120
140
x-Posit ion [mm]
Indu
ctio
nj7 B
j [m
T]
v = 400 km/hv = 350 km/hv = 300 km/hv = 250 km/hv = 200 km/hv = 150 km/hv = 100 km/hv = 70 km/hv = 50 km/hv = 40 km/hv = 0 km/h
ECUC Deliverable D5.3 Due date: 30th April 2015
FP7 TRANSPORT Contract No. 314244 1 September 2012 - 31 August 2015 Page 49 of 77
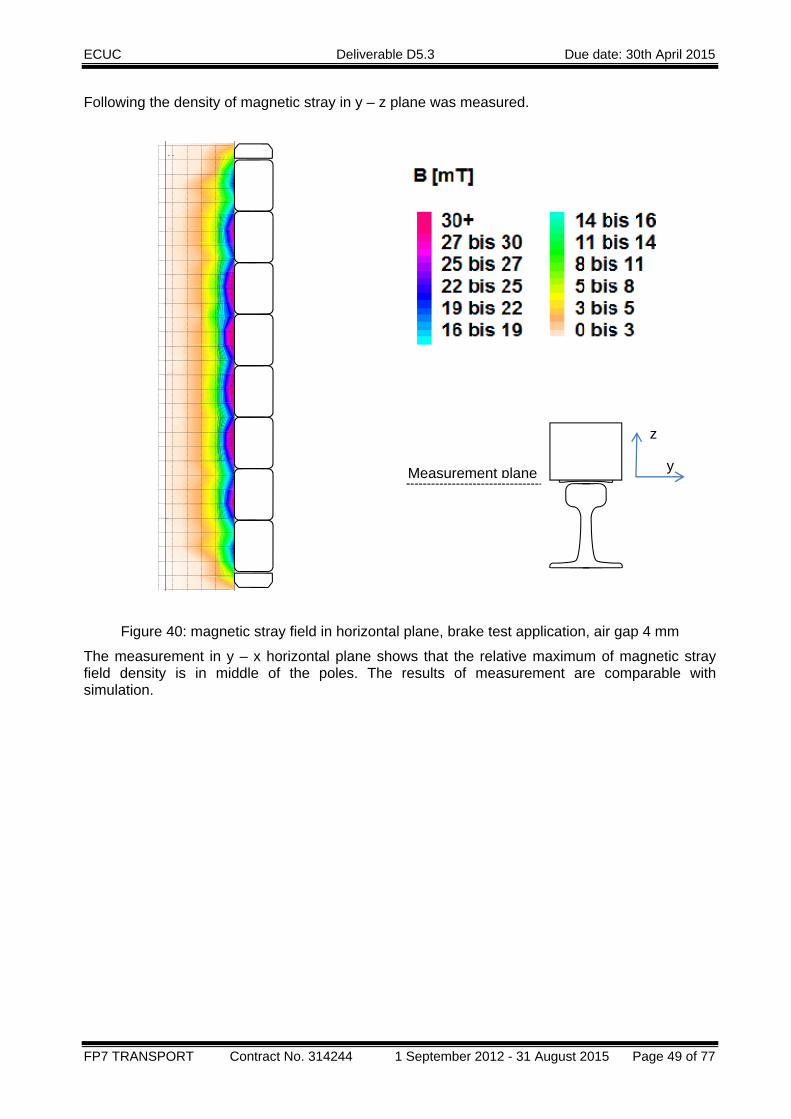
Following the density of magnetic stray in y – z plane was measured.
0
5
0
5
20
25
30
Figure 40: magnetic stray field in horizontal plane, brake test application, air gap 4 mm
The measurement in y – x horizontal plane shows that the relative maximum of magnetic stray field density is in middle of the poles. The results of measurement are comparable with simulation.
Measurement plane y
z

ECUC Deliverable D5.3 Due date: 30th April 2015
FP7 TRANSPORT Contract No. 314244 1 September 2012 - 31 August 2015 Page 50 of 77
The magnetic stray field density in y-z plane was measured in the middle of a pole. See Figure 38.
Furthermore it is necessary to check the influence of the current. In case of electric powered ECB the poles are heating. It is more practical to carry out the test with a lower current. This low current refers to a brake test application. Therefore the current is defined at 14 A by an electric powered ECB similar ECB 154 R L4. See Figure 41.
The influence of air gap was measured in position of lowest distance between Pole and rail 4 mm and the maximum distance between pole and rail with 80 mm.
Figure 41: measurements into the raster in y-z plane, brake test application
It is reasonable to check also at an emergency brake application with a current at 95 A by an electric powered ECB similar ECB 154 R L4 or the maximum of magnetisation in case of new ECB for an emergency brake application.
Figure 42: measurements into the raster in y-z plane, emergency brake application

ECUC Deliverable D5.3 Due date: 30th April 2015
FP7 TRANSPORT Contract No. 314244 1 September 2012 - 31 August 2015 Page 51 of 77
Figure 43: measurements into the raster in y-z plane, emergency brake application
The maximum of the magnetic stray field is below top of tail and depends on the magnetisation of poles.
The higher the magnetisation is, the higher the magnetic stray field density is.
The compare of magnetic stray field density dependent on air gap shows that below top of rail the maximum of magnetic stray field density is given at lowest air gap. This coherence is independent from the magnetisation.
Brake application Air gap 4 mm Air gap 80 mm
Brake test Level top of rail
39 mT
Level top of rail
2 mT
Brake test -50 mm of level top of rail 6 mT
-50 mm of level top of rail 8 mT
Emergency Level top of rail
75 mT
Level top of rail
44 mT
Emergency -50 mm of level top of rail
21 mT
-50 mm of level top of rail
9 mT
Table 8: magnetic stray field near top of rail depend on air gap
In area over top of rail the magnetic stray field density is heavily addicted by the air gap. The maximum is located relative to underside of the pole. The greater the air gap the higher the magnetic stray field density is.
3.1.2.4 Summary of low frequency interaction With the measurements in laboratory the results of simulation are verified.
In laboratory only the static magnetic flux density could be measured. The results of simulation should be compared with the results of the running test.
The worst case conditions of maximum magnetic stray field density are divided in two areas below top of the rail and above top of rail.
Based on the magnetic flux density it is possible to define a threshold in frequency range from static up to 500 Hz.
ECUC Deliverable D5.3 Due date: 30th April 2015
FP7 TRANSPORT Contract No. 314244 1 September 2012 - 31 August 2015 Page 52 of 77
3.1.3 High frequency magnetic fields and transfer function The following section includes details from Frauscher’s report (D4060-1 section 2 and section 3).
3.1.3.1 Test side The KB test facilities and test benches are used. The concrete used test side is described in the details of test set-up.
3.1.3.2 Test set-up
3.1.3.2.1 Test set-up “electric and magnetic properties of ECB” The test set-up to analyse and validate the electric and magnetic properties used special prepared components of ECB. Especially the poles of ECB are modified for the tests:
• Complete poles of ECB • Separated pole cores with and without signaling plates • Coils without pole core.
The modified test samples can be mounted on the integral beam or not.
The poles of ECB and the coils without pole core could be connected to a signal generator or the DC-power supply.
The special configurations of the test samples are described in the specific sections.
3.1.3.2.2 Set-up 1 This set-up is used for measurements with non-saturated cores. Two L4 poles (No. 2610 and No. 1551) are mounted centrally on the integral beam. Six pole cores are mounted in the remaining positions on the integral beam. The two poles are electrically connected in series together and the two end leads are connected to the function generator. The integral beam and poles are placed on the surface of a flat, horizontal, wooden table. A MNR Receiver is then positioned centrally to both poles, as indicated in Figure 40. The bottom of the MNR Receiver and the bottom of the poles share a common plane. The MNR receiver consists of three mutually perpendicular antennas (coils) as detailed in TS50238-3[2] and schematically shown in Figure 44.
The MNR Receiver is connected through the GAK to the MNR Recorder which is in turn operated over a remote desktop by a laptop PC.
The MNR Receiver is positioned centrally to the two poles. The series connection between both poles can be seen in the centre of the picture as well as the end connections leading to the function generator which is situated behind the ECB, out of sight.

ECUC Deliverable D5.3 Due date: 30th April 2015
FP7 TRANSPORT Contract No. 314244 1 September 2012 - 31 August 2015 Page 53 of 77
Figure 44: Physical setup and schematic for experiment to measure the transfer function of two
poles mounted on an integral beam.

ECUC Deliverable D5.3 Due date: 30th April 2015
FP7 TRANSPORT Contract No. 314244 1 September 2012 - 31 August 2015 Page 54 of 77
Figure 45: Position and dimensions of the x, y and z antennas within the MNR Receiver housing.
3.1.3.2.3 Set-up 2 This set-up is used for measurements with non-saturated cores. The setup is identical to Setup 1 except that the position of the MNR Recorder is changed to a position symmetrically to the pole number 1551, see Figure 46. The electrical connections are identical to Setup 1.
Figure 46: Physical setup for Setup 2.

ECUC Deliverable D5.3 Due date: 30th April 2015
FP7 TRANSPORT Contract No. 314244 1 September 2012 - 31 August 2015 Page 55 of 77
3.1.3.2.4 Set-up 3 This set-up is used for measurements with non-saturated cores. The setup is identical to Setup 1 except the integral beam and the six pole cores are removed, Figure 47.
Figure 47: Physical setup for Setup 3.
3.1.3.2.5 Set-up 4 This set-up is used for measurements with non-saturated cores. The setup is identical to Setup 2 except the integral beam and the six pole cores are removed. See Figure 48.
Figure 48: Physical setup for Setup 4.

ECUC Deliverable D5.3 Due date: 30th April 2015
FP7 TRANSPORT Contract No. 314244 1 September 2012 - 31 August 2015 Page 56 of 77
3.1.3.2.6 Set-up 5 This set-up is used for measurements with saturated cores. Three poles with windings were mounted on the integral beam along with five pole cores as shown in Figure 8. The integral beam was suspended from a ceiling crane. A short length (approx. 60 cm) of NP42 rail track (or similar) was used to close the magnetic field path beneath the poles. This allowed the mounting of the MNR Receiver directly on the rail using the claw mount. Their positioning can also be seen in Figure 49.
The central pole was connected directly to the function generator. The two outer poles are connected in series to a DC power supply capable of delivering over 100 Amps. A schematic of the electrical connections are also shown in Figure 49.
Figure 49: Physical setup and electrical schematic for measurements of pole transfer function
with saturated core.

ECUC Deliverable D5.3 Due date: 30th April 2015
FP7 TRANSPORT Contract No. 314244 1 September 2012 - 31 August 2015 Page 57 of 77
3.1.3.3 Test procedure
3.1.3.3.1 Special test procedure for properties of ECB This special procedure is defined by ECUC partners CEIT, Frauscher and KB. This chapter gives an overview of the test to carry out in the laboratory with the aim of validating the first steps of the electromagnetic model.
All of the raw data and imported experimental results can be found in the relevant reports D3953- 1 “Description of ECB coil impedance measurements” [6] and D4060-1 “ECB transfer function and passive “Fingerprint” measurements [3].
The following section includes details from Frauscher’s report (D3953-1 chapter 7.2, 7.3 and 7.4). Input impedance measurements of poles with and without pole cores were carried out to analyse their resonant frequency, input resistance and reactance with frequency.
The measurement of passive “Fingerprint” based on details from Frauscher report D4060-1 chapter 4.2 and 4.3.
3.1.3.3.1.1 Singlepole[6]The poles were measured alone with no other metal parts in close vicinity. The poles weren´t saturated. Measurements with saturated poles are specifically marked. The iron cores were removed from 4 of the poles (Ser. Nr.: S 0265, S 0266, 3219-R and 0339-R) using a hydraulic press. These measurements were carried out chronologically last with respect to all of the other presented measurements but are presented here first since they represent the simplest case. The range of measured frequency was 40 Hz up to 50 MHz.

ECUC Deliverable D5.3 Due date: 30th April 2015
FP7 TRANSPORT Contract No. 314244 1 September 2012 - 31 August 2015 Page 58 of 77
Single pole – air core
4 poles were prepared for this point of measurements: The iron core was extracted with a hydraulic press after the frequency measurement of poles with iron core had been conducted.
No. 339 type /L4 No. 3219 type L4 No. 265 type /L5 No. 266 type /L5.
Figure 50: results of resonance measurements
The resonant frequencies of poles type /L4 (approximate value of 56.5 kHz) are lower than type /L5 (63.4 KHz). These values will give feedback on the modeling of the ECB poles. The peak value for the resistance is approximately 30 KΩ whereas the maximum for reactance is around 15 KΩ depending whether the pole is L4 or L5.
0,00E+00
5,00E+03
1,00E+04
1,50E+04
2,00E+04
2,50E+04
3,00E+04
3,50E+04
4,00E+04
4,00E+04 4,50E+04 5,00E+04 5,50E+04 6,00E+04 6,50E+04 7,00E+04 7,50E+04 8,00E+04
Resistan
ce (O
hm)
Frequency (Hz)
Resistance vs. Freq, single poles, air core
265 (L5)
266 (L5)
3219(L4)
339 (L4)
‐2,50E+04
‐2,00E+04
‐1,50E+04
‐1,00E+04
‐5,00E+03
0,00E+00
5,00E+03
1,00E+04
1,50E+04
2,00E+04
2,50E+04
4,00E+04 5,00E+04 6,00E+04 7,00E+04 8,00E+04
Reactance (Ohm
)
Frequency (Hz)
Reactance vs. Freq, single poles, air core
265 (L5)
266 (L5)
3219(L4)339 (L4)

ECUC Deliverable D5.3 Due date: 30th April 2015
FP7 TRANSPORT Contract No. 314244 1 September 2012 - 31 August 2015 Page 59 of 77
Single pole – iron core
The poles were measured alone with no other metal parts in close vicinity. The measurements were carried out identically with those for coils with air core. The range of measured frequency was 40 Hz up to 50 MHz.
8 poles were prepared for this point of measurements:
No. 339 type /L4 No. 265 type /L5 No. 3219 type L4 No. 266 type /L5 No. 1551 type L4 No. 267 type /L5 No. 2610 type L4 No. 255 type /L5
0
1000
2000
3000
4000
5000
6000
7000
8000
0 20000 40000 60000 80000 100000 120000 140000 160000
Resistan
ce (O
hm)
Frequency (Hz)
Single Pole Coils with Iron Core, Resistance vs. Freq.
339 (L4)1551 (L4)2610 (L4)3219 (L4)267 (L5)266 (L5)265 (L5)255 (L5)

ECUC Deliverable D5.3 Due date: 30th April 2015
FP7 TRANSPORT Contract No. 314244 1 September 2012 - 31 August 2015 Page 60 of 77
Figure 51: results of impedance measurements
The resonant frequencies of poles with iron core are lower than without iron core. Also the resonant frequencies of poles type /L4 (45.0 kHz) are lower than type /L5 (56.5 KHz). Besides, the peaks for maximum resistance (6 KΩ) and reactance (3 KΩ) are lower than their no-core counterparts by a factor of 6. This fact will be helpful to proper define core characteristics.
‐5000
‐4000
‐3000
‐2000
‐1000
0
1000
2000
3000
4000
0 20000 40000 60000 80000 100000 120000 140000 160000
Reactance (Ohm
)
Frequency (Hz)
Single Pole Coils with Iron Core, Reactance vs. Freq. 339 (L4)
1551 (L4)
2610 (L4)
3219 (L4)
267 (L5)
266 (L5)
265 (L5)

ECUC Deliverable D5.3 Due date: 30th April 2015
FP7 TRANSPORT Contract No. 314244 1 September 2012 - 31 August 2015 Page 61 of 77
3.1.3.3.1.2 Twoandfourpoles[6]Pair of pole – air coil
Two Poles of the same type (L4 or L5) are combined in series as pair of poles (north pole and south pole). It was necessary to use an extension cable 20 cm long to complete the connection.
The poles had different connections between them, see following sketches.
A pair of L5 poles with no core is connected in three different combination in order to extract their mutual inductance. The resonant is kept in all cases at 61 KHz whereas the maximum values for R and X are approximately doubled respect to only one pole without core. Slight modifications depend on the interconnection and mutual coupling Figure 54)
Measurement M27+M28 (06/08)
Figure 52: Impedance of a pair of L5 poles without core for original interconnection
‐4,00E+04
‐3,00E+04
‐2,00E+04
‐1,00E+04
0,00E+00
1,00E+04
2,00E+04
3,00E+04
4,00E+04
1,00E+03
1,10E+04
2,10E+04
3,10E+04
4,10E+04
5,10E+04
6,10E+04
7,10E+04
8,10E+04
1,00E+04 3,00E+04 5,00E+04 7,00E+04 9,00E+04
RX
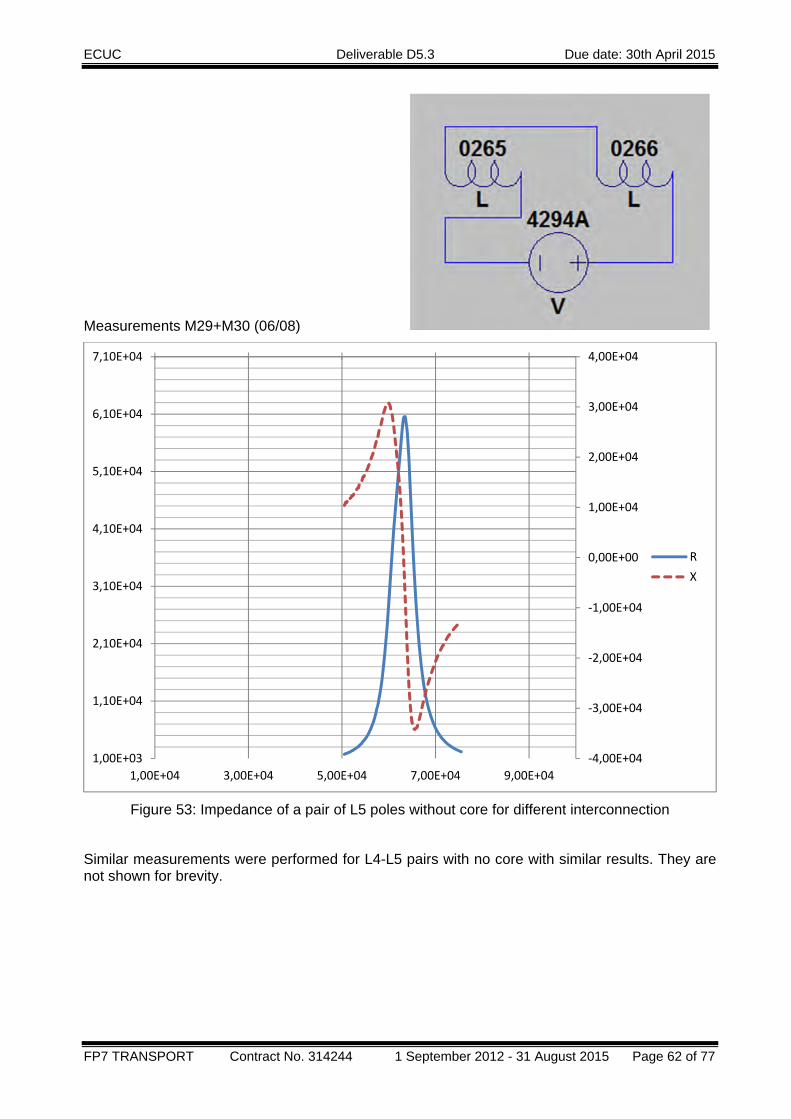
ECUC Deliverable D5.3 Due date: 30th April 2015
FP7 TRANSPORT Contract No. 314244 1 September 2012 - 31 August 2015 Page 62 of 77
Measurements M29+M30 (06/08)
Figure 53: Impedance of a pair of L5 poles without core for different interconnection
Similar measurements were performed for L4-L5 pairs with no core with similar results. They are not shown for brevity.
‐4,00E+04
‐3,00E+04
‐2,00E+04
‐1,00E+04
0,00E+00
1,00E+04
2,00E+04
3,00E+04
4,00E+04
1,00E+03
1,10E+04
2,10E+04
3,10E+04
4,10E+04
5,10E+04
6,10E+04
7,10E+04
1,00E+04 3,00E+04 5,00E+04 7,00E+04 9,00E+04
RX
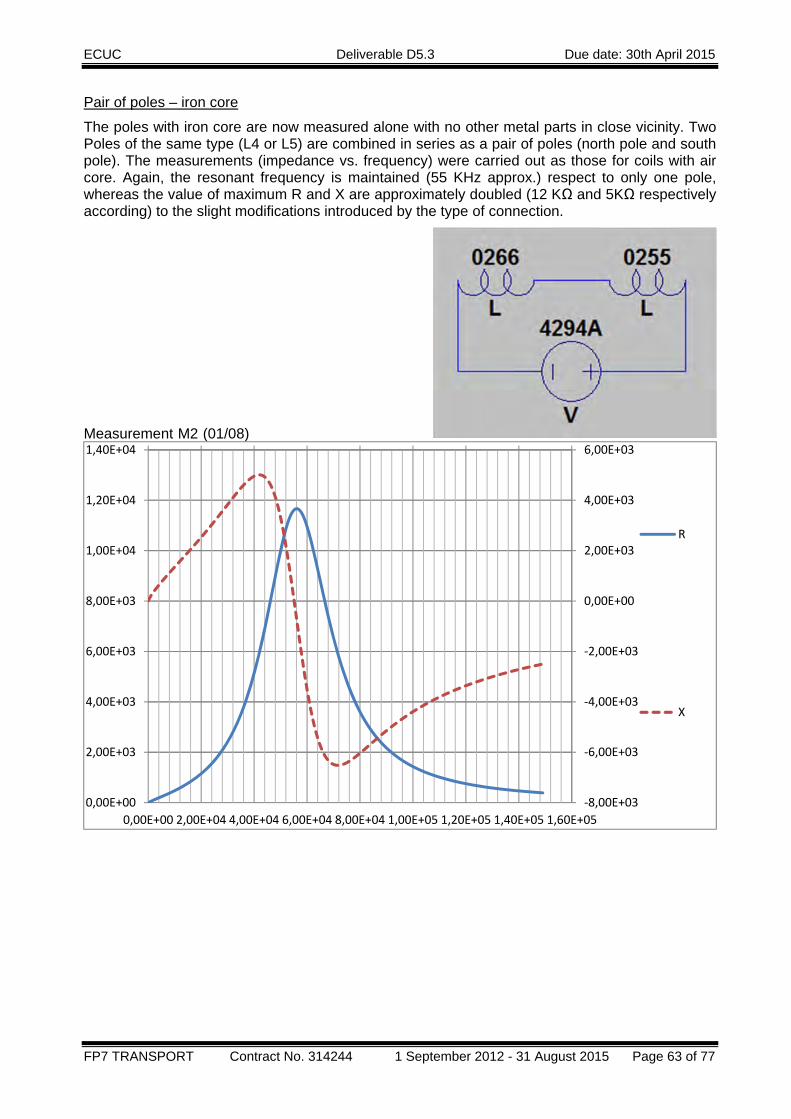
ECUC Deliverable D5.3 Due date: 30th April 2015
FP7 TRANSPORT Contract No. 314244 1 September 2012 - 31 August 2015 Page 63 of 77
Pair of poles – iron core
The poles with iron core are now measured alone with no other metal parts in close vicinity. Two Poles of the same type (L4 or L5) are combined in series as a pair of poles (north pole and south pole). The measurements (impedance vs. frequency) were carried out as those for coils with air core. Again, the resonant frequency is maintained (55 KHz approx.) respect to only one pole, whereas the value of maximum R and X are approximately doubled (12 KΩ and 5KΩ respectively according) to the slight modifications introduced by the type of connection.
Measurement M2 (01/08)
‐8,00E+03
‐6,00E+03
‐4,00E+03
‐2,00E+03
0,00E+00
2,00E+03
4,00E+03
6,00E+03
0,00E+00
2,00E+03
4,00E+03
6,00E+03
8,00E+03
1,00E+04
1,20E+04
1,40E+04
0,00E+00 2,00E+04 4,00E+04 6,00E+04 8,00E+04 1,00E+05 1,20E+05 1,40E+05 1,60E+05
R
X

ECUC Deliverable D5.3 Due date: 30th April 2015
FP7 TRANSPORT Contract No. 314244 1 September 2012 - 31 August 2015 Page 64 of 77
Measurement M3 (01/08)
‐8,00E+03
‐6,00E+03
‐4,00E+03
‐2,00E+03
0,00E+00
2,00E+03
4,00E+03
6,00E+03
0,00E+00
2,00E+03
4,00E+03
6,00E+03
8,00E+03
1,00E+04
1,20E+04
1,40E+04
1,00E+04 3,00E+04 5,00E+04 7,00E+04 9,00E+04 1,10E+05 1,30E+05 1,50E+05
RX

ECUC Deliverable D5.3 Due date: 30th April 2015
FP7 TRANSPORT Contract No. 314244 1 September 2012 - 31 August 2015 Page 65 of 77
Measurement M16 (01/08)
Figure 54: Impedance of a pair of L5 poles with core for different interconnections
Similar measurements were realized with other types of poles. These values are important to corroborate the outcomes of the EM model. They are not shown for brevity.
‐8,00E+03
‐6,00E+03
‐4,00E+03
‐2,00E+03
0,00E+00
2,00E+03
4,00E+03
6,00E+03
0,00E+00
2,00E+03
4,00E+03
6,00E+03
8,00E+03
1,00E+04
1,20E+04
1,40E+04
1,00E+04 3,00E+04 5,00E+04 7,00E+04 9,00E+04 1,10E+05 1,30E+05 1,50E+05
R
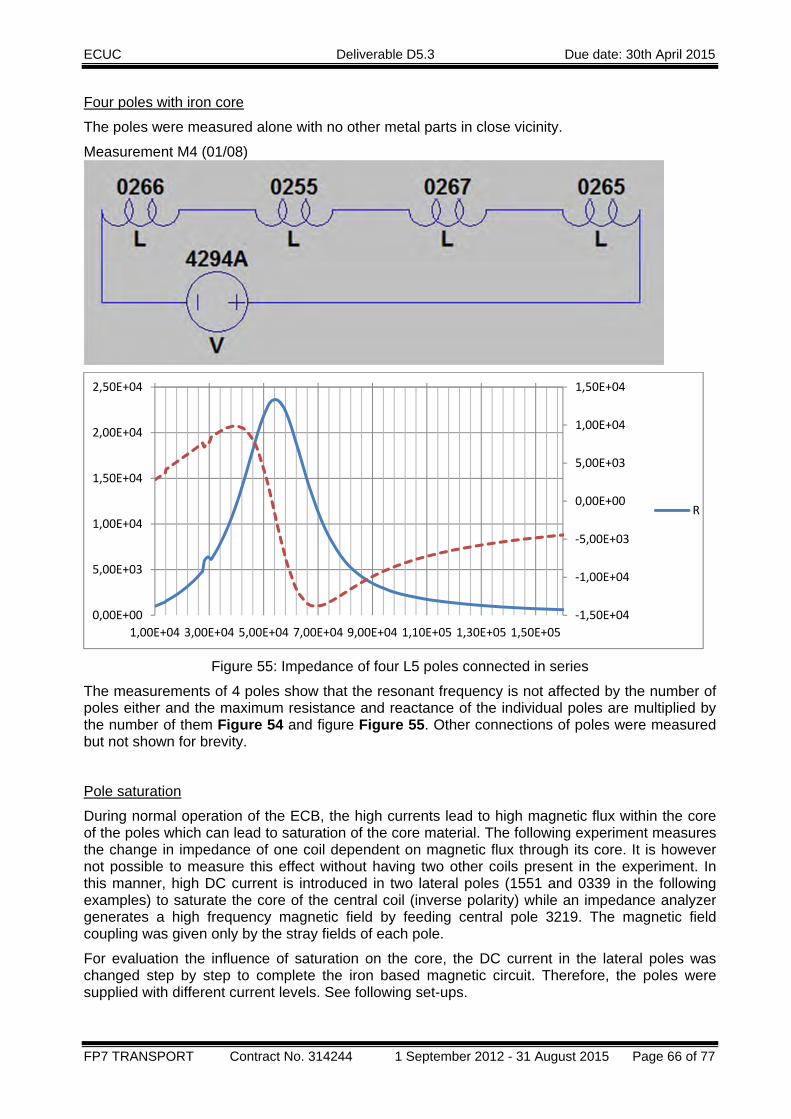
ECUC Deliverable D5.3 Due date: 30th April 2015
FP7 TRANSPORT Contract No. 314244 1 September 2012 - 31 August 2015 Page 66 of 77
Four poles with iron core
The poles were measured alone with no other metal parts in close vicinity.
Measurement M4 (01/08)
Figure 55: Impedance of four L5 poles connected in series
The measurements of 4 poles show that the resonant frequency is not affected by the number of poles either and the maximum resistance and reactance of the individual poles are multiplied by the number of them Figure 54 and figure Figure 55. Other connections of poles were measured but not shown for brevity.
Pole saturation
During normal operation of the ECB, the high currents lead to high magnetic flux within the core of the poles which can lead to saturation of the core material. The following experiment measures the change in impedance of one coil dependent on magnetic flux through its core. It is however not possible to measure this effect without having two other coils present in the experiment. In this manner, high DC current is introduced in two lateral poles (1551 and 0339 in the following examples) to saturate the core of the central coil (inverse polarity) while an impedance analyzer generates a high frequency magnetic field by feeding central pole 3219. The magnetic field coupling was given only by the stray fields of each pole.
For evaluation the influence of saturation on the core, the DC current in the lateral poles was changed step by step to complete the iron based magnetic circuit. Therefore, the poles were supplied with different current levels. See following set-ups.
‐1,50E+04
‐1,00E+04
‐5,00E+03
0,00E+00
5,00E+03
1,00E+04
1,50E+04
0,00E+00
5,00E+03
1,00E+04
1,50E+04
2,00E+04
2,50E+04
1,00E+04 3,00E+04 5,00E+04 7,00E+04 9,00E+04 1,10E+05 1,30E+05 1,50E+05
R
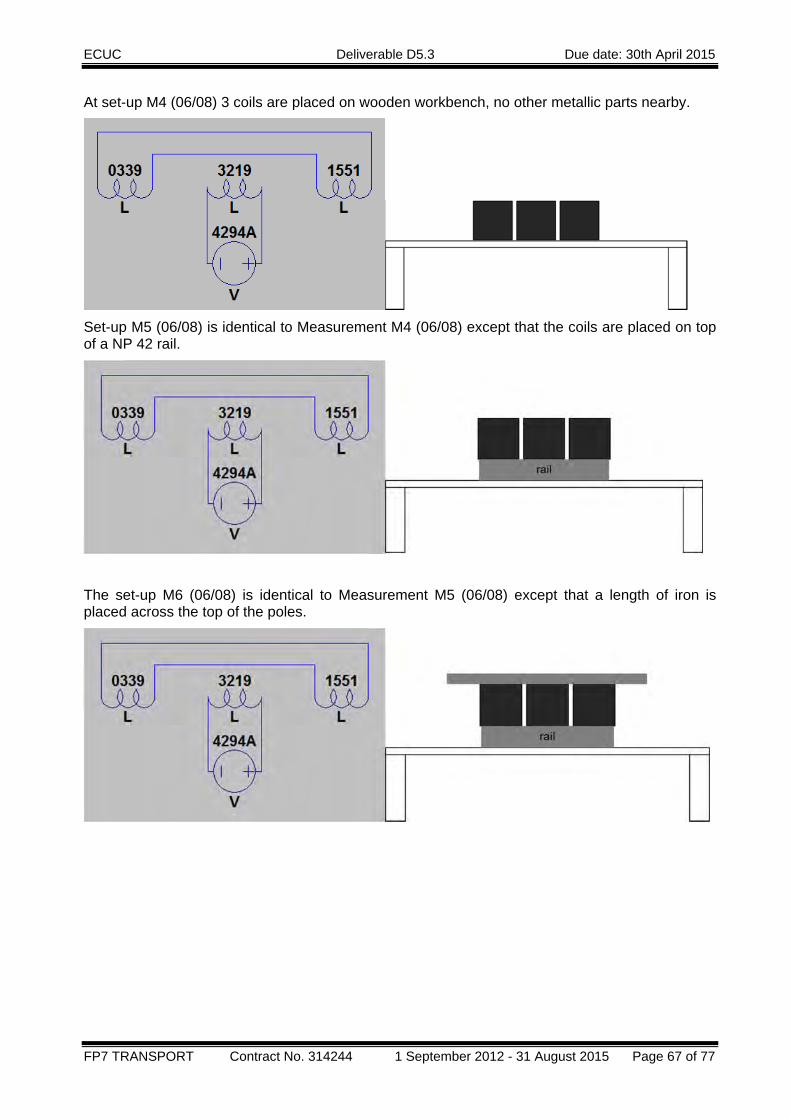
ECUC Deliverable D5.3 Due date: 30th April 2015
FP7 TRANSPORT Contract No. 314244 1 September 2012 - 31 August 2015 Page 67 of 77
At set-up M4 (06/08) 3 coils are placed on wooden workbench, no other metallic parts nearby.
Set-up M5 (06/08) is identical to Measurement M4 (06/08) except that the coils are placed on top of a NP 42 rail.
The set-up M6 (06/08) is identical to Measurement M5 (06/08) except that a length of iron is placed across the top of the poles.

ECUC Deliverable D5.3 Due date: 30th April 2015
FP7 TRANSPORT Contract No. 314244 1 September 2012 - 31 August 2015 Page 68 of 77
Identical to M6 (06/08) but the left and right poles are left open.
For set-up M9 the coils 0339 and 1551 are connected in series with the EA DC power supply. The power supply is not switched on.
Set-up M10 is identical to Measurement M9 (06/08) but with current through coils 0339 and 1551.
The reactance that has been measured by the impedance analyzer changes with the current in the lateral poles, and therefore it depends on the saturation of core. The results are shown in the following figure and will be helpful to validate the model.
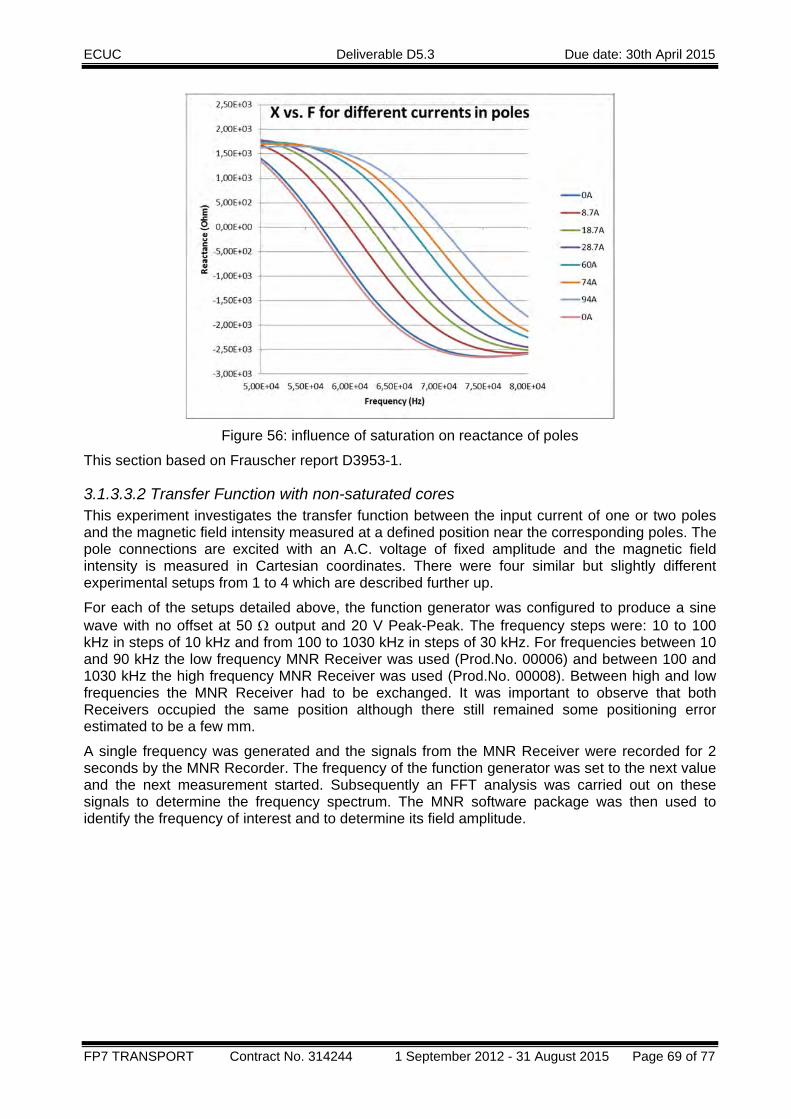
ECUC Deliverable D5.3 Due date: 30th April 2015
FP7 TRANSPORT Contract No. 314244 1 September 2012 - 31 August 2015 Page 69 of 77
Figure 56: influence of saturation on reactance of poles
This section based on Frauscher report D3953-1.
3.1.3.3.2 Transfer Function with non-saturated cores This experiment investigates the transfer function between the input current of one or two poles and the magnetic field intensity measured at a defined position near the corresponding poles. The pole connections are excited with an A.C. voltage of fixed amplitude and the magnetic field intensity is measured in Cartesian coordinates. There were four similar but slightly different experimental setups from 1 to 4 which are described further up.
For each of the setups detailed above, the function generator was configured to produce a sine wave with no offset at 50 Ω output and 20 V Peak-Peak. The frequency steps were: 10 to 100 kHz in steps of 10 kHz and from 100 to 1030 kHz in steps of 30 kHz. For frequencies between 10 and 90 kHz the low frequency MNR Receiver was used (Prod.No. 00006) and between 100 and 1030 kHz the high frequency MNR Receiver was used (Prod.No. 00008). Between high and low frequencies the MNR Receiver had to be exchanged. It was important to observe that both Receivers occupied the same position although there still remained some positioning error estimated to be a few mm.
A single frequency was generated and the signals from the MNR Receiver were recorded for 2 seconds by the MNR Recorder. The frequency of the function generator was set to the next value and the next measurement started. Subsequently an FFT analysis was carried out on these signals to determine the frequency spectrum. The MNR software package was then used to identify the frequency of interest and to determine its field amplitude.
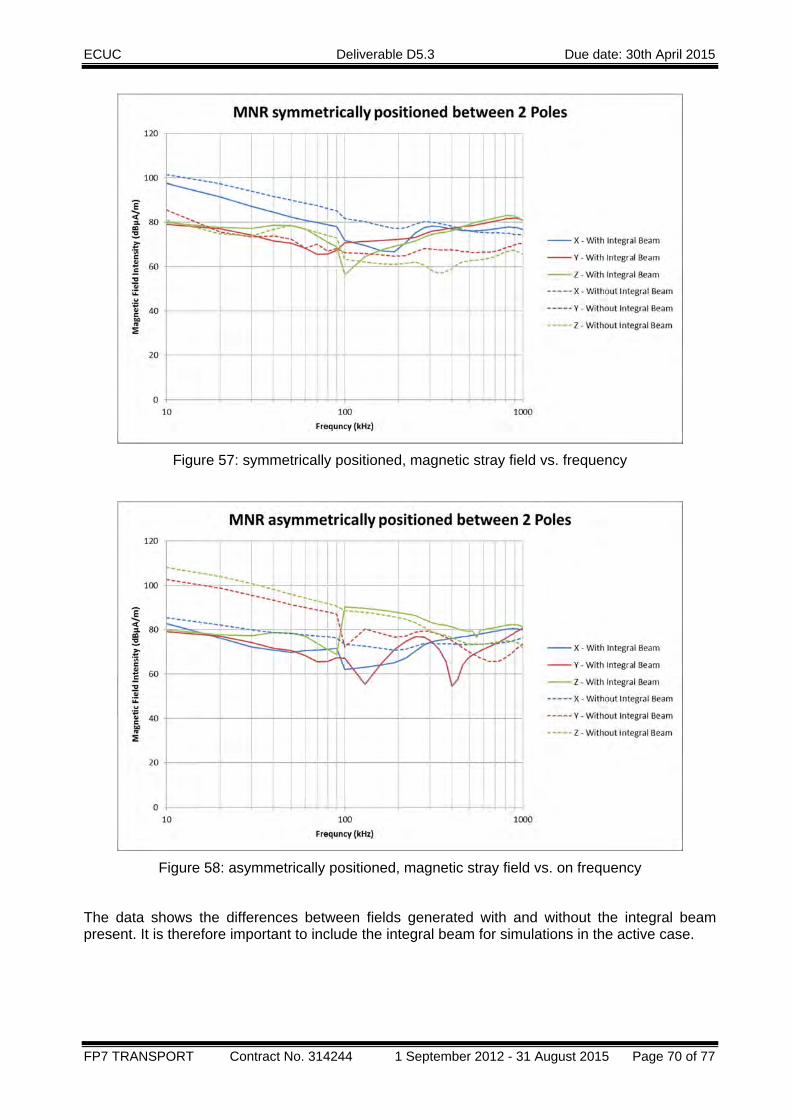
ECUC Deliverable D5.3 Due date: 30th April 2015
FP7 TRANSPORT Contract No. 314244 1 September 2012 - 31 August 2015 Page 70 of 77
Figure 57: symmetrically positioned, magnetic stray field vs. frequency
Figure 58: asymmetrically positioned, magnetic stray field vs. on frequency
The data shows the differences between fields generated with and without the integral beam present. It is therefore important to include the integral beam for simulations in the active case.

ECUC Deliverable D5.3 Due date: 30th April 2015
FP7 TRANSPORT Contract No. 314244 1 September 2012 - 31 August 2015 Page 71 of 77
Broadly speaking we can assign the following characteristics:
MNR symmetrically positioned:
• At low frequencies (< approx. 100‐200 kHz) only the x‐component of the field is reduced when the integral beam is present. Both the y‐ and z‐components remain approximately the same.
• At high frequencies only the x‐component of the field remains approximately the same when the integral beam is present. The y‐ and z‐components both gain.
MNR asymmetrically positioned:
• At low frequencies all components experience a loss although the y‐ and z‐components experience a greater loss than the x‐component.
• Towards higher frequencies all components experience a slight gain. • The y‐component with the integral beam appears to have two distinct resonances at approx. 115
kHz and 300 kHz.
Details and conclusions from Frauscher report D4060-1 section 2. [3]
3.1.3.3.3 Transfer function with partially saturated cores This experiment was conducted to determine the change in the transfer function of one pole due to its iron core being saturated. The high fields produced when the ECB is operating are present in the iron cores of the poles themselves. If these fields are high enough then a saturation of the cores occurs thereby reducing the permeability. This change would influence the fields generated in the immediate environment of the brake.
The apparatus was set up in that way that current was allowed to flow through both outer pole coils while the function generator was set to varying frequencies. In order to reduce induced voltages at the function generator inputs during switching on and off of the currents, the following steps were carried out (the steps are listed chronologically for switching the currents on. When switching the currents off, the steps were followed in the reverse order):
• Make sure the function generator is disconnected from the central pol. • Switch current on (off) • Wait 2 seconds (for fields to stabilize) Connect (disconnect) function generator to (from)
central pole
For each frequency and current data was recorded for 2s using the MNR Recorder. Afterwards, the magnetic field amplitude for each frequency was extracted from the data. Three currents were chosen, 0 A, 77 A and 95 A, to represent different amounts of saturation. 77 Ampere represents normal service braking while 95 Ampere is typical for emergency braking scenarios. Due to heating of the pole windings, measurements were recorded only over periods of about 1 minute with cooling off periods of about 15 minutes in between.

ECUC Deliverable D5.3 Due date: 30th April 2015
FP7 TRANSPORT Contract No. 314244 1 September 2012 - 31 August 2015 Page 72 of 77
Figure 59: magnetic stray field depend on frequency
The saturation of the core appears to have little effect on the magnetic field intensity. A small increase in field intensity with increasing saturation is perceptible and is typically < 2 dB.
Details and conclusions from Frauscher report 4060-1 section 3.
3.1.3.4 Summary of high frequency interaction The resonant frequencies of poles with iron core are lower than without iron core.
The improvement of poles of type /L5 can be measured. The resonant frequencies of poles type /L4 (45.0 kHz) are lower than type /L5 (56.5 KHz).
Besides, the peaks for maximum resistance (6 KΩ) and reactance (3 KΩ) are lower than their no-core counterparts by a factor of 6. This fact will be helpful to proper define core characteristics for simulation.
The saturation of the core appears to have little effect on the magnetic stray field intensity. This fact should be compared with results from running test. In consequence a threshold could be independent from brake force of ECB and could be verified easier.

ECUC Deliverable D5.3 Due date: 30th April 2015
FP7 TRANSPORT Contract No. 314244 1 September 2012 - 31 August 2015 Page 73 of 77
3.2 MECHANICAL PARAMETERS
3.2.1 Fatigue test of components of ECB frame
3.2.1.1 Test site The design of new generation of ECB is very innovative. Because of that tests of components were carried out before start the fatigue test of ECB frame.
The test side for components is shown next figure.
Figure 60: servo-hydraulic fatigue test bench
Figure 61: adapter for component of self-sustained magnet beam with load cell
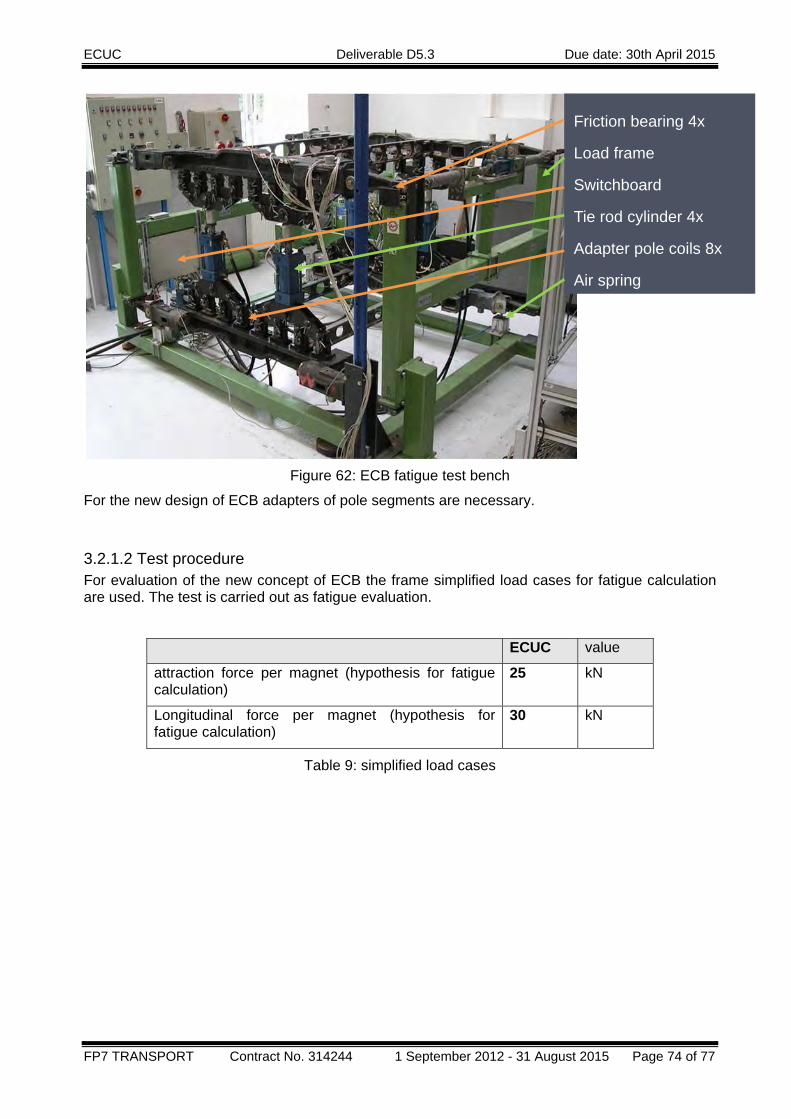
ECUC Deliverable D5.3 Due date: 30th April 2015
FP7 TRANSPORT Contract No. 314244 1 September 2012 - 31 August 2015 Page 74 of 77
Figure 62: ECB fatigue test bench
For the new design of ECB adapters of pole segments are necessary.
3.2.1.2 Test procedure For evaluation of the new concept of ECB the frame simplified load cases for fatigue calculation are used. The test is carried out as fatigue evaluation.
ECUC value
attraction force per magnet (hypothesis for fatigue calculation)
25 kN
Longitudinal force per magnet (hypothesis for fatigue calculation)
30 kN
Table 9: simplified load cases
Friction bearing 4x
Load frame
Switchboard
Tie rod cylinder 4x
Adapter pole coils 8x
Air spring
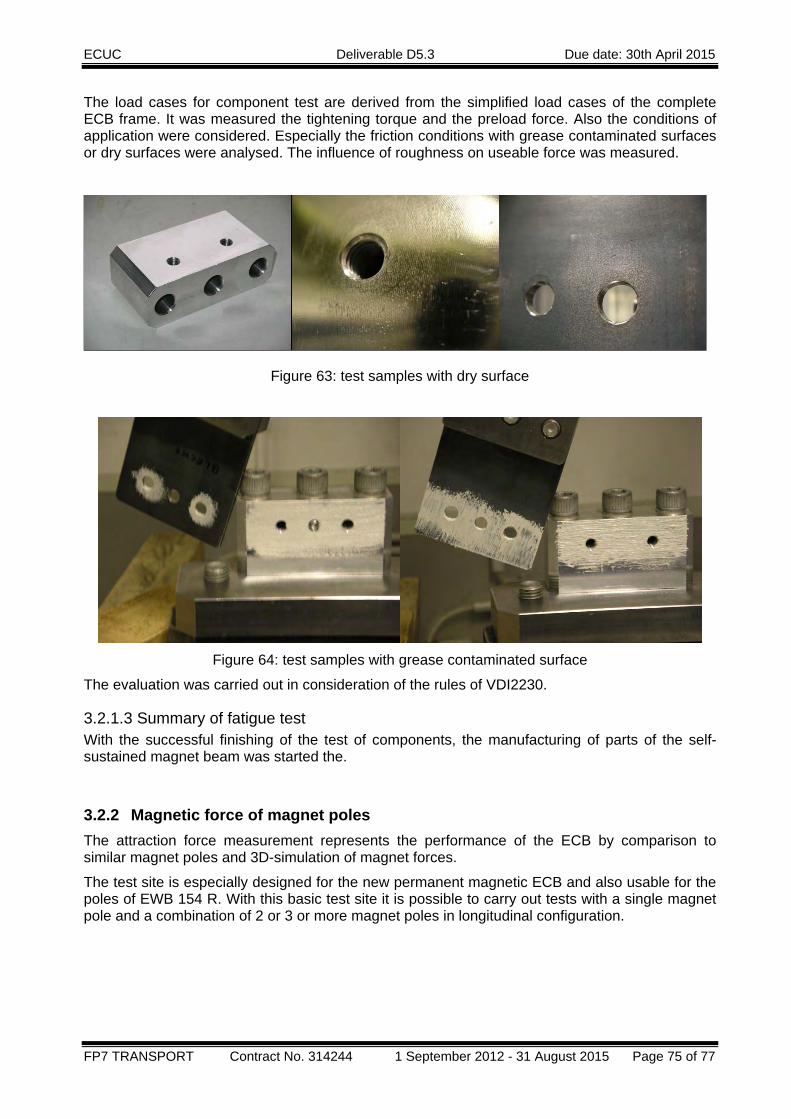
ECUC Deliverable D5.3 Due date: 30th April 2015
FP7 TRANSPORT Contract No. 314244 1 September 2012 - 31 August 2015 Page 75 of 77
The load cases for component test are derived from the simplified load cases of the complete ECB frame. It was measured the tightening torque and the preload force. Also the conditions of application were considered. Especially the friction conditions with grease contaminated surfaces or dry surfaces were analysed. The influence of roughness on useable force was measured.
Figure 63: test samples with dry surface
Figure 64: test samples with grease contaminated surface
The evaluation was carried out in consideration of the rules of VDI2230.
3.2.1.3 Summary of fatigue test With the successful finishing of the test of components, the manufacturing of parts of the self-sustained magnet beam was started the.
3.2.2 Magnetic force of magnet poles The attraction force measurement represents the performance of the ECB by comparison to similar magnet poles and 3D-simulation of magnet forces.
The test site is especially designed for the new permanent magnetic ECB and also usable for the poles of EWB 154 R. With this basic test site it is possible to carry out tests with a single magnet pole and a combination of 2 or 3 or more magnet poles in longitudinal configuration.
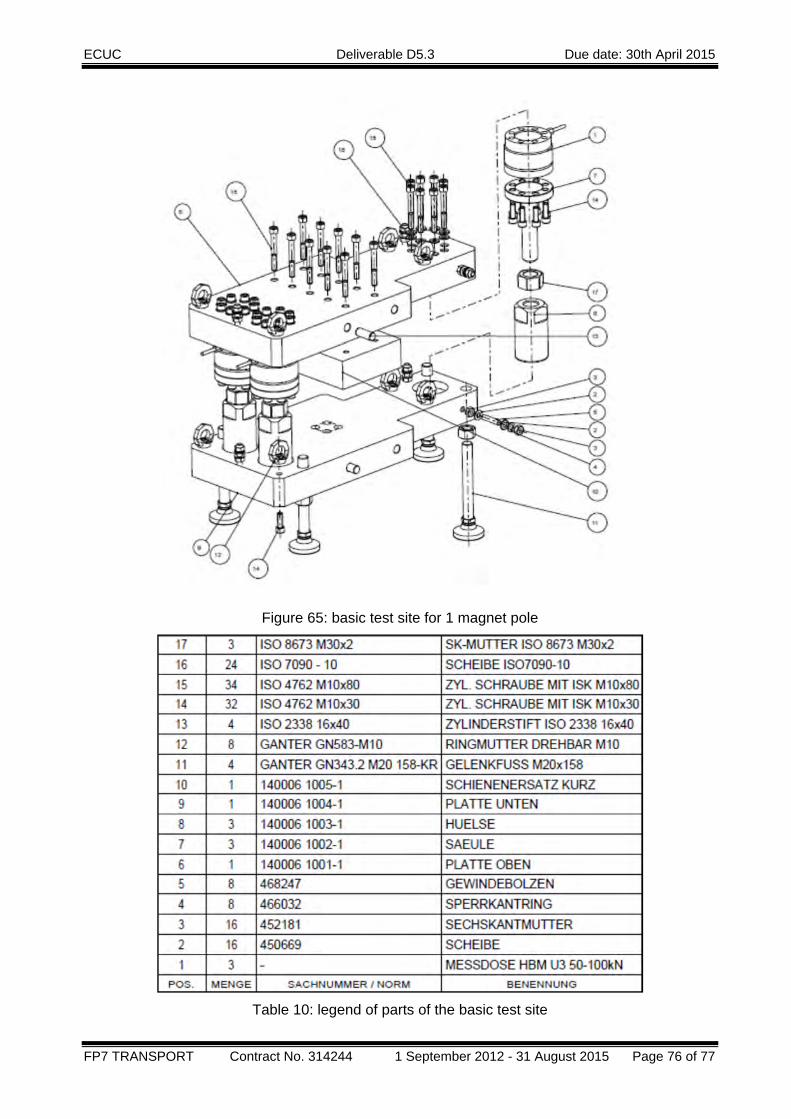
ECUC Deliverable D5.3 Due date: 30th April 2015
FP7 TRANSPORT Contract No. 314244 1 September 2012 - 31 August 2015 Page 76 of 77
Figure 65: basic test site for 1 magnet pole
Table 10: legend of parts of the basic test site

ECUC Deliverable D5.3 Due date: 30th April 2015
FP7 TRANSPORT Contract No. 314244 1 September 2012 - 31 August 2015 Page 77 of 77
The multifunctional property of the construction of the test site makes it applicable also for mechanical performance tests. Force sensors are integrated in the test site.
Figure 66 shows the longitudinal arrangement of the basic test site.
Figure 66: longitudinal configuration of 3 magnet poles (top view)