TEST REPORT - fccid.io · For a more detailed features description about the EUT, please refer to...
70
FCC 47 CFR PART 15 SUBPART C TEST REPORT For Applicant : Bright Win Technology Co., Ltd. Address : Huafeng Technology Building, Bao’An, Shenzhen, China Product Name : 9"Internet Tablet Model Name : DA988, M901, M920, M960, M980, M990, M9012, M9018, M9188, M988, M9066, M9011, M9020 Brand Name : N/A FCC ID : BPO-DAGE-DA988 Report No. : MTE/CLY/D12101594 Date of Issue : Nov. 02, 2012 Issued by : Most Technology Service Co., Ltd. Address : No.5, Langshan 2nd Rd., North Hi-Tech Industrial park, Nanshan, Shenzhen, Guangdong, China Tel : 86-755-8617 0306 Fax : 86-755-8617 0310 The report consists 70 pages in total. It may be duplicated completely for legal use with the approval of the applicant. It should not be reproduced except in full, without the written approval of our laboratory. The client should not use it to claim product endorsement by MOST. The test results in the report only apply to the tested sample. The test report shall be invalid without all the signatures of testing engineers, reviewer and approver.
-
Upload
hoangthien -
Category
Documents
-
view
216 -
download
0
Transcript of TEST REPORT - fccid.io · For a more detailed features description about the EUT, please refer to...

FCC 47 CFR PART 15 SUBPART C
TEST REPORT For
Applicant : Bright Win Technology Co., Ltd.
Address : Huafeng Technology Building, Bao’An, Shenzhen, China
Product Name : 9"Internet Tablet
Model Name : DA988, M901, M920, M960, M980, M990, M9012, M9018, M9188, M988, M9066, M9011, M9020
Brand Name : N/A
FCC ID : BPO-DAGE-DA988
Report No. : MTE/CLY/D12101594
Date of Issue : Nov. 02, 2012
Issued by : Most Technology Service Co., Ltd.
Address : No.5, Langshan 2nd Rd., North Hi-Tech Industrial park, Nanshan, Shenzhen, Guangdong, China
Tel : 86-755-8617 0306
Fax : 86-755-8617 0310
The report consists 70 pages in total. It may be duplicated completely for legal use with the approval of the
applicant. It should not be reproduced except in full, without the written approval of our laboratory. The client
should not use it to claim product endorsement by MOST. The test results in the report only apply to the tested
sample. The test report shall be invalid without all the signatures of testing engineers, reviewer and approver.

FCC ID: BPO-DAGE-DA988 Report No.: MTE/CLY/D12101594
Page 2 of 70
TABLE OF CONTENTS
1. VERIFICATION OF CONFORMITY....................................................................................... 4
2. GENERAL INFORMATION.................................................................................................... 5 2.1 Product Information..................................................................................................................................... 5 2.2 Objective....................................................................................................................................................... 6 2.3 Test Standards and Results........................................................................................................................ 6 2.4 Environmental Conditions .......................................................................................................................... 6 2.5 MEASUREMENT UNCERTAINTY ................................................................................................................. 6 3. TEST FACILITY..................................................................................................................... 7 3.2 Test Conditions ............................................................................................................................................. 8 3.3 Channel List................................................................................................................................................... 8 3.4 Description of Test Modes ........................................................................................................................... 8 3.5 Table of Parameters of Text Software Setting............................................................................................ 8 4. TEST EQUIPMENT LIST..................................................................................................... 10
5. 47 CFR Part 15 C 15.247 Requirements.............................................................................11 5.1 6dB Bandwidth........................................................................................................................................... 11 5.1.1 Definition.....................................................................................................................................11
5.1.2 Limit ............................................................................................................................................11
5.1. 3 Test Configuration........................................................................................................................11
5.1.4 Test Procedure..............................................................................................................................11
5.1.5 Test Result....................................................................................................................................11 5.2 Peak Output Power.................................................................................................................................... 19 5.2.1 Definition.................................................................................................................................... 19
5.2.2 Limit ........................................................................................................................................... 19
5.2.3 Test Configuration....................................................................................................................... 19
5.2.4 Test Procedure............................................................................................................................. 19
5.2.5 Test Result................................................................................................................................... 19 5.3 Conducted Spurious Emission ................................................................................................................ 21 5.3.1 Definition.................................................................................................................................... 21
5.3.2 Test Description .......................................................................................................................... 21
5.3.3 Test Result................................................................................................................................... 21 5.4 Band Edge .................................................................................................................................................. 29 5.4.1 Definition.................................................................................................................................... 29
5.4.2 Test Configuration....................................................................................................................... 29
5.4.3 Test Result................................................................................................................................... 29 5.5 Power Spectral Density (PSD) .................................................................................................................. 40 5.5.1 Definition.................................................................................................................................... 40
5.5.2 Limit ........................................................................................................................................... 40
5.5.4 Test Configuration....................................................................................................................... 40
5.5.3 Test Description .......................................................................................................................... 40
5.5.4 Test Configuration....................................................................................................................... 40
5.5.3 Operation Condition .................................................................................................................... 40
5.5.6 Test Result................................................................................................................................... 40

FCC ID: BPO-DAGE-DA988 Report No.: MTE/CLY/D12101594
Page 3 of 70
5.6 Conducted Emission ................................................................................................................................. 47 5.6.1 Definition.................................................................................................................................... 47
5.6.2 Test Description ............................................................................................................................. 47
5.6.3 Test Result................................................................................................................................... 47 5.7 Radiated Emission..................................................................................................................................... 50 5.7.1 Definition.................................................................................................................................... 50
5.7.2 Test Description .......................................................................................................................... 51
5.7.3 Test Result................................................................................................................................... 52
APPENDIX 1 .............................................................................................................................. 68
PHOTOGRAPHS OF TEST SETUP .......................................................................................... 68

FCC ID: BPO-DAGE-DA988 Report No.: MTE/CLY/D12101594
Page 4 of 70
1. VERIFICATION OF CONFORMITY
Equipment Under Test: 9"Internet Tablet
Brand Name: N/A
Model Number: DA988
Series Model Number: M901, M920, M960, M980, M990, M9012, M9018, M9188, M988, M9066, M9011, M9020
FCC ID: BPO-DAGE-DA988
Bright Win Technology Co., Ltd. Applicant:
Huafeng Technology Building, Bao’An, Shenzhen, China
Bright Win Technology Co., Ltd. Manufacturer:
Huafeng Technology Building, Bao’An, Shenzhen, China
Technical Standards: 47 CFR Part 15 Subpart C
File Number: MTE/CLY/D12101594
Date of test: Oct. 30-Nov. 02, 2012
Deviation: None
Condition of Test Sample: Normal
Test Result: PASS
The above equipment was tested by MOST for compliance with the requirements set forth in FCC rules and the Technical Standards mentioned above. This said equipment in the configuration described in this report shows the maximum emission levels emanating from equipment and the level of the immunity endurance of the equipment are within the compliance requirements. The test results of this report relate only to the tested sample identified in this report.
Prepared by (+ signature):
Carol Yin Nov. 02, 2012
Review by (+ signature):
Elva Wong Nov. 03, 2012
Approved by (+ signature):
Yvette Zhou(Manager) Nov. 03, 2012

FCC ID: BPO-DAGE-DA988 Report No.: MTE/CLY/D12101594
Page 5 of 70
2. GENERAL INFORMATION
2.1 Product Information
Description: 9"Internet Tablet
Model Name: DA988
Series Number: M901, M920, M960, M980, M990, M9012, M9018, M9188, M988, M9066, M9011, M9020
Model Difference description: All models are electrically identical, only model name is different
Frequency Range: 802.11b/g/n(20MHz): 2412-2462MHz 802.11n(40MHz): 2422-2452MHz
Number of Channels: IEEE 802.11b/g/n(20MHz)mode:11 Channels IEEE 802.11n(40MHz)mode: 9 Channels
Modulation Technique:
IEEE 802.11b mode: DSSS (1, 2, 5.5 and 11 Mpbs) IEEE 802.11g mode: OFDM (6, 9, 12, 18, 24, 36, 48 and 54 Mpbs) 802.11n Standard-20 MHz Channel mode: OFDM (6.5, 13, 19.5,26, 39, 52, 58.5, 65.0Mbps) 802.11n Standard-40 MHz Channel mode: OFDM (54, 108, 120,150Mbps)
Antenna Type: Internal Fixed
Antenna Gain: 2.0dBi
Power Supply: DC 5V Adapter AC100-240V,50/60Hz DC 3.7V by Battery
Temperature Range: -10°C ~ 50°C
NOTE:
1. For a more detailed features description about the EUT, please refer to User’s Manual.

FCC ID: BPO-DAGE-DA988 Report No.: MTE/CLY/D12101594
Page 6 of 70
2.2 Objective
Perform FCC Part 15 Subpart C tests for FCC Marking.
2.3 Test Standards and Results
Test items and the results are as bellow:
No. Section Description Result Date of Test
1 15.247(a)(2) 6dB Bandwidth PASS 2012/11/02
2 15.247(b)(3) Peak Output Power PASS 2012/11/02
3 15.247(d) conducted spurious emission PASS 2012/11/02
4 15.247(d) Band Edge PASS 2012/11/02
5 15.247(e) Power Spectral Density PASS 2012/11/02
6 15.207 Conducted Emission PASS 2012/11/02
7 15.247(d) 15.205 15.209
Radiated Emission PASS 2012/11/02
Note: 1. The test result judgment is decided by the limit of measurement standard 2. The information of measurement uncertainty is available upon the customer’s request.
2.4 Environmental Conditions
During the measurement the environmental conditions were within the listed ranges:
- Temperature: 15-35ºC
- Humidity: 30-60 %
- Atmospheric pressure: 86-106 kPa
2.5 MEASUREMENT UNCERTAINTY
The uncertainty is calculated using the methods suggested in the “Guide to the Expression of
Uncertainty in Measurement” (GUM) published by ISO.
The report uncertainty of measurement y±U, where expended uncertainly U is based on a standard uncertainty multiplied by a coverage factor of k=2,Providing a level of confidence of approximately 95%
- Uncertainty of Conducted Emission, Uc = ±1.8dB
- Uncertainty of Radiated Emission, Uc = ±3.2dB

FCC ID: BPO-DAGE-DA988 Report No.: MTE/CLY/D12101594
Page 7 of 70
3. TEST FACILITY
Test Site: Most Technology Service Co., Ltd.
Location: No.5, Nangshan 2nd Rd., North Hi-Tech Industrial park, Nanshan, Shenzhen, Guangdong, China
Description: There is one 3m semi-anechoic an area test sites and two line conducted labs for final
test. The Open Area Test Sites and the Line Conducted labs are constructed and
calibrated to meet the FCC requirements in documents ANSI C63.4 and CISPR 16
requirements.
The FCC Registration Number is 490827. Site Filing: The site description is on file with the Federal Communications
Commission, 7435 Oakland Mills Road, Columbia, MD 21046.
Instrument Tolerance: All measuring equipment is in accord with ANSI C63.4 and CISPR 16 requirements
that meet industry regulatory agency and accreditation agency requirement.
Ground Plane: Two conductive reference ground planes were used during the Line Conducted
Emission, one in vertical and the other in horizontal. The dimensions of these ground
planes are as below. The vertical ground plane was placed distancing 40 cm to the
rear of the wooden test table on where the EUT and the support equipment were
placed during test. The horizontal ground plane projected 50 cm beyond the footprint
of the EUT system and distanced 80 cm to the wooden test table. For Radiated
Emission Test, one horizontal conductive ground plane extended at least 1m beyond
the periphery of the EUT and the largest measuring antenna, and covered the entire
area between the EUT and the antenna. It has no holes or gaps having longitudinal
dimensions larger than one-tenth of a wavelength at the highest frequency of
measurement up to 1GHz.
558074 D01 DTS Meas Guidance v01:
provides Guidance for Performing Compliance Measurements on Digital Transmission
Systems (DTS) Operating Under CFR Title 47 15.247

FCC ID: BPO-DAGE-DA988 Report No.: MTE/CLY/D12101594
Page 8 of 70
3.2 Test Conditions
The EUT has been tested under normal operating(TX)and standby(RX)condition.
The field strength of radiation emission was measured in the following position: EUT stand-up position (Y
axis), lie-down position (X, Z axis).
The following data show only with the worst case setup.
The worst case of Y axis was reported.
Based on client request, all normal using modes of the normal function were tested but only the worst test
data of the worst mode is reported by this report.
3.3 Channel List
Channel List for 802.11b/g/n(20MHz) Channel Frequency
(MHz) Channel Frequency
(MHz) Channel Frequency
(MHz) 01 2412MHz 05 2432MHz 09 2452MHz 02 2417MHz 06 2437MHz 10 2457MHz 03 2422MHz 07 2442MHz 11 2462MHz 04 2427MHz 08 2447MHz
Channel List for 802.11n(40MHz) Channel Frequency
(MHz) Channel Frequency
(MHz) Channel Frequency
(MHz) 03 2422MHz 07 2442MHz 04 2427MHz 08 2447MHz 05 2432MHz 09 2452MHz 06 2437MHz
3.4 Description of Test Modes
To investigate the maximum EMI emission characteristics generates from EUT, the test system was pre-scanning tested base on the consideration of following EUT operation mode or test configuration mode which possible have effect on EMI emission level, Each of these EUT operation mode(s) or test configuration mode(s) mentioned above was evaluated respectively
Pre-test Mode Description Mode 1 802.11b CH01/CH07/CH11 Mode 2 802.11g CH01/CH07/CH11 Mode 3 802.11n(20MHz)CH01/CH07/CH11 Mode 4 802.11n(40MHz)CH03/CH07/CH09 Note: (1) The measurements are performed at the highest, middle, lowest available channels. (2) The measurements are performed at all bit rate of transmitter, the worst data was reported.
3.5 Table of Parameters of Text Software Setting
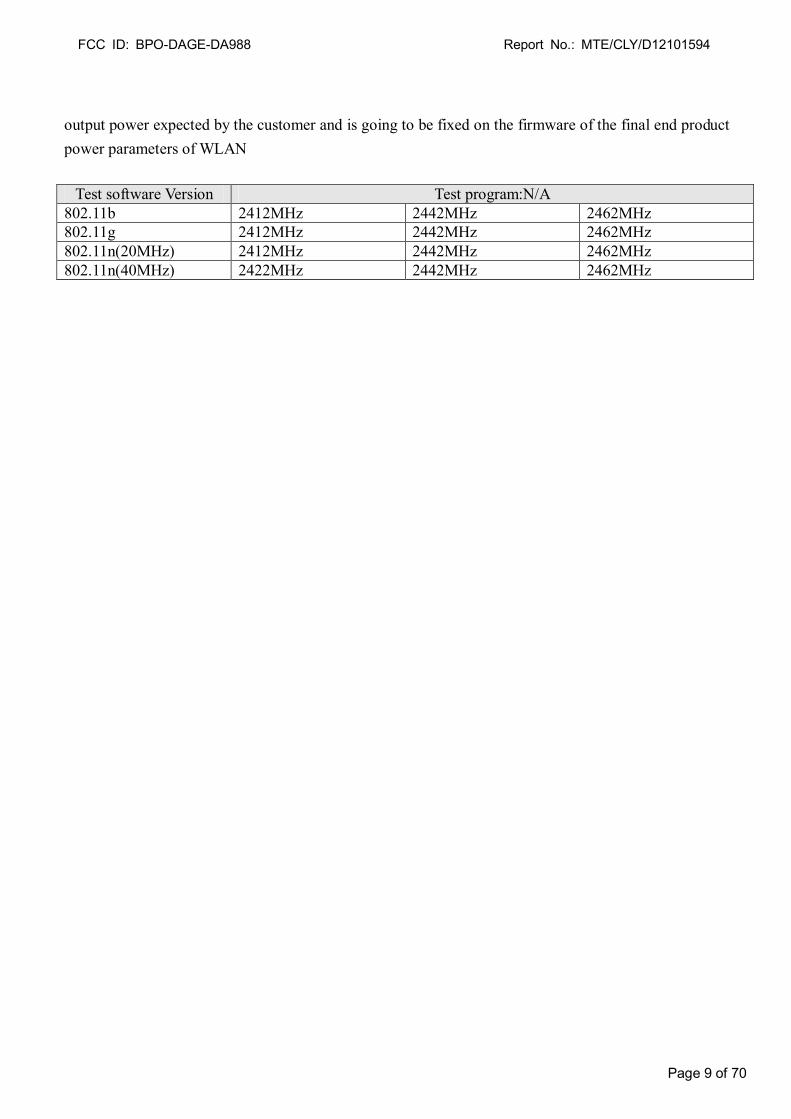
During testing channel & power controlling software provided by the customer was used to control the operating channel as well as the output power level, the RF output power selection is for the setting of RF
FCC ID: BPO-DAGE-DA988 Report No.: MTE/CLY/D12101594
Page 9 of 70
output power expected by the customer and is going to be fixed on the firmware of the final end product power parameters of WLAN
Test software Version Test program:N/A 802.11b 2412MHz 2442MHz 2462MHz 802.11g 2412MHz 2442MHz 2462MHz 802.11n(20MHz) 2412MHz 2442MHz 2462MHz 802.11n(40MHz) 2422MHz 2442MHz 2462MHz

FCC ID: BPO-DAGE-DA988 Report No.: MTE/CLY/D12101594
Page 10 of 70
4. TEST EQUIPMENT LIST Instrumentation: The following list contains equipment used at MOST for testing. The equipment conforms to the CISPR 16-1/ANSI C63.2 Specifications for Electromagnetic Interference and Field Strength Instrumentation from 10 kHz to 1.0 GHz or above. No. Equipment Manufacturer Model No. S/N Calibration
date Calibration
Interval 1 Test Receiver Rohde & Schwarz ESCI 100492 2012/03/14 1 Year
2 Spectrum Analyzer Agilent E7405A US44210471 2012/03/14 1 Year
3 L.I.S.N. Rohde & Schwarz ENV216 100093 2012/03/14 1 Year 4 Coaxial Switch Anritsu Corp MP59B 6200283933 2012/03/14 1 Year 5 Terminator Hubersuhner 50 No.1 2012/03/14 1 Year 6 RF Cable SchwarzBeck N/A No.1 2012/03/14 1 Year 7 Test Receiver Rohde & Schwarz ESPI 101202 2012/03/14 1 Year
8 Bilog Antenna Sunol JB3 A121206 2012/03/14 1 Year
9 Horn Antenna TRC N/A N/A 2012/03/14 1 Year 10 Cable Resenberger N/A NO.1 2012/03/14 1 Year 11 Cable SchwarzBeck N/A NO.2 2012/03/14 1 Year 12 Cable SchwarzBeck N/A NO.3 2012/03/14 1 Year 13 DC Power Filter DuoJi DL230B N/A 2012/03/14 1 Year
14 Single Phase Power Line Filter DuoJi FNF 202B30 N/A 2012/03/14 1 Year
15 3 Phase Power Line Filter DuoJi FNF 402B30 N/A 2012/03/14 1 Year
16 Test Receiver Rohde & Schwarz ESCI 100492 2012/03/14 1 Year 17 Absorbing Clamp Luthi MDS21 3635 2012/03/14 1 Year 18 Coaxial Switch Anritsu Corp MP59B 6200283933 2012/03/14 1 Year 19 AC Power Source Kikusui AC40MA LM003232 2012/03/14 1 Year
20 Test Analyzer Kikusui KHA1000 LM003720 2012/03/14 1 Year
21 Line Impendence Network Kikusui LIN40MA-
PCR-L LM002352 2012/03/14 1 Year 22 ESD Tester Kikusui KES4021 LM003537 2012/03/14 1 Year 23 EMCPRO System EM Test UCS-500-M4 V0648102026 2012/03/14 1 Year 24 Signal Generator IFR 2032 203002/100 2012/03/14 1 Year 25 Amplifier A&R 150W1000 301584 2012/03/14 1 Year
26 CDN FCC FCC-801-M2-25 47 2012/03/14 1 Year
27 CDN FCC FCC-801-M3-25 107 2012/03/14 1 Year 28 EM Injection Clamp FCC F-203I-23mm 403 2012/03/14 1 Year 29 RF Cable MIYAZAKI N/A No.1/No.2 2012/03/14 1 Year
30 Universal Radio Communication
Tester ROHDE&SCHWARZ CMU200 0304789 2012/03/14 1 Year
31 Telecommunication Antenna European Antennas PSA 75301R/170 0304213 2012/03/14 1 Year
32 8 Loop Antenna ARA PLA-1030/B 1029 2012/02/19 1 Year
33 Power Meter R&S NRVS 100444 2012/03/14 1 Year
NOTE: Equipments listed above have been calibrated and are in the period of validation.

FCC ID: BPO-DAGE-DA988 Report No.: MTE/CLY/D12101594
Page 11 of 70
5. 47 CFR Part 15 C 15.247 Requirements
5.1 6dB Bandwidth
5.1.1 Definition Systems using digital modulation techniques may operate in the 902–928 MHz, 2400–2483.5 MHz, and 5725–5850 MHz bands. The minimum 6 dB bandwidth shall be at least 500 kHz.
5.1.2 Limit FCC Part15(15.247)
Section Test Item Limit Frequency Range(MHz)
Result
15.247(a)(2) Bandwidth >=500KHz (6dB Bandwidth)
2400-2483.5 PASS
5.1. 3 Test Configuration
Figure 1: RF Test Setup
5.1.4 Test Procedure
Spectrum Parameters Setting Attenuation Auto
Span Frequency >Measurement bandwidth or channel separation RB 1-5% of the emission bandwidth(EBW) VB ≧3 x RBW
Detector Peak Trace Max Hold
Sweep Time Auto The EUT is powered by the Battery, is coupled to the Spectrum Analyzer (SA) through the Attenuator/DC Block. The path loss as the factor is calibrated to correct the reading. During the measurement, the EUT is activated and is set to operate at maximum power. The RF load attached to the EUT antenna terminal is 50Ohm.
5.1.5 Test Result
The lowest, middle and highest channels are selected to perform testing to record the 6 dB bandwidth of the Module.
5.1.5.1 802.11b Test Mode
The minimum occupied bandwidth for the fundamental frequency 2442 MHz is 6.774 MHz. This occupied bandwidth complies with the FCC requirement.
(Wi-Fi Module)
Spectrum Analyzer
EUT Attenuator
& DC Block

FCC ID: BPO-DAGE-DA988 Report No.: MTE/CLY/D12101594
Page 12 of 70
A. Test Verdict:
Channel Frequency (MHz) 6 dB Bandwidth (MHz) Limits (kHz) Result
1 2412 7.055 ≥500 PASS 7 2442 6.774 ≥500 PASS 11 2462 7.098 ≥500 PASS
B. Test Plot:
(CH Low)
(CH Mid)

FCC ID: BPO-DAGE-DA988 Report No.: MTE/CLY/D12101594
Page 13 of 70
(CH High)
5.1.5.2 802.11g Test Mode
The minimum occupied bandwidth for the fundamental frequency 2462MHz is 15.150MHz. This occupied bandwidth complies with the FCC requirement.
A. Test Verdict:
Channel Frequency (MHz) 6 dB Bandwidth (MHz) Limits (kHz) Result
1 2412 15.369 ≥500 PASS 7 2442 15.922 ≥500 PASS 11 2462 15.150 ≥500 PASS
B. Test Plot:

FCC ID: BPO-DAGE-DA988 Report No.: MTE/CLY/D12101594
Page 14 of 70
(CH Low)
(CH Mid)

FCC ID: BPO-DAGE-DA988 Report No.: MTE/CLY/D12101594
Page 15 of 70
(CH High)
5.1.5.3 802.11n(20MHz) Test Mode
The minimum occupied bandwidth for the fundamental frequency 2442MHz is 16.036MHz. This occupied bandwidth complies with the FCC requirement. A. Test Verdict:
Channel Frequency (MHz) 6 dB Bandwidth (MHz) Limits (kHz) Result
1 2412 16.046 ≥500 PASS 7 2442 16.036 ≥500 PASS 11 2462 17.246 ≥500 PASS
B. Test Plot:
(CH Low)

FCC ID: BPO-DAGE-DA988 Report No.: MTE/CLY/D12101594
Page 16 of 70
(CH Mid)
(CH High)

FCC ID: BPO-DAGE-DA988 Report No.: MTE/CLY/D12101594
Page 17 of 70
5.1.5.4 802.11n Test Mode(40MHz)
The minimum occupied bandwidth for the fundamental frequency 2442MHz is 36.432MHz. This occupied bandwidth complies with the FCC requirement.
A. Test Verdict:
Channel Frequency (MHz) 6 dB Bandwidth (MHz) Limits (kHz) Result
3 2422 36.470 ≥500 PASS 7 2442 36.432 ≥500 PASS 9 2452 36.454 ≥500 PASS
B. Test Plot:
(CH Low)

FCC ID: BPO-DAGE-DA988 Report No.: MTE/CLY/D12101594
Page 18 of 70
(CH Mid)
(CH High)

FCC ID: BPO-DAGE-DA988 Report No.: MTE/CLY/D12101594
Page 19 of 70
5.2 Peak Output Power
5.2.1 Definition For systems using digital modulation in the 902–928 MHz, 2400–2483.5 MHz, and 5725–5850 MHz bands: 1 Watt. As an alternative to a peak power measurement, compliance with the one Watt limit can be based on a measurement of the maximum conducted output power.
5.2.2 Limit FCC Part15(15.247)
Section Test Item Limit Frequency Range(MHz)
Result
15.247(b)(1) Peak Output Power 30dBm 2400-2483.5 PASS
5.2.3 Test Configuration
5.2.4 Test Procedure The EUT which is powered by AC adapter, is coupled to the Power Meter; the RF load attached to the EUT antenna terminal is 50Ohm; the path loss as the factor is calibrated to correct the reading.
5.2.5 Test Result The EUT operates at maximum output power mode. The lowest, middle and highest channels are selected to perform testing to verify the conducted RF output peak power of the Module.
5.2.5.1 802.11b Test Mode The maximum output power for the fundamental frequency 2412MHz is 9.97dBm. This power complies with the FCC requirement.
A. Test Verdict:
Measured Output Peak Power Limit Channel Frequency (MHz) dBm W dBm W Verdict
1 2412 9.97 0.0099 PASS 7 2442 9.73 0.0094 PASS 11 2462 9.76 0.0095
30 1 PASS
5.2.5.2 802.11g Test Mode The maximum output power for the fundamental frequency 2412 MHz is 8.78dBm. This power complies with the FCC requirement.
A. Test Verdict:
Measured Output Peak Power Limit Channel Frequency (MHz) dBm W dBm W Verdict
1 2412 8.78 0.0076 PASS 7 2442 8.10 0.0065 PASS 11 2462 8.84 0.0077
30 1 PASS

FCC ID: BPO-DAGE-DA988 Report No.: MTE/CLY/D12101594
Page 20 of 70
5.2.5.3 802.11n(20MHz) Test Mode The maximum output power for the fundamental frequency 2412 MHz is 7.84dBm. This power complies with the FCC requirement.
A. Test Verdict:
Measured Output Peak Power Limit Channel Frequency (MHz) dBm W dBm W Verdict
1 2412 7.84 0.0061 PASS 7 2442 7.66 0.0058 PASS 11 2462 7.35 0.0054
30 1 PASS
5.2.5.4 802.11n Test Mode (40MHz) The maximum output power for the fundamental frequency 2452 MHz is 6.786dBm. This power complies with the FCC requirement.
B. Test Verdict:
Measured Output Peak Power Limit Channel Frequency (MHz) dBm W dBm W Verdict
3 2422 6.543 0.004 PASS 7 2442 6.625 0.004 PASS 9 2452 6.786 0.004
30 1 PASS

FCC ID: BPO-DAGE-DA988 Report No.: MTE/CLY/D12101594
Page 21 of 70
5.3 Conducted Spurious Emission
5.3.1 Definition In any 100 kHz bandwidth outside the frequency band in which the spread spectrum or digitally modulated intentional radiator is operating, the radio frequency power that is produced by the intentional radiator shall be at least 20 dB below that in the 100 kHz bandwidth within the band that contains the highest level of the desired power, based on either an RF conducted or a radiated measurement, provided the transmitter demonstrates compliance with the peak conducted power limits.
5.3.2 Test Description See section 5.1.2 of this report.
5.3.3 Test Result The measurement frequency range is from 30MHz to the 10th harmonic of the fundamental frequency. The lowest, middle and highest channels are tested to verify the spurious emissions.
5.3.3.1 802.11b Test Mode
Test Plot:
(CH Low, 1GHz to 26.5GHz)

FCC ID: BPO-DAGE-DA988 Report No.: MTE/CLY/D12101594
Page 22 of 70
(CH MID, 1GHz to 26.5GHz)
(CH High, 1GHz to 26.5GHz)
Note: 1. The power of the Module transmitting frequency should be ignored.

FCC ID: BPO-DAGE-DA988 Report No.: MTE/CLY/D12101594
Page 23 of 70
5.3.3.2. 802.11g Test Mode
Test Plot:
(CH Low, 1GHz to 26.5GHz)
(CH MID, 1GHz to 26.5GHz)

FCC ID: BPO-DAGE-DA988 Report No.: MTE/CLY/D12101594
Page 24 of 70
(CH High, 1GHz to 26.5GHz)
Note: 1. The power of the Module transmitting frequency should be ignored.
5.3.3.3 802.11n(20MHz) Test Mode
Test Plot:
(CH Low, 1GHz to 26.5GHz)

FCC ID: BPO-DAGE-DA988 Report No.: MTE/CLY/D12101594
Page 25 of 70
(CH MID, 1GHz to 26.5GHz)
(CH High, 1GHz to 26.5GHz)

FCC ID: BPO-DAGE-DA988 Report No.: MTE/CLY/D12101594
Page 26 of 70
5.3.3. 802.11n Test Mode (40MHz)
Test Plot:
(CH Low, 9kHz to 1GHz)
(CH Low, 1GHz to 26.5GHz)

FCC ID: BPO-DAGE-DA988 Report No.: MTE/CLY/D12101594
Page 27 of 70
(CH Mid, 9kHz to 1GHz)
(CH Mid, 1GHz to 26.5GHz)

FCC ID: BPO-DAGE-DA988 Report No.: MTE/CLY/D12101594
Page 28 of 70
(CH High, 9kHz to 1GHz)
(CH High, 1GHz to 26.5GHz)

FCC ID: BPO-DAGE-DA988 Report No.: MTE/CLY/D12101594
Page 29 of 70
5.4 Band Edge
5.4.1 Definition In any 100 kHz bandwidth outside the frequency band in which the spread spectrum or digitally modulated intentional radiator is operating, the radio frequency power that is produced by the intentional radiator shall be at least 20 dB below that in the 100 kHz bandwidth within the band that contains the highest level of the desired power, based on either an RF conducted or a radiated measurement, provided the transmitter demonstrates compliance with the peak conducted power limits.
5.4.2 Test Configuration
Spectrum analyzer
Horn antenna
3m
4m
1m Turntable
EUT
0.8m
Antenna tower
Pre-amp
5.4.3 Test Result The EUT operates at continuous transmit test mode. The lowest and highest channels are tested to verify the band edge emissions.
5.4.3.1 802.11b Test Mode
Test Result Highest Emission (dBuv/m)
Vertical Horizontal Test Mode Channel Marked Frequency Limit (dBuv/m)
Peak Average Peak Average
2390MHz 55.78 34.73 55.53 33.52 Low Channel 2400MHz 65.79 45.25 66.62 45.20
2483.5MHz 55.21 34.75 55.31 33.42 WIFI
High Channel 2500MHz
74(Peak) 54(Average)
53.78 32.65 54.14 32.77

FCC ID: BPO-DAGE-DA988 Report No.: MTE/CLY/D12101594
Page 30 of 70
Test Plot:
(CH Low, Vertical, Peak)
(CH Low, Horizontal, Peak)

FCC ID: BPO-DAGE-DA988 Report No.: MTE/CLY/D12101594
Page 31 of 70
(CH High, Vertical, Peak)
(CH High, Horizontal, Peak)

FCC ID: BPO-DAGE-DA988 Report No.: MTE/CLY/D12101594
Page 32 of 70
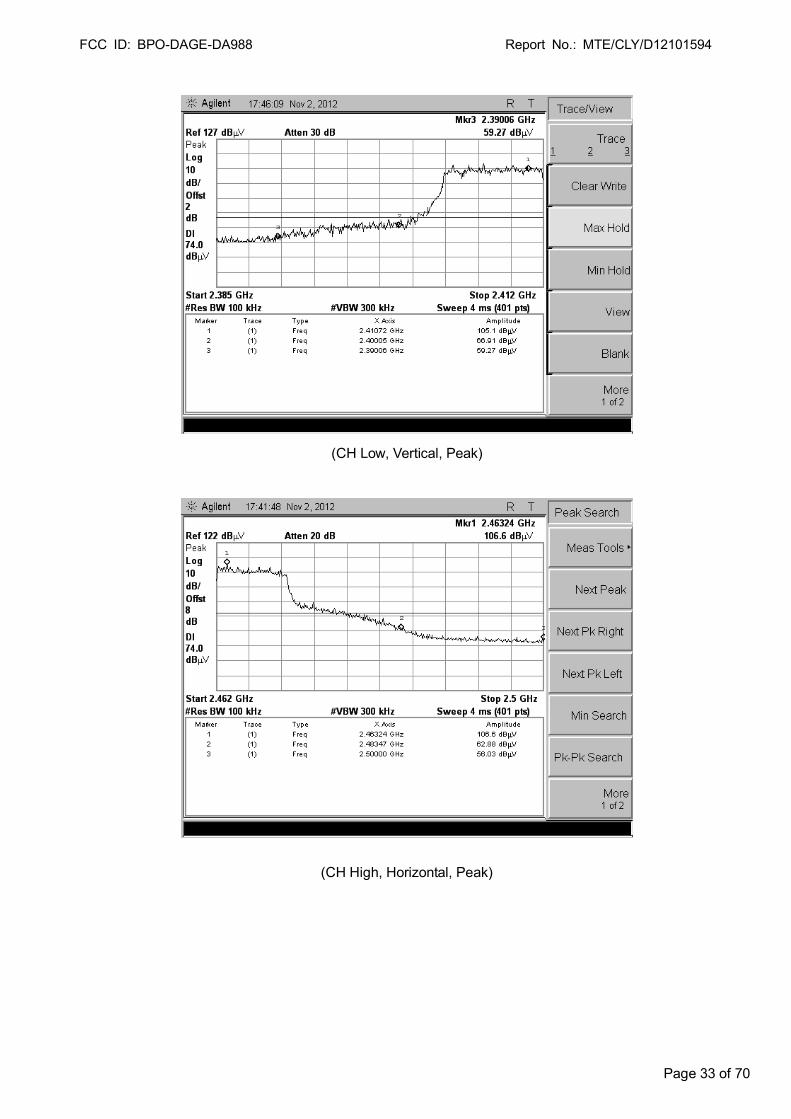
5.4.3.2 802.11g Test Mode
Test Plot:
(CH Low, Horizontal, Peak )
Test Result Highest Emission (dBuv/m)
Vertical Horizontal Test Mode Channel Marked Frequency Limit (dBuv/m)
Peak Average Peak Average
2390MHz 59.27 38.65 60.71 41.30 Low Channel 2400MHz 66.91 45.38 70.45 48.59
2483.5MHz 65.14 44.75 62.88 41.32 WIFI
High Channel 2500MHz
74(Peak) 54(Average)
54.25 34.35 56.03 35.47
FCC ID: BPO-DAGE-DA988 Report No.: MTE/CLY/D12101594
Page 33 of 70
(CH Low, Vertical, Peak)
(CH High, Horizontal, Peak)

FCC ID: BPO-DAGE-DA988 Report No.: MTE/CLY/D12101594
Page 34 of 70
(CH High, Vertical, Peak)
5.4.3.3 802.11n(20MHz) Test Mode
Test Plot:
Test Result Highest Emission (dBuv/m)
Vertical Horizontal Test Mode Channel Marked Frequency Limit (dBuv/m)
Peak Average Peak Average
2390MHz 59.19 36.68 59.36 37.63 Low Channel 2400MHz 71.82 50.57 72.11 51.32
2483.5MHz 62.05 40.34 62.05 41.55 WIFI
High Channel 2500MHz
74(Peak) 54(Average)
55.60 34.73 53.08 32.45

FCC ID: BPO-DAGE-DA988 Report No.: MTE/CLY/D12101594
Page 35 of 70
(CH Low, Horizontal, Peak )
(CH Low, Vertical, Peak)

FCC ID: BPO-DAGE-DA988 Report No.: MTE/CLY/D12101594
Page 36 of 70
(CH High, Horizontal, Peak )
(CH High, Vertical, Peak)

FCC ID: BPO-DAGE-DA988 Report No.: MTE/CLY/D12101594
Page 37 of 70
5.4.3.4 802.11n(40MHz) Test Mode
Test Plot:
(CH Low, Horizontal, Peak )
Test Result Highest Emission (dBuv/m)
Vertical Horizontal Test Mode Channel Marked Frequency Limit (dBuv/m)
Peak Average Peak Average
2390MHz 59.69 39.14 59.41 39.20 Low Channel 2400MHz 71.82 50.98 72.09 51.95
2483.5MHz 61.56 40.86 62.93 41.85 WIFI
High Channel 2500MHz
74(Peak) 54(Average)
61.20 40.07 60.29 39.32

FCC ID: BPO-DAGE-DA988 Report No.: MTE/CLY/D12101594
Page 38 of 70
(CH Low, Vertical, Peak)
(CH High, Horizontal, Peak )

FCC ID: BPO-DAGE-DA988 Report No.: MTE/CLY/D12101594
Page 39 of 70
(CH High, Vertical, Peak)

FCC ID: BPO-DAGE-DA988 Report No.: MTE/CLY/D12101594
Page 40 of 70
5.5 Power Spectral Density (PSD)
5.5.1 Definition For digitally modulated systems, the power spectral density conducted from the intentional radiator to the antenna shall not be greater than 8 dBm in any 3 kHz band.
5.5.2 Limit FCC Part15(15.247)
Section Test Item Limit Frequency Range(MHz)
Result
15.247 Power Spectral Density
8 dBm (in any 3KHz)
2402-2483.5 PASS
5.5.4 Test Configuration
5.5.3 Test Description Spectrum Parameters Setting
Attenuation Auto Span Frequency 5-30% greater than the EBW
RB 100kHz VB 300KHz
Detector Peak Trace Max Hold
Sweep Time Auto a. The EUT was directly connectd to the spectrum analyzer and antenna output port as show in the block
diagram below, b. Spectrum Setting: RBW=100KHz, VBW=300KHz, Sweep time=Auto. Span to 5-30% greater than EBW c. Scale the observed power level to an equivalent value in 3kHz by adjusting(reducing) the measured power
by a bandwidth correction factor(BWCF) where BWCF=10log(3kHz/100kHz=-15.2dB). d. Use peak detector+BWCF. f. The resulting peak PSD level must be ≦8dBm.
5.5.4 Test Configuration
5.5.3 Operation Condition The EUT tested system was configured as the statements of 2.1 unless otherwise a special operating condition is specified in the follows during the testing.
5.5.6 Test Result The lowest, middle and highest channels are tested to verify the power spectral density.
EUT Spectrum Analyzer
EUT Spectrum Analyzer

FCC ID: BPO-DAGE-DA988 Report No.: MTE/CLY/D12101594
Page 41 of 70
5.5.6.1 802.11b Test Mode
A. Test Verdict:
Channel Frequency (MHz) PSD (dBm) Limits(dBm) Result 1 2412 -11.157 ≤8 PASS 7 2442 -11.785 ≤8 PASS 11 2462 -11.630 ≤8 PASS
B. Test Plot:
(CH Low)
(CH Mid)

FCC ID: BPO-DAGE-DA988 Report No.: MTE/CLY/D12101594
Page 42 of 70
(CH High)
5.5.6.2 802.11g Test Mode
A. Test Verdict:
Channel Frequency (MHz) PSD (dBm) Limits(dBm) Result 1 2412 -16.434 ≤8 PASS 7 2442 -16.499 ≤8 PASS 11 2462 -16.499 ≤8 PASS
B. Test Plot:
(CH Low)

FCC ID: BPO-DAGE-DA988 Report No.: MTE/CLY/D12101594
Page 43 of 70
(CH Mid)
(CH High)

FCC ID: BPO-DAGE-DA988 Report No.: MTE/CLY/D12101594
Page 44 of 70
5.5.6.3 802.11n(20MHz) Test Mode
A. Test Verdict:
Channel Frequency (MHz) PSD (dBm) Limits(dBm) Result 1 2412 -12.387 ≤8 PASS 7 2442 -13.402 ≤8 PASS 11 2462 -14.388 ≤8 PASS
B. Test Plot:
(CH Low)
(CH Mid)

FCC ID: BPO-DAGE-DA988 Report No.: MTE/CLY/D12101594
Page 45 of 70
(CH High)
5.5.6.4 802.11n Test Mode (40MHz)
A. Test Verdict:
Channel Frequency (MHz) PSD (dBm) Limits(dBm) Result 3 2422 -18.842 ≤8 PASS 7 2442 -18.037 ≤8 PASS 9 2452 -17.919 ≤8 PASS
B. Test Plot:
(CH Low)

FCC ID: BPO-DAGE-DA988 Report No.: MTE/CLY/D12101594
Page 46 of 70
(CH Mid)
(CH High)

FCC ID: BPO-DAGE-DA988 Report No.: MTE/CLY/D12101594
Page 47 of 70
5.6 Conducted Emission
5.6.1 Definition According to FCC section 15.207, for an intentional radiator that is designed to be connected to the public utility (AC) power line, the radio frequency voltage that is conducted back onto the AC power line on any frequency or frequencies, within the band 150 kHz to 30 MHz, shall not exceed the limits in the following table, as measured using a 50 μH/50 ohms line impedance stabilization network (LISN).
Maximum RF Line Voltage Frequency Q.P.( dBuV) Average( dBuV) 150kHz-500kHz 66-56 56-46
500kHz-5MHz 56 46
5MHz-30MHz 60 50 Note: 1. The lower limit shall apply at the transition frequency. 2. The limit decreases linearly with the logarithm of the frequency in the range 0.15 MHz to 0.50 MHz
5.6.2 Test Description The EUT is powered by the AC Adapter which is powered by 120V, 60Hz AC mains supply through a line impedance stabilization network(LISN). The LISN provide 50Ohm/50Uh of coupling impedance for the measuring instrument, The path loss as the factor is calibrated to correct the reading. During the measurement, the EUT is activated and is set to operate at maximum power.
5.6.3 Test Result A scan was taken on both power lines, Line 1 and Line 2, recording at least the six highest emissions. Emission frequency and amplitude were recorded into a computer in which correction factors were used to calculate the emission level and compare reading to the applicable limit. If EUT emission level was less –2dB to the A.V. limit in Peak mode, then the emission signal was re-checked using Q.P and Average detector.
The Wifi model was carried out for 802.11b/g/n modulation types, 802.11b High channel modulation type was the worst case condition, The test data was shown on the summary data page.
40cm
EUT
LISN
80cm
>80cm
80cm
Receiver
Communication
Antenna
System
Simulator

FCC ID: BPO-DAGE-DA988 Report No.: MTE/CLY/D12101594
Page 48 of 70

FCC ID: BPO-DAGE-DA988 Report No.: MTE/CLY/D12101594
Page 49 of 70

FCC ID: BPO-DAGE-DA988 Report No.: MTE/CLY/D12101594
Page 50 of 70
5.7 Radiated Emission
5.7.1 Definition According to FCC section 15.247(d), radiated emission outside the frequency band attenuation below the general limits specified in § 15.209(a) is not required. In addition, radiated emissions which fall in the restricted bands, as defined in § 15.205(a), must also comply with the radiated emission limits specified in § 15.209(a) (see § 15.205(c)).
According to FCC section 15.209 (a), except as provided elsewhere in this subpart, the emissions from an intentional radiator shall not exceed the field strength levels specified in the following table:
Frequency (MHz) Field Strength (µV/m) Measurement Distance (m)
0.009 - 0.490 2400/F(kHz) 300
0.490 - 1.705 24000/F(kHz) 30
1.705 - 30.0 30 30
30 - 88 100 3
88 - 216 150 3
216 - 960 200 3
Above 960 500 3
As shown in FCC section 15.35(b), for frequencies above 1000MHz, the field strength limits are based on average detector. When average radiated emission measurements are specified in this part, including emission measurements below 1000MHz, there also is a limit on the radio frequency emissions, as measured using instrumentation with a peak detector function, corresponding to 20dB above the maximum permitted average limit for the frequency being investigated unless a different peak emission limit is otherwise specified in the rules.

FCC ID: BPO-DAGE-DA988 Report No.: MTE/CLY/D12101594
Page 51 of 70
5.7.2 Test Description
A. Test Configuration:
Below 1GHz:
Spectrum analyzer
3m
4m
1m Turntable
EUT
0.8m
Antenna tower
Reference ground plane
Bi-log antenna
Spectrum a nalyzer
4m
1m Turntable
EUT
0.8m
Antenna tower
Reference Ground plane
Loop antenna

FCC ID: BPO-DAGE-DA988 Report No.: MTE/CLY/D12101594
Page 52 of 70
Above 1GHz:
Spectrum analyzer
Horn antenna
3m
4m
1m Turntable
EUT
0.8m
Antenna tower
Pre-amp
B. Test procedures
1. The EUT is placed on a turntable, which is 0.8m above ground plane.
2. The turntable shall be rotated for 360 degrees to determine the position of maximum emission level.
3. EUT is set 3m away from the receiving antenna, which is varied from 1m to 4m to find out the highest emissions.
4. Maximum procedure was performed on the six highest emissions to ensure EUT compliance.
5. And also, each emission was to be maximized by changing the polarization of receiving antenna both horizontal and vertical.
6. Set the spectrum analyzer in the following setting as:
Below 1GHz: RBW=100 kHz / VBW=300 kHz / Sweep=AUTO
Above 1GHz : (a) PEAK: RBW=VBW=1MHz / Sweep=AUTO (b) AVERAGE: RBW=1MHz / VBW=10Hz / Sweep=AUTO
7. Repeat above procedures until the measurements for all frequencies are complete.
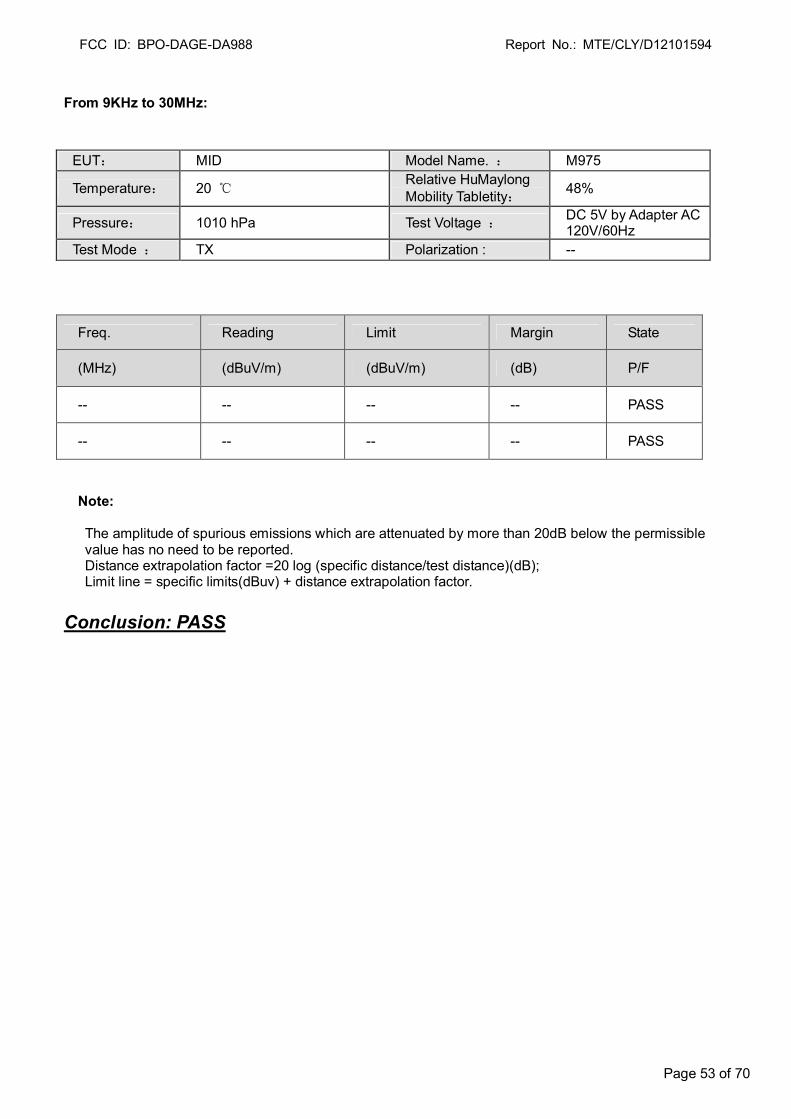
5.7.3 Test Result The Wifi model was carried out for 802.11b/g/n modulation types, 802.11b High channel modulation type was the worst case condition, The test data was shown on the summary data page.
FCC ID: BPO-DAGE-DA988 Report No.: MTE/CLY/D12101594
Page 53 of 70
From 9KHz to 30MHz:
EUT: MID Model Name. : M975
Temperature: 20 ℃ Relative HuMaylong Mobility Tabletity: 48%
Pressure: 1010 hPa Test Voltage : DC 5V by Adapter AC 120V/60Hz
Test Mode : TX Polarization : --
Note: The amplitude of spurious emissions which are attenuated by more than 20dB below the permissible value has no need to be reported. Distance extrapolation factor =20 log (specific distance/test distance)(dB); Limit line = specific limits(dBuv) + distance extrapolation factor.
Conclusion: PASS
Freq. Reading Limit Margin State
(MHz) (dBuV/m) (dBuV/m) (dB) P/F
-- -- -- -- PASS
-- -- -- -- PASS

FCC ID: BPO-DAGE-DA988 Report No.: MTE/CLY/D12101594
Page 54 of 70
Below 1 GHz

FCC ID: BPO-DAGE-DA988 Report No.: MTE/CLY/D12101594
Page 55 of 70

FCC ID: BPO-DAGE-DA988 Report No.: MTE/CLY/D12101594
Page 56 of 70
Above 1 GHz
Operation Mode: TX/ IEEE 802.11b/CH Low Test Date: Oct. 30, 2012
Temperature: 20oC Tested by: Habby Guo
Humidity: 70 % RH Polarity: Ver. / Hor.
Notes: 1. Measuring frequencies from 1 GHz to the 10th harmonic of highest fundamental frequency. 2. Radiated emissions measured in frequency above 1000MHz were made with an instrument using
peak/average detector mode. 3. Average test would be performed if the peak result were greater than the average limit or as required by the
applicant. 4. Data of measurement within this frequency range shown “ --- ” in the table above means the reading of
emissions are attenuated more than 20dB below the permissible limits or the field strength is too small to be measured.
5. Measurements above show only up to 6 maximum emissions noted, or would be lesser, with “ N/A ” remark, if no specific emissions from the EUT are recorded (ie: margin>20dB from the applicable limit) and considered that's already beyond the background noise floor.
6. Margin (dB) = Remark result (dBuV/m) – Average limit (dBuV/m).
Freq. Ant. Pol Peak AV Ant. / CL Peak AV AV
(MHz) H/V Reading Reading CF Actual Fs
Limit Limit Margin (dBuV) (dBuV) (dB) Peak AV (dBuV/m) (dBuV/m) (dB) (dBuV/m) (dBuV/m)
4824.0 H 33.28 14.02 23.54 56.82 37.56 74.00 54.00 -16.44 N/A H
4824.0 V 32.71 13.59 23.36 56.07 36.95 74.00 54.00 -17.05
N/A V

FCC ID: BPO-DAGE-DA988 Report No.: MTE/CLY/D12101594
Page 57 of 70
Operation Mode: TX/ IEEE 802.11b/CH Mid Test Date: Oct. 30, 2012
Temperature: 20oC Tested by: Habby Guo
Humidity: 70 % RH Polarity: Ver. / Hor.
Notes: 1. Measuring frequencies from 1 GHz to the 10th harmonic of highest fundamental frequency.
2. Radiated emissions measured in frequency above 1000MHz were made with an instrument using
peak/average detector mode.
3. Average test would be performed if the peak result were greater than the average limit or as required by the
applicant.
4. Data of measurement within this frequency range shown “ --- ” in the table above means the reading of
emissions are attenuated more than 20dB below the permissible limits or the field strength is too small to be
measured.
5. Measurements above show only up to 6 maximum emissions noted, or would be lesser, with “ N/A ” remark,
if no specific emissions from the EUT are recorded (ie:
margin>20dB from the applicable limit) and considered that's already beyond the background noise floor.
6. Margin (dB) = Remark result (dBuV/m) – Average limit (dBuV/m).
Freq. Ant. Pol Peak AV Ant. / CL Peak AV AV
(MHz) H/V Reading Reading CF Actual Fs
Limit Limit Margin (dBuV) (dBuV) (dB) Peak AV (dBuV/m) (dBuV/m) (dB) (dBuV/m) (dBuV/m)
4884.0 H 36.39 17.56 23.54 59.93 41.10 74.00 54.00 -12.90 N/A H
4884.0 V 36.25 16.84 23.36 59.61 40.20 74.00 54.00 -13.80
N/A V

FCC ID: BPO-DAGE-DA988 Report No.: MTE/CLY/D12101594
Page 58 of 70
Operation Mode: TX/ IEEE 802.11b/CH High Test Date: Oct. 30, 2012
Temperature: 20oC Tested by: Habby Guo
Humidity: 70 % RH Polarity: Ver. / Hor.
Notes: 1. Measuring frequencies from 1 GHz to the 10th harmonic of highest fundamental frequency.
2. Radiated emissions measured in frequency above 1000MHz were made with an instrument using
peak/average detector mode.
3. Average test would be performed if the peak result were greater than the average limit or as required by the
applicant.
4. Data of measurement within this frequency range shown “ --- ” in the table above means the reading of
emissions are attenuated more than 20dB below the permissible limits or the field strength is too small to be
measured.
5. Measurements above show only up to 6 maximum emissions noted, or would be lesser, with “ N/A ” remark,
if no specific emissions from the EUT are recorded (ie:
margin>20dB from the applicable limit) and considered that's already beyond the background noise floor.
6. Margin (dB) = Remark result (dBuV/m) – Average limit (dBuV/m).
Freq. Ant. Pol Peak AV Ant. / CL Peak AV AV
(MHz) H/V Reading Reading CF Actual Fs
Limit Limit Margin (dBuV) (dBuV) (dB) Peak AV (dBuV/m) (dBuV/m) (dB) (dBuV/m) (dBuV/m)
4924.0 H 32.70 11.67 23.54 56.24 34.21 74.00 54.00 -19.79 N/A H
4924.0 V 32.82 12.01 23.36 55.18 35.37 74.00 54.00 -18.63
N/A V

FCC ID: BPO-DAGE-DA988 Report No.: MTE/CLY/D12101594
Page 59 of 70
Operation Mode: TX/ IEEE 802.11g/CH Low Test Date: Oct. 30, 2012
Temperature: 20oC Tested by: Habby Guo
Humidity: 70 % RH Polarity: Ver. / Hor.
Notes: 1. Measuring frequencies from 1 GHz to the 10th harmonic of highest fundamental frequency.
2. Radiated emissions measured in frequency above 1000MHz were made with an instrument using
peak/average detector mode.
3. Average test would be performed if the peak result were greater than the average limit or as required by the
applicant.
4. Data of measurement within this frequency range shown “ --- ” in the table above means the reading of
emissions are attenuated more than 20dB below the permissible limits or the field strength is too small to be
measured.
5. Measurements above show only up to 6 maximum emissions noted, or would be lesser, with “ N/A ” remark,
if no specific emissions from the EUT are recorded (ie:
margin>20dB from the applicable limit) and considered that's already beyond the background noise floor.
6. Margin (dB) = Remark result (dBuV/m) – Average limit (dBuV/m).
Freq. Ant. Pol Peak AV Ant. / CL Peak AV AV
(MHz) H/V Reading Reading CF Actual Fs
Limit Limit Margin (dBuV) (dBuV) (dB) Peak AV (dBuV/m) (dBuV/m) (dB) (dBuV/m) (dBuV/m)
4824.0 H 32.95 13.78 23.78 56.73 36.56 74.00 54.00 -17.44 N/A H
4824.0 V 31.37 10.64 24.01 55.38 34.65 74.00 54.00 -19.35
N/A V

FCC ID: BPO-DAGE-DA988 Report No.: MTE/CLY/D12101594
Page 60 of 70
Operation Mode: TX/ IEEE 802.11g/CH Mid Test Date: Oct. 30, 2012
Temperature: 20oC Tested by: Habby Guo
Humidity: 70 % RH Polarity: Ver. / Hor.
Notes: 1. Measuring frequencies from 1 GHz to the 10th harmonic of highest fundamental frequency.
2. Radiated emissions measured in frequency above 1000MHz were made with an instrument using
peak/average detector mode.
3. Average test would be performed if the peak result were greater than the average limit or as required by the
applicant.
4. Data of measurement within this frequency range shown “ --- ” in the table above means the reading of
emissions are attenuated more than 20dB below the permissible limits or the field strength is too small to be
measured.
5. Measurements above show only up to 6 maximum emissions noted, or would be lesser, with “ N/A ” remark,
if no specific emissions from the EUT are recorded (ie:
margin>20dB from the applicable limit) and considered that's already beyond the background noise floor.
6. Margin (dB) = Remark result (dBuV/m) – Average limit (dBuV/m).
Freq. Ant. Pol Peak AV Ant. / CL Peak AV AV
(MHz) H/V Reading Reading CF Actual Fs
Limit Limit Margin (dBuV) (dBuV) (dB) Peak AV (dBuV/m) (dBuV/m) (dB) (dBuV/m) (dBuV/m)
4884.0 H 32.84 13.54 23.78 56.62 37.32 74.00 54.00 -16.68 N/A H
4884.0 V 31.97 10.20 24.01 55.98 34.21 74.00 54.00 -19.79
N/A V

FCC ID: BPO-DAGE-DA988 Report No.: MTE/CLY/D12101594
Page 61 of 70
Operation Mode: TX/ IEEE 802.11g/CH High Test Date: Oct. 30, 2012
Temperature: 20oC Tested by: Habby Guo
Humidity: 70 % RH Polarity: Ver. / Hor.
Notes: 1. Measuring frequencies from 1 GHz to the 10th harmonic of highest fundamental frequency.
2. Radiated emissions measured in frequency above 1000MHz were made with an instrument using
peak/average detector mode.
3. Average test would be performed if the peak result were greater than the average limit or as required by the
applicant.
4. Data of measurement within this frequency range shown “ --- ” in the table above means the reading of
emissions are attenuated more than 20dB below the permissible limits or the field strength is too small to be
measured.
5. Measurements above show only up to 6 maximum emissions noted, or would be lesser, with “ N/A ” remark,
if no specific emissions from the EUT are recorded (ie:
margin>20dB from the applicable limit) and considered that's already beyond the background noise floor.
6. Margin (dB) = Remark result (dBuV/m) – Average limit (dBuV/m).
Freq. Ant. Pol Peak AV Ant. / CL Peak AV AV
(MHz) H/V Reading Reading CF Actual Fs
Limit Limit Margin (dBuV) (dBuV) (dB) Peak AV (dBuV/m) (dBuV/m) (dB) (dBuV/m) (dBuV/m)
4924.0 H 32.41 11.58 23.78 56.19 35.36 74.00 54.00 -18.64 N/A H
4924.0 V 31.58 10.42 24.01 55.59 34.43 74.00 54.00 -19.57
N/A V

FCC ID: BPO-DAGE-DA988 Report No.: MTE/CLY/D12101594
Page 62 of 70
Operation Mode: TX/ IEEE 802.11n(20MHz)/CH Low Test Date: Oct. 30, 2012
Temperature: 20oC Tested by: Habby Guo
Humidity: 70 % RH Polarity: Ver. / Hor.
Notes: 1. Measuring frequencies from 1 GHz to the 10th harmonic of highest fundamental frequency.
2. Radiated emissions measured in frequency above 1000MHz were made with an instrument using
peak/average detector mode.
3. Average test would be performed if the peak result were greater than the average limit or as required by the
applicant.
4. Data of measurement within this frequency range shown “ --- ” in the table above means the reading of
emissions are attenuated more than 20dB below the permissible limits or the field strength is too small to be
measured.
5. Measurements above show only up to 6 maximum emissions noted, or would be lesser, with “ N/A ” remark,
if no specific emissions from the EUT are recorded (ie:
margin>20dB from the applicable limit) and considered that's already beyond the background noise floor.
6.Margin (dB) = Remark result (dBuV/m) – Average limit (dBuV/m).
Freq. Ant. Pol Peak AV Ant. / CL Peak AV AV
(MHz) H/V Reading Reading CF Actual Fs
Limit Limit Margin (dBuV) (dBuV) (dB) Peak AV (dBuV/m) (dBuV/m) (dB) (dBuV/m) (dBuV/m)
4824.0 H 30.84 10.23 24.02 54.86 34.25 74.00 54.00 -19.75 N/A H
4824.0 V 31.06 11.42 24.68 55.74 36.10 74.00 54.00 -17.90
N/A V

FCC ID: BPO-DAGE-DA988 Report No.: MTE/CLY/D12101594
Page 63 of 70
Operation Mode: TX/ IEEE 802.11n(20MHz)/CH Mid Test Date: Oct. 30, 2012
Temperature: 20oC Tested by: Habby Guo
Humidity: 70 % RH Polarity: Ver. / Hor.
Notes: 1. Measuring frequencies from 1 GHz to the 10th harmonic of highest fundamental frequency.
2. Radiated emissions measured in frequency above 1000MHz were made with an instrument using
peak/average detector mode.
3. Average test would be performed if the peak result were greater than the average limit or as required by the
applicant.
4. Data of measurement within this frequency range shown “ --- ” in the table above means the reading of
emissions are attenuated more than 20dB below the permissible limits or the field strength is too small to be
measured.
5. Measurements above show only up to 6 maximum emissions noted, or would be lesser, with “ N/A ” remark,
if no specific emissions from the EUT are recorded (ie:
margin>20dB from the applicable limit) and considered that's already beyond the background noise floor.
6 Margin (dB) = Remark result (dBuV/m) – Average limit (dBuV/m).
Freq. Ant. Pol Peak AV Ant. / CL Peak AV AV
(MHz) H/V Reading Reading CF Actual Fs
Limit Limit Margin (dBuV) (dBuV) (dB) Peak AV (dBuV/m) (dBuV/m) (dB) (dBuV/m) (dBuV/m)
4884.0 H 31.59 11.09 24.02 55.61 35.11 74.00 54.00 -18.89 N/A H
4884.0 V 30.52 10.42 24.68 55.20 35.10 74.00 54.00 -18.90
N/A V

FCC ID: BPO-DAGE-DA988 Report No.: MTE/CLY/D12101594
Page 64 of 70
Operation Mode: TX/ IEEE 802.11n(20MHz)/CH High Test Date: Oct. 30, 2012
Temperature: 20oC Tested by: Habby Guo
Humidity: 70 % RH Polarity: Ver. / Hor.
Notes: 1. Measuring frequencies from 1 GHz to the 10th harmonic of highest fundamental frequency.
2. Radiated emissions measured in frequency above 1000MHz were made with an instrument using
peak/average detector mode.
3. Average test would be performed if the peak result were greater than the average limit or as required by the
applicant.
4. Data of measurement within this frequency range shown “ --- ” in the table above means the reading of
emissions are attenuated more than 20dB below the permissible limits or the field strength is too small to be
measured.
5. Measurements above show only up to 6 maximum emissions noted, or would be lesser, with “ N/A ” remark,
if no specific emissions from the EUT are recorded (ie:
margin>20dB from the applicable limit) and considered that's already beyond the background noise floor.
6.Margin (dB) = Remark result (dBuV/m) – Average limit (dBuV/m).
Freq. Ant. Pol Peak AV Ant. / CL Peak AV AV
(MHz) H/V Reading Reading CF Actual Fs
Limit Limit Margin (dBuV) (dBuV) (dB) Peak AV (dBuV/m) (dBuV/m) (dB) (dBuV/m) (dBuV/m)
4924.0 H 30.70 11.23 24.02 54.72 35.25 74.00 54.00 -18.75 N/A H
4924.0 V 29.41 10.20 24.68 54.09 34.88 74.00 54.00 -19.12
N/A V

FCC ID: BPO-DAGE-DA988 Report No.: MTE/CLY/D12101594
Page 65 of 70
Operation Mode: TX/ IEEE 802.11n(40MHz)/CH Low Test Date: Oct. 30, 2012
Temperature: 20oC Tested by: Habby Guo
Humidity: 70 % RH Polarity: Ver. / Hor.
Notes: 1. Measuring frequencies from 1 GHz to the 10th harmonic of highest fundamental frequency.
2. Radiated emissions measured in frequency above 1000MHz were made with an instrument using
peak/average detector mode.
3. Average test would be performed if the peak result were greater than the average limit or as required by the
applicant.
4. Data of measurement within this frequency range shown “ --- ” in the table above means the reading of
emissions are attenuated more than 20dB below the permissible limits or the field strength is too small to be
measured.
5. Measurements above show only up to 6 maximum emissions noted, or would be lesser, with “ N/A ” remark,
if no specific emissions from the EUT are recorded (ie:
margin>20dB from the applicable limit) and considered that's already beyond the background noise floor.
6.Margin (dB) = Remark result (dBuV/m) – Average limit (dBuV/m).
Freq. Ant. Pol Peak AV Ant. / CL Peak AV AV
(MHz) H/V Reading Reading CF Actual Fs
Limit Limit Margin (dBuV) (dBuV) (dB) Peak AV (dBuV/m) (dBuV/m) (dB) (dBuV/m) (dBuV/m)
4844.0 H 33.59 12.51 23.98 57.57 36.49 74.00 54.00 -17.51 N/A H
4844.0 V 32.53 12.21 24.05 56.58 36.26 74.00 54.00 -17.74
N/A V

FCC ID: BPO-DAGE-DA988 Report No.: MTE/CLY/D12101594
Page 66 of 70
Operation Mode: TX/ IEEE 802.11n(40MHz)/CH Mid Test Date: Oct. 30, 2012
Temperature: 20oC Tested by: Habby Guo
Humidity: 70 % RH Polarity: Ver. / Hor.
Notes: 1. Measuring frequencies from 1 GHz to the 10th harmonic of highest fundamental frequency.
2. Radiated emissions measured in frequency above 1000MHz were made with an instrument using
peak/average detector mode.
3. Average test would be performed if the peak result were greater than the average limit or as required by the
applicant.
4. Data of measurement within this frequency range shown “ --- ” in the table above means the reading of
emissions are attenuated more than 20dB below the permissible limits or the field strength is too small to be
measured.
5. Measurements above show only up to 6 maximum emissions noted, or would be lesser, with “ N/A ” remark,
if no specific emissions from the EUT are recorded (ie:
margin>20dB from the applicable limit) and considered that's already beyond the background noise floor.
7 Margin (dB) = Remark result (dBuV/m) – Average limit (dBuV/m).
Freq. Ant. Pol Peak AV Ant. / CL Peak AV AV
(MHz) H/V Reading Reading CF Actual Fs
Limit Limit Margin (dBuV) (dBuV) (dB) Peak AV (dBuV/m) (dBuV/m) (dB) (dBuV/m) (dBuV/m)
4884.0 H 34.25 11.65 23.98 45.90 35.63 74.00 54.00 -18.37 N/A H
4884.0 V 33.69 11.02 24.05 44.71 35.07 74.00 54.00 -18.93
N/A V

FCC ID: BPO-DAGE-DA988 Report No.: MTE/CLY/D12101594
Page 67 of 70
Operation Mode: TX/ IEEE 802.11n(40MHz)/CH High Test Date: Oct. 30, 2012
Temperature: 20oC Tested by: Habby Guo
Humidity: 70 % RH Polarity: Ver. / Hor.
Notes: 1. Measuring frequencies from 1 GHz to the 10th harmonic of highest fundamental frequency.
2. Radiated emissions measured in frequency above 1000MHz were made with an instrument using
peak/average detector mode.
3. Average test would be performed if the peak result were greater than the average limit or as required by the
applicant.
4. Data of measurement within this frequency range shown “ --- ” in the table above means the reading of
emissions are attenuated more than 20dB below the permissible limits or the field strength is too small to be
measured.
5. Measurements above show only up to 6 maximum emissions noted, or would be lesser, with “ N/A ” remark,
if no specific emissions from the EUT are recorded (ie:
margin>20dB from the applicable limit) and considered that's already beyond the background noise floor.
6.Margin (dB) = Remark result (dBuV/m) – Average limit (dBuV/m).
Freq. Ant. Pol Peak AV Ant. / CL Peak AV AV
(MHz) H/V Reading Reading CF Actual Fs
Limit Limit Margin (dBuV) (dBuV) (dB) Peak AV (dBuV/m) (dBuV/m) (dB) (dBuV/m) (dBuV/m)
4904.0 H 32.78 12.05 23.98 56.76 36.13 74.00 54.00 -17.87 N/A H
4904.0 V 32.19 11.59 24.05 56.24 35.64 74.00 54.00 -18.36
N/A V

FCC ID: BPO-DAGE-DA988 Report No.: MTE/CLY/D12101594
Page 68 of 70
APPENDIX 1
PHOTOGRAPHS OF TEST SETUP

FCC ID: BPO-DAGE-DA988 Report No.: MTE/CLY/D12101594
Page 69 of 70
CONDUCTED SPURIOUS EMISSION TEST SETUP
CE TEST SETUP

FCC ID: BPO-DAGE-DA988 Report No.: MTE/CLY/D12101594
Page 70 of 70
RE TEST SETUP
------END OF REPORT------