A comparative test method to determine thermal resistance ...

5/20/2015-1
Test Planning Foundations

5/20/2015-2
Steps in Designing an Experiment
1. Define the objective of the experiment
2. Select appropriate response variables
3. Choose factors, levels
4. Choose experimental design
5. Perform the test
6. Statistically analyze the data
7. Draw conclusions
Steps are strategically linked into a defensible process!

5/20/2015-3
Planning Essential Elements
• Determine test objective(s)– Consider test phases, reporting requirements
• Determine response variables – The response variable measures the outcome of interest for the
test (a.k.a. measures, dependent variables).– Requirements often inform response variable selection
• Determine the factors and levels– Factors are all potential independent variables that may impact
the outcome of the test (i.e., response variables)– Brainstorm ALL the potential factors that could affect test
outcomes – then decide what to control during test
• Operational and engineering expertise are essential for ensuring the right responses and factors are identified
• A fancy statistical design cannot redeem the quality of a test if we miss an important factor in the planning process!

5/20/2015-4
Common Test Objectives
• Screen for important factors driving performance
• Characterize performance across an operational envelope– Note this also implies data will be adequate to determine
whether a system meets requirements across a variety of operational conditions
• Optimize system performance with respect to a set of conditions
• Compare two systems (or more) across a variety of operating conditions
• Identify problems that degrade system performance
New 5000.02: the test program should produce “data to characterize combat mission capability across an appropriately
selected set of factors and conditions”

5/20/2015-5
Objectives: Screening
• Screening experiments seek to identify the key factors from all possible factors
• Test design approach– Identify all potential factors that are thought to effect the response
variable– Choose an initial experimental design that uses minimal test
resources» Typically focusing on main effects and limited interactions
– Identify the factors that have the largest impact on the response– Update next test design to characterize the response (performance)
as a function of only the important factors
• Screening is essential to integrated testing– Allows for narrowing of factor space prior to operational testing
• Operationally realistic developmental tests, operational assessments, and limited user tests can be used to screen for important factors
5/20/2015-6
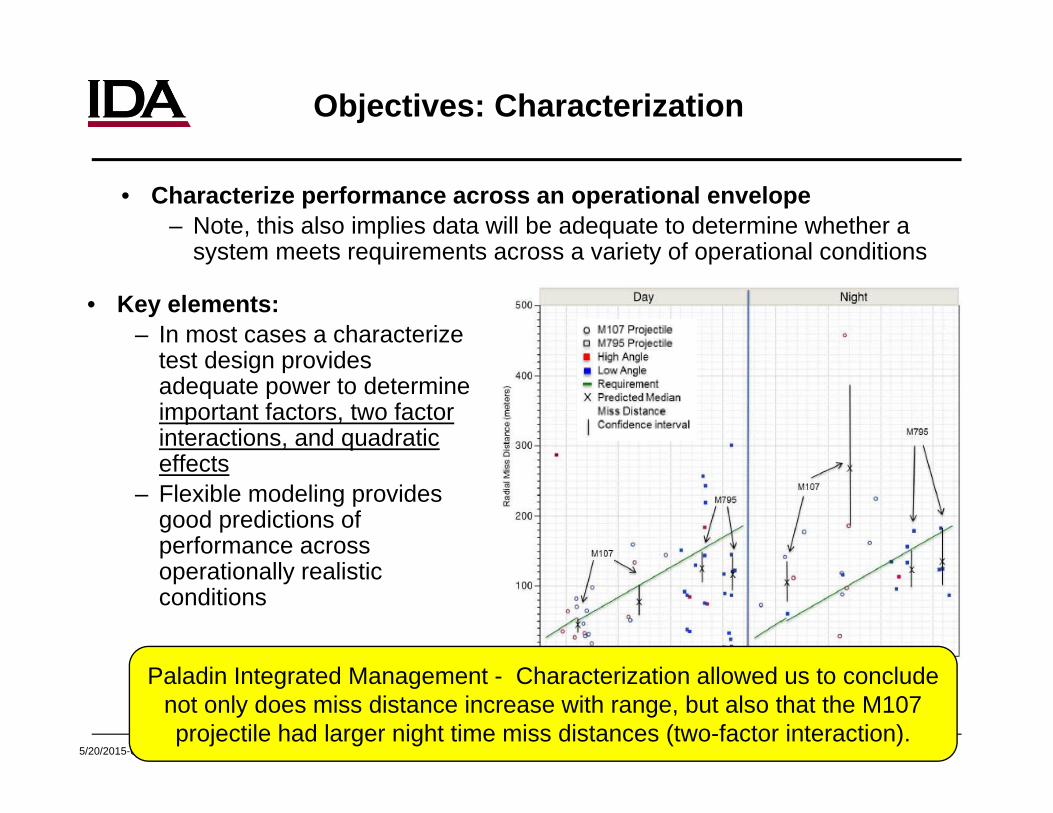
Objectives: Characterization
• Characterize performance across an operational envelope– Note, this also implies data will be adequate to determine whether a
system meets requirements across a variety of operational conditions
• Key elements:– In most cases a characterize
test design provides adequate power to determine important factors, two factor interactions, and quadratic effects
– Flexible modeling provides good predictions of performance across operationally realistic conditions
Paladin Integrated Management - Characterization allowed us to conclude not only does miss distance increase with range, but also that the M107 projectile had larger night time miss distances (two-factor interaction).

5/20/2015-7
Test Objectives and Analysis Approach
• The objective (e.g., screen/characterize) of the testing drives the complexity required in the analysis
– All experimental designs are constructed to allow for statistical modeling
• Common Terminology:– Main Effect: the change in the response produced by changing the level of
a factor– Interaction effect: occurs when the change in the response between the
levels of one factor is not the same at all levels of the other factors (e.g., factors work in a synergistic fashion)
– First order model: a model form that allows for the estimation of main effects only
– Second order model: a model form that allows for the estimation of main effects, two-way interaction effects, and quadratic effects
Main Effect Quadratic Effect Two-way interaction

5/20/2015-8
Importance of Two-Factor Interactions
• Air to Ground Missile Test
• Response variable: miss distance
• Factors: – Range to target– Altitude– Airspeed– Variant (new
versus legacy)
• Two-factor interaction model shows at low airspeed performance is robust to target range!
Interaction model allows for different performance under different conditions –Result is better predictions across the operational envelope

5/20/2015-9
Importance of Two-Factor Interactions
• Air to Ground Missile Test
• Response variable: miss distance
• Factors: – Range to target– Altitude– Airspeed– Variant (new
versus legacy)
• Main effect only model misses information, but still correctly identifies range as a significant factor
Main effect only models are appropriate for determining the most important factors, but do not do as well with prediction!

5/20/2015-10
Importance of Quadratic Effects
Quadratic effects add more flexibility to the model – improving predictions and providing information on rate of change across continuous factors.

5/20/2015-11
Example Characterization:AH-64E FOT&E I
• DOE executed close to plan
Battlefield Density Low High
Light Day Night Day Night
L16 Targeting Data
no 3 1 2 2
yes 6 2 3 3
• Statistical Result– L16 targeting data, battlefield density were
statistically significant; light was not.– Two factor interaction between BF density
and L16 targeting data was significant
• Bottom Line Result– L16 has a bigger effect on low density
battlefields– It is easy to find a target on a high density
battlefield
• Graph shows interaction between factors
80% confidence intervals shown
Cells indicate missions executed per condition

5/20/2015-12
Response Variables
• Response variables measure the outcome of a test– Selection of response variables is influenced, but not limited to, the
requirements
• Multiple responses are common and almost always necessary– Operational effectiveness and suitability are complex constructs
that require multiple responses
• Useful resources for selecting response variables:– Requirements documents, concept of employment documents,
system engineers, all stakeholders– AO operational and testing experience
• Key Performance Parameters may not always be useful response variables
– Example: Army’s Stryker combat vehicle KPPs were only that it seat 9 men, be transportable in a C-130, and have a specific communications platform inside

5/20/2015-13
Good Operational Response Variables
• Provide determination of mission capability and/or a meaningful measure of system performance
• Lend well to defensible experimental design– Measurable: they can be measured at a reasonable cost and without
affecting the test outcome.– Valid: they directly address the test objective.– Informative: continuous responses provide more information per test
point than pass/fail metrics (e.g., detection range versus detect/non-detect).
• Encapsulate reasons for procuring the system
• Provide adequate data to evaluate capabilities development document (CDD ) requirements (even if the response selected is not explicitly defined in the CDD)
• Surveys can provide measurable, informative response variables.
A common trap: data convenient to collect might not be informative!
5/20/2015-14
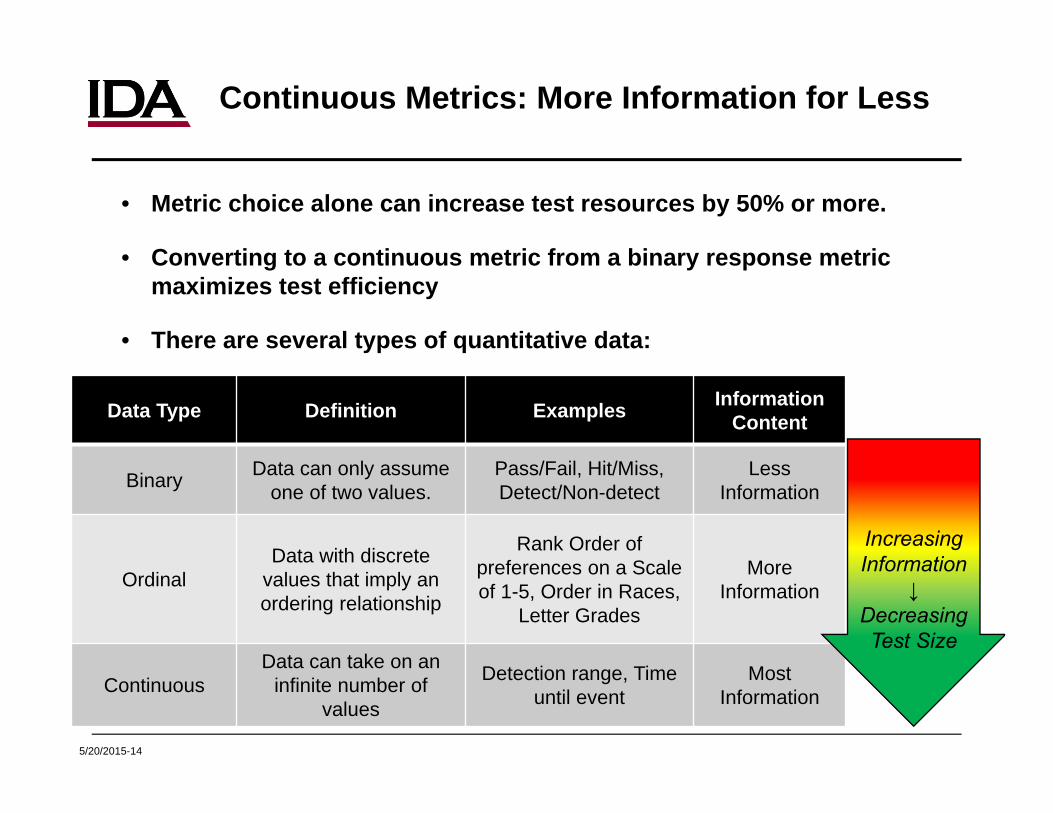
Continuous Metrics: More Information for Less
• Metric choice alone can increase test resources by 50% or more.
• Converting to a continuous metric from a binary response metric maximizes test efficiency
• There are several types of quantitative data:
Data Type Definition Examples Information Content
Binary Data can only assume one of two values.
Pass/Fail, Hit/Miss, Detect/Non-detect
LessInformation
OrdinalData with discrete
values that imply an ordering relationship
Rank Order ofpreferences on a Scaleof 1-5, Order in Races,
Letter Grades
More Information
ContinuousData can take on an
infinite number of values
Detection range, Time until event
Most Information
Increasing Information
↓ Decreasing Test Size

5/20/2015-15
Examples: Response Variables
• Missiles, bombs, bullets– Radial miss distance (preferred to hit/miss)
• Cargo aircraft– Airdrop: miss distance from target – Landing: unload time, turn around time
• Command and control systems– Operator rating of usability– Accuracy and timeliness of operating picture
• Tracking system– Track accuracy, track timeliness
• Detection systems– Detection time, detection range
• Business Systems– Data transmission accuracy– Data storing, maintaining, or retrieval accuracy– Timeliness

5/20/2015-16
Continuous Metrics:An efficient and informative test solution
• Chemical Agent Detector– Requirement: Probability of detection greater than 85% within
1 minute– Original response metric: Detect/Non-detect– Replacement: Time until detection
• Submarine Mine Detection– Requirement: Probability of detection greater than 80%
outside 200 meters– Original response metric: Detect/Non-detect– Replacement: Detection range
• Weapon System– Requirement: Probability of hit at least 90%– Original response metric: Hit/Miss– Replacement: Missile miss distance
Continuous surrogate metrics provide additional information.
5/20/2015-17
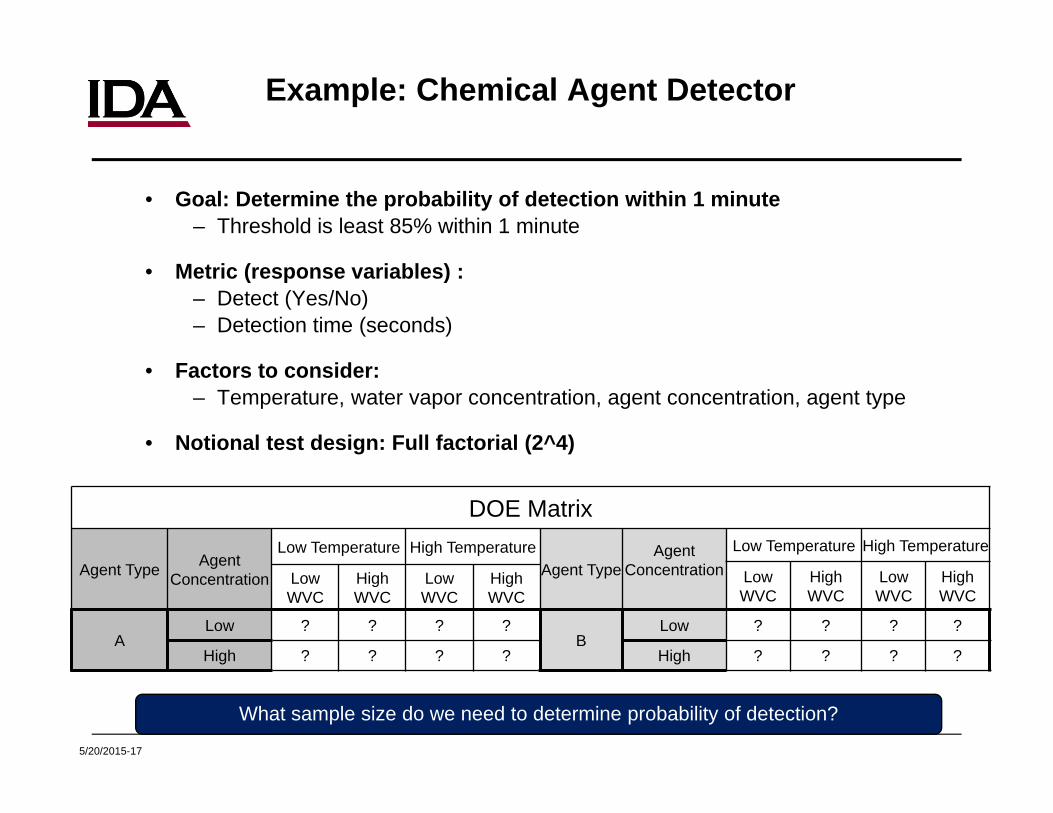
Example: Chemical Agent Detector
• Goal: Determine the probability of detection within 1 minute– Threshold is least 85% within 1 minute
• Metric (response variables) :– Detect (Yes/No)– Detection time (seconds)
• Factors to consider:– Temperature, water vapor concentration, agent concentration, agent type
• Notional test design: Full factorial (2^4)
DOE Matrix
Agent Type AgentConcentration
Low Temperature High TemperatureAgent Type
AgentConcentration
Low Temperature High Temperature
LowWVC
High WVC
LowWVC
High WVC
LowWVC
High WVC
LowWVC
High WVC
ALow ? ? ? ?
BLow ? ? ? ?
High ? ? ? ? High ? ? ? ?
What sample size do we need to determine probability of detection?

5/20/2015-18
Adequate Test Resources
• Goal: Determine an adequate sample size to determine a 10% change in probability of detection across all factor levels (across the operational envelope)
• Steps– Determine detectable difference for binary response (10%)– Calculate sample size for binary response variable– Determine the appropriate continuous response (detection time)– Determine equivalent effect size of interest using percentiles of appropriate continuous
response distribution (e.g., lognormal)– Calculate sample size for continuous response variable and compare
• Results– Detectable difference = 10%– 90% Confidence Level, 80% Power
» Binomial response (detect/non-detect): 14 replications of full factorial (224 total test points)
» Continuous response (time until detection): 5 replications of full factorial (80 total test points) – 65% reduction in test costs.
This example results in a 65% reduction in test cost.
20%

5/20/2015-19
Analysis Implications: Continuous MetricsChemical Agent Detector
• Estimate the probability of detection at 60 seconds at the mean concentration
• Detection times and detect/non-detect information recorded
• Binary analysis results in 300% increase in confidence interval width
Response Probability of Detection within
60 seconds at mean
Lower 90%Confidence
Bound
Upper 90% Confidence
Bound
ConfidenceInterval Width
Binary(Detect: Yes/No) 83.5% 60.5% 94.4% 33.9%
Continuous ( Time) 91.0% 86.3% 94.5% 8.2%
Non-detect
Detect
Binary responses lose information!
Data is for Illustration only
Mean Concentration

5/20/2015-20
Drawbacks of Continuous Responses
• Accounting for non-detects– Advanced statistical methods provide potential solutions
» Censored data analysis for unobservable non-detects» Mixture distributions
• Can require high fidelity instrumentation during data collection process
– For example, the ability to measure miss distance in operational testing
• Pass/Fail might be a function of multiple (possibly correlated) continuous variables
– Advanced statistical methods provide potential solutions:» Multivariate analyses» Copulas, similar to the financial markets
Cost saving potential is too great to not tackle these challenges.

5/20/2015-21
Surveys and Mission Oriented Response
• Operational effectiveness and suitability have a human factors component
• Surveys are useful tools for measuring aspects of effectiveness and suitability that can only be obtained from operators
• Example: KC-46 Tanker– How do we measure operational effectiveness?
» Was the fuel transfer successful? (Yes/No – binary metric)» Percentage of fuel successfully transferred» Number of breakaways while transferring fuel
– None of these fully capture system effectiveness– Surveys provide information on system usability and effectiveness:
» How challenging was operating the boom on KC-46?» Would you deploy with this system?» Does KC-46 provide a performance improvement over the legacy system?
– Added bonus – Likert scale data may be approximated by interval data if constructed correctly, reducing test costs
Surveys provide essential, objective information for operational assessments.

5/20/2015-22
Factors and Levels
• Factors are independent variables that are expected to affect the outcome of a test.
• Levels are the specific values that the factors assume. Factor levels are often referred to as conditions.
• Characteristics of good factors:– Important: factors are expected to have a large quantifiable effect
on the test outcome.– Controllable: factors can be controlled (i.e. set to a specific level)
at a reasonable cost.– Informative: quantitative factors are preferred to categorical
factors (e.g., if altitude is a factor, the preferable levels are 5,000, 10,000, and 15,000 as opposed to low, medium, and high)
• Brainstorm ALL the potential factors that could affect test outcomes – then decide what to control during test
– Factor management scheme

5/20/2015-23
Benefits of Continuous Factors
• Allow for interpolation
• Better explanation of changes in performance
– Low, medium, high altitude vs. altitude measured in feet
• Higher power– Power calculations are
on model terms as opposed to groups of data
• Strategic point placement

5/20/2015-24
Factor Management Process
• The brainstorming process often results in lots of potential factors
– Factors must be prioritized– Factor managements options:
» Strategically vary» Hold constant» Record (allow to vary but not in a controlled fashion)
• Items to consider when prioritizing factors– Magnitude of impact the factor is expected to have on the test
outcome– Likelihood of factors levels occurring in operations– Ease of control and cost for varying factors in a test
• Previous test data is the best way to screen out factors from operational testing

5/20/2015-25
Example Factor Management Process
• Part of the AFOTEC Initial Test Design Process • Part of COMOPTEVFOR’s Operational Test Director Manual
Likelihood of Encountering Level During Operations
Multiple levels occur at balanced frequencies
(e.g., 1/3, 1/3, 1/3)
Some levels are balanced, others are
infrequent(e.g., 5/10, 4/10, 1/10)
One level dominates(e.g., 4/5, 1/10, 1/10)
Effect of Changing Level on Performance Balanced Mixed Dominant
Significant Effect on Performance High Vary all
Vary balanced levels,Demonstrate infrequent
levels
Fix dominant level, Demonstrate others
Moderate Effect on Performance Medium Vary all Vary balanced levels,
Demonstrate othersFix dominant level,Demonstrate others
Low Effect on Performance Low Fix levels or record level
usedFix levels or record level
used Fix dominant level

5/20/2015-26
Test Adequacy and Factor Management
• Factor management choices directly affect test designs and test adequacy
• It is important that DOT&E AOs agree on the factor management strategy
– For factors held constant: » Limits conclusions about the system to the one condition tested
– For factors that are recorded and not controlled:» No guarantee that all levels of interest will be observed during the
test» Could increase overall variability in the test, which could
negatively affect primary objective» Can increase operational realism of the test if done well
• Common myth – adding factors causes the test size to grow exponentially
– Modern experimental designs can investigate a large number of factors efficiently
– When in doubt, error on the side of strategically varying factors

5/20/2015-27
Factors versus Test Size
• Adding or removing factors does not necessary change required test size
• A 6-factor test (2 levels each) has high power for main effects with 32 runs
– Reducing the number of factors does not reduce the required runs to maintain this power level
• A test with only two factors has marginal power at 16 runs.
– Two additional factors can be added without significantly degrading the power
Factors Tests Confidence Power
1 std dev 2 std dev
2
5 0.95 0.07 0.138 0.95 0.21 0.62
16 0.95 0.46 0.9632 0.95 0.78 0.99
38 0.95 0.09 0.18
16 0.95 0.43 0.9432 0.95 0.78 0.99
49 0.95 0.09 0.18
16 0.95 0.37 0.8932 0.95 0.77 0.99
616 0.95 0.22 0.5732 0.95 0.72 0.99
Power for Factorial Designs*
*Power calculations are from Design Expert for factorial and fractional factorial designs for main effects in the two-factor interaction model

5/20/2015-28
TEMP and Test Plan Review:Planning
1. Does the overall test strategy support characterization of combat mission capability?
2. Do the response variable(s) :– Provide a measure of mission capability and/or system performance?– Lend well to test design?– Capture the reasons for procuring the system?
3. Are the response variables informative (continuous versus pass/fail)? If a pass/fail metric is being used, is there a better continuous metric?
4. Are all factors clearly identified? – Are the factors selected for inclusion in the test design the right
factors?– Are the factors that will be held constant well documented, including
the level they will be held at? – Are the recordable factors clearly identified?– Are there any missing factors that might affect system performance?

5/20/2015-29
Key Takeaways: Planning
• Identifying objectives, responses, and factors is an essential element of experimental design
– There is no mathematical trick, requires involvement of all stakeholders, subject matter experts, and operational experience
– AO operational experience is essential in the planning process and lays the framework for the design
• Objectives, responses, and factors should be clearly identified
• Continuous responses (measures) are essential for cost efficient testing
• Identify all factors, then streamline and document the process for maximum defensibility

5/20/2015-30
Backup Slides

5/20/2015-31
Brainstorming Tools
• Brainstorm all factors to start, can always down-select later
• Document the process!
Fishbone Diagram (Cause and Effect)
Mother nature
Method MachineMeasurement
Material Manpower
Response

5/20/2015-32
Tools for Refining the Planning
Process
Under
Test
FactorsResponses
Input-Process-Output (IPO)
Noise/Record
Hold Constant
Factors omitted from DOE are important for assessing test adequacy.

5/20/2015-33
Main Effects versus Two-Way Interactions