TEST ITEM CONSTRUCTION AND VALIDATION: DEVELOPING A ...
189
TEST ITEM CONSTRUCTION AND VALIDATION: DEVELOPING A STATEWIDE ASSESSMENT FOR AGRICULTURAL SCIENCE EDUCATION A Dissertation Presented to the Faculty of the graduate School of Cornell University in Partial Fulfillment of the Requirements for the Degree of Doctor of Philosophy by Jennifer Elaine Rivera January 2007
Transcript of TEST ITEM CONSTRUCTION AND VALIDATION: DEVELOPING A ...

TEST ITEM CONSTRUCTION AND VALIDATION: DEVELOPING A
STATEWIDE ASSESSMENT FOR AGRICULTURAL SCIENCE EDUCATION
A Dissertation
Presented to the Faculty of the graduate School
of Cornell University
in Partial Fulfillment of the Requirements for the Degree of
Doctor of Philosophy
by
Jennifer Elaine Rivera
January 2007

© 2007 Jennifer Elaine Rivera
TEST ITEM CONSTRUCTION AND VALIDATION: DEVELOPING A
STATEWIDE ASSESSMENT FOR AGRICULTURAL SCIENCE EDUCATION
Jennifer Elaine Rivera, Ph.D.
Cornell University 2007
In 2001, the New York State Board of Regents approved the New York
State Regents Career and Technical Education Policy. Through the process
of program approval, career and technical education (CTE) programs can
provide students greater flexibility in attaining graduation credits in the areas of
math, science, English and/or social studies for students completing such
programs. The policy also states that individual career and technical
completers can receive a technical endorsement on their Regents diploma.
Part of the process for CTE program approval is to administer a technical
assessment certifying that students meet current industry standards.
The impetus for this study was addressing the need of one secondary
career and technical education program, agricultural science education, which
does not have a statewide exam. Currently, the Department of Education at
Cornell University in collaboration with New York Agricultural Education
Outreach is in the process of developing a statewide exam for use as the
technical assessment to certify students. Once approved, this exam will meet
the technical assessment requirement for program approval. This study
focuses on the written multiple-choice portion of the statewide exam,
specifically two aspects of developing an exam, item construction and item
validation. Based on criterion-referenced test construction procedures two of
the nine sections of the exam were developed, animal systems and plant
systems.

The results of this study outline a process for developing and validating
items. They highlight some of the benefits and disadvantages faced when
developing test items for a diverse audience without the aid of a testing
institute. Further consideration is given to procedures used to validate test
items, specifically expert judgment and analytical data. The results from this
study provide guidance to test developers related to aligning items to content,
writing and editing items, and revising items.

iii
BIOGRAPHICAL SKETCH
Jennifer “Jeno” Elaine Rivera is an assistant professor at Michigan
State University in the Department of Community, Agriculture, Recreation, and
Resource Studies. She graduated from the Department of Education at
Cornell University with a degree in Learning, Teaching, and Social Policy in
January 2007. While at Cornell her research focus was on standardized
testing for agricultural science education programs at the secondary level. Her
teaching and advising focus was on teacher preparation for agricultural
science and science pre-service educators at the secondary level. Before
pursuing a doctorate, Jennifer was a high school agricultural science educator
at a small rural school in Page County, Virginia. Her summer months were
spent working with the Virginia Governor’s School for Agriculture at Virginia
Tech. Jennifer holds a Master of Science degree in Career and Technical
Education and a Bachelor of Science degree in Crop and Soil Science with a
concentration in international agriculture, both from Virginia Tech.

iv
I wish to thank my parents, Ozzie and Lillie Rivera.
They bore me, raised me, supported me, taught me, and loved me. To them I
dedicate this dissertation.

v
ACKNOWLEDGEMENTS
It is a pleasure to thank the many people who helped made this dissertation
possible. I would like to express my gratitude to my Ph.D. supervisor, Dr.
William G. Camp. He has served as a mentor, role model, and friend for many
years. His support, encouragement, and sound advice led me through two
degrees and great teaching experiences. Without his guidance I would not be
where I am today.
I wish to thank my committee members and colleagues Dr. John Sipple and
Dr. Thomas Di Ciccio for stimulating discussions that have helped to broaden
my knowledge and understanding of education. I am especially grateful for
their friendship and intellectual advice.
I would like to give my special thanks to my editor and best friend Jeb whose
patient love enabled me to complete this work.
Lastly and most importantly I wish to thank my family, especially my sister,
Jayka without whom none of this would have been even possible.

vi
TABLE OF CONTENTS
Chapter 1 Introduction Page 1
Chapter 2 Review and Synthesis of the
Literature
Page 18
Chapter 3 Research Methods Page 96
Chapter 4 Results Page 103
Chapter 5 Summary and Discussions Page 129
Appendices Page 143
References Page 158

vii
LIST OF FIGURES
Figure 1.1 Agriculture, Food, and Natural Resource
Cluster
Page 7
Figure 2.1 Norm-referenced distribution curve vs.
criterion-referenced distribution curve
Page 55
Figure 2.2 Ideal NRT frequency distribution Page 56
Figure 2.3 Designing criterion-referenced certification
tests
Page 61
Figure 2.4 Item characteristic curve with three different
levels of difficulty and the same discrimination
Page 90
Figure 2.5 Three-item characteristic curve with the same
difficulty but with different levels of
discrimination
Page 91
Figure 4.1 Frequency distribution of test scores on
animal science pilot
Page 109
Figure 4.2 Frequency distribution of test scores on plant
science pilot
Page 120

viii
LIST OF TABLES
Table 2.1 Mapping a sentence for measuring a skill Page 64
Table 2.2 Steps for preparing criterion-referenced tests Page 66
Table 4.1 Animal Systems- item difficult and
discrimination
Page 110
Table 4.2 Animal systems – frequency of alternatives Page 118
Table 4.3 Plant Systems- item difficulty and
discrimination
Page 121
Table 4.4 Plant systems – frequency of alternatives Page 127

ix
LIST OF EQUATIONS
Equation 2.1 KR-20 formula Page 82
Equation 2.2 KR-21 fomula Page 83
Equation 2.3 Cronbach’s alpha formula Page 84
Equation 2.4 Cronbach’s alpha formula Page 84
Equation 2.5 Hoyt’s coefficient formula Page 85
Equation 2.6 IRT 2-parameter model Page 88
Equation 2.7 IRT 3-parameter model Page 89
Equation 2.8 Formula for true score Page 93
Equation 2.9 Multiple-choice model Page 94
1
CHAPTER 1
INTRODUCTION
Currently in the United States, the educational landscape is undergoing
a decades old reform movement led predominately by proponents of content
standards and high stakes testing. With the reauthorization of the Elementary
and Secondary School Act (ESEA) now known as No Child Left Behind
(NCLB), educational accountability is being measured more and more by
proficiency on standardized state tests. Increasingly within the past decade,
the standards that drive curriculum and test development are typically
generated at a national level and focus on core academic areas. For example,
the National Councils of Teachers of Mathematics (NCTM) developed the
math standards for K-12. Under NCLB, states are required to meet testing
standards or make demonstrable Annual Yearly Progress toward meeting
those standards. Data gathered from standardized testing provides
accountability measures for student, school, district, and state performance,
which are being used to measure Annual Yearly Progress.
Educational Accountability
National Level
In 1991, America 2000: An Educational Strategy proposed an
educational reform strategy based on national goals (Bush, 1991). Goal 3
states that, “The academic performance of all students at the elementary and
secondary levels will increase significantly in every quartile, and the
distribution of minority students in each quartile will more closely reflect the
student population as a whole” (U.S. Department of Education, 1991; p. 3).
Since that time, the push for standardized educational accountability has
produced a narrowing of curriculum with the stated aim of closing the

2
achievement gap existing between the bottom and top quartiles of students
(Dillon, 2006). Based on performance rankings from the National Assessment
of Educational Progress, the gap is widening and there is lack of progress
closing the white/minority, high/low socioeconomic status achievement gap
(US Department of Education, n.d. a). With an emphasis on core academic
performance standards, Career and Technical Education (CTE) programs
have taken on a lesser significance, often times being phased out entirely. In
attempts to remain relevant, CTE programs have been undergoing a
“metamorphosis”-- from superficial changes such as renaming “Vocational
Education” to “Career and Technical Education” to more fundamental changes
that attempt to synthesize CTE programs with core academics (Castellano,
Stringfield, & Stone, 2003).
The reconstruction of CTE programs leads to a question of
accountability. Currently, national tests are not available for all CTE programs.
A premier not-for-profit organization, National Occupational Competency
Institute (NOCTI), offers student “job ready” examinations in a large number of
occupational areas measuring student achievement in CTE (National
Occupational Competency Testing Institute, 2005). Board certification
examinations based on industry standards, such as those offered in
cosmetology and plumbing, have been another alternative to measure student
performance. As educators in CTE programs address integration and
accountability they face a number of challenges. One of those is diversity
across state lines and localities. Another challenge is the misalignment
between hands-on performance-based learning and standardized testing.
As the nationwide academic proficiency deadline of 2014-- imposed by
NCLB-- fast approaches, states are turning to a system of high-stakes student

3
testing to hold their academic programs accountable. Examples of the
predominant educational “high-stakes” based on student performance are
grade retention and promotion, funding provided to schools and districts, and
school closure until schools measure up to their annual yearly progress, as
required under NCLB. To meet the challenges that these stakes place on
students and schools, remediation is being offered to students providing them
further instruction in the academic areas. This increases the urgency that CTE
programs are facing to remain a part of the nationwide curriculum.
New York State
New York State (NYS) was a forerunner in competency assessment
testing by way of Regents examinations that began in 1865. The state used
these exams to “provide a basis for the distribution of State funds allocated by
statute to encourage academic education” (State Education Department, 1987,
¶ 3). Initially, Regents exam requirements focused on core academic curricula,
but in 1927 vocational education was added. In 1970, changes in high school
curriculum contributed to the discontinuation of a number of Regents
requirements, including agricultural education. In May 2000, following the
national accountability movement, the Board of Regents in New York State
implemented a System of Accountability for Student Success (SASS). This
system puts mandates on the requirements for a high school diploma- with a
concentrated focus on the five core academics of English (four years),
mathematics (three years), global history and geography (two years), U.S.
history and government (one year), and science (three years). Based on high
academic learning standards Regents testing continues to drive accountability
in the NYS educational system.

4
In 2001, the New York State Education Department (NYSED) crafted
the Career and Technical Education Policy Initiative allowing a student’s
career and technical coursework to apply towards his or her core academic
requirements by way of a state endorsement and/or career and technical
endorsement. The thinking behind this initiative was to “preserve the rigor and
integrity of academic and technical education without duplication of course
work” (MAGI Education Services, 2004, p. i). The objective of this alternative
pathway to graduation is to:
• Help every youth receive an academic education that
prepares him/her for future education and career success,
• Offer a smooth transition into a postsecondary program
leading to a technical certificate, associates or
baccalaureate degree, apprenticeship, or a job, and
• Connect to workforce investments systems to strengthen
regional workforce quality and economic competitiveness.
(MAGI Educational Services, 2004, p. 2)
Aside from granting career and technical endorsement to students
diplomas, the Career and Technical Education Policy also allows CTE
programs to be accredited in the areas of science, mathematics, English,
and/or social studies. Part of the requirements for both endorsement and
accreditation is the administration of a technical assessment to measure
student performance. Technical assessments can be based on nationally
accepted tests or industry standards appropriate to the occupations
served by the respective CTE program, such as the occupational
competency exams offered by National Occupational Competency
Testing Institute (NOCTI). If no nationally accepted technical assessment

5
exists, a technical assessment system can be developed by local
programs or a consortium of programs.
Background
Situation in NYS
In 2003 the Central New York (CNY) Agricultural Education Consortium
and Cornell University Agricultural Education Outreach (AEO) program
assumed the task of developing a technical assessment for the Natural and
Agricultural Science Core Curriculum in accordance with the NYSED
requirements for accreditation. However, the instrument developed was not
based on research and consequently could not be considered a valid measure
of student achievement. At that point AEO staff members, in conjunction with
members of the Cornell University Department of Education took the lead to
develop an assessment model consisting of standards and competency
measures that would meet the Career and Technical Education Program
Approval Guidelines. The main objective of this model is to advance
secondary agricultural education to a more rigorous, scientific-oriented
curriculum supporting the NYS Career Development Occupational Standards
(CDOS). This would ultimately allow students to use this course and exam as
one of the three required science credits for high school graduation. To
develop a successful model two objectives must be accomplished- 1) develop
and propose a core curriculum framework for agricultural science education
appropriate for New York State, and 2) develop a valid and reliable technical
assessment system based on the core curriculum framework for program
accreditation.

6
Career Clusters Model
The first objective was completed in 2005 with the completion of a core
curriculum framework based on the US Department of Education’s Career
Clusters Model. The goal of the Career Clusters model is to- 1) prepare all
students for college and careers, 2) connect employees with education, and 3)
deliver multiple educational benefits to high schools, educators, guidance
counselors, employers and industry groups, parents, and students. (Office of
Vocational and Adult Education [OVAE], 2006). The Career Clusters Model is
comprised of sixteen occupational clusters preparing pathways for secondary
students to transition into 2-year or 4-year post secondary programs or the
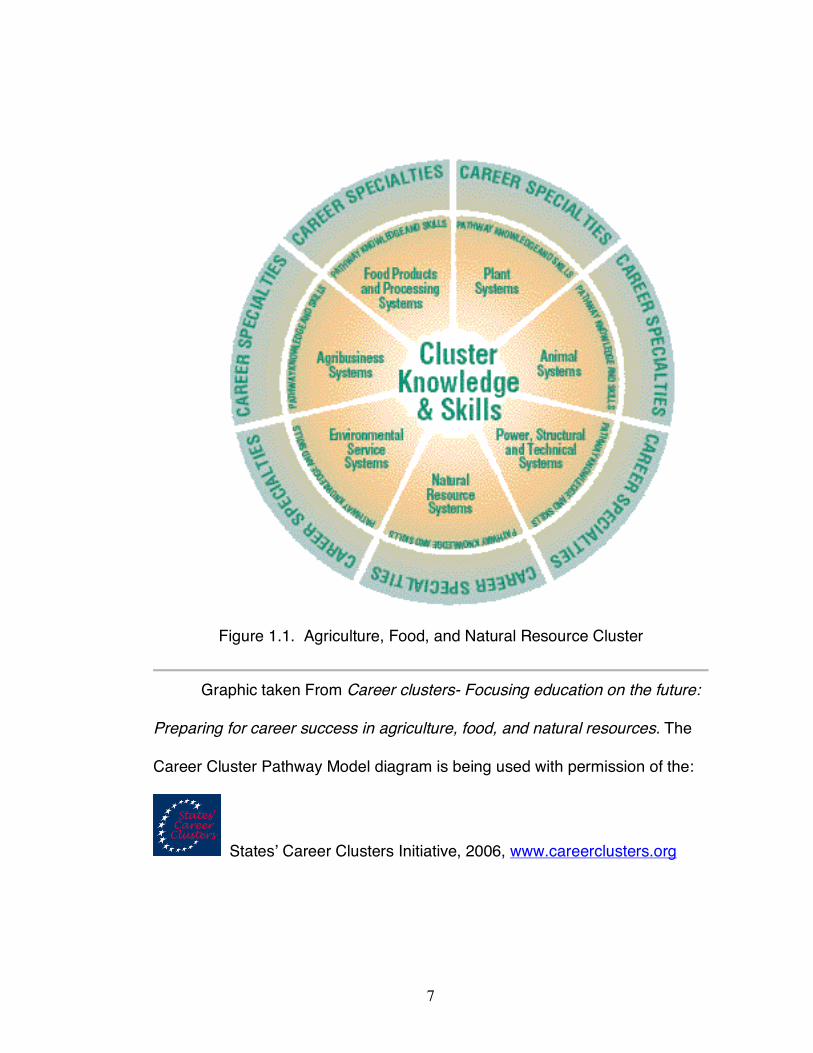
workplace. The Agriculture, Food, and Natural Resource (ANR) cluster was
used as the foundation to develop the NYS core curriculum framework as it
represents the diversity of NYS agricultural education. The ANR cluster
consists of seven pathways: (1) agribusiness systems, (2) animal systems, (3)
environmental service systems, (4) food products and processing systems, (5)
natural resource systems, (6) plant systems, and (7) power, structure, and
technical systems, see Figure 1.1.
A validation team examined the ANR model for use in New York State
and concluded it would be appropriate, with the addition of two content areas:
Agricultural Education Foundations and Safety in Agriculture Education. Thus,
the NYS core content framework for agricultural science education would
consist of nine content areas, seven coming directly from the ANR Pathways
model and two added specifically for this state. With the completion of the
NYS Core Curriculum framework for New York State in 2005, the task of
developing a valid and reliable technical assessment system for program
accreditation is currently being addressed.
7
Figure 1.1. Agriculture, Food, and Natural Resource Cluster
Graphic taken From Career clusters- Focusing education on the future:
Preparing for career success in agriculture, food, and natural resources. The
Career Cluster Pathway Model diagram is being used with permission of the:
States’ Career Clusters Initiative, 2006, www.careerclusters.org

8
Theoretical Framework
Theories of Assessment
Norm-referenced testing (NRT) and Criterion-referenced testing (CRT)
represent two of the main assessment models used historically in education.
CRT offers advantages over NRT. CRT provides more meaningful data and a
more accurate interpretation of performance. It assesses competency on
certification exams, evaluates programs, and monitors an individual’s progress
or deficiency in objective-based instruction (Hambleton, Swaminathan, Algina,
& Coulson, 1978).
During the 1960s, Glaser (1963) and Popham and Husek (1969)
introduced the field of criterion-reference measurement, later also referred to as
objective-based or domain-based measurement. Glaser (1963) was among the
first to discuss the use of CRT in systematic instruction. Popham (1993)
highlighted the work of Glaser and provided a set of guidelines to follow when
constructing criterion-referenced measurements. Similar to Popham, Roid and
Haladyna (1982) described a five-step process as ideal for developing CRT.
More recently, Shock and Coscarelli (1998, 2000) developed a 13-step
systematic model to follow.
Since the 1960s, CRT has been interpreted many ways. Linn (1984)
highlighted the links of CRT to behaviorist learning theory to include the
cognitive measure of higher-order thinking skills. Hambleton (1984) viewed
CRT as a form of authentic measurement and performance assessment based
on standards. Millman and Greene (1989) linked the term criterion to domain,
specifying each test item of a certain behavior to a specific domain.

9
Criterion-referenced item construction.
A number of procedural methods and methods based on substantive
theories have been offered by measurement specialists and used to develop
criterion-referenced items. During the early 1960s, the Instructional Objective
Exchange (IOX) specialized in using an objectives-based approach to develop
criterion-referenced measurements. Using item forms (Hivey et al., 1968),
IOX was able to develop amplified objectives. The amplified objectives were
not widely utilized so IOX found success by delimiting the amplified behavioral
objectives and developing test specifications.
Guttman (1959), Guttman & Schlesinger (1967), Castro & Jordan
(1977), and Berk (1978) developed the theory of mapping sentences, similar
to developing item forms, based on the Structural Facet Theory (Guttman,
1959; Foa, 1968). Engle and Martuza (1976) and Berk (1978) developed six
steps in creating an item based on facet design using the instructional
objective as the basis for mapping sentences. Another approach to develop
items is testing concepts, rules, and principles, a technique that can be applied
to almost any discipline (Markle & Tiemann, 1970; Tiemann & Markle, 1983).
The last well-known theory is the factor-based construction method,
generating items through factor-analysis (Guliford, 1967; Meeker, Meeker &
Roid, 1985). There is no concrete “rule book” that instructs the item developer
on how to generate criterion-referenced measurements, though Hambleton
and Rogers (1991) offered the most detailed steps.
Technology for generating multiple-choice test items.
No generally accepted approach to generating multiple-choice (MC)
items with theoretical underpinnings exists (Guttman, 1969); rather, there are
numerous guidelines, rules, and recommendations based on empirical studies

10
(Bormuth, 1970). Roid and Haladyna (1982) addressed the need for item
writing that connected teaching and testing. They provided guidance on
methods that were based on the systematic relationship of instruction and
evaluation. Popham (1990) provided a set of guidelines for creating selected-
response items focused on a practitioner’s perspective. Popham (2003) also
offered item-writing guidelines for MC items developed from the work of
Haladyna (1999) and similar to his previous work.
Item validation.
Writing the test item does not produce an item ready to be tested until it
is validated. Hambleton and Rogers (1991) and Haladyna (2004) provided
features to focus on when reviewing a CRT item’s content. Messick (1989)
emphasized the importance of item reviews, strengthening validity. Hambleton
(1994) provided a summary of methods used to review and validate items.
There have been multiple techniques established for reviewing item-objective
congruence based on large-scale assessments to small classroom
assessments, such as the use of empirical techniques similar to norm-
referenced testing, expert judgment used to calculate the index of item-
objective congruence, a rating of item-objective match on a 5-point scale
conducted by experts, and the use of a matching task (Hambleton, 1984).
Analyzing Item Responses
Classical test theory.
Lord and Novick (1968) introduced classical test theory (CTT)
approaches to the behavioral sciences. They introduced the classical linear
model and its application to estimating parameters such as true score and
error variances of latent trait variables. Common statistics are used to
describe CTT parameters including p-values, item discrimination, point-biserial

11
correlation coefficient, alpha coefficient, and variance. Analysis of these
parameters provides evidence for the validity of criterion-referenced
examinations. CTT statistics can also be used to determine values of reliability
through the use of internal consistency methods such as split halves (Rulon,
1939; Guttman, 1945; Cronbach, 1951) and item co-variance. Other methods
used to circumscribe problems inherent in split half techniques are Kuder
Richardson 20 (KR 20) and Kuder Richardson 21 (KR 21) (Kuder &
Richardson, 1937), along with Cronbach’s alpha (Cronbach, 1951), and Hoyt’s
method (Hoyt, 1941).
Item response theory.
The aim of Item Response Theory (IRT) is to understand and improve
reliability of tests (Wainer, 1989). In measuring latent traits, such as ability,
item characteristic curves can be modeled for each individual item, showing
the item’s difficulty and discrimination. The use of item response theory
principles can be applied to many different types of models to help increase
the reliability of items and tests. Some of the more common models include
the normal-ogive model (Thurstone, 1927; Lawley, 1943; Ferguson,
1942;Moiser, 1940, 1941; Richardson, 1936), the Rasch or one-parameter
logistic model (Rasch, 1960), and Birnbaum’s two- and three-parameter
logistic model (Lord & Novick, 1968). These models have been further
developed to include models such as the rating scale model (Rasch, 1961),
the graded response model (Samejima, 1969), the partial credit model
(Masters, 1988), and multiple-choice models (Thissen & Steinberg, 1984).
The original multiple-choice model was derived by Bock (1972), which
takes the multivariate logistic transformation of the nominal model to analyze
item parameters. This model was further developed by Samejima (1979),

12
which added a latent response category referred to don’t know (DK). Thissen
and Steinberg (1984) extended the model further to include trace lines for the
incorrect alternatives on the item response model.
Problem
NYS agricultural science education programs are based on local needs;
therefore no single approved statewide curriculum exists for agricultural
science. The result of that situation is that local agricultural science education
programs differ widely from one school to another. The seven pathways
outlined in the Agriculture, Food, and Natural Resources portion of the Career
Clusters Pathways model (Career Clusters, 2006) appear to be reasonably
inclusive of the range of content being delivered in NYS agricultural science
education programs with the addition of agricultural foundations and
agricultural safety pathways. Complicating the lack of a statewide curriculum
in agricultural science, no national standards or competency assessment
systems currently exist that would be appropriate for that range of content.
Clearly, developing a valid and reliable technical assessment system is
beyond the resources and ability of most local teachers. Therefore, there is a
need for a useable technical assessment system appropriate for NYS
agricultural science education programs. It should include both performance
and content components. The content component should provide objective
measurements of the core curriculum domains, and should include item banks
reflective of the wide range of content offered in NYS agricultural science
education programs.
Purpose and Objectives
An objective content test requires a bank of test items, but no test item
bank exists to measure student achievement in the content areas based on

13
the domains specific to New York State agricultural science education.
Developing a complete item pool for all nine content areas was well beyond
the scope of this study. Therefore, the purpose of this study was to develop,
validate, and field test separate banks of test items for the Animal Systems
and Plant Systems content areas. The specific objectives of this study were
to:
1. Develop an item construction protocol based on criterion
referenced testing.
2. Organize technical teams of item writers.
3. Write draft items based on core curriculum framework domains.
4. Validate items through expert judgment.
5. Pilot test items.
6. Use classical test theory and item response theory to analyze
items based on statistical measures providing further evidences
of validity and reliability.
Professional Significance of the Study
The National Council for Agricultural Education (The Council) provides
leadership and direction for school-based agricultural education programs.
Due to the lack of national standards in existence, The Council made the
development of core standards a priority within their 2004-2006 Strategic Plan
agenda. They proposed to develop National Curriculum Standards for
Secondary Agricultural Education. These standards would align with the
career clusters pathways (National Council for Agricultural Education, 2004).
Currently, their proposal focuses solely on developing standards, but they
have expressed interest in developing an assessment system based on these
standards.

14
Outside the efforts of The Council, numerous states have expressed the
need for agricultural education reform led by a system of accountability driven
by standards and testing. At the 2005 American Association for Agricultural
Education (AAAE) national conference, the issue of statewide standards and
testing development was addressed. As many are looking to their sister states
for guidance, this proposal provides these states with an item construction
protocol. If these procedures are utilized by multiple states then item banks
can be combined to provide a larger item pool.
Within New York State, this study will provide guidance to AEO as they
assume the task of constructing an item pool for the remaining six content
areas. The use of the proposed assessment based on the Natural and
Agricultural Science Core Curriculum is not mandatory; however, this study
can also assist consortiums or individual programs that chose to develop their
own test items.
Limitations and Delimitations
The goal of NYSED is to have a full assessment system for programs to
use for accreditation or certification. This constitutes developing assessments
systems -- from standards to the test itself. This study delimits and limits the
full assessment system in myriad ways. Delimitations are as follows:
1. Pathway Selection- Due to a lack of time and resources, focus
was placed on two of the nine career content areas to ensure
quality control in item construction. The remaining seven content
areas will be addressed in future studies.
2. Item Construction Procedural Amendment- Due to allocation of
resources received to develop a statewide assessment system,
this study focuses on two aspects of test construction- item

15
development and item validation. It is not an evaluation of a full
test development model containing other characteristics such as
constructing broad goals and test cutoff scores. The
construction of broad goals was conducted in a previous study.
The development of test cutoff scores will be conducted in a
future study.
3. Tripart Integration- According to the NYSED, a technical
assessment must be comprised of three components (1) a
written portion, (2) a student project and (3) a student
demonstration of technical skills. This study focuses solely on
the written portion of the assessment system, concentrating on
item construction and item validation. The remaining two portions
have already been developed through the efforts of AEO
program staff.
Limitations of the study are as follows:
1. Curriculum Specifications- Due to the focus of this study, test
items being developed are based solely on the NYS agricultural
science education core content. This is done to maintain
consistency between standards, curriculum, and assessment
measures.
2. Resource restrictions- Due to a lack of funds, professional item
writers were beyond our budgetary reach. Technical instructions
were provided to item writers -- NYS agriculture teachers and
extension agents. To further validate the item questions they
were edited and reviewed by a team of professionals in the test
taking and educational fields, as this fit into the project’s budget.

16
3. Sample Size Restrictions- Students for the item field test were
not chosen at random, restricting the sample size. In order to
run IRT models, a large population of students is needed to
ensure valid and reliable results. There are enough NYS
agriculture students enrolled in animal and plant systems
programs; however, availability of these students relies on the
school schedules and their teachers’ curriculum calendars. It
was impossible to determine in advance whether the data
gathered from the IRT models would be adequate for IRT
analysis.
Definitions
Agriculture Education Outreach (AEO)- A program to support and advise
local agriculture education programs in public schools so that these programs
may better serve the New York State economy by preparing individuals for
career opportunities in the food and fiber system and related allied fields. For
more information, see http://www.nyag-ed.org/outreach.htm
Annual Yearly Progress (AYP)- The Improving America's Schools Act (IASA)
of 1994 defined adequately yearly progress (AYP) as, "1) continuous and
substantial yearly improvement of each school and local education agency
sufficient to achieve the goal of all children … meeting the state's proficient
and advanced levels of achievement; [and] 2) is sufficiently rigorous to achieve
the goal within an appropriate timeframe (as cited in Elmore & Rothman, 1999,
p. 85)" (Goertz, 2001). NCLB legislation make several critical changes to the
IASA. NCLB legislation requires each state to create its own definition of AYP
within the parameters set by Title I. For more detail, see
http://www.cpre.org/Publications/cep01.pdf
17
Career Clusters- A grouping of occupations and broad industries based on
commonalities. The sixteen career clusters provide an organizing tool for
schools, small learning communities, academies and magnet schools.
Career Pathways- The agriculture, food, and natural resources career cluster
is divided into seven pathways. Pathways are grouped by common
knowledge and skills by occupation in these career fields. Each pathway
provides instruction as a basis for success in an array of career and
educational pursuits. The seven pathways are animal systems, agribusiness
systems, environmental service systems, food products and processing
systems, natural resource systems, plant systems, power, structural, and
technical systems.
Program Accreditation- An approvable CTE program containing a related
and continuous series/combination of courses/experiences in a career and
technical area and academic and technical knowledge and skills in preparation
for further education/training and/or employment in a career. Successful
completion of requirements allows students to fulfill a core course requirement
in English, mathematics, social studies or science after the student passes the
required Regents examination(s) in that core academic subject area.
Technical Endorsement- A technical endorsement on the diploma would
reflect student achievements. This would include: (a) completion of all
graduation requirements and CTE sequence requirements, (b) passing a
technical assessment, and (c) passing the five required Regents examinations
in English, mathematics, science and social studies, or alternatives approved
by the State Assessment Panel.

18
CHAPTER 2
REVIEW AND SYNTHESIS OF THE LITERATURE
Assessment planted roots in education dating back to the 1200s at the
university level and the 1800s at the secondary school level (Aiken, 1994).
Through the decades it has served many purposes, such as measuring
student proficiency, comparing student achievement data, or determining if a
student should be retained or promoted. The face of testing has undergone
many changes over the years. From oral testing, to standardized testing, to
authentic assessment, it has continued to change with educational policy and
practices. Today testing is near ubiquitous in public education; and with
advancements in test design and technology -- coupled with the advent of the
so-called “Age of Accountability” -- testing is a staple of education.
Organization of the Review of Literature
This chapter is divided into three main sections. The first section
focuses on the social and political debates driving assessment. There are
both facts and myths behind the public view on testing. Beliefs, coupled with
research, fostered changes in education policy and outlook that, in turn, led to
legislation that greatly affected the role of testing in today’s public schools. I
paid particular attention to the importance of testing within the education
system and the impact that it has had on public perception, particularly how
assessment has altered public discourse about education. Integrated into this
section is a focus on three federal legislative acts that have impacted
accountability in education. They are the Elementary and Secondary School
Act (1965), the Goals 2000: Educate America Act (1994), and the most recent,
the No Child Left Behind Act (2001). Accountability is the central reform theme
in all three acts. This accountability movement has increased the role of

19
testing and assessment in education and at the same time heightened the role
testing plays in school decisions at the federal, state, and local level.
The second section is a summary and discussion of the future of testing
in agricultural science education. Research in test construction is limited.
There is a need for well developed theoretical models for test design and test
validation. Within the field of agricultural science education, available testing
research is scant -- an issue that needs to be emphasized in the ongoing
research agenda for the profession.
The remainder of the chapter focuses on theories involved in test
design. I placed emphasis on item construction and item validation. I also
compared two theories driving item analysis: classical test theory and item
response theory.
Limitations and Delimitations of the Review of Research
Assessment is a broad term that encompasses various aspects of tests
and measures. For this study primary focus is given to standardized testing,
just one component within a larger assessment system. Within the
standardized testing movement, review of the research literature focuses on
criterion-referenced testing, with specific detail to item construction, item
validation, and item analysis. Within criterion-referenced testing, the use of
data collected focuses on the proportion-correct score estimates and
allocation of examinee mastery. Testing will be considered in the broader
framework of the general education system rather than specifically with in the
area of career and technical education. This is done solely due to a lack of
research evidence related to testing in career and technical education
programs. By examining academic uses of educational testing, I would hope

20
that career and technical educators can learn the pros and cons when
developing assessment measures for their specific needs.
Policy Issues
With the rise of testing in public education, there are those that feel the
existing policy of assessment is inappropriate and is wrongly enforced. Others
believe that assessment policy, which drives the high-stakes accountability
system, is the best way to measure student and school performance. Since
the 1850s, when testing in public schools was initiated to increase educational
funding, there have been strong reasons for such tests. These include
warranting educational inputs and providing state and federal funds to public
schools, sometimes led through an increase of taxes. As the nature of such
tests has changed through the decades it has altered the societal beliefs of
testing in general.
Many presidential and gubernatorial campaigns feature education as a
top priority. Emphasis is usually placed on the outcomes of the educational
system, essentially will every child be assured an equal opportunity and quality
education throughout the nation? According to Ravitch (2005), Republicans
and Democrats differ in their views of testing.
Unfortunately, the political calculations that resulted in the
No Child Left Behind law adopting a strategy of letting the
states choose their own standards and tests remain the
reality. In general, Republicans are wary of national
standards and a national curriculum, democrats have been
wary of testing in general. Both parties must come to
understand that the states are not competing with each other
to ratchet up student achievement. Instead, they are

21
maintaining standards that meet the public's comfort level
assuring an efficient educational system (¶10).
This situation impacts beliefs held by citizens about the education
system. By taking a look at the history of testing in education we can see how
testing played an important part in American schools long before this recent
“Age of Accountability.”
History of Assessment in US Educational Systems
1840s-1889
The first free public school dates back to 1639 founded in Dorchester,
Massachusetts. The Massachusetts school system took the lead in testing for
educational accountability when in the late 1840s the Massachusetts Board of
Education administered a voluntary written examination of 30 questions to
their eighth grade student body. This was a major shift from the traditional oral
exams used at the local level. Results showed that most students could not
pass due to the lack of alignment between the test items and the curricula
taught by the schoolmasters. Shortly thereafter the district discontinued
educational testing, and Massachusetts students did not see required tests
until 1986 (Bolon, 2000).
Other states began to support free public education in the 1850s and
60s such as Texas, Ohio, and New York. New York followed the testing lead
of Massachusetts and administered examinations in public schools. In 1865
the New York Board of Regents administered entrance exams for their high
school programs. In addition to these preliminary exams, an exit exam for
graduation was developed in 1878. Regents examinations were not made a
mandatory requirement for graduating with a local diploma until the start of the
21st century.

22
In 1888, superintendents in Cincinnati, Ohio replaced the traditional use
of oral and written essay exams with multiple-choice testing. This change in
format was mimicked by many other school districts in other states in the late
1880s. It was a more efficient was to classify and promote students (White,
1888). It also was an easier way to administer grades based on a test scores,
a practice done at many colleges such as William and Mary, Yale, and
Harvard to name a few.
1890-1919
By the turn of the 19th century about 80% of children ages 5 to 17 were
enrolled in some sort of school system (US Department of Commerce, 1975).
They included private schools, state-chartered academies, public schools, and
church-run charity schools. Such diversity reflected the interest of the
populace, “…motives that impelled Americans to found schools: the desire to
spread the faith, to retain the faithful, to maintain ethical boundaries, to protect
a privileged class position, to succor the helpless, to boost the community or
sell town lots, to train workers or craftsmen, to enhance the virtue or
marriageability of daughters, to make money, even to share the joys of
learning.” (Tyack & Hansot, 1982; p. 30). However, population increases
strained public school systems trying to meet the demands of growing student
enrollment and diversity. As enrollment increased, so too did the varying
levels of ability. Most students were at lower levels with lower motivation and
occupational aspirations. “Whereas before the turn of the century a fairly
homogeneous curriculum and simple organizational structure sufficed, it
became necessary after 1900 to develop a more differentiated curricular and
administrative system” (Schafer & Olexa, 1971:5). At a time where immigration
rates were rising, when compulsory-attendance laws were being adopted by
23
most states, and when adolescent work rolls were declining, a free public
education became the norm, overshadowing the private and religious-based
schools (Butts & Cremin, 1953).
Growth in public schools translated into a need for more public funding
for education. Individual states took the lead through state taxes. The role of
the federal government was not strong. “Education was regarded as a
function of the states, not in any sense a function of the National Government.”
(Capen, 1921:20). Occasionally the federal government provided aid to
develop various programs. This aid typically came through state- or locally-
matched funding in support of the land grant mission. For example, the Smith-
Hughes Act for Vocational Education of 1917 provided aid toward the
development of vocational training in secondary schools.
By the 1900s 80% of all educational spending went toward public
schools, an increase of 30% from the 1850s (Tyack & Hansot, 1982). What
was once a $15.55 per pupil expenditure in 1870 had risen to $49.12 per pupil
by 1918 (Butts & Cremin, 1953). This increase was viewed by some as a
burden on taxpayers. There arose a need to ensure that local and state tax
money applied toward secondary education was well spent; and there were
arguments as to whether such spending benefited the public at large. The
demand for effective schools was addressed bureaucratically by moving away
from the common school ideal, where the aim was to “educate citizens of
sound character,” to a more comprehensive, urbanized school system that
emphasized passing and failing (Tyack, 2003), “Crucial to educational
bureaucracy was the objective and classification, or grading, of pupils” (Tyack
& Hansot, 1982:44). This reform movement led to an institutionalized system
that divided students by grade, standardized the curriculum, and ensured a

24
reliable and rational classification of pupils (Tyack, 2003). Proponents for this
movement, “supported the highly structured models of schools in which
students would be sorted to their tested proficiency” (Katz, 1968:179). The
way to accomplish this sorting involved separating students based on ability,
which was measured by standardized achievement tests.
In the early 1900s standardized tests were the primary assessment
tools for measuring student ability in the basics -- reading, writing, and
arithmetic (Hoff, 2000). The term “standardized” had a somewhat different
meaning a century ago. Instead of referring to a norm-reference, as it is
today, it referred to a system where “…the tests were published, that
directions were given for administration, that the exam could be answered in
consistent and easily graded ways, and that there would be instructions on the
interpretation of results.” (Resnick, 1982:179). Standardized tests began to
overshadow oral and essay style tests. Standardized tests offered, “…a single
standard by which to judge and compare the output of each school, ‘positive
information in black and white,’ [in place of] the intuitive and often superficial
written evaluation of oral exams.” (Tyack, 1974:35).
According to Horace Mann, secretary of the state Board of Education in
Massachusetts from 1837-1848, testing had two purposes: classifying children
and monitoring school systems (US Congress Office of Technology
Assessment [OTA], 1992). Standardized tests gave teachers a quick tool to
measure the ability of one student compared to another. With achievement
tests, students could be sorted into grades more efficiently and either
promoted or retained based on test scores. A secondary outcome was that
state-level policy makers used test results to make comparisons between

25
schools in different districts and states. Such tests also helped standardized
curriculum based on grade level (Tyack, 2003).
Even as the use of standardized tests grew, questions were raised.
Since such tests were new, there was no assurance that they were effective.
There was no proof that the test scores actually reflected student ability.
When made public, the scores often highlighted or emphasized the pass/fail
rate of schools or students. Other critics argued that students were not
actually learning new material but simply memorized material that appeared
on tests (OTA, 1992). A final broad complaint revolved around using scores to
compare education performance in different districts or states. Critics felt
curriculum differences across regions and borders made such comparisons
meaningless.
1920-1949
A major theme in education by the 1920s responded to a rise in
immigration to the United States. Public education became a tool to
“Americanize” non-English speaking, foreign-born peoples (Tyack, 2003: 55).
It is estimated that of the 15 million foreign-born Americans in the U.S. in the
1920s, 5 million could not speak, read, or write English, and 2 million could
neither read nor write in any language. These immigrants formed
communities with cultural ties to their native lands (Towner, 1921: 83). The
situation presented a challenge for American public education. Instruction in
civics became increasingly important. Naturalization classes taught
immigrants American history, government, and citizenship. So-called
“streamer classes” taught them English and were found in almost all public
schools of the time (Tyack. 2005:28).

26
Also in the 1920s, enrollment rates continued to climb for both upper
elementary grades and high schools. One-room schoolhouses from the 19th
century were replaced by urban school structures, which featured multiple
grade levels and divided classes. Larger schools sometimes had two or more
classes per grade. Students were grouped into individual classes based on an
XYZ grouping that measured brightness (McCall & Bixler, 1928). State
educational leaders responded to the growth by encouraging creation of more
schools that allowed access to education to more children over longer periods
of time (Tyack & Cuban, 1995). From the start of the 20th century to the start
of the 21st century, the number of high school graduates increased annually
from about 95,000 to 2.5 million (NCES, 2003: table 102). At the same time,
the number of school instruction days doubled from around 1900 to the
present (Tyack & Cuban: 1995).
Standardized testing became an important tool to manage the spike in
enrollment and the expanded goals of public education. By 1925, 40,000
schools in 34 states were “standardized” (Tyack & Cuban, 1995:18). That
meant institutional systems were put in place that relied on quality indicators-
such as teacher qualifications, scoring cards or report cards, guidance
procedures, and a diversified curriculum with many electives.
A test regimen already existed to sort secondary students into grade
levels and classes. A new use for tests responded to a boom in American
industry combined with an administrative desire to place constraints on college
admissions. Sometimes this sorting had racial or nativist undertones.
Nicholas Butler, president of Columbia University in 1917, employed the
Thorndike Tests for Mental Alertness specifically to limit the number of Jewish
students admitted. He lamented that incoming students were “…depressing in

27
the extreme…largely made up of foreign born and children of those but
recently arrived…” (Wechsler, 1977:155).
The testing that developed from this situation helped sort students into
college preparatory or vocational/occupational tracts. It also grouped students
by learning styles and levels of ability. This was achieved using norm-
referenced standardized tests. According to McCall and Bixler, “a standard
test is an instrument that has been carefully prepared, in accordance with
scientific techniques, to measure intelligence, aptitude, or achievement in
school subjects” (1928:1). Prominent tests from the time included Multi-Mental
Intelligence, Thorndike-McCall Reading, National Intelligence, Stanford
Achievement, Otis Classification, and the Illinois Examinations (McCall &
Bixler, 1928:3,). Such tests measured reading, writing, spelling, arithmetic,
and intelligence; and they resulted in a cumulative score.
Testing the three R’s at the secondary level was most typical; but
intelligence testing gained in popularity after World War I because of the
American Psychological Association’s Alpha Test, a multiple-choice test used
to determine the “mental age” of military personnel. Testing soldiers allowed
the Army to sort enlisted men for special assignment (Resnick, 1982). The
Alpha Test showed a high illiteracy rate among the draftees. “The
examination of the draft registrants for service in the late war showed that of
the men called between the ages of 21 and 31, nearly 25 percent could not
read a newspaper, could not write a letter home, and could not read the
posted orders about the camps…one-fourth of the sons of America called to
the colors are incapacitated for efficient service because of their ignorance”
(Towner, 1921:82).

28
Similar multiple-choice intelligence tests were adopted by schools and
used from the third through ninth grades (Monroe, 1952). Testing proponents
herald their effectiveness. “Psychologists are now able to tell with
considerable accuracy whether a child posses an I.Q. which will ever make it
possible for him to do the work of a particular school or institution or grade in
school” (McCall, 1939:227). A one size-fits all curriculum did not meet the
demands of a diverse student body. Intelligence tests allowed schools to
separate students based on qualified scores that charted ability.
Toward the end of the 1920s, questions arose about the federal
government’s role in education and whether states were doing the job when it
came to providing an equal education to all. Testing proponents believed
emphasis should be placed on the basics, goals that every child should be
able to achieve. They also believed states should continue to control
education; but go about it more efficiently. Testing was seen as major
component of this mission. “It was not a far leap to embracing methods that,
because they were purported to measure differences, could be used to classify
children and get on with the educational mission…the American pursuit of
efficiency would become the hallmark of a generation of educationalists, and
would create the world’s most fertile ground for the cultivation of educational
tests” (OTA, 1992:111).
The use of testing grew over the next few decades. Intelligence testing
continued to increase, and tests that measured everything from vocational
skills to athletic ability gained in popularity. Educational researchers viewed
standardized tests as a way to gather data from hundreds of thousands of
subjects through a controllable medium. Test scores were used to support
administrative decisions and helped legitimize the classification of students.

29
Not everyone, however, viewed testing as valid and reliable solution for
running efficient public schools. The tests were fashioned as a way to identify
different abilities and needs in children. In practice, the tests instituted the
sorting, the labeling, and the ranking of children starting as early as the third
grade (OTA, 1992).
The evaluations drawn from testing broadened in the 1930s when E.F.
Lindquist developed the Iowa Test of Basic Skills and the Iowa Test of
Educational Development. These tests were voluntary for state high schools;
but incentives were offered to high performing schools. Throughout the ’30s
more states followed the Iowa model. Unlike in past tests, the results did not
simply chart individual student ability; but rather they were seen as a way to
“diagnose and monitor” schools and students (Peterson, 1983).
Testing also benefited from technology. Devices such as the optical-
scoring machine made processing multiple-choice tests more efficient (Walsh,
2000). Such advancements made testing affordable and readily accessible for
schools throughout the nation (OTA, 1992).
1950-1969
Curriculum changes from the end of the 1940s well into the ’50s were
predominantly centered on life-adjustment education. Only about half of
America’s youth fell into either vocational or college preparatory tracts
(Cremin, 1961). Dr. Charles Prosser, a lobbyist of the National Society for the
Promotion of Industrial Education, raised the issue with the U.S.
Commissioner of Education and the Assistant Commissioner for Vocational
Education. “We do not believe that the remaining 60% of our youth of
secondary school age will receive the life adjustment training they need and to
which they are entitled as American citizens -- unless and until the

30
administrators of public education with the assistance of the vocational
education leaders formulate a similar program for this group” (U.S. Office of
Education, nd: 15). Shortly thereafter the federal Commission on Life
Adjustment Education for Youth was founded. Its goal was to set a curriculum
to “equip all American youth to live democratically with satisfaction to
themselves and profit to society as home members, workers, and citizens” (US
Office of Education, 1951: 1).
Also through the 1950s, achievement testing continued to grow, aided
by the ease and cost effectiveness of pencil and paper tests. Optical scanners
replaced the older electro-mechanical scorers. In 1955, Lindquist developed
the first “Iowa Machine,” a state-of-the-art scoring machine for its day. The
reliance on such devices led to a subtle shift in teacher-student relationship.
[Before scoring machines] most standardized tests were hand-
scored by teachers…under that system, tests corrected and
scored by the teacher provided opportunity for careful pupil
analysis by the teacher. In turn, that analysis, pupil by pupil and
class by class, provided meaningful measures for individualizing
pupil instruction, improving instruction, reassessing the
curriculum, and making appropriate textbook decisions…as the
machine-scoring movement grew, the activities related to testing
changed. Certainly, the scoring activity left the classroom and
often as not the school system itself. Test results moved
increasingly into the hands of the administrative staff. Test
specialists were employed who were interested in an ever
broader array of derived scores to be used for many purposes …
the hands-on dimension for teachers receded and in due course

31
disappeared almost entirely” (Communication with H. Miller as
sited in OTA, 1992:255).
Also in the early years of the 1950s, education was a bottom-up
system. Local school boards were near autonomous. Local superintendents
and administrators faced few constraints from federal or state governments.
Most upper level school administrators were college trained in the field of
education; they were handpicked by their local school boards. Their main
roles were, “Keeping schools out of politics, especially resisting pressure
groups, impartially administering the rules, preserving the integrity and dignity
of the profession; and keeping the faith that ‘what happens in and to the public
schools of America happens to America’ ” (Tyack & Hansot, 1982:219). It was
a closed system, one run by local superintendents with their own,
“professional culture, values, and interests…controlled the flow of information
to school board members, by claiming impartial expertise, and by obfuscation
when necessary, they have turned school boards into rubber stamps for their
policies” (Tyack & Hansot, 1982:222). By the late ’50s, this situation prompted
what was termed a “Crisis in Education” (Life Magazine, 1958:2). Protestors
seeking social change turned their attention to public education. They
addressed their message to the highest levels of government for leverage
(Tyack & Hansot, 1982).
In the late ’50s and early ’60s, public schools moved away from life-
adjustment education to an emphasis on academics. Enacted by Congress in
1958, the National Defense Education Act (NDEA) provided federal money to
aid in sciences, mathematics, and modern languages. NDEA came as a
response to the Soviet Union launching of Sputnik (OTA, 1992). Most
Americans believed the United States lost the race to space because of

32
academic inferiority. Factors identified as weaknesses included a curriculum
that emphasized a wide variety of electives instead of core academic classes.
Examples of electives included, “guidance and education in citizenship, home
and family life, use of leisure, health, tools of learning, work experience, and
occupational adjustment” (Manzo, 2000: 129). In order to catch the Soviets,
Americans wanted to replace such classes with academic courses or more
valuable electives such as foreign languages. It was a move recommended
three decades earlier by the Committee of Ten in the Cardinal Principles report
(1919). “All programs included, as an example, three years of mathematics
and at least four years of a foreign language as well as heavy doses of
science and literature…excluding such newly emerging subjects such as
manual training and commercial courses.” (Kliebard,1995; p. 199).
Testing for achievement became a primary partner of this more
academic learning curriculum. Federal funds paid for test development and
usage. “…A program for testing aptitudes and ability of students in public
secondary schools, and…to identify students with outstanding aptitudes and
abilities…to provide such information about the aptitudes and abilities of
secondary school students as may be needed by secondary school guidance
personnel in carrying out their duties; and to provide information to other
educational institutions relative to the educational potential of students seeking
admissions to such institutions…” (PL 85-864).
While the federal initiative was geared toward identifying talented
students, public schools faced another challenge: namely, how to best
educate children of the poor. Press reports from the time labeled the 1940s
through the ’60s as an era of “urban crisis” (Ravitch, 1983:147). Technology
began to mechanize traditional agricultural practices. This fostered a

33
migration from the south, particularly its black population, to American cities.
In urban settings, blacks were segregated into poorer slums. At the same
time, jobs for semi-skilled or unskilled workers dwindled, leaving many blacks
and other poor immigrants in a state of poverty. “Blacks were concentrated in
low-wage jobs…few had the education to become professionals…even those
with credentials discovered…people with dark skin were not welcomed
(Ravitch, 1983:147). The issue of racial equality helped spur a highly
politicized school reform debate in the ’60s. Many believed that states had
failed in their public education mission, and that the current system did not
meet the needs of social and economic realities. The federal government was
asked to step in. Professor Philip Hauser, speaking at the 4th Annual
Conference of the National Committee for Support of the Public Schools, said
the states had failed miserably, “The fact is should the states continue in their
ways, I think state governments will wither and die, as probably they have
earned the right to do” (1966:14).
Titles IV and VI of the Civil Rights Act of 1964 focused on ending school
segregation and eliminating separate and unequal facilities, issues fought for
in Brown v. Education of Topeka in 1954. Title IV provided technical
assistance to prepare, adopt, and implement plans for desegregation within
public schools. Title VI prohibited discrimination in any federal-funded
program and withheld funding from institutions that did not comply (Spring,
1990). A year later, Congress passed the Elementary and Secondary
Education Act (ESEA). Within the first four years of its enactment, this act
provided $4 billion in aid to disadvantaged children (Mondale & Patton, 2001).
Title I of ESEA (renamed Chapter 1 in 1981) provided federal dollars for
program evaluation.
34
The purpose of Chapter 1 was to:
1. Determine the effectiveness of the program in improving the
education of disadvantaged children;
2. Instill local accountability for Federal funds; and
3. To provide information that State and local decision makers
can use to assess and alter programs” (OTA, 1992).
Testing was used to evaluate the programs, prompting an increase in
norm-referenced tests such as the Comprehensive Test of Basic Skills and the
California Achievement Tests (Walsh, 2000). Tying federal funds to
desegregation increased the involvement of the federal government in public
schools. According to President Lyndon B. Johnson, “It represents a major
new commitment of the federal government to quality and equality in the
schooling that we offer our young people (Mondale & Patton, 2001: 148).
Testing was part of that equation.
Some opposed mandating tests to evaluate programs. By the late ’60s,
however, such tests were providing information to policy makers. As an
unintended consequence, the collected data sparked a debate on national
testing. At the 1966 meeting of the National Committee for Support of the
Public Schools, a national testing protocol was proposed: “A national
assessment to identify kinds of progress being made in education” was the
proposal. Those against national testing believed differences in local curricula
would make the results of these tests inaccurate as a measure of true student
performance. They also believed national assessment put too much power in
the hands of the federal government, allowing it to develop and set tested
objectives (Proceedings, 1966: 85). Three years after the conference, the

35
National Assessment of Educational Progress was created to survey student
achievement in elementary, middle, and high schools.
Another teaching movement in the late ’60s set up class structure to
meet diverse student needs. According to Thomas and Thomas, the main
school classifications were as follows: 1) ability grouping, 2) special classes
for slow learners, 3) special classes for the gifted, 4) other special classes, 5)
un-graded classes, 6) retention and acceleration classes, 7) frequent
promotion plans, 8) contract and unit plans, 9) team teaching, 10) and parallel-
tract plans (1965:97).
The parallel tract further divided students based on aptitude and
achievement tests. Some of the more popular tracts were college preparatory
and vocational. The rationale behind tracking involved fitting subject matter to
group needs based on the approach that learning would be more effective
among a set of relatively homogenous students (Thomas & Thomas, 1965).
There were lots of critics. Critics felt that tracking discriminated against lower-
income and minority students. The tests, they argued, favored white middle-
class students. Once in a tract, the students felt locked into a path without
much opportunity for developmental changes. The lower, non-college prep
tracts also were viewed as inferior and tended to attract rebellious students.
Lastly, tracking limited contact between students with different backgrounds
(Thomas & Thomas, 1965). However, according to the Coleman Report,
which reported the effects of tracking, there was no difference in the outcome
of students in a tracked system (1966). Tracking drove curriculum in the early
1970s and helped develop programs such as cooperative education and work-
based learning.

36
Elementary and Secondary Education Act.
In 1965, Congress passed the Elementary and Secondary Education
Act (ESEA). Title I of ESEA (renamed Chapter I in 1981 and back to Title I in
1993) provided federal dollars for program evaluation. The purpose of Title I
of the ESEA was to, “ensure that all children have a fair, equal, and significant
opportunity to obtain a high-quality education and reach, at a minimum,
proficiency on challenging state academic achievement standards and state
academic assessments.” A large percentage of Title I funding is allocated for
public schools with a high rate of low-income families and low-achieving
students. It is used in providing the resources to help these disadvantaged
students meet student academic achievement standards outlined by the
states.
In recognition of the special education needs of low-income
families and the impact that concentrations of low-income
families have on the ability of local education agencies to support
adequate educational programs, the Congress hereby declares it
to be the policy of the United States to provide financial
assistance…to local educational agencies serving areas with
concentrations of children from low-income families to expand
and improve their educational programs by various means
(including preschool programs) which contribute to meeting the
special educational needs of educationally deprived children.
(Elementary and Secondary School Act, 1965, Section 201)
Schools were viewed as a democratic institution at the time of ESEA
passage. Policy makers and education officials in states and localities set
guidelines for school programs- including such areas as designing curriculum,

37
distributing funds, and hiring of teachers. Leaders at state and local levels did
not want to cede this control to the federal government. In order to protect
local and state autonomy ESEA prohibited any “Federal agency or official from
exercising direction, supervision, or control over the curriculum, program of
instruction, administration, or personnel in any educational institution or school
system” (1965, Section 604).
From 1965 to the present, ESEA has been reauthorized eight times,
providing funds for more than just disadvantaged students. It now has
expanded to serve other interests such as bilingual education, American
Indian education, teacher training, technology, and school libraries. In regard
to assessment, during the 1994 reauthorization of ESEA, at the time referred
to as the Hawkins-Stafford Elementary and Secondary Schools Improvement
Amendments, there was emphasis for each state to develop its own plan for
curriculum standards and an assessment system to measure those standards.
The legislation also called for local plans to be aligned to a corresponding
state plan, which would be submitted for federal approval. The law
emphasized outcomes-based and performance-based testing and the
assessment of higher-order thinking skills. It required state standards to be
valid and reliable, integrating technical and professional standards. The
frequency of testing, as mandated by Title 1, was to be yearly in an array of
subjects with adopted standards and a minimum of once for every students
during grades 3-5, 6-9 and 10-12 the subjects of mathematics and reading or
language arts. In 2002, ESEA of 2001 was signed into law. It was subtitled
the No Child Left Behind Act.

38
1970-1989
The 1970s became viewed as the “Decade of Accountability.”
Accountability has had many different definitions: 1) keeping track of federal
and state aid, 2) action taken in response to the agendas of protest groups,
e.g. Title IX coordinator to correct gender injustices, 3) compliance with legal
mandates 4) offering students more choices such as electives (Tyack, 2005:
151). Many public interests groups advocated for equal educational
opportunities. In 1972 President Richard M. Nixon signed an educational
amendment known as Title IX of the ESEA. This legislation provided equal
resources and opportunities to women. Shortly thereafter in 1975, Public Law
94-142 provided equal opportunity to students with disabilities. This legislation
ended the exclusion of students with mental or physical disabilities from public
schools (Fraser, 2001:294).
To ensure that federal aid was used for its intended purpose, programs
were monitored with their own accounting systems, creating schools with
loosely-coupled systems of separate but similar services across many federal-
aided programs (Tyack & Hansot, 1982). The system monitored compliance
with federal regulations, but it did not ensure that schools performed up to
minimum standards. This fostered a minimum competency testing movement.
By the late 1970s into the 1980s, public concerns grew more strident
regarding students graduating without knowledge in basic skills. This was
addressed through minimum competency-based education and standards
(Tyack, 2005: 151). The responsibility fell to individual students. If they did not
pass they could be barred from extracurricular activities, not promoted to the
next grade level, or restricted from graduation (Massell, 2001). The basic

39
skills regimen was multiple-choice and known as minimum competency testing
(MCT). Mandated by states or local agencies, MCT was described as:
1. All or almost all students in designated grades take a paper-
and-pencil tests designed to measure a set of skills deemed
essential for future and life work
2. The state or locality has established a passing score or
acceptable standard or performance on these tests
3. The state of locality may use test results to a) make
decisions about grade-level promotion, high school
graduation, or the awarding of diplomas; b) classify students
for remedial or other special services; c) allocate certain
funds to school districts; or d) evaluate or certify school
districts, schools, or teachers (OTA, 1992:57).
There was public support for MCT. By 1980, 29 states had
implemented MCT; by 1985 it had risen to 33 states with 11 requiring passing
scores as a prerequisite for graduation (OTA, 1982). By the mid 1990s over
20 states required passable scores for graduation (Bishop, Mane, Bishop, &
Moriarty, 2001).
A second main national education reform came in the mid ’80s when
the Regan Administration issued a federal report termed A Nation at Risk
(National Commission on Excellence in Education, 1983). The report, “urged
U.S. schools to retain an international competitive edge, seeking a more
rigorous, standardized curriculum” (Cooper, Fusareli, & Randall, 2004:170).
Implementing national standards would restructure public schools and target
specific money for a specific curriculum. Developing standardized tests based
on a standard curriculum meant policy makers could calculate if reform was

40
working; it gave parents the choice of moving students elsewhere if schools
were failing. This report helped launched school vouchers and supported the
growth of charter schools. Reformers believed school accountability and
school choice would result in competition and higher educational achievement
(Moe & Chubb, 1990). “The main barrier to more effective schools is the
disorganization and lack of incentives and direction in the public school
system. The remedy they favored is efficient, customer-oriented service such
as that found in the private sector” (Walker, 2003:49). Systematic reform
interested national organizations such as the National Science Foundation,
which funded a Statewide Systematic Reform Initiative (Walker, 2003). By
1989, President George H.W. Bush was pushing for national goals that states
could easily adopt. But it wasn’t until the Clinton Administration that the U.S.
established national standards.
1990-Present
In 1994 the Goals 2000: Educate America Act (PL 103-227) was
passed. It enacted eight broad goals for American schools to be reached
by the year 2000. These goals served as a foundation for establishing
national standards. Though voluntary, the Goals 2000 Act provided
funding to states and localities that developed similar standards.
Through the early 1990s, education policy decisions were made mostly
at the state level, holding schools accountable through the use of test scores
(Tyack, 2005). There is much debate on how to hold educational practitioners
-- primarily administrators and teachers -- responsible for student learning.
According to Hess and McGuinn (2002), during the presidential elections of
2000 the public ranked education as the nation’s most important issue. It was

41
the first time education was thought of as the nation’s No.1 problem in the past
40 years.
After winning election, President George W. Bush pushed for a national
educational accountability system. Phrases prominent in the Children’s
Defense Fund like “Leave No Child Behind” became headlines (Marschall &
McKee, 2002). As the former governor of Texas, Bush fostered that state’s
education accountability system, known as Texas Assessment of Academic
Skills (TAAS). It implemented a statewide curriculum with four end-of-course
exams. Test results were used to generate school report cards, rating districts
and individual school performance, rewarding high-performance schools and
districts, and sanctioning low-performance ones (TEA website). Bush used
Texas’ educational accountability system, with its high-stakes testing, as a
model to reauthorize the federal Elementary and Secondary Education Act
(ESEA) and create the No Child Left Behind (NCLB) Act. In his State of the
Union Address in 2001, Bush addressed issues of accountability and funding
for schools. “We must tie funding to higher standards and accountability for
results…when the Federal Government spends tax dollars, we must insist on
results. Children should be tested on basic reading and math skills every year
between grades three and eight. Measuring is the only way to know whether
all our children are learning. And I want to know, because I refuse to leave
any child behind in America” (2001).
Since the early ’90s content- and performance-based standards
increased nationwide, essentially doubling, with almost every state
establishing such standards and tests (Hurst, Tan, Meek, Sellers, 2003). By
the start of the 21st century, 48 states had such accountability systems in place
(Goertz, 2001; Linn, 2000). In 2004, 30 states required students to pass

42
assessment test to graduate. That was up from the 18 states that required
graduation tests in 1996-1997 (Goerts, Duffy, Le Froch, 2001). Such high-
stakes testing is the centerpiece of NCLB, establishing consequences for poor
performance. “High-stakes provide notable consequences for participants.
Depending on the results, students may fail to graduate, teachers may lose
salary bonuses, and schools may face reconstitution” (Lashway, 2001).
According to Title I, Part A, Section 1116 of ESEA, schools are held
accountable for student achievement. Schools and districts are given up to
five years to meet annual yearly progress (AYP) goals. If they fail, they face
drastic restructuring, relying on alternative school governance. AYP is
determined at the state level and calculated based on reaching performance
goals and standards.
Federal regulations focus on rewarding or sanctioning schools and
teachers, not individual students. Student achievement standards are
regulated by the state. For example, in 17 states students cannot be
promoted to the fifth and ninth grades if they fail to pass the forth- and eight-
grade statewide tests (Cortiella, 2004). Also, as referenced previously, a
similar number of states require seniors to pass certain statewide tests or end-
of-course exams before graduating. Federal regulations, however, do reward
and sanction teachers. According to NCLB, all teachers must be highly
qualified. That means teacher must have: 1) a bachelor's degree, 2) a full
state certification or licensure, and 3) proof that they know each subject they
teach (US Department of Education, n.d. a). According to then U.S. Secretary
of Education Rod Paige, failure to meet the requirements translates into a
delay in federal funding until conditions are fully met (National School Boards
Association [NSBA], 2004).

43
Other aspects of high-stakes achievement are enforced at the local
level. Examples include replacing career and technical programs when there
is need for additional remediation of students in academic classes that are
subject to statewide tests, such as has occurred in states like Virginia.
Though not explicitly spelled out in legislation, teachers face repercussions if a
specified portion of their students fail high-stakes exams (Glatthorn & Fontana,
2000), including shifting such teachers to non-testing classes. On the other
side, teachers might get rewarded for high pass rates with incentives such as
pay increases, as done in North Carolina. These represent examples, not
definitions, of high-stakes accountability in practice. They are illustrative of
repercussion and rewards.
Those strongly opposed to NCLB believed the high-stakes system did
nothing to help disadvantaged students (Snell, 2001). Two studies looked at
the effects of Title I spending: Sustaining Effects in 1984 and Prospects in
1997. Both found a lack of educational achievement in students targeted by
Title I funding (Snell, 2001). According to education analyst Wayne Riddle,
however, “Title I participants tend to increase their achievement at the same
rate as non-disadvantaged pupils, so the gaps in achievement do not
significantly change” (Snell, 2001:142). Schools are allowed five consecutive
years of failing to meet AYP before they are restructured and reopened under
a revised governing system. Some parents believed five years was too long a
time to send children to poor-performing schools, and they should have the
choice to send them elsewhere at an earlier time (Snell, 2001).
Goals 2000: Educate America Act.
In 1989, then Arkansas Governor William J. Clinton and the nation’s
governors agreed to set national education goals. At the time they set six

44
goals for education by the year 2000. This led to the passage of Goals 2000:
Educate America Act of 1994, which set eight broad goals for American
schools. The goals, to be reached by the year 2000, were as followed:
1. All students will start school ready to learn.
2. The high school graduation rate will increase to at least 90%.
3. All students will become competent in challenging subject
matter.
4. Teachers will have the knowledge and skills that they need.
5. U.S. students will be first in the world in mathematics and
science achievement.
6. Every adult American will be literate.
7. Schools will be safe, disciplined, and free of guns, drugs,
and alcohol.
8. Schools will promote parental involvement and participation.
(Lashway, 2001, p. 49)
The real agenda of Goals 2000 was to help all Americans reach
internationally educational competitive standards (Kean, 1995). The Act had
four main components: (1) authorization of the National Education Goals
Panel; (2) creation of the federal agency known as the National Education
Standards and Improvement Council (NESIC)]; (3) establishment of a statutory
grant program; and (4) authorization of award grants for the development of
national opportunity-to-learn standards.
The mechanism set up to promote the outcomes planned for Goals
2000 was to require states to develop their own reform plans based on the
national standards and then to distribute federal funds to aid in the
implementation of those plans. Completed state plans were reviewed by the

45
NESIC with comparison to national standards. The National Education Goals
Panel then further reviewed the recommendation of the NESIC and either
approved or dismissed it (Ravitch, 1995).
Goals 2000 created controversy after its enactment. Troublesome
issues included the amount of control that the federal government had in the
standards approval process; who was to be responsible for the standards
development process; the use of test and other assessments; and school
delivery standards, now renamed opportunity-to-learn (OTL) standards. The
latter stirred the largest debate with this legislation. The definition of OTL
standards was misunderstood; some thought OTL referred to standards that
were to be assessed and others thought it referred to everything that a student
had an opportunity to learn. The U.S. House of Representatives viewed the
OTL standards as a way to force equalization in education and would have
required states to document their OTL standards in their school reform plan for
NESIC approval. The Senate asked for the same but proposed that states not
to be required to submit their plans to the NESIC. The media interpreted OTL
standards as the federal government’s way to take control local programs.
With much debate over the issue of OTL, the final version of Goals 2000 made
OTL standards voluntary, in effect encouraging but not requiring state
participation (McDonnell, 2004).
Tests and assessments were another issue debated in relation to Goals
2000. Was the adoption of national standards going to lead to a national
assessment of these standards? If so, would it be the federal government’s
responsibility to design and implement a national testing program? After much
debate legislators made it clear that Goals 2000 would not create a national
examination system. Rather, testing was to be left to the respective states.

46
Education policy makers in each state would be responsible for developing
their own assessments based on their own individual standards. States were
to be left with the option to seek approval from the NESIC to certify their tests,
assuring their validity and reliability. Once certified, the tests were not to be
used for high-stakes purposes, i.e. graduation retention, for five years.
According to Goals 2000, the tests sole purpose were to measure the
standards for what students should know and be able to do with no rewards or
sanctions attached (Stevenson, 1995).
No Child Left Behind.
In 2001, Congress passed the reauthorization of ESEA, known as the
No Child Left Behind Act (NCLB). The passage of NCLB has made a
profound impact on the American education system, reinforcing the culture of
accountability. Its goal is to strengthen Title I accountability by demanding
student achievement in return for investments.
According to the federal government’s Strategic Plan there are six main
goals of NCLB legislation:
1. Create a Culture of Achievement.
2. Improve Student Achievement.
3. Develop Safe Schools and Strong Character.
4. Transform Education into an Evidence-based Field.
5. Enhance the Quality of and Access to Postsecondary and
Adult Education.
6. Establish Management Excellence.
There are ten titles in NCLB. Title I is the largest, with a main goal of
the NCLB act to strengthen Title I accountability (U.S. Department of
Education, 2002). A 12-year plan was implemented to raise standards of all

47
students through the use of testing in math, reading and science. There is a
growth in the amount of federal involvement in individual schools as mandated
by NCLB, challenging state and local control. The federal government
withholds funds from states unwilling to participate in the national testing effort.
The standards measured must have three levels of attainment: failure,
proficient, and advanced. Attainment results based on these standards are
then tied to a system of rewards and sanctions (PL 107-110: 1146).
As stated in NCLB, there are no federal regulations rewarding or
sanctioning students based on student performance on testing. Typically,
these are regulated by the states. A third of the 48 states with statewide
testing will not let students graduate if they have not passed a certain number
of statewide tests or their “end-of-course” exams. There are, however, federal
regulations rewarding or sanctioning teachers. According to NCLB, all
teachers must be highly qualified. To be highly qualified, a teacher must have:
(1) a bachelor's degree, (2) full state certification or licensure, and (3) proof
that they know each subject they teach (U.S. Department of Education, nd. a).
According to U.S. Secretary of Education Rod Paige, states employing
teachers that are not highly qualified will end up in a delay of federal funding
until conditions are fully met (National School Boards Association [NSBA],
2004). In 2004, Title 1 authorized $11.7 billion in aid earmarked to half of the
nation’s public schools. The expenditure represents a small percentage of the
nation’s overall education budget; but it is an amount that school districts
serving the needs of the disadvantaged students cannot do without.
The century-old America tradition of having one “education reform
movement” followed by yet another “education reform movement” has lead
many educators to think that No Child Left Behind was just the first

48
educational reform fad of the 21st century. Even if the current emphasis on
accountability promulgated by NCLB were to change after the next presidential
election or some other major turn of events, it is fairly certain that a high-
stakes accountability system of standards and assessment will be a prominent
part of the educational landscape in the United States for many years to come
(Marschall & McKee, 2001). National opinion polls reveal that Americans are
in support of clear standards specifying what students are taught and how they
are tested (Hochschild and Scott, 1998; Rose, Gallup, and Elam, 1997;
Johnson and Immerwarh, 1994). The prospect of a national leader being
seen as supporting “lowering education standards” or “reducing the
accountability of schools” is incomprehensible in the current political climate.
Beliefs about testing
Criticisms of Assessment
Teachers, students, and parents have argued that there is simply too
much testing; and that too much weight is given to such tests when it comes to
evaluating student achievement and performance. Ebel (1979), however,
noted that most criticism comes from three special interest groups:
1. Professional educators who are uneasy about the
accountability with standardized tests and external testing in
general.
2. Reformers who regard testing as part of an unsuccessful and
outmoded instructional process.
3. Free-lance writers whose best sellers purport to expose
scandals in important human institutions (p. 6).
Some basic assumptions that support achievement testing are being
researched to make constructive arguments against testing and not just

49
personal testimony. For example, Kornhaber and Orfield (2001) addressed
beliefs that, “testing will enhance economic productivity, motivate students,
and improve teaching and learning” (p. 5). Their studies found that only a
weak connection existed between economic productivity and student
performance; that tests used as motivational tools had variable results; and
that testing did not improve teaching and learning (See Levin, 2001; Madaus &
Clark, 2001; McNeil & Valenzuela, 2001 for a further read of studies
influencing Kornhaber and Orfield).
Critics noted negative impacts related to testing, including: tests
controlling the curriculum, false labeling of students as “masters” or “non-
masters”, stress placed on students, and biased tests misrepresenting all
levels of SES and minorities. Jones, Jones, and Hargrove (2003) noted that
opponents believe testing: (a) does not inform the public about school quality;
(b) does not provide an accurate measure of accountability; (c) does not
provide information about student achievement; and (d) questions the integrity
and accuracy of testing. Legitimate questions related to the integrity and
accuracy of tests and results include: (a) Why do tests and results differ
between the state and federal levels? (b) How valid are these tests? (c) Who
sets the standard score of who passes and who fails? NCLB pushes
American education more toward a free-market model -- schools either do
better or get out of the business. A key concern that has been raised is
whether policy makers have been too quick to rely simply on test results to
make major decisions?
One impact of high-stakes testing relates to teachers adjusting typical
instruction methods and adapting curriculum to focus on the fine points of what
is expected to appear on the tests (Corbett & Wilson, 1991; McNeil, 2000).

50
This could lead to a lack of depth in specific subject matter and a failure to
allot enough time to go over tested segments (Schmidt, McKnight, & Raizen,
1996), with the principles found on tests reinforced to keep scores high
(Perreault, 2000). Testing changed the make-up of classroom instruction, with
more time spent on math, reading, and writing and less time on subjects that
are not tested (Jones, Jones, Hardin, Chapman, Yarbrough, & David 1999).
Testing also alters teaching practices, according to critics. There is a
methodological shift from the constructivist student-centered approach to
teacher-centered instruction, mainly due to time pressures (Wideen, O’Shea,
Pye, & Ivany, 1997). According to these researchers, this hinders teacher
creativity by taking away the “art of teaching.” That, in turn, hinders student
creativity. Testing typically involves professional development for teachers,
suggesting ways to integrate elements that appear on tests into the current
curriculum. However, most of this development was found to be cosmetic
only, not a deep change in teaching method (Schorr & Firestone, 2001).
Sustaining professional development also can prove costly for school systems
and taxpayers.
Another complaint involves how test scores are determined and how
are they used. This includes test score inflation. The 1987 “Lake Wobegon
Report” (named after radio personality Garrison Keillor’s fictional locale where
“all children are above average”) found that state test scores were regularly
higher than the national average (Cannell, 1987). According to Linn (2000),
this resulted from a situation where test scores continued to rise until a new
test was introduced. Another problem with test scores is test score pollution.
This results in a situation where different students, schools, districts, and
states take different approaches to prepare for what can be essentially the
51
same test, effecting score outcomes. Incorrect scores are also attributed to
teacher stress of reaching AYP goals therefore providing inappropriate
assistance to students during testing (Shepherd & Doughtery, 1991).
Some of the negatives associated with testing are expected to have
long-term effects. Researchers have found that dropout rates were linked to
failing achievement tests (Grison and Shepard, 1989; Clark, Hanley, &
Madaus, 2000; Beatty, Neisser, Trent, & Heubert, 2001). Retention in a grade
level was not construed as a positive term, as in “extra help to ensure
passing,” but as a negative, as in “flunking.” According to Byrnes (1989) and
Holmes (1989), such a designation impacted a student’s self-esteem.
McCollum, Cortez, Maroney, and Montes (1999) also found that retained
students did not do better the second time around in the same grade. Darling-
Hammond (1998) attributed this to repeating the same poor training a second
time through a grade. Many school systems instituted promotional gates at
specific grade levels, holding back students until they mastered skills tested at
that check point. House (1989), however, indicated that this specific retention
procedure had no appreciable relevance to overall achievement. This
prompted some school systems, such as New York City public schools, to
drop such checkpoints in the 1990s. Most school systems, however, re-
instituted promotional gates after 2000.
Support for Assessment
On the other side of the spectrum, many believe testing is needed and
is a positive tool providing valuable data on student achievement. According
to Jones, Jones, and Hargrove (2003), most proponents say testing is
necessary to (a) measure student achievement, (b) provide information about
the quality of schools, and (c) hold students and educators accountable (p.

52
10). Similar to the atmosphere of the early 1900s, parents and taxpayers want
to make sure public money is well spent and that public schools meet student
needs. Standardized testing is viewed as a way to do this. Most states, about
85% in the year 2000, test students through norm-referenced multiple-choice
tests (Jones, Jones, & Hargrove, 2003; p.16). This testing is a relatively
inexpensive and quick way for legislators, school administrators, and parents
to process statistical data about schools and students.
As referenced earlier, some educators believe testing negatively
impacts the curriculum and alters instruction from a student-centered
approach methodology to a teacher-centered approach. Other teachers,
however, believe testing promotes just the opposite. The National Council of
Teachers of Mathematics (NCTM) 2000 Standards recommended spending
less time practicing skills to make room for conceptual learning. According to
Borko and Elliott (1999), in a study conducted on the methodology of math
teachers, it was found that teachers were aligning to the NCTM 2000
Standards, spending more time on student-centered conceptual learning.
Testing is viewed by some supporters as a way to enhance teaching.
According to Popham (2003), standardized testing helps clarify the curriculum
by basing it on content standards, objectives, or goals. It also helps teacher
understand prior knowledge among students entering a new course or new
unit of instruction. It can assist with designing a teaching calendar, planning
out how much instructional time to spend on various units. Finally, it is a tool
to measure the effectiveness of teacher instruction. Instead of relying on the
often-referenced criticism that teachers are “teaching to the test,” Popham
(2003) introduced the observation of “teaching towards test-represented

53
targets” (p. 27). Testing relates directly to measurable criterion, not the overall
goal of instruction.
Testing proponents find fault with the contention that multiple-choice
tests do not produce valid results, and that more authentic assessments are
needed. They argue that portfolios, while a good way to evaluate student
progress and ability over time, are expensive to score and less reliable due to
greater subjectivity in grading procedures. Essays and writing rubrics,
typically used to assess writing skills in English classes, are a violation of
construct validity since they do not measure writing achievement but rather
measure compliance to the rubrics themselves (Jones, Jones, & Hargrove,
2003; p.52). Likewise, science investigations using laboratory exercise are
expensive to conduct, expensive to evaluate, and, like portfolios, less reliable
due to scoring subjectivity.
Summary of Beliefs
For every criticism against testing there is a counterpoint for the value
of testing. Reasons to justify standardized testing changed over time;
however, one underlying theme remains constant: the power testing has in
forcing change within American education. Without this power, there would
probably not be such controversy. Testing in the classroom has become the
dominant measure of school and student accountability. It provides parents
with a sense of trust that public schools are properly educating their children.
Without testing, responsibility would fall to teacher opinion as to whether the
student mastered a specific criterion. Still, this notion is subject to many
reliability issues. Testing provides hard evidence that a student is able to
perform at a certain level. Test design has evolved so that a specific criterion
can be measured. Also, such tests strengthened the legitimacy of curriculum

54
and instruction nationwide, providing information needed to move teaching
methods forward.
The public is concerned about the use of test scores and decisions
based on these scores. Very little was mentioned in the research on test
construction methods. Further detailing of how standardized multiple-choice
test are designed might allay such concerns. These tests are not sets of
randomly written questions. Specific guidelines and procedures are followed
in test design. Test companies produced various tests to meet the needs of
different educational programs.
Theories of Assessment
Criterion-Referenced Measurement
During the 1960s, Glaser (1963) and Popham and Husek (1969)
popularized the concept of criterion-reference measurement, later also
referred to as objective-based or domain-based measurement. At that time
the basic methodology for developing items on a criterion-reference test and a
norm-reference test were the same (Glaser, 1963). However, there is a
distinction between norm-reference measurement and criterion-reference
measurement. Hambleton and Rogers (1991) noted four main differences: (1)
test purpose, (2) content specificity, (3) test development, and (4) test score
generalizability (p. 8). Norm-referenced testing (NRT) takes students’ scores
and places them along the normal distribution curve. It compares how
students perform on a test relative to other students, commonly referred to as
the norm group. While this is suitable for some settings, as students’ scores
become unequally distributed (i.e. many students score highly on the test), the
reliability of the test itself becomes lower. The relative score of how students
did compared to other students is the main outcome of NRT.

55
Criterion-Referenced Tests (CRT) measure a student’s absolute score
on an assessment, not the relative score as done with norm-referenced
testing, see Figure 2.1. While an ideal NRT frequency curve would be equally
distributed among the test scores, see Figure 2.2, that is not common and the
scores tend to range around the middle with a wide spread, producing a bell-
shaped curve. CRT’s mastery curve, or j-shaped curve, does not compare
examinees to one another but rather measures each examinee individually to
determine if the examinee has mastered the specific ability set forth in the
criterion. Since many test takers do well in CRT there are more scores
clustered near the high end of the distribution curve.
Figure 2.1. Norm-referenced distribution curve vs. criterion-referenced
distribution curve

56
Figure 2.2. Ideal NRT Frequency Distribution
Adapted from Criterion-Referenced test development by S. Shrock and W.
Coscarelli, 2000, p. 24. © International Society for Performance Improvement.
Reprinted with permission of the International Society for Performance
Improvement, www.ispi.org.
There have been many interpretations of CRT since Glaser introduced
the assessment theory in his 1963 article Instructional Technology and the
Measurement of Learning Outcomes: Some Questions. Introduced in the era
of behaviorist learning theory, a prominent interpretation of CRT was to
develop tests closely articulated to relevant behaviors. Glaser (1994) summed
up top psychometricians’ interpretations of CRT in his 1994 review of the
article. Linn (1994) highlighted the links to behaviorist learning theory to

57
include the cognitive measure of higher-order thinking skills. “The goal in
criterion-referenced measurement is to close the gap between the test and the
criterion behaviors and understandings that correspond to the aims of
instruction” (p. 14). He emphasized use of cutoff scores in CRT and the use of
CRT to distinguish master learners from non-masters of the subject matter;
however, he noted that while cutoff scores are beneficial, they are not
necessary in CRT. He also stressed the fact that while CRT can provide
norm-referenced data, NRT cannot provide criterion-referenced data.
Hambleton (1994) viewed CRT as a form of authentic measurement
and performance assessment based on standards. He specified six CRT
measurement advances developed from the work of Glaser (1963) and
Popham and Husek (1969). Those measurement advances were:
1. Clarification in specifying objectives
2. Progress in item writing and increased emphasis on content
validity
3. New approaches for reliability and validity assessment and
proficiency estimation
4. Standard-setting methods
5. Increased emphasis on diagnosis, decision making, and
criterion-referenced interpretations
6. Improved training of teachers in the area of assessment
With these advances, CRT has been adapted and updated, making it a more
valuable testing tool.
Hambleton and Rogers (1991) provided further findings on item validity.
Unlike NRT, where items are selected at a moderate difficulty level (p-values
between .30 and .70), they highlighted calculating item validity through expert

58
judgments or a measure of the item’s difficulty and discrimination. Hambilton
provided examples of test item review forms in Validating the Test Score
(1984, 1990). These review forms can be altered to meet the needs of various
item construction panels.
Millman linked the term criterion to domain, specifying each test item of
a certain behavior to a specific domain. Within test design, he emphasized
three domains in which test items can be divided: (1) curricular domain, (2)
cognitive domain, and (3) criterion domain (Millman & Greene, 1989). The
curricular domain is defined as, “the skills and knowledge intended or
developed as a result of deliberate instruction on identifiable curricular content”
(p. 336). A test of this type administered after instruction would yield a
measurement of the examinee’s proficiency within that curriculum domain.
The cognitive domain is defined as, “a circumscribed set of cognitive skills
usually derived from theory…but not from specific curricula or instruction…test
inferences in this domain emphasize examinee status vis-à-vis cognitive skills
that underlie or cut across other domains” (p. 337). Tests constructed in the
cognitive domain include certification licensing tests that are usually made up
of minimum-competency skills essential for adult functioning. The last domain
is the criterion domain and is defined as, “the knowledge, skills, and behaviors
needed for successful performance in the criterion setting” (p. 337). These
types of test could be used to predict the future behavior of the examinee.
According to Popham (1993), confusion surrounding the word criterion
in CRT remained prevalent in the field with its association to the word level.
Like Millman, he stressed the point that criterion refers to domain of criterion
behaviors. This is more commonly referred to as a measurement of a
student’s ability in a specified criterion behavior. While not necessarily a

59
characteristic of CRT, cutoff scores measuring proficiency can be determined
from CRT.
There are advantages to using CRT, specifically the benefit that
collected data can be compared to NRT. The data acquired through the use of
CRT is more meaningful than that of the NRT cutoff score. According to
Popham (1984), if a criterion-referenced examination has two main
characteristics, (a) explicit test specifications and (b) congruent test items,
then a more accurate interpretation of an examinee’s performance can be
determined. Other advantages of CRT include assessing competency on a
certification exam, program evaluation, and monitoring progress and/or
deficiencies of an individual in an objective-based instructional program
(Hambleton, Swaminathan, Algina, & Coulson, 1978).
Developing Criterion-Referenced Tests
Different psychonometricians specializing in the field of testing and
assessment have developed multiple techniques or guidelines to develop
criterion-referenced items. The underlying principle prominent in these
theories is summed up by the work of Mehrens and Lehmann (1987). They
noted three main characteristics of tests that should be identified when
developing or choosing a criterion-referenced examination. They are:
1. Test items are free from irrelevant sources of difficulty
2. Content domains are specified and items generated from
that domain are representative of the domain being sampled
3. Test is short enough so that it is not time-consuming, yet
long enough so that a valid score can be obtained (p. 245)
Guidelines were established to conduct criterion-referenced testing.
Glaser (1963) was among the first to discuss the use of CRT in systematic

60
instruction. He tied the role of test scores to the adequacy of teacher
performance and student performance. Popham (1993) highlighted the work
of Glaser and provided a set of guidelines to follow when constructing
criterion-referenced measurements. His procedure focuses on two main
considerations: (1) test specification and (2) test-item specifications. Test
specifications are described as, “rules to be followed in constituting the overall
nature of the test.” Test-item specifications are, “the rules to be followed in
constructing the test items” (Popham, 1993; p. 138).
Similar to Popham, Roid and Haladyna (1982) described a five-step
process as ideal for developing CRT. The five steps are: (1) instructional
intent, (2) specifying the domain, (3) item development, (4) item review, and
(5) test development.
Foley (1973) provided guidance on determining instructional intent
based on task analysis procedures. Popham (1975) provided input on the
utility of objectives and expanding objectives to include elements of the
specified domain.
More recently, Shock and Coscarelli (1998, 2000) developed a 13-step
systematic model to follow when designing CRT for certification or mastery
purposes, as shown in Figure 2.3. While their work focuses on the technical
and legal guidelines for corporate training and certification, the process is one
that could crossover into developing certification tests in the educational field.
By changing step one from analyze job content to analyze curriculum content,
their version of the criterion-referenced process for corporate certification is
adapted to meet the needs of educational certification.

Fig
ure
2.3.
Des
igni
ng C
riter
ion-
refe
renc
ed C
ertif
icat
ion
Tes
ts
Not
e. A
dapt
ed fr
om C
riter
ion-
Ref
eren
ced
Tes
t Dev
elop
men
t: T
echn
ical
and
Leg
al G
uide
lines
for
Cor
pora
te T
rain
ing
and
Cer
tific
atio
n (2
nd e
d., p
. 37)
, by
S. S
hroc
k an
d W
. Cos
care
lli, 2
000.
© In
tern
atio
nal S
ocie
ty fo
r P
erfo
rman
ce
Impr
ovem
ent.
Rep
rinte
d w
ith p
erm
issi
on o
f the
Inte
rnat
iona
l Soc
iety
for
Per
form
ance
Impr
ovem
ent,
ww
w.is
pi.o
rg
An
aly
ze
job
co
nte
nt
Est
ablis
h co
nten
t va
lidit
y of
ob
ject
ives
Cre
ate
Co
gn
itiv
e
Item
s
Cre
ate
rati
ng
inst
rum
ents
Est
ablis
h co
nten
t va
lidit
y of
it
ems
Co
nd
uct
init
ial
test
pil
ot
Do
cum
ent
Pro
cess
Perfo
rm
item
an
al y
sis
Cre
ate
par
alle
l
form
s
Set
cu
t-of
f sc
ore
Rep
ort
Sco
res
Est
abli
sh
reli
abil
ity
of
cog
nit
ive
Est
ab
lish
inte
r-r
ate
r
reli
ab
ilit
y
61
62
Item Construction
Generating Criterion-Referenced Test Items
When designing criterion-referenced measurements, emphasis is
placed on the item construction procedure of the test design. When CRT
began its popularity in the 1960s, the Instructional Objective Exchange (IOX)
specialized in using the objectives-based approach to develop criterion-
referenced measurements. They sought the help of two experts in CRT, Wells
Hivey at the University of Minnesota and Jason Millman at Cornell University.
Hivey had developed the use of item forms as the typical way to specify how
to develop a test item (Hivey et al., 1968). These forms, however, were seen
as too detailed and not enough item writers would employ the time to use
them. Since item forms were too specific for CRT, IOX engaged in the use of
amplified objectives. The amplified behavioral objectives were not precise in
CRT design and they, too, were not widely used by item writers. IOX found
success by delimiting the behavioral objectives and developing test
specifications. According to Popham, there were four to five specifications:
1. General Description -- A brief overview of the attribute being
measured. This can be anywhere from one sentence to a
paragraph long.
2. Sample Items -- An illustrative test item for the test.
3. Stimulus Attributes -- The rules to be followed in constructing the
stimulus segments of a test item.
4. Response Attributes -- The rules to be followed in (a)
constructing the response segments of a selected-response test
item or (b) scoring an examinee’s response to a constructed-
response test item.

63
5. Supplement (optional) -- Appendix, or supplement employed for
tests in which substantial amounts of content need to be
identified (p. 139).
These developed the most specific items to measure what a student can or
cannot do, but they also proved to be lengthy and time consuming and were
not used properly by item writers and teachers.
Aside from the procedural methods to develop test items, theoretical
approaches were also explored to develop test items. Guttman (1959),
Guttman & Schlesinger (1967), Castro & Jordan (1977), and Berk (1978)
developed the theory of mapping sentences based on the Structural Facet
Theory (Guttman, 1959; Foa, 1968). Mapping Sentences is similar to
developing item forms: They are written with variable elements (facets)
defining the variations in wording items to create parallel sentences. Unlike
item forms that have a formal verification step by a team of experts, mapping
sentences uses cluster analysis or small-space analysis to verify items. The
mapping sentences technique is primarily used to generate items in the
achievement domain. Engle and Martuza (1976) and Berk (1978) developed
six steps in creating an item based on facet design using the instructional
objective as the basis for mapping sentences. They are as follows: (1) Select
an instructional objective, (2) list instructional materials, (3) develop an
amplified objective, (4) generate a mapping sentence (See Table 2.1), (5)
generate the item facet structure, and (6) write the item.

64
Table 2.1 Mapping A Sentence for Measuring a Skill
With the aid of a soil textural triangle, students will be able to determine if the soil texture is classified as a Facet 1
{loamy sand sandy loam loam silt loam silt sandy clay loam clay loam silty clay loam sandy clay silty clay clay}
based on the percent by weight of Facet 2 {sand and silt sand and clay silt and clay}.
With the use of facet design to map sentences, an item writer can
generate multiple questions systematically based on one instructional
objective. In generating multiple-choice test items based on facet design,
there is more contiguity among the distractors generated; and the relationship
between the distractors and the stem is sounder. There are, however, some
limitations in using facet design and sentence mapping to generate test items.
One is that it is difficult for test writers to generate items in a certain content
area when there is no prior knowledge in that specific area. Another is a lack
of agreement among item writers as to their perception of what the facets
should be (Roid & Haladyna, 1982).
Another approach to develop items based on theories of teaching and
learning is testing concepts, rules, and principles (Markle & Tiemann, 1970;

65
Tiemann & Markle, 1983). Tiemann and Markle developed a training package
based on three basic ideas:
1. Students must learn to discriminate between examples and
non-examples of a concept.
2. Students must generalize from teaching examples to a
broader set of examples.
3. Testing the understanding of concepts must include both
examples and non-examples different from those used in
teaching concepts (Roid and Haladyna, 1982; p. 58).
This technique could be applied to almost any discipline; and training
workbooks provide rules and principles to develop proper questions.
The last well-known theory to developing criterion-referenced
measurements is the factor-based construction method (Guliford, 1967;
Meeker, Meeker & Roid, 1985). Based of Guliford’s (1967) Structure-of-
Intellect (SOI) model, 90 cognitive abilities are identified. Items are generated
from the subsets of the 90 abilities to measure student ability. Through the
use of factor-analysis, criterion-referenced items can be generated. SOI
Systems has continued to generate tests based on this method in general
education, reading instruction, remedial education, gifted education, training
and retraining, career counseling, and math (SOI Systems Structure of
Intellect, n.d.).
Even though there have been advances in testing since the origin of
CRT, there is still no concrete “rule book” that instructs the item developer on
how to generate criterion-referenced measurements. Hambleton and Rogers
(1991) noted that there are no guidelines setting the (1) optimal number of
items for each objective, (2) common cut-off scores, or (3) level of mastery vs.

66
non-mastery. Given this, Hambleton and Rogers stressed specifying content
domains for each objective by following the suggestions made by Popham
(1984). Each objective should have (1) a description, (2) a sample test item,
(3) a content description, and (4) a response description (Hambleton &
Rogers, 1991; p.8). In a review of the literature on CRT, Hambleton and
Rogers (1991) offered the most detailed steps for preparing criterion-
referenced tests (See Table 2.2).
Table 2.2 Steps for Preparing Criterion- Referenced Tests
Step Specific Detail
1 Preliminary
Considerations
a. Specify purpose of the test.
b. Specify objectives to be measured
by the test.
c. Specify groups to be measured,
special testing requirements.
d. Make initial decisions about item
formats.
e. Determine time and financial
resources available for test
construction and production.
f. Identify and select qualified staff.
g. Specify an initial estimate of test
length.

67
Table 2.2 (Continued)
2 Review of Objectives a. Review the descriptions of the
objectives to determine their
acceptability.
b. Select final group of objectives to be
measured on the test.
c. Prepare item specifications for each
objective and review them for
completeness, accuracy, clarity, and
practicality.
3 Item Writing a. Draft a sufficient number of the
objectives to be measured on the
test.
b. Enter items into a computerized item
bank.
c. Carry out item editing.
4 Assessment of content
validity
a. Identify a group of judges and
measurement specialist.
b. Review the test items to determine
their match to the objective, their
representativeness, and their
freedom from bias and stereotyping.
c. Review the test items to determine
their technical adequacy.
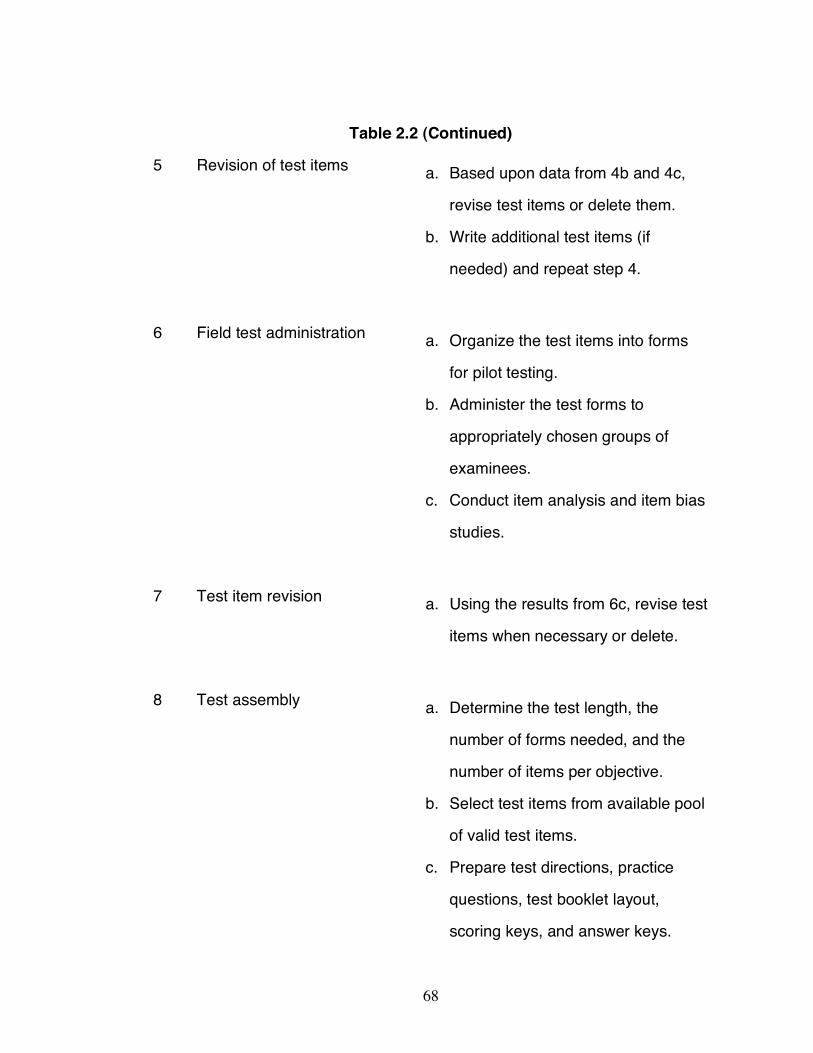
68
Table 2.2 (Continued)
5 Revision of test items a. Based upon data from 4b and 4c,
revise test items or delete them.
b. Write additional test items (if
needed) and repeat step 4.
6 Field test administration a. Organize the test items into forms
for pilot testing.
b. Administer the test forms to
appropriately chosen groups of
examinees.
c. Conduct item analysis and item bias
studies.
7 Test item revision a. Using the results from 6c, revise test
items when necessary or delete.
8 Test assembly a. Determine the test length, the
number of forms needed, and the
number of items per objective.
b. Select test items from available pool
of valid test items.
c. Prepare test directions, practice
questions, test booklet layout,
scoring keys, and answer keys.

69
Table 2.2 (Continued)
d. Specify modifications to instructions,
medium of presentation or examinee
response, and time requirements
that may be necessary for special
needs examinees.
9 Selection of a standard a. Determine if description of examinee
performance or determination of
mastery status is appropriate for test
purpose(s). (If descriptions are the
primary use, go to step 10.)
b. Initiate a process to determine the
standard to separate “masters” from
“nonmasters”. Alternatively, more
than one standard can be set, if
needed.
c. Specify considerations that may
affect the standard(s) when applied
to handicapped examinees.
d. Specify “alternative” test score
interpretations for examinees
requiring modified administration.
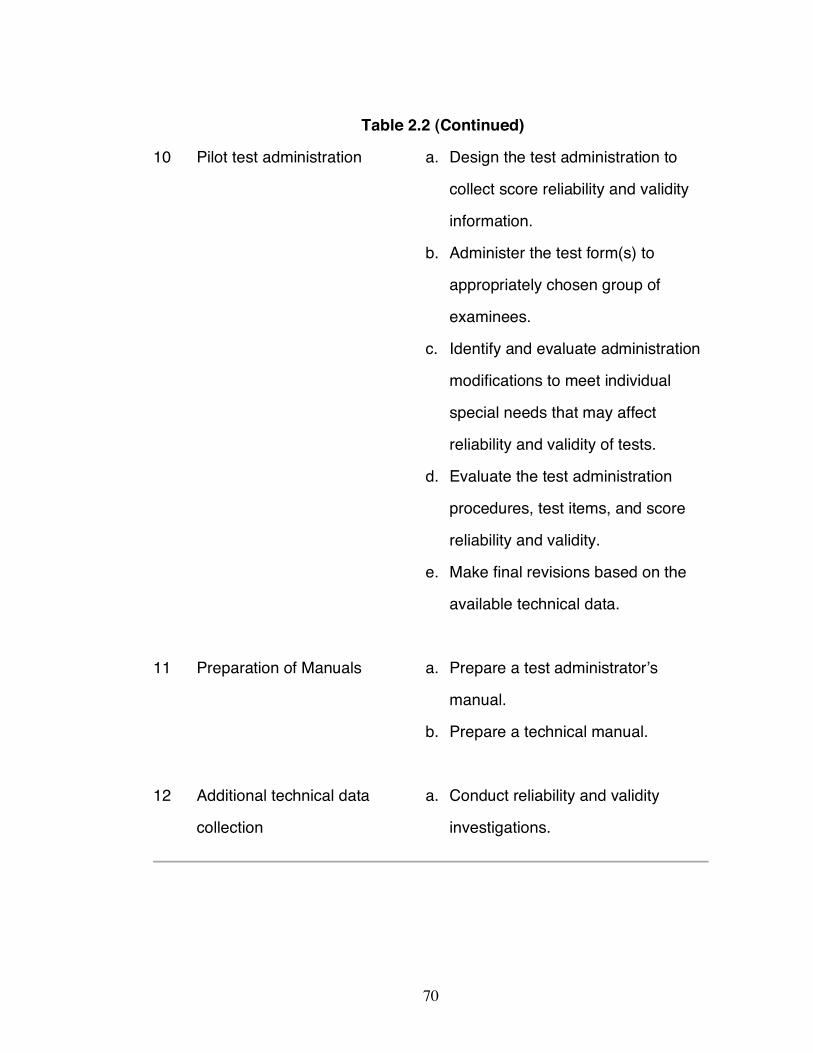
70
Table 2.2 (Continued)
10 Pilot test administration a. Design the test administration to
collect score reliability and validity
information.
b. Administer the test form(s) to
appropriately chosen group of
examinees.
c. Identify and evaluate administration
modifications to meet individual
special needs that may affect
reliability and validity of tests.
d. Evaluate the test administration
procedures, test items, and score
reliability and validity.
e. Make final revisions based on the
available technical data.
11 Preparation of Manuals a. Prepare a test administrator’s
manual.
b. Prepare a technical manual.
12 Additional technical data
collection
a. Conduct reliability and validity
investigations.

71
Note. Adapted from “Advances in criterion-referenced measurement,” by R.
Hambleton and H. Rogers, 1991, Advances in Educational and Psychological
Testing, pp. 10-11.
Generating the Multiple-choice Item
Characteristics of quality of multiple-choice tests.
Multiple-choice (MC) items were introduced in the Army Alpha Test of
1917. In 1926, the first Scholastic Aptitudes Test (SAT) was administered
consisting of MC questions. With the invention of the optical scanner, the use
of MC testing increased due to the quick turnaround time between test
administration and a final test score. This led to large-scale assessment
programs primarily consisting of MC formats, which is seen in almost every
state today (Rodriguez, 2002).
Multiple-choice testing is a form of selected-response used to measure
knowledge. This type of format is regarded as more difficult to develop when
compared to constructed-response testing, such as writing an essay question
(Haladyna, 1994). However, the ease of test construction is aided with the
use of computerized item banks and modern technology. Multiple-choice tests
are simple to administer and easier to score with the help of answer overlays
or optical scoring machines. There is little need to decipher student
penmanship (Coffman, 1971). With the development of item analysis theories
and software, results of MC exams are now easier to analyze. Such
applications measure the probability of guessing and the reliability of items,
among other things.
Validity of MC exams is determined through three main concepts: (1)
content sampling, (2) higher level thinking, and (3) recognition versus
production (Messick, 1989). In regard to content sampling, in a short period of

72
time more test items can be administered, providing a larger sample. In
regard to higher-order thinking, MC testing was once stereotyped as a test
format measuring only lower-order thinking, such as recall or facts; however,
MC tests have been proven to measure higher-order thinking if constructed
properly (Bennett, Rock, &Wang, 1990; Haladyna, 1997). Lastly, the issue of
recognition versus production is still debated. Some test critics believe the
process students go through during MC exams is different from constructed-
response exams (Fiske, 1990; Nickerson, 1989). They argue that picking the
right answer is a different process than constructing the right answer. They
question whether MC testing produces invalid results, or rather less conclusive
results, than constructed-response exams. Bridgemann and Rock’s (1992)
study on college admittance testing, however, found otherwise; and other
studies that compare essay exams and MC tests also show a high correlation
between the two as student measurement tools (Bennet, Rock, & Wang, 1990;
Bracht & Hopkins, 1970; Bridgeman & Rock, 1993; Heim & Watts, 1967;
Joorabchi & Chawhan, 1975; Patterson, 1926; Traub & Fisher, 1977; Traub,
1993; Ward, 1982).
Technology for generating multiple-choice test items.
There is no one approach to generating MC items with theoretical
underpinnings (Guttman, 1969). Rather, there are numerous guidelines, rules,
and recommendations based on empirical studies (Bormuth, 1970). Roid and
Haladyna (1982) addressed the need for item writing that connected teaching
and testing. Traditionally, item writers heavily influenced characteristics of
items (Bormuth, 1970). Roid and Haladyna (1982) provided guidance on
methods that were based on the systematic relationship of instruction and
evaluation that could be used by all.

73
Haladyna and Downing (1989a) analyzed 46 references based on
developing MC items. They conducted a second study analyzing 90 research
studies pertaining to the validity of item writing rules (Haladyna & Downing,
1989b). Through their extensive investigation they provided guidance for
developing and validating MC items (Haladyna, 1994). Halaydyna (1994,
2004) focused on four aspects of multiple-choice development: (1) foundations
for multiple-choice testing, (2) development of multiple-choice items, (3)
validity evidence arising from item development and item response validation,
and (4) the future of item writing and item response validation (pp. v-vi).
Popham (1990) provided a set of guidelines for creating selected-
response items related to a practitioner’s perspective and focused on the
obstacles to good item writing, MC dividends and deficits, and specific MC
guidelines:
1. The stem should present a self-contained question or
problem.
2. The stem should contain as much of the item’s content as
possible.
3. If possible, avoid negatively stated stems.
4. Be sure that only one alternative represents the correct or
best answer.
5. Each alternative should be grammatically consistent with the
item’s stem.
6. Avoid creating alternatives whose relative length provides an
unintended clue.
7. Make sure all alternatives are plausible.

74
8. Randomly use each alternative position for correct answer in
approximately equal numbers (pp. 238-243).
Popham (2003) also offered item-writing guidelines for MC items
developed from the work of Haladyna (1999) and similar to his previous work.
He focused on the advantages and disadvantages of MC items and basic
rules of construction for all test writers, not just those whose profession is test
writing.
Test Validity
Validity refers to, “the degree to which evidence and theory support the
interpretations of test scores entailed by proposed uses of the test…it is the
most fundamental consideration in developing and evaluating tests (AERA,
APA, & NCME, 1999; p. 9). Historically, validity has been approached as a
tripartite scheme, categorizing validity evidence into construct, content, and
criterion. This was not always the case; and it was updated in 1999. In the
first edition of Standards (APA, 1954) there was no criterion validation.
Instead, there were two other areas representing criterion validation: (1)
predictive and (2) concurrent. This was changed in the second edition of
Standards published in 1966 (APA), where validity was referred to as
construct, content, and criterion. These three facets of validity were most
representative in measurement texts from the 1960s to the 1990s (e.g., Aiken,
1994; Anastasis, 1988; Cronbach, 1990; Ebel & Frisbie, 1991; Gronlund &
Linn, 1990; Hopkins, Stanley, & Hopkins, 1990; Mehrens & Lehmen, 1991;
Popham, 1990; Sax, 1989).
Not all practitioners agreed with these three evidences of validity. As
far back as 1957, Lovevinger (1957) argued that this scheme (then a four-part
scheme) was not logically distinct and the evidences did not have equal

75
importance. Based on her research, content, predicative and concurrent
validity all support construct validity. For her, the only scientifically sound type
of validity was construct validity. Her arguments were not reflected in the
pedagogical literature of the time as they were based in the context of science
rather than measurement.
Messick (1975) revisited the arguments of validity, emphasizing the
centrality of construct validity. He expanded the concept of construct validity
to include the social consequences of test use. He emphasized two questions
that need to be addressed whenever decisions about testing are made:
First, is the test any good as a measure of the character it is
interpreted to assess? Second, should the test be used for the
proposed purpose? The first question is a technical and scientific
one and may be answered by appraising evidence bearing on the
test’s psychometric properties, especially construct validity. The
second question is an ethical one, and its answer requires an
evaluation of the potential consequences of the testing in terms of
social values (p. 962).
While the issue of validity gained attention in the educational and
psychological measurement field (e.g. Cronbach, 1980; Guion, 1974) it was
not reflected shortly thereafter in the 1985 version of Standards (AERA, APA,
& NCME, 1985). Continuing the use of the three-part framework for
measurement fields meant the process could not move forward; steps to
improve test validity were haltered (Messick, 1989). Cronbach agreed with the
work of Messick, recommending similar approaches on the centrality of
construct validity and the social consequences of testing. He focused on the
functional, political, operational, economical, and exploratorical consequences

76
of assessment (Cronbach, 1988). Cronbach (1988, 1989) offered advice for
assessing the consequences of test uses and interpretations. In his most
recent text (1990) he offered some techniques pertinent to construct validity:
1. Inspecting items…
2. Internal correlations…
3. Stability of scores…
4. Administering the test to individual who think aloud…
5. Varying test procedures experimentally…
6. Trying to improve scores…
7. Correlation with practical criteria…
8. Correlation with other tests…
9. Studies of group differences… (pp. 181-182)
In the later edition of Standards (1999) arguments against validity
represented by a three-part scheme were partially addressed. That edition
referred to types of validity evidence rather than the three distinct types of
validity. The traditional nomenclature (i.e. content validity, predictive validity,
etc.) was not utilized. Rather, the 1999 Standards focused on evidence based
on: test content, response processes, internal structure, relations to other
variables, and consequences of testing. It provided standards for integrating
the types of validity evidence.
Item Validation
Writing the test item does not produce an item ready to be tested until it
is validated. Hambleton and Rogers (1991) provided three features to focus
on when reviewing a CRT item’s content: (1) item validities, (2) technical
quality, and (3) representativeness (p. 18). While these were for CRT tests,
the same rules can be applied to a multiple-choice question, since these types

77
of questions can generate a CRT test. These three guidelines were based on
expert judgment to, “assess the degree to which the sample of items in the
test is representative of some defined domain (Hambleton & Rogers, 1991; p.
18). Haladyna (1994) offered three main characteristics that pertain to item
validation: (1) a review of the test item from item development procedures, (2)
an analysis of the statistical study of item responses, and (3) a summary of
using item response patterns to study specific problems in testing.
Reviewing Multiple-Choice Items
It is important for items to go under review to check for flaws. Messick
(1989) emphasized the importance of reviews. He noted that all items must
be reviewed for factors that would impact the degree of difficulty of the test, or
test biases. The importance of evidence gained through review of content is
also supported by Standards (AERA, APA, NCME, 1999). Haladyna (1999)
emphasized that all items must go under review for content, item writing
violations, and grammatical errors. The Standards (AERA, APA, NCME,
1999) lists six standards applied to item development.
According to Haladyna, “the central issue in content review is
relevance” (1994; p. 133). Reviewing for relevance is represented as a large
number of expert judgments dominating validity studies (Popham, 1993).
Experts are used to ensure that items are relevant to the domain being tested
and identifiable in terms of content. In the field, there is not much systematic
information informing test developers on how to review items (Messick, 1989).
Hambleton (1984b) provided a summary of methods used to validate items.
When reviewing items he advised the consideration of three main features: (1)
item-objective congruence, or how well the content reflects the domain from
which it was derived, (2) technical quality, and (3) bias (p. 207). There have
78
been multiple techniques established for reviewing item-objective congruence
based on large-scale assessments to small classroom assessments.
Examples of techniques include the use of empirical techniques similar to
norm-referenced testing, expert judgment used to calculate the index of item-
objective congruence, a rating of item-objective match on a five-point scale
conducted by experts, and the use of a matching task (Hambleton, 1984).
[See Rovinelli & Hambleton, 1977 On the use of content specialist in the
assessment of criterion-referenced test item validity for more information on
the index of item-objective congruence]. A thorough technical review of each
item should also reveal content bias. Hambleton (1994) provided technical
review forms and a judges review forms. Berk (1984) provided an item review
form used to detect bias when conducting as item analysis.
Analyzing Item Responses
Once items have been administered to a sample of students, the results
of the testing can be analyzed using statistical methods. Traditionally classical
test theory procedures have been used to analyze test results. More recently,
item response theory (IRT) methods have gained popularity in the testing field,
specifically in the use of large standardized testing programs like the SATs.
When used properly, IRT methods can produce better statistical analysis of
items, allowing more accurate results to be generated.
Classical Test Theory
Analyzing item response through the use of classical statistics requires
various parameters of data to be collected as evidence for the validity of
criterion-referenced examinations. Researchers (Crocker & Algina, 1986)
examined these characteristics and categorized them into the following:

79
1. Indices that describe the distribution of responses to a single
item (i.e. the mean and variance of the item responses),
2. Indices that describe the degree of relationship between
responses to the item and some criterion of interest, and
3. Indices that are a function of both item variance and
relationship to a criterion (Osterlind, 1989; pp. 273-274).
Common statistics used to describe these parameters include p-values,
item discrimination, such as point-biserial correlation coefficient, alpha
coefficient, and variance. With the use of this data, feedback can be provided
to test designers on the validity and reliability of the test, allowing changes as
needed.
Lord and Novick (1968) introduced classical theory approaches to the
behavioral sciences, noting the differences from application to the physical
sciences. They introduced the classical linear model and its application to
estimating parameters of the latent trait variables. Some estimates of
parameters of the classical model highlighted by Lord and Novick were true
score and error variances. True score is a calculation of the measurement
error subtracted from the observed score. Measurement error can be reduced
during the item construction phase, producing better quality items (Osterlind,
1989).
The proportion correct index, or p-value for dichotomously scored items,
is a proportion of the examinees that answered an item correctly. This index
represents the level of difficulty based on the particular group of examinees to
which the test was administered. The p-value is sample dependent and varies
when groups of different ability levels are administered the same examination.
This can be remedied by sampling from a large and diverse population to get

80
representative ability levels. P-values for single items can be calculated and
provide evidence of item performance relative to a group of examinees. They
can reveal to the test writer the quality of the items and whether the items
contain flaws that should be remedied. The p-value can also allow the test
developer to administer a test with items of the same difficulty level. Item
difficulty is determined by looking at the ability levels generated. Gulliksen
(1945) concluded on the basis of a theoretical analysis that, “in order to
maximize the reliability and variance of a test the items should have high
intercorrelations, all items should be of the same difficulty level and the level
should be as near 50 percent [p-value = 0.5] as possible” (p.80). Ebel (1979)
determined levels and distribution of difficulty recommending that an ideal
multiple-choice item for testing should be around 62.5% (p-value = 0.625).
Item discrimination is another parameter calculated using classical
statistics methods that contributes to an item’s reliability. Item discrimination is
the relationship between the performance of an item and the ability of the
examinee. It is based on the assumption that examinees with higher levels of
ability will respond correctly to the items with a higher level of difficulty. This
also leads to the assumption that examinees with lower levels of ability will not
get the items with higher levels of difficulty correct. If all examinees get the
item correct, then the item does not discriminate among examinees, offering
no information about the level of discrimination.
Item discrimination can be calculated using three main methods: (1)
point-biserial measurement of correlation, (2) biserial estimate of correlation,
and (3) phi-coefficients. The point-biserial measurement is the association
between a single item and a total test score. Using the point-biserial estimates
along with the corresponding p-value of items sorted by difficulty allows test

81
developers to choose items with a given range of difficulty and discrimination.
Point-biserial measurements do have disadvantages when it comes to
calculating discrimination indexes. The item being score contributes to the
total test score, slightly skewing data. There are computations that can
remedy these problems, which are typically used with small data sets needing
precise calculations (Allen & Yen, 2001; Henrysson, 1963; Nunnally &
Bernstein, 1994; Thorndike, 1982).
The biserial estimate of correlation is another statistic used to calculate
item discrimination. It is similar to the point-biserial correlation; however,
instead of one of the variables being dichotomous, both variables are
assumed to be continuous. The biserial range of discrimination is –1 to +1,
better discriminating examinee ability. This method is preferred over point-
biserial correlations when considering items at high difficulty ranges.
The phi coefficient is similar to the biserial estimate ranging from –1 to
+1. Its main use is to determine the degree of association between the item
and another demographic characteristic of the population (i.e. gender, race).
Aside from using the phi coefficient to look at associations between
demographics and items, it also can be used with pre- and post-instructed
groups. This technique has its flaws based on the fact that it is derived from
the Pearson coefficient of correlation and is expressed in a standard score. If
p-values for two groups are equal, the phi-coefficient will always be +1.
Classical test theory statistics can also be used to determine values of
reliability. Through the use of internal consistency methods such as split
halves and item co-variance, estimates of item and test reliability can be
determined. When using split-half procedures, items on a single test are split
into two parts. Each half is scored separately with examinee and correlation

82
coefficients calculated. Since the value underestimates the reliability of the full
test, procedures such as the Spearman Brown prophecy formula are used to
correct that estimate. Similarly, other split-half methods developed by Rulon
(1939) and Guttman (1945) can also be used to estimate reliability of the full
test. Cronbach (1951) noted that all these split-half methods produce the
same results. However, Brownwell (1933) cautioned users of such methods
due to the multiple ways tests could be split into two subsections, resulting in
different reliability estimates.
Problems were found with split-half methods to estimate an internal
consistency score based on a single sample. Various methods were
developed in the 1930s and ’40s to surmount the problems associated with
previous methods. The three most popular were the Kuder Richardson 20,
Cronbach’s alpha, and Hoyt’s analysis of variance. All three can be used to
calculate the coefficient alpha.
The Kuder Richardson- 20 (KR 20) was developed by Kuder and
Richardson (1937). It is used solely with dichotomously scored items. The KR
20 formula calculates the variance of each item and then takes the sum of all
the variances. This value is then divided by the total variance of the test and
subtracted from 1, as seen in Equation 2.1.
(2.1)
where: k = the number of items on a test
!! x2 = total test variance
pq = variance of item i
KR20 =
K
K!1 1!pq"
#! x2
$
%&&
'
())

83
Derived from this formula is a simpler formula known as the KR 21.
This formula is used under the assumption that all items are of the same level
of difficulty. The variances for individual items do not need to be calculated,
see Equation 2.2.
(2.2) (2.2)
where: k = the number of items on a test
!! x2 = total score variance
µ! = the mean total score
When using either the KR 20 or the KR 21, when items are not of the
same difficulty, it is beneficial to report both results. This is due to the fact that
the KR 21 results will produce lower estimates of the coefficient alpha than the
KR 20 formula.
The next method to calculate alpha based on item covariance is the
formula known as Cronbach’s alpha (1951), see Equations 2.3 and 2.4.
Equations 2.3 and 2.4 are the same with 2.4 taking the procedure one step
further. Unlike the KR 20 and KR 21, Cronbach’s alpha formula does not need
to be based solely on dichotomously scored items.
KR21 =k
k!11!
µ! (k!µ )"
k"! x2
#
$
%%
&
'
((

84
(2.3)
where: k = number of items on the test
si
2 = variance of item i
st
2
= total test variance
As the number of items on a test increases so does the alpha
coefficient. If the inter-item correlation is high, Cronbach’s alpha will be high.
The items are better at measuring the same underlying construct. If the inter-
item correlation is low, or if running this formula on multi-dimensional data,
Cronbach’s alpha will be low. To adjust for problems associated with multi-
dimensional data, a factor analysis can be conducted to determine which of
the items load highest on the dimension.
(2.4)
where: k = number of items
r = inter-item correlation
The last of the three methods is Hoyt’s method (1941). Hoyt developed
a method to estimate reliability that provided results identical to calculating the
coefficient alpha. Based on the analysis of variance, Hoyt’s coefficient is
! =k
k "1#$%
&'(1"
) si
2
st
2
#$%
&'(
! =k * r
1+ k "1( )* r

85
displayed in Equation 2.5. Hoyt’s coefficient is easily calculated with the aid of
statistical software.
(2.5)
where: MSperson = mean square taken from the analysis of
variance table
MSresidual = mean square for the residual variance
taken from the same table
Item Response Theory
Multiple-choice item development is a process involving more than just
writing test items to measure a certain level of cognition. As part of the
process items also must be validated through a review process, checking
characteristics such as content, bias, and distracters. Far too often emphasis
is given to the developmental stage of item construction and not the validation
stage. With the use of statistical calculations, we can measure psychometric
principles such as item quality and how it impacts test score reliability. Item
performance patterns such as item difficulty, item discrimination, and distractor
evaluation can be addressed with both classical test theory (CTT) and item
response theory (IRT) models.
Under CTT, item difficulty can be measured through the calculation of
p-values, the proportion of examinees that answered the item correctly. This
measure is highly influenced by the performance level of the sample of test
takers. Item discrimination is the product-moment relationship between item
and test performance. Guessing does not influence test scores if the test is
!!xx ' =MSpersons " MSresidual
MSpersons

86
long enough. Evaluating distractors and their relationship to test scores with
the use of CTT is rarely done (Wesman, 1971; Millman & Greene, 1989). The
use of CTT has its downfalls in evaluating item performance that can be
addressed through the use of IRT.
Advantages of item response theory.
IRT affords several advantages over CTT when analyzing items to
contribute to the reliability of tests:
1. Under IRT, item difficulty, “describes where an item functions
along the ability scale” (Baker, 2001: p. 7). When
determining the item’s difficulty, IRT estimates difficulty
without referring to the sample of students responding to the
items. With CTT, p-values are calculated based on the
sample. Samples including students who are highly trained
might produce a test with easy test items (p-value > .90) and
samples with under trained students might produce a very
hard test (p-value < .40). IRT allows item difficulty to be
estimated in an unbiased way.
2. Item discrimination is the correlation between the item and
test performance (-1.00 to +1.00). When determining item
discrimination IRT employs dichotomous and polytomous
scoring models. Discrimination is proportional with the slope
of the curve. With item response models test constructors
can better differentiate between samples of students with low
abilities (below the curve) and high abilities (above the
curve). CTT restricts the range of scores underestimating
the discrimination index.

87
3. Distractor quality can alter the performance on a test item.
IRT response models for multiple-choice items allow test
writers to identify poor performing items and revise and/or
omit them. This provides more statistics summaries then
one could obtain by solely using traditional frequency tables
(Baker, 2001).
Item response theory basics.
The aim of IRT is to understand and improve reliability of tests (Wainer,
1989). Reliability is the precision of measurement using the ratio of true and
observed score variance, equaling the test’s average ability. However, there
is fault in this definition due to the fact that reliability is not uniform across the
entire range of test scores. For example, students scoring at the high end of
the upper level of ability and students scoring at the low end of ability have
more variance in their standard error of ability. The scores centered near the
mean have less error. Error in this case is not equally distributed among the
distribution of scores.
In measuring latent traits, such as ability, item characteristic curves can
be modeled for each individual item, showing the item’s difficulty and
discrimination. While measuring this trait it is necessary to chart a student’s
ability, this scale can go anywhere from negative infinity to positive infinity with
a midpoint of zero and a unit measurement of 1. For practicality in scale
construction, the examples in this paper are limited to a range of –3 to +3
(Baker, 2001).
Examinees in a sample are given a numerical value based on their
ability in response to the item. This score is noted by the Greek letter theta,θ,
with a corresponding probability that the examinee has the ability to give a

88
correct answer, noted P (θ). Using the logistic function is an equation for the
two-parameter model, equation 2.6.
(2.6)
where: e is the constant 2.718
b = difficulty parameter, (-3<b<3)
a = discrimination parameter, (-2.80<a<2.80)
L = a(θ - b), is the logistic deviate (logit), and
θ = ability level
This value is typically small for those with low abilities and large for
those with high abilities. A three-parameter model takes into consideration the
contribution of guessing. Addition of the guessing parameter improves the fit
between item data and the model. Birnbaum (1968) modified this model to
take that factor into account. The equation for a three-parameter model is
seen in equation 2.7.
With this information an item characteristic curve (ICC) can be
constructed by plotting P (θ) as a function of ability. As the probability of
correct response rests near zero, then that denotes those of low ability. This
moves up as a smooth S-shaped curve as you approach those with high
ability. Two main characteristics can be determined by using the ICC: (1) the
difficulty of an item, and (2) item discrimination. Difficulty can be noted as a
location index of the curve, “an easy item functions among the low-ability
examinees and a hard item functions among the high-ability examinees”
(Baker, 2001:7) (see Figure 2.4).
P(!) =1
1+ e"L
=1
1+ e"a(!"b)

89
(2.7)
where: e is the constant 2.718
b = difficulty parameter, (-3<b<3)
a = discrimination parameter, (-2.80<a<2.80)
c = guessing parameter, and
θ = ability level
Figure 2.4 shows an item with the same level of discrimination but with
three different levels of difficulty. The curve labeled difficulty 1 shows that the
probability of a correct response is at a high-level for those with low abilities;
therefore, it is an easy test item. The difficulty 2 curve is an item with medium
difficulty, evenly distributed along the S-shape line. The line furthest to the
right, difficulty 3, is a hard item, with a low probability of a correct response
among high achievers (Baker, 2001).
Discrimination is noted by the slope of the curve around its middle
(average ability) and is a description of how well items differentiate between
ability levels. It answers the basic question, “To what extent does an item
discriminate between those who know the material and those who don’t”
(Ward, Stoker, Murray-Ward, 1996:58). The steeper the curve is around the
average level of ability, the higher level of discrimination. For example, see
the curve labeled high level displayed in Figure 2.5.
P(!) = c + (1" c)1
1+ e"a(!"b)

90
Figure 2.4. Item characteristic curve with three different levels of difficulty and
the same discrimination
The flatter curve around the average ability denotes a low level of
discrimination. This is the curve labeled low level in Figure 2.5. Therefore,
curves that increase more rapidly than others have a higher discrimination
level. If negative discrimination occurs, then there is discrepancy among the
test item. This shows that it was either a poorly written item or that high-ability
students were misinformed about the material generating the item. Item
difficulty and item discrimination are independent of one another.

91
Figure 2.5. Three item characteristic curves with the same difficulty but with
different levels of discrimination
When calculating ability scores, Hambleton and Swaminathan (1985)
listed four main steps to follow. They are as follows:
1. Data collection -- score examinee responses
dichotomously in a table for each examinee on each item.
2. Model selection -- Compare the fit of several models to
the test data. Select one of the models for use.
Consideration of model selection is as followed:
a. Should the model be chosen so that it fits the data
well or should the data be edited so that the data fit
the modeled desired?

92
b. Availability of the sample. Over 200 examinees, 2-
or 3-paramteter model; Less than 200 examinees
use 1-parameter model
c. Quality of the data
d. Available resources- cost of the different models,
availability of software
3. Parameter estimation -- Obtain item and ability parameter
estimates, using one of the common computer programs
(e.g. BICAL. LOGIST)
4. Scaling- Transform ability scores to a convenient scale.
With the generation of item response curves, estimation of item
parameters can be calculated by a curve-fitting procedure. Calculating
maximum-likelihood estimations and/or the chi-square goodness-of-fit of each
item characteristic curve model informs the test developer if the model chosen
was a good model to fit the data. When calculating a test characteristic curve,
information derived from the item characteristic curve model, the number of
items, and the value of item parameters are all factors used to calculate
examinees’ true scores. The formula for a true score is noted in equation 2.8
(Baker, 2001).
The use of item response theory principles can be applied to many
different types of models to help increase the reliability of items and tests.
Some of the more common models include the normal-ogive model (Lawley,
1943; Ferguson, 1942; Moiser, 1940, 1941), the Rasch or one-parameter
logistic model (Rasch, 1960), and Birnbaum’s two- and three-parameter

93
TSj = Pii=1
n
! (" j)
(2-8)
where: TSj is the true score for examinees with ability level θj.
i denotes an item, and
Pi (θj) depends upon a particular item characteristic
curve model employed
logistic model (Lord & Novick, 1968). These models have been further
developed to include models such as the rating scale model (Rasch, 1961),
the graded response model (Samejima, 1969), the partial credit model
(Masters, 1988), and multiple-choice models (Thissen & Steinberg, 1984).
The response model for multiple-choice items.
When constructing a multiple-choice test, data about item construction
and validation is beneficial to make the test more reliable. As part of the test
item validation process, reviewing the alternatives or distractors provides test
developers information in their analysis of test items. This analysis can help
describe the relationship between alternatives and the cognitive proficiency
being measured. The use of IRT is helpful in item analysis as it describes this
relationship. The original multiple-choice model was derived by Bock (1972),
which takes the multivariate logistic transformation of the nominal model to
analyze item parameters. This model was further developed by Samejima
(1979), which added a latent response category referred to as don’t know
(DK). Thissen and Steinberg (1984) extended the model further to include
trace lines for the incorrect alternatives on the item response model, see

94
equation 2.9. The multiple-choice model provides a graphical representation
of the performance of each item alternative. This analysis can be used to
review distractors, providing information to test constructors when analyzing
items.
(2-9)
where: T = Trace Lines; T(u = h) is a hypothetical type of probability
h = 1, 2,…, m, where m is the number of mc responses
k = the most correct response
a= slope parameter
c= intercept, relative frequency of the selection of each
alternative
Postscript
Three main topics related to assessment were reviewed in this chapter:
theories of assessment, policy issues related to assessment, and legislation
impacting assessment practices. A relationship -- sometimes casual,
sometimes direct -- exists among these topic areas. Taken together they
provide insight as to how high-stakes accountability testing gained its strong
foothold on the American educational landscape, and why political and
educational leaders consistently turn to such broad-based testing methods to
address real and perceived problems in public schools. The rationale for such
testing is driven by the American democratic ideal of an equal education for
T (u = h) =exp ah! + ch[ ]
exp ak! + ck[ ]k=h
mj
"

95
all. Such an ideal requires proofs along the way, and accountability testing
gives statistical, as opposed to anecdotal, evidences that students are
achieving required learning goals. This accountability system is dependent on
technological advances in distilling information, and research into test
development and test evaluation aimed at ensuring that testing methods
provide a true barometer of student and school performance. The cumulative
impact of this review indicates that accountability testing is a teaching tool that
when applied appropriately generates valuable information, useful in
evaluating individual students and broader educational groupings like classes,
schools, and districts. The challenge, as it applies to agricultural sciences
instruction, is to understand fully the strengths and limitations of accountability
testing as such a test protocol is considered for this field.

96
CHAPTER 3
RESEARCH METHODS
Under New York State Education Department (NYSED) guidelines, a
technical assessment system for student achievement, including an objective
test, is required for New York State (NYS) Agricultural Science Education. As
the state’s leading agricultural science teacher education program, Cornell’s
Department of Education was asked to develop the assessment system.
Since NYS’s agricultural science education programs are based on local
needs, the curriculum offered in local programs varies widely across the state.
However, even with such variability, the broad content areas outlined in the
Agricultural and Natural Resources (ANR) portion of the Career Pathways
model (see Figure 1.1) with the addition of an agricultural safety and an
agricultural foundations pathway appear to accurately reflect much of the
content of NYS agricultural education programs. Thus, the modified Career
Pathways ANR model was selected as the conceptual framework for the
objective test portion of the assessment system.
In the spring semester of 2004, the Agricultural Education Assessment
Project (AEAP) was initiated to construct that technical assessment system.
This study focused on one portion of the AEAP: to construct and validate
multiple-choice test items for two of the nine pathways -- plant systems and
animal systems. The results of this study are to be incorporated into the larger
AEAP project outcomes and the techniques developed in the current study will
be used to develop the remaining test item banks for the other career
pathways. Developing a complete item pool for all nine content areas was
well beyond the scope of this study.

97
Purpose and Objectives
The purpose of this study was to develop, validate, and field test
separate banks of test items for the Animal Systems and Plant Systems
content areas. The specific objectives of this study were to:
1. Develop an item construction protocol.
2. Organize technical teams of item writers.
3. Write draft items.
4. Validate items through expert judgment.
5. Pilot test items.
6. Analyze items based on statistical measures to provide further
evidences of validity and reliability.
Research Design
Item construction protocol
To achieve the goal of item construction contributing to evidences of
test validity a study involving the nature of criterion-referenced item
construction was needed. After extensive literature research, Haladyna’s
(1994) procedures and suggestions for developing multiple- choice items were
selected as the procedural protocols for item development.
Item Writing Panels
A team of item-writers was assembled consisting of eight content
experts for each team. The target representation for each team consisted of
three secondary agricultural science educators and one extension agent.
Nominations were solicited from Agricultural Education Outreach (AEO) staff,
LEAD NY staff, administrators from Cornell Cooperative Extension, and
science teacher educators from the Cornell teacher Education (CTE) program.

98
Nominees were invited to participate in a two-day tem construction and
validation workshop.
Instruction
The first day began with instruction on identifying the objective or
criterion for each domain of the core curriculum outlines, (see appendicies A
and B). Once domains for each area were thoroughly identified, participants
received instruction on the anatomy of a multiple-choice item and on basic
criterion-reference item construction techniques, (see appendix C), based on
the work of Haladyna, 1997, 1994; Halaydyna and Downing, 1989a; Roid and
Haladyna, 1982; Shrock and Coscarelli, 2000. These researchers provided a
set of guidelines to follow when writing multiple-choice items. Four main areas
were addressed in the instructions provided: (1) content guidelines, (2) style
and format concerns, (3) writing the stem, and (4) writing the options or
alternatives. The instructional phase was followed by the item construction
phase that went into the second day. The remainder of the second day was
used for item validation.
Item Construction
Participants were advised to bring with them any curriculum material
and resources that might assist them in writing items. During the initial item
construction phase, the expert panelists were instructed to specify the type of
student outcome per item tested: (a) knowledge, (b) mental skill, or (c) mental
ability. They were also asked to specify the type of content measured: (a) fact,
(b) concept, (c) principle, or (d) procedure. Finally, they were asked to specify
what type of behavior the questions were attempting to develop: (a) recall, (b)
understanding, (c) critical thinking, or (d) problem solving. An item set

99
template, (derived by Haladyna, 1994; p. 69), contained descriptions of these
three criteria and the panelist completed a template for each item, (see
Appendix C).
Validation
The remaining section of the workshop focused on item validation. To
measure the results of criterion validity and construct validity of these items,
mixed methods were used to elicit expert judgment and feedback from the
panelists themselves. A Likert-type scale was used to judge each item on the
degree to which the item matched the domain it was intended to measure, the
type of content and behavior measured, and whether the item needed revision.
Each item was reviewed by two panel members, neither of whom was involved
in the initial draft of the item. Each item was scored on a Likert-type 5-point
scale, with 1 being of poor quality and 5 being of high quality. If a judge rated
an item less a 5, he or she was instructed to indicate the deficiencies of the
item and what could be done to revise the item. A copy of the evaluation
sheet can be found in Appendix D. After each item was judged twice, each
group reconvened and reviewed the items based on the judges’ comments.
As a group they had the power to alter any items as needed before the items
went to an editorial review. Upon completion of the group task the workshop
ended and the participants were free to leave.
Once all items were collected, they were sent to a professional test
specialist for an editorial review and a final item revision. Items were reviewed
based on the following criteria established by Haladyna and Downing (1989b),
updated by Haladyna (1994), (see Appendix E).

100
Aside from expert judgment, quantitative methods were also used to
analyze the validity of items after the items have been piloted. By using
classical test theory procedures, evidence was provided about the difficulty of
the item and the item discrimination. The frequency of alternatives of each
item was calculated and that information was considered in determining
whether the questionable items should be revised or omitted based on the
evidence derived from the data. The data were also analyzed using item
response theory (IRT) models.
Item Pilot
Once all items were reviewed, the item pools were piloted at different
agricultural science programs throughout the state based on their individual
curricula- plant systems or animal systems. Examinees consisted of students
enrolled in agriculture grades 9-12. Pilot testing took one month with nine
different programs participating. The identity of all students participating
remained confidential. The only demographics collected were gender and
grade level. The scores were not reported back to the teacher and were used
only for the purpose of item analysis. The test booklets were collected at the
end of each test pilot and the teachers were not allowed to keep or make
copies.
Item Analysis
Analysis and revision of items took approximately two months. Item
analysis consists of seven main steps using classical test theory procedures.
Item response theory methods were also used to calculate item difficulty,
discrimination and guessing parameters. The steps are as follows:
Step 1- Code data dichotomously and enter into SPSS and MultiLog 7.
101
• Data was coded two ways for analysis- dichotomously with a
missing answer being coded independently from the correct and
incorrect options and forced dichotomously with a missing
response being coded as an incorrect response. All data was
entered into SPSS, the application used to calculate descriptive
statistics based on CTT.
• IRT- Data was also entered into MultiLog 7 (Thissen, Chen, &
Bock, 1993), an application used to calculate descriptive
statistics and graphical representation of the items based on IRT
models.
Step 2- Calculate Item Difficulty Index
• CTT- p-values calculated using SPSS descriptive statistics
option. The p-value for each item was calculated by the number
of correct response divided by the total number of responses. It
was calculated including all the data and then recalculated
leaving the missing data out of the equation.
• IRT- fit data to a one-, two-, or three- parameter model
depending on which model best fit the data. Used maximum
likelihood procedures of test calibration ran on MultiLog 7. Steps
2-4 were done simultaneously.
Step 3- Calculate Item Discrimination Index
• CTT- rpb point-biserial correlation relationship between item and
test performance was calculated. This was calculated using the
dichotomously scored data for each item and the total test
scores of each student. Calculations were done twice-- once

102
including all the data and then recalculated leaving the missing
data out of the equation
• IRT- Discrimination index was the second parameter calculated
based on the two-, or three- parameter model. Used maximum
likelihood procedures of test calibration.
Step 4- Calculate Guessing Index
• CTT- guessing was not calculated since the number of test items
was large enough.
• IRT- From Step 2, guessing index is the third parameter
calculated based on the three- parameter model. Used maximum
likelihood procedures of test calibration.
Step 5- Distractor Evaluation
• CTT- Using SPSS frequency tables were generated. Options A,
B, C, and D were broken down by score groups determining the
percent frequency.
• IRT- this step was not done.
Step 6- Item Evaluation
• Using the information derived for each item in the previous steps,
items with a low discrimination index were flagged for further
review. The rpb for each flagged item was compared to its
corresponding p-value to see if the two parameters conflicted.
This was also done to both sets of data for further comparison.
Step 7- Item Revision
• Based on information determined in the previous steps items
were revised or omitted, increasing the quality of items to be
included in the item bank.

103
CHAPTER 4
RESULTS
This chapter presents the outcomes resulting from the study. It begins
with a précis of the situation that produced the need for the study. The
remainder of this chapter is organized to present the results of each step in
that process and the section headings directly correspond to the specific
objectives of the study, see Chapter 1.
Background
This study makes up one part of a larger project that is being conducted
by staff members of the Agricultural Education Outreach program and faculty
of the Agricultural Science Education program of the Department of Education
at Cornell University. The purpose of the larger project is to develop a content
core for the Agricultural Science Education program for New York State (NYS),
then to use that core as the basis for development of a statewide assessment
system for student achievement. The content core developed prior to the
initiation of the current study was based primarily on the Agriculture and
Natural Resources Career Clusters Pathways model (Career Clusters, 2006)
developed under the auspices of the US Department of Education and
promulgated by the National Consortium of Directors of Career and Technical
Education. The NYS core content project resulted in a matrix of curriculum
content and student competencies organized into nine broad content domains.
The purpose of this study was to develop, validate, and field test
separate banks of test items for two of those core content domains: animal
systems and plant systems. It is anticipated that the procedures developed for
use in the current study will provide the basis for the item pool construction
process for the remaining seven content domains.

104
Objective 1. Develop an Item Construction Protocol
After a review of the literature supporting test construction and
evaluation, it was determined that criterion referenced test (CRT) methods
would be employed rather than norm-reference testing (NRT) procedures.
CRT was selected based on the fact that each questions derived from this
method is associated with a specific element of content, in our case each test
item would be connected to an element of the core curriculum. Tests based
on the CRT model are intended to measure student mastery of instructional
objectives; students are not compared along a normative curve. Aligning item
construction to test use made CRT the ideal choice.
After examining the literature to determine applicable research
regarding CRT, it was found that Shock and Coscarelli (1998,2000) provided a
viable model with specific protocols to follow when developing CRT items.
Five steps of their thirteen-step model were selected to make-up the specific
protocol for this study:
1. Create cognitive items.
2. Create rating instruments.
3. Establish content validity of items.
4. Conduct initial pilot tests.
5. Perform item analysis
Additional guidelines for criterion-referenced item construction were
adapted from Hambleton and Rogers (1991) and Halaydyna (1994, 2004), and
we infused those procedures into the directions provided to test item
developers and validators.

105
Objective 2. Organize a Technical Team of Item Writers
The technical team for each content area was designed to include
secondary teachers of agricultural education whose programs emphasis the
respective content area. It was also decided to include content experts in the
respective disciplines from Cornell Cooperative Extension (CCE).
Nominations for secondary teachers and were sought from Agricultural
Education Outreach state staff members and nominations for the Extension
representatives were sought from the Director and Associate Director of CCE.
The target size for each technical writing team was four secondary teachers
and two extension educators.
A group of six writers for each area – four agricultural educators and
two extension agents – indicated beforehand that they would participate in the
two-day item writing workshop. However, at that workshop the two extension
agents specializing in animal systems and two of the agricultural educators in
the plant systems were not present. To alleviate this problem, one agricultural
educator participated in both animal and plant systems since his expertise
spanned both disciplines. Two additional members facilitating the workshop
participated in the plant systems group as additional item writers and item
validators because the group was short agricultural educators. Both had prior
experience in plant systems. During the second day of the workshop one
extension agent in the plant systems group was not present.
Objective 3. Construct draft items based on core curriculum framework
domains.
Participants spent the first day of the workshop constructing items
independently and the second day as a group. For the area of animal

106
systems, 110 items were constructed individually, and 92 were constructed as
a group. For the area of plant systems, 76 were constructed individually, and
44 were constructed as a group. All items were multiple-choice and each was
based on a single content item of the agricultural education core curriculum
that had been developed in an earlier phase of the overall project.
Objective 4. Validate items through expert judgment.
Each item was validated by the item writing team (Appendix E), and a
professional test developer (Appendix F). The item writing team validated
items for content, quality, and relation to the specific content domain. The test
developer corrected all grammatical problems and flagged problematic items
for further content review. The test specialist returned15 items in animal
systems and 5 items in plant systems for having content issues. Further
review was done by agricultural educators at Cornell University. After a
thorough review for content, bias, and grammar, and after the pilot test, 192
animal systems questions and 115 plant systems questions remained in the
item banks. The other items were omitted due to content problems and low
correlations with the total test score.
Objective 5. Pilot Test Items
Using Atrixware, a test generator software program, two versions of at
test for each of the two curriculum areas were generated. Each of the four
tests consisted of all the questions remaining in the respective item bank. The
animal systems exam consisted of 192 questions and the plant systems
consisted of 115 (due to the security of the test, a copy of the exams cannot
be included in this text).

107
The pilot test student population was chosen based on two criteria: the
primary curriculum offered in the agricultural education program included an
emphasis in the respective content area and the availability and willingness of
the teachers to participate. There was a need to get a diverse representation
of students to omit cultural bias. The pilot test group consisted of seven
agriculture programs throughout the state with emphasis in animal systems,
and a total of 226 students. Four programs with emphasis on plant systems
programs participated, consisting of 155 students.
The pilot tests were strictly voluntary. Class schedules ranged from
school to school and program to program with some schools on block
scheduling and others on a regular schedule. The pilot exams were not timed
but in some cases the students were unable to complete them because of
class length restrictions. For students with shorter periods, some of the
students were directed to start at the end and work backwards on the test. In
all cases the exams were proctored by an outside test administrator.
Classroom teachers were all present and assisted in assuring discipline within
the classroom.
Instructions provided to the students emphasized that they would not
receive grades for the examination and that there was no penalty for guessing
or for incomplete answers. The participants reported levels of education in
agriculture and gender for further analysis. All materials for the test were
provided by the test administrator, and the tests were taken without the aid of
any external devices, such as calculators or rulers.

108
Objective 6. Analyze items for reliability and validity using CTT
methods.
The multiple-choice exams were analyzed using both a nominal scale
(A=1,…, D=4) for distractor analysis and coded into a dichotomomous scale
(with a non-response as an incorrect response) to determine descriptive
statistics. Students in the sample for both areas were grouped into advanced
(2) -- two or more years in a plant/animal specific agriculture program, or three
of more years in a regular agriculture program -- or novice (1) -- first or second
year in the specific discipline in a regular agriculture program. Gender was
coded as female, 1, or male, 2. No information identifying individual students
was collected. No other demographical information was collected.
Animal systems
For detailed student response data for items in the animal systems
content area, refer to Figure 4.1, which displays a frequency distribution of the
scores. Identification for each student was entered as nominal-level data
identifying school and assigning students (1,…,∞). The score of each student
was entered as interval level data with 100 representing a perfect score.
Scores ranged from a minimum of 0 to a maximum of 73 with a mean score
(x= 28.8) and a standard deviation (σ=15.8). Data shows that most students
scored low on the tests since most students were unable to complete the test
in the time allotted.
Three parameters needed in CTT analysis are item reliability, item
difficulty, and item discrimination. Cronbach’s alpha was calculated using
SPSS and the reliability of the 192 items in the animal systems pilot test was
0.971. The proportion correct index, or p-value for dichotomously scored
items, is a proportion of the examinees that answered an item correctly. For

109
the animal systems pilot item difficulty refer to Table 4.1. The values under
the heading p-value were calculated including missing values as incorrect
values in the computations. The p-values ranged from 0.05 to 0.81. The
adjusted p-value was calculated to make further comparisons. They exclude
the missing values from the computation. They range from 0.05 to 0.85.
Figure 4.1 Frequency distribution of test scores on animal systems pilot
The item discrimination coefficient for each animal systems item was
determined by calculating in SPSS the point-biserial correlation coefficient, see
Table 4.1. The point-biserial correlation coefficients were corrected by

110
excluding the item score from the total score before computation. Adjusted
point-biserial coefficients were also calculated excluding missing data in the
calculations. A point-biserial coefficient of 0.15 was the minimum threshold
value for retaining an item. Items below this value are highlighted in yellow as
items to reevaluate. Twenty-five items were flagged and twenty-two items
from the adjusted calculations were flagged. The responses flagged for both
the regular calculations and the adjusted calculations varied with items. One
method did not prove to be better then other; however, it is valuable to have
data calculated both ways to make sure all items that need revision based on
a low discrimination index get revised. Further analysis of their difficulty and
frequency of their alternatives was done.
Table 4.1: Animal Systems Item Difficulty and Discrimination
Item Number p-value1 Discrimination1 Number of Responses
Adjusted p-value2
Adjusted Discrimination2
1 0.218 .136 222 0.225 .090
2 0.240 .082 221 0.249 .101 3 0.409 .297 221 0.421 .459 4 0.551 .224 147 0.850 .591 5 0.196 -.094 133 0.338 .271 6 0.329 .170 155 0.484 .341 7 0.222 .001 188 0.271 .208 8 0.222 .126 227 -0.233 .043 9 0.542 .230 220 0.559 .541
10 0.262 .144 132 0.455 .433 11 0.107 -.166 180 0.139 .055 12 0.120 .221 147 0.190 .608
1 Including non-responses in the calculations as incorrect responses. 2 Non-responses were assumed to be missing data and excluded from the calculations

111
Table 4.1 (Continued)
13 0.404 .353 224 0.411 .456 14 0.516 .273 150 0.780 .353 15 0.471 .241 141 0.759 .354 16 0.218 .251 129 0.388 .316 17 0.142 .071 143 0.231 .071 18 0.409 .218 131 0.710 .200 19 0.813 .372 222 0.829 .040 20 0.467 .369 135 0.785 .420 21 0.200 -.015 179 0.257 .380 22 0.276 .240 179 0.352 .557 23 0.133 -.062 148 0.209 -.017 24 0.644 .451 202 0.723 .000 25 0.622 .245 217 0.650 .486 26 0.631 .296 220 0.650 -.051 27 0.111 .041 153 0.170 .558 28 0.480 .210 207 0.527 .239 29 0.244 .213 194 0.289 .606 30 0.769 .330 225 0.773 .656 31 0.151 .136 147 0.238 .025 32 0.507 .484 151 0.762 .591 33 0.671 .307 191 0.796 .591 34 0.236 .030 178 0.303 .181 35 0.458 .325 185 0.562 .498 36 0.369 .338 130 0.646 .652 37 0.164 -.011 154 0.247 .353 38 0.413 .333 140 0.671 .032 39 0.258 .232 135 0.437 .549 40 0.591 .302 214 0.626 .503

112
Table 4.1 (Continued) 41 0.444 .118 196 0.515 -.060 42 0.649 .419 218 0.674 .525 43 0.400 .150 223 0.408 .393 44 0.284 .126 220 0.295 .288 45 0.107 .153 150 0.167 .671 46 0.231 -.066 160 0.331 .279 47 0.711 .357 218 0.739 .374 48 0.547 .325 185 0.670 .184 49 0.320 .318 137 0.533 .395 50 0.298 .343 142 0.479 .569 51 0.218 .309 130 0.385 .089 52 0.520 .334 227 0.167 .146 53 0.431 .505 227 0.057 .582 54 0.222 .044 183 0.279 .190 55 0.644 .464 222 0.658 .203 56 0.280 .513 129 0.496 .492 57 0.147 .120 209 0.163 .549 58 0.787 .367 217 0.820 .193 59 0.364 .003 211 0.393 .016 60 0.133 .200 141 0.220 .016 61 0.289 .416 121 0.545 .290 62 0.142 -.063 122 0.270 .342 63 0.480 .259 200 0.545 .293 64 0.356 .248 202 0.401 .251 65 0.582 .624 213 0.620 .345 66 0.427 .365 187 0.519 .477 67 0.724 .583 209 0.785 .656 68 0.338 .416 133 0.579 .368

113
Table 4.1 (Continued) 69 0.138 .313 133 0.241 .623 70 0.520 .522 197 0.599 .537 71 0.551 .466 201 0.622 .539 72 0.449 .313 201 0.507 .378 73 0.627 .545 199 0.714 .365 74 0.351 .294 171 0.468 .273 75 0.280 .297 195 0.328 .181 76 0.396 .544 120 0.750 .206 77 0.636 .601 197 0.731 .437 78 0.373 .706 126 0.675 .443 79 0.342 .602 106 0.736 .244 80 0.280 .159 192 0.333 .518 81 0.320 .514 160 0.456 .470 82 0.191 .099 183 0.240 .351 83 0.658 .652 185 0.805 .365 84 0.173 .304 113 0.354 .201 85 0.342 .510 146 0.534 .305 86 0.142 .170 133 0.248 -.001 87 0.351 .394 166 0.482 -.042 88 0.396 .361 189 0.476 .328 89 0.609 .608 191 0.723 .422 90 0.293 .684 99 0.677 .697 91 0.236 .387 108 0.500 .347 92 0.133 .357 109 0.284 .289 93 0.204 .395 100 0.470 .599 94 0.542 .560 182 0.676 .274 95 0.293 .638 94 0.713 .472 96 0.058 .140 93 0.151 .106

114
Table 4.1 (Continued) 97 0.253 .324 174 0.333 .439 98 0.347 .622 139 0.568 .631 99 0.627 .657 185 0.768 .450
100 0.213 .506 100 0.490 .440 101 0.129 .430 99 0.303 .453 102 0.182 .253 150 0.280 .324 103 0.222 .601 98 0.520 .477 104 0.373 .549 142 0.599 .364 105 0.249 .579 97 0.588 .326 106 0.173 .600 79 0.506 .514 107 0.067 .000 152 0.105 .170 108 0.120 .403 92 0.304 .442 109 0.307 .587 164 0.427 .447 110 0.164 .550 85 0.447 .571 111 0.093 .422 81 0.272 .531 112 0.258 .541 96 0.615 .373 113 0.329 .599 157 0.478 .588 114 0.222 .329 116 0.440 .171 115 0.204 .260 166 0.283 .298 116 0.391 .561 163 0.546 .300 117 0.209 .363 166 0.289 .612 118 0.169 .533 72 0.542 .508 119 0.449 .516 161 0.634 .106 120 0.284 .488 148 0.439 .333 121 0.080 .243 71 0.268 .387 122 0.182 .432 123 0.341 .422 123 0.204 .322 154 0.305 -.058 124 0.173 .599 68 0.588 .484

115
Table 4.1 (Continued) 125 0.293 .494 129 0.519 .282 126 0.107 .543 85 0.294 .193 127 0.147 .465 77 0.442 .532 128 0.387 .556 151 0.583 .693 129 0.311 .439 156 0.455 .138 130 0.160 .658 73 0.507 .629 131 0.129 .274 133 0.226 .329 132 0.138 .607 63 0.508 .416 133 0.053 .507 36 0.361 .378 134 0.129 .366 61 0.492 .294 135 0.191 .544 84 0.524 .521 136 0.138 .533 62 0.516 .354 137 0.178 .341 146 0.281 .404 138 0.062 .155 111 0.135 .373 139 0.120 .344 143 0.196 .128 140 0.120 .524 58 0.483 .583 141 0.116 .145 150 0.180 .548 142 0.347 .690 126 0.627 .768 143 0.200 .707 74 0.622 .671 144 0.111 .361 84 0.310 .234 145 0.111 .368 113 0.230 .593 146 0.187 .538 127 0.339 .482 147 0.311 .253 142 0.500 .025 148 0.209 .641 88 0.545 .666 149 0.209 .615 77 0.623 .415 150 0.160 .484 76 0.487 .467 151 0.418 .611 146 0.651 .582 152 0.298 .631 119 0.571 .482

116
Table 4.1 (Continued) 153 0.160 .606 63 0.587 .503 154 0.298 .705 100 0.680 .651 155 0.409 .627 138 0.674 .715 156 0.156 .545 72 0.500 .509 157 0.533 .636 143 0.846 .498 158 0.093 .479 65 0.338 .677 159 0.302 .507 116 0.595 .456 160 0.236 .604 80 0.675 .561 161 0.213 .670 96 0.510 .680 162 0.173 .710 69 0.580 .711 163 0.187 .354 141 0.305 .557 164 0.258 .406 139 0.424 .390 165 0.351 .561 142 0.563 .489 166 0.178 .727 61 0.672 .768 167 0.156 .417 132 0.273 .234 168 0.111 .492 50 0.520 .419 169 0.191 .638 75 0.587 .380 170 0.080 .504 50 0.380 .580 171 0.076 .290 77 0.234 .090 172 0.289 .468 139 0.475 .334 173 0.076 .378 52 0.346 .231 174 0.116 .613 48 0.563 .482 175 0.196 .403 109 0.413 .502 176 0.062 .322 48 0.313 .187 177 0.191 .349 123 0.358 .484 178 0.102 .484 68 0.353 .616 179 0.098 .478 55 0.418 .508 180 0.129 .525 63 0.476 .436

117
Table 4.1 (Continued) 181 0.200 .560 87 0.529 .572 182 0.160 .691 58 0.638 .768 183 0.187 .601 64 0.672 .562 184 0.191 .624 62 0.710 .508 185 0.356 .522 135 0.600 .345 186 0.089 .413 67 0.313 .605 187 0.284 .597 115 0.565 .517 188 0.360 .657 102 0.804 .521 189 0.164 .567 78 0.487 .244 190 0.071 .187 122 0.139 .208 191 0.089 .479 50 0.420 .395 192 0.262 .570 140 0.429 .554
There were fewer items flagged in the adjusted calculations; however
not many and there were some similarities between the two. For the items
that were flagged in the regular calculations and were not flagged in the
adjusted, there was a high amount of missing data taken into consideration.
The items in the adjusted calculations that were flagged either displayed
similarities to the regular calculations or contained a high amount of incorrect
responses.
For the purposes of this study, it is important to view how each question
fared by reviewing the frequency of alternatives. The frequency of the
alternatives of each individual question was calculated; see Table 4.2 as an
example.

118
Table 4.2 Animal Systems- Frequency of Alternatives
Question 3 Frequency Percent Valid Percent Cumulative Percent
A 89 39.4 40.5 40.5
B 11 4.9 5.0 45.5
C 26 11.5 11.8 57.3
D 92 40.7 41.8 99.1
E 2 .9 .9 100.0
Valid
Total 220 97.3 100.0
Missing -1 6 2.7
Total 226 100.0
The highlighted portion displays the correct alternative. The frequency
is the number of students who chose that alternative. The percent is the
percentage of students who chose that alternative. The valid percent are
those who chose an alternative omitting those who left the choice blank. This
was taken into consideration when analyzing results of the corrected data
because there was no negative repercussion given to students who were
unable to complete the exam or to those who skipped questions of difficulty to
answer the questions of which they were sure within the time frame allotted.
Of the 25 items that were flagged due to low point-biserial coefficients,
22 contained extremely low (p<0.25) p-values indicating the items were of high
difficulty. When analyzing the frequency of distractors for these 25 items the
correct alternative for 21 of the items was not the choice most frequently
chosen by the test takers. All 25 items were flagged for further review of
content and wording with specific attention to those with the high p-values and
low point-biserial coefficients.

119
Of the 22 items from the corrected point-biserial calculations that were
flagged due to low point-biserial coefficients, 10 contained extremely low p-
values indicating the items were of high difficulty. When analyzing the
frequency of distractors for these 22 items the correct alternative for 12 of the
items was not the choice most frequently chosen by the test takers. All 22
items were flagged for further review of content and wording with specific
attention to those with the high p-values and low point-biserial coefficients.
When comparing data between the calculations done including all the
missing responses and the calculations done excluding missing responses,
there were 8 items that were similar. All items were kept in the review since
time was a limiting factor in the results and it is uncertain how much of the
variation to attribute to this factor.
Plant systems
For detailed student response data for items in the plant systems
content area refer to Figure 4.2, which displays a frequency distribution of the
scores. Identification for each student was entered as nominal-level data
identifying school and assigning students (1,…,∞). The score of each student
was entered as interval level data with 100 representing a perfect score.
Scores ranged from a minimum of 3.5 to a maximum of 83.5 with a mean
score (x= 26.7) and a standard deviation (σ=17.1). Most students scored low
on the plant systems test because they were unable to complete the test in the
time available based on class schedules.

120
Figure 4.2 Frequency distribution of test scores on plant systems pilot
Three parameters needed in CTT item analysis are item reliability, item
difficulty, and item discrimination. Cronbach’s alpha was calculated using
SPSS 12 and the reliability of the 115 items in the plant systems pilot test was
0.952. The proportion correct index, or p-value for dichotomously scored
items, is a proportion of the examinees that answered an item correctly. For
the plant systems pilot item difficulty refer to Table 4.3. The values under the
heading p-value were calculated including missing values as incorrect values
in the computations. The p-values ranged from 0.06 to 0.62. The p-values do
not reflect those students who did not finish due to lack of time. They include

121
missing values as incorrect values in the computations. The adjusted p-value
was calculated to make further comparisons. They exclude the missing values
from the computation. They range from 0.09 to 0.74.
Item discrimination coefficients for the plant systems items were
determined by calculating in SPSS the point-biserial correlation coefficient, see
Table 4.3. The point-biserial correlation coefficients were corrected to exclude
the respective item scores from the total score before computation. Adjusted
point-biserial coefficients were also calculated excluding missing data in the
calculations. A point-biserial coefficient of 0.15 was the minimum threshold
value to retain the items. These items are highlighted in yellow as items to
reevaluate. One method did not prove to be better then other; however, it is
valuable to have data calculated both ways to make sure all items that need
revision based on a low discrimination index get revised. Nine items from the
regular calculations and twenty-five items from the adjusted calculations were
flagged. Further analysis of their difficulty and frequency of their alternatives
was indicated.
Table 4.3 Plant Systems Item Difficulty and Discrimination Item
Number p-value3 Discrimination3 Number of responses
Adjusted p-value4
Adjusted Discrimination4
1 0.27 .229 127 0.323 .288
2 0.33 .370 98 0.500 .346
3 0.36 .372 101 0.535 .231
4 0.29 .329 111 0.387 .164
5 0.60 .335 122 0.738 .269 3 Including non-responses in the calculation as incorrect responses. 4 Non-responses were assumed to be missing data and excluded from calculations.

122
Table 4.3 (Continued)
6 0.43 .461 124 0.524 .543
7 0.26 .280 126 0.310 .212
8 0.15 .097 110 0.209 .104
9 0.20 .168 125 0.240 .137
10 0.26 .338 124 0.315 .460
11 0.25 .518 115 0.330 .540
12 0.40 .274 122 0.492 .380
13 0.41 .236 126 0.492 .381
14 0.31 .408 108 0.426 .172
15 0.47 .471 102 0.686 .486
16 0.32 .439 101 0.475 .218
17 0.31 .369 124 0.379 .208
18 0.47 .419 131 0.542 .568
19 0.19 .264 124 0.226 .156
20 0.20 .109 127 0.236 .040
21 0.24 -.006 121 0.298 -.255
22 0.29 .489 120 0.358 .468
23 0.23 .039 117 0.291 -.317
24 0.31 .443 98 0.480 .137
25 0.23 .410 121 0.281 .325
26 0.43 .481 119 0.546 .463
27 0.41 .344 121 0.512 .300
28 0.21 .363 109 0.294 .462
29 0.23 .082 127 0.268 .120
30 0.23 .491 105 0.324 .345

123
Table 4.3 (Continued)
31 0.16 .271 106 0.226 .070
32 0.41 .517 114 0.544 .557
33 0.19 .170 132 0.212 .426
34 0.36 .178 115 0.470 .136
35 0.43 .302 137 0.474 .526
36 0.31 .350 105 0.438 .356
37 0.35 .246 136 0.382 .316
38 0.30 .597 102 0.441 .538
39 0.21 .413 102 0.304 .483
40 0.22 .146 119 0.277 -.021
41 0.20 .276 107 0.280 .311
42 0.07 .332 124 0.282 .168
43 0.21 .322 109 0.284 .209
44 0.62 .260 132 0.705 .342
45 0.29 .360 102 0.431 .417
46 0.13 .029 102 0.186 -.428
47 0.26 .301 129 0.302 .339
48 0.31 .171 132 0.356 .055
49 0.27 .374 117 0.350 .357
50 0.28 .508 103 0.408 .210
51 0.50 .440 124 0.605 .487
52 0.41 .576 100 0.620 .723
53 0.21 .279 93 0.333 .141
54 0.27 .504 106 0.377 .510
55 0.27 .401 93 0.430 .308

124
Table 4.3 (Continued)
56 0.38 .571 93 0.613 .541
57 0.17 .210 116 0.224 .052
58 0.33 .394 102 0.490 .295
59 0.21 .413 112 0.277 .356
60 0.21 .388 95 0.326 .218
61 0.35 .471 108 0.481 .335
62 0.23 .467 90 0.389 .274
63 0.24 .482 89 0.146 -.349
64 0.19 .155 93 0.301 -.203
65 0.26 .465 109 0.358 .353
66 0.33 .457 99 0.505 .436
67 0.31 .669 86 0.535 .677
68 0.18 .288 87 0.310 .056
69 0.19 .371 106 0.264 .357
70 0.31 .550 91 0.516 .458
71 0.09 .114 83 0.157 -.153
72 0.23 .432 110 0.309 .452
73 0.34 .356 108 0.472 .175
74 0.24 .469 105 0.343 .335
75 0.26 .463 99 0.394 .508
76 0.29 .624 85 0.518 .548
77 0.25 .575 101 0.376 .593
78 0.15 .380 85 0.259 .219
79 0.15 .443 90 0.256 .306
80 0.13 .091 100 0.200 .098

125
Table 4.3 (Continued)
81 0.23 .622 70 0.500 .514
82 0.25 .355 100 0.370 .199
83 0.15 .350 70 0.314 -.076
84 0.17 .342 90 0.289 .368
85 0.21 .235 92 0.348 .005
86 0.17 .158 95 0.274 -.074
87 0.13 .161 67 0.284 -.189
88 0.32 .442 92 0.522 .319
89 0.21 .384 90 0.356 .389
90 0.18 .287 96 0.281 .240
91 0.06 -.049 93 0.097 -.290
92 0.24 .502 87 0.414 .296
93 0.15 .396 65 0.338 .138
94 0.25 .499 75 0.507 .514
95 0.35 .518 87 0.609 .468
96 0.36 .478 89 0.607 .347
97 0.38 .482 92 0.620 .525
98 0.27 .701 65 0.615 .384
99 0.31 .416 92 0.500 .471
100 0.19 .220 96 0.302 .348
101 0.31 .533 91 0.505 .567
102 0.25 .451 89 0.416 .463
103 0.17 .498 80 0.313 .266
104 0.09 .332 63 0.222 .127
105 0.23 .623 73 0.479 .512

126
Table 4.3 (Continued)
106 0.23 .576 90 0.378 .444
107 0.19 .596 66 0.439 .513
108 0.42 .365 90 0.700 .216
109 0.16 .344 78 0.308 .096
110 0.16 .416 79 0.304 .413
111 0.35 .572 94 0.564 .460
112 0.15 .145 77 0.286 -.166
113 0.30 .417 90 0.500 .502
114 0.24 .625 85 0.424 .491
115 0.15 .407 93 0.237 .517
Similar to the animal systems results, there were fewer items flagged in
the adjusted calculations; however not many and there were some similarities
between the two. For the items that were flagged in the regular calculations
and were not flagged in the adjusted, there was a high amount of missing data
taken into consideration. The items in the adjusted calculations that were
flagged either displayed similarities to the regular calculations or contained a
high amount of incorrect responses.
For the purposes of this study, it is important to view how each question
fared by reviewing the frequency of alternatives. The frequency of student
responses to each of the alternatives of each individual question were
calculated, see Table 4.4 as an example.
The highlighted portion displays the correct alternative. The frequency
is the number of students who chose that alternative. The percent is the
percentage of students who chose that alternative. The valid percent are

127
those who chose an alternative omitting those who left the choice blank. This
was used in the adjusted point-biserial calculations. This was taken into
consideration when analyzing results because there was no negative
repercussion given to students who were unable to complete the exam or to
those who skipped questions of difficulty to answer the questions of which they
were sure within the time frame allotted.
Table 4.4 Plant Systems – Frequency of Alternatives
Question 2
Frequency Percent Valid Percent Cumulative Percent
Valid A 15 10.0 15.2 15.2
B 19 12.7 19.2 34.3
C 50 33.3 50.5 84.8
D 15 10.0 15.2 100.0
Total 99 66.0 100.0
Missing -1 51 34.0
Total 150 100.0
Of the nine items that were flagged due to low point-biserial
coefficients, all contained extremely low (p<0.25) p-values indicating the items
were of high difficulty. When analyzing the frequency of distractors for these
nine items the correct alternative for all the items was not the choice most
frequently chosen by the test takers. Of the twenty-five items that were flagged
from the adjusted calculations, nine contained extremely low (p<0.25) p-values
indicating the items were of high difficulty. When analyzing the frequency of
distractors for these twenty-five items the correct alternative eighteen of the
items was not the choice most frequently chosen by the test takers. These
nine items plus the twenty-five adjusted items were flagged for further review.

128
Objective 7. Analyze items for reliability and validity using IRT methods.
All data was coded and entered into MULTILOG 7. It was determined a
priori that the multiple-choice model to analyze item distractors would be
employed for further analysis of data. Upon further analysis of the data, it was
determined that the sample size was too small. This further caused the run of
the data to respond in error and the IRT results were found inconclusive.

129
CHAPTER 5
SUMMARY AND DISCUSSION
This chapter restates the research process and reviews the major
methods used in the study. The major sections offer summaries of the results
and discussions on their implications. Also provided are recommendations
along with suggestions for further research related to the study as it applies to
the field of agricultural education.
Review of Problem and Objectives
Problem
NYS agricultural science education programs are based on local needs.
Therefore, no single approved statewide curriculum exists for agricultural
science. The result of that situation is that local programs differ widely from
one school to another. The seven pathways outlined in the Agriculture, Food,
and Natural Resources portion of the Career Clusters Pathways model (2006)
with the addition of agricultural foundations and agricultural safety pathways
was determined to represent the range of content being delivered in NYS
agricultural science education programs. Complicating the lack of a statewide
curriculum in agricultural science is the situation that no national standards or
competency assessment systems currently exist which are appropriate for that
range of content.
New York State Education Department policies promote the use of a
technical assessment system for student achievement. Yet developing a valid
and reliable technical assessment system is beyond the resources and ability
of most local teachers. Therefore, there is a need for a useable technical
assessment system appropriate for NYS agricultural science education
students. It should include both performance and content components. The

130
content component should provide objective measurements of the core
content domains and should include item banks reflective of the wide range of
content offered in NYS agricultural science education programs.
Purpose and Objectives
An objective content test requires a bank of test items, but no test item
bank exists to measure student achievement in the content areas specific to
New York State agricultural science education. Developing a complete item
pool for all nine content areas was beyond the scope of this study. Therefore,
the purpose of this study was to develop, validate, and field test separate
banks of test items for both the Animal Systems and Plant Systems content
areas. The specific objectives of this study included:
1. Develop an item construction protocol based on criterion-
referenced testing.
2. Organize technical teams of item writers.
3. Write draft items based on core curriculum framework domains.
4. Validate items through expert judgment.
5. Pilot test items.
6. Use classical test theory to analyze items based on statistical
measures to provide further evidences of validity and reliability.
7. Use item response theory to analyze items based on statistical
measures to provide further evidences of validity and reliability.
Review of the Research Design
The research design for this study followed the seven main objectives
indicated in the Purpose and Objectives portion of this chapter. The
procedure protocol for item development follows Shock and Coscarelli (1998,
2000) for developing criterion-referenced items and Haladyna’s (2004)

131
procedures and suggestions for developing multiple-choice items. Teams of
experts were assembled for each of the two content areas- 4 panelists for
animal systems and 4 for plant systems. The items were constructed and
validated by the panels and edited by a test item specialist. Agricultural
science education students throughout New York State piloted the item pools.
Classical test theory methods were used to establish item difficulty, item
discrimination, and frequency analysis and results were used to revise items.
Item Analysis Summary
Of the 192 animal systems items that were piloted, 25 items were
flagged for having low point-biserial (discrimination) coefficients (<0.15).
Of the 25 items that were flagged due to low point-biserial coefficients, 22
contained extremely low (p<0.25) p-values, indicating that fewer than 25% of
the test takers indicated correct responses. When analyzing the frequency of
distractors for these 25 items the correct alternative for 21 of them was not the
most frequent choice of the test takers. All 25 items were flagged for further
review of content and wording, with specific attention to those with the high p-
values and low point-biserial coefficients.
Of the 115 plant systems items that were piloted, nine items were
flagged for having low point-biserial coefficients (<0.15).Of the nine items that
were flagged due to low point-biserial coefficients, all contained extremely low
(p<0.25) p-values, indicating that fewer than 25% of the test takers indicated
correct responses. When analyzing the frequency of distractors for these nine
items, the correct alternative for all the items was not the choice most
frequently chosen by the test takers. These nine items were flagged for
further review.

132
The further review of the items allowed the test developers to revise
items rather than just omitting the items from the test bank. In some cases the
frequency of the distractors indicated that there were similarities between the
correct alternative and one or more of the incorrect alternatives. As test
developers looked back at these items, there was ambiguity between the
correct and the incorrect alternative(s) most frequented by the pilot sample.
These distractors were altered allowing the same question to be addressed
with a clear distinction between correct and incorrect alternatives. In other
cases a revision of the stem was needed to clarify exactly what the question
was written to address. Once all the items were revised they were entered
into a test bank and will be piloted again in a later study.
Item response theory.
All data were coded and entered into MULTILOG 7. It was determined
a priori that the IRT multiple-choice model to analyze item distractors would be
employed. Upon further analysis of the data, it was determined that the
sample size was too small. Additionally, this caused the run of the data to
respond in error and the data report was found inconclusive.
Discussion of Results
Item Construction
The item construction workshop took place during a two-day conference
set in a central location in NYS scheduled in the early spring. Full participation
from the selected panelists was anticipated, but some members who had
agreed to participate failed to attend as inclement weather likely made travel
difficult.

133
During the workshop it became apparent that most of the participating
teachers had little experience in designing multiple-choice tests. They
seemed to prefer more open-ended examinations which are easier to
construct. Extension agents attending reported that they had never designed
a test nor written a test question. This challenge demanded detailed
instruction on how to properly construct a criterion-referenced, multiple-choice
test item. Therefore, the instructional period took longer than expected and
included many questions from the participants.
Once participants began writing items individually, the process ran
smoothly. However, when participants began sharing items with one another,
some became frustrated at the quality of their items. Some deleted items and
started over, even though they had spent much of the day on the items. This
situation slowed the process and meant that fewer questions were completed.
Most participants chose to type items on the laptop computers provided;
however, some wrote items out in longhand. Deciphering penmanship
became another factor limiting the number of items completed.
Once all individuals were finished constructing items, the panels began
to work as a group. This portion of the process moved at a faster pace, with
many ideas and discussions about the best ways to measure content
domains. Once all the items were constructed the group discussed the
difficulty members had with the item construction process; specifically
generating multiple-choice items for higher levels of cognition. It was an area
in which the panelists felt that they needed further instruction, specifically
recommending a three-day workshop instead of a two-day one.

134
Item Validation
The validation process was done quickly by the animal systems panel,
making recommendations related to editing content and some grammar.
However, in the plant systems group, this task resulted in forceful
disagreements among some members. There were arguments related to the
difficulty level of about half the items put forward. Another argument centered
on the fact the not all schools have horticulture in their plant science program,
raising the question of whether horticulture-related questions should appear on
a statewide assessment. Similar questions about the scope and difficulty of
individual items were raised numerous times. Each time, the panel was
reminded that the items should be representative of all plant systems
programs in the state; and even if one individual item focused on a specified
area of plant science, it should not be completely eliminated from the item
bank.
Once all the items were validated the panels adjourned. The animal
group worked well together, and that panel completed validating items hours
ahead of the plant systems group. This caused a feeling of anxiety within the
plant systems group and resulted in the panel rushing through the validation
process for about one-quarter of the items, not providing a thorough review of
them.
The item reviewer spent about one month editing the items for grammar
and bias. This reviewer’s background was in biology so he also flagged some
questions for poor or confusing content. He made adjustment to questions as
needed and worked with an undergraduate research assistant in animal

135
systems and a former plant science educator to help re-work some of the
items.
Test Item Pilot
The test item pilot was a time consuming process due to the fact that
New York is a large state and agricultural education programs are spread out.
Trying to get a representative sample of students from different regions took
many hours of travel. None of the exams were mailed due to security reasons;
all exams were administered by an AEAP team member. Most programs
solicited to participate in the pilot testing declined. They indicated that there
was not an available day to administer outside projects into their classroom
time. Other school officials noted that approval from administrators was
needed, and that likely would be a lengthy process. Another reason cited for
nonparticipation in the test was that some teachers felt the process was a
waste of instruction time since they never planned to utilize a statewide
assessment of their curriculum.
Four of the programs participating in the pilot were led by the same
agricultural educators who had participated in the item writing workshop. They
indicated at the workshop that they would like to continue to contribute to the
development of the statewide examination and help pilot various areas of the
exam. The other participating programs were led by agricultural educators
who indicated that they planned on utilizing such an exam once it was
completed. Only one participating program leader indicated that she was not
going to utilize the exam but wanted to see how it compared to NOCTI.
Since the pilot tests were voluntary and there was no grade or student
identity attached to the tests, some students’ intrinsic motivational levels were

136
low. With no outside rewards for scoring high on the test, they did not take the
process seriously and marked incorrect answers to finish quickly and take the
remainder of the class period to relax. Some teachers stated that they would
offer extra credit for participating, which may have given more students a
desire to finish the exam.
The animal systems pilot exam consisted of 192 questions; the plant
systems had 115. A lengthy period of time (about two hours) was needed to
finish each exam. That was a large amount of time to devote, and only
programs on block scheduling could accommodate it. Students that were not
on either a block schedule or in a double period found it difficult to finish the
exam. Since the items were coded with a forced dichotomy, with no answer
being coded as an incorrect answer, the students that did not finish ended up
with poor scores.
Item Analysis
Reliability.
The reliability index calculated for both animal systems and plant
systems was high (p>0.95, adjusted p>0.97). When analysis was conducted
on how each item contributed to the overall test reliability, the alpha coefficient
still remained high. The standard error of measurement was low (plant
SEm=1.399, animal SEm=1.048), probably due to the fact that reliability and
standard error of the mean have a negative relationship, and the greater the
reliability coefficient the lower the standard error of measurement.

137
Item difficulty.
The Item difficulty coefficients (p-values) for most of the items on both
animal systems and plant systems and the adjusted p-values were a little less
than ideal (p-value<0.625) for multiple-choice test items (Ebel, 1979). This
indicates that most of the items were difficult, and most students answered
incorrectly. However, time restraints may have attributed to these low results
since most of the exams were not completed. The adjusted p-values may
have been more accurate since most of the students did not finish due to lack
of time. A comparison of the regular p-value and the adjusted p-values show
that there were some similarities between the two values.
Item discrimination.
Items that had low item discrimination (point biserial coefficient<0.15)
were flagged for further review (Varma, nd). These low values implied that
students who got the item incorrect also scored high on the test overall, while
student who got the item incorrect scored low on the test overall. There is a
relationship between point biserial statistics and p-values. They are found to
be conflicting when one is high and the other is low. When the items that were
flagged in both animal and plant systems for low point biserial coefficients
were checked for the p-value statistics, no conflicting items were found. When
the items that were flagged in both animal and plant systems for low adjusted
point biserial coefficients were checked for the adjusted p-value statistics, no
conflicting items were found. Similar to the adjusted p-values the adjusted
point-biserial coeffients may have been more accurate since most of the
students did not finish due to lack of time. All items from the regular

138
calculations and the adjusted calculations were flagged for further review of
content and review of a possible incorrect score key.
Alternative frequencies.
A review of the frequencies of the alternatives for all the questions was
conducted. It allowed comparison of the four choices which helped in revision
of the test item. For example, in most cases the correct choice was not the
choice most frequented. The choice most frequented in most cases was very
similar to the correct choice, indicating that the alternatives need to be revised
so that there is less ambiguity in the alternatives. The further inspection of the
frequencies for each item provided extra feedback, contributing to the
construct validity of the tests.
Item Response Theory
This study has aimed to compare the results of classical test theory and
item response theory. By comparing the two, it was hoped to make a further
recommendation of which theoretical methods better analyzed the data. Data
collected through IRT methods were found inconclusive. The first major cause
of error was the sample size- it was found to be too small for the data
collected. An underlying assumption of IRT is unidimensionality.
Unidimensionality could not be determined when the IRT models were being
generated. Therefore, it was not known if the 1-paramter, 2-paramter, or 3-
parameter model should be taken into consideration. Item parameters such
as difficulty and discrimination could not be calculated and goodness of fit to
determine how well the models could predict test results was also found
inconclusive.
139
Conclusions
A broader evaluation of this study points out areas from which
constructive conclusions can be drawn-- specifically test construction, item
writing, pilot testing, and item analysis. These conclusions are not only
supported by the data collected, but also rely on first-hand observations made
during the process. The main goal of this study was to develop a test item
bank for two areas for a statewide agricultural exam. As such, this study
offers the opportunity to explore one approach to developing such exams. The
process detailed here relied on workshops, revisions, and field tests. Below
are the key conclusions from these phases.
The first of these relates to the item construction protocol. Through the
use of criterion-referenced test item design, items developed were directly
linked to specific content domains or objectives. Utilizing this method over
more traditional methods, such as norm-referenced test design, allowed direct
alignment between the agriculture and natural resources core curriculum and
the items developed. Furthermore, CRT allowed for specific domains within
the agriculture curriculum to be tested- a valuable characteristic for a statewide
assessment designed to cater to the specifics of individual agricultural science
programs.
Item writing is a skill that with practice one can learn to master, but it
was very difficult to find agriculture teachers with the skills to write good items,
and it is equally difficult to find test specialists with expertise of the specific
content. The team of item writers made up of teachers and extension agents
might not have been the best group to design and write questions. They were
knowledgeable in content, but lacked the skills in generating well constructed

140
items. This meant there were multiple revisions from the initial item draft stage
to the final validation. Such a process poses the danger of content being
altered through revisions. To alleviate this, a more direct link between the
content area specialist (teachers) and test specialist (professional item writers)
needs to occur earlier on in the item construction process.
The third conclusion relates to students taking the pilot tests. These
pilot tests included all of the questions developed, in animal systems 192 and
plant systems 115. These tests proved to be too long and not specific enough.
There was insufficient data collected from students who were not
knowledgeable in certain areas covered by the test. Many of the students did
not finish the test which skewed the results related to specific test items. More
valuable data could have been collected if the pilot test targeted students had
been more thoroughly instructed in the individual curriculum domains. CRT
allows items to be categorized based on such domains, meaning the test
could have been broken down into fewer questions for more content-specific
tests.
The last conclusion is based on the IRT item analysis. According to the
findings of this study, the results calculated through the use of IRT were found
inconclusive primarily due to low sample size. A recommendation to all who
plan on using IRT methods is to make sure to have data collected from a large
sample size (>1000) or access to data with a large sample size. For this
particular study, I recommend collecting more data from the students in plant
systems and animal systems programs in NYS and then running the IRT
models for further comparison to CTT models. If it is determined that IRT
models are better to predict item characteristics, then that is the model that

141
should be used to evaluate the remaining seven areas from the core
curriculum that are going to be piloted in the future.
Suggestions for Further Research
Additional research is needed on the construction of exams to measure
specific domains set forth in career and technical education (CTE) programs.
As previously noted, criterion-referenced exams are more useful in
determining if a student has mastered a certain domain of instruction.
However, the hands-on nature of CTE programs is difficult to measure in a
multiple-choice exam. Many states are beginning to develop ways to assess
CTE programs. There is a need for research to investigate theoretical models
of test design and test validation. In the case of this study, investigation of test
construction was conducted outside of agricultural science education, and then
further outside of CTE, because there has been no research conducted in test
construction for such programs. While guidance was provided from academic
courses, which use examinations as a way to assess programs, academic
programs typically are not as hands-on in instruction and do not associate well
with the nature of CTE.
A contributing factor to well constructed assessments is the alignment
among standards, curriculum, and assessment (Solomon, 2002). This study
was based on criterion-referenced guidelines to ensure that the items being
developed were aligned to a certain domain from the core outline. However,
there remains a large gap when there are no standards and curriculum
available on which to base such an examination. Further research needs to
be conducted reviewing the alignment of bridging assessments to standards in
CTE. In NYS, consideration is recommended on the need to develop

142
standards and curriculum since it is becoming a national issue impacting all
areas of instruction.
There is a need for further research in improving assessment design
(Janesick, 2001). Too often educational programs continue to use norm-
referenced, multiple-choice exams as a way to evaluate student progress.
Studies evaluating more authentic measures, such as rubrics, portfolios, and
essays should be investigated, especially in the CTE field. Within agricultural
education, there are many resources available to assist in student evaluation.
There are Supervised Agricultural Experiences and leadership opportunities
provided by the FFA, such as Career Development Events; and there is the
nature of the agriculture classroom and curriculum, which incorporate many
hands-on experiences, such as greenhouse management, small animal care,
and investigations in biotechnology, to name a few. Such factors unique to
agricultural science education need further research as to how they can
contribute to an overall assessment and evaluation of student performance.
In states that are beginning to use CTE programs to offer alternative
venues for students to get academic credit, issues of evaluation of this model
need to be addressed. While helping students find an alternative pathway to
fulfill graduation requirements and helping CTE programs maintain enrollment,
further attention needs to be given on the outcome of student learning.
Investigation into whether students are mastering the academic content needs
to be conducted.

143
APPENDIX
Appendix A- Plant Systems Core Content Outline
Appendix B- Animal Systems Core Content Outline
Appendix C- Writing Multiple-Choice Test Items PPT
Appendix D- Item Template
Appendix E- Evaluation Sheet
Appendix F- Multiple-Choice Item Criteria

144
Appendix A Plant Systems Core Content Outline
I. Apply principles of anatomy and physiology to produce and manage
plants in both a domesticated and a natural environment.
a. Analyze and evaluate nutritional requirements and environmental conditions
i. Describe nutrient sources. ii. Determine plant nutrient requirements for optimum
growth. iii. Identify function of plant nutrients in plants. iv. Determine the environmental factors that influence and
optimize plant growth.
b. Examine data to evaluate and manage soil/media nutrients. i. Collect and test soil/media and/or plant tissue. ii. Interpret tests of soil/media and/or plant tissue. iii. Identify soil slope, structure and type. iv. Evaluate soil/media permeability and water-holding
capacity. v. Evaluate soil/media permeability and water-holding
capacity. vi. Determine the biological functions of microorganisms of
soil/media.
c. Explain and use basic methods for reproducing and propagating plants.
i. Determine the role of genetics in plants. ii. Describe the components and functions of plant
reproductive parts. iii. Identify and practice methods of asexual/sexual plant
propagation.
d. Develop a plan for integrated pest management. i. Identify plant pests (e.g., insects, diseases, weeds,
rodents). ii. Determine pest management safety practices. iii. Determine pest management methods. iv. Develop pest management plans based on pest life
cycles. v. Evaluate pest control plans.

145
II. Address taxonomic or other classifications to explain basic plant
anatomy and physiology.
a. Examine unique plant properties to identify/describe functional differences in plant structures including roots, stems, flowers, leaves and fruit.
i. Identify plant structures (e.g., seeds). ii. Describe physiological functions of plants. iii. Describe germination process and conditions.
b. Classify plants based on physiology for taxonomic or other
classifications. i. Classify plants as monocots or dicots. ii. Classify plants as annuals, biennials or perennials. iii. Classify plants according to growth habit. iv. Classify plants by type. v. Classify plants by economic value.
III. Apply fundamentals of production and harvesting to produce plants.
a. Apply fundamentals of plant management to develop a production plan.
i. Identify and select seeds and plants. ii. Manipulate and evaluate environmental conditions (e.g.,
irrigation, mulch, shading) to foster plant germination, growth and development.
iii. Evaluate and demonstrate planting practices (e.g., population rate, germination/seed vigor, inoculation, seed and plant treatments).
iv. Evaluate and demonstrate transplanting practices. v. Prepare soil/media for planting. vi. Control plant growth (e.g., pruning, pinching, disbudding,
topping, detasseling, staking, cabling, shearing, shaping). vii. Prepare plants and plant products for distribution.
b. Apply fundamentals of plant management to harvest, handle and
store crops. i. Determine crop maturity. ii. Identify harvesting practices and equipment. iii. Calculate yield and loss. iv. Identify options for crop storage.

146
IV. Analyze the importance of plants with relation to governmental policy and the Global Food Systems. a. Define global food systems. b. Discuss policies, laws, and the administration of plant sciences. c. Discuss the advancements in biotechnology in relation to plant
sciences.

147
Appendix B Animal Systems Core Content Outline
I. Apply knowledge of anatomy and physiology to produce and/or manage animals in a domesticated or natural environment. a. Use classification systems to explain basic functions of anatomy
and physiology. i. Identify how animals are scientifically classified ( kingdom,
phylum, class, order, family, genus, species) ii. Describe functional differences in animal structures and
body systems. 1. Differentiate between herbivores, omnivores and
carnivores and give examples of each 2. Compare an animal cell to a plant cell.
a. Explain the parts and functions of the animal cell.
3. Provide an overview of all major systems of the body including circulatory, skeletal, nervous, digestive, reproductive, respiratory, etc.
iii. Classify animals according to anatomy and physiology. 1. Livestock
a. Identify the basic characteristics of livestock. b. Define and identify the major bones of
various livestock skeletons. c. Identify different breeds of livestock. d. Judge livestock.
2. Companion animals a. Identify basic characteristics of companion
animals. b. Identify breeds of dogs according to AKC
classifications. c. Identify cat groups and breeds according to
CFA. 3. Laboratory and exotic species
a. Identify basic characteristics of laboratory and exotic species.
b. Analyze a subject animal to determine the nature of its health
status. i. Perform simple procedures in evaluating an animal’s
health status.

148
ii. Identify symptoms of diseases, illnesses, parasites, and other health-related problems.
1. Define parasitism, endoparasites, ectoparasites 2. Identify infectious diseases 3. Identify non-infectious diseases 4. Identify common internal parasites of livestock and
companion animals. 5. Identify common external parasites of livestock and
companion animals iii. Diagnose animal ailments iv. Identify and implement (i.e., treat) treatment options
1. Demonstrate basic first-aid for animals (bandages, wraps, shots, restraints, etc
2. Describe types of vaccines.
II. Recognize animal behaviors to facilitate working with animals safely a. Develop a safety plan for working with a specific animal
i. Explain factors that serve to stimulate or discourage given types of animal behavior.
ii. Perform safe handling procedures when working with animals.
iii. Describe situations that could cause physical harm when working with animals.
III. Provide proper nutrition to maintain animal performance.
a. Examine animal developmental stages to comprehend why nutrient requirements are different throughout an animal’s life cycle.
i. Recognize the different phases of an animal’s life cycle. ii. Select diets that provide the appropriate quantity of
nutrients for each animal developmental stage. 1. Classify the major nutrient groups and identify
foods that are associated with each group. iii. Analyze a feed ration to determine whether or not it fulfills
a given animal’s nutrient requirement. 1. Explain how to read a feed/pet label 2. Read and utilize MSDS sheets 3. Calculate nutrient requirements for various animals
given feed labels 4. Create a balance ration for a given animal.
IV. Know the factors that influence an animal’s reproductive cycle to explain species response.
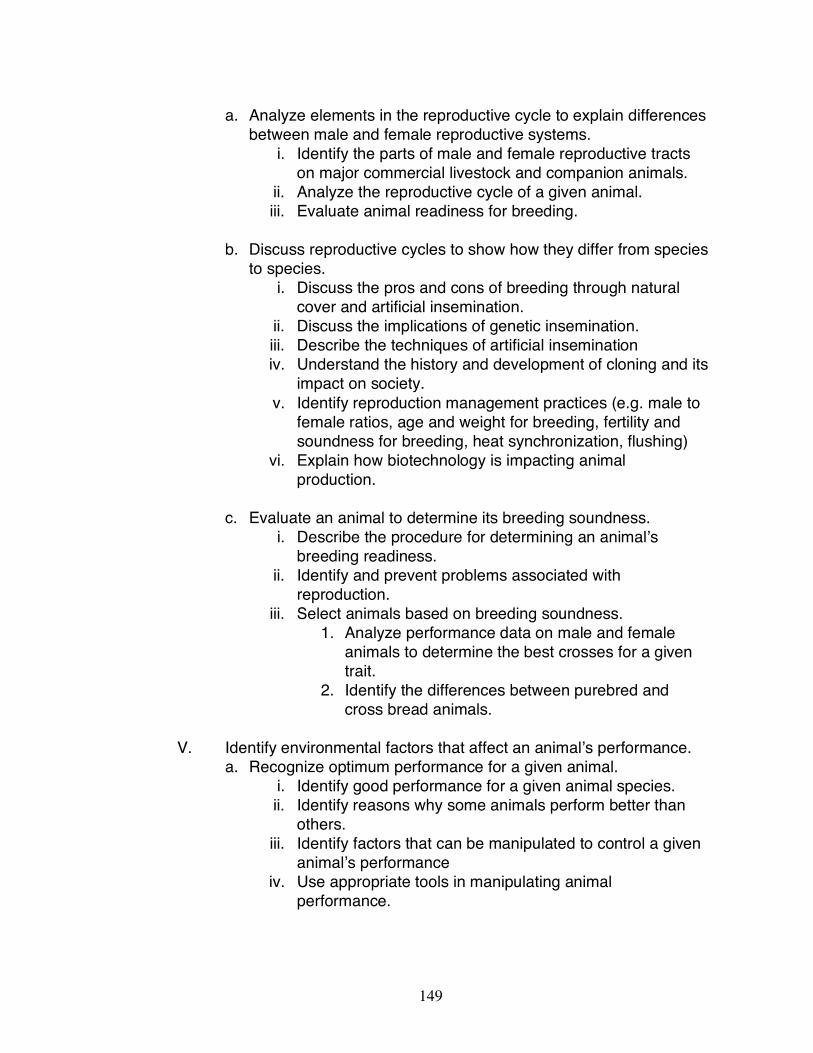
149
a. Analyze elements in the reproductive cycle to explain differences between male and female reproductive systems.
i. Identify the parts of male and female reproductive tracts on major commercial livestock and companion animals.
ii. Analyze the reproductive cycle of a given animal. iii. Evaluate animal readiness for breeding.
b. Discuss reproductive cycles to show how they differ from species
to species. i. Discuss the pros and cons of breeding through natural
cover and artificial insemination. ii. Discuss the implications of genetic insemination. iii. Describe the techniques of artificial insemination iv. Understand the history and development of cloning and its
impact on society. v. Identify reproduction management practices (e.g. male to
female ratios, age and weight for breeding, fertility and soundness for breeding, heat synchronization, flushing)
vi. Explain how biotechnology is impacting animal production.
c. Evaluate an animal to determine its breeding soundness.
i. Describe the procedure for determining an animal’s breeding readiness.
ii. Identify and prevent problems associated with reproduction.
iii. Select animals based on breeding soundness. 1. Analyze performance data on male and female
animals to determine the best crosses for a given trait.
2. Identify the differences between purebred and cross bread animals.
V. Identify environmental factors that affect an animal’s performance.
a. Recognize optimum performance for a given animal. i. Identify good performance for a given animal species. ii. Identify reasons why some animals perform better than
others. iii. Identify factors that can be manipulated to control a given
animal’s performance iv. Use appropriate tools in manipulating animal
performance.

150
1. Identify proper equipment needed for livestock care and maintenance.
b. Assess an animal to determine if it has reached its optimum
performance level. i. Make appropriate changes in an animal’s environment in
order to achieve optimum performance 1. Describe and explain the environmental concerns
associated with raising animals in confinement. ii. Develop efficient procedures to produce insistently high-
quality animals, well suited for their intended purpose. 1. Identify a given species’ desirable production
numbers (e.g. birth weight, rate of gain, age of maturity, age of sexual maturity)
2. Evaluate desired traits (e.g. production) of animals. 3. Evaluate the role that economics plays in animal
production. a. Identify products derived from major
commercial livestock. b. Identify uses for manures and other wastes
from cattle, sheep, hogs, poultry, etc. 4. Make a decision of using new techniques and
methods in the production facility so that both profit and animal safety are maximized.
VI. Animal Issues a. Identify and discuss major issues impacting the animal
production industry today. b. Compare and contrast animal rights v. animal welfare.
VII. Careers in animal systems a. Identify careers associated with animals and animal systems.

151
Appendix C
Writing Multiple-Choice Test Items PPT Outline
Slide 1: Writing Multiple-Choice Test Items
Agricultural Science Education Assessment Project
Slide 2: Overview
• What we measure with test items?
• Writing multiple-choice items
• Specific guidelines for test item writing
Slide 3: Knowledge & Skills
To achieve at the knowledge and skill level = Student ability
• Knowledge: Lowest level of cognition
• Skills: Complex acts that require knowledge and involves performance
• Mental Ability: Resembles skills but more complex
Slide 4: Content
• Facts: Basic knowledge that is not disputed
• Concepts: Classes of objects or events that share a common set of traits
• Principle: Cause and Effect, Relationship between two concepts, law of
probability, axiom
• Procedure: Sequence of mental and/or physical acts leading to a result
Slide 5: Types of Mental Behavior
• Recall
• Understanding
• Critical Thinking
• Problem Solving

152
Slide 6: Recall
Any item may really test recall if teaching is aimed at having student memorize
responses to questions that may otherwise appear to test something other than recall.
This is the difference between teaching to the test and teaching so that test
performance is good. The latter is what we want to emphasize.
Slide 7: Understanding
• Similar to comprehension on Bloom’s Taxonomy
• Applies to facts, concepts, principles, and procedures
• Key Verbs in Items: Define, demonstrate, find, exemplify, illustrate, list, listen,
provide, show, and tell
Slide 8: Critical Thinking
• Reflect, Compare, Evaluate, Make Judgment
• Key Verbs: Anticipate, appraise, attack, analyze, classify, compare, contrast,
critique, defend, distinguish, expect, evaluate, hypothosize, infer, judge,
predict, relate, value
Slide 9: Problem Solving
A set of mental steps leading to the realization of a goal.
Process:
1. Problem identification
2. Problem definition
3. Analysis
4. Proposed Solution
5. Experiment
6. Conclusion
Slide 10: Test Item Considerations
Reliability & Validity

153
Slide 11: Reliability
• Wording is clear
• Use appropriate vocabulary
• No tricky answers
• No double negatives
• Moderate difficultly level (not too easy or not too hard)
• Avoid complex or multiple sentences
Slide 11: Validity
• Matches instructional objectives/criterion
• Measures the type of student outcome
• Measures the content taught
• Measure performance at cognitive level taught
Slide 12: Multiple-Choice Items
• Stem
• Alternative: Correct response & Distractors (incorrect responses)
Slide 13: Consistent format
Stems:
• Stated as briefly and concisely as possible
• Use direct questions or statements
• Use words known to the students- Avoid window dressing
• One central problem or question
• Include as much of the item as possible so that students need not reread the
same material in each alternative

154
Slide 14: Stem Examples Poor Example: If a gas is compressed
A. its temperature increases. B. its temperature decreases. C. its temperature remains the same. D. its temperature fluctuates up and down.
This is a poor example because it rereads the same material in each alternative Slide 15: Stem Examples Good Example of the same question: Compressing a gas causes its temperature to
A. increase. B. decrease. C. remain the same. D. fluctuate up and down.
Slide 16: Alternatives
• Consistent format • Correct response
o Clearly correct o Grammatically correct with the stem o Logical or numerical order.
Slide 17: Distractors
• Plausible • Grammatically correct with stem • Should NOT include “none of the above” or “all or the above”
or “a, b, & not c” • +/- equal in length with correct response

155
Appendix D
A Template for Developing a Multiple-Choice Test Item
Choose the type of student outcome:
Knowledge Mental Skill Mental Ability
What content are you measuring?
Fact Concept Principle Procedure
What type of mental behavior are you developing?
Recall Understanding Critical Thinking Problem Solving
Stem: Correct Answer: Distractor 1: Distractor 2: Distractor 3:

156
Appendix E
Test Content Validation Form
Judge: ________________________________
Title: _________________________________
Location: Cobleskill, NY Pathway: Plant Systems Date: March 14, 2006
Please read each objective and it’s corresponding items. For each test item, please make two judgments.
1. Do you feel the item assesses its intended objective? Circle “Y” for “yes” of “N” for “no” to indicate your opinion. If you are uncertain, circle “N” and explain your concern in the comments section.
2. Do you see any technical problem with the item? For example, is there more than one corret answer among the alternatives? Is there a cue to the correct answer within the item? Is the indicated correct answer indeed correct? Circle O.K. if you see no problems; circle the “?” if you do see technical problems, and explain your concern in the comments section.
Please feel free to add any additional comments (on back) you think would be helpful to the designers of this test.

157
Appendix F
Multiple-Choice Item Criteria
Item Number Met Not Met Item Content Analysis Item based on an instructional objective (in our case the Core Curriculum outline benchmarks).
Items focused on a single problem. Vocabulary is kept consistent with the group of students being tested (secondary students).
Items are kept independent of one another. No item cuing. Over specific knowledge is avoided. Item is not based on opinion. At least one of the items from the three on the review sheet emphasize higher level thinking.
Stem Construction Analysis If possible items stems are in question format and not completion format.
If a completion format is used, a blank is not left in the middle or the beginning of the stem.
The directions in the stem are clear and that wording lets the examinee know exactly what is being asked.
Excess verbiage in the stem is avoided. The stem is worded positively; negative phrasing is avoided. The central idea and most of the phrasing is included in the stem and not in the options.
Option Analysis (For correct and distractor options) Use as many plausible distractors as possible. Options are placed in logical or numerical order. Options are independent; options should not be overlapping. All options are homogeneous in content. Options are similar in length. Phrases such as “all of the above”, “none of the above” and “I don’t know are not included.
There is only one correct answer. Option Analysis (For distractor options) Distractors are plausible. Technical phrases are used. True, incorrect phrases are used. The use of humor is avoided.

158
REFERENCES
Aiken, L.R. (1994). Psychological testing and assessment (8th ed.). Needham
Heights, MA: Allyn and Bacon.
Allen, M.J, & Yen, W.M. (2001). Introduction to measurement theory.
Longrove, IL: Waveland Press.
American Psychological Association, American Educational Research
Association, National Council on Measurement and Education. (1999).
Standards for educational and psychological testing. Washington, DC:
American Psychological Association.
American Psychological Association (1985). Standards for educational and
psychological testing. Washington, DC. American Psychological
Association.
American Psychological Association (1966). Standards for educational and
psychological testing. Washington, DC. American Psychological
Association.
American Psychological Association (1954). Standards for educational and
psychological testing. Washington, DC. American Psychological
Association.
Anastasi, A. (1988). Psychological testing (6th ed.). New York: Macmillan.
Baker, Frank (2001). The Basics of Item Response Theory. ERIC
Clearinghouse on Assessment and Evaluation, University of Maryland,
College Park, MD.

159
Beatty, A., Neisser, U., Trent, W.T., & Heubert, J.P. (2001). Understanding
dropouts: Statistics, strategies, and high-stakes testing. Retrieved
August 28, 2006 from
http://darwin.nap.edu/books/0309076021/html/R1.html.
Bennet, R.E., Rock, D.A., & Wang, M. (1990). Equivalence of free-responses
and multiple-choice items. Journal of Educational Measurement, 28,
77-92.
Berk, R.A. (1978). The application to structural facet theory to achievement
test construction. Educational Research Quarterly, 42, 145-170.
Bishop, J.H., Mane, F., Bishop, M., & Moriarty, J. (2001). The role of end-of-
course exams and minimum competency exams in standards-based
reforms. Brookings Papers on Education Policy, 2001, 267-345
Bock, R.D. (1972). Estimating item parameters and latent ability when
responses are scored in two or more nominal categories.
Psychometrika, 37, 29-51.
Bolon, C. (2000). School-based standard testing. Education Policy Analysis
8, (23) Retrieved August 28, 2006 from
http://epaa.asu.edu/epaa/v8n23/.
Borko, H., & Elliot, R.(1999). Hands-on pedagogy versus hands-off
accountability: Tension between competing commitments for exemplary
math teachers in Kentucky. Phi Delta Kappan, 80, 394-400.
Bormuth, J.R. (1970). On the theory of achievement test items.
Psychometrika, 35, 509-511.
Bracht, G.H., & Hopkins, K.D. (1970). On a theory of achievement tests.
Chicago: University of Chicago Press.

160
Bridgeman, B., & Rock, D.A. (1993). Relationship among multiple-choice and
open-ended analytical questions. Journal of Educational Measurement,
30, 313-329.
Brownell, W. A. (1933). On the accuracy with which reliability may be
measured by correlating test halves. Journal of Experimental
Education, 1, 204-215.
Bush, G.W. (1991). America 2000: An educational strategy. Washington, DC:
US Department of Education.
Butts, R.F. & Cremin, L.A. (1953). A History of Education in American Culture.
New York: Holt, Rinehart & Winston.
Byrnes, D.A. (1989). Attitudes of student and educators towards repeating a
grade in L.A. Shepard and M.L. Smith (Eds.), Flunking Grades:
Research and policies on retention (pp. 108-131). Philadelphia, PA:
Falmer Press.
Capen, S.P. (1921). Review of Recent Federal Legislation on Education. In
Proceedings of a Conference on The Relation of the Federal
Government to Education (pp. 77-88). Urbana, IL: University of Illinois.
Cannell, J.J. (1987). Nationally normed elementary achievement testing in
America’s public schools: How all fifty states are above the national
average (2nd ed.). Daniels, WV: Friends of Education.
Castellano, M., Stringfield, S. & Stone III, J.R. (2003). Secondary career and
technical education and comprehensive school reform: Implications for
research and practice. Review of Educational Research, 73 (2), pp.
231-272.
Castro, J.G. & Jordan, J.E. (1977). Facet theory attitude research.
Educational Researcher, 11, 7-11.

161
Clark, M., Haney, W., & Madaus, G. (2000). High stakes testing and high
school completion. Retrieved August 28, 2006 from
http://www.bc.edu/research/nbetpp/publications/v1n3.html.
Coffman, W.E. (1971). Essay examinations. In R.L. Thorndike (Ed.),
Educational Measurement (2nd ed., pp. 271-302). Washington, DC:
American Council of Education.
Cooper, B.S, Fusareli, L.D. & Randall, E.V. (2004). Better Policies, Better
Schools: theories and Applications. Boston, MA: Pearson.
Cortiella, C. (2004). Implications of high-stakes testing for students with
learning disabilities. Retrieved May 2, 2005 from
http://www.schwablearning.org/articles.asp?r=846&g=2.
Corbett, H.D., & Wilson, B.L. (1991). Testing, reform, and rebellion. Norwood,
NJ: Ablex.
Cremin, L.A. (1961). The Transformation of The School: Progressivism in
American Education 1876-1957. New York, NY: Alfred A. Knopf, Inc.
Crocker, L, & Algina, J. (1986). Introduction to classical and modern test
theory. New York: Hold, Rinehart, and Wilson.
Cronbach, L.J. (1990). Essentials of psychological testing (5th ed.). New
York: Harper & Row.
Cronbach, L. J.1(1980). Toward reform of program evaluation: Aims, methods,
and institutional arrangements. San Francisco: Jossey-Bass.
Cronbach, L.J. (1989). Construct validation after thirty years. In R.E. Linn
(Ed.), Intelligence: Measurement, theory and public policy (pp. 147-
171). Urbana: University of Illinois Press.
Cronbach, L.J. (1988). Fiver perspectives on validity argument. In H. Wainer
& H.I. Braun (Eds.), Test validity (pp. 3-17). Hillsdale, NJ: Erlbaum.

162
Cronbach, L. J. (1951). Coefficient alpha and the internal structure of tests.
Psychometrika, 16,
297-334.
Darling-Hammond, L. (1998). Alternatives to grade retention. The School
Administrator Web Edition.
http://www.aasa.org/publications/saarticledetail.cfm?ItemNumber=4466
(accessed February 14, 2006).
Dillon, S (2006). Schools Cut Back Subjects To Push Reading and Math. The
New York Time Select. The New York Times Company, March 26,
2006.
Ebel, R.L. (1979). Essentials of educational measurement (3rd ed.).
Englewood Cliffs, NJ: Prentice-Hall Inc.
Ebel, R.L., & Frisbie, D.A. (1991). Essentials of educational measurement (5th
ed.). Englewood Cliffs, NJ: Prentice Hall.
Elementary and Secondary School Act. Public Law 89-10 (Aprill 11, 1965).
Elemore, R.F. & Rothman, R. (Eds.) (1999). Testing, teaching, & learning: A
guide for states and school districts. A report of the National Research
Council’s Committee on Title I Testing and Assessment. Washington,
DC: National Academy Press.
Engle, J.D. & Martuza, V.R. (1976). A systematic approach to the construction
of domain referenced multiple-choice test items. Paper presented at
the meeting of the American Psychological Association. Washington,
DC.
Ferguson, G.A. (1942). Item selection by the constant process.
Psychometrika 7, 19-29.

163
Fiske, E.B. (1990). Smart schools, smart kids: Why do some schools work?
New York: Simon and Schuster.
Foa, U.G. (1968). Three kinds of behavioral objectives. Psychological
Bulletin, 70, 460-473
Foley, A. (1973). A bolton childhood. Manchester: Manchester Extra Mural
Department of the WEA.
Fraser, J.W. (2001). The School in the United States: A Documented History.
Boston, MA: McGraw- Hill.
Glaser, R. (1984). Criterion-referenced tests: Part I. origins. Educational
Measurement: Issues and Practice, 13(4). 9-11; 27-30.
Glaser, R. (1963). Instructional technology and the measurement of learning
outcomes: Some questions. American Psychologist, 18, 519-521.
Glatthorn, A & Fontana, J. (2000). Coping with standards, tests, and
accountability: Voices from the classroom. Alphareta, GA: NEA
Professional Library.
Goertz , M.E. (2001, September). The federal role in defining "adequate yearly
progress:" The flexibility/accountability trade-off. Consortium for Policy
Research in Education. Retrieved May 25, 2006 , from
http://www.cpre.org/Publications/cep01.pdf.
Goertz, M.E. (2001). Standards-based Accountability: Horse Trade or Horse
Whip? In S. Fuhrman (Ed.), From the Capitol to the Classroom:
Standards-based Reform in the States (pp. 39-59). Chicago: The
University of Chicago Press.
Goertz, M.E., Duffy, M.C., & Le Froch, K.C. (2001). Assessment and
Accountability Systems in the 50 States: 1999-2000. CPRE Research
Report Series. RR-046- March 2001.

164
Grissom, K.B, & Sheperd, L.A. (1989). Attitudes of student and educators
towards repeating a grade in L.A. Shepard and M.L. Smith (Eds.),
Flunking Grades: Research and policies on retention (pp. 108-131).
Philadelphia, PA: Falmer Press.
Gronlund, N.E., & Linn, R.L. (1990). Measurement and evaluation in teaching
(6th ed.). New York: Macmillan.
Guion, R. M. (1974) Open a new window: Validities and values in
psychological measurement. American Psychologist, 29, 287-296.
Guliford, J.P. (1967). The nature of human intelligence. New York: McGraw-
Hill.
Guttman, L. (1945). A basis for analyzing test-retest reliability. Psychometrika,
10, 255-282.
Guttman, L.A. (1959). A structural theory for intergroup beliefs and actions.
American Sociological Review, 24, 318-328.
Guttman, L.A. & Schlesinger, I.M. (1967). Systematic construcion of
distractors for ability and achievement testing. Educational and
Psychological Measurement, 27, 569-580.
Guttman, L.A. (1969). Integration of test design and analysis. In Proceedings
of the 1969 invitational conference of testing problems. Princton, NJ:
Educational Testing Service.
Haladyna, T.M. (2004) Developing and validating multiple-choice test items, 3rd
ed. Hillsdale, NJ: Lawrence Erlbaum Associates
Haladyna, T.M. (1994). Developing and validating multiple-choice test items.
Hillsdale, NJ: Lawrence Erlbaum Associates.
Haladyna, T.M. (1999). Developing and validating multiple-choice test items
(2nd ed.). Hillsdale, NJ: Lawrence Erlbaum Associates.

165
Haladyna, T.M., & Downing, S.M. (1989a). A taxonomy of multiple-choice
item-writing rules. Applied Measurement in Education, 1, 37-50.
Haladyna, T.M., & Downing, S.M. (1989b). The validity of a taxonomy of
multiple-choice item-writing rules. Applied Measurements in Education,
1, 51-78.
Hambleton, R.K. (1994). The rise and fall of criterion referenced
measurement? Educational Measurement: Issues and Practice, 13(4).
21-26.
Hambleton, R.K. (1984). Validating the test scores. In R.A. Berk (ed.). A
guide to criterion-referenced test construction. Baltimore, MD: The
John Hopkins University Press, pp. 199-230.
Hambleton , R.K. & Rogers, H.J. (1991). Advances in criterion-referenced
measurement in R. Hambleton & J. Zaal (eds.) Advances in educational
and psychological testing. Boston: Kluwer Academic Publishers.
Hambleton, R.K., Swaminathan, H., Algina, J., & Coulson, D.B. (1978).
Criterion-referenced testing and measurement: A review of technical
issues and developments. Review of Educational Research, 48. 1-47.
Heim, A.W., & Watts, K.P. (1967). An experiment on multiple-choice versus
open-ended answering in a vocabulary test. British Journal of
Educational Psychology, 37, 339-346.
Henrysson, S. (1963). Correction of item-total correlation in item analysis.
Psychometrika, 28, 211-218.
Hess, F.M., McGuinn, P.J. (2002). Seeking the Mantle of “Opportunity”:
Presidential Politics and the Educational Metaphor, 1964-2000.
Educational Policy 16(1), 72-95.

166
Hivey, W., Patterson, H.L., & Page, S.A. (1968). A “universe-defined” system
of arithmetic achievement test. Journal of Educational Measurement, 5.
275-290.
Holmes, C.T. (1989). Attitudes of student and educators towards repeating a
grade in L.A. Shepard and M.L. Smith (Eds.), Flunking Grades:
Research and policies on retention (pp. 108-131). Philadelphia, PA:
Falmer Press.
Hopkins, K.D., Stanley, J.C., & Hopkins, B.R. (1990). Educational and
psychological measurement and evaluation (7th ed.). Englewood Cliffs,
NJ: Prentice Hall.
Hochschild, J. & Scott, B. (1998). Trends: Governance and reform of public
education in the United States. Public Opinion Quarterly, 62(1), 79-120.
Hoyt, C. (1941). Test reliability estimated by analysis of variance.
Psychometrika, 6, 153-160.
Hurst, D., Tan., A., Meek, A., and Sellers, J. (2003). Overview and Inventory of
State Education Reforms: 1990 to 2000 (NCES 2003-020).
Janesick, V.J. (2001). The assessment debate: A reference handbook. Santa
Barbara, CA: ABC-CLIO.
Johnson, J. & Immerwarh, J. (1994). First things first: What American’s expect
from the public schools. New York: Public Agenda.
Jones, M.G., Jones, B.D., & Hargrove, T.Y. (2003). The unintended
consequences of high-stakes testing. New York: Rowman & Littlefield
Publishers.
Jones, M.G., Jones, D., Hardin, B., Chapman, L., Yarbrough, T, & David, M.
(1999). The impact of high stakes testing on teachers and students.
Phi Delta Kappan, 81, 199-203.

167
Joorabchi, B., & Chawan, A.R. (1975). Multiple-choice questions- the debate
goes on. British Journal of Educational Measurement, 9, 275-280.
Katz, M.B. (1968). The Irony of Early School Reform. Cambridge,
Massachusetts: Harvard University Press.
Kean, M.H. (1995). The national testing movement, redux. The Clearing
House; Mar 1995; 68, 4; Research Library, 201.
Kliebard, H.M. (1995). The cardinal principles report as archeological deposit
in C. Gaylord (ed) Committee of Ten. Cambridge, MA: Harvard
University Press.
Kornhaber, M.L., & Orfield, G. (2001). High-stakes testing policies: Examining
their assumptions and consequences in G. Orfield & M.L. Kornhaber
(Eds.), Raising standards or raising barriers? Inequality and high-stakes
testing in public education (pp. 1-18). New York: Century Foundation.
Kuder, G. F., and Richardson, M. W. (1937). The theory of the estimation of
test reliability. Psychometrika, 2, 151-160.
Lashway, L. (2001). The New Standards and Accountability: Will rewards and
sanctions motivate America’s schools to peak performance? Eugene,
OG: Eric Clearing House on Educational Management.
Lawley, D.N. (1943). On problems connected with item selection and test
construction. Proceedings of the Royal Society of Edinburgh 61, 273-
287.
Levin, H.M. (2001). High-stakes testing and economic productivity in G.
Orfield & M.L. Kornhaber (Eds.), Raising standards or raising barriers?
Inequality and high-stakes testing in public education (pp. 19-38). New
York: Century Foundation.
Life Magazine. (1958) pp. 25-33.

168
Linn, R.L. (2000). Assessment and Accountability. Educational Researcher
29(2), 4-16.
Linn, R.L. (1984). Criterion-referenced measurement: A valuable perspective
clouded by surplus meaning. Educational Measurement: Issues and
Practice, 13(4). 12-14.
Lord, F.M. & Novick, M.R. (1968). Statistical theories of mental test scores.
Reading, MA: Addison-Wesley.
Madaus, G. F. & Clarke, M. (2001). The adverse impacts of high-stakes
testing on minority students: Evidence from one hundred years of test
data in G. Orfield & M.L. Kornhaber (Eds.), Raising standards or raising
barriers? Inequality and high-stakes testing in public education (pp. 85-
106). New York: Century Foundation.
Madaus, G.F., Airasian, P.W., & Kellaghan, T. (1980). School effectiveness: A
reassessment of the evidence. New York: McGraw-Hill Book
Company.
MAGI Educational Service, Inc. (2004). New York’s state’s Career and
technical policy initiative: Evaluation report. White Plains, NY.
Manzo, K.K. (2000). Legacy of the Eight-Year Study in V.B. Edward (ed.)
Lessons of a century: A Nation’s School Come of Age. Bethesda, MD:
Editorial Projects in Education.
Massell, D. (2001). The Theory and Practice of Using Data to Build capacity:
State and Local Strategies and their Effects in S.H. Fuhrman (ed.) From
the Capital to the Classroom: Standards-based Reform in the States.
Chicago, IL: The University of Chicago Press.

169
Masters, G.N. (1988). Partial credit models. In J.P. Keeves (Ed.) Educational
research methodology, measurements and evaluation (pp. 292-296).
Oxford: Pergamon Press.
Markle, S.M., & Tiemann, P.W. (1970). Really understanding concepts.
Champaign, IL: Stipes.
Marschall, M.J., & McKee, R.J. (2002). From campaign promises to
presidential policy: Education reform in the 2000 election. Educational
Policy 16(1), 96-117.
McCall, W.A. & Bixler, H.H. (1928). How to Classify Pupils. New York:
Bureau of Publications Teachers College, Columbia University.
McDonnell, L.M. (2004). Politics, Persuasion, and Educational Testing.
Cambridge, MA: Harvard University Press.
McNeil, L. (2000). Contradictions of school reform: Educational cost of
standardized testing. New York: Routledge.
McNeil, L. & Valenzuela, A. (2001). The harmful impact of the TAAS system
of testing in Texas: Beneath the accountability rhetoric in G. Orfield &
M.L. Kornhaber (Eds.), Raising standards or raising barriers? Inequality
and high-stakes testing in public education (pp. 127-150). New York:
Century Foundation.
Mehrens, W.A. & Lehmann, I.J. (1987). Using standardized tests in education
(4th ed.). New York: Longman.
Meeker, M, Meeker, R, & Roid, (1985). Structure of intellect leaning ability
tests. Los Angeles, CA: Western Psychological Services.
Messick, S. (1989). Validity. In R.L. Linn (Ed.), Educational Measurement (3rd
ed., pp. 13-104). New York: American Council on Education and
Macmillan.

170
Messick, S. (1975). The standard problem: Meaning and values in
measurement and evaluation. American Psychologist, 30, 955- 966.
Millman, J. (1984). Criterion-referenced testing 30 years later: Promises
broken, promises kept. Educational Measurement: Issues and Practice,
13(4). 19-20, 39.
Millman, J., & Greene, J. (1989). The specification and development of tests
of achievement and ability. In R.L. Linn (Ed.) Educational Measurement
(3rd ed., pp. 335-366). New York: American Council on Education and
Macmillan.
Mondale, S & Patton, S.B. (eds.) (2001). School: The Story of American Public
Education. Boston, MA: Beacon Press.
Moe T & Chubb, J.E. (1990). Politics, markets, and America’s schools.
Washington, D.C.: Brookings Institution.
Monroe, W.S. (Ed.). (1952). Encyclopedia of Educational Research: A Project
of the American Educational Research Association. New York: The
Macmillan Company.
Mosier, C.I. (1940). Psychophysics and mental test theory: Fundamental
postulates and elementary theorems. Psychological Review, 47, 355-
366.
Mosier, C.I. (1941). Psychophysics and mental test theory II: The constant
process. Psychological Review, 48, 235-239.
Moss, P. (1992). Shifting conceptions of validity in educational
measurements: Implications for performance assessment. Review of
Educational Research, 62, 229-258.
National Center for Educational Statistics (NCES). (2003) Digest of
Educational Statistics. Washington, DC: GPO.

171
National Commission on Excellence in Education. (1983) A nation at risk: The
imperative for educational reform. A Report to the Nation and the
Secretary of Education .
National Committee for Support of Public Schools. (1966). Education and
social change. Washington, DC.
National Council for Agricultural Education (2006). Agriculture and natural
resources brochure. Retrieved July 7, 2006 from
http://www.careerclusters.org/clusters/anr.cfm.
National Council for Agricultural Education (2004). 2004-2006 Strategic Plan.
Retrieved August 29, 2005, from
http://www.agedhq.org/strategicplan.htm
National Defense Education Act, Public Law 85-864.
National Occupational Competency Testing Institute. (n.d.). Student
assessment. Retrieved May 25, 2006, from
http://www.nocti.org/student.cfm
National School Boards Association (2004). "Highly Qualified Teacher"
Changes to No Child Left Behind. Retrieved July 26, 2004 from
http://www.nsba.org/site/doc.asp?TRACKID=&VID=2&CID=870&DID=3
3335
Nickerson, R. S. (1989). New directions in educational assessment.
Educational Researcher, 18, 3-7.
Nunnally, J.C., & Bernstein, I. (1994). Psychometrics Theory (3rd ed.). New
York: McGraw-Hill.
Osterlind, S.J. (1989). Constructing test items. Boston: Kluwer Academic
Publishers.

172
Patterson, D.G. (1926). Do new and old type examinations measure different
mental funcations? School and Society, 24, 246-248.
Perreault, G. (2000). The classroom impact of high-stakes testing. Education,
120, 705-710.
Peters, G., Woolley, J. (2001). The American Presidency Project. State of the
Union Message. Retrieved April 29, 2005 from source
http://www.presidency.ucsb.edu/ws/index.php?pid=29643
Peterson, J.J. (1983) The Iowa Testing Programs. Iowa City, IA: University of
Iowa Press.
Popham, W.J. (2003). Test better, teach better: The instructional role of
assessment. Alexandria, VA: Association for Supervision and
Curriculum Development.
Popham, W.J. (1993). Educational evaluation. Boston: Allyn and Bacon.
Popham, W.J. (1990). Modern educational measurement: A practitioner’s
perspective (2nd ed.). Needham Heights, MA: Allyn and Bacon.
Popham, W.J. (1984). Specifying the domain of content or behaviors in R.
Berk (ed.) A guide to criterion-referenced test construction (pp. 29-48).
Baltimore, MD: The John Hopkins University Press.
Popham, W.J. (1975). Educational evaluation. Englewood Cliffs, NJ:
Prentice-Hall, Inc.
Popham, W.J., & Husek, T.R. (1969). Implications of criterion-referenced
measurement. Journal of Educational Measurement, 6, 1-9.
Rasch, G. (1960). Probabilistic models for some intelligence and attainment
tests. Copenhagen, Denmark: Danish Institute for Educational
Research.

173
Rasch, G. (1961). On general laws and the meaning of measurement in
psychology, Proceedings of the Fourth Berkeley Symposium on
Mathematical and Statistics and Probability (Vol. 4, pp. 321-333).
Berkeley: University of California Press.
Ravitch, D. (2005). Every state left behind in The New York Times. November
7, 2005 from http://www.nytimes.com/2005/11/07/opinion/07ravitch.html
accessed on November 11, 2005.
Ravitch, D. (1995). National standards in American education: A citizen’s
guide. Washington, D.C.: The Brookings Institution.
Ravitch, D. (1983). The troubled crusade: American education, 1945-1980.
New York: Basic Books Publishers.
Ravitch, D. & Viteritti, J.P. (2001). Making Good Citizens: Education and Civil
Society. New Haven, CT: Yale University Press.
Resnick, D. (1982). The History of Educational Testing in (A. Wigdor & W.
Garner, eds) Ability Testing: Uses, Consequences, and Controversies
Part 2. Washington, DC: National Academy Press.
Rodriguez, M.C. (2002). Choosing an Item Format in G. Tindal & T.H.
Haladyna (eds.) Large-Scale Assessments for all students. Mahwah,
NJ: Lawrence Erlbaum Associates.
Roid, G.H. & Haladyna, T.M. (1982). A technology for test-item writing. New
York: Academy Press.
Rose, L.C., Gallup, A.M., & Elam, S.M. (1997). The 32nd annual Phi Delta
Kappa/Gallup poll of the public’s attitudes towards public schools. Phi
Delta Kappan, 82(1), 41-57.
Rulon, P. J. (1939). A simplified procedure for determining the reliability of a
test by split-halves. Harvard Educational Review, 9, 99-103.

174
Rury, J.L. (2005). Education and Social Change- Themes in the History of
American Schooling (2nd ed.). Mahwah, New Jersey: Lawrence
Erlbaum Associates.
Samejima, F. (1979). A new family of models for multiple-choice items.
Research report 79-4 under Office of Naval Research Contract N00014-
77-C-360, NR 150-402. Austin, TX: University of Texas.
Samejima, F. (1969). Estimation of latent ability using a response pattern of
graded scores. Psychometrika, Monograph Supplement No. 17.
Sax, G. (1989). Principles of educational and psychological measurement and
evaluation. Belmont, CA: Wadsworth.
Schafer, W.E. & Olexa, C. (1971) Tracking and Opportunity: The Locking-out
process and beyond. Scranton, PA: Chandler Publishing Company.
Schmidt, W.H., McKnight, C.C., & Raizen, S.A. (1996). A splintered vision: An
investigation of U.S. science and mathematics education. East
Lansing, MI: US National Research Center for the Third International
Mathematics and Science Study.
Schorr, R.Y., & Firestone, V.A. (2001, April). Changing mathematics teaching
in response to a state testing program: A fine grained analysis. Paper
presented at the meeting of the American Educational Research
Association, Seattle, WA.
Shepard, L, & Doughtery, K. (1991, April). Effects of high-stakes testing on
instruction. Paper presented at the annual meeting of the American
Educational Research Association, Chicago, IL. (ERIC Document
Reproduction Service NO. ED337468)

175
Shock, S.A. & Coscarelli, W.C. (2000). Criterion-Referenced Test
Development (2nd ed.). Silver Springs, MD: International Society for
Performance Improvement.
Solomon, P. (2002). The assessment bridge: Positive ways to link tests to
learning, standards, and curriculum improvement. Thousand Oaks, CA:
Corwin Press, Inc.
SOI Systems Structure of Intellect (n.d.) SOI application areas. from Retrieved
February 1, 2005 from http://www.soisystems.com/application.html
Snell, L. (2001) Schoolhouse Crock in J.W. Noll (ed.) Taking Sides: Clashing
Views on Controversial Educational Issues (12th ed.). Guliford, CT:
McGraw-Hill/Dushkin.
Spring, J. (1990). The American School 1642-1993 (3rd ed.). New York, NY:
McGraw-Hill, Inc.
State Education Department (1987). History of Regents examinations: 1865-
1987. Retrieved September 15, 2005, from
http://www.emsc.nysed.gov/osa/hsinfogen/hsinfogenarch/rehistory.htm
Stevenson, D. (1995). Goals 2000 and local reform. Teachers College
Record, 96(3). P. 458-466.
Texas Education Agency. (nd). Data resources and research. Retrieved May
1, 2006 from http://www.tea.state.tx.us/data.html
Thissen, D., Chen, W., & Bock, D. (2003). MULTILOG (version 7) [Computer
sotware]. Lincolnwood, IL: Scientific Software International.
Thissen, D., Steinberg, L., & Fitzpatrick, A.R. (1989). Multiple-choice Models:
The distractors are also part of the item. Journal of Educational
Measurement 26, (2) 161-176.

176
Thissen, D & Steinberg, L. (1984). A response model for multiple-choice
items. Psychometrika 49, 501-519.
Thorndike, R.L. (1982). Applied Psychometrics. Boston: Hougton-Mifflin.
Thurstone, L.L. (1927). A law of comparative judgment. Psychological Review,
34, 278-286.
Tiemann, P.W., & Markle, S.M. (1983). Analyzing instructional content: A
guide to instruction and evaluation (2nd ed.). Champaign, IL: Stipes.
Thomas, R.M & Thomas S.M (1965). Individual Differences in the Classroom.
New York: David McKay.
Towner, H.A. (1921). Federal Aid to Education. Its Justification, Degree, and
Method. In Proceedings of a Conference on The Relation of the
Federal Government to Education (pp. 77-88). Urbana, IL: University
of Illinois.
Traub, R.E. (1993). On the equivalence of traits assessed by multiple-choice
and constructed-response tests. In R.E. Bennett & W.C. Ward (Eds.),
Construction versus choice in cognitive measurement: Issues in
constructed response, performance testing, and portfolio assessment
(pp. 1-27). Hillsdale, NJ: Lawrence Erlbaum Associates.
Traub, R.E., & Fisher, C.W. (1997). On the equivalence of constructed
responses and multiple-choice tests. Applied Psychological
Measurement, 1, 355-370.
Tyack, D. (2003). Seeking Common Ground: Public Schools in a Diverse
Society. Cambridge, MA: Harvard University Press.
Tyack, D. (1979). The One Best System: A History of American Urban
Education. Cambridge, MA: Harvard University Press.

177
Tyack, D (1974). The one best system: A history of American urban
education. Cambridge, MA: Harvard University Press.
Tyack, D. & Cuban L. (1995). Tinkering towards Utopia: A Century of Public
School Reform. Cambridge, MA: Harvard University Press.
Tyack, D. & Hansot, E. (1982). Managers of Virtue: Public Schools in
America, 1820-1980. New York: Basic Books.
UCLA Academic Technology Services. (n.d.) SPSS FAQ: What does
Cronbach's alpha mean? Retrieved June 1, 2006 from
http://www.ats.ucla.edu/STAT/SPSS/faq/alpha.html.
US Department of Commerce, Bureau of Census (1975). Historical Statistics
of the United States: Colonial Times to 1970, part 1. Washington, DC:
US Government Printing Office.
US Department of Education (2002). The no child left behind act of 2001.
Retrieved June 1, 2006 from
http://www.ed.gov/nclb/overview/intro/execsumm.html
US Department of Education (nd. a) NAEP: The nation’s report card.
Retrieved August 28, 2006 from
http://nces.ed.gov/nationsreportcard/itmrls/
US Department of Education (nd. b) New No Child Left Behind Flexibility:
Highly Qualified Teachers. Retrieved July 26, 2005 from
http://www.ed.gov/nclb/methods/teachers/hqtflexibility.html
US Department of Education (nd. c) Title I, part A program. Retrieved August
11, 2005 from http://www.ed.gov/programs/titleiparta/index.html.
US Office of Education. (nd). Life Adjustment Education for Every Youth.
Washington, DC: US Government Printing Office.

178
US Office of Education. (1951). Vitalizing Secondary Education: Report of the
First Commission on Life Adjustment Education for Youth. Washington,
DC: US Government Printing Office.
US Congress Office of Technology Assessment. (1992). Testing in American
schools: Asking the right questions. Washington, DC: US Government
Printing Office.
Walker, D.F. (2003). Fundamentals of Curriculum: Passion and
Professionalism. Mahwah, NJ: Lawrence Erlbaum Associates.
Walsh, M. (2000). Assessment Culture in V.B. Edward (ed.) Lessons of a
century: A Nation’s School Come of Age. Bethesda, MD: Editorial
Projects in Education.
Ward, W.C. (1982). A comparison of free responses and multiple-choice
forms of verbal aptitude tests. Applied Psychological Measurement, 6,
1-11.
Wainer, H. (1989). The future of item analysis. Journal of Educational
Measurement, 26, 191-208.
Ward, A. W., Stoker, H. W., & Murray-Ward, M. (Eds.). (1996). Educational
measurement: Origins, theories, and explications (vols. 1-2). Lanham,
MD: University Press of America.
Wechsler, H. (1977). The Qualified Student. New York, NY: John Wiley.
Wesman, A.G. (1971). Writing the test item. In R.L. Thorndike (Ed.)
Educational Measurement (2nd ed., pp. 99-111). Washington, DC:
American Council on Education.
Wideen, M.F., O’Shea, T,. Pye, I., & Ivany, G.(1997). High-stakes testing and
the teaching of science. Canadian Journal of Education, 22, 428-444.