Test database of the mechanical properties of mild, high...
34
1 Test database of the mechanical properties of mild, high- tensile and stainless steel and aluminium alloy associated with cold temperatures and strain rates Jeom Kee Paik a,b,c , Ki Jong Kim d , Jong Hwan Lee e , Bo Gyeong Jung f , and Sang Jin Kim a a The Korea Ship and Offshore Research Institute (The Lloyd’s Register Foundation Research Centre of Excellence ), Pusan National University, Busan 46241, Korea b Department of Naval Architecture and Ocean Engineering, Pusan National University, Busan 46241, Korea c Department of Mechanical Engineering, University College London, London WC1 7JE, UK d Dong Hae Industry Co Ltd, Anyang, Gyeonngi-do 14060, Korea e Dong Sung Electric Machine Co Ltd, Gimhae, Gyeongsangnam-do 50849, Korea f Agency for Defense Development, Daejeon 34186, Korea Abstract In structural analysis and design, it is essential to define the material properties associated with the targeted structural systems. When harsh environmental or operational conditions are of primary concern, the mechanical properties of materials must be quantified by considering the effects of the conditions. As testing is only a method to quantify the material properties, numerous test databases have been developed in the literature – some of which are limited to specific conditions and others that are based on old materials that are no longer in use. Modern material- manufacturing technologies have greatly advanced the material properties featured in old test databases, and today’s structural systems are often exposed to the harsher environmental and operational conditions associated with their functional requirements. Thus, test databases for these volatile material properties should be continuously developed to meet such requirements. The aim of the present study is to develop a new test database on the mechanical properties of materials for marine applications, such as mild steel, high-tensile steel, aluminium alloy 5083-O and stainless steel 304L, focusing on the effects of cold temperatures and strain rates. Discussion of the new test database refers to extant test databases where available. Moreover, test coefficients that may be useful in the existing constitutive equations for the materials are suggested and the details of the test database are documented. Keywords: Mechanical properties; mild steel; high tensile steel; aluminium alloy; stainless steel; cold temperature; strain rate 1. Introduction Ships and offshore structures are typically subjected to dynamic or impact loads while in service. In some cases, they are also exposed to low temperatures in association with Arctic operations or the cryogenic conditions created by liquefied natural gas cargo and its unintended leaks. The mechanical
Transcript of Test database of the mechanical properties of mild, high...

1
Test database of the mechanical properties of mild, high-
tensile and stainless steel and aluminium alloy associated
with cold temperatures and strain rates
Jeom Kee Paika,b,c, Ki Jong Kimd, Jong Hwan Leee,
Bo Gyeong Jungf, and Sang Jin Kima
aThe Korea Ship and Offshore Research Institute (The Lloyd’s Register Foundation Research Centre of Excellence), Pusan
National University, Busan 46241, Korea
bDepartment of Naval Architecture and Ocean Engineering, Pusan National University, Busan 46241, Korea
cDepartment of Mechanical Engineering, University College London, London WC1 7JE, UK
dDong Hae Industry Co Ltd, Anyang, Gyeonngi-do 14060, Korea
eDong Sung Electric Machine Co Ltd, Gimhae, Gyeongsangnam-do 50849, Korea
fAgency for Defense Development, Daejeon 34186, Korea
Abstract
In structural analysis and design, it is essential to define the material properties associated with the targeted structural
systems. When harsh environmental or operational conditions are of primary concern, the mechanical properties of
materials must be quantified by considering the effects of the conditions. As testing is only a method to quantify the
material properties, numerous test databases have been developed in the literature – some of which are limited to
specific conditions and others that are based on old materials that are no longer in use. Modern material-
manufacturing technologies have greatly advanced the material properties featured in old test databases, and today’s
structural systems are often exposed to the harsher environmental and operational conditions associated with their
functional requirements. Thus, test databases for these volatile material properties should be continuously developed
to meet such requirements. The aim of the present study is to develop a new test database on the mechanical
properties of materials for marine applications, such as mild steel, high-tensile steel, aluminium alloy 5083-O and
stainless steel 304L, focusing on the effects of cold temperatures and strain rates. Discussion of the new test database
refers to extant test databases where available. Moreover, test coefficients that may be useful in the existing
constitutive equations for the materials are suggested and the details of the test database are documented.
Keywords: Mechanical properties; mild steel; high tensile steel; aluminium alloy; stainless steel; cold temperature; strain rate
1. Introduction
Ships and offshore structures are typically subjected to dynamic or impact loads while in service. In
some cases, they are also exposed to low temperatures in association with Arctic operations or the
cryogenic conditions created by liquefied natural gas cargo and its unintended leaks. The mechanical

2
properties of structure materials are significantly affected by loading speed (strain rate) and temperature,
among other factors. The strain rate is defined as a relevant ratio of the loading speed to structural
displacement measured between two reference points, i.e., /d dt , where = strain and t = time.
There are typically three major differences between static/quasi-static and dynamic/impact loading
cases (Paik and Thayamballi 2003). First, the stress field differs because tensile stresses can occur even
under compressive far-field loading, and stress concentrations can happen even without notches in an
impact loading situation. Second, the structural response under impact loading varies as a function of the
strain rate. These first and second aspects always interact. The third difference occurs with the failure
strain. Materials in an impact loading condition tend to become brittle, decreasing the failure strain, even
though they are predominantly ductile under static or quasi-static loading conditions. This occurs when
the energy absorption capability by ductile yielding decreases at high strain rates subsequent to the
increase of yield strength itself. In low temperatures, materials also tend to become less ductile or even
brittle, and thus a special treatment during the material manufacturing process together with the relevant
chemical composition is required to prevent brittle fracture in materials intended for use in low
temperatures.
In structural design, it is of obvious importance to select suitable materials. As such, the structural
analyst and designer must develop a comprehensive understanding of the mechanical properties of the
materials used in target structural systems (Paik and Thayamballi 2003; Paik and Melchers 2008; Hughes
and Paik 2013). The mechanical properties of metals depend on many factors, such as their composition,
heat-treatment and thickness (the grain size of thinner rolled steel plating tends to be smaller), along with
the effects of temperature and strain rate for databases that show these effects, see, for example,
Brockenbrough (1991), and Paik and Thayamballi (2003).
The nominal values of the mechanical properties in conjunction with the minimum requirements
specified by design rules are provided by materials manufacturers, but these values are not necessarily
relevant enough for the structural analysis and design. Although the mechanical properties of such
materials can only be characterised through testing, a large test database has been developed from
laboratory tests in the literature (Manjoine 1944; Cowper and Symonds 1957; Bodner and Symonds 1962;
Symonds 1967; Forrestal and Sagartz 1978; Nicholas 1981; KSNA 1983; Campbell and Cooper 1966;
Toyosada et al. 1987; Brockenbrough 1991; Paik and Chung 1999; Itabashi and Kawata 2000; Paik and
Thayamballi 2003; Hsu and Jones 2004; Paik and Thayamballi 2007; Kundu and Chakraborti 2010;
Cadoni et al. 2012; Choung et al. 2013).
The test database in the literature covers different temperature and loading speed conditions for
different types of materials. However, most of them have been obtained for specific conditions associated
with the special purposes of their studies. Moreover, some of the old test databases are not relevant for
use today because they were obtained for very old materials that are no longer in use. Given the
significant advancements in modern material-manufacturing technologies, and because today’s structural
systems are often exposed to harsher environmental and operational conditions, it is important to realise
that the on-going mechanical property characterisation of modern materials must consider the effects of
extreme and accidental conditions.
Another challenge is associated with material modelling techniques that use the so-called constitutive
equations, including some coefficients (Ramberg and Osgood 1943; Cowper and Symonds 1957; Johnson
and Cook 1983; Mazzolani 1985; Jones 2012) determined according to the test database. Although the

3
constitutive equations given in a closed-form expression are convenient for practicing engineering and
design, it is important to realise that they always involve the uncertainties inherent in attempting to
formulate a simplified expression with a limited amount of the test database. In this regard, the material
properties must also be defined by a direct statistical analysis of the raw test database, where the method
of the best-fit prediction is combined with extrapolation and/or interpolation techniques unless other
testing is undertaken.
The aims of the present study are to develop a new test database for modern metals under different
temperature and loading speed (stain rate) conditions; to propose new coefficients for the constitutive
equations based on the new and existing test databases, where available; and to develop a statistical
analysis method for predicting the material properties. Seven types of materials for marine applications
are considered: mild steel (grades A and D), high-tensile steel (AH 32, DH 32 and DH 36), aluminium
alloy 5083-O and stainless steel 304L. Both room and low temperatures are studied by covering low
temperatures (up to -60°C) in an Arctic environment and the cryogenic conditions (up to -160°C)
associated with liquefied natural gas cargo or its unintended leaks. Both quasi-static and high-speed
loading conditions are considered up to a strain rate of 102/s.
2. Characterisation of the Material Properties
It is important to clearly define the characteristics of material properties (Paik and Thayamballi 2003).
Typically, the mechanical properties of materials are characterised by testing pre-designated specimens
under monotonic tensile loading. Figure 1 shows the typical engineering stress–engineering strain curves
for structural metals, which are obtained using monotonic tensile coupon tests. The material properties
can then be characterised using the following parameters:
Young’s modulus (or modulus of elasticity), E
proportional limit, P
upper yield point, YU
lower yield point, YL ( Y )
yield strength, Y
yield strain, Y
strain-hardening strain, h
strain-hardening tangent modulus, hE
ultimate tensile strength, T
ultimate tensile strain, T
necking tangent modulus, nE
necking stress at fracture (total breaking), F
fracture (total breaking) strain, F
Poisson’s ratio,

4
Figure 1. Idealised monotonic engineering stress–
engineering strain relationship for structural metals (Paik
and Thayamballi 2003).
Figure 2. A schematic of engineering stress–engineering strain
curves and offset yield stress for heat-treated metals (Paik and
Thayamballi 2003).
Figure 2 shows the engineering stress–engineering strain curve of heat-treated metals where neither
upper nor lower yield points may appear until the ultimate tensile strength is reached. In this case, the
yield strength is commonly defined as the stress at the intersection of the stress–strain curve and a straight
line passing through an offset point strain, i.e., 002.0,0, , which is parallel to the linear portion
of the stress–strain curve in the elastic regime. For structural design purposes, regulatory bodies or
classification societies identify a ‘minimum’ yield strength and its chemical composition and heat
treatment.
Beyond the yield stress or strain, the metal flows plastically without appreciable changes in stress
until the strain-hardening strain h is reached. The slope of the stress–strain curve in the strain-hardening
regime is defined as the strain-hardening tangent modulus hE , which may not be constant, but rather
dependent on different conditions. After the ultimate tensile stress is reached, necking takes place with
the necking tangent modulus nE until the test specimen is totally broken into two parts at the fracture
strain F . The mechanical properties of materials in a quasi-static loading condition at room temperature
are relatively well characterised, but continuous efforts are required for different loading speed and
temperature conditions.
3. Test-setup
3.1. Test specimen
The test specimens are cut out of the parent plate sheet in the rolling direction that are the most recent
materials procured in Korea. Dynamic modes of loading depend on the strain rate, among other
environmental or operational factors (Jones 2012). Table 1 indicates a typical classification of the loading
characteristics, depending on the strain rate (Hayashi and Tanaka 1988; Paik and Thayamballi 2003).
F
T
h
Y
YU
Y
P
Linear elastic behavior
Plastic behavior
Strain-hardening Necking
Fracture
arctan Eh
-arctan En
arctan E
0
F
T
h
Y
YU
Y
P
Linear elastic behavior
Plastic behavior
Strain-hardening Necking
Fracture
arctan Eh
-arctan En
arctan E
0
F
T
h
Y
YU
Y
P
Linear elastic behavior
Plastic behavior
Strain-hardening Necking
Fracture
arctan Eh
-arctan En
arctan E
0
F
T
h
Y
YU
Y
P
Linear elastic behavior
Plastic behavior
Strain-hardening Necking
Fracture
arctan Eh
-arctan En
arctan E
0
F
T
h
Y
YU
Y
P
Linear elastic behavior
Plastic behavior
Strain-hardening Necking
Fracture
arctan Eh
-arctan En
arctan E
0
F
T
h
Y
YU
Y
P
Linear elastic behavior
Plastic behavior
Strain-hardening Necking
Fracture
arctan Eh
-arctan En
arctan E
0
F
T
h
Y
YU
Y
P
Linear elastic behavior
Plastic behavior
Strain-hardening Necking
Fracture
arctan Eh
-arctan En
arctan E
0
F
T
h
Y
YU
Y
P
Linear elastic behavior
Plastic behavior
Strain-hardening Necking
Fracture
arctan Eh
-arctan En
arctan E
0
F
T
h
Y
YU
Y
P
Linear elastic behavior
Plastic behavior
Strain-hardening Necking
Fracture
arctan Eh
-arctan En
arctan E
0
F
T
h
Y
YU
Y
P
Linear elastic behavior
Plastic behavior
Strain-hardening Necking
Fracture
arctan Eh
-arctan En
arctan E
0
F
T
h
Y
YU
Y
P
Linear elastic behavior
Plastic behavior
Strain-hardening Necking
Fracture
arctan Eh
-arctan En
arctan E
0
F
T
h
Y
YU
Y
P
Linear elastic behavior
Plastic behavior
Strain-hardening Necking
Fracture
arctan Eh
-arctan En
arctan E
0,( )( ),
F
T
Y
Fracture
0.0020

5
Table 1. Dynamic modes of loading versus the strain rate (Paik and Thayamballi 2003)
Strain rate (1/s) <10-5 10-5-10-1 10-1-101.5 101.5-104 >104
Dynamic mode Creep Quasi-static Dynamic Impact Hyper velocity
impact
Figure 3. Test specimen for quasi-static testing (in mm) (ASTM-E8 2012).
Figure 4. Test specimen for dynamic testing (in mm) (ASTM-E8 2012).
Figure 5. Test specimen for impact testing (in mm) (ASTM-E8 2012).
Figures 3 to 5 show the different test specimen sizes and shapes for different loading speeds. The
thickness of the specimen varies with the material as per the test standard (ASTM-E8 2012). The gauge
length of the specimen is 50 mm for the quasi-static and dynamic testing and 25mm for the impact testing.
To measure the gauge length deformation during testing, an extensometer is attached in each specimen.
To ensure the reliability of the test results, all of the tests are performed three times on the same test
condition. During dynamic or impact testing, it is well noted that the specimens inevitably experience an
acceleration region right after dynamic or impact loading, and a stress wave is created that propagates
through the test frame toward the specimen. This wave is referred to as the incident wave, and upon
reaching the specimen it splits into two smaller waves. The first wave, called the transmitted wave, travels
through the specimen and into the transmitted test frame, causing plastic deformation in the specimen.
The second wave, called the reflected wave, is reflected away from the specimen and travels back down
the incident test frame (Hopkinson 1914; Kolsky 1949; Paik 2014).

6
To avoid this phenomenon, the test specimens are designed as shown in Figures 4 and 5. As a result,
the test specimen is unsymmetrical having an extra-long grip section on one hand with regard to the
portion embedding the extensometer unlike that in the quasi-static loading condition, and the dynamic or
impact tensile force is then applied to the longer side of the test specimen (Larour et al. 2007; Huh et al.
2008). In fact, the Hopkinson bar technique is a well-known method to examine the effect of strain rates,
but the present study used the same test machine with the loading actuator in a consistent way not only
for a quasi-static loading condition but also the dynamic and even the impact loading conditions.
3.2. Quasi-static loading machine
For testing in a quasi-static loading condition, a Universal Testing Machine (UTM) with a load cell
capacity of 1,000 kN is used. The loading speed of the actuator is kept at 0.05 mm/s under the
displacement control. Figure 6 shows the tensile test set-up for quasi-static testing.
Figure 6. Test setup for quasi-static testing.
3.3. Dynamic loading machine
For testing in a dynamic loading condition, a dynamic loading actuator with a capacity of 500 kN is
used. The loading speed can be varied in the range of 5 to 100 mm/s. Figure 7 shows the test setup for
dynamic loading. The test set-up for the dynamic loading condition is the same to the quasi-static loading
condition.
Figure 7. Test setup for dynamic testing.

7
3.4. Impact loading machine
For testing in an impact loading condition, a dynamic loading actuator with a capacity of 100 kN is
used. The loading speed can be up to 1,000 mm/s. Figure 8 shows the test setup for impact loading. The
test set-up for the impact loading condition is the same to the quasi-static loading condition.
Figure 8. Test setup for impact testing.
3.5 Low temperature control chamber
For the temperature control, an environmental chamber system using liquid nitrogen (LN2) is attached
to the test facilities. The environmental chamber is automatically controlled by inputting the target
temperature value. For practical temperature measurement, three thermocouples (T-type) are used to
monitor the surface temperature of the test specimen each second, from the beginning of the test to its
end. When the specimen reaches the target temperature, a soaking time of about 10 minutes is applied to
allow the low temperature to permeate the specimen and secure accurate test results, as shown in Figure
9. The temperature is varied from room temperature (RT) to the cryogenic condition, and it is confirmed
that the target low temperature can remain constant within an error of 3°C during the test.
Figure 9. Schematic of the low temperature control.
4. Test Results and Discussion
Tables 2 to 5 indicate the typical mechanical properties obtained from the present tests in a quasi-
static loading condition but with varying temperatures for mild steel, high-tensile steel, aluminum alloy
5083-O and stainless steel 304L, respectively, although the Poisson’s ratios are nominal values. It is
noted that the yield strength of the so-called mild steel is not necessarily 235MPa which is a minimum
requirement but it is up to 300MPa even at room temperature.

8
Figures A.1 to A.86 present the details of the test results in the Appendix. The figures present the
characteristics of material properties with increase in the loading speed and with decrease in the
temperature. It is generally observed that the yield and ultimate tensile strengths tend to increase as the
loading speed increases, while the fracture (total breaking) strain tends to decrease. Mild steel Grade A
is not relevant for use at low temperatures as the fracture strain significantly decreases with decrease in
the temperature.
Work hardening is investigated in terms of stress ( /T Y ) and strain ( /T Y ) as shown in Figures
A.67 to A.74. The work hardening behavior is affected by temperature and strain rate. For mild steel,
high-tensile steel and aluminum alloy, the work hardening tends to decrease with decrease in the
temperature, while it tends to increase for stainless steel. However, the strain based work hardening tends
to decrease for all of the materials as the temperature decreases. It is found that the work hardening
decreases with increase in the strain rate for all types of the materials considered in the present study.
Necking characteristics can also be investigated in terms of stress ( /F Y or /F T ) and strain
( /F Y or /F T ) as shown in Figures A.75 to A.90. The necking behavior is affected by temperature
and strain rate. For mild and high-tensile steel, fracture or total breaking takes place at the stress similar
to the yield strength, but it occurs at the stress several times higher than the yield strength for aluminum
alloy and stainless steel. The necking regime relative to the work hardening regime is shortened as the
temperature decreases. With increase in the strain rate, the necking regime is also shortened.

9
Table 2. Mechanical properties of mild steel.
Temp.
(oC)
Grade A Grade D
E (GPa) Y (MPa) T (MPa)
F E (GPa) Y (MPa) T (MPa)
F
20
199.6 299.3 464.9 0.423 0.3 194.5 287.2 458.7 0.457 0.3
196.1 298.9 464.6 0.427 0.3 204.1 276.4 461.7 0.446 0.3
186.3 300.8 462.4 0.426 0.3 186.1 283.6 460.4 0.468 0.3
Mean 194.0 299.6 463.9 0.425 0.3 194.9 282.4 460.3 0.457 0.3
-20
212.2 310.7 485.5 0.425 0.3 189.9 303.3 466.4 0.462 0.3
208.6 323.8 512.6 0.439 0.3 223.6 306.9 494.0 0.473 0.3
206.5 326.3 506.4 0.410 0.3 214.1 311.6 493.0 0.470 0.3
Mean 209.1 320.3 501.5 0.424 0.3 209.2 307.3 484.5 0.468 0.3
-60
181.2 345.0 512.5 0.458 0.3 217.3 332.1 525.7 0.448 0.3
173.8 349.6 514.2 0.436 0.3 205.0 338.4 524.1 0.471 0.3
189.8 345.4 509.2 0.448 0.3 212.7 333.9 520.1 0.461 0.3
Mean 181.6 346.7 512.0 0.447 0.3 211.6 334.8 523.3 0.460 0.3
Note: The Poisson ratio is an assumed value.
Table 3. Mechanical properties of high-tensile steel.
Temp. (oC)
Grade AH32 Grade DH32 Grade DH36
E
(GPa) Y
(MPa)
T
(MPa) F E
(GPa) Y
(MPa)
T
(MPa) F E
(GPa) Y
(MPa)
T
(MPa) F
20 194.1 355.6 533.4 0.380 0.3 192.1 347.2 532.4 0.409 0.3 192.9 377.8 519.4 0.339 0.3 192.3 352.5 527.4 0.389 0.3 220.9 351.6 535.6 0.422 0.3 180.9 383.1 530.5 0.347 0.3 201.7 362.1 532.2 0.388 0.3 196.3 351.2 535.4 0.403 0.3 174.0 390.0 540.6 0.343 0.3
Mean 196.0 356.7 531 0.385 0.3 203.1 350.0 534.4 0.411 0.3 182.6 383.6 530.2 0.343 0.3
-20 209.9 381.9 560.5 0.389 0.3 185.0 370.0 562.6 0.410 0.3 187.4 407.7 576.3 0.359 0.3 200.0 384.7 563.5 0.411 0.3 176.6 373.6 562.3 0.412 0.3 165.8 405.8 574.4 0.353 0.3 202.6 384.7 567.7 0.399 0.3 - 366.0 560.2 0.458 0.3 - 422.8 586.7 0.355 0.3
Mean 204.1 383.7 563.9 0.399 0.3 180.8 369.8 561.7 0.426 0.3 176.6 412.1 579.1 0.355 0.3
-60 188.8 395.7 565.6 0.416 0.3 207.1 381.2 568.6 0.438 0.3 177.0 407.7 576.3 0.359 0.3 179.5 388.8 567.5 0.421 0.3 177.1 388.4 574.1 0.410 0.3 183.3 405.8 574.4 0.353 0.3
- 391.3 561.3 0.427 0.3 187.6 386.4 572.7 0.424 0.3 - 422.8 586.7 0.355 0.3 Mean 184.1 391.9 564.8 0.421 0.3 190.6 385.3 571.8 0.424 0.3 180.1 412.1 579.1 0.355 0.3
Note: The Poisson ratio is an assumed value.

10
Table 4. Mechanical properties of aluminum alloy 5083-O.
Temp. (oC)
Aluminum alloy 5083-O
E
(GPa) Y
(MPa)
T
(MPa) F
20
73.8 177.4 330.2 0.247 0.33 71.7 173.5 330.9 0.241 0.33 65.6 173.0 329.5 0.229 0.33
Mean 70.3 174.6 330.2 0.239 0.33
-120
65.0 180.2 340.0 0.308 0.33 76.8 177.0 338.6 0.314 0.33 65.1 180.9 340.0 0.315 0.33
Mean 68.9 179.3 339.5 0.312 0.33
-160
63.3 189.8 373.6 0.341 0.33 83.1 187.9 367.4 0.318 0.33 79.4 183.4 366.7 0.324 0.33
Mean 75.2 187.0 369.2 0.327 0.33
Table 5. Mechanical properties of stainless steel 304L.
Temp.
(oC)
Stainless steel 304L
E
(GPa) Y
(MPa)
T
(MPa) F
20
203.7 306.1 727.3 0.661 0.27-0.3
197.8 313.2 739.9 0.661 0.27-
0.3
199.3 307.8 731.4 0.647 0.27-
0.3
Mean 200.2 309.0 732.8 0.656 0.27-
0.3
-120
202.6 394.6 1331.5 0.417 0.27-0.3
190.6 379.8 1351.5 0.397 0.27-
0.3
192.9 388.9 1346.9 0.387 0.27-0.3
Mean 195.3 387.7 1343.3 0.400 0.27-
0.3
-160
191.6 413.7 1504.8 0.365 0.27-
0.3
196.5 428.9 1521.4 0.360 0.27-0.3
205.0 422.1 1496.6 0.359 0.27-
0.3
Mean 197.7 421.5 1507.6 0.361 0.27-0.3
5. Test Coefficients of the Cowper-Symonds Equation
The dynamic yield strength of each material can be expressed as follows (Jones 2012).
gf
Y
Yd , (1)
where Y and Yd are static or dynamic yield stresses, respectively; f is a function of the strain
rate sensitivity effect; g is the material work hardening function; and is the strain rate.
If one neglects the effects of work-hardening, then 1g . The strain rate sensitivity parameter,
f , is often given using the equation (Jones 2012) as follows.
q/1
Y
Yd
C0.1
, (2)
where C and q are coefficients to be determined based on the test database. Jones (2012) gives some
recent constants for the Cowper-Symonds equation (Cowper and Symonds 1957) for different types of
materials.
Both crushing effects and yield strength increase with the loading speed while any fracture or tearing
of steel (and the welded regions) in a structure tends to occur earlier. The following approximate formula,
which is the inverse of the Cowper-Symonds constitutive equation for the dynamic yield stress, is then
useful for estimating the dynamic fracture strain as a function of the strain rate (Paik and Thayamballi
2003; Jones 2012).
1q/1
F
Fd
C0.1
, (3)
where F and Fd are the static or dynamic fracture strains, respectively, and is the ratio of the
total energies to rupture for dynamic and static uniaxial loadings.

11
Figures A.91 to A.98 suggest the test coefficients of equations (2) and (3), as determined by a best-fit
technique.
6. Development of the Material Database Software
This section describes the development of the Mechanical Property Database Management System
(MPDAS) software, which can predict material properties based on the test database. The input
parameters are material type, grade type, strain rate, thickness and temperature as shown in Figure 10.
Various types of materials – mild steel, high-tensile steel (H32 and H36), stainless steel (304, 304L,
316L), aluminium alloy, nickel alloy and five grades (A, B, D, E and F) of carbon steel – are considered
under a range of low temperatures and strain rates. The output parameters are the stress–strain curves
and yield stress, ultimate tensile stress and fracture strain. Figure 10 illustrates the input data definition
of the MPDAS software.
The software is developed based on the MATLAB code by taking advantage of the multi-dimensional
matrix. Figure 11 shows the concept of the MPDAS. Material card is the most significant group. Each
parameter consists of a number of spaces. Although the existing test database occupies the spaces, empty
spaces are also reserved for the new test database to provide updates. To generate the stress–strain curves
of materials unavailable in the database, the software conducts inter- or extra-polations as shown in
Figure 12. Figure 13 presents applied examples of the MPDAS software. The user can predict the
mechanical properties for both engineering and actual stress-strain curves.
(a) Material types (b) Grades (c) Strain-rates
Figure 10. Parameters considered in the software MPDAS.
Material Strain-rateGrade
S-S curve ThicknessTemperature

12
Figure 11. Schematic representation of the concept to develop the software MPDAS.
Figure 12. Inter or extra-polations of the test database.
(a) Mild steel (b) Stainless steel
Figure 13. Applied examples of the software MPDAS generating the engineering stress-engineering strain curves of a specific
material.
The benefits of the MPDAS software (version 2016) are as follows.
Various types of materials are considered: mild steel, high tensile steel, stainless steel,
aluminium alloy and nickel alloy
Five types of grades are considered for carbon steels: A, B, D, E and F
Based on the Cowper-Symonds equation, the effect of strain rates can be considered up to
100/s
Applicable thickness is up to 20 mm
Applicable temperature is in the range of -200 to 20°C
Four types of stress–strain curves are generated for engineering, true, effective and power
law curves
Allowed to add the new test database
Other functions with grid on/off, zoom-in/out, printing, coordinating, etc.
-160°C
-143°C
Stainless steel 304L, 1.2mm
-120°C
-170°C
Material property at -170°C by extrapolation
Property at -143°C by interpolation
Property at -160°C by test
Property at -120°C by test
Mild steel, A grade, 12mm
Test
Developed program
-20°C
-40°C
Stainless steel 304L, 1.2mm
Test
Developed program
-160°C
-120°C

13
7. Concluding Remarks
The aim of the present study was to develop a new test database of materials for marine applications
with the focus on low temperatures and strain rates. The details of the materials’ stress–strain curves
were documented.
The obtained test database of materials used for ships and offshore structures was analysed to
characterise the material properties in the form of graphs. The Cowper-Symonds equation was considered
to quantify the effects of strain rates and low temperatures on the dynamic yield strength and fracture
strain, together with the existing test database where available. Work hardening and necking behaviour
were also documented. The MPDAS software was developed to define the material properties directly
from the test database.
Clearly, the results of the structural analysis will be totally wrong if the material properties are not
correctly defined. This is of greater significance when structural systems involve highly nonlinear
behaviour in association with extreme and accidental conditions. It is important to realise that inadequate
definition of the material properties is a primary cause of the uncertainties involved in structural designs.
It is thus highly encouraged to continue to develop the new test database of materials covering a greater
variety of environmental and operational conditions. It is planned that the test database will be updated
with new test results as they become available.
Acknowledgements
The present study was undertaken at the Korea Ship and Offshore Research Institute at Pusan National
University which has been a Lloyd’s Register Foundation Research Centre of Excellence since 2008.
Lloyd’s Register Foundation (LRF), a UK registered charity and sole shareholder of Lloyd’s Register
Group Ltd, invests in science, engineering and technology for public benefit, worldwide. Financial
support from ClassNK is greatly acknowledged.
References
ASTM-E8. 2012. Standard test methods for tension testing of metallic materials. American Society for
Testing and Materials, USA.
Bodner SR, Symonds PS. 1962. Experimental and theoretical investigation of the plastic deformation of
cantilever beams subjected to impulsive loading. Journal of Applied Mechanics, 29:719−728.
Brokenbrough RL. 1991. Material properties. Chapter 1.2 in Constructional steel design, an international
guide, Elsevier Applied Science, London, UK.
Cadoni E, Fenu L, Forni D. 2012. Strain rate behaviour in tension of austenitic stainless steel used for
reinforcing bars. Construction and Building Materials, 35:399−407.
Campbell J, Cooper RH. 1966. Yield and flow of low-carbon steel at medium strain rates. Proceedings
of the Conference on the Physical Basis of Yield and Fracture, Institute of Physics and Physical
Society, 77−87.

14
Choung JM, Nam WS, Lee JY. 2013. Dynamic hardening behaviors of various marine structural steels
considering dependencies on strain rate and temperature. Marine Structures, 32:49−67.
Cowper GR, Symonds PS. 1957. Strain-hardening and strain-rate effects in the impact loading of
cantilever beams. Technical Reports No. 28, Division of Applied Mathematics, Brown University,
USA.
Forrestal MJ, Sagartz MJ. 1978. Elastic-plastic response of 304 stainless steel beams to impulse loads.
Journal of Applied Mechanics, 45:685−687.
Hayashi T, Tanaka Y. 1988. Impact engineering. Nikkan Kogyo Simbunsha, Tokyo, Japan (in Japanese).
Hopkinson B. 1914. A method of measuring the pressure produced in the detonation of high explosive
or by the impact of bullets, Transactions of Royal Society (London) A, 213:437-456.
Hsu SS, Jones N. 2004. Dynamic axial crushing of aluminum alloy 6063-T6 circular tubes. Latin
American Journal of Solids and Structures, 1(3):277−296.
Hughes OF, Paik JK. 2013. Ship structural analysis and design. The Society of Naval Architects and
Marine Engineers, Alexander, USA.
Huh H, Kim SB, Song JH and Lim JH. 2008. Dynamic tensile characteristics of TRIP-type and DP-type
steel sheets for an auto-body, International Journal of Mechanical Sciences, 50:918-931.
Itabashi M, Kawata K. 2000. Carbon content effect on high-strain-rate tensile properties for carbon steels.
International Journal of Impact Engineering, 24:117−131.
Johnson GR, Cook WH. 1983. A constitutive model and data for metals subjected to large strains, high
strain rates and high temperatures. Proceedings of 7th International Symposium on Ballistics, 541–
547.
Jones N. 2012. Structural impact. 2nd Edition, Cambridge University Press, Cambridge, UK.
Kolsky H. 1949. An investigation of the mechanical properties of materials at very high rates of loading,
Proceedings of Physics Society, B62:676.
KSNA. 1983. Handbook of shipbuilding and design, The Kansai Society of Naval Architects, Osaka,
Japan (in Japanese).
Kundu A, Chakraborti PC. 2010. Effect of strain rate on quasi static tensile flow behavior of solution
annealed 304 austenitic stainless steel at room temperature. Journal of Materials Science,
45:5482−5489.
Larour P, Rusinek A, Klepaczko JR and Bleck W. 2007. Effects of strain rate and identification of
material constants for three automotive steels, Journal of Steel Research, 78:348-358.
Manjoine MJ. 1944. Influence of rate of strain and temperature on yield stresses of mild steel. Journal of
Applied Mechanics, 11:211−218.
Mazzolani FM. 1985. Aluminum alloy structures. Pitman Publishing Ltd., London, UK.
Nicholas T. 1981. Tensile testing of materials at high rates of strain. Experimental Mechanics,
21:177−185.
Paik JK. 2014. Putting deep water safety to the test. Marine Technology, The Society of Naval Architects
and Marine Engineers, Alexander, USA, April, 12-17.
Paik JK, Chung JY. 1999. A basic study on static and dynamic crushing behavior of a stiffened tube.
Transactions of The Korean Society of Automotive Engineers (KSAE), 7(1):219−238.
Paik JK, Melchers RE. 2008. Condition assessment of aged structures. CRC Press. Boca Raton, USA.
Paik JK, Thayamballi AK. 2003. Ultimate limit state design of steel-plated structures. John Wiley &

15
Sons, Chichester, UK.
Paik JK, Thayamballi AK. 2007. Ship-shaped offshore installations: design, building, and operation.
Cambridge University Press, New York, USA.
Ramberg W, Osgood WR. 1943. Description of stress strain curves by three parameters. Technical Note
No. 902, National Advisory Committee on Aeronautics, Hampton, USA.
Symonds PS. 1967. Survey of methods of analysis for plastic deformation of structures under dynamic
loading. Division of Engineering Report BU/NSRDC/1-67, Brown University, USA.
Toyosada M, Fujii E, Nohara K, Kawaguchi Y, Arimochi K, Isaka K. 1987. The effect of strain rate on
critical CTOD and J-integral. Journal of the Society of Naval Architects of Japan, 161:343−356.
Appendix: Details of the Test Results
A.1 Mild steel Grade A
Figure A.1. Engineering stress-engineering strain curves for
mild steel Grade A at room temperature.
Figure A.2. Engineering stress- engineering strain curves for
mild steel Grade A at -20 deg. C.
Figure A.3. Engineering stress- engineering strain curves for
mild steel Grade A at -60 deg. C.
Figure A.4. Effects of low temperature on elastic modulus
of steels.
850 mm/s
= 1.8 /s)90 mm/s
4.5 mm/s
0.05 mm/s ( = 0.001 /s)
= 34 /s)
= 0.09 /s)
0.05 mm/s ( = 0.001 /s)
4.5 mm/s = 0.09 /s)
= 1.8 /s)90 mm/s
850 mm/s = 34 /s)
0.05 mm/s ( = 0.001 /s)
4.5 mm/s = 0.09 /s)
= 1.8 /s)90 mm/s
850 mm/s = 34 /s)

16
Figure A.5. Effects of low temperature on yield strength of
mild steel Grade A.
Figure A.6. Effects of low temperature on tensile strength of
mild steel Grade A.
Figure A.7. Effects of low temperature on fracture (total
breaking) of mild steel Grade A.
Figure A.8. Effects of strain rate on yield strength of mild
steel Grade A.
Figure A.9. Effects of strain rate on tensile strength of mild
steel Grade A.
Figure A.10. Effects of strain rate on fracture (total breaking)
strain of mild steel Grade A.

17
A.2 Mild steel Grade D
Figure A.11. Engineering stress- engineering strain curves
for mild steel Grade D at room temperature.
Figure A.12. Engineering stress- engineering strain curves
for mild steel Grade D at -20 deg. C.
Figure A.13. Engineering stress- engineering strain curves for
mild steel Grade D at -60 deg. C.
Figure A.14. Effects of low temperature on yield strength of
mild steel Grade D.
Figure A.15. Effects of low temperature on tensile strength
of mild steel Grade D.
Figure A.16. Effects of low temperature on fracture (total
breaking) strain of mild steel Grade D.
0.05 mm/s ( = 0.001 /s)
850 mm/s = 34 /s)
= 1.8 /s)90 mm/s
4.5 mm/s = 0.09 /s)
0.05 mm/s ( = 0.001 /s)
4.5 mm/s = 0.09 /s)
= 1.8 /s)90 mm/s
850 mm/s = 34 /s)
0.05 mm/s ( = 0.001 /s)
4.5 mm/s = 0.09 /s)
= 1.8 /s)90 mm/s
850 mm/s = 34 /s)

18
Figure A.17. Effects of strain rate on yield strength of mild
steel Grade D.
Figure A.18. Effects of strain rate on tensile strength of mild
steel Grade D.
Figure A.19. Effects of strain rate on fracture (total breaking) strain of mild steel Grade D.
A.3 High-tensile steel AH 32
Figure A.20. Engineering stress- engineering strain curves
for high-tensile steel AH32 at room temperature.
Figure A.21. Engineering stress- engineering strain curves
for high-tensile steel AH 32 at -20 deg. C.
0.05 mm/s
( = 0.001 /s)
4.5 mm/s = 0.09 /s)
= 1.8 /s)90 mm/s
850 mm/s = 34 /s)
0.05 mm/s ( = 0.001 /s)
4.5 mm/s = 0.09 /s)
= 1.8 /s)90 mm/s
850 mm/s = 34 /s)

19
Figure A.22. Engineering stress- engineering strain curves for
high-tensile steel AH 32 at -60 deg. C.
Figure A.23. Effects of low temperature on yield strength of
high-tensile steel AH 32.
Figure A.24. Effects of low temperature on tensile strength
of high-tensile steel AH 32.
Figure A.25. Effects of low temperature on fracture (total
breaking) strain of high-tensile steel AH 32.
Figure A.26. Effects of stain rate on yield strength of high-
tensile steel AH 32.
Figure A.27. Effects of strain rate on tensile strength of high-
tensile steel AH 32.
0.05 mm/s ( = 0.001 /s)
4.5 mm/s= 0.09 /s)
= 1.8 /s)90 mm/s
850 mm/s = 34 /s)

20
Figure A.28. Effects of strain rate on fracture (total breaking) of high-tensile steel AH 32.
A.4 High-tensile steel DH 32
Figure A.29. Engineering stress- engineering strain curves
for high-tensile steel DH 32 at room temperature.
Figure A.30. Engineering stress- engineering strain curves
for high-tensile steel DH 32 at -20 deg. C.
Figure A.31. Engineering stress- engineering strain curves for
high-tensile steel DH 32 at -60 deg. C.
Figure A.32. Effects of low temperature on yield strength of
high-tensile steel DH 32.
0.05 mm/s ( = 0.001 /s)
4.5 mm/s = 0.09 /s)
= 1.8 /s)90 mm/s850 mm/s = 34 /s)
0.05 mm/s ( = 0.001 /s)
4.5 mm/s = 0.09 /s)
= 1.8 /s)90 mm/s
850 mm/s = 34 /s)
0.05 mm/s ( = 0.001 /s)
4.5 mm/s
= 0.09 /s)
= 1.8 /s)90 mm/s
850 mm/s = 34 /s)
21
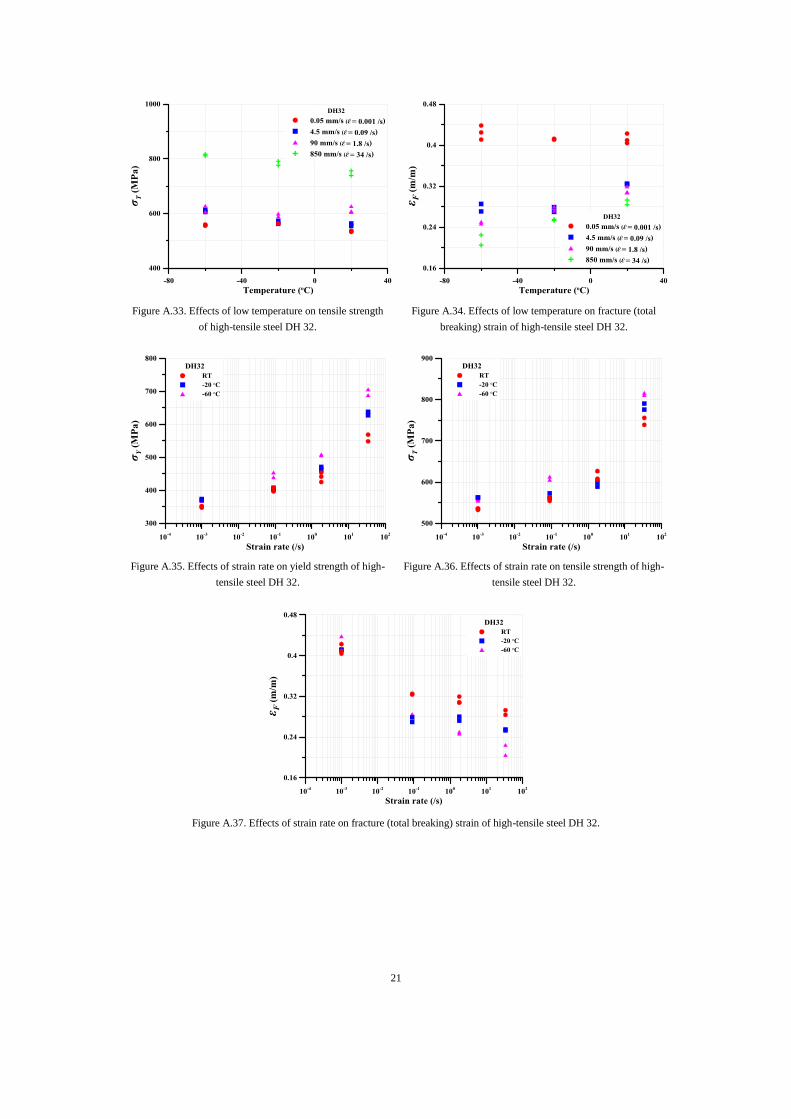
Figure A.33. Effects of low temperature on tensile strength
of high-tensile steel DH 32.
Figure A.34. Effects of low temperature on fracture (total
breaking) strain of high-tensile steel DH 32.
Figure A.35. Effects of strain rate on yield strength of high-
tensile steel DH 32.
Figure A.36. Effects of strain rate on tensile strength of high-
tensile steel DH 32.
Figure A.37. Effects of strain rate on fracture (total breaking) strain of high-tensile steel DH 32.

22
A.5 High-tensile steel DH 36
Figure A.38. Engineering stress- engineering strain curves
for high-tensile steel DH 36 at room temperature.
Figure A.39. Engineering stress- engineering strain curves
for high-tensile steel DH 36 at -20 deg. C.
Figure A.40. Engineering stress- engineering strain curves for
high-tensile steel DH 36 at -60 deg. C.
Figure A.41. Effects of low temperature on yield strength
of high-tensile steel DH 36.
Figure A.42. Effects of low temperature on tensile strength of
high-tensile steel DH 36.
Figure A.43. Effects of low temperature on fracture (total
breaking) strain of high-tensile steel DH 36.
0.05 mm/s ( = 0.001 /s)
4.5 mm/s = 0.09 /s)
= 1.8 /s)90 mm/s
850 mm/s = 34 /s)
0.05 mm/s ( = 0.001 /s)
4.5 mm/s = 0.09 /s)
= 1.8 /s)90 mm/s
850 mm/s = 34 /s)
0.05 mm/s
( = 0.001 /s)
4.5 mm/s
= 0.09 /s) = 1.8 /s)
90 mm/s
850 mm/s = 34 /s)

23
Figure A.44. Effects of strain rate on yield strength of high-
tensile steel DH 36.
Figure A.45. Effects of strain rate on tensile strength of high-
tensile steel DH 36.
Figure A.46. Effects of stain rate on fracture (total breaking) strain of high-tensile steel DH 36.
A.6 Aluminum alloy 5083
Figure A.47. Engineering stress- engineering strain curves
for aluminum alloy 5083 at room temperature.
Figure A.48. Engineering stress- engineering strain curves
for aluminum alloy 5083 at -120 deg. C.
0.05 mm/s ( = 0.001 /s)
4.5 mm/s= 0.09 /s)
= 1.8 /s)
90 mm/s
850 mm/s= 34 /s) 0.05 mm/s ( = 0.001 /s)
4.5 mm/s
= 0.09 /s)
= 1.8 /s)90 mm/s
850 mm/s
= 34 /s)

24
Figure A.49. Engineering stress- engineering strain curves for
aluminum alloy 5083-O at -160 deg. C.
Figure A.50. Effects of low temperature on elastic modulus
of aluminum alloy 5083-O.
Figure A.51. Effects of low temperature on yield strength of
aluminum alloy 5083-O.
Figure A.52. Effects of low temperature on tensile strength
of aluminum alloy 5083-O.
Figure A.53. Effects of low temperature on fracture (total
breaking) strain of aluminum alloy 5083-O.
Figure A.54. Effects of strain rate on yield strength of
aluminum alloy 5083-O.
0.05 mm/s
( = 0.001 /s)
4.5 mm/s
= 0.09 /s)
= 1.8 /s)90 mm/s
850 mm/s
= 34 /s)
25
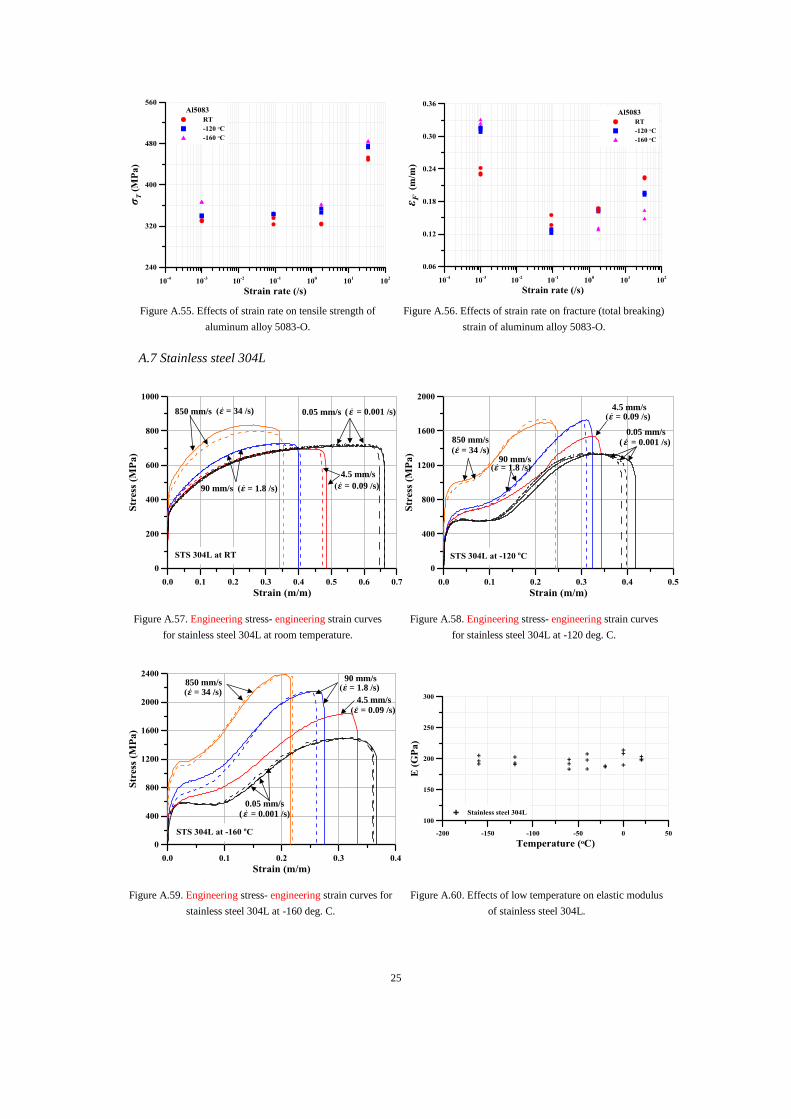
Figure A.55. Effects of strain rate on tensile strength of
aluminum alloy 5083-O.
Figure A.56. Effects of strain rate on fracture (total breaking)
strain of aluminum alloy 5083-O.
A.7 Stainless steel 304L
Figure A.57. Engineering stress- engineering strain curves
for stainless steel 304L at room temperature.
Figure A.58. Engineering stress- engineering strain curves
for stainless steel 304L at -120 deg. C.
Figure A.59. Engineering stress- engineering strain curves for
stainless steel 304L at -160 deg. C.
Figure A.60. Effects of low temperature on elastic modulus
of stainless steel 304L.
0.05 mm/s ( = 0.001 /s)
4.5 mm/s
= 0.09 /s)= 1.8 /s)90 mm/s
850 mm/s = 34 /s)
0.05 mm/s
( = 0.001 /s)
4.5 mm/s= 0.09 /s)
= 1.8 /s)90 mm/s
850 mm/s
= 34 /s)
0.05 mm/s
( = 0.001 /s)
4.5 mm/s
= 0.09 /s)
= 1.8 /s)90 mm/s
850 mm/s= 34 /s)

26
Figure A.61. Effects of low temperature on yield strength of
stainless steel 304L.
Figure A.62. Effects of low temperature on tensile strength
of stainless steel 304L.
Figure A.63. Effects of low temperature on fracture (total
breaking) strain of stainless steel 304L.
Figure A.64. Effects of strain rate on yield strength of
stainless steel 304L.
Figure A.65. Effects of strain rate on tensile strength of
stainless steel 304L.
Figure A.66. Effects of strain rate on fracture (total
breaking) strain of stainless steel 304L.
A.8 Work hardening

27
Figure A.67. Effects of low temperature on work hardening
of mild steel - /T Y .
Figure A.68. Effects of low temperature on work hardening
of high-tensile steel - /T Y .
Figure A.69. Effects of low temperature on work hardening
of aluminum alloy 5083-O - /T Y .
Figure A.70. Effects of low temperature on work hardening
of stainless steel 304L - /T Y .
Figure A.71. Effects of low temperature on work hardening
of mild steel - /T Y .
Figure A.72. Effects of low temperature and strain rate on
work hardening of high-tensile steel - /T Y .

28
Figure A.73. Effects of low temperature and strain rate on
work hardening of aluminum alloy 5083-O - /T Y .
Figure A.74. Effects of low temperature and strain rate on
work hardening of stainless steel 304L - /T Y .
A.9 Necking
Figure A.75. Effects of low temperature and strain rate on
necking of mild steel - /F Y .
Figure A.76. Effects of low temperature and strain rate on
necking of high-tensile steel - /F Y .
Figure A.77. Effects of low temperature and strain rate on
necking of aluminum alloy 5083-O - /F Y .
Figure A.78. Effects of low temperature and strain rate on
necking of stainless steel 304L - /F Y .

29
Figure A.79. Effects of low temperature and strain rate on
necking of mild steel - /F T .
Figure A.80. Effects of low temperature and strain rate on
necking of high-tensile steel - /F T .
Figure A.81. Effects of low temperature and strain rate on
necking of aluminum alloy 5083-O - /F T .
Figure A.82. Effects of low temperature and strain rate on
necking of stainless steel 304L - /F T .
Figure A.83. Effects of low temperature and strain rate on
necking of mild steel - /F Y .
Figure A.84. Effects of low temperature and strain rate on
necking of high-tensile steel - /F Y .

30
Figure A.85. Effects of low temperature and strain rate on
necking of aluminum alloy 5083-O - /F Y .
Figure A.86. Effects of low temperature and strain rate on
necking of stainless steel 304L - /F Y .
Figure A.87. Effects of low temperature and strain rate on
necking of mild steel - /F T .
Figure A.88. Effects of low temperature and strain rate on
necking of high-tensile steel - /F T .
Figure A.89. Effects of low temperature and strain rate on
necking of aluminum alloy 5083-O - /F T .
Figure A.90. Effects of low temperature and strain rate on
necking of stainless steel 304L - /F T .

31
Figure A.91. Dynamic yield strength of mild steel against strain rates and low temperatures.
Figure A.92. Dynamic yield strength of high-tensile steel against strain rates and low temperatures.

32
Figure A.93. Dynamic yield strength of aluminum alloy 5083-O against strain rates and low temperatures.
Figure A.94. Dynamic yield strength of stainless steel 304L against strain rates and low temperatures.

33
Figure A.95. Dynamic fracture strain of mild steel against strain rates and low temperatures.
Figure A.96. Dynamic fracture strain of high-tensile steel against strain rates and low temperatures.

34
Figure A.97. Dynamic fracture strain of aluminum alloy 5083-O against strain rates and low temperatures.
Figure A.98. Dynamic fracture strain of stainless steel against strain rates and low temperatures.