Test and Evaluation of Recreational Off-Highway Vehicles ... · the position of the outboard ROPS...
50
Test and Evaluation of Recreational Off-Highway Vehicles (ROVs) Dynamic Occupant Protection Performance Tests For: The Consumer Product Safety Commission CONTRACT: CPSC-D-11-0003 Task Order 0001 – Task 2 September 2012 Biomechanics & Vehicle Dynamics 7349 Worthington-Galena Road Columbus, Ohio 43085
Transcript of Test and Evaluation of Recreational Off-Highway Vehicles ... · the position of the outboard ROPS...
Test and Evaluation of Recreational
Off-Highway Vehicles (ROVs)
Dynamic Occupant Protection
Performance Tests
For:
The Consumer Product Safety Commission
CONTRACT: CPSC-D-11-0003 Task Order 0001 – Task 2
September 2012
Biomechanics & Vehicle Dynamics
7349 Worthington-Galena Road
Columbus, Ohio 43085

Test and Evaluation of Recreational
Off-Highway Vehicles (ROVs)
Dynamic Occupant Protection
Performance Tests
For:
The Consumer Product Safety Commission
CONTRACT: CPSC-D-11-0003
Task Order 0001 – Task 2
“These comments are those of S-E-A, Ltd. staff and they have not been reviewed or
approved by, and may not necessarily reflect the views of, the Commission.”
Report prepared by:
Douglas R. Morr, P.E.
Biomechanics & Vehicle Dynamics
7349 Worthington-Galena Road
Columbus, Ohio 43085

TABLE OF CONTENTS
1. OVERVIEW…………………………………………………………………………… 1
2. ROLL SIMULATOR TESTING.……………………………………………………… 2
2.1 Input Parameters……………………………………………………………… 2
2.2 Test Protocols………….……………………………………………………… 4
2.3 Results………………………………………………………………………… 6
3. SUMMARY....…………………………………………………………………........... 12
Appendix: Data and Photographs …………………………...……………………………13

1
1. OVERVIEW
This report describes and reports the results of a series of tests conducted by S-E-A, Ltd.
(S-E-A), for the Consumer Product Safety Commission under contract number CPSC-D-
11-0003 Task Order 0001 – Task 2. This report presents the results from the Dynamic
Occupant Protection Performance Tests, as performed on the S-E-A Roll Simulator.
The current work provides data relative to the occupant kinematics during a 90-degree
rollover event of a range of 2009-2011 model year Recreational Off-Highway Vehicles
(ROVs). Both minimum energy (threshold) and higher energy (tripped) roll events were
studied. The kinematics of a belted Hybrid III 50th
percentile male anthropomorphic test
device (ATD) were recorded and the measured ATD head motion is presented within the
Appendix. This current study specifically analyzed only belted occupant motion from 0 to
90 degrees of roll angle on a roll simulator.
The roll simulator can be used to simulate 90-degree rollover events of ROVs. The device
has been validated through vehicle dynamics testing of vehicles within this vehicle class.
The roll simulator has been shown to reproduce lateral accelerations, roll rates, and roll
angles experienced by ROVs during field testing. For the subject testing protocol the roll
simulator incorporated one Hybrid III 50th
percentile male ATD for evaluation of occupant
protection devices. Please refer to the following publications for additional information
and validation details of the S-E-A Roll Simulator:
• “Modeling and Validation of a Roll Simulator for Recreational Off-Highway
Vehicles,” Zagorski, et al., American Society of Mechanical Engineers, Paper
Number: IMECE2011-62603, 2011.
• “Control Strategies for a Roll Simulator for Recreational Off-Highway Vehicles,”
Zagorski, et al., American Society of Mechanical Engineers, Paper Number:
IMECE2011-62601, 2011.
• “Validation of a Roll Simulator for Recreational Off-Highway Vehicles,” Zagorski,
et al., Society of Automotive Engineers, Paper Number: SAE 2012-01-0241, 2012.
This work was completed as a follow-up to the work completed by S-E-A under CPSC
Contract Number CPSC-S-10-0014, Vehicle Characteristics Measurements of Recreational
Off-Highway Vehicles, April 2011. It should be noted that the vehicle code notation
specified in those reports remains the same for the current report.
The Appendix to this report contains the requested test results for each vehicle tested.

2
2. ROLL SIMULATOR TESTING
2.1 Input Parameters
Input parameters for the roll simulator testing were determined through vehicle dynamics
testing of representative vehicles within the subject vehicle class, as well as review of
published literature. Tip-up tests with outriggers and 90-degree rollover tests were
reviewed. The outrigger tests are referenced in the reports for contract CPSC-S-10-0014.
The full, 90-degree rollover tests were completed on vehicles A, B, and C, as part of
CPSC-D-11-0003 Task Order 0001 – Task 1 for both threshold and tripped rollover events.
In these tests, each vehicle was instrumented with steering and brake/throttle robots for
autonomous control. The threshold rollover tests were 30 mph dropped-throttle, step steer
maneuvers. The tripped rollover tests were conducted with initial speeds in the range of 25
to 28 mph. A low friction surface was prepared by spreading a thin layer of sand on top of
an asphalt test surface. For a tripped rollover test, the vehicle approached the low friction
surface at the initial test speed and a step steer input was applied to initiate turning. Once
the vehicle reached the low friction surface, the rear wheels of the vehicle were braked
until they locked up, causing the vehicle to yaw sideways into the trip feature. The trip
feature used was 4 to 6-inch high wooden beams, secured to the ground using wooden
stakes. Sand tubes were placed in front of the beams to prevent damage to the suspension
and to prevent tires from debeading.
The mean value of peak body-fixed lateral acceleration at the point of two-wheel lift
(indicating tip up) for the 10 vehicles tested with outriggers is 0.83 g. For the autonomous,
90-degree threshold rollover tests, the body-fixed lateral acceleration levels remained in
the range of 0.7 to 0.9 g during the rollover events; and maximum roll rates were found to
be close to 180 deg/sec. Figure 1 shows the nominal response profiles from these
threshold rollover events. These values compare well with the available published
literature. Lateral acceleration, roll angle, and roll rate were numerically analyzed for the
set of autonomous test data, and target input parameters for the roll simulation were
developed based on the mean response profiles. These target profiles establish vehicle
independent simulation parameters that represent a threshold rollover event, as shown in
Figure 2.
For the tripped rollover events, the body-fixed lateral accelerations ranged from 2 to 3 g
during the rollovers, with the mean of the peak values for all of the tests being
approximately 2.5 g. While the range of roll rates for the autonomous tripped tests was
larger than for the threshold tests, the mean of the peak roll rates for the tripped tests was
also close to 180 deg/sec. Figure 3 shows the nominal response profiles from these tripped
rollover events. These profiles were developed to establish vehicle independent
simulation parameters representative of a tripped rollover event, as shown in Figure 4. For
the tripped event, the lateral acceleration profile has a brief period of deceleration in the
range of 0.6 g prior to tripping, followed by a higher lateral acceleration pulse of 2.5 g
magnitude and 0.25 second duration. The deceleration prior to tripping simulates the build
up of lateral acceleration before a tripped rollover event. The duration of the lateral
acceleration pulse in the tripped rollover is much shorter than the lateral acceleration

3
profile used during the threshold event. The peak roll rates are 180 deg/sec for both
simulated events; however, the roll acceleration (slope of roll rate from 0 to 180 deg/sec)
for the tripped event is much greater than the threshold event.
Note that the standard SAE vehicle dynamics (SAE J670) and crash testing (SAE J1733)
coordinate systems are used for Figures 1 through 4.
-0.5 0 0.5 10
0.5
1
Time (sec)
Lat.
Accel. (
g)
Threshold Rollover: Lateral Acceleration
-0.5 0 0.5 1-200
-100
0
Time (sec)
Roll
Rate
(deg/s
)
Threshold Rollover: Roll Rate
-0.5 0 0.5 1-100
-50
0
Time (sec)
Roll
Angle
(deg)
Threshold Rollover: Roll Angle
Figure 1 – Nominal response profiles from threshold events

4
-0.5 0 0.5 1 1.5-0.2
0
0.2
0.4
0.6
0.8
1
1.2
Time (sec)
Lat.
Accel. (
g)
Untripped Rollover: Lateral Acceleration
-0.5 0 0.5 1 1.5-100
-80
-60
-40
-20
0
Time (sec)
Roll
Angle
(deg)
UnTripped Rollover: Roll Angle
Variable Name Units Range
AY Acceleration Peak g 0.6 – 1.0
T90 Time to 90 Deg Roll (and End Accel.) sec 0.9 – 1.1
Figure 2– Roll simulator test parameters for threshold event
Threshold Rollover: Lateral Acceleration
Threshold Rollover: Roll Angle

5
-0.5 0 0.5 10
1
2
3
Time (sec)
Lat.
Accel. (
g)
Tripped Rollover: Lateral Acceleration
-0.5 0 0.5 1-200
-150
-100
-50
0
Roll
Rate
(deg/s
)
Tripped Rollover: Roll Rate
-0.5 0 0.5 1-100
-50
0
Time (sec)
Roll
Angle
(deg)
Tripped Rollover: Roll Angle
Figure 3 – Nominal response profiles from tripped events

6
-0.5 0 0.5 1-0.5
0
0.5
1
1.5
2
2.5
3
Time (sec)
Lat.
Accel. (
g)
Tripped Rollover: Lateral Acceleration
-0.5 0 0.5 1-100
-80
-60
-40
-20
0
Time (sec)
Roll
Angle
(deg)
Tripped Rollover: Roll Angle
Variable Name Units Range
AYpeak Acceleration Pulse Amplitude g 2.5 – 3.0
AYinit Initial Acceleration g 0.4 – 0.8
Tpulse Acceleration Pulse Width sec 0.20 – 0.30
T90 Time to 90 Deg Roll sec 0.50 – 0.70
Figure 4– Roll simulator test parameters for tripped event

7
2.2 Test Protocols
For each vehicle, three threshold tests and three tripped tests were conducted, each with a
belted and instrumented Hybrid III 50th
percentile male ATD in the driver’s seat. All roll
events were driver’s side leading; thus, the ATD was a belted nearside occupant.
Following those tests, another threshold test was conducted for qualitative purposes, at the
request of the CPSC, with an unbelted and uninstrumented Hybrid II 50th
percentile male
ATD as the nearside occupant (again in the driver position). The yaw angle used for
testing on the roll simulator was determined through analysis of the resulting lateral and
longitudinal vehicle accelerations at the time of roll in previously published tests. Vehicle
C was the first vehicle tested in this series, and testing was completed at a yaw angle of
eight degrees, based upon an initial analysis of the available real-world data and previous
test results. However, upon completion of data reduction of tests completed per CPSC-D-
11-0003 Task Order 0001 – Task 1, it was determined that while a yaw angle of eight
degrees is well within the range of dynamic response for this class of vehicles, a yaw angle
of 15 degrees was approximately the average across the range of vehicles tested.
Therefore, a yaw angle of 15 degrees was used on all other vehicles. Additionally, during
unbelted occupant testing, a series of tests was completed on Vehicle B at yaw angles of
zero and eight degrees to allow for additional comparisons by the CPSC staff.
Currently, there is no published test method for use of ATDs in ROV tests. The ATD
positioning and documentation protocol used here was based upon existing protocols. The
ATD joints were set at 1 g, and prior to each test, the ATD was positioned within the
occupant compartment. Measurements of its position relative to the occupant
compartment and the on-board camera were recorded (based on applicable portions of SAE
J128, 49CFRPart 572, FMVSS 208). These pretest measurements were used to determine
the position of the outboard ROPS plane (x-z plane) and the ATD initial y-position relative
to this plane for each test (Table 1). The ROPS plane is shown in the results in the
Appendix as a solid constant y-value.
Table 1 – Initial ATD y-position relative to ROPS plane (in inches)
Belted Unbelted
Mean StDev Mean StDev
Vehicle B_1 8.8 +/-0.00 8.7 +/-0.00
Vehicle B_2 N/A 8.3 +/-0.15
Vehicle C 8.6 +/-0.08 9.0 +/-0.00
Vehicle D 11.0 +/-0.08 11.0 +/-0.00
Vehicle F 7.0 +/-0.38 7.5 +/-0.00
Vehicle G 10.5 +/-0.08 11.0 +/-0.00
Vehicle H 8.0 +/-0.54 6.2 +/-0.00
Vehicle K 9.4 +/-0.20 9.0 +/-0.00

8
Pretest and post-test photographs were taken to document each test. In addition to the
previously specified documents, the following were reviewed for determining the ATD
positioning and pretest measurement protocols:
• “Improved ATD Positioning Procedures,” Reed, et al., Society of Automotive
Engineers, Paper Number: SAE 2001-01-0117, 2001.
• NATO Document No. RTO-TR-HFM-090, Chapter 4 “Test Methods and
Procedures,” and Annex I “Test Protocol for Occupant Safety Measurements and
Injury Assessment,” Final Report of the HFM-90 Task Group 25, April 2007.
• U.S. Department of Transportation, National Highway Traffic Safety
Administration Laboratory Test Procedure for FMVSS 208, FMVSS 212, FMVSS
219, and FMVSS 301F, TP208-13, July 27, 2005.
Linear accelerometers (Crossbow, CXL04GP3-R-AL, 4G triaxial, 100 Hz) and an angular
rate sensor (Spectrum Sensors and Controls, 11206AC, 300 deg/sec uniaxial, 100 Hz) were
rigidly attached to the vehicle. These vehicle measurements were recorded and transcribed
to the vehicle center of gravity. Occupant motion was recorded with an on-board, high-
speed video camera (250 fps). In addition to the on-board camera, three off-board high-
speed video cameras (300 fps) were used to document each test. These cameras captured
the vehicle and occupant motion from above, in front, and isometrically from the side of
the vehicle during the actual roll phase. Synchronization of all video data with the vehicle
and ATD data was accomplished through a synchronized electrical signal and on-board
flash. ATD head and chest accelerations were also recorded for each test that used a
Hybrid III ATD; however, further analysis of these data is beyond the scope of the current
study. All ATD data were collected per SAE J211.
2.3 Results
The Appendix contains the requested test results for each belted occupant test. A sample
of each plot presented and a brief explanation are provided in this section. The metrics
presented in the Appendix are vehicle lateral acceleration, vehicle roll angle, and nearside
occupant head displacement. Also included are still-frame photographs of occupant
position at 0 degrees and 45 degrees of roll angle.
Occupant head kinematics are calculated through analysis of the high-speed video data.
Markers were placed on the ATD head and torso, as well as on the vehicle and were
digitized from 0 to 90 degrees of vehicle roll angle. A detailed procedure for this tracking
analysis can be found in the paper below:
• “Establishing Occupant Response Metrics on a Roll Simulator,” Yoder, et al.,
Society of Automotive Engineers, Paper Number: SAE 2012-01-0099, 2012.
As has been described in the previously referenced papers, the initial phase of motion of
the roll simulator involves accelerating the vehicle to a specified speed and then
maintaining this speed prior to initiating any roll motion. During this initial phase, the
ATD’s inertia causes the ATD to lean inboard and then, during the constant speed phase,

9
the ATD reaches a quasi-static position near its original position prior to roll initiation.
Qualitative analysis of the on-board camera videos throughout the entire motion of the
ATD was completed to ensure that a quasi-static position was achieved. Quantitative
analysis of ATD head kinematics was only completed during the roll event. In the
displacement data presented in the Appendix, zero displacement represents the initial
position of the ATD head; positive displacement represents inboard motion; and negative
displacement represents outboard motion. Since only the first 90 degrees of motion were
being assessed in this test series, data that were collected after 90 degrees of roll are
depicted in the results in grey.
As an example, Figures 5 and 6 show vehicle roll angle, vehicle lateral acceleration, and
Y-axis (lateral) and Z-axis (vertical) ATD head motion for threshold tripped tests,
respectively, of Vehicle C. The ATD head lateral and vertical motions are plotted against
time and against roll angle, with the ROPS plane shown as a solid constant y-value on
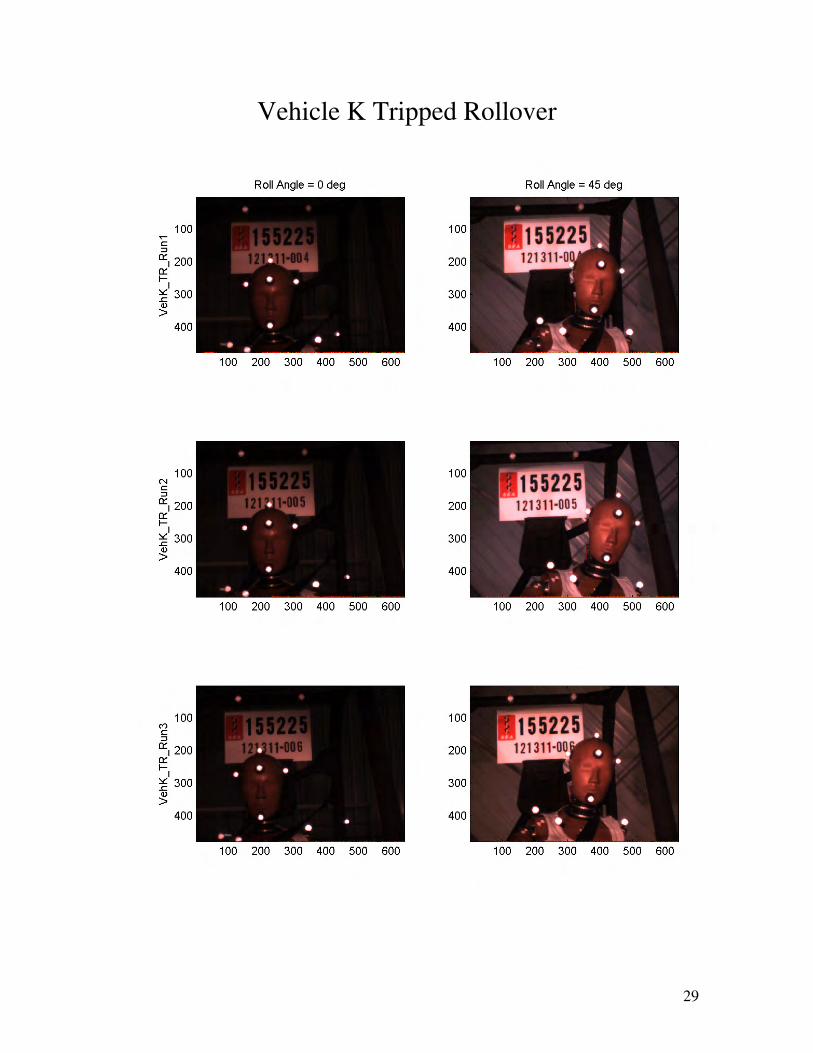
these plots for demonstrative purposes. Figure 7 is a sample of on-board video clips from
the same threshold test as shown in Figure 5. In Figure 8, video clips from an unbelted
ATD threshold test are shown for comparison purposes. These plots and photographs are
provided in the Appendix for all tested vehicles. Table 2 presents the mean and maximum
relative head displacements (in inches) for each test. In this table, the AVG values are the
means of the peak value measured for all tests of that particular vehicle and event.
Similarly, MAX values are the highest peak values measured from any test in the particular
series.

10
Figure 5 – Vehicle lateral acceleration, roll angle, and ATD head motion for threshold roll.

11
Figure 6 – Vehicle lateral acceleration, roll angle, and ATD head motion for tripped roll.

12
Figure 7 – Sample video clips from on-board camera at 0 and 45 degrees for threshold roll
with belted ATD.
Figure 8 – Sample video clips from on-board camera at 0 and 45 degrees for threshold roll
with unbelted ATD.

13
Table 2 – Head Displacement
BELTED TEST RESULTS
Vehicle Event Type Yaw Angle (degrees)
Head Excursion (inches)
Y-Avg Y-Max Z-Avg Z-Max
B Threshold 15 -3.8 -4.0 -1.8 -3.0
B Trip 15 -5.6 -5.7 -2.1 -2.3
C Threshold 8 -3.9 -4.2 -0.9 -1.4
C Trip 8 -5.5 -6.4 -1.8 -2.1
D Threshold 15 -9.3 -9.5 -2.8 -1.7
D Trip 15 -13.0 -16.1 -5.1 -7.8
F Threshold 15 -8.7 -12.0 -6.0 -6.1
F Trip 15 -13.1 -14.3 -6.9 -7.3
G Threshold 15 -16.0 -16.8 -3.1 -3.9
G Trip 15 -14.0 -14.1 -3.1 -3.2
H Threshold 15 -16.8 -18.9 -3.2 -4.0
H Trip 15 -14.3 -14.4 -2.5 -3.0
K Threshold 15 -15.6 -16.2 -0.6 -1.0
K Trip 15 -14.0 -14.7 -2.2 -2.3

14
3. SUMMARY The current work provides objective occupant kinematic data on a range of 2009-2011
model year Recreational Off-Highway Vehicles during 90-degree threshold and tripped
rollover events. The test inputs utilized here, and developed under CPSC-D-11-0003 Task
Order 0001 – Task 2, are shown to be repeatable and produce meaningful results relative to
passive occupant kinematic assessment. In general, the range of 0 to 90 degrees on the roll
simulator provides good representation of lateral acceleration and roll motion as observed
in the literature and measured during actual 90-degree rollover events.
This current study specifically analyzed only belted occupant motion from 0 to 90 degrees
of roll angle. The metric utilized to quantify ATD kinematics for these tests was head
displacement toward the outboard ROPS plane relative to the initial head position. The
methodology applied for these measures has been discussed in the referenced literature. In
the subject test series test-to-test differences were observed, primarily in overall magnitude
of head motion and in timing of maximum displacement. These differences were not
significant for the majority of vehicles, however some vehicles did have larger differences.
ATD pre-test placement variations and head excursion evaluation technique accuracy are
two known sources of test-to-test response differences. These sources do not account for
the range on some vehicles, suggesting additional repeat runs are necessary for full
characterization.
Initial unbelted tests have been completed, clearly showing that passive occupant response
is dramatically different in the unbelted scenario. However, occupant interaction with both
occupant compartment and outboard containment structures varies considerably based
upon lateral acceleration and yaw angle. Further parametric-type testing is needed to
refine test procedures for assessment of unbelted occupant response.

15
APPENDIX

16
Maximum Head Displacement (in)
Threshold Tripped
Vehicle Head Y Head Z Head Y Head Z
C
Run 1 -4.0 -1.4 -6.4 -1.8
Run 2 -4.2 -1.0 -6.3 -2.1
Run 3 -3.5 -0.4 -3.9 -1.6
Mean -3.9 -0.9 -5.5 -1.8
B
Run 1 -3.3 -3.0 -5.4 -1.8
Run 2 -4.0 -1.2 -5.7 -2.1
Run 3 -4.0 -1.1 -5.7 -2.3
Mean -3.8 -1.8 -5.6 -2.1
K
Run 1 -16.2 -1.0 -13.1 -2.1
Run 2 -16.0 -0.2 -14.7 -2.2
Run 3 -14.7 -0.6 -14.2 -2.3
Mean -15.6 -0.6 -14.0 -2.2
D
Run 1 -9.5 -4.3 -16.1 -7.8
Run 2 -9.3 -2.5 -11.7 -3.8
Run 3 -9.1 -1.7 -11.3 -3.7
Mean -9.3 -2.8 -13.0 -5.1

17
Threshold Tripped
Vehicle Head Y Head Z Head Y Head Z
F
Run 1 -5.8 -6.0 -13.2 -7.2
Run 2 -12.0 -6.1 -14.3 -7.3
Run 3 -8.8 -6.0 -11.8 -6.3
Mean -8.7 -6.0 -13.1 -6.9
G
Run 1 -16.4 -2.9 -13.7 -3.2
Run 2 -16.8 -2.6 -14.0 -3.1
Run 3 -14.7 -3.9 -14.1 -2.9
Mean -16.0 -3.1 -14.0 -3.1
H
Run 1 -18.9 -4.0 -14.2 -2.1
Run 2 -16.3 -2.4 -14.4 -3.0
Run 3 -15.1 -3.2
Mean -16.8 -3.2 -14.3 -2.5
Threshold
Belted
Threshold
Unbelted
B
Run 1 -15.3 -4.3 -14.9 -4.3
Run 2 -12.6 -2.6 -16.2 -2.6
Run 3 -12.9 -2.1
Mean -13.6 -3.0 -15.6 -0.4
The results shown in red indicate that the maximum excursion was not obtained because it
exceeded the field of view of the camera. The ATD was not contained in the vehicle.
Please refer to the videos.

18
Vehicle C Threshold Rollover

19
Vehicle C Threshold Rollover

20
Vehicle C Tripped Rollover

21
Vehicle C Tripped Rollover

22
Vehicle B Threshold Rollover

23
Vehicle B Threshold Rollover

24
Vehicle B Tripped Rollover

25
Vehicle B Tripped Rollover

26
Vehicle K Threshold Rollover

27
Vehicle K Threshold Rollover

28
Vehicle K Tripped Rollover
29
Vehicle K Tripped Rollover

30
Vehicle D Threshold Rollover

31
Vehicle D Threshold Rollover

32
Vehicle D Tripped Rollover

33
Vehicle D Tripped Rollover

34
Vehicle F Threshold Rollover

35
Vehicle F Threshold Rollover

36
Vehicle F Tripped Rollover

37
Vehicle F Tripped Rollover

38
Vehicle G Threshold Rollover

39
Vehicle G Threshold Rollover

40
Vehicle G Tripped Rollover

41
Vehicle G Tripped Rollover

42
Vehicle B Threshold Unbelted Rollover

43
Vehicle B Unbelted Rollover

44
Vehicle H Threshold Rollover

45
Vehicle H Threshold Rollover

46
Vehicle H Tripped Rollover

47
Vehicle H Tripped Rollover