TESIS DOCTORAL Contribution of perforant path synaptic markers and GSK-3 to cognitive ... ·...
185
TESIS DOCTORAL Contribution of perforant path synaptic markers and GSK-3 to cognitive impairment and Alzheimer´s Disease. Autora: Laura Molina Porcel Directores: Dra. Virginia M-Y Lee Dra. Teresa Gómez Isla Dr. Antonio Escartin Siquier PROGRAMA DE DOCTORADO EN MEDICINA INTERNA UNIVERSIDAD AUTÓNOMA DE BARCELONA 2015
Transcript of TESIS DOCTORAL Contribution of perforant path synaptic markers and GSK-3 to cognitive ... ·...

TESIS DOCTORAL
Contribution of perforant path synaptic markers and GSK-3 to cognitive impairment
and Alzheimer´s Disease.
Autora:
Laura Molina Porcel
Directores:
Dra. Virginia M-Y Lee Dra. Teresa Gómez Isla
Dr. Antonio Escartin Siquier
PROGRAMA DE DOCTORADO EN MEDICINA INTERNA UNIVERSIDAD AUTÓNOMA DE BARCELONA
2015

1
Contribution of perforant path synaptic markers and GSK-3 to cognitive impairment
and Alzheimer´s Disease. Tesis presentada por Laura Molina Porcel para optar al grado de Doctor por la Universitat Autònoma de Barcelona. Trabajo realizado en el Center for Neurodegenerative Disease Research, bajo la dirección de los Doctores Virginia M-Y Lee, Teresa Gomez Isla y Antonio Escartin. Barcelona, 17 de noviembre de 2015
Doctoranda:
Laura Molina Porcel
Directores de tesis:
Dra. Virginia M-Y Lee Dra. Teresa Gómez Isla Dr. Antonio Escartin Siquier

2

3

4

5

6
A mi familia

7

8
CONTENT
I. INTRODUCTION 12 1. Alzheimer´s disease 14
1.1. Neuropathological changes 14 1.2. Physiopathology 15
1.2.1. Amyloid- peptides and Amyloid precursor protein 16 1.2.2. Tau protein 18
1.3. Treatment 20
2. Contribution of synaptic markers in cognitive status and cognitive impairment in the oldest-old 21
2.1. Relevance of studies in nonagenarians 21 2.2. Common causes of dementia in the elderly 24
2.2.1. Cerebrovascular disease 25 2.2.2. Hippocampal sclerosis 25
2.3. Contribution of synaptic markers to dementia and cognitive impairment 27 2.3.1. Synaptophysin 28 2.3.2. Synaptic vesicle transporter (SV2) 29 2.3.3. Vesicular glutamate transporter 1 (VGLUT1) 30
3. Contribution of Glycogen synthase kinase 3 (GSK-3) to Alzheimer´s disease pathology and cognitive impairment 32
3.1. Protein characteristics of GSK-3 32 3.2. Methods to reduce GSK-3 activity in mice models 34
3.2.1. GSK-3 inhibitors 34 3.2.2. Conventional knockout 35 3.2.3. Short hairpin RNA (shRNA) 35 3.2.4. Conditional transgenic mice 37
3.2.4.1. Dominant negative transgenic mice 37 3.2.4.2. Conditional knockout transgenic mice 38
3.3. GSK-3 in Alzheimer´s disease 40 3.3.1. GSK-3 and tau 41 3.3.2. GSK-3 and APP 44
II. HYPOTHESIS 49
III. OBJECTIVES 52
IV. METHODS AND RESULTS 55

9
STUDY 1: Contribution of synaptic markers in cognitive status and cognitive impairment in the oldest-old 56
1.1. METHODS 57 1.1.1. Study population 57 1.1.2. Determination of cognitive status 57 1.1.3. Neuropathology 58 1.1.4. Synaptic protein measures 59 1.1.5. Statistical analysis 61
1.2. RESULTS 62 1.2.1. Subject characteristics 62 1.2.2. Alzheimer´s disease pathology 62 1.2.3. Hippocampal sclerosis 64 1.2.4. Cerebrovascular disease 64 1.2.5. 43-kDa transactive response sequence DNA-binding protein (TDP-43) 65 1.2.6. Synaptic markers 66 1.2.7. Multiple pathologies 68 1.2.8. Memory impairment only subjects 68
STUDY 2: Contribution of GSK-3 to Alzheimer´s disease pathology and cognitive impairment in an APP mouse 71
2.1. METHODS 72 2.1.1.Generation of conditional knockout transgenic mice 72
2.1.1.1. Generation of heterozygous GSK-3 floxed mice by Taconic 72 2.1.1.2. CRE lines 74 2.1.1.3. PDAPP mice 75 2.1.1.4. Breeding schemes 76 2.1.1.5. Tamoxifen induction in CRE-ERT2 lines by Taconic 79
2.1.2. Histology and brain preparation 79 2.1.2.1. Antibodies used in histology 79 2.1.2.2. Immunohistochemical quantification 80
2.1.3. Western blots 80 2.1.4. Behavioral analysis 81
2.1.4.1. Open field test 81 2.1.4.2. Barnes maze 81
2.1.5. Statistical analysis 83
2.2. RESULTS 84 2.2.1. GSK-3 expression in GSK-3 cko and in GSK-3 cko mice 84 2.2.2. GSK-3 cko mice did not survive after tamoxifen induction 87

10
2.2.3. Double transgenic GSK-3 CKO-PDAPP and GSK-3 CKO-PDAPP mouse line generation 88
2.2.4. GSK-3 CKO decreases A amyloid deposition in PDAPP mice 90 2.2.5 Conditional knockout of GSK-3 prevents age-dependent behavioral
deficits in PDAPP mice 91
V. DISCUSSION 94 STUDY 1: Contribution of synaptic markers in cognitive status and
cognitive impairment in the oldest-old 95
STUDY 2: Contribution of GSK-3 to Alzheimer´s disease pathology and cognitive impairment in an APP mouse 103
VI. CONCLUSIONS 112
VII. REFERENCES 116
VIII. ABBREVIATIONS 152
IX. ACKNOWLEDGEMENTS 156
X. APPENDIX 160 Appendix 1: “Perforant path synaptic loss correlates with cognitive
impairment and Alzheimer´s disease in the oldest-old." Robinson JL, Molina Porcel L, Corrada MM, Raible K, Lee EB, Lee VM, Kawas CH, Trojanowski JQ. Brain. 2014 Sep;137(Pt 9):2578-87. 161
Appendix 2: “Selectively silencing GSK-3 isoforms reduces plaques and tangles in mouse models of Alzheimer´s disease. " Molina-Porcel L, Hurtado DE, Carroll JC, Macdonald C, Aboagye AK, Trojanowski JQ, Lee VM. J Neurosci. 2012 May 23;32(21):7392-402. 173

11

12
I. INTRODUCTION

13
I. INTRODUCTION
The frequency of Alzheimer´s disease (AD) and other dementias is increasing
worldwide due to the progressive ageing of the population. In Spain reported rates
vary, but the prevalence appears to be about 6% among those aged 75 years or
older (1). Moreover, the annual incidence of new cases of AD per 1000 people-year
in our country increases with age, from about 1.5 at ages 65-69 up to 50 at age of 90
or above (2).
Researchers estimate that the prevalence of dementia and AD in Western Europe
will duplicate by 2050, and quadruplicate in some large countries such as China and
India (3). This increase will have a tremendous impact in our societies. First, because
of the devastating effects of this disease on the health of patients and also their
caregivers, who experience increased rates of stress and depression (4), and
secondly, on our economies. Although these numbers vary between countries, the
estimated cost per patient per year in Western European countries is over 30,000
USD, amounting to over 1.2% of the gross domestic product (5).
AD and other neurodegenerative dementias show a great diversity of clinical
phenotypes but in general are clinically characterized by progressive cognitive and
behavioral impairment that gradually interferes with activities of daily living (ADL). In
the early stages, one or more cognitive domains are affected, but without interfering
with ADL. This period has received several names, such as cognitive impairment but
not dementia (CIND) or mild cognitive impairment (MCI) (6,7). In this dissertation, we
used CIND to define individuals with cognitive or functional loss that did not meet the
criteria for dementia using the Diagnostic and Statistical Manual of Mental Disorders
4th edition criteria (8).
From the pathological point of view, AD and other neurodegenerative diseases share
a common pathological hallmark which is the accumulation of characteristic abnormal
proteins into insoluble aggregates inside or among selectively vulnerable neurons or

14
glial cells (9). These aggregates associate with neuronal and synaptic loss, but the
mechanisms involved are not fully understood.
1. Alzheimer´s disease
1.1. Neuropathological changes
Macroscopic findings in AD brains include brain atrophy, with loss of brain volume
involving the temporal (including the hippocampus), parietal and frontal lobes and
thinning and shortening of the cortical ribbon of the temporal, frontal and parietal gyri.
There is also associated ex vacuo ventricular dilation (10).
Microscopic findings of AD are senile plaques (SP), neurofibrillary tangles, dystrophic
neurites, neuronal and synaptic loss, granulovacuolar degeneration, Hirano bodies,
inflammatory glial reaction with reactive astrocytes and amyloid angiopathy.
However, only SP and neurofibrillary pathology are included in the diagnostic criteria
for AD.
SP are extracellular and insoluble deposits mainly composed of -amyloid peptides
(A(11,12). Plaques can be classified as focal or diffuse A deposits. Classic or
neuritic plaques are focal Aβ deposits which are characteristic of AD. They have a
spherical structure with central condensation, positive for amyloid stains, and is
surrounded by a peripheral halo, which is often separated by a clear zone that
contains glial cells and dystrophic neuronal processes (13). In contrast, diffuse
plaques, also present in AD and common in non-demented elderly and in Down
syndrome, are morphologically diverse, can be larger than neuritic plaques, have
irregular contours, stain weakly or are negative for amyloid stains, and have a lack of
dystrophic neurites (10).
Neurofibrillary tangles (NFT) are intracellular filamentous inclusions composed of
misfolded hyperphosphorylated tau protein (14) forming paired helical filaments

15
(PHF) and straight filaments (15) that occupy the cytoplasm and extend into apical
dendrites. Although NFT are a key diagnostic feature of AD, they are not specific to
the disease and can be present in normal brains and in several other conditions (i.e.
progressive supranuclear palsy (16), cortical basal degeneration (17), parkinsonism-
dementia complex of Guam (18)).
1.2. Physiopathology
AD is a complex and heterogeneous disorder. Family history increases the risk for
AD by four times compared with the general population (19,20); however, it is
estimated that only in around 0.5% of the cases a monogenic cause is identified (21).
The three identified genes are the amyloid precursor protein (APP) (22), presenilin-1
(PSEN1)(23), and presenilin-2 (PSEN2) (23,24) that when mutated, or in the case of
the APP gene also when duplicated (25–28), can cause an early-onset form of AD
(<65 years). The pattern of inheritance of these three genes is autosomal dominant.
They are strongly tied to APP and Ametabolism, and as I will discuss below, they
are one of the bases of the amyloid hypothesis of AD.
Nevertheless, the most common form of AD is the late-onset (> 65 years). In this
complex subtype of AD, a combination of biological, genetic, environmental and
lifestyle factors are involved. For example, the presence of the allele ε4 of the
apolipoprotein E (APOE), the primary genetic risk factor for late-onset AD, increases
the probability of developing AD over time, and reduces the age of onset in a dose-
dependent manner (29), while the ε2 allele decreases the risk and increases the age
at onset (30).
The exact mechanism and how all of these factors interact and contribute to both
forms of AD is still unknown. However, the presence of SP and NFT in the
neuropathology together with the genetic causes of the disease indicates that it is
related to APP and tau metabolism.

16
1.2.1. Amyloid- peptides and amyloid precursor protein
The APP gene is located on chromosome 21 and contains 18 exons (26–28). APP is
a type I integral membrane protein, with a large extracellular domain, and a short
cytoplasmic domain. The normal function of APP is not well known; it has been
proposed as a cell surface receptor and sequential downstream signaling molecule
(31), or to be involved in cell adhesion (32), cell movement (33), or synaptic formation
(34–36).
Two major proteolytic pathways have been described for APP, the amyloidogenic
and the non-amyloidogenic pathway (Figure 1):
In the non-amyloidogenic pathway, APP is first cleaved by -secretase between the
amino acids lysine-16 and leucine-17 of the A sequence, generating a larger APP
soluble fragment α (APPs), and a smaller -C-terminal fragment (CTF) with ~83
amino acids. Subsequently, CTF is cleaved by-secretase, generating an amyloid
precursor protein intracellular domain fragment (AICD) and a 3KDa peptide (p3) (37).
-Secretase is an intramembrane aspartyl protease complex composed of four
subunits presenilin, nicrastin, anterior pharynx-defective 1 (Aph-1), and presenilin
enhancer 2 (PEN-2) (38–40).
In the amyloidogenic pathway, APP is first cleaved in the extracellular domain by -
secretase 1 (BACE1), a transmembrane aspartyl protease identified in 1999 (41,42).
This cleavage generates two fragments, the shedding of nearly the entire
ectodomain, named APP soluble β (APPsβ) fragment, and a membrane-tethered C-
terminal fragment consisting of the last 99 amino acid residues of APP, named -C-
terminal fragment (CTF) or C99. Then, -CTF is cleaved by -secretase in the
transmembrane domain generating two fragments: an extracellular peptide, A, with
a weight of ~4KDa, and a cytoplasmic polypeptide named AICD. -Secretase cleaves
APP at multiples sites within the transmembrane domain, generating Apeptides of
several lengths ranging from 38 to 43 amino acids. The majority of the secreted A

17
peptides secreted have a terminal residue 40 (A40) (~90%), whereas fewer than
10% of them end at residue 42 (A42). A42 and A40 are the major components of
SP in AD.
Figure 1: Proteolytic processing of the amyloid precursor protein.
Little is known about the physiological function of APP and its derivatives, such as
AFor example, Aβ1-42 is a conserved sequence within APP across species,
suggesting that this peptide has a functional value (43). In fact, at low doses, Acan
positively modulate synaptic plasticity and memory by increasing long-term
potentiation in mice (44), induce angiogenesis in human endothelial cells and

18
zebrafish brain (43), and, at least in vitro, play a role in neurogenesis from neural
stem cells (45).
However, the majority of studies have been focused on reproducing pathological
conditions by using overexpression and mutation models. From these models we
have learnt that an increase in A leads to tau alterations (46–48), synaptic
abnormalities (49–51), excitotoxicity (52), and neuronal loss (53).
1.2.2. Tau protein
Tau is a microtubule (MT)-associated protein discovered in 1975 (54). It is a very
soluble protein and naturally unfolded. Tau is abundant in the central nervous system
(CNS), in neurons and glia cells (55,56), and is also expressed in the peripheral
nervous system (57). In neurons, tau is located predominantly in axons, in
association with MT (54). Tau is encoded by a single gene (Microtubule-Associated
Protein Tau gen (MAPT)) which is located on chromosome 17at position 21.1. MAPT
consists of 16 exons: exons 2 and 3 encode N-terminal repeats, and exons 9, 10, 11
and 12 encode carboxy terminal tubulin/MT-binding domains. In the adult human
CNS, alternative splicing of exons 2, 3 and 10 generate six isoforms (58,59). Each
isoform differs from the next by the presence of zero, one or two N-terminal repeats
(0N, 1N or 2N) and by the presence of three (3R) or four (4R) carboxy terminal
tubulin/MT-binding domains. In the adult human brain, the ratio 3R and 4R is close to
1, and alterations in this ratio are related to pathology(60). The 6 isoforms are named
4R2N, 3R2N, 4R1N, 3R1N, 4R0N and 3R0N.
Tau has been implicated in binding, stabilizing and promoting the polymerization of
MT (61). Isoforms with more MT binding domains (4R) are more efficient than 3R
isoforms in this role (62). Other possible functions of tau are the regulation of motor-
driven axonal transport (63), neurite outgrowth (64), cellular signaling, neuronal
development, neuroprotection, apoptosis and scaffolding (65). Interestingly, Tau

19
knockout (KO) mice are viable. In these mice, MT stability and organization is altered
in some small caliber axons, and an increase in MT-associated protein 1A was found
suggesting a possible compensation mechanism (66).
Tau undergoes several posttranslational modifications such as phosphorylation,
truncation, nitration, glycation, glycosylation, ubiquitination, polyamination and
acetylation (for review see (67,68)). Their functions are not well known: some may be
related to normal tau function, but others are thought to play a role in the
pathogenesis of diseases such as AD. One post-translational modification that has
been widely studied is phosphorylation. Tau phosphorylation seems to have a
physiological role in development, and in axonal transport (69–71). However, in AD,
hyperphosphorylated tau aggregates in PHF. PHF are abnormal twisted filaments
and the major component of NFT. NFT are intracellular neuronal inclusions of tau
that occupy the cytoplasm and extend into apical dendrites (14)
It is not fully understood how tau becomes hyperphosphorylated and aggregated, or
what the consequences of this process are. It is possible than an increase in protein
kinases and/or a decrease in phosphatase activity could increase tau
phosphorylation (72). The largest isoform of tau has 79 potential serine and threonine
phosphate acceptor sites, at least 39 of which have been reported to be
phosphorylated in PHF and 9 in normal tau (73). These sites are clustered in regions
flanking MT. MT are critical for axonal transportation, and an increase in tau
phosphorylation may decrease MT binding, possibly compromising MT stability and
axonal transport by loss of function (71,74–76). This increase of
hyperphosphorylated, unbound and soluble tau may promote the aggregation of tau
and other proteins, and produce axonal dysfunction, synaptic deficits and neuronal
loss (for a review of tau in AD see (77–82)).
Multiple kinases are able to phosphorylate tau in vitro, such as mitogen-activated
protein kinases (MAPK), cyclin-dependent kinase 5 (CDK-5), or Calcium/calmodulin-
dependent protein kinase II (CAMKII). However, there is evidence that glycogen
synthase kinase 3 (GSK-3) plays an important role in regulating tau phosphorylation

20
in vivo under physiological and pathological conditions (67): therefore, GSK-3 has
been identified as a possible therapeutic target in AD and other tauopathies.
Several findings implicate tau in the cascade of events leading to neuronal death in
AD and other tauopathies. In AD, NFTs are necessary for diagnosis (83). They have
a characteristic distribution and progression in AD brains (84,85), and correlate better
with cognition than SP (86). Nonetheless, the way in which tau is involved in AD is
not fully understood. Tau mutations are responsible for a hereditary
neurodegenerative disease called frontotemporal dementia and parkinsonism linked
to chromosome 17, but not for AD. Tau mutations induce tau pathology and neuronal
loss, but no plaque formation (87). However, as stated previously, APP, PSEN1 and
PSEN2 mutations generate SP but also NFT, suggesting that alterations in APP and
A formation can induce changes in tau processing. In addition, some studies
suggest that A-mediated neuronal cell death and memory deficits require tau
(88,89). Altogether, these observations place tau pathology downstream of amyloid
pathology. However, recent data suggest that in non-selected cases, tau deposition
could start earlier than A deposition (90). Nevertheless, the precise mechanistic link
between A and tau remains to be resolved. Several molecules, such as GSK-3,
have been implicated in this role (for review, (91)).
1.3. Treatment
For the pharmacological treatment of AD, the United States Food and Drug
Administration and the European Medicines Agency approved acetylcholinesterase
inhibitors (Donepezile, Rivastigmine and Galantamine) for mild to moderate AD, and
Memantine, an N-methyl-D-aspartate (NMDA) antagonist for moderate to severe AD.
The goal of these treatments is to modulate neurotransmitter imbalance observed in
AD brains. On the one hand, several studies have suggested a deficiency in
cholinergic neurotransmission in AD brains which may correlate with cognitive and

21
behavioral symptoms (92,93). Acetylcholinesterase inhibitors reduce degradation of
acetylcholine by inhibition of a catabolic enzyme present in the synapses
(acetylcholinesterase). This inhibition increases acetylcholine synaptic concentration
and postsynaptic neurotransmission effects(94). On the other hand, memantine is a
low-moderate affinity, uncompetitive NMDA receptor antagonist. Glutamate is an
excitatory neurotransmitter involved in memory that interacts with NMDA receptors.
An excess of stimulation on these receptors can produce an excitatory response by a
massive entrance of calcium into the cell, leading to neuronal dysfunction and death.
Pharmacological studies suggest that Memantine preferentially blocks activated
NMDA receptors, but due to its low affinity and relatively fast off-rate it does not
interfere with normal synaptic transmission (for review (95).
Unfortunately, current treatments provide some short symptomatic benefit but do not
alter the underlying disease process. Further investigation is needed to identify new
targets that potentially may be able to modify disease progression. In this
dissertation, we first studied the correlations between synaptic markers and other
pathological changes with cognitive status and global cognitive function in the oldest-
old. In the second part, we sought to elucidate the contribution of GSK-3 in cognitive
impairment and APP-related pathology in a mouse model of AD.
2. Contribution of synaptic markers in cognitive status and cognitive impairment in the oldest-old.
2.1. Relevance of studies in the oldest-old
Recently, researchers have been focusing in individuals 90 years old and older (90+),
for several reasons. First, they are the segment of the population with the fastest
growth of all. For example in Spain, there are currently approximately 339,000 people
aged 90+, and this number is expected to increase to 1.5 million by 2050, which
would account for 3.2 % of the Spanish population (Figure 2) (96). These numbers

22
are similar worldwide and in other developed countries such as the United States of
America (see Table 1) (96).
Figure 2: Oldest old population in Spain from 1990 to 2100. Source: United Nations, Department of Economic and Social Affairs, Population Division (2013). World Population Prospects: The 2012 Revision, DVD edition (medium fertility). (96).
2010 2050
AREA: total (thousands) % total (thousands) %
World 12,792 0,20 68,381 0,70
Spain 339 0,70 1,525 3,20
United States of America 1,918 0,60 7,895 2,00
Table 1: Oldest old total population and percentage estimation 2010 and 2050. Source: United Nations, Department of Economic and Social Affairs, Population Division (2013). World Population Prospects: The 2012 Revision, DVD edition (medium fertility) (96).
Figure 1. Oldest-Old Population in Spain from 1990 to 2100
1990
2000
2010
2020
2030
2040
2050
2100
0
1000
2000
3000
0,3% 0,5% 0,7%1,3%
1,6%2,2%
3,2%
*%of Spanish population
6,9%*
tota
l pop
ulat
ion
(tho
usan
ds)

23
This progressing ageing of the population is alarming because the percentage of
older people that are potentially care receivers is increasing overtime, while the
percentage of people that are potential caregivers (people aged 20 to 64) is
decreasing. For example in Spain, in 2000, for every person aged 90+ there were
113 people aged 20 to 64, but by the year 2050, it is estimated that there will only be
15 (96).
Second, although a high frequency of dementia and AD among the oldest old is
anticipated, their prevalence and incidence are not well known. It is expected that the
risk for AD and dementia would increase with age, but is unknown whether this
increase will be doubling exponentially with every five years of life (97), such as in AD
and people aged from 65 to 90 years (2,98); if this increase will slow down over time
(99); or even whether it will decrease with age in the oldest old (100). Although the
prevalence probably will keep increasing, the potential burden for public health
systems is very different for each assumption, and several population studies are
trying to address this issue.
Third, it is unknown whether factors that potentially confer protection in younger
subjects such as antioxidants, physical and cognitive activities are operative for the
oldest old (101). Similarly, it is unknown whether risk factors are the same. For
example, the allele APOE 4 is a well-known risk factor for AD in the younger elderly
(102), but several studies have failed to find an association in older populations
(97,103–105), suggesting that the association between APOE 4 and dementia
decreases with age or even disappears in the oldest old. A better understanding of
risk and protective factors for AD and other dementias may help to delay the onset of
these diseases.
Fourth, and more closely related to this dissertation, is the fact that the correlation
between the pathological substrates of neurodegeneration and cognitive impairment
are not well known in the oldest old. There is an extensive overlap in pathology
among individuals with and without dementia (106). In our previous work, similarly to
other studies, we found that a number of patients with dementia (22%) did not have

24
sufficient pathology to account for their cognitive loss (107,108). Conversely, about
1/3 of patients met the pathological criteria for AD but did no experience clinical
dementia (109–111). This poor clinical and pathological correlation suggests that
other factors may have an important role in cognition in the oldest old, and that
further investigation is required.
In summary, studies in the oldest old are important for planning for the public health
burden that this age group will produce in the future, and because it may reveal some
disparities compared to the younger population that may allow us to better
understand neurodegenerative diseases, and give us some clues to achieve a better
and healthier ageing.
2.2. Common causes of dementia in the elderly.
The most common cause of dementia in the oldest-old is AD. In our previous paper,
86% of participants that met criteria for dementia before death were diagnosed with
clinical AD (61% alone, 11% AD/dementia with Lewy bodies, 11% AD/Vascular
dementia) (107).
However, the clinical-pathological correlation in the elderly is a little more complex
than in younger patients. Dementia of unknown etiology increases with age (108).
Although neocortical NFT and SP also correlates to dementia in this group of age
(112–114,107), some studies suggest that the density of NFT and amyloid tends to
stabilize with age in the oldest old with cognitive impairment (113,115–117). In fact,
some patients display cognitive impairment besides of a lack of abundant AD or other
pathology such as Lewy bodies, etc. (108). A possible explanation for this is that
other age-related pathologies such as hippocampal sclerosis (HS), cerebrovascular
diseases (CVD), or synaptic loss (118) may contribute to the cognitive impairment
and to dementia (108,86).

25
2.2.1. Cerebrovascular disease (CVD)
CVD is a heterogeneous disease affecting the blood vessels that supply the brain. It
includes among others, large vessel infarcts, microinfarcts, microhemorrhages,
cerebral amyloid angiopathy, etc.
CVD is associated with dementia and cognitive impairment (108,119–122). CVD may
have synergistic mechanisms with AD. For example, MCI patients with white matter
hyperintensities have higher ratios of conversion to dementia than patients without
them (123). In addition, patients with similar cognitive impairment and pathological
changes of CVD display less AD pathology than those with AD pathology alone
(124–126).
CVD frequency increases overtime. For example, in octogenarians (people 80 to 89
years old), white matter hyperintensities detected by magnetic resonance imaging
(MRI) are present in over 75% (119), but in extreme old age it percentage increases
up to 100% (127). On anatomopathological series, subtle CVD pathology has been
observed in over 75% of 90+ individuals (124). Overall, this suggests that the
contribution of CVD in cognitive impairment and dementia in the oldest old may play
an important role.
2.2.2. Hippocampal sclerosis (HS)
HS is a neuropathological condition with severe neuronal loss and gliosis in both
region 1 of the cornus ammonis (CA1) and the subiculum of the hippocampus. It was
first described in 1880 by Wilhelm Sommer (128). HS is related to temporal lobe
epilepsy, and vascular risk factors, but has recently been associated with the oldest
old.
Recent studies suggest that there has been an important increase in the frequency of
HS in extreme old age (129,130). For example, in a previous study our group

26
observed that 18% of participants of The 90+ study that underwent to autopsy
displayed HS (107). Similar results have been found in other studies: for example
16% of the participants of the Bronx Longitudinal Aging Study who are 80 years old
or older (80+) show HS (131). Most importantly, HS strongly correlates to cognitive
impairment and dementia in this age group. For example, lower Mini-Mental State
examination (MMSE) scores were observed in patients with unilateral or bilateral HS
(up to 8 points) (112). Another example is that increased frequencies of HS have
been reported in demented individuals compared to controls, and in some studies,
HS was only observed in demented patients (107,131).
Clinically, HS individuals present prominent memory and language deficits and
become progressively demented (132). They have similar initial symptoms to AD,
except for subtle differences such as in apathy, trail-making test, or word list delay
(129,133). Rates of dementia progression in HS are also similar to those individuals
with AD, so HS is often misdiagnosed (133).
Isolated HS is a rare finding so it usually associated with other pathology such as SP,
NFT, CVD and 43-kDa transactive response sequence DNA-binding protein (TDP-
43) (132,112,107). TDP-43 is a multifunctional protein, able to bind both DNA and
RNA, and involved in many cellular processes including RNA transcription,
alternative splicing or mRNA stability (134). Hyper-phosphorylated TDP-43 is the
major component of both amyotrophic lateral sclerosis and frontotemporal
degeneration with ubiquitin-positive tau- and -synuclein-negative inclusions (135),
and it has been also associated to other pathologies such as AD (136). Interestingly,
TDP-43 seems to be the only factor to increase the odds of HS (130). For example,
in our previous 90+ study, aberrant TDP-43 immunoreactivity was seen in 79% of HS
patients compared with 20% of HS negative patients wirth dementia (107). Other
studies reported higher percentages of TDP-43 pathology in HS patients, up to
89.9% compared to 9.7% in patients without HS (129,130). Furthermore, HS with
coexisting TDP-43 has been associated with lower function in multiple cognitive
domains suggesting a synergistic effect (130). In addition, the sequence of events

27
that lead to HS in the oldest old is not well known, but the finding of TDP-43
immunoreactivity in the contralateral side of individuals with unilateral HS suggests
that HS may be attributable to TDP-43 pathology and it can be a distinct entity related
to aging (129).
2.3. Contribution of synaptic markers in dementia and cognitive impairment.
A common finding in degenerative disorders is the loss of synapses. Synaptic
dysfunction is one of the earliest features in AD (137–140). Indeed, significant
synapse loss has been documented in brain regions affected by AD pathology (141).
Moreover, reductions in the number of synaptic proteins may be the most consistent
progression marker of AD even in extreme old age (142,143).
However, it is unclear whether there is a loss of synapses related to normal aging.
Some papers have reported reduced immunoreactivity of presynaptic markers in
some regions such as the frontal or temporal cortex, while others do not (reviewed in
(144)).
Nonetheless, the relationship between anatomy, synaptic proteins and AD pathology
is complex. First, different synapse types change at different times and in specific
brain regions. For example, cholinergic signaling in the cerebral cortex including
entorhinal cortex and in the hippocampus are affected early due to the degeneration
of the large cholinergic neurons of the ventral forebrain, while -aminobutyric acid
(GABA) transmission is relatively preserved in late AD (reviewed in (145)). Second,
the evolution of synaptic loss in a specific region does not always follow a linear
decrease. Increased synaptic markers can be observed at early stages of the
disease (146,147).
In addition, the mechanisms that relate AD pathology with synaptotoxicity remain
uncertain. Several lines of evidence suggest that A seems to regulate synaptic
activities, and that A production is regulated, at least in part, by neuronal activity

28
(148,149). Accumulation of A may impair the inhibitory activity of interneurons and
stimulate glutamate receptors which can result in excitotoxicity (150–152).
Subsequently, aberrant neuronal activity may trigger a vicious cycle by augmenting
A production (reviewed (153)). In this line, oligomeric A has been shown to induce
synaptic dysfunction and neuritic degeneration (138,154). However, tau mouse
models also show synaptic dysfunction and memory deficits, even before NFT
formation (155,156). Altogether, this suggests than both A and tau are involved in
synaptic dysfunction during the early stages of disease.
In this dissertation, we aimed to understand the synaptic changes underlying
cognitive impairment and dementia and therefore, synaptophysin, synaptic vesicle
glycoprotein 2 isoform (SV2) and vesicular glutamate transporter 1 (VGLUT1) were
measured in the outer molecular layer of the hippocampus, a region affected early in
AD.
2.3.1. Synaptophysin
Synaptophysin is a presynaptic protein located in synaptic vesicles (157,158). It is the
most abundant of the synaptic vesicle proteins, accounting for over 10% of them
(159). Its function is not well known. Several roles have been proposed in synaptic
function including exocytosis, synapse formation and endocytosis of synaptic vesicles
(160–162). For example, synaptophysin is able to bind to synaptobrevin, a
component of the SNARE complex (soluble N-ethylmaleimide sensitive factor
attachment protein (SNAP) receptor) in the synaptic vesicle (163). The SNARE
complex is a group of proteins It has been proposed that by this interaction,
synaptophysin sequesters synaptovebrin and prevents its ability to interact with the
two other components of the SNARE complex on the plasma membrane (syntaxin
and SNAP-25), and therefore membrane fusion and exocytosis might be altered
(164). Interestingly, it has been proposed that A might regulate exocytosis by
disrupting the ability of synaptophysin to interact with synaptobrevin and enhancing

29
synaptic vesicle release (165). But on the other hand, KO studies have shown that
synaptophysin is not essential for neurotransmitter release, suggesting that it may
play modulatory rather than fundamental roles at the nerve terminal (166).
Quantification of synaptophysin by western blot (WB), enzyme-linked immunosorbent
assay (ELISA) or by other approaches is a method that is often used for measuring
presynaptic integrity. Several papers have shown a reduction of synaptophysin in
frontal (141,167–169), parietal (167,170), occipital (170) and temporal cortex
(167,141) of AD individuals compared to controls. In some cases, this reduction can
precede cell loss and AD pathology (170). In addition, synaptophysin levels correlate
with cognition (170), although in other studies this correlation was not observed
(141).
Reduction in synaptophysin levels have also been observed in other dementias such
as vascular dementia, or mixed dementia (AD + vascular dementia) (168).
Interestingly, some studies have found that a decrease, an increase or no changes at
all of synaptophysin levels can be found in MCI patients compared to controls
(147,171,172). For example, in a previous analysis of the 90+ cohort, synaptophysin
levels in frontal cortex, measured by WB were significantly increased in MCI
individuals compared to AD patients but not compared to controls (147). Overall this
suggests that more data are necessary to better understand the role of synaptic
integrity at early stages of the disease and in the oldest old.
2.3.2. Synaptic vesicle glycoprotein 2 (SV2)
Synaptic vesicle glycoprotein 2 (SV2) is an integral membrane presynaptic protein
located in all synaptic vesicles (173). There are 3 isoforms: SV2A, SV2B and SV2C.
SV2A is the most widely expressed in the CNS and in endocrine cells (173,174).
SV2B is brain-specific, and SVC is a minor form in the brain. Interestingly, some
neurons express SV2A and SV2B, and both isoforms may be present on the same
synaptic vesicle (174).

30
The function of SV2 is not well known. SV2A KO mice seem normal at birth, but they
fail to grow, developing severe seizures by 1.5 weeks of age, and dying within 3
weeks of birth, suggesting neural and metabolic alterations (175). It has been
observed that neurotransmission is reduced in the absence of SV2A, without
changes in synapse or synaptic vesicle density or morphology suggesting that it may
have a modulatory role (175–177). SV2A binds synaptotagmin, a presynaptic protein
localized to synaptic vesicles, which is considered to act as a calcium sensor for
regulating calcium-dependent exocytosis of synaptic vesicles (178–180). Recent data
suggest that SV2 may regulate the expression and trafficking of synaptotagmin, and
consistent with this, a reduced calcium-mediated exocytosis is observed in neurons
lacking SV2 (181).
SV2 is associated with several neurologic conditions. For example, it is the binding
site for the antiepileptic drug levetiracetam (182). Another example is that SV2 has
been indentified as a protein receptor for Botulinum neurotoxin A. Mice lacking SV2
isoforms display reduced sensitivity to this toxin (183).
In dementia, SV2 has been found to be decreased in the temporal cortex of AD
patients (184); however, other studies failed to find this reduction in the
hippocampus, entorhinal cortex, caudate nucleus, and occipital cortex (185).
Reductions of SV2 levels have been also found in the dentate gyrus of the
hippocampus of APP/PSEN1 mice at 12 months (186). However, although
levetiracetam has been shown to reduce hippocampal hyperactivity and to improve
cognition in CIND individuals (187), it is not well known what happens with SV2
protein levels during the early stages of disease or in the oldest old, and more studies
are needed.
2.3.3. Vesicular glutamate transporeter (VGLUT1)
Glutamate is the major excitatory neurotransmitter in the CNS (188). Increased
amounts of extracellular glutamate can lead to cell death (189). Glutamate is an

31
amino acid that is also involved in cell metabolism. It is unable to diffuse through the
membranes, and is introduced into cells and different compartments by several
glutamate transporters. Once glutamate is released into the synaptic cleft, it is rapidly
taken up by astrocytes and converted into glutamine (190,191). Glutamine is
discharged from glial cells and enters neurons (192). In neurons, glutamine is
converted into glutamate and is stored in synaptic vesicles (193). VGLUT is a
presynaptic protein responsible for the transportation of glutamate into synaptic
vesicles (194,195). There are 3 isoforms in mammals (VGLUT1-3). VGLUT1 and
VGLUT2 are more abundant, and are considered specific markers of glutamatergic
neurons, but VGLUT3 is less abundant and often co-localizes with non-glutamatergic
markers in neurons (for review (196,197)).
Glutamate transporters have been investigated and associated with several
neurological diseases such as stroke, epilepsy or Huntington´s disease (198–200).
Specifically, VGLUT1 has been involved in several diseases such as schizophrenia
(201) or Parkinson disease (202).
In dementia and cognitive impairment, significant reduction in VGLUT1 in the frontal
cortex (Brodmann area 9) has been found in patients with vascular dementia, mixed
dementia and AD compared to patients with stroke but not dementia. In addition,
VGLUT1 levels in frontal and temporal cortex (Brodmann area 20) correlated with
cognitive tests, suggesting that the integrity of glutamatergic synapses might play an
important role in maintaining cognition after stroke (168).
In AD, reduced protein levels of VGLUT1 were found in the parietal, occipital and
frontal cortex of AD patients compared to controls, but not in the temporal cortex
(170,203,204). Messenger ribonucleic acid (mRNA) levels were also reduced in the
prefrontal cortex of AD patients (205). In the majority of studies, VGLUT1 correlated
with cognitive symptoms (203,204). Interestingly, a paradoxical increase of VGLUT1
immunoreactive boutons has been found in the midfrontal gyrus of MCI patients
(203). However is not well known what occurs in the oldest old.

32
3. Glycogen synthase kinase 3 (GSK-3) in Alzheimer´s disease pathology and cognitive impairment
3.1. Protein characteristics of GSK-3
GSK-3 is a serine/proline kinase initially identified for its ability to phosphorylate and
inactivate glycogen synthase (206).
There are two mammalian GSK-3 isoforms (GSK-3 and GSK-3each encoded by
distinct but closely related genes mapped to chromosomes 19q12.3 and 3q13.3,
respectively (207–209). Both isoenzymes are highly conserved, GSK-3 and GSK-3
share an overall 84% sequence identity, with 98% homology in the kinase domain
(207). The main difference between these two monomeric isoforms is in the N-
terminal region. GSK-3 contains an extended Glycine-rich region, and therefore is
bigger than GSK-3 (51KD and 46KD, respectively) (207). This high degree of
homology suggests similar substrate specificities, but multiple data have shown that
they also have different functions (210–212).
In addition to GSK-3 and GSK-3, a splicing variant of GSK-3 with a 13 amino acid
insert in an external loop near the catalytic domain was identified in 2002 and named
GSK-32 (213). Furthermore, both GSK-3 variants share substrates, but GSK-32
shows some differences such as lower phosphorylation rate or different
phosphorylation sites, at least in vitro (212,213).
It is important to note that GSK-3and GSK-3 are ubiquitously expressed in many
tissues, with particularly abundant levels in the CNS (207,213,214), while GSK-32
expression is more restricted to the CNS (213).
Within cells, GSK-3 is predominantly a cytosolic protein (215,216), although it is also
present in the nucleus (216) and mitochondria (217,218). In the CNS, GSK-3 is
present in neurons and astrocytes. Within neurons, GSK-3 is present in the cytosol
of the neuronal soma, dendrites, rough endoplasmic reticulum, free ribosomes and

33
mitochondria, while in astrocytes, GSK-3 is present in astrocytic processes and in
rough endoplasmic reticulum, free ribosomes and mitochondria (219).
GSK-3 is a relatively stable protein (220), with a high activity in resting and
unstimulated cells (206,221). Since GSK-3 can interact with numerous substrates (for
a review of comprehensive list of over 100 suggested targets see (222)), it requires a
complex control system to modulate its activity. Several regulatory mechanisms have
been described including: protein complex association (223), priming/substrate
specificity (224,225), subcellular localization (216,226), proteolytic cleavage
(227,228), and the most well-known, phosphorylation (for review, see (229)).
Phosphorylation of GSK-3 at serine-21 (p-S21-GSK-3, or GSK-3 at serine-9 (p-
S9-GSK-3) significantly decreases the availability of the active site to interact with a
substrate, and the activity of GSK-3 is reduced. Therefore, in some papers, p-S21-
GSK-3 and p-S9-GSK-3 are considered the inactive forms. Conversely, when the
phosphorylation is at tyrosine-279 of GSK-3(p-Y279-GSK-3 or at tyrosine-216 of
GSK-3 (p-Y216-GSK-3their activity increases (230–232).
GSK-3 is involved in many physiological processes like glucose metabolism (233–
236) and inflammation (237,238). In the central nervous system, GSK-3 has been
implicated in basic functions such as in axonal growth (239–241), synaptogenesis
(239,242), cell adhesion (243), cytoskeletal stability (244–247), plasticity (248–253),
vesicular transport (254) or energy metabolism (217).
In fact, GSK-3 has been investigated due to its possible role in several diseases such
as psychiatric disorders (255–257), neoplasms (258,259), hypoxic-ischemic disease
(260,261), metabolic diseases (262), and neurodegenerative diseases such as AD
(263–265).

34
3.2. Methods to reduce GSK-3 activity in mouse models
Over the years, different methods have been used to manipulate GSK-3 in animals
such as drug inhibitors, overexpression models, conventional knockouts, conditional
knockouts, etc. In this work, we wanted to study the role of GSK-3 and GSK-3 in
amyloid pathology and cognitive impairment in vivo. To do this, we aimed to reduce
GSK-3, GSK-3 and GSK-3 activity in a mouse model of AD. Next, I will review
different methods commonly used to reduce GSK-3 activity in mouse models.
3.2.1. GSK-3 inhibitors
The most common approach to reduce GSK-3 activity has been the use of inhibitory
drugs such as lithium. This approach has several advantages since it is rapid; the
investigator can decide when to initiate and the duration of treatment, and it is the
closest method to human clinical trials. However, it has a number of disadvantages
that can make it difficult to interpret results, with the main one being the lack of
specificity.
In general, drugs have off-target effects that can interfere with results. Moreover,
human kinases maintain a high degree of homology that can reduce the specificity of
GSK-3 inhibitors (ATP competitors) (266). To date, there are no isoform-specific
GSK-3 inhibitors. It is important to highlight this fact, because GSK-3 inhibitors are
often called “GSK-3" inhibitors in the literature (267), which is a term that is not
accurate and is due to the historically higher interest on the isoform over
therather than the real effect of the drug.

35
3.2.2. Conventional knockout
The classical method to study the effect of decreasing a protein in vivo is using the
KO approach. Mice without GSK-3 are viable and appear morphologically normal
(268). GSK-3 KO mice show some behavioral deficits such as decreased
exploratory activity, decreased immobility time, anti-aggression behavior, decreased
locomotion, increased sensitivity to environmental cues, decreased social motivation,
impaired sensorimotor gating, associative memory, and coordination (210).
However, disruption of the murine GSK-3 gene results in embryonic lethality caused
by severe liver degeneration during mid-gestation, around embryonic day 14(211).
Heterozygous KO mice are viable, appear morphologically normal, and have also
shown some behavioral deficits (269,270).
Since GSK-3 KO mice are not viable, several methods have been used to
selectively reduce GSK-3 and to try to compare both isoforms. Our group
generated two novel genetic approaches: short hairpin ribonucleic acid (shRNA), and
two different lines of conditional knockout (CKO) mice.
3.2.3. Short hairpin Ribonucleic acid (shRNA)
ShRNA is an artificial RNA molecule that can be used to silence gene expression via
the RNA interference pathway. ShRNA is delivered into mammalian cells through
infection with viral vectors, which allow stable integration of shRNA and long-term
knockdown (KD) of the targeted gene (271).
In several papers, this method has been used to successfully KD GSK-3 in vitro
(272). To the best of our knowledge, our group was the first to utilize this approach in
AD mouse models (273).

36
In parallel to the CKO work presented in this thesis, our group developed
recombinant adeno-associated virus 2/1 (rAAV2/1) shRNA constructs which
specifically reduced the expression and activity of GSK-3α (shRNA-α) or GSK-3β
(shRNA-). However, we failed to generate a construct that silenced both isoforms (
and ) equally. Constructs were injected intraventricularly in newborn mice. We
observed a wide distribution of rAAV2/1. It was predominant in hippocampal regions
CA1–CA3, the granular cell layer of the dentate gyrus, and with greater variability in
deeper cortical layers four through six along with cortical amygdalar regions. Overall,
cortical regions in close proximity to the lateral ventricles showed higher transduction.
We observed a mosaic pattern, where cells expressing rAAV2/1 also showed a lack
of Immunoreactivity to GSK-3 or GSK-3 if shRNA- or shRNA- was injected,
respectively. The KD persisted over 11 months. Immunoblot analyses showed that
GSK-3α protein levels were reduced by ∼58–72% in shRNA-α-injected mice
compared with shRNA-β-injected mice, and with controls (non-injected mice and
scramble shRNA (shRNA-scr)-injected mice), whereas GSK-3β protein levels were
reduced by ∼40–54% in shRNA-β-injected mice (Figure 3) (273).
Figure 3: Immunoblot analyses of hippocampal lysates probed with GSK-3 antibodies. ShRNA-α treatment significantly reduced GSK-3α expression without altering GSK-3β expression (F(3,12)=68.47, p<0.0001) and vice versa for shRNA-β treated mice (F(3,12)=29.05, p<0.0001). un: un-injected; scr: shRNA-scr injected mice; : shRNA- injected mice, : shRNA- injected mice; GAPDH: glyceraldehyde 3-phosphate dehydrogenase (Source: Hurtado et al (273)).
The advantages of this method were that it was isoform-specific, the KD lasted
through time, and it was relatively fast. However, shRNA also shows several

37
inconveniences. First, we observed variability, not only between mice, which we
solved by increasing the number of mice injected, but also between different shRNA
constructs injected. For example, rAAV2/1 with shRNA-construct spread more
widely than the shRNA-, and therefore we cannot be certain whether the differences
observed in our results were due to the specificity of targeted genes or it if was
simply due to a different degree of KD. Furthermore, introduction of shRNA into cells
and also in vivo, can generate several responses, such as activation of some
components of the immune system that can interfere with the reliability of the results;
therefore, confirmation using a different approach is recommended (for review
several aspects of shRNA approach go to (274))
3.2.4. Conditional transgenic mice
The conditional transgenic technology allows us to generate complex animal models
in which we can exert temporo-spatial control of the expression or deletion of a
particular gene (275). This ability to switch gene expression ON/OFF in restricted
tissues and at specific times allows us, among other things, to study certain genes
whose deletion in vivo is not feasible as in the case of GSK-3
3.2.4.1. Dominant negative transgenic mice
When we started our project, dominant negative GSK-3 conditional transgenic mice
were available. These mice expressed a mutated form of GSK-3K85R) that
generated a catalytically inactive form of GSK-3. K85R-GSK-3 inhibited GSK-3
function in a dominant-negative manner, possibly by non-productively sequestering in
vivo substrates or regulators of GSK-3 (276). In these mice K85R-GSK-3
expression was controlled by the Tet-Off system. In this system, the gene expression
was OFF in the presence of tetracycline, but in absence of treatment, a protein
named tetracycline transactivator was able to recognize a specific Deoxyribonucleic
38
Acid (DNA) sequence (TetO) and the expression of the K85R GSK-3 transgene was
ON. It is a very interesting model, since the process is reversible depending on the
presence/absence of tetracycline treatment.
In order to avoid developmental effects due to GSK-3 lack of function during
embryogenesis, tetracycline transactivator transgene was driven by the CAMKII
promoter. This promoter, as we will see below, is only expressed postnatally and is
restricted to the brain (277,278), which means that decreased activity of GSK-3 in
these mice can only be induced in the CNS after birth.
Despite the complexity of this model, for our objectives, it showed a major drawback:
the lack of isoform specificity. This dominant-negative GSK-3 mouse model showed
increased levels of p-S21-GSK-3, but more importantly it also showed increased
levels of p-S9-GSK-3, suggesting that the reduction of the activity affected both
isoforms (278,279).
3.2.4.2. Conditional knockout transgenic mice
There are different techniques to generate CKO mice. We used the CRE-LoxP
system derived from the P1 bacteriophage, which consists of two components: the
CRE recombinase and a loxP recognition site.(280)
The CRE recombinase stands for “Causes REcombination”. It is a protein that is able
to recognize a specific sequence of DNA, the loxP (Locus Of X(cross)-over in P1),
and catalyze a reciprocal crossover-event between two of these loxP regions. This
recombination can generate deletions (Figure 4), inversions, etc., depending on the
orientation of both loxP sites.
These components are part of the natural viral lifecycle of the bacteriophage, but
researchers have adapted this system and used it widely as a site-specific
recombinase technology in prokaryotic and eukaryotic cells.

39
Figure 4: Deletion generated through the CRE-LoxP system
To obtain CKO mice, we usually need to generate double-transgenic mice. First, two
loxP sequences with the proper orientation are inserted at specific sites of the DNA.
For example, in our case, we inserted loxP at intron 1 and intron 4 of our targeted
gene in a plasmid. Then, and usually after a laborious process of selection, a
heterozygous flox mouse was generated. Next, we needed to add CRE protein to
these mice. The most common way to do this is by crossing them with mice
expressing CRE. There are several CRE lines, and it is important to select the best
one to achieve our objectives. To do this, is important to look at the promoter driving
CRE expression, because it defines in what tissues CRE is expressed and at what
age. For example, Thy1-Cre mice express CRE specifically in neurons after birth, but
Nestin-Cre mice express CRE in the central and peripheral nervous system, kidney
and heart after embryonic day 11. Therefore, if the goal is to study the effects of the
deletion in the CNS in adulthood, it would be better to choose the first model, but if
the question is focused in the second half of pregnancy, the second model is better.
In addition, there are inducible CRE lines. Some lines express CRE-ERT2, a fusion
protein of CRE recombinase combined to a mutant form of the human estrogen
receptor. Under normal conditions the complex CRE-ERT2 remains attached and is

40
located in the cytoplasm. However, after exposure to 4-hydroxytamoxifen CRE is
liberated; it is able to move into the nuclear compartment, and cause loxP
recombination.
Inducible models are remarkable, because we can postpone a gene deletion until
later periods of life in mice, such as when AD pathology is well established. However,
on the other hand, some technical issues such as preparation, conservation and the
need for administration of tamoxifen may cause more variability.
3.3. GSK-3 in Alzheimer´s disease
Since the role of GSK-3 in AD as a tau kinase was first observed in 1992 by Ishiguro
et al. (281), several studies have suggested that GSK-3 activity is increased in AD
brains. For example, it has been shown that in AD brains, GSK-3 localizes in pre-
tangle neurons, NFT, and dystrophic neurites (282–287). Interestingly, similar results
have been observed in double APP/tau transgenic mice (288). Furthermore,
increased levels of GSK-3 expression measured either by microarrays in
hippocampus (289), or by WB in post-synaptosomal fractions (286) also has been
found.
A common approach to estimate GSK-3 activity in AD brains is by measuring GSK-3
phosphorylated forms. Increased levels of p-Y279-GSK-3and p-Y216-GSK-3the
“hyperactive” forms of GSK-3, but not of the inactive forms (p-S21-GSK-3p-S9-
GSK-3 have been found in hippocampus, entorrhinal, temporal and frontal cortex
(282,283). However, other studies failed to find this increase in GSK-3 activity in AD
brains (286), or even found data suggesting that it is reduced (287,290,291).
In peripheral blood, similar results have been found in white cells (292), and platelets
(293,294) of patients with AD and MCI compared to controls, although the
significance of these findings is still to be determined.

41
Furthermore, genetic associations between GSK-3 and AD have been recently found.
Different polymorphisms in the promoter (295,296), or in an intronic region (297) of
GSK-3have been reported. In addition, synergistic effects of GSK-3 with other
genes such as MAPT (296,298) or cdk5 (299) have been related to late-onset and
sporadic AD.
Furthermore, it has been proposed that PSEN1 indirectly inactivates GSK-3 and
GSK-3. Mutations or deletions in PSEN1 have shown to increase phosphorylation of
tau by interfering with the inactivation of GSK-3 (300,301). Overall, this suggests that
PSEN1 mutations, the most frequent known cause of familial AD, may have an
additional mechanism by which they contribute to AD pathology through increased
GSK-3 activity.
In summary, although there is no direct evidence of the increased activity of GSK-3 in
AD, there is sufficient data suggesting GSK-3 involvement in several steps of the
physiopathology of AD, such as tau phosphorylation and NFT formation, APP and
A, inflammation, and synaptic and neuronal dysfunction and loss (for review, see
(264,265,302–304)).
Next, I will review the roles of GSK-3 in Tau phosphorylation and NFT formation, and
in APP and PS formation, which is the aim of the second part of this dissertation.
3.3.1. GSK-3 and tau
In vitro studies have shown that both isoforms of GSK-3 ( and ) are able to
phosphorylate tau in several primed and non-primed PHF phosphoepitopes
(281,305–309). Conversely, treatment with GSK-3 inhibitors, such as lithium, reduces
tau phosphorylation in cells (309). Overall, this suggests that GSK-3 may have an
important role in NFT formation in vivo.

42
Consistent with this, different GSK-3 overexpression mouse models have shown
hyperphosphorylation of tau (310–315). When GSK-3 overexpression was
associated with human mutated tau overexpression, an exacerbation of NFT was
found (312). Similar results have been found in the Drosophila model of co-
expression of a constitutively active form of shaggy (the homologue form of GSK-3)
and human wild type (WT) tau (316,317). Furthermore, although not all (310,312), the
majority of these studies showed some degree of neuronal dysfunction or behavioral
deficits. Importantly, these deficits could be reversed after the normalization of GSK-
3 levels by silencing transgene expression (318), or by using GSK-3 inhibitors (317),
suggesting that they may be a good therapeutic strategy in tauopathies. Interestingly,
these deficits could be ameliorated by knocking out tau, which suggests that these
deleterious effects due to an increased activity of GSK-3 are at least, in part,
dependent on tau (319).
On the other hand, GSK-3 inhibitors have been shown to reduce tau pathology such
as tau phosphorylation (267,320–323), insoluble tau levels (321,324) or intracellular
inclusions (320) in tau mouse models of AD and other tauopathies. Furthermore, in
these models, GSK-3 inhibitors were also shown to improve associated deficits such
as cognitive and motor impairment (267,324), axonal degeneration (321) or neuronal
loss (267). Similar results have been found after knocking down selectively GSK-3
or GSK-3by different approaches in vivo(273,278,325,326). For example, as
explained previously, in parallel to the work of this dissertation, our group developed
AAV2/1 shRNA constructs which specifically reduced the expression and activity of
GSK-3 or GSK-3. These constructs were injected intraventricularly into newborn
double APP/tau transgenic mice. We observed that both GSk-3 and GSK-3 KD
reduced tau phosphorylation, conformational changes and NFT in this model (273)
(Figure 5).

43
Figure 5: GSK-3 and GSK-3 KD reduces tau phosphorylation and conformational changes in APP/tau double transgenic mice. APP/tau double transgenic neonates were un-injected (un) or injected with shRNA- shRNA-, or shRNA-scr (control) and evaluated at 11 months of age (n=15 per group). Representative immunohistochemistry images counterstained with hematoxylin show CA3 regions of posterior hippocampus stained with antibodies to total tau (T14), phospho-tau Ser202/Thr205 (AT8), phospho-tau Thr231 (AT180), phospho-tau Ser262 (12E8), or conformational specific antibodies Alz50, MC1, or thioflavin staining (ThS) as indicated. (Source: Hurtado et al (273)).

44
Unfortunately, despite all of these promising data, GSK-3 inhibitors have failed to
show any efficacy in clinical trials of tauopathies. For example, a recent phase 2 trial
with tideglusib (a GSK-3 inhibitor also known as NP12) failed to show any clinical
efficacy after 52 weeks of treatment in patients with mild-to-moderate Progressive
Supranuclear Palsy (n=146) (327); or after 26 weeks of treatment of AD patients
(n=306) (328).
In summary, there are enough data to demonstrate the role of GSK-3 in tau
phosphorylation and probably NFT formation. However, it is still unknown whether
GSK-3 inhibitors could be an effective treatment in patients with different tauopathies.
Additional studies are needed to further investigate this subject.
3.3.2. GSK-3 and APP.
As stated previously, GSK-3 has been proposed as a possible link between APP and
tau. In this line, several studies have shown that A may increase GSK-3 activity
(53,217,312,329–331). For example, in vitro, the administration of A oligomers to
primary rat hippocampal cultures reduced p-S9-GSK-3 levels with normal levels of
total GSK-3 suggesting an increase of GSK-3 activity (53). Similar results have
been found in vivo, when A oligomers were infused in mice (330). In both cases,
increased levels of phospho-tau were also found (53,330) Likewise, double APP/tau
transgenic mice have shown higher levels of p-Y279-GSK-3and p-Y216-GSK-
3with normal levels of total GSK-3 and GSK-3suggesting increased GSK-3
activity, associated with an aggravation of NFT pathology when compared to
parenteral single tau transgenic mice (312). These data suggest that Aoligomers
could hyperphosphorylate tau and induce tauopathy through GSK-3 activation.
Importantly, A can also induce other AD-related changes such as spine changes
(331), neuronal dysfunction (332) or neuronal loss (329,331). Interestingly, removing
tau has been shown to have a less protective effect than GSK-3 inhibition in some

45
studies (332), suggesting that GSK-3-mediated toxicity induced by A was only in
part dependent on tau, and that other downstream molecules might be involved.
On the other hand, several studies have suggested that GSK-3 is not only a
downstream element of A, but also upstream, and it may have some effect on A
production (267,272,325,332–337). For example, GSK-3 inhibitors are able to reduce
Alevels in several cell cultures (COS7, CHO-APP695, HEK293, NT2N, N2a and
primary neurons from tg2576 mice) (272,334,336,337). Furthermore, in vivo studies
have shown that acute treatment with lithium and valproic acid can reduce A levels
in PDAPP mice. Consistent with this, chronic treatment with different GSK-3 inhibitors
can reduce A levels after 3 weeks of treatment in 3 month-old Tg2576xPSEN1p264L
(272), after 1 month of treatment in 9 month-old tg2576 mice (337), or after 7 months
of treatment in 8 month-old homozygous PDAPP mice (336). Furthermore,
decreased levels of Apeptides have been found in double-transgenic mice
overexpressing mutant APP and a dominant-negative form of GSK-3 (325). ilarly,
inhibition of Shaggy either by expression of a dominant negative form in the adult
nervous system or by treatment with lithium reduces A42 levels in flies (332).
In addition, chronic treatment with GSK-3 inhibitors can also reduce the amyloid
burden in 15 month-old tg2576 mice after 3 months of treatment (267), and in 8
month-old homozygous PDAPP mice after 7 months of treatment (336).
However, the effects of lithium and other GSK-3 inhibitors on A production are
controversial. Several studies have failed to show any effect on reducing
Alevelsand even unexpected results have been found (323,338). For example, in
vitro, treatment with lithium increased A levels in rat cultured neurons (338).
Furthermore, chronic treatment with lithium for 4 weeks did not significantly reduce
Alevels, amyloid load, or working memory in 15 months-old APP/tau/PS1 triple
transgenic mice, despite being able to reduce tau phosphorylation (323). There are
several possible explanations which will be discussed later: and may also regulate
unintended targets, which may confound experimental results.

46
Previously, and in this line, Phiel et al., in collaboration with our lab, observed that
GSK-3 and GSK-3 may have different roles in APP processing and Aβ production
in vitro. In CHO-APP695 cells, the transfection of short interfering RNAs directed
against GSK-3 and GSK-3 reduced GSK-3 protein levels in an isoform-specific
manner. A selective reduction of GSK-3 protein expression decreased A-40 and
A-42 levels, while a selective reduction of GSK-3 protein expression resulted in a
modest increase of A-40 and A-42 levels. Furthermore, overexpression of GSK-3
in CHO-APP695 cells increased A-40 and A-42 levels in a dose-dependent manner,
suggesting that GSK-3but not GSK-3, may be the key isoform that regulates the
production of amyloid peptides (272).
However, other authors observed that GSK-3 inhibition by GSK-3antisense
oligonucleotides reduced A levels in cells (335,336), suggesting that the GSK-3
isoform, and not only GSK-3, may also have an important role in A production.
In this context, a few groups have tried to explore the effect of GSk-3 and GSK-3
in A in vivo. Our group decided to selectively reduce the expression of each isoform
by two different genetic approaches: 1) by CRE/loxP system in triple CKO mice,
which is described in this dissertation; and 2) as stated previously, by developing
recombinant AAV2/1b shRNA constructs which specifically reduced the expression
and activity of GSK-3 or GSK-3. These constructs were injected intraventricularly
in newborn single APP transgenic mice and in double APP/tau transgenic mice. Both
systems were conducted in parallel, but shRNA was faster. Consistent with Phiel et
al., we observed that GSk-3KD, but not GSK-3reduced A levels and amyloid
load in both of ours 11 month-old AD mouse models (273) (Figure 6).
However, Jaworski et al. failed to show any evidence of GSK-3-mediated control of
APP, not only for GSK-3but also for GSK-3and concluded that the GSK-3
isozymes do not contribute significantly to the processing of APP in mice brain in
vivo.(339).

47
Figure 6: GSK-3 but not GSK-3 KD decreases A levels and SP in APP and APP/tau transgenic mice. APP or APP/tau transgenic neonates were un-injected (un) or injected with shRNA- shRNA-, or shRNA-scr (scr) and evaluated at 11 months of age (n=15 per group). A) Representative immunohistochemistry images immunostained for A (Nab228) and counterstained with hematoxylin demonstrated a significant reduction in plaque load after GSK-3 KD in both APP and APP/tau transgenic mice (n=15 per group) Scale bar, 1mm. B) Hippocampal A load was quantified using ImageJ software (n = 7–12 per group). In both APP and APP/tau transgenic mice shRNA-treatment decreased A burden compared with untreated mice. C, D) Hippocampal regions of APP and APP/tau mice were analyzed for soluble and insoluble Ausing A sandwich ELISA (n= 5–8/group). A-40 and A-42 levels were reduced in soluble (RIPA) and insoluble (FA) fractions in both APP and APP/tau transgenic mice. Data are shown as mean + SEM. * p< 0.05, ** p< 0.01(Source: Hurtado et al (273)
Taken together, previous studies suggested that GSK-3 reduction may represent a
potential therapeutic target for AD. However, the effect of each isoform on A and
APP in vivo is unknown. In this dissertation, we aimed to study whether GSK-
3and/or GSK-3KO could ameliorate cognitive and behavioral deficits observed in
AD mice, and to review the effect of each of the isoforms in amyloid pathology.

48

49
II. HYPOTHESIS

50
1. Synaptic loss in the dentate gyrus of the hippocampus is an independent and early
event associated with cognitive impairment in the oldest old.
2. Reduction of GSK-3but not GSK-3 levels may ameliorate amyloid-related
pathology and cognitive impairment in AD mouse models.

51

52
III. OBJECTIVES

53
1. Contribution of synaptic markers to cognitive status and cognitive impairment in the oldest-old.
We aimed to:
a. study the correlation of synaptic markers with global cognitive scores and
cognitive group in the oldest old
b. study the correlation of frequent pathological changes in the oldest old with
global cognitive scores and cognitive group, and
c. estimate the independent contribution of both synaptic markers and
pathological changes to global cognitive scores in the oldest old
2. Contribution of GSK3 to AD pathology and cognitive impairment in an APP mouse model.
We aimed to:
a. study the effect of the selective reduction of GSK-3 or GSK-3isoforms in
cognitive and behavioral deficits in an APP mouse model of AD, and
b. study the effect of the selective reduction of GSK-3 or GSK-3isoforms in
amyloid load in an APP mouse model of AD
To achieve these objectives we aimed to:
c. generate GSK-3 and GSK-3double transgenic CKO mice,
d. generate GSK-3 triple transgenic CKO mice, and
e. generate GSK-3/APP and GSK-3/APP triple transgenic mice.

54

55
IV. METHODS AND RESULTS

56
STUDY 1: Contribution of synaptic markers to cognitive status and cognitive impairment in the oldest-old.

57
1.1. METHODS:
1. 1. 1. Study population:
Study participants were the first 157 individuals to come to autopsy from The 90+
Study, a longitudinal population-based study of ageing and dementia in people aged
90 and older who are survivors of the Leisure World Cohort Study (8). Briefly,
individuals live at home as well as in institutions, and represent the full spectrum of
health and cognitive abilities. All 90+ Study participants had evaluations every 6
months including a neurological examination by a trained physician or nurse
practitioner and a full neuropsychological battery that included the MMSE. Relevant
medical history, medication use, and demographic information were obtained from
the participants or their informants. Medical records, including brain imaging
evaluations were obtained from the participant’s physicians. Information about
cognitive (340) and functional abilities (341) were obtained from informants in
frequent contact with the participants. To inquire about the onset of cognitive
problems, the Dementia Questionnaire(342,343) interview was conducted over the
phone with informants of participants with evidence of cognitive impairment. Shortly
after death, the Dementia Questionnaire was done with the decedent’s informant to
inquire about the participant’s condition since the last evaluation. The Institutional
Review Board of the University of California, Irvine, approved all procedures and all
participants or their surrogates gave written informed consent.
1. 1. 2. Determination of Cognitive Status:
After a participant’s death, all available information was reviewed and discussed
during a multidisciplinary consensus diagnostic conference led by ‘The 90+ Study’
principal investigator (C.K.). Participants were classified as normal, CIND, or as
having dementia. Dementia diagnosis was established using Diagnostic and
Statistical Manual of Mental Disorders 4th Edition criteria (344). CIND is defined by
initial cognitive impairments such as deficits in episodic memory (345), executive
dysfunction (346), naming difficulties or other aphasias (347). Participants were

58
classified as CIND if they showed cognitive or functional deficits that were not severe
enough to meet criteria for dementia. All cognitive diagnoses were made blinded to
pathological evaluations.
1. 1. 3. Neuropathology
All autopsies were performed at the University of California, Irvine. After weighing the
whole brain and gross inspection, one hemisphere was dissected as previously
described (348). Six-micrometre thick, coronal sections of mid-frontal cortex superior
temporal cortex, anterior hippocampus, amygdala, substantia nigra and medulla
oblongata were cut. All histological staining, immunohistochemistry and microscopic
analyses were performed in the Centre for Neurodegenerative Disease Research at
the University of Pennsylvania as described (107). Briefly, sections were subjected to
immunohistochemistry using the avidin-biotin complex detection method
(VECTASTAINABC kit; Vector Laboratories) with ImmPACTTM diaminobenzidine
peroxidase substrate (VectorLaboratories) as the chromogen using monoclonal
antibodies to phosphorylated tau (mouse PHF1; 1:1K, gift of Dr Peter Davies,
Manhasset, NY), -amyloid (mouse NAB228; 1:15K; generated in Centre for
Neurodegenerative Disease Research), phosphorylated TDP-43 (rat 409/410; 1:500;
gift of Dr Manuela Neumann, Zurich, Switzerland), SV2 (mouse SV2; 1:20K; DSH
Iowa), synaptophysin (mouse MAB368; 1:1K; Millipore) and VGLUT1 (Guinea pig
VGLUT1; 1:7.5K; SYSY).
Topographical Braak staging (stages I–VI) was assigned from PHF1 stained slides
(n=157) (85). Thal phases were determined from NAB228 stained hippocampal
slides: phase 0–1, 2, 3 and 4 (n=150) (349). TDP-43 inclusions and neurites were
determined from 409/410 stained hippocampal slides: presence/absence.
The assessment of cerebrovascular disease pathology (n=108) and hippocampal
sclerosis (n=155) was determined from Harris haematoxylin and eosin stained mid-

59
frontal cortex, superior temporal cortex, hippocampus, amygdala, substantia nigra
and medulla sections. Hippocampal sclerosis was assessed as follows: 0 for no
gliosis or neuronal loss; 1+ for mild gliosis or neuronal loss in the CA1 or subiculum;
2+ for moderate or severe gliosis and neuronal loss consistent with definite
hippocampal sclerosis. Cerebrovascular lesions such as infarcts, micro-infarcts or
micro-bleeds along with cerebral amyloid angiopathy and HS were used to generate
CVD pathology scores following a simplified staging of Jellinger and Attems as
follows: 0 for cases without major infarcts, hippocampal sclerosis, cerebral amyloid
angiopathy or other lesions; 1+ for minimal vascular pathology cases with mild to
moderate cerebral amyloid angiopathy and/or 1–2 small lacunes; 2+ for moderate
vascular pathology cases with severe cerebral amyloid angiopathy and/or HS and/or
major infarcts (350).
1. 1. 4. Synaptic protein measures
Synaptic relative immunointensity ratios (RIRs) were obtained by the following
process. A preliminary study of synaptic and presynaptic proteins was done including
antibodies to synaptophysin, SV2, VGLUT1, synataxin 1, vesicle-associated
membrane protein 2 (VAMP2), synapsin 1, synaptotagmin 1, dynamin, vesicular
GABA transporfter (VGAT), post synaptic density protein 95 (PSD95) and Glutamate
receptor 1 (GLUR1); obvious outer molecular layer synaptic loss was observed on
slides obtained from patients with AD when stained with antibodies to synaptophysin,
SV2 and VGLUT1. For this study, hippocampal slides were stained for synaptophysin
(n=149), SV2 (n=151) or VGLUT1 (n=152). Sections were scanned (Nikon DS-Fi2
camera, gain 1.2, exposure 15ms) at 10 on a Nikon Eclipse TE2000 microscope
using NIS Elements software (Nikon Instruments, Inc.). ImageJ 1.47t (National
Institutes of Health) was used for analysis.Mean pixel intensities of the inner- and
outer molecular layer of the dentate gyrus just under CA1 were captured (Figure 7).
Raw values on an 8-bit scale (range of 45–185) were normalized to a blank area for
each slide (median value 41). Synaptic RIRs of the outer/inner molecular layer were

60
Figure 7: Representative images of synaptic protein immunoreactivity. Synaptic marker immunohistochemistry from two cases shows distinct staining of the inner molecular layer (highlighted in yellow) and the outer molecular (highlighted in purple) of the hippocampus. (A–C) The relatively healthy outer molecular layer: (A) synaptophysin, (B) SV2 and (C) VGLUT1 with synaptic ratios 1.19, 1.13 and 0.78, respectively (note that VGLUT1 is consistently lower than the other two). In contrast, (D–F) represents an individual with severely reduced outer molecular layer, whose inner molecular layer is preserved: (D) synaptophysin, (E) SV2 and (F) VGLUT1 with synaptic ratios 0.53, 0.74 and 0.56, respectively.

61
calculated from (outer molecular layer - blank) / (inner molecular layer - blank) for
each case. To verify the repeatability of our measurements, 10 random cases were
stained twice by the synaptic antibodies and synaptic RIRs were obtained
independently by two researchers (L.M.P., J.L.R.). A K of 0.987 was obtained (Type
C intraclass correlation coefficient).
All pathological diagnoses were done blinded to clinical diagnosis.
1. 1. 5. Statistical analysis
We compared characteristics of the three cognitive groups: normal, CIND and
dementia using Chi-squared test for categorical variables and ANOVA for continuous
variables. We used multinomial logistic regression models to determine the
association between each individual neuropathological or synaptic protein measure
and cognitive diagnosis. We report the odds of being in the CIND group compared to
the normal group, the odds of being in the dementia group compared to the CIND
group, and the odds of being in the dementia group compared to the normal group.
Neuropathological and synaptic protein measures were analysed as continuous
variables in the logistic regression analyses. Separate regression models were used
for each neuropathological and synaptic protein measure.We also explored the
association between the individual neuropathological or synaptic measures and the
MMSE, a measure of global cognition, using multiple linear regression analyses.
Finally, we analysed the relative contribution of the different pathological measures to
global cognitive scores, by including all synaptic and pathological measures in a
multiple regression model. All regression models were adjusted for age at death and
gender and all analyses were performed using SAS version 9.3 (SAS Institute Inc.).

62
1.2. RESULTS:
1. 2. 1. Subject characteristics
Of the 157 participants of this study, 36 had normal cognition, 37 were diagnosed
with CIND and the majority (n=84) had dementia (Table 2). The most frequent clinical
diagnosis of the participants with dementia was AD alone (65%) or in combination
with other dementias (21%) followed by vascular dementia (7%) and dementia with
Lewy bodies (6%). Participants had an average age at death of 98 years (range: 94–
101 years), were mostly female (71%), and highly educated (71% had at least a
college education). MMSE scores were available for the majority of individuals within
1 year before death (Table 2). The overall frequency of the APOE alleles was 14%
for the 2 allele and 22% for the 4 allele. While there was an increase in the
frequency of the 4 allele in the dementia group (27%) compared to the normal group
(21%), this non-significant increase is consistent with previous work where we found
that the 4 allele no longer plays a role in dementia and mortality at very old ages
(351). Brain weight was non-significantly lower in the dementia group.
1. 2. 2. Alzheimer’s disease pathology
AD pathology was measured using Braak and Braak staging (85) and Thal phases
(349). In the normal group, Braak stage (median III; mean 3.3) and Thal phase
(median 1; mean 1.9) scores indicate that AD pathology was present in at least mild
to moderate amounts (Figure 8). The CIND group presented with similar Braak stage
(median III; mean 3.4) and Thal phase (median 3; mean 2.3) scores, while Braak
stage (median V; mean 4.3) and Thal phase (median 3; mean 2.6) were more
moderate to severe in the dementia group. Higher Braak stages were significantly
associated with higher odds of being in the dementia ve rsus normal group [odds
ratio (OR) =1.68, P=0.001] and of being in the dementia versus CIND group (OR =
1.52, P=0.02) (Table 3). Higher Thal phases were associated with higher odds of

63
being in the dementia versus the normal group (OR =1.64, P=0.011) but did not
distinguish between the dementia and CIND groups (P>0.15).
Table 2: Characteristics of The 90+ Study participants. a Excludes four participants with missing MMSE score. b Excludes five participants with unknown ApoE allele status.c Excludes one participant with unknown degree of education. d Includes impairment in domains other than memory or executive function. e Includes mixed Alzheimer’s disease/vascular dementia, Alzheimer’s disease/other and Alzheimer’s disease with dementia with Lewy bodies.
Neither AD marker distinguished between the normal and CIND groups. Higher levels
of AD plaque and tangle burdens were significantly associated with lower MMSE
scores (Thal phase, P=0.02; Braak stage, P<0.001). The greatest decreases on the
cognitive tests occurred with the highest plaque and tangle burdens. The mean
MMSE score was significantly lower in Thal phase 4 compared to Thal phases 2 and

64
Figure 8: Thal phase and Braak stage measures by cognitive group in the oldest-old. Thal phase stage scores were increased in Demented compared to normal, Braak stage score was significantly different in demented compared to CIND and Normal ( * <0.05; *** <0.001 p-values from multinomial logistic regression after adjusting for age at death and gender).
earlier (P<0.01) and even to Thal phase 3 (P<0.05). For Braak stage, the mean
MMSE score was significantly lower in stage VI compared to all the other Braak
stages (P<0.001), and in stage V compared to stages III and IV (P<0.05).
1. 2 .3. Hippocampal sclerosis
As the prevalence of HS increases with age, we investigated what proportion of
individuals had these lesions in our cohort. HS was found in 15% of all individuals,
but in only one individual without dementia. The presence of HS in 28% of those with
dementia (23/82) allowed the measure to significantly distinguish the dementia group
from both the normal (P=0.003) and CIND (P=0.002) groups (Table 3).
1. 2. 4. Cerebrovascular disease
As the prevalence of CVD pathology increases with age, we investigated what
proportion of individuals had these lesions in our cohort. Cerebrovascular lesions and
cerebral amyloid angiopathy were present in modest amounts in The 90+ Study.
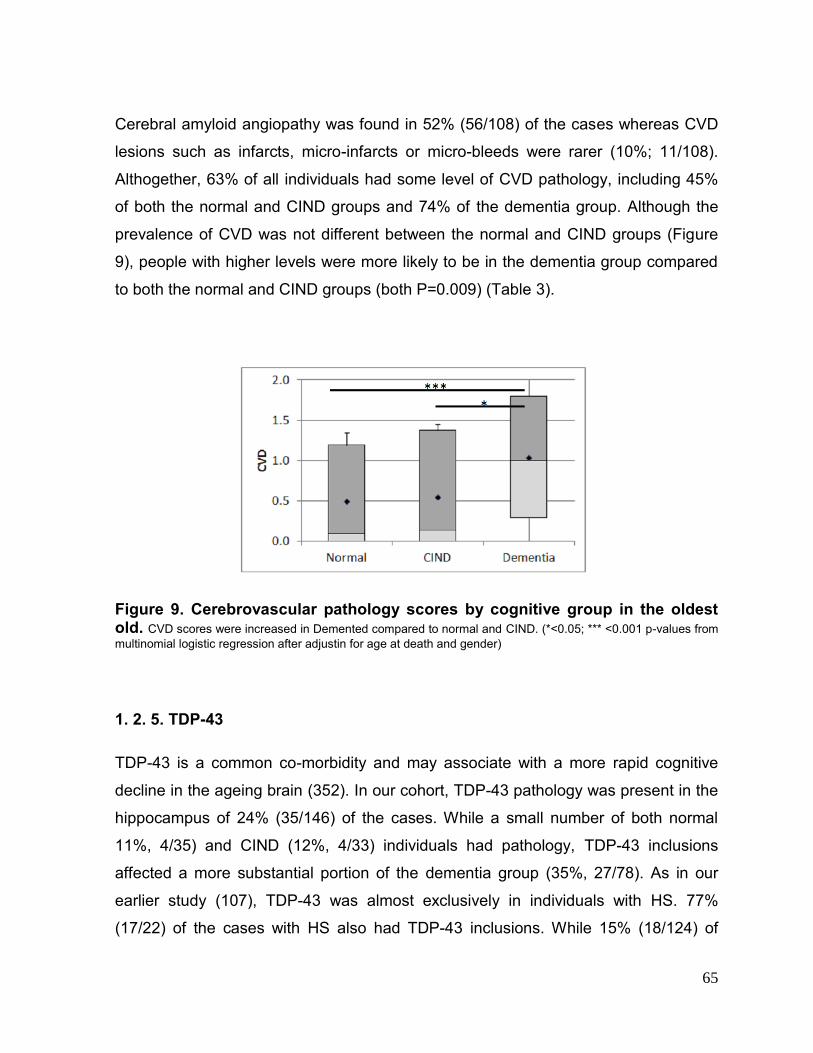
65
Cerebral amyloid angiopathy was found in 52% (56/108) of the cases whereas CVD
lesions such as infarcts, micro-infarcts or micro-bleeds were rarer (10%; 11/108).
Althogether, 63% of all individuals had some level of CVD pathology, including 45%
of both the normal and CIND groups and 74% of the dementia group. Although the
prevalence of CVD was not different between the normal and CIND groups (Figure
9), people with higher levels were more likely to be in the dementia group compared
to both the normal and CIND groups (both P=0.009) (Table 3).
Figure 9. Cerebrovascular pathology scores by cognitive group in the oldest old. CVD scores were increased in Demented compared to normal and CIND. (*<0.05; *** <0.001 p-values from multinomial logistic regression after adjustin for age at death and gender)
1. 2. 5. TDP-43
TDP-43 is a common co-morbidity and may associate with a more rapid cognitive
decline in the ageing brain (352). In our cohort, TDP-43 pathology was present in the
hippocampus of 24% (35/146) of the cases. While a small number of both normal
11%, 4/35) and CIND (12%, 4/33) individuals had pathology, TDP-43 inclusions
affected a more substantial portion of the dementia group (35%, 27/78). As in our
earlier study (107), TDP-43 was almost exclusively in individuals with HS. 77%
(17/22) of the cases with HS also had TDP-43 inclusions. While 15% (18/124) of

66
individuals without HS also had TDP-43 pathology, the numbers were too low to
analyse the significance of the TDP-43 pathology after controlling for HS (data not
shown).
1. 2. 6. Synaptic markers
As described above, to measure the synaptic levels of the perforant pathway,
synaptic RIRs were generated by measuring the intensity of synaptophysin, SV2, and
VGLUT1 by immunohistochemistry in the outer molecular layer of the hippocampus
relative to the inner molecular layer. Higher RIRs represent a relatively healthy outer
layer in relation to the inner layer, whereas lower RIRs correspond to synaptic loss in
the outer layer (Figure 10). In the normal group, synaptophysin (mean 0.94) and SV2
(mean 0.94) had RIRs close to 1.00, whereas the glutamate-specific VGLUT1 RIR
was lower (mean 0.67). Similar values were obtained in the CIND group:
synaptophysin (mean 0.98), SV2 (mean 0.96) and VGLUT1 (mean 0.64). In the
dementia group, these values were mildly lower: synaptophysin (mean 0.87), SV2
(mean 0.89) and VGLUT1 (mean 0.63).
Figure 10: Synaptic ratios measures by cognitive group in the oldest old. All three synaptic RIRs were reduced in dementia compared to normal with (A) synaptophysin and (B) SV2 were significantly different between the three cognitive groups; however, (C) VGLUT1 did not distinguish between CIND and dementia. No synaptic RIR distinguished normal from CIND. (*<0.05; *** <0.001 p-values from multinomial logistic regression after adjustin for age at death and gender)

67
All three synaptic RIRs distinguished between the dementia and normal groups with
higher RIRs associated with lower odds of being in the dementia group (P<0.05)
(Table 3). The synaptophysin and SV2 RIRs also distinguished between the
dementia and CIND groups (synaptophysin, P<0.001; SV2, P=0.008), whereas the
VGLUT1 RIR did not (P=0.747). No RIR distinguished between the CIND and normal
groups (all P>0.12). We also examined the association between synaptic RIRs and
global cognitive scores and found that for all three synaptic markers, higher RIR
values were significantly associated with higher MMSE scores (synaptophysin,
P<0.001; SV2, P<0.001, VGLUT1, P<0.05).
Table 3: Association between markers and cognitive groups in the oldest old. Odds ratios and 95% CIs were generated from multinomial logistic regression models where the dependent (outcome) variable was cognitive group (normal, CIND, or dementia) and the independent variables were the neuropathological markers as continuous variables, except TDP-43 which was a binary variable. P-values 50.05 are in bold. Age at death and gender were included as covariates and each neuropathological measure was analysed in a separate model. The overall P-value corresponds to the type 3 analyses and tests whether the neuropathological marker (independent variable) is significantly associated with the cognitive group (outcome variable). Odds ratios are per unit. n for each group =149 (synaptophysin), 151 (SV2), 152 (VGLUT1), 157 (Braak stage), 150 (Thal phase), 155 (HS), 108 (cerebrovascular disease) and 146 (TDP-43).

68
1. 2. 7. Multiple pathologies
Pearson correlation coefficients showed significant correlations between the three
synaptic RIRs (VGLUT1 and SV2, corr =0.37, P<0.001; VGLUT1 and synaptophysin,
corr =0.45, P<0.001; SV2 and synaptophysin, corr =0.50, P<0.001). Given the
correlation between synaptic markers, we wanted to explore the independent
contribution of each with respect to global cognitive scores. In a multiple regression
model that included all three synaptic markers, we found that higher RIRs for both
synaptophysin (beta =20.3, P=0.002) and SV2 (beta =13.4, P=0.03) remained
significantly associated with better MMSE scores.
Post hoc analysis revealed that the SV2 RIR was significantly lower at Braak stage VI
(P<0.001) and the VGLUT1 RIR was significantly lower in individuals with HS
(P=0.024). To estimate the independent contribution of all the different measures to
global cognitive scores, we included all three synaptic RIRs, the AD pathology
scores, and HS in a multiple regression analysis. In this model, the synaptophysin
ratio, Braak stage, TDP-43 and HS all remained significantly associated with MMSE
scores (P-values:<0.05, 0.001, <0.01 and 0.001, respectively).
1. 2. 8. Memory impairment only subjects
The primary impairment in 13 of the CIND individuals was memory (Table 2). As
those with executive impairment may have dysfunction related more to a
frontotemporal lobar degeneration rather than Alzheimer’s disease and those with
‘other’ impairment cannot be well defined, it’s possible that the 13 with memory
impairment are more likely to be on the continuum between normal cognition and
Alzheimer’s disease. To test this hypothesis, we compared the RIRs and our
pathological markers in the ‘memory impairment only’ CIND subjects to the normal
and dementia subjects to see if our results had more significance. No new
associations were found (data not shown), except for VGLUT1 RIR that almost

69
distinguished between memory impairment only CINDR subjects and normal groups
(p=0.05), suggesting that a reduction of the Vglut1 may be an early event in memory
impairment only CIND group. Similar subgroup analysis with the executive
impairment and ‘other’ impairment CIND individuals also did not reveal any new
associations that the comparisons with the group as a whole hadn’t already shown
(data not shown).

70

71
STUDY 2: Contribution of GSK-3 in Alzheimer´s disease pathology and cognitive impairment in an APP mouse model.

72
2. 1. METHODS:
2. 1. 1. Generation of conditional knockout transgenic mice
Because GSK-3KO in mice is lethal, GSK-3CKO and GSK-3CKO mice were
generated using the CRE-loxP system.
2. 1. 1. 1. Generation of heterozygous GSK-3 floxed mice by Taconic.
Heterozygous GSK-3 floxed mice (the GSK-3flox/- line, and the GSK-3flox/- line) were
generated through a contract with Taconic.
For the GSK-3flox/- line, the targeting vector based on a 9.9 kb genomic fragment of
the GSK-3 gene encompassing exons 1–11 and surrounding sequences was
obtained from the C57BL/6J RP23 Bacterial Artificial Chromosomes Library and was
modified by inserting a loxP site and an FRT-flanked neomycin resistance gene in
intron 1 and a loxP site in intron 4, as well as a ZsGreen cassette at its 3´ end (Figure
11).
Figure 11: GSK-3 targeted gene after homologous recombination of GSK-3 wt allelele and the targeting vector.

73
Thirty micrograms of linearized DNA vector were electroporated using a Bio-
RadGene Pulser at 240 V and 500 F into 1 x 10⁷ cells of the C57BL/6N embryonic
stem cell lines. Only nonfluorescent clones suggesting the absence of the ZsGreen
region were selected on day eight. After expansion and freezing clones in nitrogen,
176 clones were analyzed by using 5´,3´, and neomycin probes after digestion by
KpnI, EcoRI, AflIII, PflFI, and BglII restriction enzymes in standard Southern blotting
techniques. Proper homologous recombination was identified in four of the clones (B-
A6, B-C3, B-C9 and B-G11) (Figure 12), and clone B-C9 was used for blastocyst
injection.
Figure 12: Identification of proper homologous recombination by Southern blotting. 176 clones were analyzed by using 5´ end (A), 3´ end (B), and neomycin probes (C) after digestion by AflIII (A, C), KpnI (B), PflFI, and BglII restriction enzymes in standard Southern blotting techniques.

74
Ten to fifteen targeted C57BL/6N.tac embryonic stem cells were microinjected into
each blastocyst obtained after superovulation of BALB/c females and eight injected
blastocysts were transferred to each uterine horn of a 2.5 days postcoitum,
pseudopregnant Naval Medical Research Institute female mouse. Highly chimeric
mice were bred to female C57BL/6 mice with Flp-Deleter recombinase gene to
remove the Neo selection marker (Figure 13). Germline transmission was identified
by the presence of black C57BL/6 offspring.
The same protocol was used to generate the GSK-3 flox/- line.
Figure 13: Gene structure of the GSK-3 CKO allele after FLP mediated deletion
2. 1. 1. 2. CRE lines
To introduce the CRE protein in the system, GSK-3 floxed mice were mated with two
different lines of mice that expressed CRE: CAMKII-CRE and UBC-CRE-ERT2
lines.
CAMKII-CRE lines
CAMKII-CRE mice were described by Tsien et al. (353) In these mice, CRE
expression is driven by the calcium/calmodulin-dependent protein kinase II
(CAMKII) promoter, which is restricted to the brain and has been shown to be silent
until several days after birth when the nervous system is still developing (277).
Consistently, CRE-LoxP recombination is restricted to cells in the forebrain and

75
occurs during the third postnatal week (353). The CAMKII-CRE line is very
interesting in the study of AD for two reasons: first, because its expression is
specifically in the brain, especially in the cortex and hippocampus, which are targeted
regions in AD; and second, since the KO occurs at the third postnatal week, we can
avoid most of the developmental effects of the gene deletion, and are thus able to
have a more accurate analysis of its effect in adulthood.
UBC-CRE-ERT2 lines
These mice were described by Ruzankina et al. (354) The CRE-ERT2 is a fusion
protein of Cre recombinase fused to a triple mutant form of the human estrogen
receptor. Its expression is driven by the Human Ubiquitin C (UBC) promoter and
therefore present in all tissues (355). At physiological concentration, this mutant form
of the estrogen receptor is unable to bind to its natural ligand, so under normal
conditions, CRE-ERT2 remains in the cytoplasm and there is no any effect of CRE.
However, after exposure to 4-hydroxytamoxifen, CRE is liberated and is able to go
into the nuclear compartment. If this line is bred with a line of mice containing a loxP
flanking sequence, such as our GSK-3 floxed lines, tamoxifen induction will result in
deletion of the flanking sequences in widespread tissues generating KO mice. With
this system, we can decide at what age we want to induce the KO, but once the
established, it is irreversible.
2. 1. 1. 3. PDAPP mice:
PDAPP mice were described by Games et al. (356) These mice overexpress the
human APP minigene harboring the Indiana mutation (V717F) driven by the Platelet-
Derived Growth Factor promoter, and are therefore labeled PDAPP. PDAPP mice
recapitulate several of the features of AD such as increased A levels in the brain,
neuritic plaques surrounded by astrocytes and glia, dystrophic neurites (356),

76
hyperphosphorylated tau (357), synaptic loss (356), and age-dependent behavioral
deficits such as spatial memory in the water maze (358) and hyperactivity in the open
field test (359). In general, these findings seem to be dependent on the dosage of the
mutant APP allele, as they appear earlier or are more severe in homozygous mice
than in heterozygous mice (360). Other not age related deficits present in these mice
(such as significant size reduction in the hippocampus or deficits in working memory)
are thought to be related to aberrant neurodevelopment due to the mutant APP
(360).
The aim of this dissertation is to analyze the effect of knocking out GSK-3 and GSK-
3 in heterozygous PDAPP mice.
2. 1. 1. 4. Breeding schemes:
GENERATION OF TRIPLE TRANSGENIC GSK-3CKO;PDAPP AND GSK-
3CKO;PDAPP MICE
Triple transgenic mice were generated by crossing GSK-3flox/- mice with
heterozygous CAMKIIα-CRE mice (353) and homozygous PDAPP mice.(356) Four
crosses resulted in the targeted triple transgenic mouse: GSK-3flox/flox;CAMKIIα-
CRE+/-;PDAPP+/- (GSK-3cko;PDAPP). Line expansion was accomplished by
mating GSK-3cko;PDAPP mice with GSK-3flox/flox mice. This cross generated four
genotypes of mice: GSK-3flox/flox;CaMKIIα-cre-/-;PDAPP-/- (GSK-3 wt), GSK-
3flox/flox;CaMKIIα-cre+/- PDAPP-/- (GSK-3 cko), GSK-3flox/flox;CaMKIIα-cre-/-
;PDAPP+/- (GSK-3 wt;PDAPP), and GSK-3flox/flox;CaMKIIα-cre+/-;PDAPP+/- (GSK-
3cko;PDAPP). Each of the four groups consisted of n=10-15 mice that were
analyzed at 17 months of age (Figure 14).

77
We used the same scheme to breed GSK-3cko;PDAPP mice, but after the first
generation of GSK-3cko;PDAPP mice, they were unable to breed and we were not
able to expand and maintain the line.
Figure 14: Triple transgenic breeding scheme. Our founders were a heterozygous GSK-3flox/- floxed mouse (one read ear), a homozygous PDAPP+/+ mouse (white body) and the heterozygous CAMKII-CRE+/- line (yellow nose). Before GSK.3 flox animals arrived, CAMKIIα-CRE+/-;PDAPP+/+ mice were generated. Then, breedings were done in parallel. Homozygous GSK-3flox/flox mice (two read ears) were generated and used to mantain the line. Simultaneosly, GSK-3flox/-;CAMKIIα-cre+/-;PDAPP+/- was generated by crossing CAMKIIα-cre+/-;PDAPP+/+ with GSK-3flox/-. Next, GSK-3flox/-;CAMKIIα-cre+/-;PDAPP+/- was crossed with GSK-3flox/flox, and the desired genotype, GSK-3flox/flox;CAMKIIα-cre+/-;PDAPP+/- was obtained. Finally, we expanded the line by crossing it with GSK-3flox/flox. The last breeding generated the target mouse and all of the controls nedeed. Black rectangles highlight the targeted genotype used as a breeder at the next breeding. Red rectangle: target mouse. Half white body: heterozygous PDAPP+/- mouse

78
GENERATION OF TRIPLE TRANSGENIC GSK3 CKO MICE
Triple transgenic mice were generated by crossing the GSK-3flox/flox mice with GSK-
3flox/flox and UBC-CRE-ERT2 lines.(354) Eight crosses resulted in triple transgenic
GSK-3flox/flox; GSK-3flox/flox;UBC-CRE-ert2 +/- mice.
Concurrently, double transgenic mice were generated by crossing the GSK-3flox/flox-
mice with GSK-3flox/flox. Two crosses resulted in double transgenic GSK-3flox/flox;
GSK-3flox/flox mice.
Subsequently, GSK-3flox/flox; GSK-3flox/flox;UBC-CRE-ERT2 +/- were mated with GSK-
3flox/flox;GSK-3flox/flox mice, generating two genotypes: GSK-3flox/flox;GSK-3flox/flox
;UBC-CRE.ert2+/- (UBC-GSK-3 CKO) and their control littermates GSK-3flox/flox;
GSK-3flox/flox (UBC-GSK-3 wt).
GENERATION OF DOUBLE TRANSGENIC GSK-3 CKO AND GSK-3CKO MICE
During the development of our triple transgenic mice, we generated several cohorts
of mice that we used to generate preliminary data to test the effectiveness,
reproducibility and distribution of the KO.
We generated two UBC-CRE-ERT2 lines: the alpha line, GSK-3flox/flox;UBC-CRE-
ERT2+/- (UBC-GSK-3 CKO), with GSK-3flox/flox;UBC-CRE-ERT2-/- (UBC-GSK-3
WT) mice as controls, and the beta line, GSK-3flox/flox;UBC-CRE-ERT2+/- (UBC-GSK-
3 CKO), with GSK-3flox/flox;UBC-CRE-ERT2-/- (UBC-GSK-3 wt) mice as controls.
Similarly, we generated two CAMKII-CRE lines: the alpha line, GSK-3flox/flox;
CAMKII-CRE+/- (GSK-3 cko), and GSK-3flox/flox;CAMKII-CRE-/- (GSK-3 wt) mice
as controls. And the beta line: GSK-3flox/flox;CAMKII-CRE+/- (GSK-3 cko) and their
littermates GSK-3flox/flox;CAMKII-CRE-/- (GSK-3 wt) mice as controls.

79
2. 1. 1. 5. Tamoxifen induction in CRE-ERT2 lines
To recombine the GSK-3 floxed alleles using the CRE-ERT2 system, we tried two
different methods to deliver tamoxifen into the mice: by adding tamoxifen (500
mg/Kg) to a chow diet chow ad libitum for 7 to 30 days, or by oral gavage or
intraperitoneal injection. As previously described, tamoxifen was solubilized at
20mg/ml in a mixture of 98% corn oil and 2% ethanol, and administered at 0.5mM/g
body weight, once per day for 5 days (354).
Several cohorts of mice were generated and analyzed at seven days, one month and
three months post-induction.
2. 1. 2. Histology and brain preparation
As previously described (361), mice were anesthetized and transcardially perfused
with phosphate buffered saline, pH 7.0 in accordance with protocols approved by the
Institutional Animal Care and Use Committee of the University of Pennsylvania.
Brains were surgically removed and the right hemisphere was fixed in 4% neutral
buffered formalin, while the left hemisphere was dissected into various brain regions
and frozen at -80°C for biochemical analysis. To maintain consistency of dissection
and to facilitate analysis, brains were coronally sliced starting with an initial cut
parallel to the olfactory tract as it bends towards the medial eminence. Bisection at
this point generated anterior and posterior cortical regions, which were fixed in
neutral buffered formalin and paraffin embedded. Paraffin blocks were sectioned
exhaustively to a thickness of 6 m. Tissue sections were stained using a Polymer
horseradish peroxidase detection system (Biogenex).
2. 1. 2. 1. Antibodies Used in Histology
GSK-3 expression was monitored using GSK-3 rabbit polyclonal antibody (9338)

80
and GSK-3rabbit mouse monoclonal antibody (mAb) (27C10) (Cell Signaling
Technology). To track the distribution of Aplaques, we used mouse mAb Nab228,
which binds to amino acids 1-11 in A peptides (362).
2. 1. 2. 2. Immunohistochemical quantification
A deposits were quantified by a researcher blinded to experimental condition as
previously described (363). Images from immunolabelled sections were captured and
digitized using a video capture system (Nikon camera coupled to an Olympus DP71
upright microscope). Using NIH ImageJ software, the areas of interest were drawn
freehand (i.e. CA1). Afterwards, digital grayscale images were converted into binary
positive/negative data using a constant threshold limit. The percentage of positive
pixels (i.e., immunoreactivity area) was quantified for each image to generate
immunoreactivity “load” values (i.e., percentage area occupied by the
immunoreactivity product). For Aβ deposit quantification, images of Nab228-stained
sections of the hippocampus (Bregma -1.95) were measured.
2. 1. 3. Western blots
To measure soluble proteins, hippocampi and cortex were homogenized in
radioimmunoprecipitation assay (RIPA) buffer in the presence of protease inhibitors
and briefly sonicated. Samples were centrifuged at 100,000 g for 30 min at 4 °C, and
protein concentration was measured by bicinchoninic acid assay. Samples were
electrophoresed on 10% Tris-glycine acrylamide gels and transferred to a
nitrocellulose or Polyvinylidene fluoride membrane. Immunoblots were probed with
the following antibodies: GSK-3β mouse mAb (Calbiochem), and GAPDH mouse
mAb (Advanced Immunochemical) as a loading control. Immunoblots were then
exposed to species-specific horseradish peroxidase-conjugated anti-IgG antibodies
(Santa Cruz Biotechnology) and visualized by enhanced chemiluminescence

81
(PerkinElmer) using a Fuji Imager. Images were quantified using Multi Gauge version
3.2 FujiFilm software.
2. 1. 4. Behavioral analysis
The effect of GSK-3 KO on age related deficits described in heterogyzous PDAPP
mice were tested by the open field test (activity) and the Barnes maze (hippocampal-
dependent spatial memory).
2. 1. 4. 1. Open field test:
To assess general activity, locomotion, and anxiety, mice were tested in the open
field. This test is based on conflicting innate tendencies in mice to explore a novel
environment and to avoid bright and open spaces that resemble dangerous
situations, such as predator risk. The test was performed and adapted from
previously described (364,365): the apparatus was a square arena (52 x 52 x 40 cm)
with black Plexiglas walls and white floor that was evenly illuminated. Mice were
individually placed in the center and allowed to explore freely for 13 min while the trial
was videotaped (Figure 15A-B). Subsequent video scoring was completed by an
observer blind to treatment groups using the SMARTv25 video tracking software
(Panlab, SL). Total distance moved was automatically calculated by the tracking
software as a direct measure of locomotion and activity (Figure 15C).
2. 1. 4. 2. Barnes maze:
Mice were tested for hippocampal-dependent spatial learning and memory in the
Barnes maze (San Diego Instruments) The Barnes maze consists of a circular table
with 20 circular holes around the circumference of the table. Under each hole is a slot

82
Figure 15: Open field test. (A). Open field apparatus scheme: square arena (52x 52 x 40 cm) with black Plexiglas walls and white floor. Web-camera connected to a computer registered all activity from the top. (B) Image from the top. (C) Data analysis using SMARTv25 (Panlab, SL)
for a box. There are 19 small boxes and a larger one (the goal box) in which to hide.
Individually, mice are exposed on the surface of the table which is evenly illuminated.
As mentioned before, mice try to avoid bright and open spaces, and the goal of the
maze is to reach the goal box where they can escape. Fixed visual cues around the
platform serve to orient mice to find the goal box. Mice that are unable to find it after
2.5 min of exposure are gently guided to the goal box (Figure 16).
As described previously in our laboratory (366), mice were tested over six days. On
training days 1-3, mice were exposed to the Barnes maze for three 2.5 min trials, 15
min apart. On testing days 4-6, they were exposed to two 2.5 min trials. On all six
days, only the last two trials were scored. Mice were tested on their ability to learn

83
and remember a fixed position of an escape compartment, and their performance
was scored for strategy and latency in finding the escape compartment. Strategies
were defined as follows: a) spatial (mouse navigates directly to the escape hole with
both first intent deviation and total errors < or =3), b) serial (mouse systematically
searches for consecutive holes with no center crosses), and c) random (no strategy
at all) as previously described (367).
Figure 16: Barnes maze apparatus and paradigm.
2. 1. 5. Statistical analysis
The majority of data analysis was completed using one-way ANOVA followed by
Bonferroni´s post-hoc test. Barnes maze search strategy was analyzed using a Chi-

84
Squared test, and latency with a two-way ANOVA. Life span studies were analyzed
using the Kaplan-Meier survival curve.
2. 2. RESULTS:
2. 2. 1. GSK-3 expression in GSK-3 CKO mice and in GSK-3 CKO mice
CAMKII-CRE lines
Immunohistochemical studies showed a dramatic reduction in GSK-3
immunostaining in the brains of GSK-3 CKO mice without altering GSK-3
immunostaining (Figure 17). Although complete KO of GSK-3 was not achieved,
only a small number of GSK-3-positive neurons were detected in clearly defined
regions.
Figure 17: GSK-3 CKO produced a mosaic pattern of GSK-3 expression in the CA1 region of hippocampus, but no reduced GSK-3 immunoreactivity. Scale bar, 100 m. Neurons with reduced GSK-3 expression are highlighted by black circles and neurons expressing normal GSK-3 levels are highlighted by dashed black circles.

85
Consistent with a previous report (353), the most robust reduction overall was
observed in the forebrain, mainly in CA1 of the hippocampus and cortex. To a lesser
extent we observed a reduction in lateral amygdale nuclei, CA3 of the hippocampus,
layers four and five of the cortex, caudate, putamen, thalamus, and the reticular part
of the substantia nigra. There were no changes in the hypothalamus, fornix, septal
nuclei, brainstem, or cerebellum. These changes appeared consistently in all GSK-
3 CKO mice (Figure 18).
Figure 18: Distribution and consistency of GSK-3 immunoreactivity in GSK-3
CKO mice.
Moreover, ~70% reduction in hippocampal GSK-3 levels was detected by
immunoblot analyses without any evident compensatory increase in GSK-3
expression (Figure 19).

86
Figure 19: Confirmation of GSK-3 reduction in hippocampal lysates from GSK-3CKO mice by WB. Densitometric analysis showed a significant reduction in GSK-3 (67%, t(5)=9, p=0.0003) but not in GSK-3 levels (t(3)=0.4912, p=0.6570). Data show mean ± SEM. ***p<0.01 compared with wt. GSK-3 WT (wt) and GSK-3 CKO (cko). n=4 mice per group.
The same findings regarding specificity, distribution, consistency and intensity of the
reduction in GSK-3 expression were observed in GSK-3 CKO mice (data not
shown).
UBC-CRE-ERT2 lines
We explored two different methods for the delivering of tamoxifen into mice: directly
by oral gavage or intraperitoneal injection once per day for 5 days, and by adding
tamoxifen to chow diet and feeding ad libitum for 7 or 30 days. Both methods were
equally successful in reducing GSK-3 proteins as shown by WB and
immunohistochemical analysis. Complete KO was not achieved in this CRE line
either. We observed a mosaic pattern of immunoreactivity with GSK-3 or GSK-3
specific antibodies in UBC-GSK-3 CKO or UBC-GSK-3 CKO mice lines
respectively.
After tamoxifen induction UBC-GSK-3 CKO and UBC-GSK-3 CKO were sacrificed
at different time points and analyzed by immunohistochemistry. At seven days, a
reduction in the intensity of immunoreactivity was observed, and isolated cells
showed no immunoreactivity at all. At one month, the number of unstained cells

87
increased and the number of immunoreactive cells was reduced. As expected, after
four months of induction, the KO persisted.
As observed with CAMKII-CRE lines, the KO was isoform specific, and we did not
observe any compensatory increase in the levels of the other GSK-3 isoform by WB.
The UBC-CRE line showed a wider distribution of the KO than the CAMKII-CRE
line. We observed an intense reduction of GSK-3 levels in the hippocampus, spinal
cord, cerebellum and other structures (basal ganglia and brain stem). The extent of
GSK-3 reduction was less in the cortex (Figure 20). Other organs were analyzed
(liver, muscle, heart), and a significant decrease in the intensity of GSK-3
immunoreactivity was also observed.
Figure 20: Reduced GSK-3 protein levels in GSK-3 CKO mice after five days of tamoxifen induction by oral gavage, and one month survival. Representative WB “Other” includes subcortical white matter and basal ganglia. g or 40 g of protein were loaded per well.
2. 2. 2. GSK-3 CKO mice did not survive after tamoxifen induction
To better understand the contribution of GSK 3 in AD, we initially planned to KO both
isoforms GSK-3 and in the same mouse, and compare the results with the

88
GSK.3 CKO line and the GSK-3 CKO line.
To this end, we used the inducible UBC-CRE-ERT2 system, and generated a cohort
of UBC-GSK-3 CKO mice and their UBC-GSK-3 WT littermates as controls.
We explored two different methods to deliver tamoxifen into the mice: directly by oral
gavage/intraperitoneal injection once per day for 5 days, or by tamoxifen diet chow
ad libitum for 7 or 30 days.
In our first experiment, five one-month-old UBC-GSK3 CKO mice received
tamoxifen by oral gavage or intraperitoneal injection. All of them died on the sixth or
seventh day after the initiation of induction with tamoxifen. Only one of the three
control UBC-GSK3 WT mice died, and it was due to a complication during the
oral gavage procedure.
We conducted a second experiment. One-month-old mice were feed a chow diet
containing tamoxifen. All six UBC-GSK3 CKO died between the 6th and 13th days
after the initiation of induction with tamoxifen, while none of the three UBC-GSK-
3 WT controls died.
2. 2. 3. Double transgenic GSK-3 cko-PDAPP and GSK-3cko-PDAPP mouse
lines generation
To study the effects of GSK-3 and GSK-3 on A deposits and cognitive
impairment, we attempted to generate two lines of transgenic CKO mice
overexpressing mutant APP (GSK-3cko;PDAPP line and GSK-3cko;PDAPP line).
After several crosses we were able to generate the first generation of GSK-
3cko;PDAPP mice. Lastly, we successfully expanded this line, and generated four
genotypes: GSK-3cko;PDAPP, and their littermates (GSK-3 wt, GSK-3 cko,
GSK-3 wt;PDAPP) as controls. Each of the four groups consisted of n=10-15 mice
that were analyzed at 17 months of age.

89
However, when we attempted to generate the GSK-3cko;PDAPP line we had
several difficulties. First, althought we were able to generate the first generation of
GSK-3CKO;PDAPP mice (11 mice), we observed that the real ratio for this
genotype was 1:15, which was higher than the theoretical 1:8 expected ratio for this
breeding. Second, when we tried to expand the line (nine different matings), we were
unable to obtain any pregnant females. Third, GSK-3cko;PDAPP mice showed a
high mortality. Survival analyses were not planned between littermates in this
generation of mice, but when compared with the survival of the first generation of
GSK-3 cko;PDAPP mice, GSK-3 cko;PDAPP mice displayed a significantly higher
mortality (2(1) =8.411, p<0.01, n=11-12 mice per group) (Figure 21). Finally, since 9
of 11 mice died before 6 months with a median age of 3.5 months, we could not do
any analysis of the effect of GSK-3 KO on plaque load or behavior.
Figure 21: GSK-3 cko;PDAPP mice displayed higher mortality than GSK-3
cko;PDAPP mice.
0.0 2.5 5.0 7.5 10.0 12.50
25
50
75
100 GSK-3 cko;PDAPPGSK-3 cko;PDAPP
P value 0.0037
Time (months)
Perc
ent s
urvi
val

90
2. 2. 4. GSK-3 KO decreases Aamyloid deposition in PDAPP mice
To evaluate the effect of GSK-3 KO on A senile plaque burden in our mice,
hippocampi from age-matched GSK-3 wt;PDAPP and GSK-3cko;PDAPP mice
were analyzed by immunohistochemistry with anti-A mAb Nab228. A
immunoreactivity was quantified using ImageJ. In the CA1, we observed a significant
reduction in A load in GSK-3cko;PDAPP compared to GSK-3 wt;PDAPP females
(t(12)=2.253, p=0.0438) (Figure 22).
Figure 22: In CA1, GSK-3 CKO significantly decreases amyloid load in PDAPP females. Scale bar 500 m. R *p< 0.05. GSK-3 wt;PDAPP (wt-APP) and GSK-3 cko;PDAPP (cko-APP).

91
2. 2. 5. GSK-3 CKO prevents age-dependent behavioral deficits in PDAPP
mice.
Lastly, to determine whether the above-mentioned changes in A load corresponded
to alterations in motor activity or spatial learning, GSK-3 wt, GSK-3 cko, GSK-3
wt;PDAPP and GSK-3cko;PDAPP mice were tested on the open field and Barnes
maze.
GSK-3wt;PDAPP mice manifested an increased level of locomotor activity in the
open field compared with control groups, whereas GSK-3cko;PDAPP performed at
a level indistinguishable from GSK-3 wt and GSK-3 cko mice (F(3,25)=5.234,
p=0.0061) (Figure 23).
Figure 23: GSK-3 wt;PDAPP displayed hyperactivity on the open field test while GSK-3 cko;PDAPP did not. *p<0.05, **p<0.01. GSK-3 wt (wt), GSK-3 cko (cko), GSK-3 wt;PDAPP (wt-APP) and GSK-3 cko;PDAPP (cko-APP).
In the Barnes maze, differences between groups were observed in latency
(F(3,43)=3.589, p=0.021). GSK-3 wt;PDAPP mice displayed significant deficits
compared with GSK-3 wt mice, while GSK-3cko;PDAPP mice were statistically

92
indistinguishable from control groups (Figure 24). Lastly, significant differences
between groups were also observed in the strategies used by mice to find the target
(=26.198, p<0.0001). GSK-3 wt;PDAPP mice were more likely to utilize a poor
search strategy (random) in the Barnes maze compared with the other three
genotype groups, while GSK-3cko;PDAPP were more likely to utilize beneficial
search strategies (serial and spatial) (Figure 24).
Figure 24: GSK-3cko prevents spatial memory deficits in PDAPP mice in the Barnes maze. Search strategy data are shown as the percentage of mice utilizing each strategy per genotype column. *p< 0.05, **p<0.01, ***p< 0.001. GSK-3 wt (wt), GSK-3 cko (cko), GSK-3 wt;PDAPP (wt-APP), and GSK-3 cko;PDAPP (cko-APP).
Importantly, these results are not confounded by GSK-3KO as we did not detect
any differences between GSK-3 wt and GSK-3cko mice in locomotor activity or
spatial memory.

93

94
V. DISCUSSION

95
STUDY 1: Contribution of synaptic markers to cognitive status and cognitive impairment in the oldest-old.

96
In this autopsy study of a large cohort of very elderly individuals, we sought to
elucidate which pathologies among those examined here associate with normal
ageing, which associate with dementia and which, if any, associate with cognitive
impairment. We review all of our findings below.
First, cognitively normal nonagenarians in The 90+ Study have pathological changes,
a median Braak stage of III and a Thal phase of one, consistent with predictable,
age-dependent deposition of AD pathology (90). Of course, many pathologies
besides AD affect the ageing brain including other neurodegenerative diseases, CVD
and HS among others. In this study, we did not examine the role of multiple
neurodegenerative diseases, but we previously reported that synuclein and TDP-43
pathology affect <20% of cognitively normal individuals in this age category and then
primarily as co-morbidities (107). CVD, on the other hand, was common, affecting
45% of the group while HS was almost non-existent (n=1).
Against this background level of multiple age-related pathologies in cognitively
normal individuals, we can analyze the increases in AD burden, CVD and HS
associated with dementia (Figure 25A). As 90+ individuals have a moderate burden
of age-related tangles and plaques and a particularly high prevalence of dementia
(368), it is not surprising that AD pathology is the most common underlying
contributor to dementia in this group (369). For individuals with dementia, the median
Braak stage is V and the Thal phase is three. Compared with the normal group, these
are substantial increases consistent with an intermediate burden of AD
neuropathological change (83). Along with AD, the prevalence of CVD—not including
HS—increased to 74% of individuals in the dementia group. Additionally, dementia
was associated with the appearance of HS in a substantial minority (28%). Similarly,
and primarily comorbidly, TDP-43 also affected a large minority (35%). Both the CVD
and HS percentages are consistent with reported frequencies of these pathologies in
this age-group (370,371), adding further evidence of the association of both entities
with dementia in the oldest-old.
The changes in all three of the synaptic markers studied here are consistent with the

97
interpretation that significant perforant pathway loss occurs with dementia in the 90+
subjects (Figure 25B). This is consistent with our previous work involving 32
individuals in The 90+ Study, where neocortical synaptophysin protein levels were
significantly decreased with dementia (147). In our multiple logistic regression
analysis, both the synaptophysin RIR and Braak stage were tightly associated with
cognitive scores. Concurrently, post hoc analysis revealed that the SV2 RIR was
significantly lower at Braak stage VI, raising the possibility that synaptic protein loss
is tightly correlated with tau burden. This is supported by studies in tau transgenic
mice (156), and in human cohorts where synaptic protein loss only occurs at the
highest Braak stages (372).
On the other hand, as the synaptophysin RIR, Braak stage, HS and TDP-43
pathology measures all remained significantly associated with MMSE scores in our
multiple logistic regression analysis, perhaps something more than pathological AD is
taking place, and it could be that synaptic protein loss in the perforant pathway and
HS are independent factors that contribute to dementia in the oldest-old.
If cognitively normal individuals have age-related tangles and plaques, and these
pathologies increase along with synaptic loss in dementia, what changes occur
during CIND? We observed that none of the pathological changes measured in this
study distinguished the normal and CIND groups, that all of them distinguished
normal and dementia groups, and that, except for Thal phase, all variables were able
to differentiate CIND versus dementia (Table 3). These data suggest that plaque
deposition could be an early event related to cognitive impairment in the oldest-old
(Figure 25A). Cognitively normal nonagenarians have a median Thal phase of one,
which means that A pathology is absent in the medial temporal lobe or restricted to
the temporal neocortex, in at least 50% of them. However, CIND individuals have a
median Thal phase of three, which is consistent with a greater plaque burden, and it
means that at least 50% of them have A pathology in the white matter,
parvopyramidal layer of the presubicular region, temporal cortex and in the perforant
pathway (molecular layer of the dentate fascia and entorhinal cortex) (349).

98
Importantly, there is no concurrent increase in the Braak stage (median III) or HS
(median 0): this may signify that plaques are having an earlier effect than tangles,
which is consistent with numerous biomarker studies that show A becomes
abnormal before tau in cognitively normal individuals (373,374).
Figure 25: A model of changes associated with cognitive impairment and dementia in the oldest-old. Neuropathology and synaptic measures are associated with cognitive impairment in ‘The 90+ Study’. (A) Mild to moderate Alzheimer’s disease pathology already exists in the oldest-old for cognitively normal individuals and the Thal phase may increase with cognitive impairment.With dementia, all markers increase significantly, especially Braak stage, cerebrovascular disease (CVD) pathology and hippocampal sclerosis (HS). (B) Glutamatergic specific synaptic loss (VGLUT1) in the perforant pathway pathology may occur during cognitive impairment, while significant synaptic loss occurs with dementia. All values are relative to the normal group’s means normalized to 1.0, except cerebrovascular disease which factors out the contribution of hippocampal sclerosis before normalizing; the hippocampal sclerosis percentages are graphed separately on the right axis.
We hypothesized that perforant pathway synaptic loss may be one of the early
correlates of cognitive impairment in The 90+ Study, but this was not the case. We
focused on the perforant pathway, because it is a very well known system. Neurons
in layer II of the entorhinal cortex that are significantly affected in early AD (clinical
dementia rating score of 0.5) (375) project into the OML of the hippocampal dentate
gyrus. However, none of the synaptic markers measured in this study distinguished
the normal and CIND groups; and, similar to pathological changes, all of them
distinguished the normal and dementia groups, suggesting that synaptic loss is tightly

99
linked to pathology associated with dementia in the oldest old, and is consistent with
an acceleration of the pathological cascade implied by other studies.
We focused on AD because it was the most prevalent disease in our cohort (107),
and we selected VGLUT1, SV2 and synaptophysin because they showed an obvious
OML synaptic loss on slides obtained from AD patients: therefore, we cannot rule out
that other regions may have earlier synaptic changes in the oldest-old.
Importantly, a close review of the literature shows that the relationship between early
cognitive impairment and synapses is more complicated than expected. Several
factors such as localization, specificity of the synaptic marker, etiology, plasticity, and
the different methods used to measure the synaptic markers need to be taken into
account.
For example, we observed that although the VGLUT1 RIR can clearly distinguish the
normal and dementia groups (P=0.034), this measure did not distinguish the CIND
from the dementia group (P=0.747), whereas the synaptophysin (P<0.001) and SV2
RIRs (P=0.008) still do (Table 25B). These data suggest that CIND may be
associated with a decrease in glutamatergic neurons, whereas non-glutamatergic
neurons remain relatively unaffected. If true, this is consistent with previous work
showing that observed pre-synaptic proteins, such as synaptophysin, remain
constant or increase in earlier phases of illness before decreasing with dementia
onset (147,376).
However, our data disagree with a previous published study in which VGLUT1
immunoreactive boutons were found increased in the frontal cortex of MCI patients
(203). Several reasons may account for this incongruency. For example, the different
brain regions analyzed (mid-frontal cortex vs. OML); and that, as it is well established
that different non-prion proteins, such as A, tau, TDP-43 or synuclein show a
sequential topographical distribution (for review see (9)), synaptic changes may
follow a similar pattern, and synaptic changes in one region may not necessarily
correlate with another at the same time.
100
CIND is a heterogeneous group.We hypothesized that memory-CIND individuals are
more likely to be on the continuum between normal cognition and Alzheimer’s
disease than those individuals with executive impairment or ‘other‘. Therefore, we
compared the RIRs and our pathological markers in the memory-CIND subjects
(n=13) to the normal and dementia subjects to see if our results had more
significance. No new associations were found. However, VGLUT1 RIR almost
distinguished between memory-CIND subjects and normal groups (p=0.05),
suggesting that glutamatergic terminals may be more affected in early AD.
Interestingly, in our study the decrease in the VGLUT1 RIR is coincident with the
increase in Thal phase. This finding is interesting, because a link between A and
glutamatergic synapses has been suggested. For example, A appears to
accumulate preferentially in VGLUT synaptosomes (377). Reduction of VGLUT1
staining has been found in human induced pluripotent stem cell derived neurons after
application of A Furthermore, reduced VGLUT1 protein levels have been
found in A plaque rich regions of AD mice models that overexpress human APP
(379). Moreover, in humans, reduced VGLUT1 RIR has also been found in non-
demented cases with substantial neocortical plaque pathology in the absence of NFT
compared to controls (379). Overall, these data suggest that A and plaques may
damage glutamatergic synapses. If true, this is interesting, because increased
amounts of glutamate can lead to cell death (189), and VGLUT1 is a presynaptic
protein responsible for the transportation of glutamate into synaptic vesicles
(194,195). Then, reduced levels of VGLUT1 could alter the recycling/clearance of
glutamate in synaptic terminals, increase the excitotoxic damage produced, and
contribute to the acceleration of the deleterious events associated to AD.
In summary our study has several strengths: it is a poblational study, which
correlates clinical and pathological data of a large cohort of individuals over 90 years
old, with a large sample of CIND individuals. However, one potential caveat of this
study is that we did not count neurons or synapses. It would be interesting to analyze
whether these synaptic marker changes really correlate with the number of synapses,

101
and also to know whether neuronal loss can be detected before or after synaptic RIR
deficits.
In this study we focused in three synaptic proteins: synaptophysin, SV2 and VGLUT1
and, in one region, OML. However, it would also be very interesting to expand the
number of synaptic markers and regions analyzed here to have a better
understanding of the physiopathological changes involved with cognitive impairment,
and to identify possible plasticity and compensatory events.
Importantly, our study suggests that individuals with CIND are for the most part
pathologically and synaptically indistinguishable from individuals with normal
cognition. This being the case, pharmaceutical interventions that target tau and A or
protect synapses are all viable therapeutic strategies for a population at risk of
dementia due to Alzheimer’s disease. In addition, interventions designed to maintain
a healthy synaptic system and a strict control of vascular risk factors may be good
strategies to preserve cognitive function in nonagenarians and centenarians.

102

103
STUDY 2: Contribution of GSK3 to Alzheimer´s disease and cognitive impairment in an APP mouse model

104
To identify the respective roles of both GSK-3 and GSK-3 on SP formation and
behavioral deficits in vivo, we utilized a novel genetic approach to manipulate the
levels of these two GSK-3 isoforms. We successfully generated CKO of GSK-3 in
GSK-3 cko and GSK-3cko;PDAPP+/- mice, and CKO of GSK-3 in GSK-3 cko
mice. However, we failed to generate GSK-3 CKO and GSK-3cko;PDAPP+/-
mice. Importantly, we report that GSK-3 CKO reduced the formation of SP and
ameliorated the behavioral and cognitive deficits observed in AD transgenic mice.
Our study corroborates previous reports demonstrating that GSK-3 may regulate
APP metabolism (267,272,325,332–337). The role of GSK-3 in AD has been
underestimated over the years. In fact, very few studies have tried to elucidate the
role of each isoform in APP metabolism. Previously, in our shRNA KD model, and in
accordance with an earlier cell-based study (272), we observed that inhibition of
GSK-3 but not GSK-3, was sufficient to reduce A levels and plaque load in aged
AD mouse models (361). Unfortunately, our shRNA approach has a major drawback,
which is the variability of KD efficiency between GSK-3 and isoforms.
Specifically, GSK-3 protein levels were only reduced by ~50% compared to ~70%
for GSK-3. This variability limited the interpretation of our results, because it is
unknown whether the different effects observed in A levels and SP load were
because both isoforms have different effects on A, or simply because the level of
KD was different. To overcome this technical aspect, we tried to generated triple
GSK-3cko;PDAPP+/- mice and GSK-3cko;PDAPP+/- mice. Unfortunately, we could
not further investigate the role of GSK-3on APP, but we demonstrated that GSK-
3cko reduced amyloid load in PDAPP mice compared with GSK-3 wt littermates,
providing further evidence of the possible role of GSK-3 in APP metabolism and SP
formation.
To our knowledge, only one other group has studied the role of GSK-3 or GSk-3
on APP metabolism in vivo. However, they did not explore the effects on plaque load
or behavior deficits. In disagreement with our results, they observed no differences in

105
mouse or human A40 or A42 levels in their GSK-3 CKO mice (339). Important to
note are the differences between their approach and ours. First, they injected an
adeno-associated viral vector expressing triple mutant APP into the hippocampus of
GSK-3 In additionhuman amyloid peptides were analyzed only three weeks later.
This difference is most likely due to technical issues such as the different levels of
APP expression between these two different approaches (adenovirus-APP injection
in hippocampus vs. PDAPP mice), or the drastically shorter treatment term of three
weeks, compared with 11 or 17 months in our shRNA- and GSK-3 cko PDAPP
mice, respectively.
We were able to obtain a first generation of GSK-3cko;PDAPP+/- mice with several
difficulties. The real ratio for this genotype was higher than the theoretically expected
ratio (1/15 and 1/8, respectively), while the GSK-3cko;PDAPP+/- ratio was 1/10.
Mice were unable to breed and displayed higher mortality, with a median age of 3.5
months of survival: therefore, we could not analyze the effect of GSK-3 CKO on
plaque load or behavior. Interestingly, these results are similar to those of a previous
report, in which they observed that the combination of GSK-3 cko with APP (V717I)
did not yield viable offspring, in contrast to GSK-3 cko with APP (V717I) (339).We
did not conduct survival studies on our GSK-3 CKO mice, but we did not observe
any rough differences compared with their GSK-3 WT littermates. The most
parsimonious explanation is that a lack of GSK-3 may generate toxic species,
probably originating from APP or its derivatives that may compromise survival. It is
possible that under normal conditions, a small amount of these toxic species may not
have any consequences, but in mice overexpressing APP, large quantities are
produced, which compromises survival.
Similar results were observed with our viral approach: shRNA- APP/tau mice also
displayed a significant increase in mortality, compared with uninjected APP/tau mice
(2 (1) =4.76, P<0.05). Conversely, shRNA- did not alter the survival of APP mice
when compared with APP controls (273). It is important to note, that the level of GSK-

106
3 KD achieved was lower with shRNA than with the CKO method, suggesting that in
addition to the amount of APP (or derivatives), the degree of GSK-3 reduction may
be important for toxicity in these mice. n summary, although we could not study the
role of GSK-3 on APP metabolism, our results suggest that an excess of APP or
derivatives is more deleterious in GSK-3 CKO mice than in GSK-3 CKO mice, and
provide further evidence of the substantial functional difference of both isoforms in
vivo; our study highlights the importance of further effort aimed at uncovering the
mechanism behind GSK-3 regulation of APP and A processing.
Furthermore, to our knowledge, this is the first study to analyze whether GSK-3
CKO have any beneficial effect on cognition in APP mice. This is especially relevant
because GSK-3 has been involved in synaptic plasticity, learning, and memory, and
both the excess and lack of GSK-3 activity may alter cognition. For example,
behavioral deficits have been observed in GSK-3 KO mice (210), and in
heterozygous GSK-3 KO mice (269,270). On the other hand, it has been proposed
that memory failure in AD results from to LTP inhibition due to GSK-3 hyperactivity,
and that GSK-3 inhibiton can be a good strategy to improve cognition (for a review
see (253,380)). We observed that GSK-3cko prevented spatial memory deficits and
hyperactivity in PDAPP mice, highlighting the potential benefits of inhibiting the GSK-
3 isoform as a therapeutic strategy in AD.
To be able to study the role of GSK-3 and GSK-3 on AD in vivo, we first needed to
generate GSK-3, GSK-3 and GSK-3 CKO mice. The generation of these lines
was a secondary objective of this work, therefore, some aspects were not studied in
depth. Nevertheless, the process helped us to better understand CKO models and
some aspects of the GSK-3 protein.
First, neither of the CRE lines (UBC-CRE-ERT2 and CAMKII-CRE) generated an
absolute GSK-3 KO. We observed a significant reduction in levels of the targeted
GSK-3 isoform in both GSK-3 and GSK-3 lines. Nonetheless, even in regions

107
where the reduction was over 95%, neurons highly immunoreactive to the targeted
GSK-3 isoform were observed by immunohistochemistry.
We observed that the inhibition of GSK-3 was isoform specific in both CKO lines and
with the shRNA approach. No decreased immunoreactivity or decreased levels of the
non-targeted GSK-3 form were observed by immunohistochemistry or by WB. As
discussed in the introduction, all GSK-3 inhibitors inactivate GSK-3 and GSK-3.
The same goes for dominant negative GSK-3conditional transgenic mice, where
increased levels of p-S21-GSK-3 and p-S9-GSK-3are observed. Overall, these
results suggest that to date, shRNA and CKO are the best approaches to achieve
selective isoform inhibition. However, in the near future, we may have isoform-
selective inhibitors (381), since some experimental drugs have shown up to 27-fold
selectivity for GSK-3α over GSK-3β (382).
As in other studies, we observed that the reduction of GSK-3 or GSK-3 with this
approach did not have an obvious impact on the expression of the other isoform
(339). We observed a similar lack of compensation of the protein levels or activity of
the non-targeted isoform of GSK-3 with the shRNA approach. Overall, these results
suggest that the two isoforms have different regulatory systems.
To generate triple transgenic GSK-3cko;PDAPP+/- mice. We used the CAMKII-CRE
line (353). This line presented several advantages, such as the great uniformity of the
KO achieved. We observed that the severity and the distribution of the KO on both
GSK-3 cko and GSK-3 cko mice were almost identical in all adult mice analyzed
by immunohistochemistry. On the contrary, the UBC-CRE-ERT2 line displayed more
variability, probably because it is an inducible and more complex model, in which
additional variables related to the correct administration and preparation of the drug,
among others, may interefere with the induction of the KO.
In addition, the CAMKII line only expresses CRE in the CNS (353). This is important
because some proteins, such as GSK-3, have other important systemic roles (eg.
glucose metabolism) that may interfere with the results. Tissue specific CKO

108
technology allows us to focus and better understand the role of a protein deletion in a
specific tissue such as the CNS.
However, the CAMKII-CRE line also showed some disadvantages. The KO was
less severe and its distribution narrower than in the UBC-CRE-ERT2 line. For
example, in some regions such as CA2, no KO was observed inte the CAMKII-CRE
line. This is important because it can dilute the results. For example, when we
examined the plaque burden on the hippocampus in PDAPP mice, we observed that
GSK-3 cko;PDAPP+/- mice tended to have lower plaque loads than their GSK-3
wt;PDAPP+/- littermates, but this difference was not significant. However, when we
decided to exclude the CA2 region from the analysis and just focus on CA1, the
difference observed in plaque burden between GSK-3 cko;PDAPP+/- and controls
was significant.
Importantly, the expression of CRE with the CAMKIIpromoter occurs early,
between two and three weeks after birth. Similarly, in our previous work, we injected
our shRNA construct on the day the mice were born. With both systems, we achieved
the KO/KD months before plaque deposition and age-related cognitive impairments
were present. Therefore, our results show that GSK-3reduction prevented AD
pathology and cognitive impairment in AD mice, but it is unknown whether GSK-3
inhibition can be beneficial once AD pathology is already established.
Our results were similar to those obtained with GSK-3 inhibitors in AD mouse models
and in humans. Prepathological AD mouse models treated for a period of one to
seven months with GSK-3 inhibitors showed reduced A levels, amyloid load, and
behavioral deficits, compared with control groups (267,272,336,337). In humans,
amnestic MCI participants treated with lithium for 12 months showed a better
performance in cognitive tests that the placebo group (383). Similarly, low doses of
tideglusib for 26 weeks also showed significant responses in several cognitive tests
(ADAS-cog, MMSE and word fluency) in mild to moderate AD (328). Overall, these

109
data add further evidence that GSK-3 reduction may be beneficial in the early stages
of AD.
Convesely, after short-term treatment with GSK-3 inhibitors in aged AD mouse
models, such as 1 month of treatment with lithium in 14-months-old APP/tau/PSEN1
mice, no changes were observed in Alevels, amyloid load, or working memory,
(323). In agreement with this result, phase II clinical trials in humans have shown that
short-term treatment with GSK-3 inhibitors (lithium for 10 weeks (384), or tideglusib
for 26 weeks (328)) did not show benefits with respect to biomarkers or any of the
cognitive assessments performed.
In summary, all of these data suggest that GSK-3 CKO and GSK-3 inhibitors may
prevent SP formatiom and other APP related disorders; however, they may not be
able to reverse pathology after it has been well established. In this respect, more
studies are necessary to determine whether APP-related changes can be reversed
by inducible CKO of GSK-3 mice, or by treating both aged APP mouse models and
mild AD patients with GSK-3 inhibitors for longer periods of time.
Finally, to better understand the role of GSK-3 on APP, we tried to generate inducible
triple GSK-3+ cko mice, but they died during the first week after the initiation of
induction. We did not perform any further analysis, so it is unknown if the cause of
death was CNS-related or systemic (heart, liver, etc). We did not repeat this
experiment in the CAMKII-CRE line, so is unknown if they would survive, but it is
very unlikely. Another group tried to generate triple GSK-3 CKO mice using the
Thy1-CRE line, contanining a neuron specific promoter that expresses after birth.
Interestingly, although not much information regarding breedings was provided, they
yielded 354 offspring, none of which was the desired GSK-3flox/flox;GSK-
3flox/flox;Thy1-cre+/-. These data indicate that GSK-3 is vital to the CNS, and provides
further evidence that isoform-specific GSK-3 inhibitors can be safer and very likely
could display fewer side effects that inhibiting both isoforms.

110
In summary, our study highlights the importance of GSK-3in AD. Our observations
demonstrate that reducing GSK-3 expression ameliorates SPs, and prevents AD-
like cognitive impairment in our mouse models. We have also shown that reducing
GSK-3 expression had deleterious effects in our APP mice. We indeed illustrated
that the lack of both GSK-3 isoforms is incompatible with life in mice. Altogether, this
study suggests that strategies selectively reducing one isoform of GSK-3 may be
safer and better tolerated than GKS-3 inhibitors targeting both; although more studies
are needed to better understand the molecular mechanisms involved, our study
highlights GSK-3as a potential therapeutic target in AD.

111

112
VI. CONCLUSIONS

113
1. Contribution of synaptic markers to cognitive status and cognitive impairment in the oldest-old.
a. Synaptophysin, SV2 and VGLUT1 correlated with global cognitive scores
in the oldest old, and distinguished normal from demented patients, but not
normal from CIND individuals. Synaptophysin and SV2 also distinguished
CIND from demented individuals.
b. Braak stage, Thal phase, HS, CVD and TDP-43 correlated with global
cognitive scores in the oldest old, and distinguished normal from demented
patients, but not normal from CIND individuals. Except for the Thal phase,
all these pathological changes also distinguished CIND from demented
individuals.
c. Synaptophysin, Braak stage, HS and the TDP-43 pathology measures
remained significantly associated with MMSE scores in our multiple logistic
regression analysis.
2. Contribution of GSK3 to AD and cognitive impairment in AD mouse models.
a. GSK-3 CKO prevented cognitive and behavioral deficits in an APP
mouse model of AD.
b. GSK-3 CKO partially prevented amyloid load in an APP mouse model
of AD.
c. We successfully generated both, GSk-3 and GSK-3 CKO mice with
two different CKO systems: a tissue specific (CAMKII-CRE line), and a
ubiquitously expressed but inducible model (UBC-CRE-ERT2 line).
However, we were unable to generate triple transgenic GSK- CKO
mice using the inducible system.

114
d. We successfully generated triple transgenic GSK-3 cko;PDAPP+/-
mice and GSK-3 cko;PDAPP+/-. However, GSK-3 cko;PDAPP+/- were
unable to breed and displayed a high rate of mortatility.

115

116
VII. REFERENCES

117
REFERENCES
1. Virués-Ortega J, de Pedro-Cuesta J, Vega S, Seijo-Martínez M, Saz P, Rodríguez F, et al. Prevalence and European comparison of dementia in a ≥75-year-old composite population in Spain. Acta Neurol Scand. mayo de 2011;123(5):316-24.
2. Bermejo-Pareja F, Benito-León J, Vega S, Medrano MJ, Román GC. Incidence and subtypes of dementia in three elderly populations of central Spain. J Neurol Sci. 15 de enero de 2008;264(1-2):63-72.
3. WorldAlzheimerReport.pdf [Internet]. [citado 21 de marzo de 2014]. Recuperado a partir de: http://www.alz.co.uk/research/files/WorldAlzheimerReport.pdf
4. Cuijpers P. Depressive disorders in caregivers of dementia patients: a systematic review. Aging Ment Health. julio de 2005;9(4):325-30.
5. world_alzheimer_report_2010.pdf [Internet]. [citado 21 de marzo de 2014]. Recuperado a partir de: http://www.alz.org/documents/national/world_alzheimer_report_2010.pdf
6. Rubin EH, Morris JC, Grant EA, Vendegna T. Very mild senile dementia of the Alzheimer type. I. Clinical assessment. Arch Neurol. abril de 1989;46(4):379-82.
7. Petersen RC, Smith GE, Waring SC, Ivnik RJ, Tangalos EG, Kokmen E. Mild cognitive impairment: clinical characterization and outcome. Arch Neurol. marzo de 1999;56(3):303-8.
8. Corrada MM, Berlau DJ, Kawas CH. A population-based clinicopathological study in the oldest-old: the 90+ study. Curr Alzheimer Res. julio de 2012;9(6):709-17.
9. Brettschneider J, Del Tredici K, Lee VM-Y, Trojanowski JQ. Spreading of pathology in neurodegenerative diseases: a focus on human studies. Nat Rev Neurosci. febrero de 2015;16(2):109-20.
10. James Lowe, Suzanne S Mirro, Bradley T Hyman, Dennis W Dickson. Greenfield´s Neuropathology. 8.a ed. Seth Love DWE, David Louis, editores. London: Hodder Arnold; 2008. 1040 - 1041 p.
11. Masters CL, Simms G, Weinman NA, Multhaup G, McDonald BL, Beyreuther K. Amyloid plaque core protein in Alzheimer disease and Down syndrome. Proc Natl Acad Sci USA. junio de 1985;82(12):4245-9.

118
12. Glenner GG, Wong CW. Alzheimer’s disease: initial report of the purification and characterization of a novel cerebrovascular amyloid protein. Biochem Biophys Res Commun. 16 de mayo de 1984;120(3):885-90.
13. Selkoe DJ. Cell biology of the amyloid beta-protein precursor and the mechanism of Alzheimer’s disease. Annu Rev Cell Biol. 1994;10:373-403.
14. Grundke-Iqbal I, Iqbal K, Tung YC, Quinlan M, Wisniewski HM, Binder LI. Abnormal phosphorylation of the microtubule-associated protein tau (tau) in Alzheimer cytoskeletal pathology. Proc Natl Acad Sci USA. julio de 1986;83(13):4913-7.
15. KIDD M. Paired helical filaments in electron microscopy of Alzheimer’s disease. Nature. 12 de enero de 1963;197:192-3.
16. Ishino H, Otsuki S. Distribution of Alzheimer’s neurofibrillary tangles in the basal ganglia and brain stem of progressive supranuclear palsy and Alzheimer’s disease. Folia Psychiatr Neurol Jpn. 1975;29(2):179-87.
17. Komori T. Tau-positive glial inclusions in progressive supranuclear palsy, corticobasal degeneration and Pick’s disease. Brain Pathol. octubre de 1999;9(4):663-79.
18. Umahara T, Hirano A, Kato S, Shibata N, Yen SH. Demonstration of neurofibrillary tangles and neuropil thread-like structures in spinal cord white matter in parkinsonism-dementia complex on Guam and in Guamanian amyotrophic lateral sclerosis. Acta Neuropathol. 1994;88(2):180-4.
19. Graves AB, White E, Koepsell TD, Reifler BV, van Belle G, Larson EB, et al. A case-control study of Alzheimer’s disease. Ann Neurol. diciembre de 1990;28(6):766-74.
20. Mendez MF, Underwood KL, Zander BA, Mastri AR, Sung JH, Frey WH 2nd. Risk factors in Alzheimer’s disease: a clinicopathologic study. Neurology. abril de 1992;42(4):770-5.
21. Cruts M, Theuns J, Van Broeckhoven C. Locus-specific mutation databases for neurodegenerative brain diseases. Hum Mutat. septiembre de 2012;33(9):1340-4.
22. Goate A, Chartier-Harlin MC, Mullan M, Brown J, Crawford F, Fidani L, et al. Segregation of a missense mutation in the amyloid precursor protein gene with familial Alzheimer’s disease. Nature. 21 de febrero de 1991;349(6311):704-6.
23. Sherrington R, Rogaev EI, Liang Y, Rogaeva EA, Levesque G, Ikeda M, et al. Cloning of a gene bearing missense mutations in early-onset familial Alzheimer’s disease. Nature. 29 de junio de 1995;375(6534):754-60.

119
24. Levy-Lahad E, Wasco W, Poorkaj P, Romano DM, Oshima J, Pettingell WH, et al. Candidate gene for the chromosome 1 familial Alzheimer’s disease locus. Science. 18 de agosto de 1995;269(5226):973-7.
25. Rovelet-Lecrux A, Hannequin D, Raux G, Le Meur N, Laquerrière A, Vital A, et al. APP locus duplication causes autosomal dominant early-onset Alzheimer disease with cerebral amyloid angiopathy. Nat Genet. enero de 2006;38(1):24-6.
26. Goldgaber D, Lerman MI, McBride WO, Saffiotti U, Gajdusek DC. Isolation, characterization, and chromosomal localization of human brain cDNA clones coding for the precursor of the amyloid of brain in Alzheimer’s disease, Down’s syndrome and aging. J Neural Transm Suppl. 1987;24:23-8.
27. Robakis NK, Wisniewski HM, Jenkins EC, Devine-Gage EA, Houck GE, Yao XL, et al. Chromosome 21q21 sublocalisation of gene encoding beta-amyloid peptide in cerebral vessels and neuritic (senile) plaques of people with Alzheimer disease and Down syndrome. Lancet. 14 de febrero de 1987;1(8529):384-5.
28. Kang J, Lemaire HG, Unterbeck A, Salbaum JM, Masters CL, Grzeschik KH, et al. The precursor of Alzheimer’s disease amyloid A4 protein resembles a cell-surface receptor. Nature. 19 de febrero de 1987;325(6106):733-6.
29. Corder EH, Saunders AM, Strittmatter WJ, Schmechel DE, Gaskell PC, Small GW, et al. Gene dose of apolipoprotein E type 4 allele and the risk of Alzheimer’s disease in late onset families. Science. 13 de agosto de 1993;261(5123):921-3.
30. Corder EH, Saunders AM, Risch NJ, Strittmatter WJ, Schmechel DE, Gaskell PC, et al. Protective effect of apolipoprotein E type 2 allele for late onset Alzheimer disease. Nat Genet. junio de 1994;7(2):180-4.
31. Zheng H, Koo EH. Biology and pathophysiology of the amyloid precursor protein. Mol Neurodegener. 2011;6(1):27.
32. Breen KC, Bruce M, Anderton BH. Beta amyloid precursor protein mediates neuronal cell-cell and cell-surface adhesion. J Neurosci Res. enero de 1991;28(1):90-100.
33. Sabo SL, Ikin AF, Buxbaum JD, Greengard P. The Alzheimer amyloid precursor protein (APP) and FE65, an APP-binding protein, regulate cell movement. J Cell Biol. 25 de junio de 2001;153(7):1403-14.
34. Small DH, Clarris HL, Williamson TG, Reed G, Key B, Mok SS, et al. Neurite-outgrowth regulating functions of the amyloid protein precursor of Alzheimer’s disease. J Alzheimers Dis. noviembre de 1999;1(4-5):275-85.

120
35. Wang Z, Wang B, Yang L, Guo Q, Aithmitti N, Songyang Z, et al. Presynaptic and postsynaptic interaction of the amyloid precursor protein promotes peripheral and central synaptogenesis. J Neurosci. 2 de septiembre de 2009;29(35):10788-801.
36. Young-Pearse TL, Bai J, Chang R, Zheng JB, LoTurco JJ, Selkoe DJ. A critical function for beta-amyloid precursor protein in neuronal migration revealed by in utero RNA interference. J Neurosci. 26 de diciembre de 2007;27(52):14459-69.
37. Haass C, Hung AY, Schlossmacher MG, Teplow DB, Selkoe DJ. beta-Amyloid peptide and a 3-kDa fragment are derived by distinct cellular mechanisms. J Biol Chem. 15 de febrero de 1993;268(5):3021-4.
38. Edbauer D, Winkler E, Regula JT, Pesold B, Steiner H, Haass C. Reconstitution of gamma-secretase activity. Nat Cell Biol. mayo de 2003;5(5):486-8.
39. Kimberly WT, LaVoie MJ, Ostaszewski BL, Ye W, Wolfe MS, Selkoe DJ. Gamma-secretase is a membrane protein complex comprised of presenilin, nicastrin, Aph-1, and Pen-2. Proc Natl Acad Sci USA. 27 de mayo de 2003;100(11):6382-7.
40. Takasugi N, Tomita T, Hayashi I, Tsuruoka M, Niimura M, Takahashi Y, et al. The role of presenilin cofactors in the gamma-secretase complex. Nature. 27 de marzo de 2003;422(6930):438-41.
41. Vassar R, Bennett BD, Babu-Khan S, Kahn S, Mendiaz EA, Denis P, et al. Beta-secretase cleavage of Alzheimer’s amyloid precursor protein by the transmembrane aspartic protease BACE. Science. 22 de octubre de 1999;286(5440):735-41.
42. Sinha S, Anderson JP, Barbour R, Basi GS, Caccavello R, Davis D, et al. Purification and cloning of amyloid precursor protein beta-secretase from human brain. Nature. 2 de diciembre de 1999;402(6761):537-40.
43. Cameron DJ, Galvin C, Alkam T, Sidhu H, Ellison J, Luna S, et al. Alzheimer’s-related peptide amyloid-β plays a conserved role in angiogenesis. PLoS ONE. 2012;7(7):e39598.
44. Morley JE, Farr SA, Banks WA, Johnson SN, Yamada KA, Xu L. A physiological role for amyloid-beta protein:enhancement of learning and memory. J Alzheimers Dis. 2010;19(2):441-9.
45. López-Toledano MA, Shelanski ML. Neurogenic effect of beta-amyloid peptide in the development of neural stem cells. J Neurosci. 9 de junio de 2004;24(23):5439-44.
46. Ferreira A, Lu Q, Orecchio L, Kosik KS. Selective phosphorylation of adult tau isoforms in mature hippocampal neurons exposed to fibrillar A beta. Mol Cell Neurosci. 1997;9(3):220-34.
121
47. Zheng W-H, Bastianetto S, Mennicken F, Ma W, Kar S. Amyloid beta peptide induces tau phosphorylation and loss of cholinergic neurons in rat primary septal cultures. Neuroscience. 2002;115(1):201-11.
48. Leschik J, Welzel A, Weissmann C, Eckert A, Brandt R. Inverse and distinct modulation of tau-dependent neurodegeneration by presenilin 1 and amyloid-beta in cultured cortical neurons: evidence that tau phosphorylation is the limiting factor in amyloid-beta-induced cell death. J Neurochem. junio de 2007;101(5):1303-15.
49. Busche MA, Eichhoff G, Adelsberger H, Abramowski D, Wiederhold K-H, Haass C, et al. Clusters of hyperactive neurons near amyloid plaques in a mouse model of Alzheimer’s disease. Science. 19 de septiembre de 2008;321(5896):1686-9.
50. Fraser PE, Lévesque L, McLachlan DR. Alzheimer A beta amyloid forms an inhibitory neuronal substrate. J Neurochem. marzo de 1994;62(3):1227-30.
51. Pike CJ, Cotman CW. Calretinin-immunoreactive neurons are resistant to beta-amyloid toxicity in vitro. Brain Res. 13 de febrero de 1995;671(2):293-8.
52. Mattson MP. Cellular actions of beta-amyloid precursor protein and its soluble and fibrillogenic derivatives. Physiol Rev. octubre de 1997;77(4):1081-132.
53. Reifert J, Hartung-Cranston D, Feinstein SC. Amyloid beta-mediated cell death of cultured hippocampal neurons reveals extensive Tau fragmentation without increased full-length tau phosphorylation. J Biol Chem. 10 de junio de 2011;286(23):20797-811.
54. Weingarten MD, Lockwood AH, Hwo SY, Kirschner MW. A protein factor essential for microtubule assembly. Proc Natl Acad Sci USA. mayo de 1975;72(5):1858-62.
55. Binder LI, Frankfurter A, Rebhun LI. The distribution of tau in the mammalian central nervous system. J Cell Biol. octubre de 1985;101(4):1371-8.
56. Shin RW, Iwaki T, Kitamoto T, Tateishi J. Hydrated autoclave pretreatment enhances tau immunoreactivity in formalin-fixed normal and Alzheimer’s disease brain tissues. Lab Invest. mayo de 1991;64(5):693-702.
57. Couchie D, Mavilia C, Georgieff IS, Liem RK, Shelanski ML, Nunez J. Primary structure of high molecular weight tau present in the peripheral nervous system. Proc Natl Acad Sci USA. 15 de mayo de 1992;89(10):4378-81.
58. Goedert M, Spillantini MG, Jakes R, Rutherford D, Crowther RA. Multiple isoforms of human microtubule-associated protein tau: sequences and localization in neurofibrillary tangles of Alzheimer’s disease. Neuron. octubre de 1989;3(4):519-26.

122
59. Andreadis A, Brown WM, Kosik KS. Structure and novel exons of the human tau gene. Biochemistry. 3 de noviembre de 1992;31(43):10626-33.
60. Hong M, Zhukareva V, Vogelsberg-Ragaglia V, Wszolek Z, Reed L, Miller BI, et al. Mutation-specific functional impairments in distinct tau isoforms of hereditary FTDP-17. Science. 4 de diciembre de 1998;282(5395):1914-7.
61. Drechsel DN, Hyman AA, Cobb MH, Kirschner MW. Modulation of the dynamic instability of tubulin assembly by the microtubule-associated protein tau. Mol Biol Cell. octubre de 1992;3(10):1141-54.
62. Goedert M, Jakes R. Expression of separate isoforms of human tau protein: correlation with the tau pattern in brain and effects on tubulin polymerization. EMBO J. diciembre de 1990;9(13):4225-30.
63. Trinczek B, Ebneth A, Mandelkow EM, Mandelkow E. Tau regulates the attachment/detachment but not the speed of motors in microtubule-dependent transport of single vesicles and organelles. J Cell Sci. julio de 1999;112 ( Pt 14):2355-67.
64. Caceres A, Kosik KS. Inhibition of neurite polarity by tau antisense oligonucleotides in primary cerebellar neurons. Nature. 1 de febrero de 1990;343(6257):461-3.
65. Ittner A, Ke YD, van Eersel J, Gladbach A, Götz J, Ittner LM. Brief update on different roles of tau in neurodegeneration. IUBMB Life. julio de 2011;63(7):495-502.
66. Harada A, Oguchi K, Okabe S, Kuno J, Terada S, Ohshima T, et al. Altered microtubule organization in small-calibre axons of mice lacking tau protein. Nature. 9 de junio de 1994;369(6480):488-91.
67. Avila J, Lucas JJ, Perez M, Hernandez F. Role of tau protein in both physiological and pathological conditions. Physiol Rev. abril de 2004;84(2):361-84.
68. Pevalova M, Filipcik P, Novak M, Avila J, Iqbal K. Post-translational modifications of tau protein. Bratisl Lek Listy. 2006;107(9-10):346-53.
69. Johnson GVW, Stoothoff WH. Tau phosphorylation in neuronal cell function and dysfunction. J Cell Sci. 15 de noviembre de 2004;117(Pt 24):5721-9.
70. Ebneth A, Godemann R, Stamer K, Illenberger S, Trinczek B, Mandelkow E. Overexpression of tau protein inhibits kinesin-dependent trafficking of vesicles, mitochondria, and endoplasmic reticulum: implications for Alzheimer’s disease. J Cell Biol. 2 de noviembre de 1998;143(3):777-94.
71. Lindwall G, Cole RD. Phosphorylation affects the ability of tau protein to promote microtubule assembly. J Biol Chem. 25 de abril de 1984;259(8):5301-5.

123
72. Planel E, Miyasaka T, Launey T, Chui D-H, Tanemura K, Sato S, et al. Alterations in glucose metabolism induce hypothermia leading to tau hyperphosphorylation through differential inhibition of kinase and phosphatase activities: implications for Alzheimer’s disease. J Neurosci. 10 de marzo de 2004;24(10):2401-11.
73. Hanger DP, Anderton BH, Noble W. Tau phosphorylation: the therapeutic challenge for neurodegenerative disease. Trends Mol Med. marzo de 2009;15(3):112-9.
74. Alonso AC, Grundke-Iqbal I, Iqbal K. Alzheimer’s disease hyperphosphorylated tau sequesters normal tau into tangles of filaments and disassembles microtubules. Nat Med. julio de 1996;2(7):783-7.
75. Wagner U, Utton M, Gallo JM, Miller CC. Cellular phosphorylation of tau by GSK-3 beta influences tau binding to microtubules and microtubule organisation. J Cell Sci. junio de 1996;109 ( Pt 6):1537-43.
76. Lu Q, Wood JG. Functional studies of Alzheimer’s disease tau protein. J Neurosci. febrero de 1993;13(2):508-15.
77. Lee VM, Goedert M, Trojanowski JQ. Neurodegenerative tauopathies. Annu Rev Neurosci. 2001;24:1121-59.
78. Lee VM-Y, Brunden KR, Hutton M, Trojanowski JQ. Developing therapeutic approaches to tau, selected kinases, and related neuronal protein targets. Cold Spring Harb Perspect Med. septiembre de 2011;1(1):a006437.
79. Ballatore C, Brunden KR, Trojanowski JQ, Lee VM-Y, Smith AB 3rd, Huryn DM. Modulation of protein-protein interactions as a therapeutic strategy for the treatment of neurodegenerative tauopathies. Curr Top Med Chem. 2011;11(3):317-30.
80. Brunden KR, Trojanowski JQ, Lee VM-Y. Evidence that non-fibrillar tau causes pathology linked to neurodegeneration and behavioral impairments. J Alzheimers Dis. agosto de 2008;14(4):393-9.
81. Brunden KR, Trojanowski JQ, Lee VM-Y. Advances in tau-focused drug discovery for Alzheimer’s disease and related tauopathies. Nat Rev Drug Discov. octubre de 2009;8(10):783-93.
82. Santacruz K, Lewis J, Spires T, Paulson J, Kotilinek L, Ingelsson M, et al. Tau suppression in a neurodegenerative mouse model improves memory function. Science. 15 de julio de 2005;309(5733):476-81.
83. Montine TJ, Phelps CH, Beach TG, Bigio EH, Cairns NJ, Dickson DW, et al. National Institute on Aging-Alzheimer’s Association guidelines for the

124
neuropathologic assessment of Alzheimer’s disease: a practical approach. Acta Neuropathol. enero de 2012;123(1):1-11.
84. Braak H, Braak E. Neuropathological stageing of Alzheimer-related changes. Acta Neuropathol. 1991;82(4):239-59.
85. Braak H, Alafuzoff I, Arzberger T, Kretzschmar H, Del Tredici K. Staging of Alzheimer disease-associated neurofibrillary pathology using paraffin sections and immunocytochemistry. Acta Neuropathol. octubre de 2006;112(4):389-404.
86. Nelson PT, Alafuzoff I, Bigio EH, Bouras C, Braak H, Cairns NJ, et al. Correlation of Alzheimer disease neuropathologic changes with cognitive status: a review of the literature. J Neuropathol Exp Neurol. mayo de 2012;71(5):362-81.
87. Reed LA, Grabowski TJ, Schmidt ML, Morris JC, Goate A, Solodkin A, et al. Autosomal dominant dementia with widespread neurofibrillary tangles. Ann Neurol. octubre de 1997;42(4):564-72.
88. Rapoport M, Dawson HN, Binder LI, Vitek MP, Ferreira A. Tau is essential to beta -amyloid-induced neurotoxicity. Proc Natl Acad Sci USA. 30 de abril de 2002;99(9):6364-9.
89. Roberson ED, Scearce-Levie K, Palop JJ, Yan F, Cheng IH, Wu T, et al. Reducing endogenous tau ameliorates amyloid beta-induced deficits in an Alzheimer’s disease mouse model. Science. 4 de mayo de 2007;316(5825):750-4.
90. Braak H, Thal DR, Ghebremedhin E, Del Tredici K. Stages of the pathologic process in Alzheimer disease: age categories from 1 to 100 years. J Neuropathol Exp Neurol. noviembre de 2011;70(11):960-9.
91. Hernández F, Gómez de Barreda E, Fuster-Matanzo A, Lucas JJ, Avila J. GSK3: a possible link between beta amyloid peptide and tau protein. Exp Neurol. junio de 2010;223(2):322-5.
92. Bartus RT, Dean RL, Beer B, Lippa AS. The cholinergic hypothesis of geriatric memory dysfunction. Science. 30 de julio de 1982;217(4558):408-14.
93. Mufson EJ, Counts SE, Perez SE, Ginsberg SD. Cholinergic system during the progression of Alzheimer’s disease: therapeutic implications. Expert Rev Neurother. noviembre de 2008;8(11):1703-18.
94. Nochi S, Asakawa N, Sato T. Kinetic study on the inhibition of acetylcholinesterase by 1-benzyl-4-[(5,6-dimethoxy-1-indanon)-2-yl]methylpiperidine hydrochloride (E2020). Biol Pharm Bull. agosto de 1995;18(8):1145-7.

125
95. Lipton SA. Failures and Successes of NMDA Receptor Antagonists: Molecular Basis for the Use of Open-Channel Blockers like Memantine in the Treatment of Acute and Chronic Neurologic Insults. NeuroRx. enero de 2004;1(1):101-10.
96. World Population Prospects, the 2012 Revision [Internet]. [citado 7 de abril de 2015]. Recuperado a partir de: http://esa.un.org/wpp/Excel-Data/population.htm
97. Corrada MM, Brookmeyer R, Paganini-Hill A, Berlau D, Kawas CH. Dementia incidence continues to increase with age in the oldest old: the 90+ study. Ann Neurol. enero de 2010;67(1):114-21.
98. Jorm AF, Jolley D. The incidence of dementia: a meta-analysis. Neurology. septiembre de 1998;51(3):728-33.
99. Gao S, Hendrie HC, Hall KS, Hui S. The relationships between age, sex, and the incidence of dementia and Alzheimer disease: a meta-analysis. Arch Gen Psychiatry. septiembre de 1998;55(9):809-15.
100. Miech RA, Breitner JCS, Zandi PP, Khachaturian AS, Anthony JC, Mayer L. Incidence of AD may decline in the early 90s for men, later for women: The Cache County study. Neurology. 22 de enero de 2002;58(2):209-18.
101. Kawas CH, Corrada MM. Alzheimer’s and dementia in the oldest-old: a century of challenges. Curr Alzheimer Res. diciembre de 2006;3(5):411-9.
102. Strittmatter WJ, Saunders AM, Schmechel D, Pericak-Vance M, Enghild J, Salvesen GS, et al. Apolipoprotein E: high-avidity binding to beta-amyloid and increased frequency of type 4 allele in late-onset familial Alzheimer disease. Proc Natl Acad Sci USA. 1 de marzo de 1993;90(5):1977-81.
103. Juva K, Verkkoniemi A, Viramo P, Polvikoski T, Kainulainen K, Kontula K, et al. APOE epsilon4 does not predict mortality, cognitive decline, or dementia in the oldest old. Neurology. 25 de enero de 2000;54(2):412-5.
104. Sobel E, Louhija J, Sulkava R, Davanipour Z, Kontula K, Miettinen H, et al. Lack of association of apolipoprotein E allele epsilon 4 with late-onset Alzheimer’s disease among Finnish centenarians. Neurology. mayo de 1995;45(5):903-7.
105. Ganguli M, Lee C-W, Snitz BE, Hughes TF, McDade E, Chang C-CH. Rates and risk factors for progression to incident dementia vary by age in a population cohort. Neurology. 1 de junio de 2015;84(1):72-80.
106. Neuropathology Group. Medical Research Council Cognitive Function and Aging Study. Pathological correlates of late-onset dementia in a multicentre, community-based population in England and Wales. Neuropathology Group of the Medical Research Council Cognitive Function and Ageing Study (MRC CFAS). Lancet. 20 de enero de 2001;357(9251):169-75.

126
107. Robinson JL, Geser F, Corrada MM, Berlau DJ, Arnold SE, Lee VM-Y, et al. Neocortical and hippocampal amyloid-β and tau measures associate with dementia in the oldest-old. Brain. diciembre de 2011;134(Pt 12):3708-15.
108. Crystal HA, Dickson D, Davies P, Masur D, Grober E, Lipton RB. The relative frequency of «dementia of unknown etiology» increases with age and is nearly 50% in nonagenarians. Arch Neurol. mayo de 2000;57(5):713-9.
109. Polvikoski T, Sulkava R, Myllykangas L, Notkola IL, Niinistö L, Verkkoniemi A, et al. Prevalence of Alzheimer’s disease in very elderly people: a prospective neuropathological study. Neurology. 26 de junio de 2001;56(12):1690-6.
110. Katzman R, Terry R, DeTeresa R, Brown T, Davies P, Fuld P, et al. Clinical, pathological, and neurochemical changes in dementia: a subgroup with preserved mental status and numerous neocortical plaques. Ann Neurol. febrero de 1988;23(2):138-44.
111. Silver MH, Newell K, Brady C, Hedley-White ET, Perls TT. Distinguishing between neurodegenerative disease and disease-free aging: correlating neuropsychological evaluations and neuropathological studies in centenarians. Psychosom Med. junio de 2002;64(3):493-501.
112. Nelson PT, Abner EL, Schmitt FA, Kryscio RJ, Jicha GA, Smith CD, et al. Modeling the association between 43 different clinical and pathological variables and the severity of cognitive impairment in a large autopsy cohort of elderly persons. Brain Pathol. enero de 2010;20(1):66-79.
113. Dolan D, Troncoso J, Resnick SM, Crain BJ, Zonderman AB, O’Brien RJ. Age, Alzheimer’s disease and dementia in the Baltimore Longitudinal Study of Ageing. Brain. agosto de 2010;133(Pt 8):2225-31.
114. Wilson RS, Leurgans SE, Boyle PA, Schneider JA, Bennett DA. Neurodegenerative basis of age-related cognitive decline. Neurology. 21 de septiembre de 2010;75(12):1070-8.
115. Savva GM, Wharton SB, Ince PG, Forster G, Matthews FE, Brayne C, et al. Age, neuropathology, and dementia. N Engl J Med. 28 de mayo de 2009;360(22):2302-9.
116. Haroutunian V, Schnaider-Beeri M, Schmeidler J, Wysocki M, Purohit DP, Perl DP, et al. Role of the neuropathology of Alzheimer disease in dementia in the oldest-old. Arch Neurol. septiembre de 2008;65(9):1211-7.
117. von Gunten A, Ebbing K, Imhof A, Giannakopoulos P, Kövari E. Brain aging in the oldest-old. Curr Gerontol Geriatr Res. 2010;

127
118. Masliah E, Mallory M, Hansen L, DeTeresa R, Terry RD. Quantitative synaptic alterations in the human neocortex during normal aging. Neurology. enero de 1993;43(1):192-7.
119. Garde E, Mortensen EL, Krabbe K, Rostrup E, Larsson HB. Relation between age-related decline in intelligence and cerebral white-matter hyperintensities in healthy octogenarians: a longitudinal study. Lancet. 19 de agosto de 2000;356(9230):628-34.
120. Snowdon DA, Greiner LH, Mortimer JA, Riley KP, Greiner PA, Markesbery WR. Brain infarction and the clinical expression of Alzheimer disease. The Nun Study. JAMA. 12 de marzo de 1997;277(10):813-7.
121. Gold G, Kövari E, Herrmann FR, Canuto A, Hof PR, Michel J-P, et al. Cognitive consequences of thalamic, basal ganglia, and deep white matter lacunes in brain aging and dementia. Stroke. junio de 2005;36(6):1184-8.
122. Schneider JA, Boyle PA, Arvanitakis Z, Bienias JL, Bennett DA. Subcortical infarcts, Alzheimer’s disease pathology, and memory function in older persons. Ann Neurol. julio de 2007;62(1):59-66.
123. Prasad K, Wiryasaputra L, Ng A, Kandiah N. White matter disease independently predicts progression from mild cognitive impairment to Alzheimer’s disease in a clinic cohort. Dement Geriatr Cogn Disord. 2011;31(6):431-4.
124. Nelson PT, Jicha GA, Schmitt FA, Liu H, Davis DG, Mendiondo MS, et al. Clinicopathologic correlations in a large Alzheimer disease center autopsy cohort: neuritic plaques and neurofibrillary tangles «do count» when staging disease severity. J Neuropathol Exp Neurol. diciembre de 2007;66(12):1136-46.
125. Zekry D, Duyckaerts C, Moulias R, Belmin J, Geoffre C, Herrmann F, et al. Degenerative and vascular lesions of the brain have synergistic effects in dementia of the elderly. Acta Neuropathol. mayo de 2002;103(5):481-7.
126. Petrovitch H, Ross GW, Steinhorn SC, Abbott RD, Markesbery W, Davis D, et al. AD lesions and infarcts in demented and non-demented Japanese-American men. Ann Neurol. enero de 2005;57(1):98-103.
127. Polvikoski TM, van Straaten ECW, Barkhof F, Sulkava R, Aronen HJ, Niinistö L, et al. Frontal lobe white matter hyperintensities and neurofibrillary pathology in the oldest old. Neurology. 7 de diciembre de 2010;75(23):2071-8.
128. Sommer W. Erkrankung des Ammonshorns als aetiologisches Moment der Epilepsie. Archiv f Psychiatrie. octubre de 1880;10(3):631-75.

128
129. Nelson PT, Schmitt FA, Lin Y, Abner EL, Jicha GA, Patel E, et al. Hippocampal sclerosis in advanced age: clinical and pathological features. Brain. mayo de 2011;134(Pt 5):1506-18.
130. Nag S, Yu L, Capuano AW, Wilson RS, Leurgans SE, Bennett DA, et al. Hippocampal sclerosis and TDP-43 pathology in aging and Alzheimer disease. Ann Neurol. junio de 2015;77(6):942-52.
131. Dickson DW, Davies P, Bevona C, Van Hoeven KH, Factor SM, Grober E, et al. Hippocampal sclerosis: a common pathological feature of dementia in very old (> or = 80 years of age) humans. Acta Neuropathol. 1994;88(3):212-21.
132. Corey-Bloom J, Sabbagh MN, Bondi MW, Hansen L, Alford MF, Masliah E, et al. Hippocampal sclerosis contributes to dementia in the elderly. Neurology. enero de 1997;48(1):154-60.
133. Leverenz JB, Agustin CM, Tsuang D, Peskind ER, Edland SD, Nochlin D, et al. Clinical and neuropathological characteristics of hippocampal sclerosis: a community-based study. Arch Neurol. julio de 2002;59(7):1099-106.
134. Cohen TJ, Lee VMY, Trojanowski JQ. TDP-43 functions and pathogenic mechanisms implicated in TDP-43 proteinopathies. Trends Mol Med. noviembre de 2011;17(11):659-67.
135. Neumann M, Sampathu DM, Kwong LK, Truax AC, Micsenyi MC, Chou TT, et al. Ubiquitinated TDP-43 in frontotemporal lobar degeneration and amyotrophic lateral sclerosis. Science. 6 de octubre de 2006;314(5796):130-3.
136. Uryu K, Nakashima-Yasuda H, Forman MS, Kwong LK, Clark CM, Grossman M, et al. Concomitant TAR-DNA-binding protein 43 pathology is present in Alzheimer disease and corticobasal degeneration but not in other tauopathies. J Neuropathol Exp Neurol. junio de 2008;67(6):555-64.
137. DeKosky ST, Scheff SW. Synapse loss in frontal cortex biopsies in Alzheimer’s disease: correlation with cognitive severity. Ann Neurol. mayo de 1990;27(5):457-64.
138. Lambert MP, Barlow AK, Chromy BA, Edwards C, Freed R, Liosatos M, et al. Diffusible, nonfibrillar ligands derived from Abeta1-42 are potent central nervous system neurotoxins. Proc Natl Acad Sci USA. 26 de mayo de 1998;95(11):6448-53.
139. Scheff SW, Price DA. Alzheimer’s disease-related alterations in synaptic density: neocortex and hippocampus. J Alzheimers Dis. 2006;9(3 Suppl):101-15.
140. Scheff SW, Price DA, Schmitt FA, DeKosky ST, Mufson EJ. Synaptic alterations in CA1 in mild Alzheimer disease and mild cognitive impairment. Neurology. 1 de mayo de 2007;68(18):1501-8.
129
141. DeKosky ST, Scheff SW, Styren SD. Structural correlates of cognition in dementia: quantification and assessment of synapse change. Neurodegeneration. diciembre de 1996;5(4):417-21.
142. Terry RD, Masliah E, Salmon DP, Butters N, DeTeresa R, Hill R, et al. Physical basis of cognitive alterations in Alzheimer’s disease: synapse loss is the major correlate of cognitive impairment. Ann Neurol. octubre de 1991;30(4):572-80.
143. Beeri MS, Haroutunian V, Schmeidler J, Sano M, Fam P, Kavanaugh A, et al. Synaptic protein deficits are associated with dementia irrespective of extreme old age. Neurobiol Aging. junio de 2012;33(6):1125.e1-8.
144. Scheff SW, Price DA, Sparks DL. Quantitative assessment of possible age-related change in synaptic numbers in the human frontal cortex. Neurobiol Aging. junio de 2001;22(3):355-65.
145. Davies P, Anderton B, Kirsch J, Konnerth A, Nitsch R, Sheetz M. First one in, last one out: the role of gabaergic transmission in generation and degeneration. Prog Neurobiol. agosto de 1998;55(6):651-8.
146. Counts SE, Nadeem M, Lad SP, Wuu J, Mufson EJ. Differential expression of synaptic proteins in the frontal and temporal cortex of elderly subjects with mild cognitive impairment. J Neuropathol Exp Neurol. junio de 2006;65(6):592-601.
147. Head E, Corrada MM, Kahle-Wrobleski K, Kim RC, Sarsoza F, Goodus M, et al. Synaptic proteins, neuropathology and cognitive status in the oldest-old. Neurobiol Aging. julio de 2009;30(7):1125-34.
148. Kamenetz F, Tomita T, Hsieh H, Seabrook G, Borchelt D, Iwatsubo T, et al. APP processing and synaptic function. Neuron. 27 de marzo de 2003;37(6):925-37.
149. Cirrito JR, Yamada KA, Finn MB, Sloviter RS, Bales KR, May PC, et al. Synaptic activity regulates interstitial fluid amyloid-beta levels in vivo. Neuron. 22 de diciembre de 2005;48(6):913-22.
150. Meilandt WJ, Yu G-Q, Chin J, Roberson ED, Palop JJ, Wu T, et al. Enkephalin elevations contribute to neuronal and behavioral impairments in a transgenic mouse model of Alzheimer’s disease. J Neurosci. 7 de mayo de 2008;28(19):5007-17.
151. Palop JJ, Mucke L. Amyloid-beta-induced neuronal dysfunction in Alzheimer’s disease: from synapses toward neural networks. Nat Neurosci. julio de 2010;13(7):812-8.
152. Verret L, Mann EO, Hang GB, Barth AMI, Cobos I, Ho K, et al. Inhibitory interneuron deficit links altered network activity and cognitive dysfunction in Alzheimer model. Cell. 27 de abril de 2012;149(3):708-21.

130
153. Huang Y, Mucke L. Alzheimer mechanisms and therapeutic strategies. Cell. 16 de marzo de 2012;148(6):1204-22.
154. Walsh DM, Klyubin I, Fadeeva JV, Cullen WK, Anwyl R, Wolfe MS, et al. Naturally secreted oligomers of amyloid beta protein potently inhibit hippocampal long-term potentiation in vivo. Nature. 4 de abril de 2002;416(6880):535-9.
155. Polydoro M, Acker CM, Duff K, Castillo PE, Davies P. Age-dependent impairment of cognitive and synaptic function in the htau mouse model of tau pathology. J Neurosci. 26 de agosto de 2009;29(34):10741-9.
156. Yoshiyama Y, Higuchi M, Zhang B, Huang S-M, Iwata N, Saido TC, et al. Synapse loss and microglial activation precede tangles in a P301S tauopathy mouse model. Neuron. 1 de febrero de 2007;53(3):337-51.
157. Jahn R, Schiebler W, Ouimet C, Greengard P. A 38,000-dalton membrane protein (p38) present in synaptic vesicles. Proc Natl Acad Sci USA. junio de 1985;82(12):4137-41.
158. Navone F, Jahn R, Di Gioia G, Stukenbrok H, Greengard P, De Camilli P. Protein p38: an integral membrane protein specific for small vesicles of neurons and neuroendocrine cells. J Cell Biol. diciembre de 1986;103(6 Pt 1):2511-27.
159. Takamori S, Holt M, Stenius K, Lemke EA, Grønborg M, Riedel D, et al. Molecular anatomy of a trafficking organelle. Cell. 17 de noviembre de 2006;127(4):831-46.
160. Daly C, Ziff EB. Ca2+-dependent formation of a dynamin-synaptophysin complex: potential role in synaptic vesicle endocytosis. J Biol Chem. 15 de marzo de 2002;277(11):9010-5.
161. Gordon SL, Leube RE, Cousin MA. Synaptophysin is required for synaptobrevin retrieval during synaptic vesicle endocytosis. J Neurosci. 28 de septiembre de 2011;31(39):14032-6.
162. Kwon SE, Chapman ER. Synaptophysin regulates the kinetics of synaptic vesicle endocytosis in central neurons. Neuron. 9 de junio de 2011;70(5):847-54.
163. Calakos N, Scheller RH. Vesicle-associated membrane protein and synaptophysin are associated on the synaptic vesicle. J Biol Chem. 7 de octubre de 1994;269(40):24534-7.
164. Pennuto M, Dunlap D, Contestabile A, Benfenati F, Valtorta F. Fluorescence resonance energy transfer detection of synaptophysin I and vesicle-associated membrane protein 2 interactions during exocytosis from single live synapses. Mol Biol Cell. agosto de 2002;13(8):2706-17.

131
165. Russell CL, Semerdjieva S, Empson RM, Austen BM, Beesley PW, Alifragis P. Amyloid-β acts as a regulator of neurotransmitter release disrupting the interaction between synaptophysin and VAMP2. PLoS ONE. 2012;7(8):e43201.
166. McMahon HT, Bolshakov VY, Janz R, Hammer RE, Siegelbaum SA, Südhof TC. Synaptophysin, a major synaptic vesicle protein, is not essential for neurotransmitter release. Proc Natl Acad Sci USA. 14 de mayo de 1996;93(10):4760-4.
167. Masliah E, Terry RD, DeTeresa RM, Hansen LA. Immunohistochemical quantification of the synapse-related protein synaptophysin in Alzheimer disease. Neurosci Lett. 28 de agosto de 1989;103(2):234-9.
168. Kirvell SL, Elliott MS, Kalaria RN, Hortobágyi T, Ballard CG, Francis PT. Vesicular glutamate transporter and cognition in stroke: a case-control autopsy study. Neurology. 16 de noviembre de 2010;75(20):1803-9.
169. Masliah E, Terry RD, Mallory M, Alford M, Hansen LA. Diffuse plaques do not accentuate synapse loss in Alzheimer’s disease. Am J Pathol. diciembre de 1990;137(6):1293-7.
170. Kirvell SL, Esiri M, Francis PT. Down-regulation of vesicular glutamate transporters precedes cell loss and pathology in Alzheimer’s disease. J Neurochem. agosto de 2006;98(3):939-50.
171. Sze CI, Troncoso JC, Kawas C, Mouton P, Price DL, Martin LJ. Loss of the presynaptic vesicle protein synaptophysin in hippocampus correlates with cognitive decline in Alzheimer disease. J Neuropathol Exp Neurol. agosto de 1997;56(8):933-44.
172. Scheff SW, Price DA, Ansari MA, Roberts KN, Schmitt FA, Ikonomovic MD, et al. Synaptic change in the posterior cingulate gyrus in the progression of Alzheimer’s disease. J Alzheimers Dis. 2015;43(3):1073-90.
173. Buckley K, Kelly RB. Identification of a transmembrane glycoprotein specific for secretory vesicles of neural and endocrine cells. J Cell Biol. abril de 1985;100(4):1284-94.
174. Bajjalieh SM, Frantz GD, Weimann JM, McConnell SK, Scheller RH. Differential expression of synaptic vesicle protein 2 (SV2) isoforms. J Neurosci. septiembre de 1994;14(9):5223-35.
175. Crowder KM, Gunther JM, Jones TA, Hale BD, Zhang HZ, Peterson MR, et al. Abnormal neurotransmission in mice lacking synaptic vesicle protein 2A (SV2A). Proc Natl Acad Sci USA. 21 de diciembre de 1999;96(26):15268-73.

132
176. Janz R, Goda Y, Geppert M, Missler M, Südhof TC. SV2A and SV2B function as redundant Ca2+ regulators in neurotransmitter release. Neuron. diciembre de 1999;24(4):1003-16.
177. Xu T, Bajjalieh SM. SV2 modulates the size of the readily releasable pool of secretory vesicles. Nat Cell Biol. agosto de 2001;3(8):691-8.
178. Schivell AE, Batchelor RH, Bajjalieh SM. Isoform-specific, calcium-regulated interaction of the synaptic vesicle proteins SV2 and synaptotagmin. J Biol Chem. 1 de noviembre de 1996;271(44):27770-5.
179. Pyle RA, Schivell AE, Hidaka H, Bajjalieh SM. Phosphorylation of synaptic vesicle protein 2 modulates binding to synaptotagmin. J Biol Chem. 2 de junio de 2000;275(22):17195-200.
180. Brose N, Petrenko AG, Südhof TC, Jahn R. Synaptotagmin: a calcium sensor on the synaptic vesicle surface. Science. 15 de mayo de 1992;256(5059):1021-5.
181. Yao J, Nowack A, Kensel-Hammes P, Gardner RG, Bajjalieh SM. Cotrafficking of SV2 and synaptotagmin at the synapse. J Neurosci. 21 de abril de 2010;30(16):5569-78.
182. Lynch BA, Lambeng N, Nocka K, Kensel-Hammes P, Bajjalieh SM, Matagne A, et al. The synaptic vesicle protein SV2A is the binding site for the antiepileptic drug levetiracetam. Proc Natl Acad Sci USA. 29 de junio de 2004;101(26):9861-6.
183. Dong M, Yeh F, Tepp WH, Dean C, Johnson EA, Janz R, et al. SV2 is the protein receptor for botulinum neurotoxin A. Science. 28 de abril de 2006;312(5773):592-6.
184. Lassmann H, Weiler R, Fischer P, Bancher C, Jellinger K, Floor E, et al. Synaptic pathology in Alzheimer’s disease: immunological data for markers of synaptic and large dense-core vesicles. Neuroscience. 1992;46(1):1-8.
185. Sze CI, Bi H, Kleinschmidt-DeMasters BK, Filley CM, Martin LJ. Selective regional loss of exocytotic presynaptic vesicle proteins in Alzheimer’s disease brains. J Neurol Sci. 15 de abril de 2000;175(2):81-90.
186. Kaufman AC, Salazar SV, Haas LT, Yang J, Kostylev MA, Jeng AT, et al. Fyn inhibition rescues established memory and synapse loss in Alzheimer mice. Ann Neurol. junio de 2015;77(6):953-71.
187. Bakker A, Krauss GL, Albert MS, Speck CL, Jones LR, Stark CE, et al. Reduction of hippocampal hyperactivity improves cognition in amnestic mild cognitive impairment. Neuron. 10 de mayo de 2012;74(3):467-74.

133
188. Fonnum F. Glutamate: a neurotransmitter in mammalian brain. J Neurochem. enero de 1984;42(1):1-11.
189. Choi DW, Maulucci-Gedde M, Kriegstein AR. Glutamate neurotoxicity in cortical cell culture. J Neurosci. febrero de 1987;7(2):357-68.
190. Martinez-Hernandez A, Bell KP, Norenberg MD. Glutamine synthetase: glial localization in brain. Science. 25 de marzo de 1977;195(4284):1356-8.
191. Rothstein JD, Tabakoff B. Alteration of striatal glutamate release after glutamine synthetase inhibition. J Neurochem. noviembre de 1984;43(5):1438-46.
192. Chaudhry FA, Reimer RJ, Edwards RH. The glutamine commute: take the N line and transfer to the A. J Cell Biol. 29 de abril de 2002;157(3):349-55.
193. Conti F, Minelli A. Glutamate immunoreactivity in rat cerebral cortex is reversibly abolished by 6-diazo-5-oxo-L-norleucine (DON), an inhibitor of phosphate-activated glutaminase. J Histochem Cytochem. junio de 1994;42(6):717-26.
194. Bellocchio EE, Reimer RJ, Fremeau RT, Edwards RH. Uptake of glutamate into synaptic vesicles by an inorganic phosphate transporter. Science. 11 de agosto de 2000;289(5481):957-60.
195. Takamori S, Rhee JS, Rosenmund C, Jahn R. Identification of a vesicular glutamate transporter that defines a glutamatergic phenotype in neurons. Nature. 14 de septiembre de 2000;407(6801):189-94.
196. Liguz-Lecznar M, Skangiel-Kramska J. Vesicular glutamate transporters (VGLUTs): the three musketeers of glutamatergic system. Acta Neurobiol Exp (Wars). 2007;67(3):207-18.
197. Shen J. Modeling the glutamate-glutamine neurotransmitter cycle. Front Neuroenergetics. 2013;5:1.
198. Behrens PF, Franz P, Woodman B, Lindenberg KS, Landwehrmeyer GB. Impaired glutamate transport and glutamate-glutamine cycling: downstream effects of the Huntington mutation. Brain. agosto de 2002;125(Pt 8):1908-22.
199. Maragakis NJ, Rothstein JD. Glutamate transporters: animal models to neurologic disease. Neurobiol Dis. abril de 2004;15(3):461-73.
200. Sepkuty JP, Cohen AS, Eccles C, Rafiq A, Behar K, Ganel R, et al. A neuronal glutamate transporter contributes to neurotransmitter GABA synthesis and epilepsy. J Neurosci. 1 de agosto de 2002;22(15):6372-9.
201. Eastwood SL, Harrison PJ. Decreased expression of vesicular glutamate transporter 1 and complexin II mRNAs in schizophrenia: further evidence for a

134
synaptic pathology affecting glutamate neurons. Schizophr Res. 1 de marzo de 2005;73(2-3):159-72.
202. Kashani A, Betancur C, Giros B, Hirsch E, El Mestikawy S. Altered expression of vesicular glutamate transporters VGLUT1 and VGLUT2 in Parkinson disease. Neurobiol Aging. abril de 2007;28(4):568-78.
203. Bell KFS, Bennett DA, Cuello AC. Paradoxical upregulation of glutamatergic presynaptic boutons during mild cognitive impairment. J Neurosci. 3 de octubre de 2007;27(40):10810-7.
204. Kashani A, Lepicard E, Poirel O, Videau C, David JP, Fallet-Bianco C, et al. Loss of VGLUT1 and VGLUT2 in the prefrontal cortex is correlated with cognitive decline in Alzheimer disease. Neurobiol Aging. noviembre de 2008;29(11):1619-30.
205. Chen KH, Reese EA, Kim H-W, Rapoport SI, Rao JS. Disturbed neurotransmitter transporter expression in Alzheimer’s disease brain. J Alzheimers Dis. 2011;26(4):755-66.
206. Embi N, Rylatt DB, Cohen P. Glycogen synthase kinase-3 from rabbit skeletal muscle. Separation from cyclic-AMP-dependent protein kinase and phosphorylase kinase. Eur J Biochem. junio de 1980;107(2):519-27.
207. Woodgett JR. Molecular cloning and expression of glycogen synthase kinase-3/factor A. EMBO J. agosto de 1990;9(8):2431-8.
208. Shaw PC, Davies AF, Lau KF, Garcia-Barcelo M, Waye MM, Lovestone S, et al. Isolation and chromosomal mapping of human glycogen synthase kinase-3 alpha and -3 beta encoding genes. Genome. octubre de 1998;41(5):720-7.
209. Hansen L, Arden KC, Rasmussen SB, Viars CS, Vestergaard H, Hansen T, et al. Chromosomal mapping and mutational analysis of the coding region of the glycogen synthase kinase-3alpha and beta isoforms in patients with NIDDM. Diabetologia. agosto de 1997;40(8):940-6.
210. Kaidanovich-Beilin O, Lipina TV, Takao K, van Eede M, Hattori S, Laliberté C, et al. Abnormalities in brain structure and behavior in GSK-3alpha mutant mice. Mol Brain. 2009;2:35.
211. Hoeflich KP, Luo J, Rubie EA, Tsao MS, Jin O, Woodgett JR. Requirement for glycogen synthase kinase-3beta in cell survival and NF-kappaB activation. Nature. 6 de julio de 2000;406(6791):86-90.
212. Soutar MPM, Kim W-Y, Williamson R, Peggie M, Hastie CJ, McLauchlan H, et al. Evidence that glycogen synthase kinase-3 isoforms have distinct substrate preference in the brain. J Neurochem. noviembre de 2010;115(4):974-83.

135
213. Mukai F, Ishiguro K, Sano Y, Fujita SC. Alternative splicing isoform of tau protein kinase I/glycogen synthase kinase 3beta. J Neurochem. junio de 2002;81(5):1073-83.
214. Yao H-B, Shaw P-C, Wong C-C, Wan DC-C. Expression of glycogen synthase kinase-3 isoforms in mouse tissues and their transcription in the brain. J Chem Neuroanat. mayo de 2002;23(4):291-7.
215. Hemmings BA, Yellowlees D, Kernohan JC, Cohen P. Purification of glycogen synthase kinase 3 from rabbit skeletal muscle. Copurification with the activating factor (FA) of the (Mg-ATP) dependent protein phosphatase. Eur J Biochem. octubre de 1981;119(3):443-51.
216. Bijur GN, Jope RS. Proapoptotic stimuli induce nuclear accumulation of glycogen synthase kinase-3 beta. J Biol Chem. 5 de octubre de 2001;276(40):37436-42.
217. Hoshi M, Takashima A, Noguchi K, Murayama M, Sato M, Kondo S, et al. Regulation of mitochondrial pyruvate dehydrogenase activity by tau protein kinase I/glycogen synthase kinase 3beta in brain. Proc Natl Acad Sci USA. 2 de abril de 1996;93(7):2719-23.
218. Bijur GN, Jope RS. Rapid accumulation of Akt in mitochondria following phosphatidylinositol 3-kinase activation. J Neurochem. diciembre de 2003;87(6):1427-35.
219. Perez-Costas E, Gandy JC, Melendez-Ferro M, Roberts RC, Bijur GN. Light and electron microscopy study of glycogen synthase kinase-3beta in the mouse brain. PLoS ONE. 2010;5(1):e8911.
220. Hongisto V, Vainio JC, Thompson R, Courtney MJ, Coffey ET. The Wnt pool of glycogen synthase kinase 3beta is critical for trophic-deprivation-induced neuronal death. Mol Cell Biol. marzo de 2008;28(5):1515-27.
221. Cohen P, Yellowlees D, Aitken A, Donella-Deana A, Hemmings BA, Parker PJ. Separation and characterisation of glycogen synthase kinase 3, glycogen synthase kinase 4 and glycogen synthase kinase 5 from rabbit skeletal muscle. Eur J Biochem. mayo de 1982;124(1):21-35.
222. Kaidanovich-Beilin O, Woodgett JR. GSK-3: Functional Insights from Cell Biology and Animal Models. Front Mol Neurosci. 2011;4:40.
223. Aberle H, Bauer A, Stappert J, Kispert A, Kemler R. beta-catenin is a target for the ubiquitin-proteasome pathway. EMBO J. 1 de julio de 1997;16(13):3797-804.

136
224. Dajani R, Fraser E, Roe SM, Young N, Good V, Dale TC, et al. Crystal structure of glycogen synthase kinase 3 beta: structural basis for phosphate-primed substrate specificity and autoinhibition. Cell. 15 de junio de 2001;105(6):721-32.
225. ter Haar E, Coll JT, Austen DA, Hsiao HM, Swenson L, Jain J. Structure of GSK3beta reveals a primed phosphorylation mechanism. Nat Struct Biol. julio de 2001;8(7):593-6.
226. Taelman VF, Dobrowolski R, Plouhinec J-L, Fuentealba LC, Vorwald PP, Gumper I, et al. Wnt signaling requires sequestration of glycogen synthase kinase 3 inside multivesicular endosomes. Cell. 23 de diciembre de 2010;143(7):1136-48.
227. Ma S, Liu S, Huang Q, Xie B, Lai B, Wang C, et al. Site-specific phosphorylation protects glycogen synthase kinase-3β from calpain-mediated truncation of its N and C termini. J Biol Chem. 29 de junio de 2012;287(27):22521-32.
228. Jurado-Arjona J, Goñi-Oliver P, Rodríguez-Prada L, Engel T, Henshall DC, Ávila J, et al. Excitotoxicity induced by kainic acid provokes glycogen synthase kinase-3 truncation in the hippocampus. Brain Res. 22 de junio de 2015;1611:84-92.
229. Medina M, Wandosell F. Deconstructing GSK-3: The Fine Regulation of Its Activity. Int J Alzheimers Dis. 2011;2011:479249.
230. Doble BW, Woodgett JR. GSK-3: tricks of the trade for a multi-tasking kinase. J Cell Sci. 1 de abril de 2003;116(Pt 7):1175-86.
231. Hughes K, Nikolakaki E, Plyte SE, Totty NF, Woodgett JR. Modulation of the glycogen synthase kinase-3 family by tyrosine phosphorylation. EMBO J. febrero de 1993;12(2):803-8.
232. Cole A, Frame S, Cohen P. Further evidence that the tyrosine phosphorylation of glycogen synthase kinase-3 (GSK3) in mammalian cells is an autophosphorylation event. Biochem J. 1 de enero de 2004;377(Pt 1):249-55.
233. Park IK, Roach P, Bondor J, Fox SP, DePaoli-Roach AA. Molecular mechanism of the synergistic phosphorylation of phosphatase inhibitor-2. Cloning, expression, and site-directed mutagenesis of inhibitor-2. J Biol Chem. 14 de enero de 1994;269(2):944-54.
234. Dent P, Campbell DG, Hubbard MJ, Cohen P. Multisite phosphorylation of the glycogen-binding subunit of protein phosphatase-1G by cyclic AMP-dependent protein kinase and glycogen synthase kinase-3. FEBS Lett. 8 de mayo de 1989;248(1-2):67-72.
235. Dent P, Lavoinne A, Nakielny S, Caudwell FB, Watt P, Cohen P. The molecular mechanism by which insulin stimulates glycogen synthesis in mammalian skeletal muscle. Nature. 22 de noviembre de 1990;348(6299):302-8.

137
236. Fiol CJ, Haseman JH, Wang YH, Roach PJ, Roeske RW, Kowalczuk M, et al. Phosphoserine as a recognition determinant for glycogen synthase kinase-3: phosphorylation of a synthetic peptide based on the G-component of protein phosphatase-1. Arch Biochem Biophys. diciembre de 1988;267(2):797-802.
237. Martin M, Rehani K, Jope RS, Michalek SM. Toll-like receptor-mediated cytokine production is differentially regulated by glycogen synthase kinase 3. Nat Immunol. agosto de 2005;6(8):777-84.
238. Jope RS, Yuskaitis CJ, Beurel E. Glycogen synthase kinase-3 (GSK3): inflammation, diseases, and therapeutics. Neurochem Res. mayo de 2007;32(4-5):577-95.
239. Lucas FR, Salinas PC. WNT-7a induces axonal remodeling and increases synapsin I levels in cerebellar neurons. Dev Biol. 1 de diciembre de 1997;192(1):31-44.
240. Lucas FR, Goold RG, Gordon-Weeks PR, Salinas PC. Inhibition of GSK-3beta leading to the loss of phosphorylated MAP-1B is an early event in axonal remodelling induced by WNT-7a or lithium. J Cell Sci. mayo de 1998;111 ( Pt 10):1351-61.
241. Eickholt BJ, Walsh FS, Doherty P. An inactive pool of GSK-3 at the leading edge of growth cones is implicated in Semaphorin 3A signaling. J Cell Biol. 15 de abril de 2002;157(2):211-7.
242. Hall AC, Lucas FR, Salinas PC. Axonal remodeling and synaptic differentiation in the cerebellum is regulated by WNT-7a signaling. Cell. 3 de marzo de 2000;100(5):525-35.
243. Mackie K, Sorkin BC, Nairn AC, Greengard P, Edelman GM, Cunningham BA. Identification of two protein kinases that phosphorylate the neural cell-adhesion molecule, N-CAM. J Neurosci. junio de 1989;9(6):1883-96.
244. Guan RJ, Khatra BS, Cohlberg JA. Phosphorylation of bovine neurofilament proteins by protein kinase FA (glycogen synthase kinase 3). J Biol Chem. 5 de mayo de 1991;266(13):8262-7.
245. Berling B, Wille H, Röll B, Mandelkow EM, Garner C, Mandelkow E. Phosphorylation of microtubule-associated proteins MAP2a,b and MAP2c at Ser136 by proline-directed kinases in vivo and in vitro. Eur J Cell Biol. junio de 1994;64(1):120-30.
246. Guidato S, Tsai LH, Woodgett J, Miller CC. Differential cellular phosphorylation of neurofilament heavy side-arms by glycogen synthase kinase-3 and cyclin-dependent kinase-5. J Neurochem. abril de 1996;66(4):1698-706.

138
247. García-Pérez J, Avila J, Díaz-Nido J. Implication of cyclin-dependent kinases and glycogen synthase kinase 3 in the phosphorylation of microtubule-associated protein 1B in developing neuronal cells. J Neurosci Res. 15 de mayo de 1998;52(4):445-52.
248. Peineau S, Taghibiglou C, Bradley C, Wong TP, Liu L, Lu J, et al. LTP inhibits LTD in the hippocampus via regulation of GSK3beta. Neuron. 1 de marzo de 2007;53(5):703-17.
249. Peineau S, Bradley C, Taghibiglou C, Doherty A, Bortolotto ZA, Wang YT, et al. The role of GSK-3 in synaptic plasticity. Br J Pharmacol. marzo de 2008;153 Suppl 1:S428-37.
250. Peineau S, Nicolas CS, Bortolotto ZA, Bhat RV, Ryves WJ, Harwood AJ, et al. A systematic investigation of the protein kinases involved in NMDA receptor-dependent LTD: evidence for a role of GSK-3 but not other serine/threonine kinases. Mol Brain. 2009;2:22.
251. Zhu L-Q, Wang S-H, Liu D, Yin Y-Y, Tian Q, Wang X-C, et al. Activation of glycogen synthase kinase-3 inhibits long-term potentiation with synapse-associated impairments. J Neurosci. 7 de noviembre de 2007;27(45):12211-20.
252. Hooper C, Markevich V, Plattner F, Killick R, Schofield E, Engel T, et al. Glycogen synthase kinase-3 inhibition is integral to long-term potentiation. Eur J Neurosci. enero de 2007;25(1):81-6.
253. Bradley CA, Peineau S, Taghibiglou C, Nicolas CS, Whitcomb DJ, Bortolotto ZA, et al. A pivotal role of GSK-3 in synaptic plasticity. Front Mol Neurosci. 2012;5:13.
254. Morfini G, Szebenyi G, Elluru R, Ratner N, Brady ST. Glycogen synthase kinase 3 phosphorylates kinesin light chains and negatively regulates kinesin-based motility. EMBO J. 1 de febrero de 2002;21(3):281-93.
255. Li X, Jope RS. Is glycogen synthase kinase-3 a central modulator in mood regulation? Neuropsychopharmacology. octubre de 2010;35(11):2143-54.
256. Kozlovsky N, Nadri C, Agam G. Low GSK-3beta in schizophrenia as a consequence of neurodevelopmental insult. Eur Neuropsychopharmacol. enero de 2005;15(1):1-11.
257. Polter A, Beurel E, Yang S, Garner R, Song L, Miller CA, et al. Deficiency in the inhibitory serine-phosphorylation of glycogen synthase kinase-3 increases sensitivity to mood disturbances. Neuropsychopharmacology. julio de 2010;35(8):1761-74.

139
258. Darrington RS, Campa VM, Walker MM, Bengoa-Vergniory N, Gorrono-Etxebarria I, Uysal-Onganer P, et al. Distinct expression and activity of GSK-3α and GSK-3β in prostate cancer. Int J Cancer. 15 de septiembre de 2012;131(6):E872-83.
259. Plyte SE, Hughes K, Nikolakaki E, Pulverer BJ, Woodgett JR. Glycogen synthase kinase-3: functions in oncogenesis and development. Biochim Biophys Acta. 16 de diciembre de 1992;1114(2-3):147-62.
260. Juhaszova M, Zorov DB, Yaniv Y, Nuss HB, Wang S, Sollott SJ. Role of glycogen synthase kinase-3beta in cardioprotection. Circ Res. 5 de junio de 2009;104(11):1240-52.
261. Das S, Wong R, Rajapakse N, Murphy E, Steenbergen C. Glycogen synthase kinase 3 inhibition slows mitochondrial adenine nucleotide transport and regulates voltage-dependent anion channel phosphorylation. Circ Res. 24 de octubre de 2008;103(9):983-91.
262. Wagman AS, Johnson KW, Bussiere DE. Discovery and development of GSK3 inhibitors for the treatment of type 2 diabetes. Curr Pharm Des. 2004;10(10):1105-37.
263. Cohen P, Goedert M. GSK3 inhibitors: development and therapeutic potential. Nat Rev Drug Discov. junio de 2004;3(6):479-87.
264. Hooper C, Killick R, Lovestone S. The GSK3 hypothesis of Alzheimer’s disease. J Neurochem. marzo de 2008;104(6):1433-9.
265. Medina M, Avila J. Glycogen synthase kinase-3 (GSK-3) inhibitors for the treatment of Alzheimer’s disease. Curr Pharm Des. 2010;16(25):2790-8.
266. Eldar-Finkelman H, Martinez A. GSK-3 Inhibitors: Preclinical and Clinical Focus on CNS. Front Mol Neurosci. 2011;4:32.
267. Serenó L, Coma M, Rodríguez M, Sánchez-Ferrer P, Sánchez MB, Gich I, et al. A novel GSK-3beta inhibitor reduces Alzheimer’s pathology and rescues neuronal loss in vivo. Neurobiol Dis. septiembre de 2009;35(3):359-67.
268. MacAulay K, Doble BW, Patel S, Hansotia T, Sinclair EM, Drucker DJ, et al. Glycogen synthase kinase 3alpha-specific regulation of murine hepatic glycogen metabolism. Cell Metab. octubre de 2007;6(4):329-37.
269. O’Brien WT, Harper AD, Jové F, Woodgett JR, Maretto S, Piccolo S, et al. Glycogen synthase kinase-3beta haploinsufficiency mimics the behavioral and molecular effects of lithium. J Neurosci. 28 de julio de 2004;24(30):6791-8.
270. Kimura T, Yamashita S, Nakao S, Park J-M, Murayama M, Mizoroki T, et al. GSK-3beta is required for memory reconsolidation in adult brain. PLoS ONE. 2008;3(10):e3540.

140
271. Moore CB, Guthrie EH, Huang MT-H, Taxman DJ. Short Hairpin RNA (shRNA): Design, Delivery, and Assessment of Gene Knockdown. Methods Mol Biol. 2010;629:141-58.
272. Phiel CJ, Wilson CA, Lee VM-Y, Klein PS. GSK-3alpha regulates production of Alzheimer’s disease amyloid-beta peptides. Nature. 22 de mayo de 2003;423(6938):435-9.
273. Hurtado DE, Molina-Porcel L, Carroll JC, Macdonald C, Aboagye AK, Trojanowski JQ, et al. Selectively silencing GSK-3 isoforms reduces plaques and tangles in mouse models of Alzheimer’s disease. J Neurosci. 23 de mayo de 2012;32(21):7392-402.
274. Cejka D, Losert D, Wacheck V. Short interfering RNA (siRNA): tool or therapeutic? Clin Sci. enero de 2006;110(1):47-58.
275. Ryding AD, Sharp MG, Mullins JJ. Conditional transgenic technologies. J Endocrinol. octubre de 2001;171(1):1-14.
276. Dominguez I, Itoh K, Sokol SY. Role of glycogen synthase kinase 3 beta as a negative regulator of dorsoventral axis formation in Xenopus embryos. Proc Natl Acad Sci USA. 29 de agosto de 1995;92(18):8498-502.
277. Burgin KE, Waxham MN, Rickling S, Westgate SA, Mobley WC, Kelly PT. In situ hybridization histochemistry of Ca2+/calmodulin-dependent protein kinase in developing rat brain. J Neurosci. junio de 1990;10(6):1788-98.
278. Gómez-Sintes R, Hernández F, Bortolozzi A, Artigas F, Avila J, Zaratin P, et al. Neuronal apoptosis and reversible motor deficit in dominant-negative GSK-3 conditional transgenic mice. EMBO J. 6 de junio de 2007;26(11):2743-54.
279. Gómez-Sintes R, Hernández F, Lucas JJ, Avila J. GSK-3 Mouse Models to Study Neuronal Apoptosis and Neurodegeneration. Front Mol Neurosci. 2011;4:45.
280. Sternberg N, Hamilton D. Bacteriophage P1 site-specific recombination. I. Recombination between loxP sites. J Mol Biol. 25 de agosto de 1981;150(4):467-86.
281. Ishiguro K, Takamatsu M, Tomizawa K, Omori A, Takahashi M, Arioka M, et al. Tau protein kinase I converts normal tau protein into A68-like component of paired helical filaments. J Biol Chem. 25 de mayo de 1992;267(15):10897-901.
282. Pei JJ, Braak E, Braak H, Grundke-Iqbal I, Iqbal K, Winblad B, et al. Distribution of active glycogen synthase kinase 3beta (GSK-3beta) in brains staged for Alzheimer disease neurofibrillary changes. J Neuropathol Exp Neurol. septiembre de 1999;58(9):1010-9.

141
283. Leroy K, Yilmaz Z, Brion J-P. Increased level of active GSK-3beta in Alzheimer’s disease and accumulation in argyrophilic grains and in neurones at different stages of neurofibrillary degeneration. Neuropathol Appl Neurobiol. febrero de 2007;33(1):43-55.
284. Yamaguchi H, Ishiguro K, Uchida T, Takashima A, Lemere CA, Imahori K. Preferential labeling of Alzheimer neurofibrillary tangles with antisera for tau protein kinase (TPK) I/glycogen synthase kinase-3 beta and cyclin-dependent kinase 5, a component of TPK II. Acta Neuropathol. septiembre de 1996;92(3):232-41.
285. Imahori K, Uchida T. Physiology and pathology of tau protein kinases in relation to Alzheimer’s disease. J Biochem. febrero de 1997;121(2):179-88.
286. Pei JJ, Tanaka T, Tung YC, Braak E, Iqbal K, Grundke-Iqbal I. Distribution, levels, and activity of glycogen synthase kinase-3 in the Alzheimer disease brain. J Neuropathol Exp Neurol. enero de 1997;56(1):70-8.
287. Ferrer I, Barrachina M, Puig B. Glycogen synthase kinase-3 is associated with neuronal and glial hyperphosphorylated tau deposits in Alzheimer’s disease, Pick’s disease, progressive supranuclear palsy and corticobasal degeneration. Acta Neuropathol. diciembre de 2002;104(6):583-91.
288. Ishizawa T, Sahara N, Ishiguro K, Kersh J, McGowan E, Lewis J, et al. Co-localization of glycogen synthase kinase-3 with neurofibrillary tangles and granulovacuolar degeneration in transgenic mice. Am J Pathol. septiembre de 2003;163(3):1057-67.
289. Blalock EM, Geddes JW, Chen KC, Porter NM, Markesbery WR, Landfield PW. Incipient Alzheimer’s disease: microarray correlation analyses reveal major transcriptional and tumor suppressor responses. Proc Natl Acad Sci USA. 17 de febrero de 2004;101(7):2173-8.
290. Swatton JE, Sellers LA, Faull RLM, Holland A, Iritani S, Bahn S. Increased MAP kinase activity in Alzheimer’s and Down syndrome but not in schizophrenia human brain. Eur J Neurosci. mayo de 2004;19(10):2711-9.
291. Baum L, Hansen L, Masliah E, Saitoh T. Glycogen synthase kinase 3 alteration in Alzheimer disease is related to neurofibrillary tangle formation. Mol Chem Neuropathol. diciembre de 1996;29(2-3):253-61.
292. Hye A, Kerr F, Archer N, Foy C, Poppe M, Brown R, et al. Glycogen synthase kinase-3 is increased in white cells early in Alzheimer’s disease. Neurosci Lett. 3 de enero de 2005;373(1):1-4.
293. Forlenza OV, Torres CA, Talib LL, de Paula VJ, Joaquim HPG, Diniz BS, et al. Increased platelet GSK3B activity in patients with mild cognitive impairment and Alzheimer’s disease. J Psychiatr Res. febrero de 2011;45(2):220-4.
142
294. Pláteník J, Fišar Z, Buchal R, Jirák R, Kitzlerová E, Zvěřová M, et al. GSK3β, CREB, and BDNF in peripheral blood of patients with Alzheimer’s disease and depression. Prog Neuropsychopharmacol Biol Psychiatry. 3 de abril de 2014;50:83-93.
295. Mateo I, Infante J, Llorca J, Rodríguez E, Berciano J, Combarros O. Association between glycogen synthase kinase-3beta genetic polymorphism and late-onset Alzheimer’s disease. Dement Geriatr Cogn Disord. 2006;21(4):228-32.
296. Zhang N, Yu J-T, Yang Y, Yang J, Zhang W, Tan L. Association analysis of GSK3B and MAPT polymorphisms with Alzheimer’s disease in Han Chinese. Brain Res. 19 de mayo de 2011;1391:147-53.
297. Schaffer BAJ, Bertram L, Miller BL, Mullin K, Weintraub S, Johnson N, et al. Association of GSK3B with Alzheimer disease and frontotemporal dementia. Arch Neurol. octubre de 2008;65(10):1368-74.
298. Kwok JBJ, Loy CT, Hamilton G, Lau E, Hallupp M, Williams J, et al. Glycogen synthase kinase-3beta and tau genes interact in Alzheimer’s disease. Ann Neurol. octubre de 2008;64(4):446-54.
299. Mateo I, Vázquez-Higuera JL, Sánchez-Juan P, Rodríguez-Rodríguez E, Infante J, García-Gorostiaga I, et al. Epistasis between tau phosphorylation regulating genes (CDK5R1 and GSK-3beta) and Alzheimer’s disease risk. Acta Neurol Scand. agosto de 2009;120(2):130-3.
300. Baki L, Shioi J, Wen P, Shao Z, Schwarzman A, Gama-Sosa M, et al. PS1 activates PI3K thus inhibiting GSK-3 activity and tau overphosphorylation: effects of FAD mutations. EMBO J. 7 de julio de 2004;23(13):2586-96.
301. Tanemura K, Chui D-H, Fukuda T, Murayama M, Park J-M, Akagi T, et al. Formation of tau inclusions in knock-in mice with familial Alzheimer disease (FAD) mutation of presenilin 1 (PS1). J Biol Chem. 24 de febrero de 2006;281(8):5037-41.
302. Kremer A, Louis JV, Jaworski T, Van Leuven F. GSK3 and Alzheimer’s Disease: Facts and Fiction…. Front Mol Neurosci. 2011;4:17.
303. Jope RS, Johnson GVW. The glamour and gloom of glycogen synthase kinase-3. Trends Biochem Sci. febrero de 2004;29(2):95-102.
304. Giese KP. GSK-3: a key player in neurodegeneration and memory. IUBMB Life. mayo de 2009;61(5):516-21.
305. Hanger DP, Hughes K, Woodgett JR, Brion JP, Anderton BH. Glycogen synthase kinase-3 induces Alzheimer’s disease-like phosphorylation of tau: generation of paired helical filament epitopes and neuronal localisation of the kinase. Neurosci Lett. 23 de noviembre de 1992;147(1):58-62.

143
306. Lovestone S, Reynolds CH, Latimer D, Davis DR, Anderton BH, Gallo JM, et al. Alzheimer’s disease-like phosphorylation of the microtubule-associated protein tau by glycogen synthase kinase-3 in transfected mammalian cells. Curr Biol. 1 de diciembre de 1994;4(12):1077-86.
307. Cho J-H, Johnson GVW. Glycogen synthase kinase 3beta phosphorylates tau at both primed and unprimed sites. Differential impact on microtubule binding. J Biol Chem. 3 de enero de 2003;278(1):187-93.
308. Hanger DP, Byers HL, Wray S, Leung K-Y, Saxton MJ, Seereeram A, et al. Novel phosphorylation sites in tau from Alzheimer brain support a role for casein kinase 1 in disease pathogenesis. J Biol Chem. 10 de agosto de 2007;282(32):23645-54.
309. Hong M, Chen DC, Klein PS, Lee VM. Lithium reduces tau phosphorylation by inhibition of glycogen synthase kinase-3. J Biol Chem. 3 de octubre de 1997;272(40):25326-32.
310. Spittaels K, Van den Haute C, Van Dorpe J, Geerts H, Mercken M, Bruynseels K, et al. Glycogen synthase kinase-3beta phosphorylates protein tau and rescues the axonopathy in the central nervous system of human four-repeat tau transgenic mice. J Biol Chem. 29 de diciembre de 2000;275(52):41340-9.
311. Lucas JJ, Hernández F, Gómez-Ramos P, Morán MA, Hen R, Avila J. Decreased nuclear beta-catenin, tau hyperphosphorylation and neurodegeneration in GSK-3beta conditional transgenic mice. EMBO J. 15 de enero de 2001;20(1-2):27-39.
312. Terwel D, Muyllaert D, Dewachter I, Borghgraef P, Croes S, Devijver H, et al. Amyloid activates GSK-3beta to aggravate neuronal tauopathy in bigenic mice. Am J Pathol. marzo de 2008;172(3):786-98.
313. Brownlees J, Irving NG, Brion JP, Gibb BJ, Wagner U, Woodgett J, et al. Tau phosphorylation in transgenic mice expressing glycogen synthase kinase-3beta transgenes. Neuroreport. 20 de octubre de 1997;8(15):3251-5.
314. Li B, Ryder J, Su Y, Moore SA Jr, Liu F, Solenberg P, et al. Overexpression of GSK3betaS9A resulted in tau hyperphosphorylation and morphology reminiscent of pretangle-like neurons in the brain of PDGSK3beta transgenic mice. Transgenic Res. agosto de 2004;13(4):385-96.
315. Hernández F, Borrell J, Guaza C, Avila J, Lucas JJ. Spatial learning deficit in transgenic mice that conditionally over-express GSK-3beta in the brain but do not form tau filaments. J Neurochem. diciembre de 2002;83(6):1529-33.
316. Jackson GR, Wiedau-Pazos M, Sang T-K, Wagle N, Brown CA, Massachi S, et al. Human Wild-Type Tau Interacts with wingless Pathway Components and
144
Produces Neurofibrillary Pathology in Drosophila. Neuron. 16 de mayo de 2002;34(4):509-19.
317. Mudher A, Shepherd D, Newman TA, Mildren P, Jukes JP, Squire A, et al. GSK-3β inhibition reverses axonal transport defects and behavioural phenotypes in Drosophila. Mol Psychiatry. 2 de marzo de 2004;9(5):522-30.
318. Engel T, Hernández F, Avila J, Lucas JJ. Full reversal of Alzheimer’s disease-like phenotype in a mouse model with conditional overexpression of glycogen synthase kinase-3. J Neurosci. 10 de mayo de 2006;26(19):5083-90.
319. Gómez de Barreda E, Pérez M, Gómez Ramos P, de Cristobal J, Martín-Maestro P, Morán A, et al. Tau-knockout mice show reduced GSK3-induced hippocampal degeneration and learning deficits. Neurobiol Dis. marzo de 2010;37(3):622-9.
320. Pérez M, Hernández F, Lim F, Díaz-Nido J, Avila J. Chronic lithium treatment decreases mutant tau protein aggregation in a transgenic mouse model. J Alzheimers Dis. agosto de 2003;5(4):301-8.
321. Noble W, Planel E, Zehr C, Olm V, Meyerson J, Suleman F, et al. Inhibition of glycogen synthase kinase-3 by lithium correlates with reduced tauopathy and degeneration in vivo. Proc Natl Acad Sci USA. 10 de mayo de 2005;102(19):6990-5.
322. Plattner F, Angelo M, Giese KP. The roles of cyclin-dependent kinase 5 and glycogen synthase kinase 3 in tau hyperphosphorylation. J Biol Chem. 1 de septiembre de 2006;281(35):25457-65.
323. Caccamo A, Oddo S, Tran LX, LaFerla FM. Lithium reduces tau phosphorylation but not A beta or working memory deficits in a transgenic model with both plaques and tangles. Am J Pathol. mayo de 2007;170(5):1669-75.
324. Nakashima H, Ishihara T, Suguimoto P, Yokota O, Oshima E, Kugo A, et al. Chronic lithium treatment decreases tau lesions by promoting ubiquitination in a mouse model of tauopathies. Acta Neuropathol. diciembre de 2005;110(6):547-56.
325. Rockenstein E, Torrance M, Adame A, Mante M, Bar-on P, Rose JB, et al. Neuroprotective effects of regulators of the glycogen synthase kinase-3beta signaling pathway in a transgenic model of Alzheimer’s disease are associated with reduced amyloid precursor protein phosphorylation. J Neurosci. 21 de febrero de 2007;27(8):1981-91.
326. Alon LT, Pietrokovski S, Barkan S, Avrahami L, Kaidanovich-Beilin O, Woodgett JR, et al. Selective loss of glycogen synthase kinase-3α in birds reveals distinct roles for GSK-3 isozymes in tau phosphorylation. FEBS Lett. 20 de abril de 2011;585(8):1158-62.

145
327. Tolosa E, Litvan I, Höglinger GU, Burn D, Lees A, Andrés MV, et al. A phase 2 trial of the GSK-3 inhibitor tideglusib in progressive supranuclear palsy. Mov Disord. abril de 2014;29(4):470-8.
328. Lovestone S, Boada M, Dubois B, Hüll M, Rinne JO, Huppertz H-J, et al. A phase II trial of tideglusib in Alzheimer’s disease. J Alzheimers Dis. 2015;45(1):75-88.
329. Takashima A, Noguchi K, Sato K, Hoshino T, Imahori K. Tau protein kinase I is essential for amyloid beta-protein-induced neurotoxicity. Proc Natl Acad Sci USA. 15 de agosto de 1993;90(16):7789-93.
330. Hu S, Begum AN, Jones MR, Oh MS, Beech WK, Beech BH, et al. GSK3 inhibitors show benefits in an Alzheimer’s disease (AD) model of neurodegeneration but adverse effects in control animals. Neurobiol Dis. febrero de 2009;33(2):193-206.
331. Tackenberg C, Brandt R. Divergent pathways mediate spine alterations and cell death induced by amyloid-beta, wild-type tau, and R406W tau. J Neurosci. 18 de noviembre de 2009;29(46):14439-50.
332. Sofola O, Kerr F, Rogers I, Killick R, Augustin H, Gandy C, et al. Inhibition of GSK-3 ameliorates Abeta pathology in an adult-onset Drosophila model of Alzheimer’s disease. PLoS Genet. septiembre de 2010;6(9).
333. Aplin AE, Jacobsen JS, Anderton BH, Gallo JM. Effect of increased glycogen synthase kinase-3 activity upon the maturation of the amyloid precursor protein in transfected cells. Neuroreport. 10 de febrero de 1997;8(3):639-43.
334. Sun X, Sato S, Murayama O, Murayama M, Park J-M, Yamaguchi H, et al. Lithium inhibits amyloid secretion in COS7 cells transfected with amyloid precursor protein C100. Neurosci Lett. 15 de marzo de 2002;321(1-2):61-4.
335. Ryder J, Su Y, Liu F, Li B, Zhou Y, Ni B. Divergent roles of GSK3 and CDK5 in APP processing. Biochem Biophys Res Commun. 26 de diciembre de 2003;312(4):922-9.
336. Su Y, Ryder J, Li B, Wu X, Fox N, Solenberg P, et al. Lithium, a common drug for bipolar disorder treatment, regulates amyloid-beta precursor protein processing. Biochemistry. 8 de junio de 2004;43(22):6899-908.
337. Rezai-Zadeh K, Douglas Shytle R, Bai Y, Tian J, Hou H, Mori T, et al. Flavonoid-mediated presenilin-1 phosphorylation reduces Alzheimer’s disease beta-amyloid production. J Cell Mol Med. marzo de 2009;13(3):574-88.
338. Feyt C, Kienlen-Campard P, Leroy K, N’Kuli F, Courtoy PJ, Brion J-P, et al. Lithium chloride increases the production of amyloid-beta peptide independently from its inhibition of glycogen synthase kinase 3. J Biol Chem. 30 de septiembre de 2005;280(39):33220-7.

146
339. Jaworski T, Dewachter I, Lechat B, Gees M, Kremer A, Demedts D, et al. GSK-3α/β kinases and amyloid production in vivo. Nature. 8 de diciembre de 2011;480(7376):E4-5; discussion E6.
340. Clark CM, Ewbank DC. Performance of the dementia severity rating scale: a caregiver questionnaire for rating severity in Alzheimer disease. Alzheimer Dis Assoc Disord. 1996;10(1):31-9.
341. Pfeffer RI, Kurosaki TT, Harrah CH, Chance JM, Filos S. Measurement of functional activities in older adults in the community. J Gerontol. mayo de 1982;37(3):323-9.
342. Silverman JM, Breitner JC, Mohs RC, Davis KL. Reliability of the family history method in genetic studies of Alzheimer’s disease and related dementias. Am J Psychiatry. octubre de 1986;143(10):1279-82.
343. Kawas C, Segal J, Stewart WF, Corrada M, Thal LJ. A validation study of the Dementia Questionnaire. Arch Neurol. septiembre de 1994;51(9):901-6.
344. American Psychiatric Association, American Psychiatric Association, and Task Force on DSM-IV (1994). Diagnostic and statistical manual of mental disorders: DSM-IV. (Washington, DC: American Psychiatric Association)
345. Albert MS, Moss MB, Tanzi R, Jones K. Preclinical prediction of AD using neuropsychological tests. J Int Neuropsychol Soc. julio de 2001;7(5):631-9.
346. Chen P, Ratcliff G, Belle SH, Cauley JA, DeKosky ST, Ganguli M. Patterns of cognitive decline in presymptomatic Alzheimer disease: a prospective community study. Arch Gen Psychiatry. septiembre de 2001;58(9):853-8.
347. Saxton J, Lopez OL, Ratcliff G, Dulberg C, Fried LP, Carlson MC, et al. Preclinical Alzheimer disease: neuropsychological test performance 1.5 to 8 years prior to onset. Neurology. 28 de diciembre de 2004;63(12):2341-7.
348. Berlau DJ, Corrada MM, Head E, Kawas CH. APOE epsilon2 is associated with intact cognition but increased Alzheimer pathology in the oldest old. Neurology. 3 de marzo de 2009;72(9):829-34.
349. Thal DR, Capetillo-Zarate E, Del Tredici K, Braak H. The development of amyloid beta protein deposits in the aged brain. Sci Aging Knowledge Environ. 8 de marzo de 2006;2006(6):re1.
350. Jellinger KA, Attems J. Incidence of cerebrovascular lesions in Alzheimer’s disease: a postmortem study. Acta Neuropathol. enero de 2003;105(1):14-7.

147
351. Corrada MM, Paganini-Hill A, Berlau DJ, Kawas CH. Apolipoprotein E genotype, dementia, and mortality in the oldest old: the 90+ Study. Alzheimers Dement. enero de 2013;9(1):12-8.
352. Wilson RS, Yu L, Trojanowski JQ, Chen E-Y, Boyle PA, Bennett DA, et al. TDP-43 pathology, cognitive decline, and dementia in old age. JAMA Neurol. noviembre de 2013;70(11):1418-24.
353. Tsien JZ, Chen DF, Gerber D, Tom C, Mercer EH, Anderson DJ, et al. Subregion- and cell type-restricted gene knockout in mouse brain. Cell. 27 de diciembre de 1996;87(7):1317-26.
354. Ruzankina Y, Pinzon-Guzman C, Asare A, Ong T, Pontano L, Cotsarelis G, et al. Deletion of the developmentally essential gene ATR in adult mice leads to age-related phenotypes and stem cell loss. Cell Stem Cell. 7 de junio de 2007;1(1):113-26.
355. Schorpp M, Jäger R, Schellander K, Schenkel J, Wagner EF, Weiher H, et al. The human ubiquitin C promoter directs high ubiquitous expression of transgenes in mice. Nucleic Acids Res. 1 de mayo de 1996;24(9):1787-8.
356. Games D, Adams D, Alessandrini R, Barbour R, Berthelette P, Blackwell C, et al. Alzheimer-type neuropathology in transgenic mice overexpressing V717F beta-amyloid precursor protein. Nature. 9 de febrero de 1995;373(6514):523-7.
357. Masliah E, Sisk A, Mallory M, Games D. Neurofibrillary pathology in transgenic mice overexpressing V717F beta-amyloid precursor protein. J Neuropathol Exp Neurol. abril de 2001;60(4):357-68.
358. Chen G, Chen KS, Knox J, Inglis J, Bernard A, Martin SJ, et al. A learning deficit related to age and beta-amyloid plaques in a mouse model of Alzheimer’s disease. Nature. 21 de diciembre de 2000;408(6815):975-9.
359. Dodart JC, Meziane H, Mathis C, Bales KR, Paul SM, Ungerer A. Behavioral disturbances in transgenic mice overexpressing the V717F beta-amyloid precursor protein. Behav Neurosci. octubre de 1999;113(5):982-90.
360. Kobayashi DT, Chen KS. Behavioral phenotypes of amyloid-based genetically modified mouse models of Alzheimer’s disease. Genes, Brain and Behavior. 1 de abril de 2005;4(3):173-96.
361. Hurtado DE, Molina-Porcel L, Iba M, Aboagye AK, Paul SM, Trojanowski JQ, et al. A{beta} accelerates the spatiotemporal progression of tau pathology and augments tau amyloidosis in an Alzheimer mouse model. Am J Pathol. octubre de 2010;177(4):1977-88.

148
362. Lee EB, Leng LZ, Zhang B, Kwong L, Trojanowski JQ, Abel T, et al. Targeting amyloid-beta peptide (Abeta) oligomers by passive immunization with a conformation-selective monoclonal antibody improves learning and memory in Abeta precursor protein (APP) transgenic mice. J Biol Chem. 17 de febrero de 2006;281(7):4292-9.
363. Carroll JC, Iba M, Bangasser DA, Valentino RJ, James MJ, Brunden KR, et al. Chronic stress exacerbates tau pathology, neurodegeneration, and cognitive performance through a corticotropin-releasing factor receptor-dependent mechanism in a transgenic mouse model of tauopathy. J Neurosci. 5 de octubre de 2011;31(40):14436-49.
364. Boyce-Rustay JM, Holmes A. Genetic inactivation of the NMDA receptor NR2A subunit has anxiolytic- and antidepressant-like effects in mice. Neuropsychopharmacology. noviembre de 2006;31(11):2405-14.
365. Carroll JC, Boyce-Rustay JM, Millstein R, Yang R, Wiedholz LM, Murphy DL, et al. Effects of mild early life stress on abnormal emotion-related behaviors in 5-HTT knockout mice. Behav Genet. enero de 2007;37(1):214-22.
366. Brunden KR, Zhang B, Carroll J, Yao Y, Potuzak JS, Hogan A-ML, et al. Epothilone D improves microtubule density, axonal integrity, and cognition in a transgenic mouse model of tauopathy. J Neurosci. 13 de octubre de 2010;30(41):13861-6.
367. O’Leary TP, Savoie V, Brown RE. Learning, memory and search strategies of inbred mouse strains with different visual abilities in the Barnes maze. Behav Brain Res. 20 de enero de 2011;216(2):531-42.
368. Corrada MM, Brookmeyer R, Berlau D, Paganini-Hill A, Kawas CH. Prevalence of dementia after age 90: results from the 90+ study. Neurology. 29 de julio de 2008;71(5):337-43.
369. Hebert LE, Weuve J, Scherr PA, Evans DA. Alzheimer disease in the United States (2010-2050) estimated using the 2010 census. Neurology. 7 de mayo de 2013;80(19):1778-83.
370. Giannakopoulos P, Hof PR, Michel JP, Guimon J, Bouras C. Cerebral cortex pathology in aging and Alzheimer’s disease: a quantitative survey of large hospital-based geriatric and psychiatric cohorts. Brain Res Brain Res Rev. octubre de 1997;25(2):217-45.
371. Nelson PT, Head E, Schmitt FA, Davis PR, Neltner JH, Jicha GA, et al. Alzheimer’s disease is not «brain aging»: neuropathological, genetic, and epidemiological human studies. Acta Neuropathol. mayo de 2011;121(5):571-87.

149
372. Mukaetova-Ladinska EB, Garcia-Siera F, Hurt J, Gertz HJ, Xuereb JH, Hills R, et al. Staging of cytoskeletal and beta-amyloid changes in human isocortex reveals biphasic synaptic protein response during progression of Alzheimer’s disease. Am J Pathol. agosto de 2000;157(2):623-36.
373. Aisen PS. Pre-dementia Alzheimer’s trials: overview. J Nutr Health Aging. abril de 2010;14(4):294.
374. Jack CR, Knopman DS, Jagust WJ, Petersen RC, Weiner MW, Aisen PS, et al. Tracking pathophysiological processes in Alzheimer’s disease: an updated hypothetical model of dynamic biomarkers. Lancet Neurol. febrero de 2013;12(2):207-16.
375. Gómez-Isla T, Price JL, McKeel DW, Morris JC, Growdon JH, Hyman BT. Profound loss of layer II entorhinal cortex neurons occurs in very mild Alzheimer’s disease. J Neurosci. 15 de julio de 1996;16(14):4491-500.
376. Honer WG. Pathology of presynaptic proteins in Alzheimer’s disease: more than simple loss of terminals. Neurobiol Aging. diciembre de 2003;24(8):1047-62.
377. Sokolow S, Luu SH, Nandy K, Miller CA, Vinters HV, Poon WW, et al. Preferential accumulation of amyloid-beta in presynaptic glutamatergic terminals (VGluT1 and VGluT2) in Alzheimer’s disease cortex. Neurobiol Dis. enero de 2012;45(1):381-7.
378. Nieweg K, Andreyeva A, van Stegen B, Tanriöver G, Gottmann K. Alzheimer’s disease-related amyloid-β induces synaptotoxicity in human iPS cell-derived neurons. Cell Death Dis. 2015;6:e1709.
379. Mitew S, Kirkcaldie MTK, Dickson TC, Vickers JC. Altered synapses and gliotransmission in Alzheimer’s disease and AD model mice. Neurobiol Aging. octubre de 2013;34(10):2341-51.
380. Medina M, Avila J. Understanding the relationship between GSK-3 and Alzheimer’s disease: a focus on how GSK-3 can modulate synaptic plasticity processes. Expert Rev Neurother. mayo de 2013;13(5):495-503.
381. Lo Monte F, Kramer T, Gu J, Anumala UR, Marinelli L, La Pietra V, et al. Identification of glycogen synthase kinase-3 inhibitors with a selective sting for glycogen synthase kinase-3α. J Med Chem. 10 de mayo de 2012;55(9):4407-24.
382. Lo Monte F, Kramer T, Gu J, Brodrecht M, Pilakowski J, Fuertes A, et al. Structure-based optimization of oxadiazole-based GSK-3 inhibitors. Eur J Med Chem. marzo de 2013;61:26-40.
383. Forlenza OV, Diniz BS, Radanovic M, Santos FS, Talib LL, Gattaz WF. Disease-modifying properties of long-term lithium treatment for amnestic mild

150
cognitive impairment: randomised controlled trial. Br J Psychiatry. mayo de 2011;198(5):351-6.
384. Hampel H, Ewers M, Bürger K, Annas P, Mörtberg A, Bogstedt A, et al. Lithium trial in Alzheimer’s disease: a randomized, single-blind, placebo-controlled, multicenter 10-week study. J Clin Psychiatry. junio de 2009;70(6):922-31.

151

152
VIII. ABREVIATIONS

153
ABBREVIATIONS
80+ 80 years old and older 90+ 90 years old and older AAV2/1 recombinant adeno-associated virus 2/1 Aβ β-amyloid peptides Aβ40 40 amino acid form of β-amyloid peptides Aβ42 42 amino acid form of β-amyloid peptides AD Alzheimer’s disease ADL Activities of daily living AICD Amyloid precursor protein intracellular domain ANOVA Analysis of variance APOE Apolipoprotein E APP Amyloid precursor protein αCTF α-C-Terminal fragment βCTF β-C-Terminal fragment CA1 Region 1 of the cornus ammonis of hippocampus CAMKIIα Calcium/calmodulin-dependent protein kinase II CDK-5 cyclin-dependent kinase 5 CIND Cognitive impairment but no dementia CKO Conditional knockout CNS Central nervous system CRE Causes recombination protein CRE-ERT2 Cre protein fused to a triple mutant form of the human estrogen
receptor CVD Cerebrovascular disease DNA Deoxyribonucleic acid ELISA Enzyme-linked immunosorbent assay GAPDH Glyceraldehydes 3-phosphate dehydrogenase GSK-3 Glycogen synthase kinase 3 GSK-3 Glycogen synthase kinase 3 isoform GSK-3 Glycogen synthase kinase 3 isoform GSK-32 Splicing variant of glycogen synthase kinase 3 isoform HS Hippocampal sclerosis KD Knockdown KO Knockout loxP locus of cross over in P1 mAb monoclonal antibody MAPT Microtubule-associated protein tau gene MCI Mild cognitive impairment MMSE Mini-Mental State Examination MT Microtubule NFT Neurofibrillary tangles NMDA N-methyl-D-aspartate

154
PDAPP APP minigene harboring the V717F mutation, driven by the platelet-derived growth factor promoter
PHF paired helical filament p-S21-GSK-3 Glycogen synthase kinase3 isoform phophorylated at serine 21p-S9-GSK-3 Glycogen synthase kinase3 isoform phosphorylated at serine 9 p-Y279-GSK-3 Glycogen synthase kinase3 isoform phosphorylated at serine
279p-Y216-GSK-3 Glycogen synthase kinase3 isoform phosphorylated at serine
216 PSEN1 Presenilin-1 PSEN2 Presenilin-2 rAAV2/1 Recombinant adeno-associated virus 2/1 RIPA Radioimmunoprecipitation assay buffer RIRs Relative immunointensity ratios shRNA Short/small hairpin ribonucleic acid shRNA- shRNA construct that specifically reduces GSK-3 expression shRNA- shRNA construct that specifically reduces GSK-3 expression SNAP soluble N-ethylmaleimide sensitive factor attachement protein SNARE soluble N-ethylmaleimide sensitive factor attachement receptor SP Senile plaques SV2 synaptic vesicle glycoprotein 2 SV2A synaptic vesicle glycoprotein 2 isoform A TDP-43 43-kDa transactive response sequence DNA-binding protein UBC Human Ubiquitin C promoter VGLUT vesicular glutamate transporter VGLUT1 vesicular glutamate transporter isoform 1 WB western blot WT wild type

155

156
IX. ACKNOWLEDGEMENTS

157
ACKNOWLEDGEMENTS / AGRADECIMIENTOS
I am very grateful to Virginia Lee and John Trojanowski for giving me the opportunity
to join their lab, for their guidance and all the support they gave me, for their inspiring
passion for science, and for creating such a wonderful and enriching environment
that made me grow more than I anticipated.
Special thanks to David for sharing the GSK-3 project with me and for all the
techniques he taught me. Thanks to JR for making the 90+ paper possible despite
the distance. Thanks to Awo, Caryn and Kevin for their hard work and technical
support. Thanks to Jenna Carroll for sharing her expertise in behavior and for all her
edits on the original paper of GSK-3. Thanks to Maria M.Corrada for her statistical
analysis and all the edits into the original paper of The 90+ Study, and to Claudia H.
Kawas for letting me work with this amazing cohort of The 90+ Study. Thanks to all
the students that helped us: Amanda, Brigid, Erin, Stylianos and Nick, it was very
refreshing and motivating having them around. Thanks to all the CNDR members:
Sue, Terry, Linda, Jen, Dawn, Rob, Amy, Cindy, Kevin, Michiyo, Dave, Scott, Lionel,
Paola, Anna, Bin, Vicky, Kelvin, Laura V, Hide, Jing, Selsuk, Johannes, Alex, Kurt,
Hiro, Felix, Chi, Jin, Nuria, Charlotte, Adam, Susana and Jon for helping me through
all these years, I have learnt so much from all of them. Gracias a “Juno” por su
inteligencia emocional y guía. Mi más profundo agradecimiento a María, mi “coach” y
editora personal, por ser mi puente y embajadora en Filadelfia, y por todas las cosas
positivas que me ha aportado personal y profesionalmente en la última década. Y a
mi querida Aitziber, compañera de residencia, tesis, aventuras y desventuras, por
pensar “out of the box”, por su coraje y por estar siempre cerca a pesar de la
distancia.
Quisiera agradecer a Teresa Gómez Isla y Rafael Blesa por crear la Unidad de
Memoria del Hospital de Sant Pau, darme la oportunidad de formarme clínicamente y
de iniciarme en la investigación básica. Agradecer a Alberto Lleó y Jordi Clarimón
por todo lo que me han enseñado, por su guía y continuo apoyo que tanto ha
significado para mí. Gracias a mis primeros “básicos” Cristina, Jose, y Lidia por todo

158
lo que pacientemente me enseñaron, y especialmente a Cristina por sacar el tiempo
de donde no hay y revisar esta tesis. Gracias a la parte clínica de la unidad de
memoria Isabel, Estela, Gemma y Belén, por su ayuda y lo mucho que aprendí de
ellas. Quisiera agradecer a Toni Escartín todo su apoyo todos estos años y a Joan
Martí por enseñarme a explorar, introducirme en el pensamiento crítico y en la
investigación clínica. Gracias también al resto de “neuros” (Mercè, Dani, Lola,
Roberto, Alex, Sergi, Marta, Jordi y Pago) por su apoyo y por compartir esta pasión
por nuestra especialidad que ha hecho mi residencia tan estimulante.
Quiero agradecer al Instituto Carlos III y a la fundación Caja Madrid su apoyo
económico durante la realización de esta tesis. Thanks to the Marian S. Ware
Program for Drug Discovery and grants from the National Institutes of Health
(AG11542, AG17586, T32-GM07229, T32-AG000255, AG10124, AG16573,
AG21055, P50-AG16573, MH64045) for funding these projects.
Thanks to the participants of the 90+Study and their families for their generosity.
Agradecer a mis pacientes y a sus familiares que a lo largo de los años han
depositado su confianza en mí por ser mi principal fuente de motivación.
Y para acabar, quiero agradecer a mi familia su apoyo y por hacerme sentir tan
querida y afortunada. Nada de esto tendría sentido sin vosotros.

159

160
X. APPENDIX

161
Appendix 1. “Perforant path synaptic loss correlates with cognitive impairment and
Alzheimer´s disease in the oldest-old. Robinson JL, Molina-Porcel L, Corrada MM,
Raible K, Lee EB, Lee VM, Kawas CH, Trojanowski JQ. Brain. 2014 Sep;137(Pt
9):2578-87.
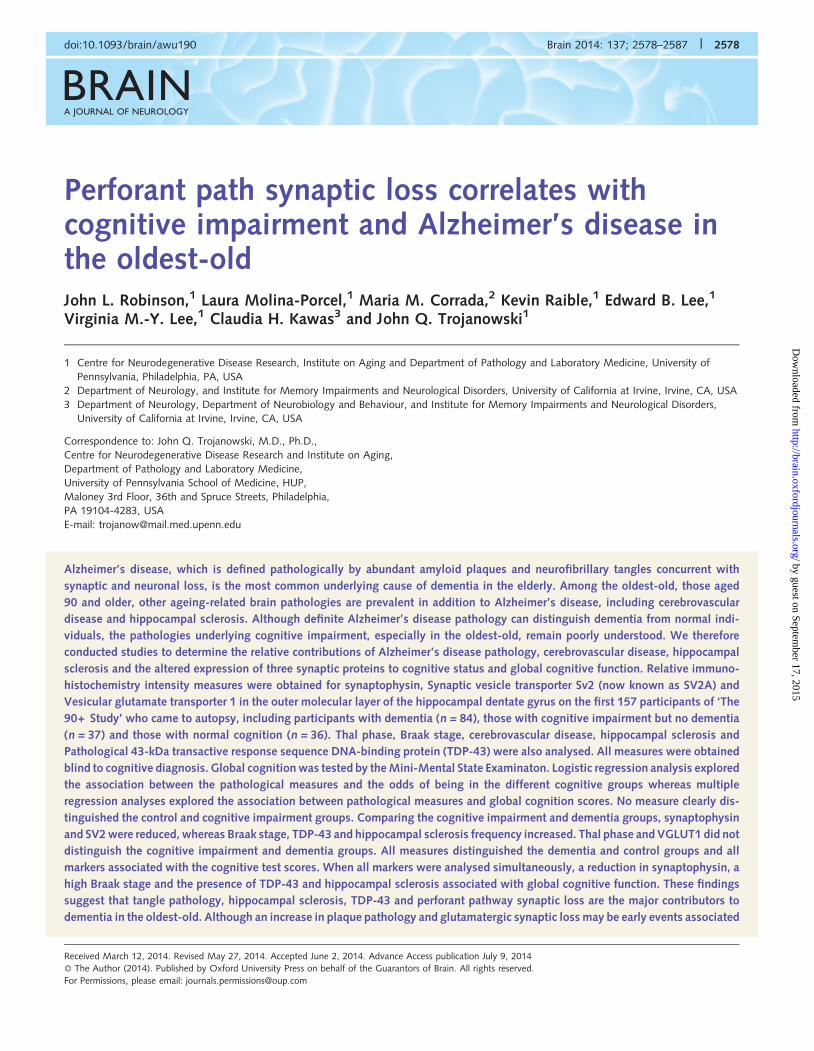
BRAINA JOURNAL OF NEUROLOGY
Perforant path synaptic loss correlates withcognitive impairment and Alzheimer’s disease inthe oldest-oldJohn L. Robinson,1 Laura Molina-Porcel,1 Maria M. Corrada,2 Kevin Raible,1 Edward B. Lee,1
Virginia M.-Y. Lee,1 Claudia H. Kawas3 and John Q. Trojanowski1
1 Centre for Neurodegenerative Disease Research, Institute on Aging and Department of Pathology and Laboratory Medicine, University of
Pennsylvania, Philadelphia, PA, USA
2 Department of Neurology, and Institute for Memory Impairments and Neurological Disorders, University of California at Irvine, Irvine, CA, USA
3 Department of Neurology, Department of Neurobiology and Behaviour, and Institute for Memory Impairments and Neurological Disorders,
University of California at Irvine, Irvine, CA, USA
Correspondence to: John Q. Trojanowski, M.D., Ph.D.,
Centre for Neurodegenerative Disease Research and Institute on Aging,
Department of Pathology and Laboratory Medicine,
University of Pennsylvania School of Medicine, HUP,
Maloney 3rd Floor, 36th and Spruce Streets, Philadelphia,
PA 19104-4283, USA
E-mail: [email protected]
Alzheimer’s disease, which is defined pathologically by abundant amyloid plaques and neurofibrillary tangles concurrent with
synaptic and neuronal loss, is the most common underlying cause of dementia in the elderly. Among the oldest-old, those aged
90 and older, other ageing-related brain pathologies are prevalent in addition to Alzheimer’s disease, including cerebrovascular
disease and hippocampal sclerosis. Although definite Alzheimer’s disease pathology can distinguish dementia from normal indi-
viduals, the pathologies underlying cognitive impairment, especially in the oldest-old, remain poorly understood. We therefore
conducted studies to determine the relative contributions of Alzheimer’s disease pathology, cerebrovascular disease, hippocampal
sclerosis and the altered expression of three synaptic proteins to cognitive status and global cognitive function. Relative immuno-
histochemistry intensity measures were obtained for synaptophysin, Synaptic vesicle transporter Sv2 (now known as SV2A) and
Vesicular glutamate transporter 1 in the outer molecular layer of the hippocampal dentate gyrus on the first 157 participants of ‘The
90+ Study’ who came to autopsy, including participants with dementia (n = 84), those with cognitive impairment but no dementia
(n = 37) and those with normal cognition (n = 36). Thal phase, Braak stage, cerebrovascular disease, hippocampal sclerosis and
Pathological 43-kDa transactive response sequence DNA-binding protein (TDP-43) were also analysed. All measures were obtained
blind to cognitive diagnosis. Global cognition was tested by the Mini-Mental State Examinaton. Logistic regression analysis explored
the association between the pathological measures and the odds of being in the different cognitive groups whereas multiple
regression analyses explored the association between pathological measures and global cognition scores. No measure clearly dis-
tinguished the control and cognitive impairment groups. Comparing the cognitive impairment and dementia groups, synaptophysin
and SV2 were reduced, whereas Braak stage, TDP-43 and hippocampal sclerosis frequency increased. Thal phase and VGLUT1 did not
distinguish the cognitive impairment and dementia groups. All measures distinguished the dementia and control groups and all
markers associated with the cognitive test scores. When all markers were analysed simultaneously, a reduction in synaptophysin, a
high Braak stage and the presence of TDP-43 and hippocampal sclerosis associated with global cognitive function. These findings
suggest that tangle pathology, hippocampal sclerosis, TDP-43 and perforant pathway synaptic loss are the major contributors to
dementia in the oldest-old. Although an increase in plaque pathology and glutamatergic synaptic loss may be early events associated
doi:10.1093/brain/awu190 Brain 2014: 137; 2578–2587 | 2578
Received March 12, 2014. Revised May 27, 2014. Accepted June 2, 2014. Advance Access publication July 9, 2014
� The Author (2014). Published by Oxford University Press on behalf of the Guarantors of Brain. All rights reserved.
For Permissions, please email: [email protected]
by guest on September 17, 2015
http://brain.oxfordjournals.org/D
ownloaded from

with cognitive impairment, we conclude that those with cognitive impairment, but no dementia, are indistinguishable from cogni-
tively normal subjects based on the measures reported here.
Keywords: Alzheimer’s disease; Braak stage; Thal phase; synaptic loss; oldest-old; cognitive impairment
Abbreviations: CIND = cognitively impaired no dementia; MMSE = Mini-Mental State Examination; RIR = relative immunointensityratio
IntroductionAlong with tangles and plaques, Alzheimer’s disease is character-
ized by the loss of neurons and their synapses. Indeed, significant
synapse loss has been documented in all brain regions affected by
Alzheimer’s disease pathology (DeKosky et al., 1996) and reduc-
tions in the number of presynaptic and synaptic proteins may be
the most consistent progression marker of Alzheimer’s disease as
the burden of plaques and tangles grows and neurons continue to
degenerate (Beeri et al., 2012). For example, significant reductions
in synaptophysin and VGLUT1 were found in both the parietal and
occipital cortices of Alzheimer’s disease brains in one study (Kirvell
et al., 2006) and our group previously reported a decrease in
synaptophysin in the frontal cortex of dementia patients (Head
et al., 2009). Nonetheless, the relationship between anatomy, syn-
aptic proteins and Alzheimer’s disease pathology is complex
(Honer, 2003). In our previous study, individuals with cognitive
impairment, but no dementia (CIND) had increases in synaptophy-
sin whereas others have reported a significant decrease in the
hippocampal levels of synaptophysin, even in CIND individuals
(Sze et al., 2000).
Because it has long been known that changes in the perforant
pathway are associated with memory impairment (Hyman et al.,
1986; Senut et al., 1991), we hypothesized that perforant path-
way synaptic changes may be one of the major correlates of cog-
nitive impairment in Alzheimer’s disease. The perforant pathway
arises from neurons in layers 2 and 3 of the entorhinal cortex and
projects into the outer molecular layer of the hippocampal dentate
gyrus. Importantly, neurons and synapses in the inner molecular
layer remain unaffected by perforant pathway loss in the outer
molecular layer. There are several markers of synaptic health that
are reliably detected by immunohistochemistry in sections of CNS
tissues including synaptophysin, SV2 and VGLUT1.
Synaptophysin is involved in multiple, important aspects of syn-
aptic vesicle exo- and endocytosis (Valtorta et al., 2004). SV2,
besides being a ubiquitous presynaptic protein, is the binding
site for the antiepileptic drug levetiracetam, a drug shown to im-
prove cognition in CIND individuals (Bakker et al., 2012). VGLUT1
mediates the accumulation of glutamate—the major excitatory
neurotransmitter—into secretory vesicles in the neocortex and
hippocampus (El Mestikawy et al., 2011).
Individuals in the ‘The 90+ Study’, a population-based cohort of
nonagenarians, have a high prevalence of cognitive impairment (Peltz
et al., 2012) allowing for the assessment at autopsy of a significant
number of CIND individuals. This investigation is a cross-sectional
clinical-pathological correlation study involving the first 157 individ-
uals to come to autopsy. For our analysis, we compared measures of
perforant pathway synaptic health across each cognitive group. Since
the prevalence of severe Alzheimer’s disease pathology is reduced in
nonagenarians, whereas the proportion with hippocampal sclerosis
and cerebrovascular disease pathology increases (Nelson et al.,
2011b), we also measured the underlying pathologies affecting
these individuals, specifically their Braak stage, Thal phase, and the
presence of hippocampal sclerosis and cerebrovascular disease. Our
aim was to understand both the synaptic and pathological changes
underlying cognitive impairment and dementia.
Materials and methodsStudy participants were the first 157 individuals to come to autopsy from
the 90+ Study, a longitudinal population-based study of ageing and
dementia in people aged 90 and older who are survivors of the Leisure
World Cohort Study (Corrada et al., 2012). Briefly, individuals live at
home as well as in institutions, and represent the full spectrum of
health and cognitive abilities. All 90+ Study participants had evaluations
every 6 months including a neurological examination by a trained phys-
ician or nurse practitioner and a full neuropsychological battery that
included the Mini-Mental State Examination (MMSE). Relevant medical
history, medication use, and demographic information were obtained
from the participants or their informants. Medical records, including
brain imaging evaluations were obtained from the participant’s phys-
icians. Information about cognitive (Clark and Ewbank, 1996) and func-
tional abilities (Pfeffer et al., 1982) were obtained from informants in
frequent contact with the participants. To inquire about the onset of
cognitive problems, the Dementia Questionnaire (Silverman et al.,
1986; Kawas et al., 1994) interview was conducted over the phone
with informants of participants with evidence of cognitive impairment.
Shortly after death, the Dementia Questionnaire was done with the de-
cedent’s informant to inquire about the participant’s condition since the
last evaluation. The Institutional Review Board of the University of
California, Irvine, approved all procedures and all participants or their
surrogates gave written informed consent.
Determination of cognitive statusAfter a participant’s death, all available information was reviewed and
discussed during a multidisciplinary consensus diagnostic conference led
by ‘The 90+ Study’ principal investigator (C.K.). Participants were clas-
sified as normal, CIND, or as having dementia. Dementia diagnosis was
established using Diagnostic and Statistical Manual of Mental Disorders
4th Edition criteria (American Psychiatric Association et al., 1994). CIND
is defined by initial cognitive impairments such as deficits in episodic
memory (Albert et al., 2001), executive dysfunction (Chen et al.,
2001), naming difficulties or other aphasias (Saxton et al., 2004).
Participants were classified as CIND if they showed cognitive or func-
tional deficits that were not severe enough to meet criteria for dementia.
All cognitive diagnoses were made blinded to pathological evaluations.
Synaptic loss and cognitive impairment in the 90+ Brain 2014: 137; 2578–2587 | 2579
by guest on September 17, 2015
http://brain.oxfordjournals.org/D
ownloaded from

NeuropathologyAll autopsies were performed at the University of California, Irvine. After
weighing the whole brain and gross inspection, one hemisphere was
dissected as previously described (Berlau et al., 2009). Six-micrometre
thick, coronal sections of mid-frontal cortex superior temporal cortex,
anterior hippocampus, amygdala, substantia nigra and medulla oblon-
gata were cut. All histological staining, immunohistochemistry and
microscopic analyses were performed in the Centre for
Neurodegenerative Disease Research (CNDR) at the University of
Pennsylvania as described (Robinson et al., 2011). Briefly, sections
were subjected to immunohistochemistry using the avidin-biotin com-
plex detection method (VECTASTAIN� ABC kit; Vector Laboratories)
with ImmPACTTM diaminobenzidine peroxidase substrate (Vector
Laboratories) as the chromogen using monoclonal antibodies to phos-
phorylated tau (mouse PHF1; 1:1K, gift of Dr Peter Davies, Manhasset,
NY), b-amyloid (mouse NAB228; 1:15K; generated in CNDR), TARDBP
(rat 409/410; 1:500; gift of Dr Manuela Neumann, Zurich, Switzerland),
SV2 (mouse SV2; 1:20K; DSH Iowa), synaptophysin (mouse MAB368;
1:1K; Millipore) and VGLUT1 (Guinea pig VGLUT1; 1:7.5K; SYSY).
Topographical Braak staging (stages I–VI) was assigned from PHF1
stained slides (n = 157) (Braak et al., 2006). Thal phases were deter-
mined from NAB228 stained hippocampal slides: phase 0–1, 2, 3 and 4
(n = 150) (Thal et al., 2006). TARDBP inclusions and neurites were
determined from 409/410 stained hippocampal slides: presence/
absence.
The assessment of cerebrovascular disease pathology (n = 108) and
hippocampal sclerosis (n = 155) was determined from Harris haematoxy-
lin and eosin stained mid-frontal cortex, superior temporal cortex, hippo-
campus, amygdala, substantia nigra and medulla sections. Hippocampal
sclerosis was assessed as follows: 0 for no gliosis or neuronal loss; 1+ for
mild gliosis or neuronal loss in the CA1 or subiculum; 2+ for moderate
or severe gliosis and neuronal loss consistent with definite hippocampal
sclerosis. Cerebrovascular lesions such as infarcts, micro-infarcts or
micro-bleeds along with cerebral amyloid angiopathy and hippocampal
sclerosis were used to generate cerebrovascular disease pathology scores
following a simplified staging of Jellinger and Attems as follows: 0 for
cases without major infarcts, hippocampal sclerosis, cerebral amyloid
angiopathy or other lesions; 1+ for minimal vascular pathology cases
with mild to moderate cerebral amyloid angiopathy and/or 1–2 small
lacunes; 2+ for moderate vascular pathology cases with severe cerebral
amyloid angiopathy and/or hippocampal sclerosis and/or major infarcts
(Jellinger and Attems, 2003).
Synaptic relative immunointensity ratios (RIRs) were obtained by the
following process. A preliminary study of synaptic and presynaptic pro-
teins was done including antibodies to synaptophysin, SV2, VGLUT1,
synataxin 1, VAMP2, synapsin 1, synaptotagmin 1, dynamin, VGAT,
PSD95 and GLUR1; obvious outer molecular layer synaptic loss was
observed on slides obtained from patients with Alzheimer’s disease
when stained with antibodies to synaptophysin, SV2 and VGLUT1. For
this study, hippocampal slides were stained for synaptophysin (n = 149),
SV2 (n = 151) or VGLUT1 (n = 152). Sections were scanned (Nikon DS-
Fi2 camera, gain 1.2, exposure 15 ms) at �10 on a Nikon Eclipse TE2000
microscope using NIS Elements software (Nikon Instruments, Inc.).
ImageJ 1.47t (National Institutes of Health) was used for analysis.
Mean pixel intensities of the inner- and outer molecular layer of the
dentate gyrus just under CA1 were captured (Fig. 1). Raw values on
an 8-bit scale (range of 45–185) were normalized to a blank area for
each slide (median value 41). Synaptic RIRs of the outer/inner molecular
layer were calculated from (outer molecular layer � blank) / (inner mo-
lecular layer � blank) for each case. To verify the repeatability of our
measurements, 10 random cases were stained twice by the synaptic
antibodies and synaptic RIRs were obtained independently by two re-
searchers (L.M.P., J.L.R.). A K of 0.987 was obtained (Type C intraclass
correlation coefficient).
All pathological diagnoses were done blinded to clinical diagnosis.
Statistical analysisWe compared characteristics of the three cognitive groups: normal,
CIND and dementia using �2 tests for categorical variables and
ANOVA for continuous variables. We used multinomial logistic re-
gression models to determine the association between each individ-
ual neuropathological or synaptic protein measure and cognitive
diagnosis. We report the odds of being in the CIND group
compared to the normal group, the odds of being in the dementia
group compared to the CIND group, and the odds of being in the
dementia group compared to the normal group. Neuropathological
and synaptic protein measures were analysed as continuous vari-
ables in the logistic regression analyses. Separate regression models
were used for each neuropathological and synaptic protein measure.
We also explored the association between the individual neuropatho-
logical or synaptic measures and the MMSE, a measure of global
cognition, using multiple linear regression analyses. Finally, we
analysed the relative contribution of the different pathological
measures to global cognitive scores, by including all synaptic
and pathological measures in a multiple regression model. All regre-
ssion models were adjusted for age at death and gender and
all analyses were performed using SAS version 9.3 (SAS Institute
Inc.).
Results
Subject characteristicsOf the 157 participants of this study, 36 had normal cognition, 37
were diagnosed with CIND and the majority (n = 84) had
dementia (Table 1). The most frequent clinical diagnosis of the par-
ticipants with dementia was Alzheimer’s disease alone (65%) or in
combination with other dementias (21%) followed by vascular de-
mentia (7%) and dementia with Lewy bodies (6%).
Participants had an average age at death of 98 years (range:
94–101 years), were mostly female (71%), and highly educated
(71% had at least a college education). MMSE scores were avail-
able for the majority of individuals within 1 year before death
(Table 1). The overall frequency of the APOE alleles were 14%
for the e2 allele and 22% for the e4 allele. While there was an
increase in the frequency of the e4 allele in the dementia group
(27%) compared to the normal group (21%), this non-significant
increase is consistent with previous work where we found that the
e4 allele no longer plays a role in dementia and mortality at very
old ages (Corrada et al., 2013). Brain weight was non-significantly
lower in the dementia group.
Alzheimer’s disease pathologyIn the normal group, Braak stage (median III; mean 3.3) and Thal
phase (median 1; mean 1.9) scores indicate that Alzheimer’s dis-
ease pathology was present in at least mild to moderate amounts
(Fig. 2D and E). The CIND group presented with similar Braak
2580 | Brain 2014: 137; 2578–2587 J. L. Robinson et al.
by guest on September 17, 2015
http://brain.oxfordjournals.org/D
ownloaded from

stage (median III; mean 3.4) and Thal phase (median 3; mean 2.3)
scores, while Braak stage (median V; mean 4.3) and Thal phase
(median 3; mean 2.6) were more moderate to severe in the de-
mentia group. Higher Braak stages were significantly associated
with higher odds of being in the dementia versus normal group
[odds ratio (OR) = 1.68, P = 0.001] and of being in the dementia
versus CIND group (OR = 1.52, P = 0.02) (Table 2). Higher Thal
phases were associated with higher odds of being in the dementia
versus the normal group (OR = 1.64, P = 0.011) but did not dis-
tinguish between the dementia and CIND groups (P40.15).
Neither Alzheimer’s disease marker distinguished between the
normal and CIND groups.
Higher levels of Alzheimer’s disease plaque and tangle burdens
were significantly associated with lower MMSE scores (Thal phase,
Figure 1 Representative images of synaptic protein immunoreactivity. Synaptic marker immunohistochemistry from two cases shows
distinct staining of the inner molecular layer (highlighted in yellow) and the outer molecular (highlighted in purple) of the hippocampus.
(A–C) The relatively healthy outer molecular layer: (A) synaptophysin, (B) SV2 and (C) VGLUT1 with synaptic ratios 1.19, 1.13 and 0.78,
respectively (note that VGLUT1 is consistently lower than the other two). In contrast, (D–F) represents an individual with severely reduced
outer molecular layer, whose inner molecular layer is preserved: (D) synaptophysin, (E) SV2 and (F) VGLUT1 with synaptic ratios 0.53,
0.74 and 0.56, respectively.
Synaptic loss and cognitive impairment in the 90+ Brain 2014: 137; 2578–2587 | 2581
by guest on September 17, 2015
http://brain.oxfordjournals.org/D
ownloaded from
Laura
Highlight

P = 0.02; Braak stage, P5 0.001). The greatest decreases on the
cognitive tests occurred with the highest plaque and tangle bur-
dens. The mean MMSE score was significantly lower in Thal phase
4 compared to Thal phases 2 and earlier (P5 0.01) and even to
Thal phase 3 (P5 0.05). For Braak stage, the mean MMSE score
was significantly lower in stage VI compared to all the other Braak
stages (P5 0.001), and in stage V compared to stages III and IV
(P50.05).
Hippocampal sclerosis andcerebrovascular diseaseAs the prevalence of hippocampal sclerosis and cerebrovascular
disease pathology increases with age, we investigated what pro-
portion of individuals had these lesions in our cohort. Hippocampal
sclerosis was found in 15% of all individuals, but in only one
individual without dementia. The presence of hippocampal scler-
osis in 28% of those with dementia (23/82) allowed the measure
to significantly distinguish the dementia group from both the
normal (P = 0.003) and CIND (P = 0.002) groups (Table 2).
Cerebrovascular lesions and cerebral amyloid angiopathy were
present in modest amounts in The 90+ Study. Cerebral amyloid
angiopathy was found in 52% (56/108) of the cases whereas
cerebrovascular disease lesions such as infarcts, micro-infarcts or
micro-bleeds were rarer (10%; 11/108). Althogether, 63% of all
individuals had some level of cerebrovascular disease pathology,
including 45% of both the normal and CIND groups and 74% of
the dementia group. Although the prevalence of cerebrovascular
disease was not different between the normal and CIND groups
(Fig. 2F), people with higher levels were more likely to be in the
dementia group compared to both the normal and CIND groups
(both P = 0.009) (Table 2).
TDP-43TDP-43 is a common co-morbidity and may associate with a more
rapid cognitive decline in the ageing brain (Wilson et al., 2013). In
Table 1 Characteristics of The 90+ Study participants
Characteristic All subjects Normal CIND Dementia(n = 157) (n = 36) (n = 37) (n = 84)
Mean (SD)
Age at death 98.0 (3.6) 97.8 (2.5) 98.4 (4.0) 97.7 (3.7)
Last MMSE scorea 18.1 (10.1) 27.8 (1.6) 23.7 (5.4) 11.2 (8.6)
MMSE interval to death (months) 7.5 (7.7) 5.9 (3.3) 6.5 (4.5) 8.6 (9.8)
Brain weight (g) 1127 (121) 1179 (104) 1123 (125) 1104 (121)
n (%)
APOE E4b
0 alleles 119 (78) 27 (79) 33 (89) 59 (73)
5 1 alleles 33 (22) 7 (21) 4 (11) 22 (27)
APOE E2
0 alleles 131 (86) 29 (85) 31 (84) 71 (88)
5 1 alleles 21 (14) 5 (15) 6 (16) 10 (12)
Gender
Male 45 (29) 15 (42) 10 (27) 20 (24)
Female 112 (71) 21 (58) 27 (73) 64 (76)
Educationc
4High school 45 (29) 7 (19) 8 (22) 30 (36)
Any college 73 (47) 16 (44) 20 (54) 37 (45)
Any graduate school 38 (24) 13 (36) 9 (24) 16 (19)
Normal cognition 36 (23) 36 (100)
CIND 37 (24)
Memory impairment 13 (35)
Executive impairment 12 (32)
Other impairmentd 12 (32)
Dementia 84 (54)
Alzheimer’s disease only 55 (65)
Alzheimer’s disease pluse 18 (21)
Vascular dementia 6 (7)
Other dementia 5 (6)
aExcludes four participants with missing MMSE score.bExcludes five participants with unknown ApoE allele status.cExcludes one participant with unknown degree of education.dIncludes impairment in domains other than memory or executive function.eIncludes mixed Alzheimer’s disease/vascular dementia, Alzheimer’s disease/other and Alzheimer’s disease with dementia with Lewy bodies.
2582 | Brain 2014: 137; 2578–2587 J. L. Robinson et al.
by guest on September 17, 2015
http://brain.oxfordjournals.org/D
ownloaded from

our cohort, TDP-43 pathology was present in the hippocampus of
24% (35/146) of the cases. While a small number of both normal
(11%, 4/35) and CIND (12%, 4/33) individuals had pathology,
TARDBP inclusions affected a more substantial portion of the
dementia group (35%, 27/78). As in our earlier study (Robinson
et al., 2011), TARDBP was almost exclusively in individuals with
hippocampal sclerosis. 77% (17/22) of the cases with hippocam-
pal sclerosis also had TARDBP inclusions. While 15% (18/124) of
Table 2 Association between markers and cognitive groups
Measure Wald test CIND versus Normal Dementia versus CIND Dementia versusNormal
P-value OR (95% CI) OR (95% CI) OR (95% CI)P-value P-value P-value
Synaptophysin 0.002 5.59 (0.20–159.45) 0.01 (50.01–0.11) 0.03 (50.01–0.59)0.314 0.001 0.021
SV2 0.017 2.85 (0.10–84.75) 0.02 (50.01–0.35) 0.05 (50.01–0.93)0.546 0.008 0.045
VGLUT1 0.099 0.04 (50.01–2.41) 0.56 (0.02–18.84) 0.02 (50.01–0.76)0.124 0.747 0.034
Braak stage 0.001 1.06 (0.75–1.50) 1.52 (1.07–2.16) 1.68 (1.24–2.30)0.740 0.020 0.001
Thal phase 0.037 1.37 (0.89–2.11) 1.20 (0.84–1.71) 1.64 (1.12–2.38)0.158 0.318 0.011
Hippocampal sclerosis 50.001 0.94 (0.36–2.49) 3.32 (1.56–7.05) 3.13 (1.48–6.64)0.906 0.002 0.003
Cerebrovascular disease 0.004 0.94 (0.35–2.55) 2.99 (1.31–6.83) 2.81 (1.29–6.13)0.900 0.009 0.009
TDP-43 0.008 0.90 (0.20–4.05) 4.32 (1.34–13.95) 3.89 (1.23–12.36)0.893 0.014 0.021
Odds ratios and 95% CIs were generated from multinomial logistic regression models where the dependent (outcome) variable was cognitive group (normal, CIND, ordementia) and the independent variables were the neuropathological markers as continuous variables, except TARDBP which was a binary variable. P-values 50.05 are inbold. Age at death and gender were included as covariates and each neuropathological measure was analysed in a separate model. The overall P-value corresponds to thetype 3 analyses and tests whether the neuropathological marker (independent variable) is significantly associated with the cognitive group (outcome variable). Odds ratios
are per unit. n for each group = 149 (synaptophysin), 151 (SV2), 152 (VGLUT1), 157 (Braak stage), 150 (Thal phase), 155 (hippocampal sclerosis, 108 (cerebrovasculardisease) and 146 (TARDBP).
Figure 2 Synaptic intensity and neuropathology measures by cognitive group. Synaptic ratios (A–C) and neuropathology measures (D–F)
in the oldest-old. All three synaptic RIRs were reduced in dementia compared to normal with (A) synaptophysin and (B) SV2 and
significantly different between the three cognitive groups, however, (C) VGLUT1 did not distinguish between CIND and dementia. No
synaptic RIR distinguished normal from CIND. (D) Thal phase and scores were all increased in dementia compared to normal with (D)
similar Thal phases reported for CIND and dementia, whereas (E) Braak stage and (F) cerebrovascular disease (CVD) pathologies, including
hippocampal sclerosis, were significantly different between the three cognitive groups. Each measure is graphed with the first and third
quartiles boxed with the median band dividing the box into darker upper and lighter lower ranges; a whisker line extends to the minimums
and maximums; shaded diamonds represent the means.
Synaptic loss and cognitive impairment in the 90+ Brain 2014: 137; 2578–2587 | 2583
by guest on September 17, 2015
http://brain.oxfordjournals.org/D
ownloaded from

individuals without hippocampal sclerosis also had TARDBP path-
ology, the numbers were too low to analyse the significance of the
TARDBP pathology after controlling for hippocampal sclerosis
(data not shown).
Synaptic healthAs described above, to measure the synaptic levels of the perfor-
ant pathway, synaptic RIRs were generated by measuring the
intensity of synaptophysin, SV2, and VGLUT1 by immunohisto-
chemistry in the outer molecular layer of the hippocampus relative
to the inner molecular layer (Fig. 1). Higher RIRs represent a rela-
tively healthy outer layer in relation to the inner layer,
whereas lower RIRs correspond to synaptic loss in the outer
layer (Fig, 2A–C). In the normal group, synaptophysin (mean
0.94) and SV2 (mean 0.94) had RIRs close to 1.00, whereas the
glutamate-specific VGLUT1 RIR was lower (mean 0.67). Similar
values were obtained in the CIND group: synaptophysin (mean
0.98), SV2 (mean 0.96) and VGLUT1 (mean 0.64). In the demen-
tia group, these values were mildly lower: synaptophysin (mean
0.87), SV2 (mean 0.89) and VGLUT1 (mean 0.63).
All three synaptic RIRs distinguished between the dementia and
normal groups with higher RIRs associated with lower odds of
being in the dementia group (P50.05) (Table 2). The synapto-
physin and SV2 RIRs also distinguished between the dementia and
CIND groups (synaptophysin, P50.001; SV2, P = 0.008),
whereas the VGLUT1 RIR did not (P = 0.747). No RIR distin-
guished between the CIND and normal groups (all P4 0.12).
We also examined the association between synaptic RIRs and
global cognitive scores and found that for all three synaptic mar-
kers, higher RIR values were significantly associated with higher
MMSE scores (synaptophysin, P50.001; SV2, P50.001,
VGLUT1, P50.05).
Multiple pathologiesPearson correlation coefficients showed significant correlations be-
tween the three synaptic RIRs (VGLUT1 and SV2, corr = 0.37,
P5 0.001; VGLUT1 and synaptophysin, corr = 0.45, P50.001;
SV2 and synaptophysin, corr = 0.50, P50.001). Given the correl-
ation between synaptic markers, we wanted to explore the inde-
pendent contribution of each with respect to global cognitive
scores. In a multiple regression model that included all three syn-
aptic markers, we found that higher RIRs for both synaptophysin
(beta = 20.3, P = 0.002) and SV2 (beta = 13.4, P = 0.03) remained
significantly associated with better MMSE scores.
Post hoc analysis revealed that the SV2 RIR was significantly
lower at Braak stage VI (P5 0.001) and the VGLUT1 RIR was
significantly lower in individuals with hippocampal sclerosis
(P = 0.024). To estimate the independent contribution of all the
different measures to global cognitive scores, we included all three
synaptic RIRs, the Alzheimer’s disease pathology scores, and hip-
pocampal sclerosis in a multiple regression analysis. In this model,
the synaptophysin ratio, Braak stage, TARDBP and hippocampal
sclerosis all remained significantly associated with MMSE scores
(P-values:50.05, 0.001, 50.01 and 0.001, respectively).
Memory impairment only subjectsThe primary impairment in 13 of the CIND individuals was
memory (Table 1). As those with executive impairment may
have dysfunction related more to a frontotemporal lobar degen-
eration rather than Alzheimer’s disease and those with ‘other’ im-
pairment cannot be well defined, it’s possible that the 13 with
memory impairment are more likely to be on the continuum be-
tween normal cognition and Alzheimer’s disease. To test this hy-
pothesis, we compared the RIRs and our pathological markers in
the ‘memory impairment only’ CIND subjects to the normal and
dementia subjects to see if our results had more significance. No
new associations were found (data not shown), suggesting that
the memory impairment subjects weren’t more likely to lead to the
intermediate level of Alzheimer’s disease apparent in the dementia
group than the other CIND individuals. Similar subgroup analysis
with the executive impairment and ‘other’ impairment CIND indi-
viduals also did not reveal any new associations that the compari-
sons with the group as a whole hadn’t already shown (data not
shown).
DiscussionWe hypothesized that perforant pathway synaptic loss may be one
of the early correlates of cognitive impairment in The 90+ Study,
but this was not the case. None of the measures distinguished the
normal and CIND groups and almost all the measures distin-
guished the CIND and dementia groups from the cognitively
normal individuals. This implies that synaptic loss is tightly linked
to pathology associated with dementia in the oldest-old.
This is not the case in younger age groups where it is hypothe-
sized that plaques and neurofibrillary tangles accumulate years,
even decades, before cognitive impairment and where pathology
accumulates progressively (Sperling et al., 2011). Perhaps nona-
genarians represent individuals with significant cognitive reserve?
Although their brains may be exposed to the same pathological
insults during progressive cognitive impairment as younger co-
horts, they are able to minimize any synaptic loss and accumula-
tions of pathology. At the very least, our data are consistent with
an acceleration of the pathological cascade implied by other
studies.
In this autopsy study of a large cohort of CIND individuals, we
sought to elucidate which pathologies among those examined
here associate with normal ageing, which associate with dementia
and which, if any, associate with cognitive impairment. We review
all of our findings below.
First, cognitively normal nonagenarians in The 90+ Study have
a median Braak stage of III and a Thal phase of 1 consistent with
predictable, age-dependent deposition of Alzheimer’s disease
pathology (Braak et al., 2011). Of course, many pathologies be-
sides Alzheimer’s disease affect the ageing brain including other
neurodegenerative diseases, cerebrovascular disease and hippo-
campal sclerosis among others. In this study, we did not examine
the role of multiple neurodegenerative diseases, but we previously
reported that �-synuclein and TARDBP pathology affect 520% of
cognitively normal individuals in this age category and then
2584 | Brain 2014: 137; 2578–2587 J. L. Robinson et al.
by guest on September 17, 2015
http://brain.oxfordjournals.org/D
ownloaded from

primarily as co-morbidities (Robinson et al., 2011).
Cerebrovascular disease, on the other hand, was common, affect-
ing 45% of the group while hippocampal sclerosis was almost
non-existent (n = 1).
Against this background level of multiple age-related patholo-
gies in cognitively normal individuals, we can analyse the increases
in Alzheimer’s disease burden, cerebrovascular disease and hippo-
campal sclerosis associated with dementia (Fig. 3A). As 90+ indi-
viduals have a moderate burden of age-related tangles and
plaques and a particularly high prevalence of dementia (Corrada
et al., 2008), it is not surprising that Alzheimer’s disease pathology
is the most common underlying contributor to dementia in this
group (Hebert et al., 2013). For individuals with dementia, the
median Braak stage is V and the Thal phase of 3. Compared
with the normal group, these are substantial increases consistent
with an intermediate burden of Alzheimer’s disease neuropatho-
logical change (Montine et al., 2012). Along with Alzheimer’s dis-
ease, the prevalence of cerebrovascular disease—not including
hippocampal sclerosis—increased to 74% of individuals in the de-
mentia group. Additionally, dementia was associated with the ap-
pearance of hippocampal sclerosis in a substantial minority (28%).
Similarly, and primarily comorbidly, TARDBP also affected a large
minority (35%). Both the cerebrovascular disease and hippocam-
pal sclerosis percentages are consistent with reported frequencies
of these pathologies in this age-group (Giannakopoulos et al.,
1997; Nelson et al., 2011a).
The changes in all three of the synaptic markers studied here are
consistent with the interpretation that significant perforant path-
way loss occurs with dementia in the 90+ subjects (Fig. 3B). This
is consistent with our previous work involving 32 individuals in The
90+ Study where neocortical synaptophysin protein levels were
significantly decreased with dementia (Head et al., 2009). In our
multiple logistic regression analysis, both the synaptophysin RIR
and Braak stage tightly associated with cognitive scores.
Concurrently, post hoc analysis revealed that the SV2 RIR was
significantly lower at Braak stage VI, raising the possibility that
synaptic protein loss is tightly correlated with tau burden. This is
supported by studies in tau transgenic mice (Yoshiyama et al.,
2007) and in human cohorts where synaptic protein loss only
occurs at the highest Braak stages (Mukaetova-Ladinska et al.,
2000). On the other hand, as the synaptophysin RIR, Braak
stage, hippocampal sclerosis and the TDP-43 pathology measures
all remained significantly associated with MMSE scores in our mul-
tiple logistic regression analysis, perhaps something more than
pathological Alzheimer’s disease is taking place and that synaptic
protein loss in the perforant pathway and hippocampal sclerosis
are independent factors that contribute to dementia in the oldest-
old.
If cognitively normal individuals have age-related tangles and
plaques, and these pathologies increase along with synaptic loss
in dementia, what changes occur during CIND? CIND in the
oldest-old may be associated with a greater substantial distribution
of plaques as measured by Thal phase (Fig. 3A). Cognitively
normal nonagenarians at Thal phase 2 have plaque deposition
that has spread into layers 2/3 of the entorhinal cortex (Thal
et al., 2006), suggesting that plaques are already present in the
perforant pathway. In the CIND group, the median Thal phase
was 3 indicating a greater plaque burden affecting the perforant
pathway. As there is no concurrent increase in the Braak stage
(median III), this may signify that plaques are having an earlier
effect than tangles, which is consistent with numerous biomarker
studies that show amyloid-b becomes abnormal before tau in cog-
nitively normal individuals (Aisen, 2010; Jack et al., 2013).
CIND may also be associated with a decrease in glutamatergic
synapses in the perforant pathway as measured by the VGLUT1
RIR (Fig. 3B). Although the VGLUT1 RIR can clearly distinguish
the normal and dementia groups (P = 0.034), this measure does
not distinguish the CIND from the dementia groups (P = 0.747),
whereas the synaptophysin (P50.001) and SV2 RIRs (P = 0.008)
still do (Table 2). The most parsimonious explanation is that non-
glutamatergic neurons remain relatively unaffected during CIND
whereas glutamatergic neurons experience synaptic loss. If true,
Figure 3 A model of changes associated with cognitive impairment and dementia in the oldest-old. Neuropathology and synaptic
measures are associated with cognitive impairment in ‘The 90+ Study’. (A) Mild to moderate Alzheimer’s disease pathology already exists
in the oldest-old for cognitively normal individuals and the Thal phase may increase with cognitive impairment. With dementia, all markers
increase significantly, especially Braak stage, cerebrovascular disease (CVD) pathology and hippocampal sclerosis (HS). (B) Glutamatergic
specific synaptic loss (VGLUT1) in the perforant pathology may occur during cognitive impairment, while significant synaptic loss occurs
with dementia. All values are relative to the normal group’s means normalized to 1.0 (see Fig. 1), except cerebrovascular disease which
factors out the contribution of hippocampal sclerosis before normalizing; the hippocampal sclerosis percentages are graphed separately on
the right axis.
Synaptic loss and cognitive impairment in the 90+ Brain 2014: 137; 2578–2587 | 2585
by guest on September 17, 2015
http://brain.oxfordjournals.org/D
ownloaded from

this is consistent with previous work showing that observed pre-
synaptic proteins, such as synaptophysin, remain constant or in-
crease in earlier phases of illness before decreasing with dementia
onset (Honer, 2003; Head et al., 2009). That the decrease in the
VGLUT1 RIR is coincident with the increase in Thal phase may
imply that plaques damage glutermatergic synapses. Of course,
there are many possibilities including that the reduction in
VGLUT1 may simply signify a loss of transporters, rather than
the loss of glutamatergic afferents (Tannenberg et al., 2004).
Importantly, our study suggests that individuals with CIND are
for the most part pathologically and synaptically indistinguishable
from individuals with normal cognition. This being the case,
pharmaceutical interventions that target tau and amyloid-b or pro-
tect synapses are all viable therapeutic strategies for a population
at risk of dementia due to Alzheimer’s disease. In addition, inter-
ventions designed to maintain a healthy synaptic system and a
strict control of vascular risk factors may be good strategies to
preserve cognitive function in nonagenarians and centenarians.
AcknowledgementsWe wish to thank the assistance of Terry Schuck, Felix Geser and
Laura Volpicelli-Daley.
FundingThis work was supported in part by grants from the National
Institutes of Health (AG10124, AG16573, AG17586, AG21055,
P50AG16573 and MH64045).
ReferencesAisen PS. Pre-dementia Alzheimer’s trials: overview. J Nutr Health Aging
2010; 14: 294.
Albert MS, Moss MB, Tanzi R, Jones K. Preclinical prediction of AD using
neuropsychological tests. J Int Neuropsychol Soc 2001; 7: 631–639.
American Psychiatric Association, American Psychiatric Association,
and Task Force on DSM-IV. Diagnostic and statistical manual of
mental disorders: DSM-IV. Washington, DC: American Psychiatric
Association; 1994.Bakker A, Krauss GL, Albert MS, Speck CL, Jones LR, Stark CE, et al.
Reduction of hippocampal hyperactivity improves cognition in amnes-
tic mild cognitive impairment. Neuron 2012; 74: 467–474.Beeri MS, Haroutunian V, Schmeidler J, Sano M, Fam P, Kavanaugh A,
et al. Synaptic protein deficits are associated with dementia irrespective
of extreme old age. Neurobiol Aging 2012; 33: 1125.e1–8.
Berlau DJ, Corrada MM, Head E, Kawas CH. APOE epsilon2 is associated
with intact cognition but increased Alzheimer pathology in the oldest
old. Neurology 2009; 72: 829–834.
Braak H, Alafuzoff I, Arzberger T, Kretzschmar H, Del Tredici K. Staging
of Alzheimer disease-associated neurofibrillary pathology using paraffin
sections and immunocytochemistry. Acta Neuropathol 2006; 112:
389–404.Braak H, Thal DR, Ghebremedhin E, Del Tredici K. Stages of the patho-
logic process in Alzheimer disease: age categories from 1 to 100 years.
J Neuropathol Exp Neurol 2011; 70: 960–969.
Chen P, Ratcliff G, Belle SH, Cauley JA, DeKosky ST, Ganguli M.
Patterns of cognitive decline in presymptomatic Alzheimer disease: a
prospective community study. Arch Gen Psychiatry 2001; 58:
853–858.
Clark CM, Ewbank DC. Performance of the dementia severity rating
scale: a caregiver questionnaire for rating severity in Alzheimer disease.
Alzheimer Dis Assoc Disord 1996; 10: 31–39.
Corrada MM, Berlau DJ, Kawas CH. A population-based clinicopatholo-
gical study in the oldest-old: the 90+ study. Curr Alzheimer Res 2012;
9: 709–717.
Corrada MM, Brookmeyer R, Berlau D, Paganini-Hill A, Kawas CH.
Prevalence of dementia after age 90: results from the 90+ study.
Neurology 2008; 71: 337–343.
Corrada MM, Paganini-Hill A, Berlau DJ, Kawas CH. Apolipoprotein E
genotype, dementia, and mortality in the oldest old: the 90+ Study.
Alzheimers Dement 2013; 9: 12–18.DeKosky ST, Scheff SW, Styren SD. Structural correlates of cognition in
dementia: quantification and assessment of synapse change.
Neurodegener J Neurodegener Disord Neuroprotection Neuroregen-
eration 1996; 5: 417–421.
El Mestikawy S, Wallen-Mackenzie A, Fortin GM, Descarries L,
Trudeau LE. From glutamate co-release to vesicular synergy: vesicular
glutamate transporters. Nat Rev Neurosci 2011; 12: 204–216.
Giannakopoulos P, Hof PR, Michel JP, Guimon J, Bouras C. Cerebral
cortex pathology in aging and Alzheimer’s disease: a quantitative
survey of large hospital-based geriatric and psychiatric cohorts. Brain
Res Brain Res Rev 1997; 25: 217–245.Head E, Corrada MM, Kahle-Wrobleski K, Kim RC, Sarsoza F,
Goodus M, et al. Synaptic proteins, neuropathology and cognitive
status in the oldest-old. Neurobiol Aging 2009; 30: 1125–1134.
Hebert LE, Weuve J, Scherr PA, Evans DA. Alzheimer disease in the
United States (2010–2050) estimated using the 2010 census.
Neurology 2013; 80: 1778–1783.
Honer WG. Pathology of presynaptic proteins in Alzheimer’s disease:
more than simple loss of terminals. Neurobiol Aging 2003; 24:
1047–1062.
Hyman BT, Van Hoesen GW, Kromer LJ, Damasio AR. Perforant path-
way changes and the memory impairment of Alzheimer’s disease. Ann
Neurol 1986; 20: 472–481.
Jack CR Jr, Knopman DS, Jagust WJ, Petersen RC, Weiner MW,
Aisen PS, et al. Tracking pathophysiological processes in Alzheimer’s
disease: an updated hypothetical model of dynamic biomarkers. Lancet
Neurol 2013; 12: 207–216.
Jellinger KA, Attems J. Incidence of cerebrovascular lesions in
Alzheimer’s disease: a postmortem study. Acta Neuropathol 2003;
105: 14–17.
Kawas C, Segal J, Stewart WF, Corrada M, Thal LJ. A validation study of
the Dementia Questionnaire. Arch Neurol 1994; 51: 901–906.
Kirvell SL, Esiri M, Francis PT. Down-regulation of vesicular glutamate
transporters precedes cell loss and pathology in Alzheimer’s disease.
J Neurochem 2006; 98: 939–950.
Montine TJ, Phelps CH, Beach TG, Bigio EH, Cairns NJ, Dickson DW,
et al. National Institute on Aging-Alzheimer’s Association guidelines for
the neuropathologic assessment of Alzheimer’s disease: a practical ap-
proach. Acta Neuropathol 2012; 123: 1–11.Mukaetova-Ladinska EB, Garcia-Siera F, Hurt J, Gertz HJ, Xuereb JH,
Hills R, et al. Staging of cytoskeletal and beta-amyloid changes in
human isocortex reveals biphasic synaptic protein response dur-
ing progression of Alzheimer’s disease. Am J Pathol 2000; 157:
623–636.
Nelson PT, Head E, Schmitt FA, Davis PR, Neltner JH, Jicha GA, et al.
Alzheimer’s disease is not “brain aging”: neuropathological, genetic,
and epidemiological human studies. Acta Neuropathol 2011a; 121:
571–587.Nelson PT, Schmitt FA, Lin Y, Abner EL, Jicha GA, Patel E, et al.
Hippocampal sclerosis in advanced age: clinical and pathological fea-
tures. Brain J Neurol 2011b; 134: 1506–1518.Peltz CB, Corrada MM, Berlau DJ, Kawas CH. Cognitive impairment in
nondemented oldest-old: prevalence and relationship to cardiovascular
risk factors. Alzheimers Dement 2012; 8: 87–94.
2586 | Brain 2014: 137; 2578–2587 J. L. Robinson et al.
by guest on September 17, 2015
http://brain.oxfordjournals.org/D
ownloaded from
Laura
Highlight

Pfeffer RI, Kurosaki TT, Harrah CH Jr, Chance JM, Filos S. Measurementof functional activities in older adults in the community. J Gerontol
1982; 37: 323–329.
Robinson JL, Geser F, Corrada MM, Berlau DJ, Arnold SE, Lee VMY,
et al. Neocortical and hippocampal amyloid-b and tau measures asso-ciate with dementia in the oldest-old. Brain J Neurol 2011; 134:
3708–3715.
Saxton J, Lopez OL, Ratcliff G, Dulberg C, Fried LP, Carlson MC, et al.
Preclinical Alzheimer disease: neuropsychological test performance 1.5to 8 years prior to onset. Neurology 2004; 63: 2341–2347.
Senut MC, Roudier M, Davous P, Fallet-Bianco C, Lamour Y. Senile
dementia of the Alzheimer type: is there a correlation between entorh-inal cortex and dentate gyrus lesions? Acta Neuropathol 1991; 82:
306–315.
Silverman JM, Breitner JC, Mohs RC, Davis KL. Reliability of the family
history method in genetic studies of Alzheimer’s disease and relateddementias. Am J Psychiatry 1986; 143: 1279–1282.
Sperling RA, Aisen PS, Beckett LA, Bennett DA, Craft S, Fagan AM, et al.
Toward defining the preclinical stages of Alzheimer’s disease: recom-
mendations from the National Institute on Aging-Alzheimer’s
Association workgroups on diagnostic guidelines for Alzheimer’s dis-ease. Alzheimers Dement 2011; 7: 280–292.
Sze CI, Bi H, Kleinschmidt-DeMasters BK, Filley CM, Martin LJ. Selective
regional loss of exocytotic presynaptic vesicle proteins in Alzheimer’s
disease brains. J. Neurol Sci 2000; 175: 81–90.Tannenberg RK, Scott HL, Westphalen RI, Dodd PR. The identification
and characterization of excitotoxic nerve-endings in Alzheimer disease.
Curr Alzheimer Res 2004; 1: 11–25.
Thal DR, Capetillo-Zarate E, Del Tredici K, Braak H. The development ofamyloid beta protein deposits in the aged brain. Sci. Aging Knowl
Environ 2006; 2006: re1.
Valtorta F, Pennuto M, Bonanomi D, Benfenati F. Synaptophysin: leadingactor or walk-on role in synaptic vesicle exocytosis? BioEssays News
Rev Mol Cell Dev Biol 2004; 26: 445–453.
Wilson RS, Yu L, Trojanowski JQ, Chen EY, Boyle PA, Bennett DA, et al.
TDP-43 Pathology, cognitive decline, and dementia in old age. JAMANeurol 2013; 70: 1418–1424.
Yoshiyama Y, Higuchi M, Zhang B, Huang SM, Iwata N, Saido TC, et al.
Synapse loss and microglial activation precede tangles in a P301S
tauopathy mouse model. Neuron 2007; 53: 337–351.
Synaptic loss and cognitive impairment in the 90+ Brain 2014: 137; 2578–2587 | 2587
by guest on September 17, 2015
http://brain.oxfordjournals.org/D
ownloaded from

172

173
Appendix 2 “Selectively silencing GSK-3 isoforms reduces plaques and tangles in
mouse models of Alzheimer´s disease” Hurtado DE, Molina-Porcel L, Carroll JC,
Macdonald C, Aboagye AK, Trojanowski JQ, Lee VM. J Neurosci. 2012 May
23;32(21):7392-402.

Behavioral/Systems/Cognitive
Selectively Silencing GSK-3 Isoforms Reduces Plaques andTangles in Mouse Models of Alzheimer’s Disease
David E. Hurtado,1* Laura Molina-Porcel,1,2* Jenna C. Carroll,1 Caryn MacDonald,1 Awo K. Aboagye,1
John Q. Trojanowski,1 and Virginia M.-Y. Lee1
1Center for Neurodegenerative Disease Research, Department of Pathology and Laboratory Medicine, and Institute on Aging, University of PennsylvaniaSchool of Medicine, Philadelphia, Pennsylvania 19104-4283 and 2Universitat Autonoma de Barcelona, Barcelona, Spain 08193
Glycogen synthase kinase-3 (GSK-3) is linked to the pathogenesis of Alzheimer’s disease (AD), senile plaques (SPs), and neurofibrillarytangles (NFTs), but the specific contributions of each of the GSK-3 � and � isoforms to mechanisms of AD have not been clarified. In thisstudy, we sought to elucidate the role of each GSK-3� and GSK-3� using novel viral and genetic approaches. First, we developedrecombinant adeno-associated virus 2/1 short hairpin RNA constructs which specifically reduced expression and activity of GSK-3� orGSK-3�. These constructs were injected intraventricularly in newborn AD transgenic (tg) mouse models of SPs (PDAPP �/�), both SPsand NFTs (PDAPP �/�;PS19 �/�), or wild-type controls. We found that knockdown (KD) of GSK-3�, but not GSK-3�, reduced SPformation in PDAPP �/� and PS19 �/�;PDAPP �/� tg mice. Moreover, both GSK-3� and GSK-3� KD reduced tau phosphorylation andtau misfolding in PS19 �/�;PDAPP �/� mice. Next, we generated triple tg mice using the CaMKII�-Cre (�-calcium/calmodulin-dependent protein kinase II-Cre) system to KD GSK-3� in PDAPP �/� mice for further study of the effects of GSK-3� reduction on SPformation. GSK-3� KD showed a significant effect on reducing SPs and ameliorating memory deficits in PDAPP �/� mice. Together, thedata from both approaches suggest that GSK-3� contributes to both SP and NFT pathogenesis while GSK-3� only modulates NFTformation, suggesting common but also different targets for both isoforms. These findings highlight the potential importance of GSK-3�as a possible therapeutic target for ameliorating behavioral impairments linked to AD SPs and NFTs.
IntroductionAlzheimer’s disease (AD) is the most common form of dementiaand presents clinically with progressive memory loss and cogni-tive impairments. AD is characterized pathologically by extracel-lular senile plaques (SPs), composed of amyloid-� (A�) peptidesderived from the proteolysis of the amyloid precursor protein(APP), and by intracellular neurofibrillary tangles (NFTs), com-posed of hyperphosphorylated tau protein. Glycogen synthasekinase-3 (GSK-3) is a serine/threonine kinase that has beenimplicated in the formation of both SPs and NFTs (Jope andJohnson, 2004; Giese, 2009). For example, GSK-3 activationmodulates A� production (Phiel et al., 2003; Ryder et al., 2003),while A� activates GSK-3 (Kim et al., 2003; Akiyama et al., 2005;Ryan and Pimplikar, 2005). Additionally, GSK-3 is a principal
kinase that phosphorylates tau at key residues found in AD NFT(Hanger et al., 2009). Thus, GSK-3 modulates pathways related toSP and NFT formation and it has been suggested that GSK-3reduction may represent an attractive therapeutic target for AD(Phiel et al., 2003; Ryder et al., 2003).
There are two mammalian GSK-3 isoforms, i.e., GSK-3� andGSK-3�, each of which is encoded by a separate gene. Both arehighly conserved and widely expressed serine/threonine kinasesthat share a high degree of homology (Woodgett, 1990). Histor-ically, the most widely used strategy to study the effects of GSK-3reduction in vivo has been to use pharmacological GSK-3 inhib-itors. When administered to various AD transgenic (tg) mice,these inhibitors reduce hyperphosphorylated tau accumulation,A� production, and/or SP burden (Perez et al., 2003; Phiel et al.,2003; Su et al., 2004; Noble et al., 2005; Sereno et al., 2009).However, available inhibitors lack specificity for GSK-3 isoformsand may also have off-target effects, which may confound exper-imental results. Although a few recent studies have used geneticapproaches in vivo (Gomez-Sintes et al., 2007; Alon et al., 2011;Jaworski et al., 2011), they have been unable to fully distinguishwhich GSK-3 isoform is responsible for hyperphosphorylated tauaccumulation and/or SP formation.
In this study, we used two distinct approaches to evaluate theeffect of GSK-3� or GSK-3� knockdown (KD) in vivo on AD-related neuropathology: a viral short hairpin RNA (shRNA) ap-proach and a genetic approach. First, we intraventricularlydelivered adeno-associated virus (AAV) encoding shRNAs di-rected toward GSK-3� or GSK-3� into newborn tg mice display-
Received Feb. 23, 2012; revised April 6, 2012; accepted April 13, 2012.Author contributions: D.E.H., L.M.-P., J.Q.T., and V.M.-Y.L. designed research; D.E.H., L.M.-P., J.C.C., C.M., and
A.K.A. performed research; D.E.H., L.M.-P., J.C.C., and V.M.-Y.L. analyzed data; D.E.H., L.M.-P., J.C.C., J.Q.T., andV.M.-Y.L. wrote the paper.
This study is supported by National Institutes of Health grants AG11542, AG17586, T32-GM07229, and T32-AG000255, the Marian S. Ware Alzheimer Program, the Fundacion Caja Madrid, and Instituto de Salud Carlos III. Wethank Jon Toledo, Amanda Piarulli, Brigid Jensen, Erin Coffey, and Stylianos Monos for technical and statisticalassistance.
*D.E.H. and L.M.-P. contributed equally to this work.The author(s) declare(s) no competing financial interests.Correspondence should be addressed to Virginia M.-Y. Lee, Department of Pathology and Laboratory Medicine,
University of Pennsylvania School of Medicine, Maloney Building 3rd Floor, HUP, 3600 Spruce Street, Philadelphia,PA 19104-4283. E-mail: [email protected].
DOI:10.1523/JNEUROSCI.0889-12.2012Copyright © 2012 the authors 0270-6474/12/327392-11$15.00/0
7392 • The Journal of Neuroscience, May 23, 2012 • 32(21):7392–7402

ing SP pathology (PDAPP�/�), both SPs and NFTs (PDAPP�/�;PS19�/�), or wild-type (wt) control mice. Second, we generateda triple tg mouse model using CaMKII�-cre (�-calcium/calmodulin-dependent protein kinase II-Cre) system to KDGSK-3� alleles in PDAPP�/� mice. Using these two models, wedemonstrated that knocking down GSK-3� or GSK-3� reducesthe accumulation of phosphorylated tau; however, a singleGSK-3� KD was sufficient to decrease plaque formation and im-prove cognition in the triple tg mouse model.
Materials and MethodsScreening shRNANeuro 2a (N2a) cells were transfected with shRNA plasmids directedtoward murine GSK-3� or GSK-3�. shRNA plasmids containing thepuromycin selection marker were purchased from Origene. Forty-eighthours post-transfection, cells were treated with 5 �g/ml puromycin for7 d. Immunoblot analysis of cell lysates led to the identification of specificGSK-3 shRNAs used in this study with the following sequences: GSK-3�shRNA: AAGGACGAGCTGTATTTGAATCTGGTGCT and GSK-3�shRNA: GGCGACCGAGAACCACCTCCTTTGCGGAG along with ascramble control shRNA: TGACCACCCTGACCTACGGCGTGCAGTGC,designated as shRNA-�, shRNA-�, and shRNA-scr, respectively.
To measure eukaryotic translation initiation factor 2� (eIF2�) re-sponse, N2a cells were transfected with shRNA-�, shRNA-�, andshRNA-scr as described above and compared with untreated N2a cells.As a positive control, N2a cells were treated with thapsigargin (300 nM;Sigma) for 1 h and cell lysates were used for immunoblotting.
AAV construction, packaging, and intraventricular injectionRecombinant AAV 2/1 (rAAV2/1) expressing shRNA used in this studywas produced at the University of Pennsylvania Vector Core as describedpreviously (Gao et al., 2006). These AAV vectors were purified by tworounds of cesium chloride– gradient centrifugation, buffer-exchangedwith PBS, and concentrated using Amicon Ultra 15 centrifugal filterdevices-100K (Millipore). Genome titer (genome copies per milliliter) ofAAV vectors were determined by real-time PCR. Viral vector titers wereas follows: 4.7 � 10 12 GC/ml for shRNA-�, 3.2 � 10 12 GC/ml forshRNA-�, and 2.1 � 10 12 GC/ml for shRNA-scr. The recombinant ge-nome contained AAV 2 (AAV2) inverted terminal repeats that flankedfive cassettes: the U6 promoter; a 29 bp palindromic DNA sequence witha 7 bp loop and a termination (TTTTTT) sequence, the CMV promoter,cDNA ZsGreen (Clontech), and an SV-40 poly(A) sequence. Recombi-nant AAV2 genome was cross-packaged with AAV-1 cap proteins gener-ating pseudotype rAAV2/1.
Mouse intraventricular injection procedure was adapted from previ-ously described studies (Passini and Wolfe, 2001; Li and Daly, 2002).Briefly, on the day of birth (designated as P 0.5), neonatal females werecryo-anesthetized on ice for 5 min. Once anesthetized, neonates weretransilluminated over a cold fiber-optic illuminator to highlight craniallandmarks and 2 �l rAAV2/1 (containing shRNA-�, shRNA-�, orshRNA-scr) was injected into each lateral ventricle using a 10 �l Hamil-ton syringe with a 33 gauge needle. Pups were subsequently placed on aheating pad for recovery and then returned to their home cage. Of the�230 total mice injected, �218 pups survived surgery and were tattooed10 d later, yielding a “success rate” of �95%.
Generation of tg miceUsing the abovementioned approach, three mouse lines were generated:(1) heterozygous PDAPP (PDAPP �/�), (2) heterozygous PS19;PDAPP(PS19 �/�;PDAPP �/�), and (3) control wt (B6C3 background strain).The PDAPP mouse model is well described, and was engineered to en-code a human APP minigene carrying the V717F mutation driven by thePDGF promoter (Games et al., 1995). The PS19 model harbors the T34isoform of tau with one N-terminal insert and four microtubule bindingrepeats (1N4R) encoding the P301S mutation driven by the mouse prionpromoter (Yoshiyama et al., 2007). F1 hybrid PS19 �/�;PDAPP �/� andPDAPP �/� were generated by crossing parental strains PS19 �/� andhomozygous PDAPP. F1 hybrids wt were generated by mating parental
strains heterozygous PS19 �/� and WT mice. Only female F1 hybridswere used in experimental groups.
Using the abovementioned lines, five cohorts of mice were generatedfor this study: (1) 4-month-old wt mice, (2) 11-month-old wt mice, (3)11-month-old PDAPP �/� mice, (4) 11-month-old PDAPP �/�;PS19 �/� mice, and (5) wt survival group. In each cohort, a separategroup of mice received one of four injection paradigms: rAAV containingshRNA-�, shRNA-�, shRNA-scr, or noninjected control. Each groupconsisted of 15 mice except for the survival cohort (n � 10/group).To-gether, a grand total of 20 experimental groups and 280 mice were used.
Conditional knock-out generationGSK-3� conditional knock-out (cko) mice were generated using theCre-loxP system through a contract with Taconic. To produce heterozy-gous GSK-3� floxed (GSK-3� flox/�) mice, the targeting vector based ona 9.9 kb genomic fragment from the GSK-3� gene encompassing exons1–11 and surrounding sequences was obtained from the C57BL/6J RP23Bacterial Artificial Chromosomes Library and was modified by insertinga loxP site and an FRT-flanked neomycin resistance gene in intron 1 anda loxP site in intron 4, as well as a ZsGreen cassette at its 3� end (see Fig.5A). Thirty micrograms of linearized DNA vector were electroporatedusing a Bio-Rad Gene Pulser at 240 V and 500 �F into 1 � 10 7 cells of theC57BL/6N embryonic stem (ES) cell lines. Only nonfluorescent clonessuggesting the absence of the ZsGreen region were selected on day 8.After expansion and freezing clones in nitrogen, 176 clones were ana-lyzed by using 5�, 3�, and neomycin probes after digestion by KpnI,EcoRI, AflIII, PflFI, and BglII restriction enzymes in standard Southernblotting techniques (Fig. 5A–D). Proper homologous recombination wasidentified in four of the clones, and clone B-C9 was used for blastocystinjection.
Ten to fifteen targeted C57BL/6N.tac ES cells were microinjected intoeach blastocyst obtained after superovulation of BALB/c females and 8injected blastocysts were transferred to each uterine horn of a 2.5 dayspostcoitum, pseudopregnant Naval Medical Research Institute femalemouse. Highly chimeric mice were bred to female C57BL/6 mice withFlp-Deleter recombinase gene to remove the Neo selection marker.Germline transmission was identified by the presence of black C57BL/6offspring.
Triple tg mice were generated by crossing the GSK-3� flox/� mice withCaMKII�-cre (C57BL/6 background) (Tsien et al., 1996) and PDAPP lines.Four crosses resulted in triple tg mice GSK-3� flox/flox;CaMKII�-cre�/�;PDAPP�/� thatweresubsequentlymatedwithGSK-3� flox/flox mice,generatingfour genotypes: GSK-3� flox/flox;CaMKII�-cre�/�;PDAPP�/� (GSK-3� wt),GSK-3� flox/flox;CaMKII�-cre�/� PDAPP�/� (GSK-3� cko), GSK-3� flox/flox;CaMKII�-cre�/�;PDAPP�/� (GSK-3� wt;PDAPP), and GSK-3� flox/flox;CaMKII�-cre�/�;PDAPP�/� (GSK-3� cko;PDAPP). Each of the four groupsconsisted of n � 10–15 mice that were analyzed at 17 months of age.
Histology and brain preparationMice were anesthetized and transcardially perfused with PBS, pH 7.0, inaccordance with protocols approved by the Institutional Animal Careand Use Committee of the University of Pennsylvania. Brains were sur-gically removed and the right hemisphere was fixed in 4% neutral buff-ered formalin (NBF), while the left hemisphere was dissected into variousbrain regions and frozen at �80°C for biochemical analysis. To maintainconsistency of dissection and to facilitate analysis brains were coronallysliced starting with an initial cut parallel to the olfactory tract as it bendstoward the median eminence. Bisection at this point generated anteriorand posterior cortical regions which were fixed in NBF and paraffinembedded. Paraffin blocks were sectioned at 6 �m exhaustively. Tissuesections were stained using a Polymer horseradish peroxidase detectionsystem (Biogenex) and automatically stained using the i6000 AutomatedStaining System (Biogenex) as previously described (Hurtado et al.,2010).
Antibodies used in histologyViral distribution was assessed using rabbit polyclonal antibody ( pAb)ZsGreen (Clontech). ShRNA off-target effects were identified by acti-vated microglia using ionized calcium binding adaptor molecule 1 (iba1)rabbit pAb (019-19741; Wako Chemicals), and activated astrocytes using
Hurtado, Molina-Porcel et al. • Silencing GSK3 Isoforms in Alzheimer’s Disease Mouse Model J. Neurosci., May 23, 2012 • 32(21):7392–7402 • 7393

glial fibrillary acidic protein (GFAP) rabbit pAb (Dako). GSK-3 expres-sion was monitored through the use of a GSK-3� rabbit pAb (9338) andGSK-3� rabbit mouse monoclonal antibody (mAb) (27C10; Cell Signal-ing Technology). To track the distribution of A� plaques, we used mousemAb Nab228 which binds to 1–11 in A� peptides (Lee et al., 2006).Anti-tau antibodies used in this study include: AT8 mouse mAb specificfor phosphorylated Ser202/Thr205 (Innogenetics), 12E8 mouse mAbspecific for phosphorylated S262 (gift from P. Seubert, Elan Pharma),AT180 mouse mAb specific for phosphorylated Thr231 (Innogenetics),and anti-tau mouse mAb T14, which is specific for human tau (Yo-shiyama et al., 2007). Additionally we used Alz50 and MC1 mouse mAb(a gift from Peter Davies) to monitor conformational tau. Fibrillary taulesions were detected using Thioflavine-S/Lipofuscin (ThS) autofluores-cence quenching protocols as described by Yoshiyama et al. (2007).
Immunohistochemical quantificationA� deposits, phospho-tau, Iba1, and GFAP immunoreactive (IR) burdenwere quantified by a researcher blinded to experimental conditions aspreviously described (Carroll et al., 2011). Images from immunolabeledsections were captured and digitized using a video capture system (Nikoncamera coupled to an Olympus DP71 upright microscope). Using NIHImageJ software, the areas of interest were drawn freehand (i.e., entirehippocampus). Afterward, digital grayscale images were converted intobinary positive/negative data using a constant threshold limit. The per-centage of positive pixels (i.e., IR area) was quantified for each image togenerate IR “load” values (i.e., percentage area occupied by the IR prod-uct). For phospho-tau burden, images of AT180- or 12E8-stained sec-tions of CA3 regions close to bregma �3.28 mm were measured. For A�deposit quantification; images of Nab228-stained sections of hippocam-pus were more anterior (bregma �1.95).
Sandwich ELISA analysisA� 40 and A� 42 levels were detected using A� sandwich ELISA proto-cols as previously described (Lee et al., 2003). Briefly, brain regionswere sonicated in radioimmunoprecipitation assay (RIPA) buffer (0.5%sodium deoxycholate, 0.1% SDS, 1% NP-40, 5 mM EDTA in TBS,pH 8.0) containing protease inhibitors (1 �g/ml pepstatin A, leupeptin,L-1-tosylamido-2-phenylethyl chloromethyl ketone, 1-chloro-3-tosy-lamido-7-amino-2-heptanone, soybean trypsin inhibitor, and 0.5 mM
phenylmethanesulfonyl fluoride) at 6 �l/mg of tissue followed by cen-trifugation at 100,000 g for 20 min at 4°C. The resulting pellet was furtherextracted by sonication with 70% formic acid (FA) at 1 �l/mg tissuefollowed by a second identical centrifugation. Both RIPA and FA lysateswere assayed by sandwich ELISA using Ban50 (anti-A�1–10) as a captur-ing antibody and end-specific BC05 and BA27 antibodies to distinguishA� 40 and A� 42, respectively.
Western blotsTo measure soluble proteins, hippocampi and N2a cells were homoge-nized in RIPA buffer in the presence of protease inhibitors and brieflysonicated. Samples were centrifuged at 100,000 g for 30 min at 4°C,and protein concentration was measured by bicinchoninic acid assay.Samples were electrophoresed on 10% Tris-glycine acrylamide gels andtransferred to a nitrocellulose or polyvinylidene fluoride membrane. Im-munoblots were probed with the following antibodies: GSK-3�� mousemAb (Calbiochem), eIF2� (9722) rabbit pAb, phospho-eIF2� (Ser51)(119A11) rabbit mAb (Cell Signaling Technology), C terminus of APP(5685) rabbit pAb (Lee et al., 2005), PhAT, a phospho rabbit pAb raisedto residues 665– 673 containing phospho-Thr668 at the C terminus ofAPP (Lee et al., 2005), and GAPDH mouse mAb (Advanced Immuno-chemical) as a loading control. Immunoblots were then exposed tospecies-specific horseradish peroxidase-conjugated anti-IgG antibodies(Santa Cruz Biotechnology) and visualized by enhanced chemilumines-cence (PerkinElmer) using a Fuji Imager. Images were quantified usingMulti Gauge version 3.2 FujiFilm software.
GSK-3 kinase activity assayFrozen hippocampal sections were sonicated 20 times at 1 s pulses, on iceat 6 �l/mg of tissue in homogenization buffer (D-PBS w/ Ca 2�, Mg 2�),pH 7.3 (Invitrogen), containing protease and phosphates inhibitors
(complete, Mini, EDTA-free Protease Inhibitor Cocktail, andPhosSTOP) (Roche Applied Science). Samples were centrifuged at100,000 � g for 30 min at 4°C and supernatant protein concentrationswere determined using a Bradford assay (Bio-Rad). Fifty micrograms oflysate was used for immunoprecipitation (IP) for GSK-3� or GSK-3�. IPwas performed using 35 �l of Protein A/G PLUS-Agarose slurry (SantaCruz Biotechnology), 50 �g of lysate, and 2 �l of GSK-3�- or GSK-3�-specific antibodies (Cell Signaling Technology). IP was incubated over-night at 4°C on a rotator and subsequently washed and resuspended inhomogenization buffer. Resuspended bead slurry was used for GSK-3kinase activity assay. The activity assay was performed in kinase buffer(25 mM Tris-HCl, pH 7.5, 0.5 mM EGTA, 75 mM NaCl, 0.015%, Brij-35,0.05% �-mercaptoethanol, pH 7.4, and 1 �M cAMP-dependent proteinkinase inhibitor tide) and ATP buffer (10 mM MgCl2, 0.1 mM adenosine5�-triphosphate, 3MBq/ml adenosine 5�-triphosphate [� �32P]), withthe GSK-3 substrate, phospho-glycogen synthase peptide-2 (Millipore).Reactions were performed at 37°C for 15 min. 32P-labeled peptide wasabsorbed on P81 phosphocellulose paper (GE Healthcare) and washedseveral times in 75 mM phosphoric acid followed by an acetone wash andbriefly dried. Quantitation was performed in a �-scintillation counter,1450 MicroBeta TriLux (PerkinElmer).
Behavioral analysisOpen field. To assess general activity, locomotion, and anxiety, mice weretested in the open field as adapted as previously described (Boyce-Rustayand Holmes, 2006; Carroll et al., 2007). The apparatus was a square arena(40 � 40 � 35 cm) with black Plexiglas walls and white floor that wasevenly illuminated to �95 lux. Mice were individually placed in thecenter and allowed to freely explore for 13 min while the trial was video-taped. Subsequent video scoring was completed by an observer blind totreatment groups using the SMARTv25 video-tracking software (Panlab,S.LU.). Total distance moved was automatically calculated by the track-ing software as a direct measure of locomotion and activity.
Barnes maze. Mice were tested for hippocampal-dependent spatialmemory on the Barnes maze (San Diego Instruments) using a previouslydescribed protocol from our laboratory (Brunden et al., 2010). Briefly,mice were tested over �6 d. On training days 1–3, mice were exposed tothe Barnes maze for three 2.5 min trials, 15 min apart. On testing days4 – 6, they were exposed to two 2.5 min trials. On all 6 d, only the two lasttrials were scored. Mice were tested on their ability to learn and remem-ber a fixed position of an escape compartment, and their performancewas scored for strategy and latency to find the escape compartment.Strategies were defined as (1) spatial (mouse navigates directly to theescape hole with both first intent deviation and total errors � or � 3), (2)serial (mouse systematically searches of consecutive holes with no centercrosses), and (3) random (no strategy at all) as previously described(O’Leary et al., 2011).
Statistical analysisThe majority of data analysis was completed using one-way ANOVAfollowed by Bonferroni’s post hoc test. ELISA was assessed using theKruskal–Wallis analysis and Dunn’s post hoc test. Barnes maze searchstrategy was analyzed using a � 2 and latency with a two-way ANOVA.Life-span studies were analyzed using the Kaplan–Meier survival curve.
ResultsIdentification, development, and implementation of rAAV2/1shRNA targeting GSK-3� and GSK-3�Four hairpin shRNA constructs were designed using a proprie-tary Origene algorithm to target GSK-3� or GSK-3� and theywere evaluated by transfection into N2a cells along with a scram-bled hairpin control to determine which shRNA yielded the high-est expression (Fig. 1A,B). Due to high sequence homology ofGSK-3 isoforms, each hairpin was assessed for both GSK-3� andGSK-3� expression. In the case of GSK-3�, since shRNA GSK-3�#1 showed no target reduction and #4 displayed cellular toxicity(t(4) � 1.459, p � 0.2182 and �50%, respectively), both wereeliminated from the study (Fig. 1A). The GSK-3� #2 and #3 of
7394 • J. Neurosci., May 23, 2012 • 32(21):7392–7402 Hurtado, Molina-Porcel et al. • Silencing GSK3 Isoforms in Alzheimer’s Disease Mouse Model

both shRNAs showed a significant GSK-3� reduction (82 and74%, respectively, p � 0.001) compared with untreated cells(F(2,6) � 54.82, p � 0.0001) without affecting GSK-3� expres-sion. Since shRNA GSK-3� #2 showed higher KD levels, it waschosen for further development (Fig. 1B). In the case of GSK-3�,shRNAs GSK-3� #3 and #4 displayed cellular toxicity (�50%)and were therefore eliminated from consideration. ShRNAGSK-3� #1 and #2 showed similar levels of GSK-3� reduction (65and 57%, respectively, p � 0.001) and little toxicity comparedwith untreated cells (F(2,5) � 298.5, p � 0.0004). However, inshRNA GSK-3� #1, we observed a nonsignificant trend towardGSK-3� reduction (17%, p � 0.34), therefore shRNA GSK-3� #2was selected for further development. No alterations in GSK-3
expression were observed with scramble shRNA control (F(3,4) �1.125, p � 0.4386).
Pseudotype rAAV2/1 viruses containing hairpin sequences forGSK-3� #2, GSK-3� #2, and a scrambled shRNA (designated asshRNA-�, shRNA-�, and shRNA-scr, respectively) were pro-duced and injected into newborn wt mice (see Material andMethods). To evaluate AAV distribution, wt mice were examinedat 4 months postinjection by monitoring ZsGreen expressionwhich was found predominately in hippocampal regions CA1–CA3, the granular cell layer of the dentate gyrus, and with morevariability in deeper cortical layers four through six along withcortical amygdala regions (Fig. 1C). Overall, cortical regions in closeproximity to the lateral ventricles showed higher transduction than
Figure 1. shRNA selection, rAAV distribution and expression, and lack of evidence of off-target effects. N2a cells were transfected with hairpin constructs and selected with puromycin for 7d. Ascontrols, N2a cells were transfected with an empty vector (VEC) or a scrambled hairpin control (scr). A, Representative Western blot of GSK-3� shRNA #1– 4 and (B) GSK-3� shRNA #1– 4demonstrates that shRNA GSK-3� #2 showed the highest KD level (F(2,6) � 54.82, p � 0.0001), and GSK-3� #2 showed a GSK-3� reduction without affecting GSK-3� levels (F(2,5) � 298.5, p �0.0004). Wt neonates (n � 15/group) were uninjected or injected with shRNA-scr, shRNA-�, or shRNA-� and evaluated at 4 months of age to confirm rAAV distribution and targeted-gene KD. C,Representative images of both anterior and posterior brain after shRNA-scr treatment shows rAAV distribution stained for ZsGreen (green) within hippocampal regions and deeper cortical layers ina rostrocaudal pattern. Scale bar, 1 mm. D, Representative immunofluorescence images of the CA1 region of hippocampus from each of the three shRNA treatment groups and uninjected controlsare shown immunostained for ZsGreen or for both GSK-3�� isoforms (red) and counterstained with DAPI (blue). Merging GSK-3 and ZsGreen expression reveals that expression of rAAV2/1 directlyleads to reduction of targeted GSK-3 isoforms (highlighted by white circles), whereas neurons lacking rAAV2/1 show no loss of GSK-3 expression (highlighted by dashed white circles). Scale bar, 50�m. To analyze possible off-target effects, N2a cells were treated with shRNA-scr, shRNA-�, and shRNA-�. DMSO and thapsigargin (Thap) treatment were used as negative and positive controls,respectively (E). Representative Western blot and (F ) densitometric analysis of phosphorylated eIF2� (Ph-eIF2�) normalized to GAPDH reveals no significant alterations (F(4,5) � 0.6255, p �0.6650). Untreated, un; shRNA-scr-treated cells, scr; shRNA-�-treated cells, �; and shRNA-�-treated cells, �.
Hurtado, Molina-Porcel et al. • Silencing GSK3 Isoforms in Alzheimer’s Disease Mouse Model J. Neurosci., May 23, 2012 • 32(21):7392–7402 • 7395
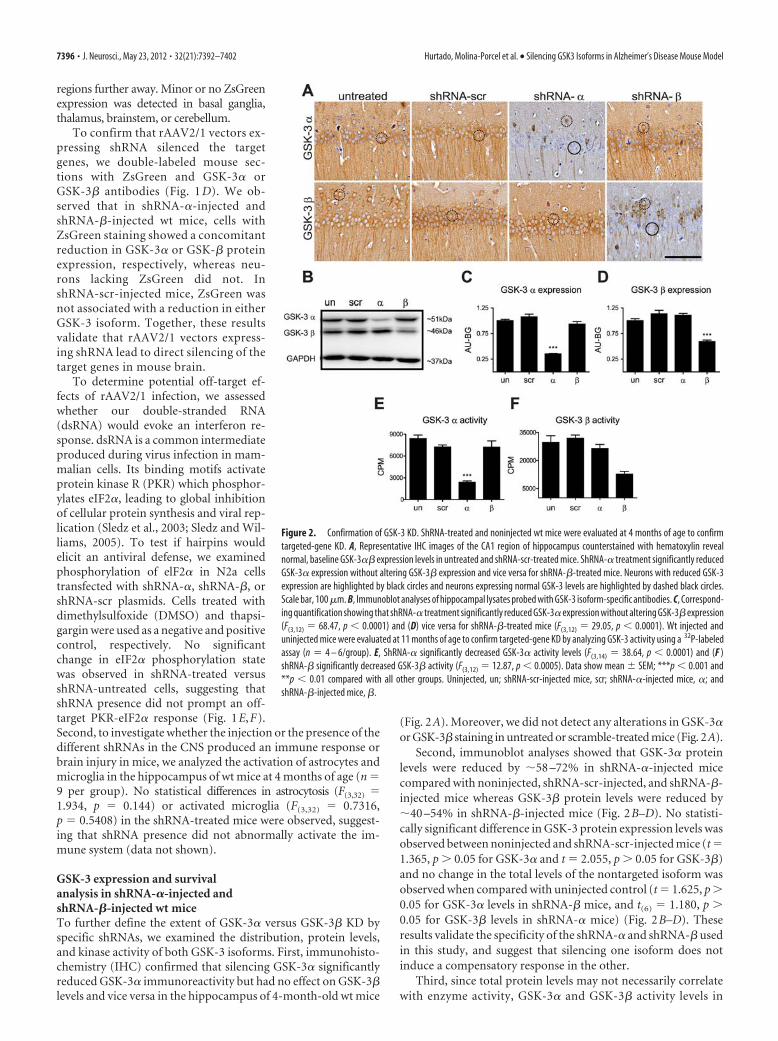
regions further away. Minor or no ZsGreenexpression was detected in basal ganglia,thalamus, brainstem, or cerebellum.
To confirm that rAAV2/1 vectors ex-pressing shRNA silenced the targetgenes, we double-labeled mouse sec-tions with ZsGreen and GSK-3� orGSK-3� antibodies (Fig. 1 D). We ob-served that in shRNA-�-injected andshRNA-�-injected wt mice, cells withZsGreen staining showed a concomitantreduction in GSK-3� or GSK-� proteinexpression, respectively, whereas neu-rons lacking ZsGreen did not. InshRNA-scr-injected mice, ZsGreen wasnot associated with a reduction in eitherGSK-3 isoform. Together, these resultsvalidate that rAAV2/1 vectors express-ing shRNA lead to direct silencing of thetarget genes in mouse brain.
To determine potential off-target ef-fects of rAAV2/1 infection, we assessedwhether our double-stranded RNA(dsRNA) would evoke an interferon re-sponse. dsRNA is a common intermediateproduced during virus infection in mam-malian cells. Its binding motifs activateprotein kinase R (PKR) which phosphor-ylates eIF2�, leading to global inhibitionof cellular protein synthesis and viral rep-lication (Sledz et al., 2003; Sledz and Wil-liams, 2005). To test if hairpins wouldelicit an antiviral defense, we examinedphosphorylation of elF2� in N2a cellstransfected with shRNA-�, shRNA-�, orshRNA-scr plasmids. Cells treated withdimethylsulfoxide (DMSO) and thapsi-gargin were used as a negative and positivecontrol, respectively. No significantchange in eIF2� phosphorylation statewas observed in shRNA-treated versusshRNA-untreated cells, suggesting thatshRNA presence did not prompt an off-target PKR-eIF2� response (Fig. 1E,F).Second, to investigate whether the injection or the presence of thedifferent shRNAs in the CNS produced an immune response orbrain injury in mice, we analyzed the activation of astrocytes andmicroglia in the hippocampus of wt mice at 4 months of age (n �9 per group). No statistical differences in astrocytosis (F(3,32) �1.934, p � 0.144) or activated microglia (F(3,32) � 0.7316,p � 0.5408) in the shRNA-treated mice were observed, suggest-ing that shRNA presence did not abnormally activate the im-mune system (data not shown).
GSK-3 expression and survivalanalysis in shRNA-�-injected andshRNA-�-injected wt miceTo further define the extent of GSK-3� versus GSK-3� KD byspecific shRNAs, we examined the distribution, protein levels,and kinase activity of both GSK-3 isoforms. First, immunohisto-chemistry (IHC) confirmed that silencing GSK-3� significantlyreduced GSK-3� immunoreactivity but had no effect on GSK-3�levels and vice versa in the hippocampus of 4-month-old wt mice
(Fig. 2A). Moreover, we did not detect any alterations in GSK-3�or GSK-3� staining in untreated or scramble-treated mice (Fig. 2A).
Second, immunoblot analyses showed that GSK-3� proteinlevels were reduced by �58 –72% in shRNA-�-injected micecompared with noninjected, shRNA-scr-injected, and shRNA-�-injected mice whereas GSK-3� protein levels were reduced by�40 –54% in shRNA-�-injected mice (Fig. 2B–D). No statisti-cally significant difference in GSK-3 protein expression levels wasobserved between noninjected and shRNA-scr-injected mice (t �1.365, p � 0.05 for GSK-3� and t � 2.055, p � 0.05 for GSK-3�)and no change in the total levels of the nontargeted isoform wasobserved when compared with uninjected control (t � 1.625, p �0.05 for GSK-3� levels in shRNA-� mice, and t(6) � 1.180, p �0.05 for GSK-3� levels in shRNA-� mice) (Fig. 2B–D). Theseresults validate the specificity of the shRNA-� and shRNA-� usedin this study, and suggest that silencing one isoform does notinduce a compensatory response in the other.
Third, since total protein levels may not necessarily correlatewith enzyme activity, GSK-3� and GSK-3� activity levels in
Figure 2. Confirmation of GSK-3 KD. ShRNA-treated and noninjected wt mice were evaluated at 4 months of age to confirmtargeted-gene KD. A, Representative IHC images of the CA1 region of hippocampus counterstained with hematoxylin revealnormal, baseline GSK-3�� expression levels in untreated and shRNA-scr-treated mice. ShRNA-� treatment significantly reducedGSK-3� expression without altering GSK-3� expression and vice versa for shRNA-�-treated mice. Neurons with reduced GSK-3expression are highlighted by black circles and neurons expressing normal GSK-3 levels are highlighted by dashed black circles.Scale bar, 100 �m. B, Immunoblot analyses of hippocampal lysates probed with GSK-3 isoform-specific antibodies. C, Correspond-ing quantification showing that shRNA-� treatment significantly reduced GSK-3� expression without altering GSK-3� expression(F(3,12) � 68.47, p � 0.0001) and (D) vice versa for shRNA-�-treated mice (F(3,12) � 29.05, p � 0.0001). Wt injected anduninjected mice were evaluated at 11 months of age to confirm targeted-gene KD by analyzing GSK-3 activity using a 32P-labeledassay (n � 4 – 6/group). E, ShRNA-� significantly decreased GSK-3� activity levels (F(3,14) � 38.64, p � 0.0001) and (F )shRNA-� significantly decreased GSK-3� activity (F(3,12) � 12.87, p � 0.0005). Data show mean SEM; ***p � 0.001 and**p � 0.01 compared with all other groups. Uninjected, un; shRNA-scr-injected mice, scr; shRNA-�-injected mice, �; andshRNA-�-injected mice, �.
7396 • J. Neurosci., May 23, 2012 • 32(21):7392–7402 Hurtado, Molina-Porcel et al. • Silencing GSK3 Isoforms in Alzheimer’s Disease Mouse Model

hippocampal lysates of shRNA-�-injected, shRNA-�-injected,and shRNA-scr-injected 11-month-old wt mice were comparedwith noninjected controls for GSK-3 enzyme activity. Impor-tantly, a significant 71% decrease in GSK-3� activity in shRNA-
�-injected mice (Fig. 2E), and acomparable 67% reduction in GSK-3� ac-tivity in shRNA-�-injected mice (Fig. 2F)were observed. Significantly, GSK-3� KDdid not affect GSK-3� activity levels (t �0.9417, p � 0.05), and GSK-3� KD didnot affect GSK-3� activity (t � 1.673, p �0.05), suggesting that a single isoform KDdid not trigger a compensatory effect inthe alternate isoform. Further, shRNA-scrhad no effect on GSK-3� or GSK-3� ac-tivity levels (t � 1.641 and t � 0.6733,respectively, p � 0.05). Last, these resultssuggest that KD of the targeted genes waspersistent over 11 months.
Finally, we sought to confirm whetherGSK-3 KD would have deleterious effectson life span. Survival analysis of wt miceinjected with shRNA-�, shRNA-�, or -scrrAAV2/1 monitored up to 12 monthsshowed no difference in life span betweeninjected and uninjected controls (� 2 �2.210, p � 0.53, n � 10 per group) sug-gesting that GSK-3 KD does not alter sur-vival in wt mice.
GSK-3� or GSK-3� KD reduces NFTsand tau phosphorylation as well asmitigates conformational changes inPDAPP �/�;PS19 �/� bigenic miceTo evaluate the effect of GSK-3� andGSK-3� KD on tau phosphorylation andNFT formation, newborn PDAPP�/�;PS19�/� bigenic mice were injected withshRNA-�, shRNA-�, or shRNA-scr rAAV2/1and were examined at 11 months of age (n �15 per group). Although shRNA-�-injectedand shRNA-� PDAPP�/�;PS19�/�-injectedmice had lower reduction of GSK-3� andGSK-� protein expression than previous ex-periments with wt or PDAPP�/� mice, theywere, nonetheless, statistically significant(30%, F(2,57) � 6.271, p � 0.0035, and 29%,F(2,57) � 32.38, p � 0.0001, respectively).
To determine whether specific phos-phorylation sites of tau were affected byGSK-3� or GSK-3� KD, we conductedIHC using antibodies on a number of differ-ent phosphorylation-dependent epitopes,as well as on abnormal conformationepitopes of tau and total tau in the CA3hippocampus region. Quantification ofthe IR load showed that total human taulevels measured by T14 were not alteredby silencing GSK-3� or GSK-3� (Fig. 3A).In contrast, NFTs and tau hyperphospho-rylation associated with pathological tauon Ser202/Thr205 (detected by mAbAT8), Thr231 (mAb AT180), and Ser262
(mAb 12E8) were markedly decreased (Fig. 3A) and quantitationof IHC with both AT180 (Fig. 3B) and 12E8 (Fig. 3C) showedsignificant reductions after GSK-3� or GSK-3� KD. Interest-ingly, reduction in tau hyperphosphorylation was accompanied
Figure 3. GSK-3� or GSK-3� KD reduces tau phosphorylation and conformational changes in PS19 �/�;PDAPP �/� mice.PS19 �/�;PDAPP �/� neonates were uninjected (un) or injected with shRNA-�, shRNA-�, or shRNA-scr and evaluated at 11months of age (n � 15 per group). A, Representative IHC images counterstained with hematoxylin show CA3 regions of posteriorhippocampus stained with antibodies to total tau (T14), phospho-tau Ser202/Thr205 (AT8), phospho-tau Thr231 (AT180),phospho-tau Ser262 (12E8), or conformational specific antibodies Alz50, MC1, or ThS as indicated. Scale bar, 100 �m. PS19 �/�;PDAPP �/� mice treated with shRNA-� or shRNA-� showed a significant reduction in phospho-tau, Alz50, MC1, and ThS staining,but not in total tau load compared with shRNA-scr and noninjected controls. The phospho-tau burden in the CA3 region wasquantified using ImageJ for mAb AT180 (B) and 12E8 (C) in n � 3– 4 mice/group, to demonstrate the quantification of �50%reduction with shRNA-� and shRNA-� treatment compared with controls (F(3,8) � 8.283, p � 0.0078 and F(3,9) � 15.28, p �0.0007, respectively). Data show mean SEM; **p � 0.01, *p � 0.05 compared with shRNA-scr controls.
Hurtado, Molina-Porcel et al. • Silencing GSK3 Isoforms in Alzheimer’s Disease Mouse Model J. Neurosci., May 23, 2012 • 32(21):7392–7402 • 7397

by a decrease in the accumulation of ab-normal tau conformers as detected byconformation-specific antibodies Alz50,MC1, and a dramatic reduction in NFTs asmonitored by ThS, which recognizes�-pleated conformations in tau amyloid in-clusions. Together, these results suggest thatboth GSK-3� and GSK-3� KD were effec-tive in reducing tau hyperphosphorylation,pathological tau conformational changes,and NFT formation.
GSK-3� but not GSK-3� KD decreasesA� levels and SPs in PDAPP �/� andPDAPP �/�;PS19 �/� brainsThe effects of GSK-3 KD on A� amyloiddeposition in SPs and A� levels in brainwere also evaluated in PDAPP�/� andPDAPP�/�; PS19�/� mice injected withrAAV2/1 containing shRNA-�, shRNA-�, orshRNA-scr and examined at 11 months ofage. ShRNA-� and shRNA-� KD resulted ina reduction of GSK-3� (�70%) andGSK-3� (�50%) protein expression, re-spectively, in PDAPP�/� mice (Fig.4E,G). A� levels were measured usingIHC and A� sandwich ELISA. IHC tomonitor A� SP burden in hippocampalregions of PDAPP�/� and PDAPP�/�;PS19�/� mice showed a statistically signifi-cant reduction in A� load after GSK-3� butnot GSK-3� KD in PDAPP�/� andPDAPP�/�;PS19�/� mice (Fig. 4A,B). Ingeneral, the reduction in A� depositionwas more pronounced in PDAPP�/�;PS19�/� mice and a modest increase inA� accumulation was detected in shRNA-�-treated PDAPP �/� and PDAPP �/�;PS19�/� mice when compared with shRNA-scr-treated and shRNA-scr-untreated mice(Fig. 4B). Moreover, measurements ofbrain A� levels by ELISA corroborated IHCstudies of A� load by demonstrating a sim-ilar reduction in soluble and insoluble A�40/42 levels in hippocampus from bothRIPA (Fig. 4C) and FA extracted fractions(Fig. 4D). Overall, A� 40 and A� 42 levelswere statistically different between treat-ment groups in both fractions and geno-types. Moreover, we observed that GSK-3�KD significantly decreased both soluble andinsoluble A� 40 and A� 42 levels compared with noninjected con-trols, whereas mice treated with shRNA-scr or shRNA-� had little tono change in A� 40/42 levels (Fig. 4C,D). Thus GSK-3� KD but notGSK-3� KD reduces A� levels in PDAPP�/� and PDAPP�/�;PS19�/� mice.
To investigate potential mechanisms by which GSK-3� KDreduces A� levels and plaque load, we evaluated APP levels inthe hippocampus of treated PDAPP �/� mice by immunoblots(Fig. 4 E) and showed no group differences in APP expression(Fig. 4 E, H, 5685) or phosphorylation at Thr668 (Fig. 4 E, I,PhAT) of APP. Together, these results suggest that the reduc-tion in A� plaque load by lowering GSK-3� expression is not
mediated by alterations in total APP levels or APPphosphorylation.
Conditional knockout of GSK-3� decreases A� amyloiddeposition and prevents memory deficits in PDAPP �/� miceTo further confirm the effects of GSK-3� on A� deposition, weused a genetic approach and the cre-loxP system to generate tgcko mice overexpressing mutant APP in four genotypes: GSK-3�wt, GSK-3� cko, GSK-3� wt;PDAPP�/�, and GSK-3� cko;PDAPP�/�, all of which were analyzed at 17 months of age. IHCstudies showed a dramatic reduction in GSK-3� immunostain-ing in brains of GSK-3� cko mice without altering GSK-3� im-
Figure 4. GSK-3� KD decreases A� levels and plaque deposition in PDAPP �/� and PDAPP �/�;PS19 �/� brains.PDAPP �/� or PDAPP �/�;PS19 �/� neonates were uninjected (un) or injected with shRNA-�, shRNA-�, or shRNA-scr andevaluated at 11 months of age. A, Representative images of sections immunostained for A� (Nab228) and counterstained withhematoxylin demonstrated a significant reduction in plaque load after GSK-3� KD (n � 15 per group). Scale bar, 1 mm. B,Hippocampal A� load was quantified using ImageJ software (n � 7–12 per group). In both PDAPP �/� and PDAPP �/�;PS19 �/� models, shRNA-� treatment decreased A� burden compared with untreated mice (F(3,124) � 5.269, p � 0.0019 andF(3,91) � 7.701, p � 0.0001, respectively). C, D, In PDAPP �/� and PDAPP �/�;PS19 �/� mice, hippocampal regions wereanalyzed for soluble and insoluble A� levels using A� sandwich ELISA (n �5– 8/group). In PDAPP �/� mice, shRNA-� decreasedsoluble A� 40 and A� 42 levels in the RIPA fraction (C) (A�40 H4 � 16.84, p � 0.0008 and A�42 H4 � 13.39, p � 0.0039); andFA fraction (D) (A� 40 H4 � 14.67, p � 0.0021 and A� 42 H4 � 13.07, p � 0.0045). Likewise, shRNA-� decreased soluble A�40 and A� 42 levels in PS19 �/�;PDAPP �/� mice in the RIPA fraction (C) (A� 40 H4 �10.55, p �0.0144 and A� 42 H4 �10.74,p �0.0132), and FA fraction (D) (A� 40 H4 �10.44, p �0.0152 and A� 42 H4 �9.178, p �0.0270). Data are shown as meanSEM. *p � 0.05, **p � 0.01. E, Western blot and densitometric analysis were performed in triplicate with n � 4 –5 mice/group.Representative blots show GSK-3��, total APP (5685), phosphorylated APP (PhAT), and a loading control (GAPDH). GSK-3� levels(F ) were significantly reduced in mice treated with shRNA-� (F(2,15) � 26.96, p � 0.001), and GSK-3� levels (G) were signifi-cantly reduced in mice treated with shRNA-� (F(2,15) � 12.40, p � 0.0007) compared with shRNA-scr controls. However, neitherthe total APP (H ) nor phospho-APP levels (I ) were altered across treatment groups (F(2,21) � 0.3396, p � 0.7159, and F(2,21) �0.4014, p � 0.6744, respectively). Data show mean SEM; ***p � 0.001 compared with untreated controls.
7398 • J. Neurosci., May 23, 2012 • 32(21):7392–7402 Hurtado, Molina-Porcel et al. • Silencing GSK3 Isoforms in Alzheimer’s Disease Mouse Model

munostaining (Fig. 5A). Although complete knockout (KO) ofGSK-3� was not achieved, only a small number of GSK-3�-positive neurons were detected in clearly defined regions, and thiswas consistent throughout our cohort. Specifically, consistentwith a previous report (Tsien et al., 1996), the most robust reduc-tion overall was observed in the cortex, limbic system, and thal-amus. To a lesser extent, we observed a reduction in the CA2 andCA3 of hippocampus, layers 4 –5 of cortex, lateral amygdale nu-clei, caudate, putamen, and reticular part of substantia nigra, andthere were no changes in the hypothalamus, fornix, septal nuclei,brainstem, and cerebellum (data not shown). Moreover, �70%reduction in hippocampal GSK-3� levels was detected by immu-noblot analyses (Fig. 5B,C), without any evident compensatoryincrease in GSK-3� expression (Fig. 5D).
To evaluate the effect of GSK-3� KO on A� SP burden in ourgenetic models, hippocampi from age-matched GSK-3� wt;PDAPP�/� and GSK-3� cko;PDAPP�/� mice were interrogated by
IHC with anti-A� mAb Nab228 (Fig. 6A),and A� IR load was quantified using ImageJ(Fig.6B).IntheCA1,weobservedasignificantreduction in A� IR SP load in GSK-3� cko;PDAPP�/� compared with GSK-3� wt;PDAPP�/� mice.
Last, to determine whether the above-mentioned changes in A� IR load corre-sponded to alterations in motor activity orspatial memory, GSK-3� wt, GSK-3� cko,GSK-3� wt;PDAPP�/�, and GSK-3� cko;PDAPP�/� mice were tested in the openfield and Barnes maze. GSK-3� wt;PDAPP�/� mice manifested an increasedlevel of locomotor activity in the openfield compared with control groups (Fig.6C), displayed significant deficits in la-tency to find the target on the Barnes maze(Fig. 6D), and used a poor maze strategycompared with all three other groups (Fig.6E). However, GSK-3� cko;PDAPP�/�
performed at a level indistinguishablefrom GSK-3� wt on all three behavioralmeasures (Fig. 6C–E), suggesting thatGSK-3� KO can prevent the locomotorhyperactivity and memory deficits dem-onstrated in PDAPP mice. Importantly,these results are not confounded byGSK-3� KO as we did not detect any dif-ferences between GSK-3� wt and GSK-3�cko mice on locomotor activity or spatialmemory. Together, these data suggest thatGSK-3� KO can prevent behavioral defi-cits and reduce A� plaque burden inPDAPP�/� mice.
DiscussionTo identify the respective roles of bothGSK-3� and GSK-3� in modulating for-mation of AD SPs and NFTs in vivo, weused a novel viral approach and a geneticapproach to manipulate the levels of thesetwo GSK-3 isoforms. Importantly, bothGSK-3� and GSK-3� underwent success-ful KD using isoform-specific shRNArAAV2/1. Moreover, we successfully gen-erated cko of GSK-3� in GSK-3� cko and
GSK-3� cko;PDAPP�/� mice as a second approach to furtherconfirm our findings using the viral approach. Based on bothapproaches, we report that GSK-3�, but not GSK-3�, KD re-duced A� levels and formation of SPs and that both GSK-3� andGSK-3� KD reduced tau phosphorylation, tau misfolding, andNFT numbers in these tg mice. These results suggest that GSK-3�contributes to both SP and NFT pathogenesis while GSK-3� onlymodulates NFT formation.
Our study corroborates previous reports demonstrating thatGSK-3 may regulate APP metabolism (Sun et al., 2002; Li et al.,2003; Phiel et al., 2003; Ryder et al., 2003; Su et al., 2004; Sereno etal., 2009). However, this is the first study to analyze the impact ofmanipulating individual GSK-3 isoforms on the formation of SPsand NFTs in aged tg mouse models of these two signature lesionsof AD. In accordance with a previous cell-based study (Phiel et al.,2003), our data suggest that inhibition of GSK-3� but not
Figure 5. Generation of GSK-3� fx mice, confirmation and characterization of GSK-3� cko mice. cko GSK-3� mice generation.A, Restriction maps (from top to bottom) of the genomic locus, targeting vector, homologous alleles, cko allele, and a constitutiveKO allele. After proper homologous recombination, exons 2– 4 of targeted allele were flanked by loxP sites with the addition of aneomycin (neo) resistant marker flanked by FRT sites and in the absence of ZsGreen. Nonfluorescent selected clones were analyzedby Southern blot. Probes (blue rectangles) were located at the 5� and 3� ends and in the neo fragment. Genomic DNA was digestedwith AflIII for the 5� (B) and Neo probe (D) or KpnI for the 3� probe (C). All four clones were positive for proper homologousrecombination and ES clone BC-09 was selected. After Flp-mediated deletion, a conditional KO allele was generated without Neothrough mating with a Cre-deleter mouse line. Using this Cre-loxP system, wt or cko genotypes (n � 10 –15 mice/group) weregenerated (GSK-3� wt, GSK-3� cko, GSK-3� wt;PDAPP, and GSK-3� cko;PDAPP) and analyzed at 17 months of age. GSK-3� ckowas confirmed by IHC using GSK-3��-specific antibodies. E, Representative images counterstained with hematoxylin show thatin the CA1 region of hippocampus, GSK-3� cko produced a mosaic pattern of neuronal GSK-3� expression and significantlyreduced GSK-3� but not GSK-3� immunoreactivity. Scale bar, 100 �m. Neurons with reduced GSK-3 expression are highlightedby black circles and neurons expressing normal GSK-3 levels are highlighted by dashed black circles. F, GSK-3� cko was alsoconfirmed by Western blot from hippocampal lysates (n � 4 mice/group) and densitometric analysis showing a significantreduction in GSK-3� (G) (67%, t(5) � 9, p � 0.0003) but not in GSK-3� levels (H ) (t(3) � 0.4912, p � 0.6570). Data showmean SEM; ***p � 0.001 compared with �wt. GSK-3� wt, �wt; GSK-3� cko, �cko.
Hurtado, Molina-Porcel et al. • Silencing GSK3 Isoforms in Alzheimer’s Disease Mouse Model J. Neurosci., May 23, 2012 • 32(21):7392–7402 • 7399

GSK-3� is sufficient to reduce A� levels and plaque load, suggest-ing differential roles of GSK-3� and GSK-3� in A� production,accumulation, and SP formation. In contrast, a recent studyfailed to report any changes in A� 40 and A� 42 levels after 3weeks of AAV-APP injection in GSK-3� cko mouse brains(Jaworski et al., 2011). However, this difference is most likely dueto technical issues such as the different levels of APP expression orthe drastically shorter treatment term (3 weeks) compared with11 months in our study. Further studies are necessary to elucidatethe mechanism of GSK-3� in A� and APP metabolism.
Currently, it is unclear if inhibition of GSK-3 directly regu-lates APP proteolysis or indirectly through interaction with anunidentified protein. Our results are consistent with previousreports demonstrating no change in APP (Ryder et al., 2003;Jaworski et al., 2011) or phospho-APP levels (Plattner et al., 2006;Jaworski et al., 2011) after GSK-3 reduction. Furthermore,GSK-3 inhibition could lead to the accumulation and increasedactivity of various GSK-3 phosphorylation substrates including�-catenin, CREB, c-Myc, NFAT, and Notch (Jope and Johnson,2004; Rayasam et al., 2009), that may activate an array of genesand modulate APP metabolism. Importantly, this effect may havethe greatest impact in brain regions specifically relevant to ADsuch as the hippocampus where GSK-3 is highly expressed and
active in resting neuronal and glia cells (Yao et al., 2002). Ourstudy and others highlight the importance of further effort aimedat uncovering the mechanism behind GSK-3 regulation of APPand A� processing.
Our data on tau phosphorylation by GSK-3� and GSK-3�corroborate previous findings that both isoforms contribute tonormal and pathological tau phosphorylation (Ishiguro et al.,1988, 1993; Perez et al., 2003; Noble et al., 2005; Sereno et al.,2009). Other isoform-specific studies in vivo have shown thatoverexpression of GSK-3� increases phosphorylation of tau(Spittaels et al., 2000; Lucas et al., 2001) while overexpression of adominant-negative form of GSK-3� (Gomez-Sintes et al., 2007)or KO of GSK-3� (Alon et al., 2011) decreases endogenous tauphosphorylation. Our results strengthen these conclusions by re-vealing that targeting either GSK-3 isoform is sufficient to reducelevels of pathological phospho-tau species linked to NFT forma-tion and conformational changes associated with formation ofNFTs in a double tg mice model of AD. While our results arelargely consistent with previous studies, it is important to notethat this study is the first to separately assess the impact of indi-vidual GSK-3� and GSK-3� isoforms in NFT pathology.
The use of a viral injection model and a conditional KO ap-proach in AD tg mice in the present study offers significantstrengths and advantages over previous studies. For example, weavoided the use of GSK-3 inhibitors which act indiscriminatelyon both GSK-3 isoforms and other kinases or cellular processesand therefore may confound data interpretation. By individuallytargeting GSK-3� and GSK-� isoforms, we circumvented thebroad and poorly understood targets of kinase inhibitors andinstead focused on one kinase and one isoform at a time. Thisallowed us to confirm and extend our previous conclusion thatselectively silencing GSK-3� reduces A� plaque load as well as thetau tangle burden. Moreover, in addition to demonstrating thatsilencing GSK-3� with shRNA reduced soluble and insoluble lev-els of both A� 40 and A� 42 and plaque load in multiple AD tglines, we were able to further demonstrate a significant ameliora-tion of cognitive deficits in our GSK-3� cko;PDAPP�/� mice.Thus, the utilization of two distinct experimental approachesstrengthens our conclusion that selectively silencing GSK-3� re-duces the A� plaque load.
However, one significant limitation of this study was the vari-ability of KD efficiency between GSK-3 � and GSK-3� isoforms.Specifically, GSK-3� protein levels were only reduced by �50%compared with�70% for GSK-3�. In an attempt to achievehigher GSK-3� KD, we attempted to generate a triple tg mouse(GSK-3�flox/flox;� CaMKII-Cre�/�;PDAPP�/�). However, thiscross failed to generate viable offspring that survived beyond 6months of age (9 of 11 mice died by 6 months) similar to aprevious report (Jaworski et al., 2011). Therefore, we were lim-ited to achieving 50% GSK-3� KD using our shRNA approach.Although this GSK-3� KD efficiency was sufficient to confirm theeffects of this in the behavioral bioassay (forced swim test, datanot shown) and to quantify changes in tau phosphorylation, itwas not sufficient to observe any effects on A�. Therefore, wecannot rule out the possibility that full GSK-3� KD could influ-ence APP proteolysis in vivo and future studies using conditional,inducible, brain-specific KO mice is required to address thisissue.
Similarly, this study was complicated by the variability ofGSK-3 KD efficiency between tg mouse genotypes. Using the viralapproach, GSK-3 was sufficiently silenced in wt and PDAPP�/�
mice; however, the KD in PS19�/�;PDAPP�/� mice was �40%lower. All genotypes were injected at the same time and under the
Figure 6. GSK-3� cko decreases amyloid deposition and prevents memory deficits inPDAPP �/� mice. At 17 months of age, GSK-3� wt, GSK-3� cko, GSK-3� wt;PDAPP, andGSK-3� cko;PDAPP mice were evaluated for A� levels and behavioral phenotype (n � 10 –15/group). A, Representative images show hippocampal A� using mAb Nab228 in GSK-3� wt;PDAPP and GSK-3� cko;PDAPP mice. Scale bar, 500 �m. GSK-3� cko showed significantlyreduced A� immunoreactivity (t(12) � 2.253, p � 0.0438) which was quantified as A� loadusing ImageJ (B). Mice were also assessed for locomotor activity on the open field test (C) andspatial memory (D) and search strategy (E) on the Barnes maze. Compared with GSK-3� wt andGSK-3� cko mice, GSK-3� wt;PDAPP displayed hyperactivity on the open field test (F(3,25) �5.234, p � 0.0061) (C). Compared with GSK-3� wt mice, GSK-3� wt;PDAPP mice performedsignificantly worse (longer latency to find the target) in the Barnes maze (F(3,43) � 3.589, p �0.021) while GSK-3� cko;PDAPP mice were statistically indistinguishable from both groups (D).Last, GSK-3� wt;PDAPP mice were more likely to use a poor search strategy (random) on theBarnes maze compared with the other three genotype groups (�(6)
2 � 26.198, p � 0.0001),while GSK-3� cko;PDAPP were more likely to use beneficial search strategies (serial and spatial)(E). Search strategy data are shown as the percentage of mice using each strategy per genotypecolumn. *p � 0.05, **p � 0.01, ***p � 0.001. GSK-3� wt, �wt; GSK-3� cko, �cko; GSK-3�wt;PDAPP, �wt-APP; and GSK-3� cko;PDAPP, �cko-APP.
7400 • J. Neurosci., May 23, 2012 • 32(21):7392–7402 Hurtado, Molina-Porcel et al. • Silencing GSK3 Isoforms in Alzheimer’s Disease Mouse Model

same conditions by one of two researchers. However, reducingprotein levels by injection of rAAV2 containing shRNA is fraughtwith several technical problems such as the reproducibility of theinjections and virus stability. Alternatively, this difference mayhave been caused by differential tolerability of the virus and mor-tality as PS19�/�;PDAPP�/� mice displayed a higher mortalityrate compared with other lines (�(3)
2 � 34.24, p � 0.0001) regard-less of the shRNA injection. Therefore it is possible that mice withlower GSK-3 KD preferentially survived. Despite this issue, big-enic PS19�/�;PDAPP�/� mice displayed a more profound re-duction in A� plaques after GSK-3 KD compared withmonogenic PDAPP�/� with greater KD efficiency, suggestingthat other factors contribute to reducing A� pathology in thesemice.
In terms of mortality, we did observe an unexpected short-ened life span of PS19�/�;PDAPP�/� and PDAPP�/� micetreated with shRNA-� (data not shown). This effect has not beenobserved in other GSK-3� KD models (MacAulay et al., 2007;Jaworski et al., 2011), our GSK-3� cko mice (�(31,26)
2 � 0.8387,p � 0.3598), or our GSK-3� cko;PDAPP mice (�(20,31)
2 � 2.317,p � 0.1279), suggesting that it might be an artifact or technicalissue of our viral injection paradigm. We speculate that abruptlyreducing GSK-3� levels at the 12 h postnatal developmental stagewhen critical neocortical regions are still under development(Rice et al., 1985) may contribute to additional deleterious brainabnormalities separate from transgene expression of APP andtau, as supported by recent studies (Kaidanovich-Beilin et al.,2009; Kim et al., 2009).
In conclusion, our study highlights the importance of GSK-3�in the formation of A� plaques as well as the role both GSK-3�and GSK-3� play in the pathological development of NFTsformed by pathological tau. Our observations demonstrate thatreducing GSK-3� expression ameliorates the key pathologicalsignatures of AD, i.e., SPs and NFTs, and improves AD-like cog-nitive impairment in our mouse models. These results have im-portant implications for future design of therapeutics that maypreferentially target GSK-3� over GSK-3�. However, beforetherapeutic development can proceed in a fully informed man-ner, the differential roles of GSK-3 isoforms in various cellularmechanisms need to be delineated to fully appreciate such spe-cific targeting. The broad functions of both GSK-3 isoforms allowthem to be potential drug targets in a number of diseases includ-ing cancer, bipolar mood disorder, diabetes, and AD (Jope andJohnson, 2004). Through the use of cko models and RNAi tech-niques, we may begin to understand the critical functions of bothisoforms in the pathogenesis of a variety of diseases.
ReferencesAkiyama H, Shin RW, Uchida C, Kitamoto T, Uchida T (2005) Pin1 pro-
motes production of Alzheimer’s amyloid beta from beta-cleaved amy-loid precursor protein. Biochem Biophys Res Commun 336:521–529.
Alon LT, Pietrokovski S, Barkan S, Avrahami L, Kaidanovich-Beilin O,Woodgett JR, Barnea A, Eldar-Finkelman H (2011) Selective loss of gly-cogen synthase kinase-3alpha in birds reveals distinct roles for GSK-3isozymes in tau phosphorylation. FEBS Lett 585:1158 –1162.
Boyce-Rustay JM, Holmes A (2006) Genetic inactivation of the NMDA re-ceptor NR2A subunit has anxiolytic- and antidepressant-like effects inmice. Neuropsychopharmacology 31:2405–2414.
Brunden KR, Zhang B, Carroll J, Yao Y, Potuzak JS, Hogan AM, Iba M, JamesMJ, Xie SX, Ballatore C, Smith AB 3rd, Lee VM, Trojanowski JQ (2010)Epothilone D improves microtubule density, axonal integrity, and cogni-tion in a transgenic mouse model of tauopathy. J Neurosci 30:13861–13866.
Carroll JC, Boyce-Rustay JM, Millstein R, Yang R, Wiedholz LM, Murphy DL,
Holmes A (2007) Effects of mild early life stress on abnormal emotion-related behaviors in 5-HTT knockout mice. Behav Genet 37:214 –222.
Carroll JC, Iba M, Bangasser DA, Valentino RJ, James MJ, Brunden KR, LeeVM, Trojanowski JQ (2011) Chronic stress exacerbates tau pathology,neurodegeneration, and cognitive performance through a corticotropin-releasing factor receptor-dependent mechanism in a transgenic mousemodel of tauopathy. J Neurosci 31:14436 –14449.
Games D, Adams D, Alessandrini R, Barbour R, Berthelette P, Blackwell C,Carr T, Clemens J, Donaldson T, Gillespie F (1995) Alzheimer-typeneuropathology in transgenic mice overexpressing V717F beta-amyloidprecursor protein. Nature 373:523–527.
Gao G, Lu Y, Calcedo R, Grant RL, Bell P, Wang L, Figueredo J, Lock M,Wilson JM (2006) Biology of AAV serotype vectors in liver-directedgene transfer to nonhuman primates. Mol Ther 13:77– 87.
Giese KP (2009) GSK-3: a key player in neurodegeneration and memory.IUBMB Life 61:516 –521.
Gomez-Sintes R, Hernandez F, Bortolozzi A, Artigas F, Avila J, Zaratin P,Gotteland JP, Lucas JJ (2007) Neuronal apoptosis and reversible motordeficit in dominant-negative GSK-3 conditional transgenic mice. EMBOJ 26:2743–2754.
Hanger DP, Anderton BH, Noble W (2009) Tau phosphorylation: the ther-apeutic challenge for neurodegenerative disease. Trends Mol Med15:112–119.
Hurtado DE, Molina-Porcel L, Iba M, Aboagye AK, Paul SM, Trojanowski JQ,Lee VM (2010) A{beta} accelerates the spatiotemporal progression oftau pathology and augments tau amyloidosis in an Alzheimer mousemodel. Am J Pathol 177:1977–1988.
Ishiguro K, Ihara Y, Uchida T, Imahori K (1988) A novel tubulin-dependentprotein kinase forming a paired helical filament epitope on tau. J Biochem104:319 –321.
Ishiguro K, Shiratsuchi A, Sato S, Omori A, Arioka M, Kobayashi S, Uchida T,Imahori K (1993) Glycogen synthase kinase 3 beta is identical to tauprotein kinase I generating several epitopes of paired helical filaments.FEBS Lett 325:167–172.
Jaworski T, Dewachter I, Lechat B, Gees M, Kremer A, Demedts D,Borghgraef P, Devijver H, Kugler S, Patel S, Woodgett JR, Van Leuven F(2011) GSK-3alpha/beta kinases and amyloid production in vivo. Nature480:E4 –E5; discussion E6.
Jope RS, Johnson GV (2004) The glamour and gloom of glycogen synthasekinase-3. Trends Biochem Sci 29:95–102.
Kaidanovich-Beilin O, Lipina TV, Takao K, van Eede M, Hattori S, LaliberteC, Khan M, Okamoto K, Chambers JW, Fletcher PJ, MacAulay K, DobleBW, Henkelman M, Miyakawa T, Roder J, Woodgett JR (2009) Abnor-malities in brain structure and behavior in GSK-3alpha mutant mice. MolBrain 2:35.
Kim JW, Lee JE, Kim MJ, Cho EG, Cho SG, Choi EJ (2003) Glycogen syn-thase kinase 3 beta is a natural activator of mitogen-activated proteinkinase/extracellular signal-regulated kinase kinase kinase 1 (MEKK1).J Biol Chem 278:13995–14001.
Kim WY, Wang X, Wu Y, Doble BW, Patel S, Woodgett JR, Snider WD(2009) GSK-3 is a master regulator of neural progenitor homeostasis.Nat Neurosci 12:1390 –1397.
Lee EB, Skovronsky DM, Abtahian F, Doms RW, Lee VM (2003) Secretionand intracellular generation of truncated Abeta in beta-site amyloid-betaprecursor protein-cleaving enzyme expressing human neurons. J BiolChem 278:4458 – 4466.
Lee EB, Leng LZ, Zhang B, Kwong L, Trojanowski JQ, Abel T, Lee VM (2006)Targeting amyloid-beta peptide (Abeta) oligomers by passive immuniza-tion with a conformation-selective monoclonal antibody improves learn-ing and memory in Abeta precursor protein (APP) transgenic mice. J BiolChem 281:4292– 4299.
Lee EB, Zhang B, Liu K, Greenbaum EA, Doms RW, Trojanowski JQ, Lee VM(2005) BACE overexpression alters the subcellular processing of APP andinhibits Abeta deposition in vivo. J Cell Biol 168:291–302.
Li B, Ryder J, Su Y, Zhou Y, Liu F, Ni B (2003) FRAT1 peptide decreasesAbeta production in swAPP(751) cells. FEBS Lett 553:347–350.
Li J, Daly TM (2002) Adeno-associated virus-mediated gene transfer to theneonatal brain. Methods 28:203–207.
Lucas JJ, Hernandez F, Gomez-Ramos P, Moran MA, Hen R, Avila J (2001)Decreased nuclear beta-catenin, tau hyperphosphorylation and neurode-generation in GSK-3beta conditional transgenic mice. EMBO J 20:27–39.
MacAulay K, Doble BW, Patel S, Hansotia T, Sinclair EM, Drucker DJ, Nagy
Hurtado, Molina-Porcel et al. • Silencing GSK3 Isoforms in Alzheimer’s Disease Mouse Model J. Neurosci., May 23, 2012 • 32(21):7392–7402 • 7401

A, Woodgett JR (2007) Glycogen synthase kinase 3alpha-specific regu-lation of murine hepatic glycogen metabolism. Cell Metab 6:329 –337.
Noble W, Planel E, Zehr C, Olm V, Meyerson J, Suleman F, Gaynor K, WangL, LaFrancois J, Feinstein B, Burns M, Krishnamurthy P, Wen Y, Bhat R,Lewis J, Dickson D, Duff K (2005) Inhibition of glycogen synthasekinase-3 by lithium correlates with reduced tauopathy and degenerationin vivo. Proc Natl Acad Sci U S A 102:6990 – 6995.
O’Leary TP, Savoie V, Brown RE (2011) Learning, memory and search strat-egies of inbred mouse strains with different visual abilities in the Barnesmaze. Behav Brain Res 216:531–542.
Passini MA, Wolfe JH (2001) Widespread gene delivery and structure-specific patterns of expression in the brain after intraventricular injectionsof neonatal mice with an adeno-associated virus vector. J Virol75:12382–12392.
Perez M, Hernandez F, Lim F, Díaz-Nido J, Avila J (2003) Chronic lithiumtreatment decreases mutant tau protein aggregation in a transgenicmouse model. J Alzheimers Dis 5:301–308.
Phiel CJ, Wilson CA, Lee VM, Klein PS (2003) GSK-3alpha regulates pro-duction of Alzheimer’s disease amyloid-beta peptides. Nature 423:435– 439.
Plattner F, Angelo M, Giese KP (2006) The roles of cyclin-dependent kinase5 and glycogen synthase kinase 3 in tau hyperphosphorylation. J BiolChem 281:25457–25465.
Rayasam GV, Tulasi VK, Sodhi R, Davis JA, Ray A (2009) Glycogen synthasekinase 3: more than a namesake. Br J Pharmacol 156:885– 898.
Rice FL, Gomez C, Barstow C, Burnet A, Sands P (1985) A comparativeanalysis of the development of the primary somatosensory cortex: inter-species similarities during barrel and laminar development. J Comp Neu-rol 236:477– 495.
Ryan KA, Pimplikar SW (2005) Activation of GSK-3 and phosphorylationof CRMP2 in transgenic mice expressing APP intracellular domain. J CellBiol 171:327–335.
Ryder J, Su Y, Liu F, Li B, Zhou Y, Ni B (2003) Divergent roles of GSK3 andCDK5 in APP processing. Biochem Biophys Res Commun 312:922–929.
Sereno L, Coma M, Rodríguez M, Sanchez-Ferrer P, Sanchez MB, Gich I,
Agullo JM, Perez M, Avila J, Guardia-Laguarta C, Clarimon J, Lleo A,Gomez-Isla T (2009) A novel GSK-3beta inhibitor reduces Alzheimer’spathology and rescues neuronal loss in vivo. Neurobiol Dis 35:359 –367.
Sledz CA, Williams BR (2005) RNA interference in biology and disease.Blood 106:787–794.
Sledz CA, Holko M, de Veer MJ, Silverman RH, Williams BR (2003) Acti-vation of the interferon system by short-interfering RNAs. Nat Cell Biol5:834 – 839.
Spittaels K, Van den Haute C, Van Dorpe J, Geerts H, Mercken M, BruynseelsK, Lasrado R, Vandezande K, Laenen I, Boon T, Van Lint J, VandenheedeJ, Moechars D, Loos R, Van Leuven F (2000) Glycogen synthase kinase-3beta phosphorylates protein tau and rescues the axonopathy in the cen-tral nervous system of human four-repeat tau transgenic mice. J BiolChem 275:41340 – 41349.
Su Y, Ryder J, Li B, Wu X, Fox N, Solenberg P, Brune K, Paul S, Zhou Y, LiuF, Ni B (2004) Lithium, a common drug for bipolar disorder treatment,regulates amyloid-beta precursor protein processing. Biochemistry43:6899 – 6908.
Sun X, Sato S, Murayama O, Murayama M, Park JM, Yamaguchi H,Takashima A (2002) Lithium inhibits amyloid secretion in COS7 cellstransfected with amyloid precursor protein C100. Neurosci Lett 321:61– 64.
Tsien JZ, Chen DF, Gerber D, Tom C, Mercer EH, Anderson DJ, Mayford M,Kandel ER, Tonegawa S (1996) Subregion- and cell type-restricted geneknockout in mouse brain. Cell 87:1317–1326.
Woodgett JR (1990) Molecular cloning and expression of glycogen synthasekinase-3/factor A. EMBO J 9:2431–2438.
Yao HB, Shaw PC, Wong CC, Wan DC (2002) Expression of glycogen syn-thase kinase-3 isoforms in mouse tissues and their transcription in thebrain. J Chem Neuroanat 23:291–297.
Yoshiyama Y, Higuchi M, Zhang B, Huang SM, Iwata N, Saido TC, Maeda J,Suhara T, Trojanowski JQ, Lee VM (2007) Synapse loss and microglialactivation precede tangles in a P301S tauopathy mouse model. Neuron53:337–351.
7402 • J. Neurosci., May 23, 2012 • 32(21):7392–7402 Hurtado, Molina-Porcel et al. • Silencing GSK3 Isoforms in Alzheimer’s Disease Mouse Model