tesi v29 EN 2 - copia
182
1 DOCTORAL THESIS Title What groups of factors do senior executives believe affect their use of executive information systems? Author Josep Lluís Cano Giner Program PhD in Business Administration University Escola Tècnica Superior d'Enginyeria Industrial de Barcelona Department Department of Management Supervised by Dr. Marta Díaz Boladeras Dr. Vicenç Fernández Alarcón UPC – Departament of Management Campus SUD - Edif. H AVDA. DIAGONAL, 647 08028 Barcelona Spain
Transcript of tesi v29 EN 2 - copia

1
DOCTORAL THESIS
Title What groups of factors do senior executives believe affect their use of executive information systems?
Author Josep Lluís Cano Giner
Program PhD in Business Administration
University Escola Tècnica Superior d'Enginyeria Industrial de Barcelona
Department Department of Management
Supervised by Dr. Marta Díaz Boladeras Dr. Vicenç Fernández Alarcón
UPC – Departament of Management Campus SUD - Edif. H AVDA. DIAGONAL, 647 08028 Barcelona Spain

2
To Marta, Arnau and Júlia
3
Acknowledgements
Thanking all those who have helped us reach where we are today is always a
difficult task. I hope not to leave anyone out along the way. If I do, it is clearly an
error of omission.
I have been fortunate to be able to dedicate myself to something I truly enjoy:
teaching. This is the primary reason behind my finally writing this thesis. I feel
that I have dedicated myself to this field because I found professors who helped
me understand the importance of education while I was a student. From some, I
learned what I had to do; from others, what I should avoid. Thanks to all of you.
I studied at La Salle Condal (Barcelona), ESADE Business School, Universitat
Politécnica de Catalunya, and Harvard Business School.
I would also like to give special mention to the IT Management Department at
Copenhagen Business School who welcomed me during my international stay
there. Thank you Janni, Leif, Niels, Jan, Ravi, Suzanne, Heidi…
I have also been fortunate to have magnificent colleagues; with some, our
relationship has developed even beyond the professional realm. I learn
something new from you every day: Xavier, Jordi, Paco, Josep Maria, Xari,
Núria, Ricard, Gerard, Mar, Pere, Joan, Enric, Tamiko, Jaime, Enric and
Rodrigo. Thank you.
I have also learned something new from many other people I work with on a
daily basis: Dolors, Marta, Yolanda, Fàtima, Marian,…
And, of course, I’d also like to thank my family who put up with me throughout
the entire thesis preparation process.
Nor can I forget Dr. Marta Díaz Boladeras and Dr. Vicenç Fernández Alarcon,
both of whom accompanied me on the long road culminating in this thesis.

4
I also need to thank the Dean and Vice Deans of ESADE, Dr. Alfons Sauquet,
Dr. Manel Peiró and Dr. Jonathan Wareham, for their invaluable help during this
process. Lastly, I would also like to thank Dr. Eugènia Bieto, ESADE Director
General, and Ramón Aspa, Deputy Director General, for their support.
To all of you, my most sincere thanks.

5
Contents
1. INTRODUCTION 10
2. MOTIVATIONS BEHIND THIS THESIS 12 i. Research object and subjects 12 ii. Scientific motivations 14 iii. Methodological motivations 16
3. CONCEPTUAL FRAMEWORK 17
a. Senior executives 17
b. What is an EIS? 18 i. Methods to provide information to the EIS 20 ii. EIS use 22 iii. Methodology for EIS development 23 iv. Keys behind EIS success 23 v. Current EIS impact on executives’ tasks 25 vi. EIS failures 26
c. Technology Acceptance Model (TAM) 27 i. Introduction to the Technology Acceptance Model 27 ii. TAM 2 29 iii. TAM and other lines of research 30 iv. External variables or factors 31 v. Critical reflections on TAM 33
4. METHODOLOGY 35
a. Introduction to Concept Mapping 35
b. Step 1: Preparation 39 i. Developing the focus 39 ii. Expert user interviews 39 iii. Literature review 40
c. Step 2: Statement generation 52 i. First phase 53 ii. Second phase 54
d. Step 3: Statement structuring 58 i. Participant selection 59 ii. Statement sorting 62 iii. Statement rating 66
e. Step 4: Statement representation (map computation) 66 i. Point map 67 ii. Cluster map 68 iii. Point rating map 71 iv. Cluster rating map 71
f. Reflection on the methodology used 72

6
5. ANALYSIS AND FINDINGS 74 i. Statement list 74 ii. Cluster list and names 82 iii. Point map 91 iv. Cluster map 92 v. Point rating map 94 vi. Cluster rating map 95 vii. Differences between senior executives 98 (1) Prior experience 100 (2) Frequency of use 101 (3) Time dedicated 102 (4) Years of experience 103 (5) Percentage of EIS system used 104 (6) Executives’ self‐evaluation as users 105 (7) Satisfaction with EIS 106 (8) Job position 107 (9) Executives’ age 108 (10) Gender 109 (11) Executives’ work experience 110 (12) Seniority 111
6. REFLECTION AND DISCUSSION 114 i. Answers to research questions: 114 ii. Other findings 117 iii. Scientific contributions 118 iv. Methodological contributions 119 v. Future lines of research 120
7. REFERENCES 122
8. ANNEXES 140
Annex 1: EIS state of the art conceptual map 141
Annex 2: Paper ‐ “Framework for the analysis of executive information systems based on the perceived usefulness and the perceived ease of use” 143
Annex 3: Paper ‐ “Use of computers and applications by senior executives” 161
Annex 4: Survey 175

7
Index of Tables
TABLE 1: FACTORS RELATED TO “THE PERCEIVED EASE OF USE AND PERCEIVED
USEFULNESS OF AN EIS” FROM SENIOR EXECUTIVE INTERVIEWS ........................... 39
TABLE 2: FACTORS RELATED TO “THE PERCEIVED EASE OF USE AND PERCEIVED
USEFULNESS OF AN EIS” BASED ON A REVIEW OF LITERATURE DEDICATED TO
TAM .................................................................................................................................................. 46
TABLE 3: FACTORS RELATED TO “THE RELATIONSHIP BETWEEN EXECUTIVES AND
COMPUTERS OR APPLICATIONS” BASED ON A LITERATURE REVIEW ....................... 52
TABLE 4: SUMMARY OF THE EXTERNAL VARIABLES ................................................................. 54
TABLE 5: LIST OF FACTORS AND THEIR ORIGINS ...................................................................... 58
TABLE 6: FACTORS ORDERED BY MEAN SCORE ........................................................................ 76
TABLE 7 LIST OF DESCRIPTIVES FOR FACTORS’ AVERAGE AND STANDARD DEVIATION
.......................................................................................................................................................... 77
TABLE 8: LIST OF DESCRIPTIVES FOR AVERAGE AND STANDARD DEVIATION
DEPENDING ON FACTORS’ ORIGINS ..................................................................................... 79
TABLE 9: FACTORS’ MEAN, TOP 10 AND TOP 20 RANKINGS ................................................... 79
TABLE 10: T-TEST RESULTS .............................................................................................................. 81
TABLE 11: COMPLETE LIST OF FACTORS AND CLUSTERS ...................................................... 90
TABLE 12: CLUSTERS ORDERED BY MEAN RATING AND THE NUMBER OF FACTORS
INCLUDED. ..................................................................................................................................... 90
TABLE 13: LOWER AND HIGHER RATINGS BY GROUPS ......................................................... 112
TABLE 14 CLUSTERS ORDERED BY AVERAGE RATING .......................................................... 117

8
Index of Figures
FIGURE 1: TECHNOLOGY ACCEPTANCE MODEL (TAM) ............................................................ 28
FIGURE 2: UNIFIED THEORY OF ACCEPTANCE AND USE OF TECHNOLOGY (UTAUT)
(VENKATESH ET AL., 2003) ....................................................................................................... 30
FIGURE 3: HOW INDIVIDUAL DIFFERENCES INFLUENCE TECHNOLOGY USAGE (YI ET
AL., 2005) ........................................................................................................................................ 31
FIGURE 4. CONCEPT MAPPING STEPS (W. M. K. TROCHIM, 1989B) ...................................... 36
FIGURE 5. CONCEPT MAPPING STEPS ADAPTATION ................................................................ 38
FIGURE 6: SCHEMA OF THE PROCESS TO FIND FACTORS ..................................................... 55
FIGURE 7: PROCEDURE TO COMPUTE THE BINARY AND SYMMETRIC SIMILARITY
MATRIX FOR ONE PERSON FROM THEIR CARD SORT .................................................... 63
FIGURE 8: SPREADSHEET WITH PART OF THE GROUPS FOR ONE INTERVIEW .............. 64
FIGURE 9: PART OF A SYMMETRIC SIMILARITY MATRIX FOR INTERVIEW NUMBER 1
FROM THEIR CARD SORT ......................................................................................................... 64
FIGURE 10: PART OF THE ADDED SYMMETRIC SIMILARITY MATRIX FOR ALL THE
INTERVIEWEES ............................................................................................................................ 65
FIGURE 11: THE POINT MAP .............................................................................................................. 67
FIGURE 12: STRESS AND FIT MEASURES ..................................................................................... 68
FIGURE 13: THE CLUSTER MAP ........................................................................................................ 70
FIGURE 14: THE POINT RATING MAP .............................................................................................. 71
FIGURE 15: THE CLUSTER RATING MAP ........................................................................................ 72
FIGURE 16: INTERVIEW FACTORS IN RED .................................................................................... 80
FIGURE 17: GRAPHS FOR NORMALITY OF THE TWO GROUPS OF FACTORS .................... 80
FIGURE 18: BOX PLOT GRAPH FOR THE TWO GROUPS OF VARIABLES ............................. 81
FIGURE 19: PICTURE OF THE FACTORS ON A GLASS WALL ................................................... 82
FIGURE 20: INTERPRETATION OF THE POINT MAP .................................................................... 91
FIGURE 21: INTERPRETATION OF THE CLUSTER MAP ............................................................. 93
FIGURE 22: INTERPRETATION OF THE POINT RATING MAP .................................................... 94
FIGURE 23: INTERPRETATION OF THE CLUSTER RATING MAP ............................................. 96
FIGURE 24: HIGHER AND LOWER IMPACT REGIONS IN THE CLUSTER RATING MAP ..... 96
FIGURE 25: DIMENSIONS OF THE CLUSTER MAP ....................................................................... 97
FIGURE 26: RATING VALUES BY SENIOR EXECUTIVES THAT HAVE PRIOR EXPERIENCE
WITH EIS AND SENIOR EXECUTIVES WITHOUT IT .......................................................... 100
FIGURE 27: RATING VALUES BETWEEN SENIOR EXECUTIVES BASED ON EIS
FREQUENCY OF USE ............................................................................................................... 101
FIGURE 28: RATING VALUES BETWEEN SENIOR EXECUTIVES BASED ON THE TIME
SPENT USING THE EIS ............................................................................................................. 102
9
FIGURE 29: RATING VALUES BETWEEN SENIOR EXECUTIVES BASED ON THEIR YEARS
OF EXPERIENCE AS EIS USERS ........................................................................................... 103
FIGURE 30: RATING VALUES BETWEEN SENIOR EXECUTIVES BASED ON THE
PERCENTAGE OF THE EIS SYSTEM USED ........................................................................ 104
FIGURE 31: RATING VALUES BY EXECUTIVES’ SELF-EVALUATIONS .................................. 105
FIGURE 32: RATING VALUES BY EXECUTIVES’ SATISFACTION WITH THEIR EIS ............ 106
FIGURE 33: RATING VALUES BY JOB POSITION ........................................................................ 107
FIGURE 34: RATING VALUES BASED ON THE SENIOR EXECUTIVES’ AGES ..................... 108
FIGURE 35: RATING VALUES BASED ON SENIOR EXECUTIVES’ GENDER ........................ 109
FIGURE 36: RATING VALUES BASED ON WORK EXPERIENCE .............................................. 110
FIGURE 37: RATING VALUES BY EXECUTIVES’ SENIORITY ................................................... 111

10
What groups of factors do senior executives believe affect their use of
executive information systems?
1. Introduction
In a highly competitive and turbulent environment, executives need more
efficient ways to analyze their companies, markets and competitors. The aim is
to help their organizations become more competitive and, as a result, survive
the changes taking place around them. Executive Information Systems (EIS)
can help executives access the internal and external data they need to be able
to make the right decisions and achieve their organizations’ objectives. As Ikart
(2005) indicates, a significant number of organizations have invested heavily in
EIS to improve the performance gain of executives’ roles. If senior executives
adopted these systems more widely, they would probably increase their
productivity.
The beginnings of the relationship between Information Technologies,1
executives and decision-making can be traced back to the times of the first
computers. However, executives have been reluctant to use IT systems to
make decisions. Scholars have provided several arguments over the years to
explain this lack of computer use among executives, including: poor keyboard
skills, a lack of training and experience in computer use, and even concern
about their status, as they felt that using a computer was not a part of their job
(Mohan, Holstein, & Adams, 1990). Executives also have little time to play
around with new technologies, they are reluctant to use the technology due to
personal computer anxiety, they lack IT skills and proficiency and dedicated
staff is not available to answer their queries (Seyal & Pijpers, 2004). In addition,
another set of reasons refers to the alternative between system flexibility or
simplicity, that is, if systems were inflexible or overly-simple, executives
perceived them as adding no value, but there are other cases in which
1 In Spain, most people commonly talk about “Information and Communication Technologies,” but “Information Technology” is more common abroad, generally including Communication Technologies in the term. In this thesis I use “IT.”

11
executives have overcome these obstacles, for example, executives at
Lockheed-Georgia (Houdeshel & Watson, 1987).
In the mid-1950s, most scientists believed that computers would have a notable
impact on scientific calculations (e.g., in astronomy and the military sphere). A
few (including Russell Ackoff, John Diebold and J.W. Forrester) agreed that
computers would, in the then immediate future, revolutionize the work of
executives in the policy area, strategy and decision-making as Drucker (1998)
said. The possibility that computers and applications would affect the way
executives worked was already anticipated. Although computers existed before
1965, this date marked an unprecedented change when IBM presented its
System/360 family of products. At that moment, scientists began to ask
themselves how computers might help humans improve their decision-making.
Collaboration between scientists at the Carnegie Institution, together with
Marvin Minsky at the Massachusetts Institute of Technology and John McCarthy
at Stanford University, developed the first cognitive computer models, serving
as the embryo for Artificial Intelligence (Buchanan & O'Connell, 2006).
When observing the current situation within organizations, we can affirm that a
large number of executives have adopted these types of decision-making
solutions. The rise and increasing use of these tools have led to different
studies analyzing why EIS systems are adopted within organizations. The
common objective of these studies has been to determine which factors have to
be considered when implementing an EIS within a given organization for the
project to be successful.
The key conclusions of these studies include: Information Systems
departmental support for EIS projects is directly related to the EIS system’s
success, and both Information Systems’ and vendor/consultant’s support for
EIS projects are influenced by top management’s support; in addition, high
levels of support from a company’s senior executives indirectly influence EIS
success by creating a supportive context for the Information Systems
organization and vendors/consultant in a firm’s EIS efforts (Bajwa, Rai, &
Brennan, 1998). Other studies have determined that there are higher levels of

12
environmental dynamism, heterogeneity, and hostility in firms that have adopted
EIS compared to firms not using an EIS, and a firm’s size determines the EIS
capabilities implemented (support for managerial communications, coordination,
control, and planning) (Bajwa, Rai, & Ramaprasad, 1998). Similarly, there is a
relation between the increase of EIS capabilities (from decision support to
collaboration support) and environmental uncertainty, Information Systems
support and top management support, but not with firm size (Rai & Bajwa,
1997); and, the variables that contribute to the success of an EIS can be
categorized as those that contribute to successful EIS development (the most
important are: executive leadership and continued involvement in the
development process) and those that contribute to successful ongoing EIS
operations (the most important are those that affect the executives and their
work) (R. K. Rainer & Watson,1995a). Other scholars have determined that the
factors that contribute to create new EIS systems are: pressures to improve
corporate performance while simultaneously controlling the growth in the
number of staff who support key executives, widespread knowledge transfers
about EIS systems from publications and conferences, and easier to use, less
expensive, and more powerful technologies to present information to users
(Young & Watson, 1995).
Executive Information Systems, like any other software, are designed to be
used directly by users, in this case, executives. Salmeron (2002) demonstrated
an increase in direct EIS use by executives in two studies on large Spanish
firms. This use increased from 69% to 75.9% in a study carried out in March
1999 compared to another in February 2001. Salmeron argued that this
increase was due to the fact that Spanish executives in these firms had become
aware of the importance information systems have and that new generations
which were more likely to use these EIS were reaching executive positions.
2. Motivations behind this thesis
i. Research object and subjects

13
Senior executives are not easy to study due to their reluctance to participate in
research projects dedicated to them. As such, these executives’ traits as well as
research techniques have to be carefully considered to make this research
possible.
There are few studies readily available on senior executives. For example,
when searching for the topic “senior executives” in the Web of Science2 (part of
the Web of Knowledge, accessed (7/6/12), a total of 573 entries addressed all
the topics dedicated to these executives. As such, studies dedicated to “senior
executives” are especially relevant due to the difficulty in accessing these
professionals, the relevant role that they have in organizations, the differences
that they have with respect to other people in an organization as well as the
reduced number of studies available on them.
Scholars have also carried out various studies on the factors which affect the
success of EIS systems, though they do not examine how these factors affect
the ways executives actually use these systems. Rainer and Watson (1995)
distinguish between the EIS development phase and its posterior use. Their
study includes executives, EIS manufacturers and implementers. These authors
declare that executives’ opinions are the most important and that they
sometimes differ from those of the salesmen and consultants. They conclude
that executives have to assume a more active role in EIS development and that
the most important factor in EIS use is meeting executives’ needs. However,
Rainer and Watson do not analyze cases in which executives find EIS systems
already implemented upon joining their organizations. Their study raises an
important question, that is, if executives’ opinions are the most important, why
not only ask them?
In a later study, Bajwa, Rai and Brennan (1998) analyze factors related to
support from management, the IT department and salesmen and/or consultants. 2 Web of Science ® provides researchers, administrators, faculty, and students with quick, powerful access to the world's leading citation databases. Authoritative, multidisciplinary content covers over 12,000 of the highest impact journals worldwide, including Open Access journals and over 150,000 conference proceedings. (http://thomsonreuters.com website, accessed July, 2012)

14
They conclude that support from senior management and salesmen/consultants
has no effect on an EIS system’s success, though they admit that one of the
limits of their study is the reduced number of participants in their research.
As discussed above, research does exist analyzing the causes of EIS success
or failure, but very few studies have focused on EIS adoption by executives and
on the factors or series of factors which lead executives to use these types of
information systems developed especially for them.
The objective of this thesis, then, is to uncover which factors senior executives
feel affect their use of EIS, compare the factors they propose to those
mentioned in other studies related to EIS or other IT artifacts to thus determine
the factors’ importance, and group the factors which affect or may affect senior
executives.
Improving our awareness of these factors and how they can be grouped
together may serve to help professionals manage EIS projects better and
achieve better results in terms of their adoption and use by senior executives to
help improve their decision making and achieve their organizational goals.
ii. Scientific motivations
Among all the different theories developed in the Information Systems area and,
concretely, those related with the prediction of an information system’s
acceptance the Technology Acceptance Model or TAM (F. D. Davis, 1989) is
the most utilized. TAM is an adaptation of the Theory of Reasoned Action (TRA)
to the IT field. TAM suggests that a user’s behavioral intention (BI) is the factor
which allows us to better predict how he or she actually uses the system. This
intention is determined by the user’s attitude towards the system’s use. TAM
posits that perceived usefulness and perceived ease of use determine an
individual's intention to use a system, this ‘intention to use it’ serving as a
mediator of actual system use. Perceived usefulness is also seen as being
directly impacted by a system’s perceived ease of use. Researchers have

15
simplified TAM by removing the attitude construct found in TRA from the current
specification (Venkatesh, Morris, Davis, & Davis, 2003).
In their meta-analysis of TAM, Yousafzi, Foxall and Pallister (2007a) indicate
that “according to Davis (1989), one of the key purposes of TAM was to provide
a basis for tracing the impact of factors on internal beliefs, i.e., Perception of
Usefulness and Perception of Ease Of Use, and to link that to actual use.” This
link to actual use was also found by Wöber and Gretzel (2000) who affirmed
that “the results indicate that the actual use of the system is strongly dependent
on perceived ease of use and perceived usefulness.”
Yousafzi, Foxall and Pallister (2007a) also reported that:
• There were only 5 studies related to managers or executives, EIS or
DSS (Decision Support Systems), out of 145 studies, and that
• Only one of these 5 studies analyzed the factors. This study was carried
out by Pijpers, Bemelmans, Heemstra and van Montfort (2001) and
analyzes the underlying factors, though they propose grouping these
factors as follows:
A review of the relevant literature also suggests [that] the external, independent variables can be categorized in: individual characteristics, organizational characteristics, task-related characteristics, and characteristics of the IT Resource.
I found one more study in a more detailed search on EIS and TAM. This study
was undertaken by Ikart (2005) who proposed grouping these factors as
follows:
The variables used from Triandis’ framework (1979) in this paper are: Social factor, Habits and Facilitating conditions.
Both analyze the underlying factors though they propose two different sets of
criteria with which to group them.
Lee, Kozar and Larsen (2003) conclude their article by arguing that there are
still various areas which need to be further examined, including the

16
incorporation of more variables and exploring environmental conditions. One of
these areas is precisely the scientific motivation behind this thesis, namely, to
contribute to clarify the importance different factors have in understanding IT
use by a specific group of users and to confirm the need to carry out prior
qualitative studies before studying the factors between a given type of user and
a given type of IT solution. This thesis also aims to contribute to improve one of
the most studied theories in the IT field.
iii. Methodological motivations
The methodology proposed to group these factors together is Concept Mapping
(W. M. K. Trochim, 1985; W. M. K. Trochim, 1989b). Concept Mapping is a
general framework for structured conceptualization and shows how specific
conceptualization processes can be devised to assist groups in the theory and
concept formation stages of planning and evaluation. This process usually
consists of 6 steps as we shall see in Chapter 4 below. Another of this thesis’
purposes is to apply the Concept Mapping method to senior executives.
However, we shouldn’t confuse this methodology with “concept maps.” The
latter were developed in 1972 in the course of Novak’s research program at
Cornell.
This research is a novel example using Concept Mapping. In addition, it may
also provide us with an example on applying this methodology with ITs and
senior executives.
The structure of this thesis is divided into five main sections after the
introduction and the discussion on motivations: the conceptual framework,
research methodology, analysis and findings, reflection and discussion,
references, and annexes.
The objective of the conceptual framework section is to define these senior
executives, EIS and TAM; as such, it is divided into three main subsections.

17
3. Conceptual framework
a. Senior executives
Executives play an important role in organizations. They occupy the higher
positions in firms and, most fundamentally, they decide on the future of their
organizations. They need information to make these decisions, and EIS
systems are the IT platforms designed to facilitate these decisions.
There are different types of executives within organizations, but the literature
distinguishes “senior executives” from others. Seeley and Targett (1997)
propose the following definition: “an executive who is concerned with the
strategic direction of their organization’s business.” They add that the senior
executive “is in a position to influence significantly the strategic decision-making
processes for their function and/or the organization; has substantial control and
authority above how resources are deployed; is in a position to influence the
strategic direction of the Business of their function/organization; may have other
senior managers reporting to him or her.”
Numerous studies in the literature analyze the relationship between executives
and information systems. In these studies, executives are also considered
different types of users based on their work, status, roles, skills, etcetera.
Different authors refer to executives in many different ways: federal decision
makers; legislators and members of their office support staff; staff members of
selected committees that deal with advanced technologies on a routine basis;
and administrators of Executive Branch agencies (Ault & Gleason, 1998; Brady,
1967; Buchanan & O'Connell, 2006; Cano Giner, 2011; Elbeltagi, McBride, &
Hardaker, 2005; Hasan & Lampitsi, 1995; Marginson, King, & McAulay, 2000;
Mawhinney & Lederer, 1990; Pijpers et al., 2001; Pijpers & van Montfort, 2006;
Puuronen & Savolainen, 1997; M. Seeley & Targett, 1999; Seyal & Pijpers,
2004; Stenfors, Tanner, Syrjanen, Seppala, & Haapalinna, 2007; Vlahos &
Ferratt, 1995).

18
Senior executives are a special group which need to be studied. Seyal and
Pijpers (2004) declare that “senior executives’ use of ITs is purely optional and
[they] are unlikely to be highly influenced by peers or subordinates”, adding, “it
is therefore important that they should be treated as a special group due to the
nature and type of duties performed.”
I concur that these are the reasons why we should study senior executives.
b. What is an EIS?
Executive Information Systems are a type of Decision Support System (DSS)
based on providing organizational executives with data (Fitzgerald, 1992). They
can, however, be used at different executive levels. They are flexible tools
which provide broad, in-depth information and which have analytical capabilities
supporting a wide range of executives’ decisions (Houdeshel & Watson, 1987)
(Rockart & DeLong, 1988). EIS systems are designed to make the data from
lower areas within the organization, essentially, data from transactional
systems, easy to use and available to executives for these to be able to make
decisions on a highly informed and qualified basis (Stevenson, 1994).
EIS have transformed enormously since 1976 when Ben Heineman, Northwest
Industries CEO, began using a terminal and a database to monitor and plan the
growth of the company’s nine business units (Rockart & Treacy, 1982).
Watson, Rainer and Koh (1991) define EIS as computer-based systems which
provide executives easy access to internal and external data that are essential
for their critical success factors (Rockart, 1979). A review of key studies on EIS
characteristics offers the following list of EIS traits (Burkan, 1988; Friend, 1986;
Kogan, 1986; Zmud, 1986):
a. They are designed for each individual executive.
b. They extract, filter, compress and track critical information.

19
c. They provide real-time access, analyze trends, generate exceptions
reports and enable drilling down from the aggregate level to details.
d. They access and incorporate a wide range of internal and external data.
e. They are very easy to use and require very little training, if any, for their
use.
f. They are used directly by the executives, without the need for
intermediaries.
g. Data are presented in graphic form, in tables and/or in text format.
The literature also makes an important distinction between these EIS systems
and Executive Support Systems (ESS). According to Hung (2003), these two
types of systems should not be confused, as ESS provide the following
capacities in addition to the traits described above:
a. They permit electronic communications (for example, e-mail, computer-
based conferences and text processors).
b. They have data analysis capacities (for example, spreadsheets and
consulting language); and
c. They include organizational tools (for example, a calendar).
EIS data sources are also diverse in origin, including, for example, the
company’s transactional systems, financial data systems, sales data systems,
text files and manually introduced data. All these are internal sources. However,
a fundamental trait defining EIS systems is that they also gather external data.
As such, they should have access to sources such as news items, legal
regulations and analyses on the competition (Young & Watson, 1995).
This external information is critical in many industries. For example, John C.
Wilson, CFO at Hardee’s Food Systems (an American fast food company with
more than 2 billion dollars in sales in 1985), argued that, when he analyzed the
company’s sales in a geographic area where profits were worse than in other
areas, he discovered that these results were due to inclement weather in that
area over the timeframe analyzed (Madlin, 1986).

20
EIS were increasingly developed in the second half of the 1980s due to the rise
of new technologies: client/server systems, communications networks, graphic
interfaces, multidimensional models, etc. However, increased market turbulence
was the decisive factor, instilling the need for executives to have systems
available allowing them to access prepared data. These systems represented a
significant aid in their decision-making and in providing them the information
they needed to draft their companies’ strategies.
Today, EIS systems access information stored in data marts or data
warehouses. The latter enable users (senior executives included) to access
cleaner, more consistent and integrated data, thus allowing users to find more
and better quality data. Many EIS systems enable users to access data through
their web browsers which also give them access to data found on their
companies’ intranets and Internet, in general. In addition, some EIS systems
also include On-Line Analytical Processing (OLAP) functions, permitting users
to analyze data at both the aggregate and detailed levels.
i. Methods to provide information to the EIS
Rockart’s Critical Success Factor theory (1979) was fundamental to the
development of EIS. These critical success factors refer to a limited number of
areas. Achieving satisfactory results in these areas implies ensuring competitive
performance for a given individual, his/her department or the organization as a
whole.
In 1979, John F. Rockart published his article entitled “Chief executives define
their own data needs” in which he analyzed different methods to provide data to
executives. These methods included the product-based technique (aggregating
transaction data by products or product lines), the null approximation method
(as executives’ work is dynamic, it cannot be predetermined), key indicator
system (indicator selection, exceptions reports and their visualization), and
analysis of the data that all executives in an organization need (non-existing
data in the process are then added). Lastly, Rockart concluded by proposing

21
the Critical Success Factors (CSF) methodology based on Daniel’s (1961) prior
work on “success factors.”
The CSF method is based on executives’ individual preferences, implying that
these factors can be different for different executives and that they can change
over time for the same executive. For each organization, these CSFs are a
limited number of areas which, if results are satisfactory, will ensure their
competitive success. As such, executives have to pay special and continuous
attention to these areas. This methodology proposes that CSFs have to be
aligned with the organizations’ objectives.
According to Rockart (1979), CSFs are designed according to:
a. The structure of each industry,
b. The companies’ competitive advantage, market position and geographic
location,
c. Environmental factors, and
d. Temporal factors.
CSFs can also be different among similar organizations given that the situation
in one may still be quite different from that in another (Rockart, 1979).
In his article, Rockart (1979) declares that these CSFs do not serve to define
the data needed to draft organizational strategy since the latter cannot be
predefined. According to Rockart, then, the CSF method defines the information
that executives need to monitor, manage, identify the places where information
has to be monitored and improve existing business areas which can be easily
defined. The same author would later declare, “recognizing that information is a
strategic resource, this clearly implies the need to relate information systems to
business strategy and, especially, ensure that the business strategy is
developed within the context of new IT” (Rockart & Crescenzi, 1984). These
authors allude to IT as much more than support for strategic planning. Rather,
they propose that information technologies are strategy planning components in
themselves (Rockart & Morton, 1984; Volonino & Watson, 1990). This idea is

22
key in furthering IT use by today’s organizations and needs to be highlighted,
though this is not a specific objective of this thesis.
Watson and Frolick (1993) propose that different methods can be used to
determine EIS requirements. Volonino and Watson (1990) provide three
alternatives when deciding which data need to be included in the first EIS
version:
a. Present data which are critical to resolve a potential problem at that
specific moment;
b. Key performance data; and
c. Information aimed at helping executives achieve their organizations’
strategic objectives.
ii. EIS use
Various examples in the literature explore how executives use EIS systems: for
planning and process monitoring (Rockart & Treacy, 1982) and for planning,
analyses and activity monitoring (Volonino & Watson, 1990). Volonino and
Watson declare in their article (1990): “EIS was developed to support Fisher-
Price’s strategic plan.” According to Tang, information has to produce
knowledge, and knowledge combined with a strategic management style can be
effective. Without information, even strategically-oriented executives are
operating only on the basis of good intentions (Tang, 1991). The output from
analyzing data on the environment becomes an input in strategic decision-
making. The quality of the data and the time required to process them are
extremely important: when this information is processed manually, it can create
distortions regarding various “information filters.” As such, EIS systems should
incorporate Artificial Intelligence elements to improve their procedures
compared to traditional EIS, according to Wang and Turban (1991).
The Fisher-Price case (Watson, 2006) is a clear example of how executives
need to be able to access information. In the mid-1980s, this toy manufacturer
23
and distributor suffered a dramatic drop in sales with the advent of videogames.
The company was slow in discovering the change in trends due to the
deficiencies of its information systems. As a result, it had to build new systems
enabling it to access market data quickly and so be able to adequately respond
to environmental changes. The company thus decided to develop an EIS
system which would monitor its business processes and provide information to
all those involved in decision-making. The company developed this EIS system
specifically to help its executives make decisions, though, in this particular case,
it was also developed for the rest of the company’s employees: from lower
echelons to salesmen.
iii. Methodology for EIS development
Volonino and Watson (1990) proposed a specific methodology to develop EIS
projects: Strategic Business Objectives (SBO). The latter is based on EIS
systems being designed to support organizational objectives as expressed by
its executives. Crockett (1992) proposed an additional methodology to ensure
that the needed strategic information flows into the EIS system:
a. Identify the critical success factors and the stakeholders’ expectations;
b. Document the performance measures executives have to monitor;
c. Define report formats and frequency; and
d. Demonstrate how information actually flows and how to use it.
In highly dynamic markets, frequent changes in client requirements, product
quality improvements, new cost controls, etc., are the norm. In these cases, EIS
systems can help executives as these changes imply necessary
transformations in organizational structures and in executive tasks (Volonino,
Watson, & Robinson, 1995).
iv. Keys behind EIS success

24
Rainer and Watson (1995) analyze the keys behind the success of EIS systems
both at the project development level as well as in their posterior use. These
authors carry out a two-phase study: the first stage serves to determine what
the key factors are, and the second to determine their importance. In the
development phase, the authors argue that the 5 key factors in order of
importance are: sponsorship by executives, support from senior management,
defined requirements, the relationship between EIS systems and business
objectives, and the quick delivery of the first EIS version. With respect to use,
they propose the following 5 key factors: ease of use, precise data, on-time
information, relevant data, and system reliability.
Prototyping is the most recommended EIS development methodology
(Guimaraes & Saraph, 1991; Watson et al., 1991). It includes: problem
definition, system development and system implementation. This methodology
views user participation as a priority factor. In other words, executives have to
participate in each attempt to refine the system, something which, without
doubt, helps to align the EIS system and the executives. In addition, this
methodology also allows new requirements to be incorporated as executives
identify these in their changing environment.
There is an interesting reference about developing EIS systems using
prototyping techniques (Nandhakumar & Avison, 1999). These authors
analyzed an EIS development in a large manufacturing company (LMC),
concluding:
The development at LMC appeared to be characterized by improvisation, opportunism, interruption and mutual negotiation as much as progress milestones, planning and management control. The process was marked by cycles of interactions, rather than a sequence of pre-planned stages, in which the developers drew on their knowledge about organizational context and methodologies.
This example shows that sometimes organizations say that they are using a
methodology when in fact they are not.
The literature suggests the existence of critical success factors (CSFs) for the
development of information systems supporting senior executives (Poon &

25
Wagner, 2001). In their research, these authors found a dichotomy between
success and failure cases in EIS implementations, speculating that the “meta-
success” factors in an EIS system’s successful implementation are:
“championship,” “availability of resources” and a “link to organization
objectives.” Furthermore, Salmeron and Herrero (2005) propose using the
analytic hierarchy process (AHP) methodology to determine success factors
priorities to successfully implement EIS systems.
v. Current EIS impact on executives’ tasks
Though originally thought that information technologies would have an
important impact on organizations, the actual impact on executives has been
less than expected since they do not use ITs intensively in decision-making.
According to Drucker (1998), this is due to the fact that ITs have not provided
the information executives need but, rather, normally just internal data extracted
primarily from accounting systems and without bearing in mind that external
information is fundamental in decision-making. Normally, those working in the IT
area generally argue that executives are not prepared to use ITs, but Drucker
affirmed that IT developers have centered on the technology component, not
information. According to Drucker, we need new models to overcome traditional
accounting-based systems and to prepare information for executives. For
example, he mentions activity-based costs and economic value added. The
development of new methodologies, such as the Balanced Scorecard (Kaplan &
Norton, 1992), Total Quality Management and Six Sigma, among others,
provide executives with new models which can help them in strategic
management processes.
Crockett (1992) agrees with Drucker, affirming that EIS’ limits are as follows:
e. EIS systems still fail to provide the information executives consider
crucial (or do so too late), even after their implementation.
f. The information they provide is not interrelated in terms of the different
functional and strategic areas.

26
g. And, the information appearing does help to diagnose problems but it
does not help find solutions.
vi. EIS failures
For many organizations, EIS projects are high-risk initiatives as they’re aimed at
users with few computer skills and who are skeptical in terms of how computers
can help them improve their work (Watson, 1990). EIS projects are also seen as
high-risk due to their high rate of failure (Houdeshel & Watson, 1987; Rockart &
DeLong, 1988). The risk of failure may in fact be higher when implementing an
EIS than key operational systems that have to be made to work regardless
(McBride, 1997). Poon and Wagner (2001) argue that EIS implementation
projects have failed, estimating that as many as 70% of these failures are due
to technological, organizational, psychological and educational issues.
Expectations regarding EIS systems have not always been met (Anónimo,
1995). Chang and Zairi (Zairi, Oakland, & Chang, 1998) carried out a study
identifying a list of motives behind EIS project failures based on the experience
of 23 EIS developers and 15 executives. The first two motives refer to EIS
design, while the last 3 to subjective system user factors:
a. A lack of definition and strategic focus,
b. Poor information quality,
c. Inadequate perception of its return,
d. Opposition from mid-level executives, and
e. Executives’ educational background
Karten (1987) also indicated that EIS systems have not provided the expected
value. She felt that executives need the right information at the right time,
something which is difficult to achieve since this information is difficult to gather,
consolidate and show. One of the primary motives behind this is that there are
many incompatible information sources as they are not structured and cannot
be anticipated. For these reasons, Karten argued that the true value computers

27
provide executives is their analytical speed and access to information. However,
she did not consider the use of data warehouses which consolidate information
from different sources. In addition, in cases where these incompatible sources
exist, they can attempt to consolidate information through Extract, Transform
and Load (ETL) tools or other, more sophisticated instruments which allow
users to deduce content in empty data fields.
Arnott and Pervan (2005) analyze Decision Support Systems studies and
conclude that a major omission in DSS scholarship is the poor identification of
the clients (project buyers) and users of the various DSS applications that are
the focus of research. They also refer to the problem of professional relevance
or the practical contribution of DSS research.
In this thesis, I use Mind Manager (version 5.0.878) to develop the conceptual
framework regarding EIS as can be seen in Annex 1. The map presented is
small and not easily read or printed. I present it only as an example. I believe
that this kind of software is really useful for state-of-the-art research. I also
recommend researchers use mind maps to carry out literature reviews.
c. Technology Acceptance Model (TAM)
i. Introduction to the Technology Acceptance Model
Many scholars consider the Technology Acceptance Model (TAM) to be the
most influential and widely-used theory in information systems (Lee et al.,
2003). The object of this thesis is not to evaluate TAM and other theories on
computer use. However, as TAM is one of the most tested theories, it should be
included in the literature review with a view to listing the factors which might
determine EIS use by senior executives. TAM has been tested and proven to be
robust, though it has also been questioned.
Several authors originally proposed TAM in 1989 (F. D. Davis, 1989; F. D.
Davis, Bagozzi, & Warshaw, 1989) with the aim of explaining a given

28
technology’s adoption and use at the individual level. The cited authors’
concerned themselves with user satisfaction and attitudes (F. D. Davis, 1989).
Researchers and professionals commonly use the Technology Acceptance
Model (Burton-Jones & Hubona, 2006; F. D. Davis et al., 1989; F. D. Davis,
1989; Venkatesh & Davis, 1996; Venkatesh & Davis, 2000; Venkatesh, 2000) to
predict and explain IT user acceptance. TAM (Figure 1) was originally designed
to understand the causal relationship between external variables and the
acceptance and real use of a given IT product.
Figure 1: Technology Acceptance Model (TAM)
Research on TAM suggests that a user’s behavioral intention (BI) is the factor
which allows us to better predict how he or she actually uses the system. This
intention is determined by the user’s attitude towards the system’s use. This
attitude is in turn determined by the system’s perceived usefulness (PU) and
perceived ease of use (PEOU). Davis et al. (1989) defined perceived
usefulness as “the degree to which a person believes that using a given system
will improve their work results.” Similarly, perceived ease of use refers to “the
degree to which a person believes that using a given system will be effortless.”
The latter concluded their study with three main conclusions:

29
a. The use people make of their computers can be reasonably forecast
based on their intentions.
b. Perceived usefulness is the most important determinant of people’s
behavioral intentions regarding their use of computers.
c. Perceived ease of use is the second most important determinant of
people’s intentions regarding their computer use.
After this seminal work, Davis et al. (1989) developed new scales regarding
perceived usefulness and perceived ease of use. These new scales proved to
be highly convergent, offering a discriminatory function and factual validity.
ii. TAM 2 Based on Davis et al.’s work, Venkatesh and Davis (2000) and Venkatesh
(2000) extended the model, leading to TAM2. They also carried out two
longitudinal studies demonstrating that “the pre-prototype’s measurements
regarding usefulness may well near the measurements found in the final
solution and they significantly predict intention of use and behavioral intention
six months after implementation” (Venkatesh, 2000).
TAM2 aims to establish a unified vision of users’ IT acceptance (Venkatesh et
al., 2003). As a result of this research, Venkatesh et al. (2003) proposed the
Unified Theory of Acceptance and Use of Technology (UTAUT), but it does not
take into account the software application’s characteristics or how the
implementation project may affect perceived usefulness (PU) or perceived ease
of use (PEOU).

30
Figure 2: Unified Theory of Acceptance and Use of Technology (UTAUT) (Venkatesh et al., 2003)
The TAM method has also received important criticism, including from Benbasat
and Barki (2007) regarding the great effort TAM requires and the number of
TAM versions. Straub and Burton-Jones (2007) have also criticized the high risk
of common methods variance when measuring perceptions.
iii. TAM and other lines of research
Other authors (Yi, Wu, & Tung, 2005) have used the TAM model to analyze
how individual differences affect technology use. In their study, Yi, Wu and
Tung conclude that individual differences can directly or indirectly affect the use
of technology and may even moderate the relationship between perceptions
and that use. Based on these discoveries, the authors propose a model which
details the impact of individual differences on technology use.
Their model (Figure 3 below) proposes that individual differences can affect
technology use in different ways. Firstly, individual differences affect technology
usage (P1). Secondly, these differences affect technology use indirectly through
perceptions (P3 and P4). And, finally, individual differences moderate the
relation between perceptions and technology usage (P2).

31
Figure 3: How individual differences influence technology usage (Yi et al., 2005)
iv. External variables or factors
The terms “external variables” and “external factors” are used indistinctly by
different authors in TAM research (F. D. Davis, 1989). According to Davis and
Venkatesh (1996) these factors are: “objective design characteristics, training,
efficient use of computers, user involvement in design and the nature of the
implementation process.” According to Davis et al. (1989), they encompass “the
technical traits of the system design, user involvement in system development,
the type of development process for the system used, the cognitive style,
training documentation, consultant support for users, system functionalities,
user traits, and end behavior.” A later study reviewing existing articles signaled
that “there was no clear pattern with respect to the choice of external variables
considered” (Legris, Ingham, & Collerette, 2003). These same authors also
refer to the 39 factors affecting satisfaction levels with an information system as
described by Bailey and Pearson (1983) and to Cheney, Mann and Amoroso’s
(1986) classification of the different factors.
In their study, Pijpers, Bemelmans, Heemstra and van Montfort (2001) selected
external variables based on Venkatesh and Davis’ (1996) discussion on “other
Individual Differences
Personal traitsDemographic variablesSituational variables
Perceptions
Perceived ease of usePerceived usefulness...
Technology Usage Behabior
Frecuency of use...
P1P3
P4

32
researchers and other areas of research.” They grouped these variables by:
individual traits, organizational traits, task traits and IT resource traits. However,
their research suggests that few of the above variables directly or indirectly
influence actual use.
Lee et al. (2003) published a complete meta-analysis of publications on TAM.
They proposed a chronological analysis of TAM’s evolution over time and
researchers’ contributions to TAM in terms of: the systems types to which they
apply the TAM model, the external variables or factors, major limitations,
number of publications by years and journals, the most prolific authors,
research objective traits, and research methodologies. Lee et al. conclude their
article recommending that various areas require further analysis. This includes
incorporating more variables and exploring environmental conditions. These
authors also declare that we need more in-depth knowledge about the factors
affecting perceived usefulness (PU) and perceived ease of use (PEOU) and
that we need to examine different information systems in different settings,
more complex information systems, and the effects in different settings and with
more complex tasks. They also insist that more qualitative research is needed
on a smaller number of individuals to reveal more valuable information.
As discussed above in the section on motivations behind this thesis, I have
attempted to uncover these factors from qualitative interviews and from the
literature review. I then asked the surveyed senior executives to group and rate
the factors in keeping with Lee et al.’s (2003) recommendations to find out more
about the factors and because two similar studies can have different
approaches and different results as discussed.
My first research question is:
Is additional qualitative research needed to find more valuable information
about the factors?

33
v. Critical reflections on TAM
Organizations spend a lot of money on new information systems. Their
expectations are that these new systems will be adopted by internal users, but
sometimes they don’t as expected.
Technology acceptance has been an enduring question in IT research
(Hirschheim, 2007), and “TAM has had a significant influence on the IS field”
(Venkatesh, Davis, & Morris, 2007).
As Lucas, Burton Swanson and Zmud (2007) indicate: “Essentially, TAM
reduced predictors of an individual’s intention to adopt a new IT innovation to a
core set of two variables, perceived usefulness and perceived ease of use,”
adding, “the model provides relatively few implications for management for
implementing new technology.” In my opinion, this is what lacks the most. To
manage implementations we need to know what the antecedents are in order to
manage them during and after the implementation process.
Numerous explanations in the literature attempt to justify why users don’t adopt
new systems. For example, Goodhue ( 2007) asked rhetorically: “How often are
information systems a poor fit for the tasks to which they are applied?” He
answered: “Sadly, the answer is too often,” proposing researchers add
“perceived fit to the task” to TAM. He also criticized TAM, saying: “TAM makes
an implicit assumption ‘that more use is better.’”
Benbasat and Barki (2007) criticized TAM because they agreed with Hirschheim
(2007) who said that “the field’s focus on TAM-based explanations has either
directly or indirectly diverted researchers’ attention away from many other more
important research issues associated with IT adoption, and this has led to a
state of theoretical chaos and confusion.” This is because there are various
TAM versions to which authors have added social influences, facilitating
conditions, etcetera. Benbasat and Barki (2007) also use some examples from
the literature to argue that “researchers have sought to add constructs to TAM

34
as these became relevant to the changing technology, leading to the present
situation.” In other words, they argue that researchers have to take into account
the IT artifact itself, the IT artifact users, and also the context where they are
using that IT artifact. They also add, “Moreover, another reason for adhering to
the global and generalized perceptions measured in TAM, which has resulted in
our lack of understanding of its antecedents, is that opening a black box of
usefulness is neither straightforward nor trivial.” They proposed instead that “it
would be fruitful to investigate the antecedents of usefulness in order to provide
design-oriented advice.” I also believe that TAM can be like a “black box” if we
can measure the perceived usefulness and perceived ease of use. However,
we don’t know what the antecedents are nor, as such, what value TAM
provides.
These criticisms have encouraged me to include TAM in this research. Although
TAM is a central piece in adoption research, I decided to increase the scope by
including factors from other research areas in an attempt to broaden our
perspective. These additional factors come from a literature review based on
the factors that senior executives might take into account with software
applications and computers, and factors that senior executives think might
affect their use of EIS as mentioned in interviews.
In this study I decided not to explore the relationships between factors and
“perceived usefulness” and “perceived ease of use” because doing so would
have increased the complexity of the survey even further. In addition, the scope
of this thesis goes well beyond TAM.
Below I present my own approach using Concept Mapping.
35
4. Methodology
a. Introduction to Concept Mapping For this research I use the Concept Mapping model proposed by Trochim and
Linton (1986). As Trochim (1989b) defined:
Concept Mapping is a general framework for structured conceptualization
and it shows how specific conceptualization processes can be devised to
assist groups in the theory and concept formation stages of planning and
evaluation.
This process can be used whenever there is a group of people who wish
to develop a conceptual framework to evaluate or plan, displaying the
framework in the form of a concept map.
A facilitator guides the Concept Mapping process. He or she can be an
outside consultant or an internal member of the group responsible for
planning or carrying out evaluation efforts.
The facilitator’s role is only to manage the process. The concept map’s
content, interpretation and utilization are determined entirely by the
group.
This process usually consists of 6 steps (W. M. K. Trochim, 1989b) as detailed
in Figure 4 below.

36
Figure 4. Concept Mapping steps (W. M. K. Trochim, 1989b)
Scholars have applied Concept Mapping in a large number of studies with
subjects ranging from education and educational administration to children and
youth, mental health, the elderly, health, and the arts. Some specific examples
include developing family support programs (Rosas, 2005), organizational
learning (Sutherland & Katz, 2005), developing healthcare programs (Burke et
al., 2005; U. Nabitz, Van den Brink, & Jansen, 2005; W. M. Trochim, Cabrera,
Milstein, Gallagher, & Leischow, 2006; W. M. K. Trochim, Milstein, Wood,
Jackson, & Pressler, 2004; W. Trochim & Kane, June 2005; Yampolskaya,
Nesman, Hernandez, & Koch, 2004), smart card technology adoption (Martin &
Rice, 2010), improving the EFQM model (U. Nabitz, Severens, Brink, & Jansen,
2001), and determining which factors may influence and shape client loyalty
towards travel agencies (Bigné, Aldas-Manzano, Kuster, & Vila, 2002). Other
applications have also attempted to contribute to other methodologies’ analysis
of open-ended survey responses (K. M. Jackson & Trochim, 2002; Rosas &
Camphausen, 2007) or scale development and validation in evaluations (Rosas
& Camphausen, 2007). These projects have also had different purposes:
planning, evaluation, survey design, curriculum development, theory building
and management (W. M. K. Trochim, 1989a).
Step 5 Map interpretation:• Statement list• Cluster list• Point map• Cluster map• Point rating map• Cluster rating map
Step 4 Statement representation:• Map computation
Step 3 Statement structuring:• Statement sorting• Statement rating
Step 2 Statement generation:• Focus on brainstorming
Step 6 Map utilization:For Planning
• Action Plans• Planning Group Structure• Needs Assessment• Program development
• Program Development• Measurement• Sampling• Outcome Assessment
For Evaluation
Step 1 Preparation:Selecting the participantsDeveloping the focus
• Focus on Brainstorming• Focus on Rating
12
3
45
6 7
8
9
1011 1213141516
1718
19
202122
2324
25
26 27
28
293031
3233
34
35
3637
38
39
40
41
4243
44
4546474849
5051
52
53
54
55
5657585960
61 626364
656667
68
69
7071
72
7374
757677
78
79
80
8182
83
84
85
8687
88
89
909192
93
94
95
96
9798
99
100
101
102
103
104105 106
107
108109110
111
112
113114
115
116
117
7 8
3
412
5
6

37
There are different types of participants in these studies, from graduate
students to agency representatives, staff and board members. Important
differences also exist in terms of the number of people participating, from 4 to
75, and also in the number of statements, from 11 to 137, as presented in
Trochim (1989a).
Some references to understand the reliability and validity of Concept Mapping
can be found in Trochim (1993) and in Jackson and Trochim’s work (2002). I
refer to both studies further below.
Other qualitative methodologies such as focus groups or brainstorming could be
applied, but, according to Nabits et al. (2001), Concept Mapping “takes the best
of two worlds and combines the inductive aspects of the forum approach and
the deductive aspects of statistical procedures.” These authors also applied
Concept Mapping to their research on managers as I do.
I adapted the first two steps in the Concept Mapping methodology due to the
difficulty in accessing senior executives and also because senior managers are
reluctant to spend a lot of time on one single activity. This is not the first time
that someone adapts this methodology. Actually, Witkin and Trochim (1997) did
so in one study. Participants were faculty members, and the authors’ objective
was to synthesize listening constructs. Bigné et al. (2002) review the literature
and interview experts later. Nabitz et al. (2001) use the European Foundation
for Quality Management (EFQM) as the starting point of their study. These
changes are reflected in Figure 5.

38
Figure 5. Concept Mapping steps adaptation (Source: the author)
I use Concept Mapping to answer my second and third research questions.
The second research question in this thesis is:
What groups of factors do senior executives believe affect their use of
executive information systems?
And, the third research question is:
How important are these groups of factors for senior executives?
As discussed in the previous section, Concept Mapping consists of different
steps. I discuss each of these steps in detail:
Step 5 Map interpretation:• Statement List• Cluster List• Point Map• Cluster Map• Point Rating Map• Cluster Rating Map
Step 4 Statement representation:• Map computation
Step 3 Statement structuring:• Participant selection• Statement sorting• Statement rating
Step 2 Statement generation:
Step 1 Preparation:• Developing the focus• Experts Interview• Literature Review
12
3
45
6 7
8
9
1011 1213141516
1718
19
202122
2324
25
26 27
28
293031
3233
34
35
3637
38
39
40
41
4243
44
4546474849
5051
52
53
54
55
5657585960
61 626364
656667
68
69
7071
72
7374
757677
78
79
80
8182
83
84
85
8687
88
89
909192
93
94
95
96
9798
99
100
101
102
103
104105 106
107
108109110
111
112
113114
115
116
117
7 8
3
412
5
6
Literature review andpreliminary interviews
LIST
XXXXXXXXXXXXXXXXXXXXXXXXXXXXXXXXXXXXXXXXXXXXXXXXXX...XXXXXXXXXX

39
b. Step 1: Preparation
This step is divided into three sub-steps:
i. Developing the focus
The focus of this thesis is to identify and rate the group of factors that can affect
how senior executives use executive information systems.
ii. Expert user interviews
We carried out two interviews with two executives and presented a paper at a
doctoral consortium that was later published (Cano, Fernández Alarcon, & Díaz
Boladeras, 2008). This paper is presented as Annex 2. The output of these first
interviews were 15 factors or variables. The list is included in Table 1 below.
Factors related with “the perceived ease of use of an EIS”:
Easy to know what information the EIS contains
Easy to know the model underlying the information
EIS provides the information one is interested in.
Easy drill-down from aggregated information to detailed information
Help should be simple, short and clear (I found a preference for initial training).
The same ‘functionalities’ as ‘Windows’ or the Web browsers
Easy to learn
Easy to remember
Easy to interpret the information: graphics, tables, etc.
Factors related with “the perceived usefulness of EIS”
The first screen must contain the most important information above the key areas.
If there is a problem, users can focus on it, disregarding the details.
A “map-like function” when users get lost
Know how the calculation is done (having the option of checking formulas)
Multidimensionality
Spend as little time as possible to find the information that users need
Table 1: Factors related to “the perceived ease of use and perceived usefulness of an EIS” from senior executive interviews

40
We discovered 15 factors through these interviews, but executives made no
reference to the other factors usually found in the literature relative to
organization, executive skills or capabilities, trust, etcetera. As such, I had to
widen the scope of analysis to compare the factors that senior executives
mentioned during the interviews and compare them with other factors in the
literature. This has allowed me to respond to the first research question.
iii. Literature review
There are three inputs in the literature review: the first is the list of the factors in
Yousafzai, Foxall and Pallister’s (2007a) TAM meta-analysis; the second is a
review of factors in TAM; and the third is an open approach which stems from a
literature review about the relationship between executives and computers and
software applications. My primary objective with this last literature review was to
broaden the scope on TAM and add the senior executives’ perspectives as
mentioned in the previous section. I present my main findings here:
Yousafzai, Foxall and Pallister’s (2007a) TAM meta-analysis includes 79
external variables grouped by: organizational characteristics, system
characteristics, users’ personal characteristics, and other variables. The entire
list and details of the variables can be found on page 269 of their paper.
I carried out a review of external variables and antecedents in TAM. I
found 111 papers related with TAM or with external variables. I selected 31
papers based on their discussion of these factors (Adams, Nelson, & Todd,
1992; Agarwal & Prasad, 1998a; Burton-Jones & Hubona, 2006; F. D. Davis et
al., 1989; F. D. Davis, 1989; F. D. Davis & Venkatesh, 1996; F. D. Davis &
Venkatesh, 2004; S. Davis & Wiedenbeck, 2001; Gefen & Straub, 1997; Gefen
& Straub, 1997; Gefen, Karahanna, & Straub, 2003a; Gefen, Karahanna, &
Straub, 2003b; Igbaria, Guimaraes, & Davis, 1995; Igbaria, Zinatelli, Cragg, &
Cavaye, 1997; C. M. Jackson, Chow, & Leitch, 1997; Legris et al., 2003; D.
Straub, Keil, & Brenner, 1997; Szajna, 1996; Venkatesh, 2000). I found 216
external variables mentioned in said papers. As can be seen in Table 2 below,

41
in some cases there are several variables in the same cell. For example, I
divided the factor “more accurate forecast or higher quality graphs” (F. D. Davis,
1989) into two. As such, the number of rows in the table is 185 less than the
216 factors originally found.
Authors Factors
Davis (1989)
The system's technical design characteristics
User involvement in system development
The type of system development process used
The nature of implementation process
Cognitive style
System design characteristics
User characteristics (cognitive stile and other personality
variables)
Task characteristics
Nature of the development of implementation process
Political influences
Organizational structure
Menus, icons, mice, and touch screens
Training, documentation and user support consultants
More accurate "forecast" or higher quality "graphs"
Learning based on feedback
System features
User characteristics
Ultimate behavior
User interface
Better training
Accuracy or amount of information accessible through a system
Davis et al. (1989)
Objective system design characteristics
Training
Computer self-efficacy
User involvement in design
Nature of the implementation process
Legris et al. (2003)
Situational involvement, intrinsic involvement, prior use,
argument of change
Internal computing support, internal computing training,
management support, external computing, support, external
42
computing training
Perceived developer responsiveness
Role with regard to technology, tenure in workforce, level of
education, prior similar experiences, participation in training
Quality perceived subjectiveness
Compatibility, trainability, visibility, result demonstrability
Tool functionality, tool experience, task technology fit, task
characteristics
Subjective norms, voluntariness, image, job relevance, output
quality, result demonstrability
Gender, experience
Effect of experience
Implementation gap, transitional support
Output quality
Computer self-efficacy, objective usability, direct experience
No external variable
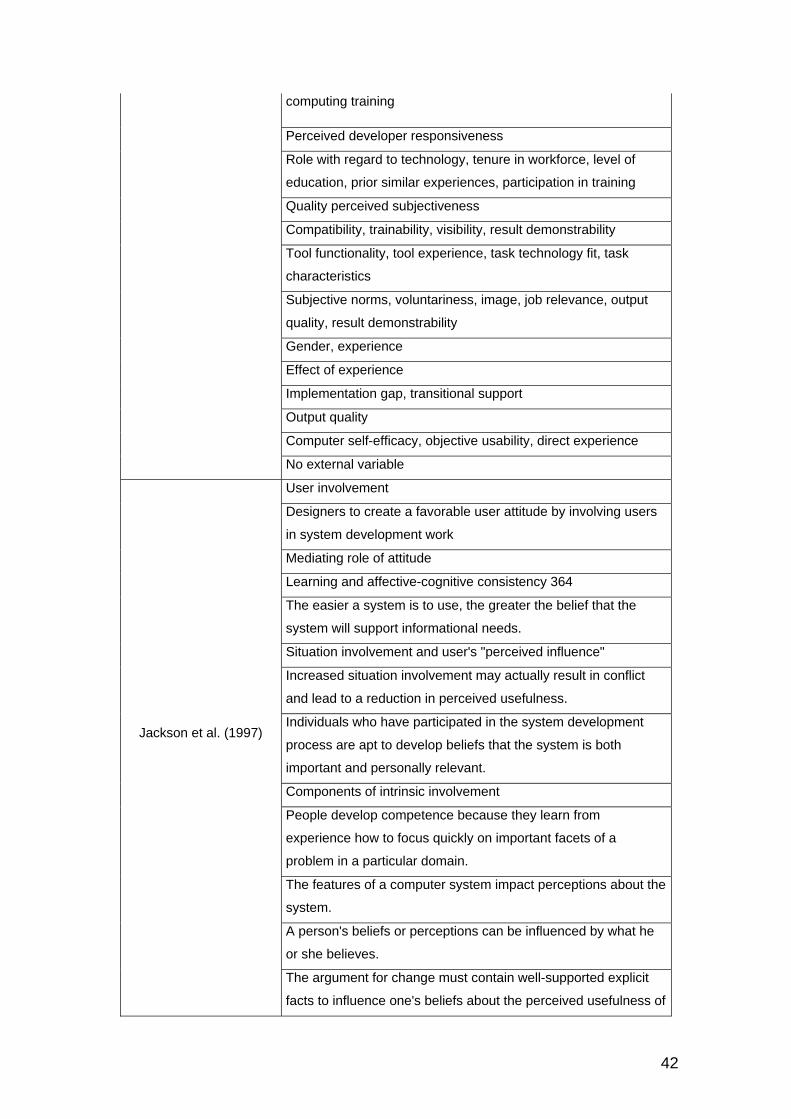
Jackson et al. (1997)
User involvement
Designers to create a favorable user attitude by involving users
in system development work
Mediating role of attitude
Learning and affective-cognitive consistency 364
The easier a system is to use, the greater the belief that the
system will support informational needs.
Situation involvement and user's "perceived influence"
Increased situation involvement may actually result in conflict
and lead to a reduction in perceived usefulness.
Individuals who have participated in the system development
process are apt to develop beliefs that the system is both
important and personally relevant.
Components of intrinsic involvement
People develop competence because they learn from
experience how to focus quickly on important facets of a
problem in a particular domain.
The features of a computer system impact perceptions about the
system.
A person's beliefs or perceptions can be influenced by what he
or she believes.
The argument for change must contain well-supported explicit
facts to influence one's beliefs about the perceived usefulness of

43
the system.
Davis and Venkatesh
(2004)
System design characteristics
Training
Adams et al. (1992)
User experience
Type or sophistication of system use
Other task
User characteristics
Szajna (1996)
The task
User characteristics
Political influences
Organizational factors
Development process
Venkatesh (2000)
Control (internal and external - conceptualized as computer self-
efficacy and facilitating conditions, respectively)
Intrinsic motivation (conceptualized as computer playfulness)
Emotion (conceptualized as computer anxiety)
Igbaria et al. (1997)
Internal computing support
Internal computing training
Management support
External computing support
External computing training
Burton-Jones and
Hubona (2006)
System experience
Level of education
Age
Task characteristics
Perceived behavioral control
Straub et al. (1997) and
Straub and Burton-Jones
(2007)( 2007)
Power-distance
Uncertainty avoidance
Masculinity
Individualism
Agarwal and Prasad
(1998a)
Personal innovativeness
Communication channels
Mass media
Interpersonal communication
Igbaria et al. (1995)
Individual characteristics and computer experience
Organizational support
System quality
Beliefs
Davis and Wiedenbeck Computer interaction style

44
(2001) Prior exposure
Gefen, Karahanna and
Straub (2003b)
Situational normality
Familiarity with the e-vendor
Social influences
Characteristics of the system and of the task
Gefen and Straub (1997) Perceived social presence and richness of the medium (SPIR)
Gender
Igbaria (1993)
User training
Computer experience
Information center support
Management support
Venkatesh and Davis
(2000)
Subjective norm
Image
Job relevance
Output quality
Result demonstrability
Experience
Voluntariness
Igbaria and Tan (1997)
Precise information you need
Content meets your needs
Reports
Sufficient information
Accurate
Satisfaction with the accuracy
Useful output format
Clear information
User friendly
Easy to use
Timely
Up-to-date information
Venkatesh et al. (2003)
Performance expectancy
Effort expectancy
Social influence
Facilitating conditions
Experience
Voluntariness of use
Yi et al. (2005) Personal innovativeness
Computer experience
Encouragement by others
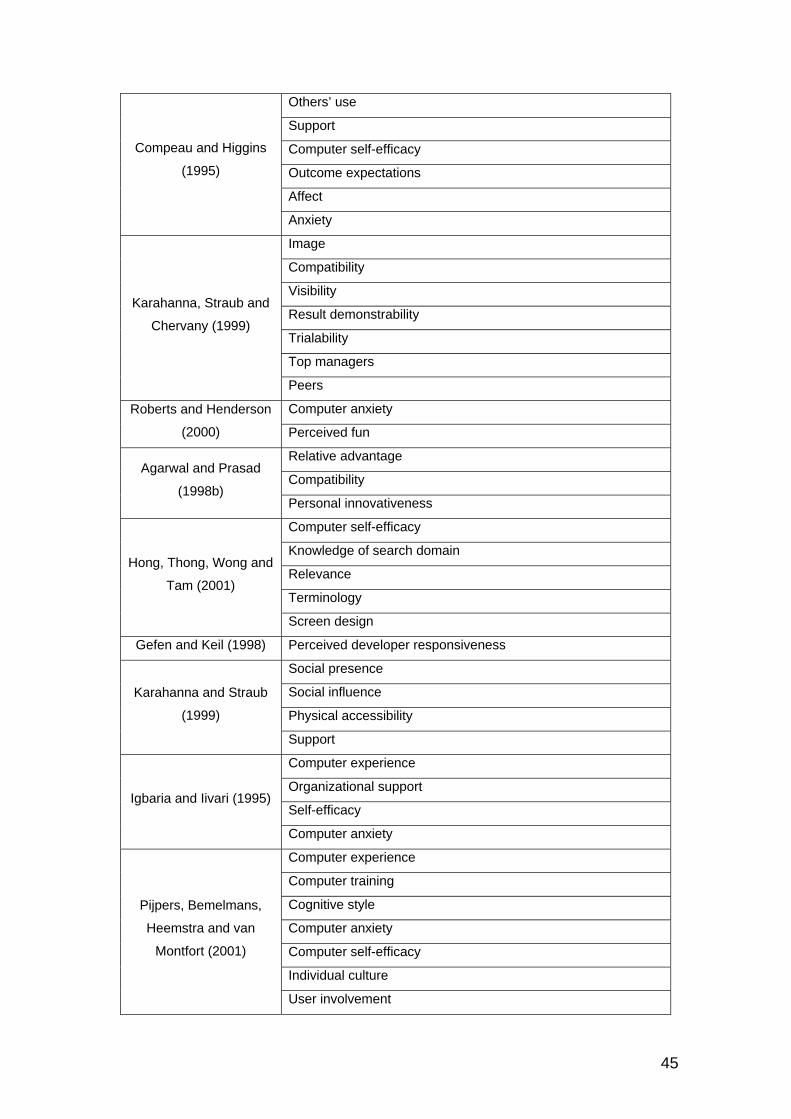
45
Compeau and Higgins
(1995)
Others’ use
Support
Computer self-efficacy
Outcome expectations
Affect
Anxiety
Karahanna, Straub and
Chervany (1999)
Image
Compatibility
Visibility
Result demonstrability
Trialability
Top managers
Peers
Roberts and Henderson
(2000)
Computer anxiety
Perceived fun
Agarwal and Prasad
(1998b)
Relative advantage
Compatibility
Personal innovativeness
Hong, Thong, Wong and
Tam (2001)
Computer self-efficacy
Knowledge of search domain
Relevance
Terminology
Screen design
Gefen and Keil (1998) Perceived developer responsiveness
Karahanna and Straub
(1999)
Social presence
Social influence
Physical accessibility
Support
Igbaria and Iivari (1995)
Computer experience
Organizational support
Self-efficacy
Computer anxiety
Pijpers, Bemelmans,
Heemstra and van
Montfort (2001)
Computer experience
Computer training
Cognitive style
Computer anxiety
Computer self-efficacy
Individual culture
User involvement

46
Perceived fun/enjoyment
Organizational structure
IT maturity
Organizational support
Organizational culture
Organizational usage
Social pressure
Environmental uncertainty
Competitor behavior
Task related
Accessibility
Implementation process
User interface
Table 2: Factors related to “the perceived ease of use and perceived usefulness of an EIS” based on a review of literature dedicated to TAM
Some may ask why I didn’t include Davis’ (1989) 12 questions to determine
perceived usefulness (PU) and perceived ease of use (PEOU). The reason is
that my main objective here is to determine the factors, while Davis’s aim with
those questions was to measure perceptions: PU and PEOU. As such, these
questions are not valid to define the factors or understand how they affect
senior executives’ use of EIS systems.
The last input comes from a literature review included in the paper, "Use
of computers and applications by senior executives" (Cano Giner, 2011),
included in this thesis as Annex 3. Said review includes 37 additional external
variables (see Table 3 below).
As mentioned, several studies in the literature analyze how executives use
computers and applications. One of the first of these was conducted by Brady
(1967), addressing the issue of whether computers had changed the method,
form or content of executives’ decision-making. Brady concluded his study
stating that computers had had no impact on how executives made decisions.
In the same study, he also indicated that executives were not using computers
due to:
47
A lack of understanding (or training) on how computers can be used for
decision-making by executives,
A defensive attitude on the part of some executives regarding the threat
posed by computers to their decision-making functions and their
prerogatives to exert their “opinion,”
A lack of applications developed and specifically intended for decision–
making,
Indecision on the part of executives in formally identifying the decision-
making criteria they wanted to use, and
Executives’ tendency to wait for other firms to invest and take the initial
risk of pioneering the use of new computer applications.
Brady (1967) forecast that significant advances in the impact of computers
would be achieved simply as a consequence of the passage of time and staff
turnover. However, he recommended speeding up changes by developing and
training both middle and senior executives. In his study’s conclusions he
predicted that by the mid-1970s computers would cause changes in a large
number of aspects related to executive decision-making.
Another of the key papers dealing with computer use by executives is “The
CEO goes on-line” by Rockart and Treacy (1982). In this article, the authors
showed how CEOs increasingly access and use information from computers on
a regular basis. They described how four senior executives use computers,
specifically with EIS applications. These offer executives analytical tools in their
search for greater insight into their companies and sectors, the possibility of
personalizing them to meet each executive’s information needs, and the
possibility of implementing them by starting with small projects that can grow
gradually. EIS systems are intended to help executives use information more
effectively. The authors conclude their paper with the following statement:
Not all senior managers, of course, will find an EIS system to their taste, but enough user-friendly technology now exists to accommodate the needs of those who wish to master a more data-intensive approach to their jobs.

48
PC use by executives was subsequently analyzed by Mawhinney and Lederer
(1990) who employed a model consisting of four groups of variables: managers’
attributes in the organization (level, span of control, type of work, control of the
system, and contribution to job performance), personal attributes (age, sex,
level of training, typing skills, and competence in using the system), system
attributes (ease of learning, ease of use, accessibility, response time, and
suitability), and process attributes (participation in the acquisition, satisfaction
with the system, training in its use, and technical support). The authors
analyzed how these variables affect PC use by the executives, discovering that
none of the groups of variables seem to dominate the model and that the two
items with the strongest correlation with reported time of use time were: 1) the
system’s contribution to job performance and 2) the managers’ level of
competence with the system.
Managers are reluctant to spend extra time learning other applications when
they can do what they want on a spreadsheet, even if this is not the most
efficient way of doing it, according to Seeley and Targett (1997 and 1999) .
They reported on several studies which analyze senior executives as computer
users. In their paper’s conclusions they stated that senior executives use
computers more extensively than before, that they use a larger number of
applications more competently than they used to, and that the number of
applications they use can be related to age (younger executives use a wider
range of applications).
Drucker (1998) explores the meaning and purpose of information in an article
entitled “The next information revolution.” The author states that senior
executives do not use new technologies because these technologies don’t
provide them with the information they need for their work; likewise, he argues
that the accounting systems at their disposal do not help them in decision-
making. Another aspect Drucker highlights is that senior executives have a
degenerative tendency, especially in big corporations, to focus inwards (on
costs and results) rather than outwards (on opportunities, changes and threats).
Consequently, he predicted a trend over the following 10 to 15 years towards
gathering external information. One of the factors that can cause a change in
49
this trend is better training in technologies that he forecasts senior executives
will have in the future. Another issue Drucker addresses is whether system
employees and directors are prepared to tend to the senior executives using the
medium required to learn about ITs.
In their study on senior executives’ personal use of computers, Seeley and
Targett (1999) conclude that this use is related to the dynamic and complex
iteration between both internal factors, such as executives’ perception of their
role as managers, modus operandi and personality, and certain factors, such as
system infrastructures, the nature of the task and organizational culture.
Poon and Wagner (2001) revise the Critical Success Factors model (Rockart &
DeLong, 1988) to apply it to information systems for executives, confirming the
applicability of Rockart and DeLong’s eight original factors while adding two
additional ones. Nevertheless, Poon and Wagner consider that, out of all the
success factors, success is possible if we manage just three of them: support at
both executive and operational levels; resources; and linking the system to the
business objectives.
According to Pijpers et al. (2001), the perception of fun/enjoyment that senior
executives may have when using an information system is an external variable
that influences their beliefs about, attitude towards and use of information
systems.
Xu and Kaye (2002) analyze the support executives need, concluding that they
require support from information specialists rather than technology specialists.
The function of the former is to scan external information in the outside world,
turn it into meaningful information and make it easily accessible to managers so
that they can use it. Consequently, when EIS systems are designed and
implemented, we have to train the executives not only on how to use the system
but also about the information they will find there, information which is
systematically updated, analyzed and formatted by information specialists
before the executives actually use the system. These specialists must therefore
be familiar with executive culture; they must exploit and obtain executives’
50
vision and knowledge to judge and interpret the information and make explicit
that which must be shared among information specialists.
We also have to take into account the differences between expert and novice
executive computer users, as shown by Hung (2003). Executives’ skills affect
system use; expert users require less time to reach a solution and view more
screens when performing analytical tasks, whereas novices view more screens
when performing more intuitive chores, and executives feel more useful when
they use more powerful systems. Furthermore, expert users consider intuitive
systems to be more useful than analytical ones, whereas the difference is not
significant for novices.
Senior executives are not benefiting from the use of technologies according to
Seyal and Pijpers (2004). A lack of commitment to IT use and their applications
can be seen as a threat to competitiveness. According to the authors, several
reasons account for impediments to IT use: 1) senior executives have little time
to experiment with new technologies; 2) they are reluctant to use the technology
due to PC anxiety; and 3) senior executives lack skills and proficiency in IT use
and, moreover, require support staff to answer their queries. Some senior
executives argue that they see no connection between what ITs do and their
tasks as senior executives. The latter’s reaction to ITs is even worse if they did
not take any IT-related course during their college years.
Internationalization has also created the need to assess whether senior
executives make strategic decisions differently depending on their origin.
Martinsons and Davison (2007) analyze the differences among American,
Japanese and Chinese executives, defining different decision-making styles
among these; hence, information technologies must be adapted to the different
styles of their users.
I ascribed the 37 reasons cited by various authors and studies above to one of
the following categories in Table 3: Senior Executives, System, Project, or
Others. Subsequently, with the object of reducing the number of factors, I
grouped them whenever possible, taking into account those that are similar and
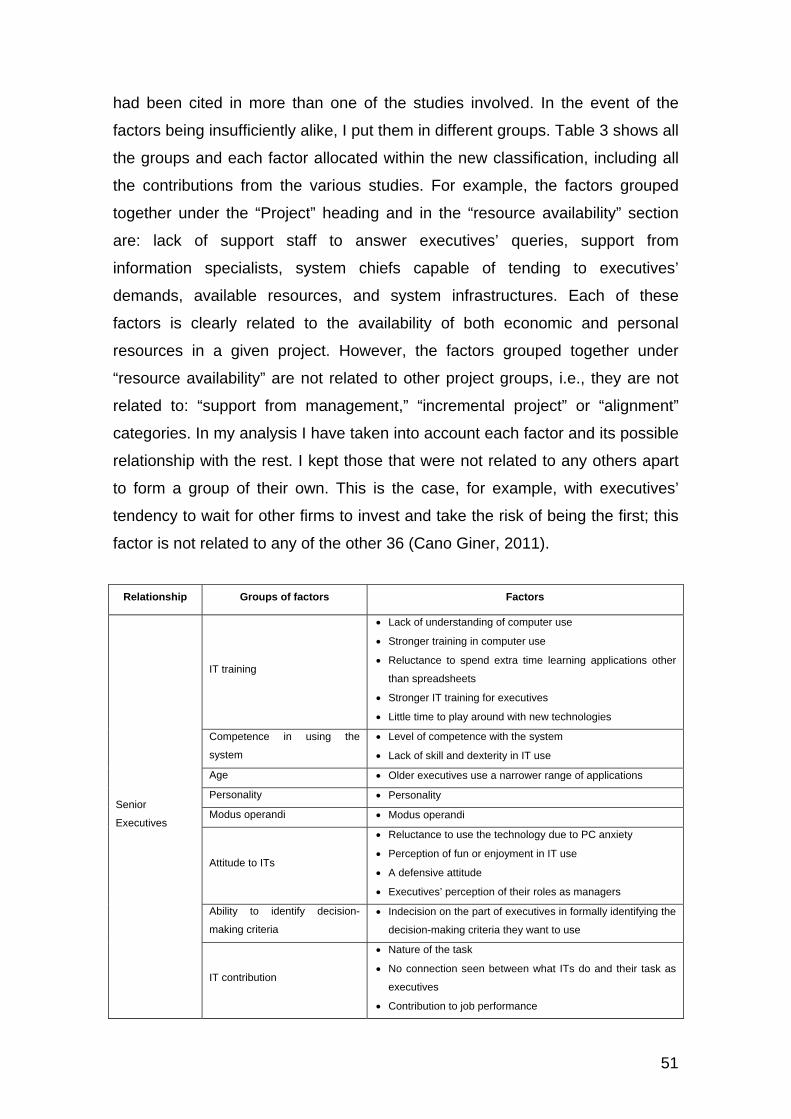
51
had been cited in more than one of the studies involved. In the event of the
factors being insufficiently alike, I put them in different groups. Table 3 shows all
the groups and each factor allocated within the new classification, including all
the contributions from the various studies. For example, the factors grouped
together under the “Project” heading and in the “resource availability” section
are: lack of support staff to answer executives’ queries, support from
information specialists, system chiefs capable of tending to executives’
demands, available resources, and system infrastructures. Each of these
factors is clearly related to the availability of both economic and personal
resources in a given project. However, the factors grouped together under
“resource availability” are not related to other project groups, i.e., they are not
related to: “support from management,” “incremental project” or “alignment”
categories. In my analysis I have taken into account each factor and its possible
relationship with the rest. I kept those that were not related to any others apart
to form a group of their own. This is the case, for example, with executives’
tendency to wait for other firms to invest and take the risk of being the first; this
factor is not related to any of the other 36 (Cano Giner, 2011).
Relationship Groups of factors Factors
Senior
Executives
IT training
Lack of understanding of computer use
Stronger training in computer use
Reluctance to spend extra time learning applications other
than spreadsheets
Stronger IT training for executives
Little time to play around with new technologies
Competence in using the
system
Level of competence with the system
Lack of skill and dexterity in IT use
Age Older executives use a narrower range of applications
Personality Personality
Modus operandi Modus operandi
Attitude to ITs
Reluctance to use the technology due to PC anxiety
Perception of fun or enjoyment in IT use
A defensive attitude
Executives’ perception of their roles as managers
Ability to identify decision-
making criteria
Indecision on the part of executives in formally identifying the
decision-making criteria they want to use
IT contribution
Nature of the task
No connection seen between what ITs do and their task as
executives
Contribution to job performance

52
Risk aversion against investing
in ITs
Executives’ tendency to wait for other firms to invest and
take the risk of being pioneers
System Functionality of the system
Personalization of applications
Adapt to the different styles of their users
Need to adapt systems to executives’ experience
Lack of applications development
Specificity of the system Availability of applications designed for executives’ tasks
Project
Support from management Support at both executive and operational levels
Resource availability
Lack of support staff to answer executives’ queries
Support from information specialists
System chiefs capable of tending to executives’ demands
Available resources
System infrastructures
Incremental project Incremental project
Alignment
Linking the system to the business objectives
System does not provide executives with the necessary
information
Need for systems to collect more external information
Others Other factors
Passing of time
Organizational culture
Management changes due to staff movements
Table 3: Factors related to “the relationship between executives and computers or applications” based on a literature review
All the factors relate to different kinds of information systems, including: word
processors, electronic mail, voice mail, spreadsheets, personal computers,
internet browsers, software packages, decision support systems, executive
information systems, web portals, e-commerce stores, etcetera.
c. Step 2: Statement generation
The objective of this step is to generate short conditional phrases or statements
which describe the factors that could increase executive information system use
by senior executives.
I began with a long list of variables, concretely, 347 factors stemming from four
different sources: the interviews, TAM meta-analysis, the literature review of
TAM and external variables and a literature review on the relationship between
executives and computers or applications.

53
I selected the variables in two phases due to the number of factors to be
managed:
i. First phase
I assigned a number to every variable to be able to track them. I then attributed
a general label to every external variable to help find similar or duplicate
variables, and then ordered the statements by these labels. The labels include,
for example: system, user, project, information, task, etcetera. These labels
helped me group sentences and compare them to find duplicities and
similarities.
I accepted fifteen of the variables stemming from executives’ interviews to see if
senior executives felt that these factors were more relevant than the factors
from the literature review.
Some duplicity existed between variables (188). Also, some variables didn’t
seem to have any relation with executive information systems and executives
(10); and there were 30 external variables that were “too general” and were
therefore discarded.
After this first classification, there were 119 statements left, but no more than
100 are recommended (W. M. K. Trochim, 1989b). As such, I had to reduce the
list by at least 19 more. I did this in the second phase.

54
ii. Second phase
The criterion I used to discard external variables was to exclude those that EIS
developers can’t control for; this includes, for example, the user’s age and level
of education. I thus discarded 25 factors, leaving 94 for executives to sort and
rate.
Once I selected these external variables, I then used the RANDOM function in
Excel to order the statements in an indiscriminate manner and assign them a
number between 1 and 94.
Finally, I selected 94 external variables to be grouped. Table 4 below describes
the variables’ origins.
Accepted
Discarded
in second
phase
Duplicities No
relation
Too
generalTotal Accepted
Number
of papers
Output from the
first interviews 15 0 0 0 0 15 100% 1
External variables
in TAM meta-
analysis 38 11 21 3 6 79 52% 1
Review of TAM
antecedents and
determinants 21 11 156 5 23 216 12% 34
Output from the
literature review
in the paper "Use
of computers and
applications by
senior executives" 20 3 11 2 1 37 54% 12
Total 94 25 188 10 30 347 29% 48
Table 4: Summary of the external variables
I provide a schema in Figure 6 to summarize Step 2.

55
Figure 6: Schema of the process to find factors
I also changed some terms such as “user” and “users” for “executive(s)” and
“system” and “systems” for “Executive Information System(s).” I also rewrote the
sentences to facilitate executives’ understanding.
In those cases where there was duplicity between factors, I did not have a
preference in terms of selecting variables from different origins with the
exception of those stemming from the interviews. For my analysis, this implies
that there is one general group of factors that originates from three different
sources: TAM meta-analysis, a review of external variables in TAM and a
review of computer and application use by senior executives. This was required
to be able to compare ratings from senior executives. For my posterior analysis,
I called this group of factors “General,” while I called the group of factors coming
from interviews “EIS”, as depicted in Table 5 below.
As a result, 15 factors stem from Executive Information System interviews (the
“EIS” label in the “Factor origins” column in Table 5) and 79 factors from other
Information Systems as described in the literature (the “General” label in the
“Factor origins” column in Table 5).

56
Factor number
Factor Factor origins
1 If other executives had influenced you to use the executive information system … General
2 If the executive information system had been easier to remember… EIS
3 If the executive information system screens had been designed better … General
4 If the quality of the executive information system information had been better … General
5 If the executive group had been more innovative … General
6 If the use of the executive information system had been a part of the organization's culture ... General
7 If the executive information system had been easier to learn … EIS
8 If the executive information system had included an information confirmation mechanism … General
9 If you had been closer to sources of power … General
10 If there had been a problem and you could have used the executive information system to focus on the issue, disregarding the details, … EIS
11 If the executive information system could have been adapted to the different executive leadership styles … General
12 If you had suffered from job insecurity ... General
13 If the executive information system had included the information you needed … EIS
14 If the executive information system had been more reliable … General
15 If the executive information system had offered a greater wealth of information … General
16 If the executive information system had included more external information ... General
17 If you had been less defensive … General
18 If someone had demonstrated the positive results obtained from using the executive information system … General
19 If there had been organizational pressure to use the executive information system … General
20 If the project had had more visibility … General
21 If you had needed less time to find the information required … EIS
22 If the executive information system and the business objectives had been better linked … General
23 If the project's implementation process had been better… General
24 If the project's implementation had been incremental … General
25 If you had felt greater cultural affinity with the executive information system ... General
26 If you had been more predisposed to using computers … General
27 If the executive information system had had a drill-down function, enabling you to go from aggregated information to detailed data, … EIS
28 If you had had support from information specialists … General
29 If there had been institutional control over the executive information system's use ... General
30 If the system's infrastructures had been better … General
31 If the executive information system had been multidimensional in terms of functionality … EIS
32 If it had been easy to interpret the information in the executive information system’s graphs, tables, reports, etc. … EIS
33 If the executive information system had had the same functionalities as Windows or the Internet … EIS
34 If your ability to concentrate had been better … General
35 If you had trusted the executive information system … General
36 If resources had been available for the executive information system … General
37 If you had perceived that the executive information system was less complex … General
38 If it had been easier to know what information the executive information system contained … EIS
39 If you had been better at using the executive information system … General

57
40 If the designers had instilled a more favorable attitude among executives by involving them during the implementation project … General
41 If it had been less difficult to use the executive information system … General
42 If the organization had used the executive information system more … General
43 If you had had more experience with the executive information system … General
44 If you hadn't been reluctant to spend extra time learning how to use applications other than spreadsheets … General
45 If you had been more computer literate … General
46 If the executive information system had been better designed to suit your tasks … General
47 If there had been external courses on how to use the executive information system … General
48 If the use of the executive information system had been voluntary … General
49 If you had had a better understanding of the use of computers … General
50 If there had been back-end support for executive information system users … General
51 If the executive information system had offered clear and precise help … EIS
52 If you had participated in the executive information system's development … General
53 If the executive information system could have been customized … General
54 If the system graphics had been better … General
55 If the executive information system had been more important … General
56 If you had been involved in the executive information system's design … General
57 If you had been trained on computer usage … General
58 If you had had more time to play with and explore the executive information system … General
59 If there had been organizational polices supporting the executive information system ... General
60 If there had been no implementation gap … General
61 If you had participated in the training program … General
62 If there had been social pressure to use the executive information system … General
63 If your computer skills had been better … General
64 If your perception of your role as an executive had been different … General
65 If the terminology used in the executive information system had been clearer … General
66 If it had been easier to understand the information model used … EIS
67 If you had been better able to innovate… General
68 If management had been more supportive during the project's implementation … General
69 If the executive information system had been more accurate … General
70 If the developer had been more responsive … General
71 If there had been greater political pressure … General
72 If the executive information system had contributed more to your job performance … General
73 If there had been internal training programs for the executive information system … General
74 If it had been easier to access the executive information system … General
75 If there had been organizational support on the executive information system … General
76 If you had identified the decision-making criteria you wanted to use … General
77 If other colleagues had had influence … General
78 If it had been easier to browse the executive information system … General
79 If the executive information system had included "What if" functionalities … General
80 If the executive information system had been more attractive … General
81 If the executive information system had needed less response time … General
82 If access to the executive information system director had been easier ... General
83 If you had been less anxious about using computers … General
84 If the executive information system had offered greater security … General
85 If the first screen had contained the most important information about all key areas … EIS
86 If you had felt happier using the executive information system … General
87 If you had participated during the implementation project … General

58
88 If your colleagues had used the system more … General
89 If the executive information system had had a "map-like function" in case you got lost … EIS
90 If the executive information system had been compatible with other executive information systems … General
91 If there had been conditions making it easier to access the executive information system … General
92 If there had been fewer perceived risks during the project's implementation … General
93 If you had known how the calculations were done (having the option to check them) … EIS
94 If the executive information system information had been updated more often … General
Table 5: List of factors and their origins
d. Step 3: Statement structuring
This is the part of the research in which the executives are involved the most.
As such, I decided to run a pilot test to uncover any possible problems
executives might have and also determine how much time they would need to
complete the task at hand. Two executives completed this pilot test in two
different meetings. They needed an average of 40 minutes to finish it.
I gave them the personal questions on a form, followed by the 94 cards
containing a statement each. I told them that they should classify these cards
into different groups depending on how they made sense for them though with
some restrictions: each card could only be included in one group; they could not
put all the cards into a single group; and the individual cards could not be
independent groups. And finally, I gave them the list of 94 factors and told them
that they should rate each factor using a 1 to 5 scale based on the degree to
which they would have likely used the Executive Information System depending
on the condition described on each card (from “much less likely” – 1 – to “much
more likely” – 5).
Some misinterpretations arose during these meetings so I decided to include
general instructions on the first page of the survey and more detailed
instructions in every survey section. As such, every senior executive
participating received an envelope containing: the cover letter with the
instructions and the study purpose, the survey itself and a smaller envelope with
94 cards and 12 paperclips.

59
The survey consisted of three parts:
Part 1: instructions and the questions about executives’ use of Executive
Information Systems, their experience in using EIS, personal data and
their company’s information;
Part 2: instructions on how to classify cards; and
Part 3: instructions and the list of factors.
After they completed the survey and classified the cards, I asked them to put
everything back in the envelope provided and return it to me.
The complete survey is attached as Annex 4.
i. Participant selection
In the various studies using Concept Mapping (W. M. K. Trochim, 1989b), we
can find differences in the number of participants. As such, Trochim (1989b)
recommends a group of between 8 and 15 heterogeneous participants to obtain
the greatest number of points of view. Rosas (2005) works with 29
professionals and staff members, while Bigné et al. (2002) work with 15
consumers.
Sutherland and Katz (2005) refer in their research to some of Trochim’s
recommendations about the number of participants. They indicate that Trochim
analyzed 38 Concept Mapping studies in a paper presented at the annual
meeting of the American Evaluation Association in Dallas (TX) in 1993 and
found a range of between 6 and 33 participants. Trochim is reported to have
noted that the typically recommended sample size for concept mapping projects
is 15 people. (I am aware that this is a secondary source but I did not have
access to Trochim’s original presentation).
I held 25 interviews. And, before the senior executives answered the survey
questions, I discussed the definition of an Executive Information System with
60
them. The cover letter includes a definition from Britannica Academic Edition:
“An information system is an integrated set of components for collecting,
storing, processing, and communicating information.” In this study an Executive
Information System is one kind of information system designed based on
executives’ needs and used by executives. I decided to use this definition so
that senior executives had a clearly sufficient idea about what an EIS is. There
are some questions in the survey which also check to ensure that the system
they are using (or used in the past) is (or was), in fact, an EIS.
In the survey carried out as part of this thesis, I included questions to test if the
participating executives were senior executives as defined and asked several
demographic questions to see if there were differences between these
executives and others in terms of their EIS use.
Only 23 of these participants currently used an EIS or had used one in their
previous jobs. As such, I decided to discard two interviews because those
participants were not currently using an EIS and because they didn’t have
experience with EIS. I provide descriptions of the 23 final participants in the
following paragraphs.
There were 5 general managers in the group, 7 business unit directors, 5
functional area directors and 6 with other responsibilities.
There were 19 males and 4 females.
In terms of ages, there were 10 between 25 and 34, 9 between 35 and 44, and
4 over 45.
One of the executives had a PhD degree, 13 had a Master’s degree, 7 had a
Bachelor’s degree and one a High School diploma.
I confirmed that these participants were involved in determining their
organizations’ strategic direction. This was the case with all 23, and I could thus
consider them to be “senior executives” as defined above.
61
On average, they had 14.6 years of working experience, one with 40 years’
experience (the maximum in the group) and another with 7 (the minimum).
They had been working for their current firms 7.4 years on average. The
maximum was 35 years. In addition, participants had occupied their current
positions for 2.2 years on average.
When I asked them about what kind of information technology user they thought
they were, one described himself/herself as a beginner, one as an expert, 10 as
intermediate users, and 11 as advanced users.
The companies they work for cover a wide range of different industries:
telecommunications, aerospace and defense, automotive, manufacturing,
chemicals, financial services, consumer products, energy, tourism, health, and
legal services.
All the executives work in Spain, except one who works in Andorra.
In terms of company size and the number of employees, 14 executives work in
companies with more than 250 employees. And, in terms of sales volume, 13
work in companies with more than €50 million in revenues.
As regards the EIS systems the executives use or had used: 14 provide data in
graphs, tables and text format, 10 provide internal and external information and
data, 13 provide information in real time, 8 were designed based on their needs,
12 allow them to drill down from the aggregate information level to detailed
information, 11 provide analytical functionalities, 6 provide them tendency
analysis and, finally, 4 EIS provide them alerts about exceptions.
11 executives actually use the functionality to drill down from the aggregate
level to detailed information, and 10 of them use the analytical functionalities.
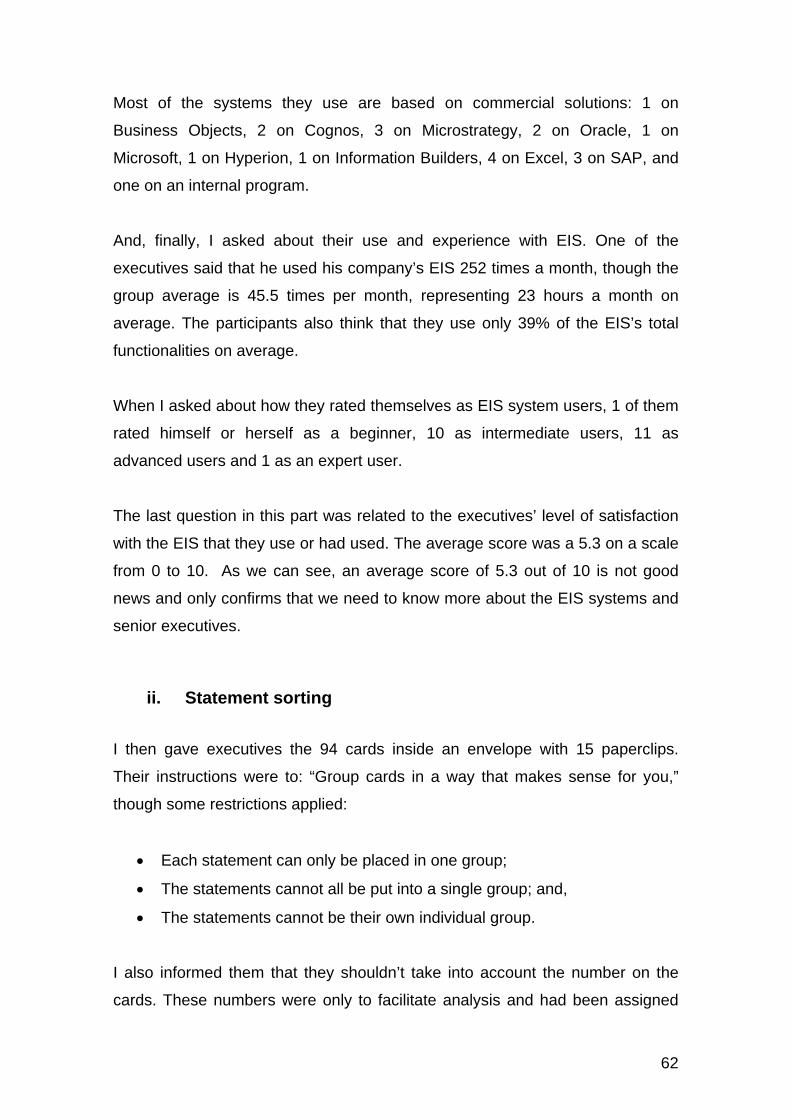
62
Most of the systems they use are based on commercial solutions: 1 on
Business Objects, 2 on Cognos, 3 on Microstrategy, 2 on Oracle, 1 on
Microsoft, 1 on Hyperion, 1 on Information Builders, 4 on Excel, 3 on SAP, and
one on an internal program.
And, finally, I asked about their use and experience with EIS. One of the
executives said that he used his company’s EIS 252 times a month, though the
group average is 45.5 times per month, representing 23 hours a month on
average. The participants also think that they use only 39% of the EIS’s total
functionalities on average.
When I asked about how they rated themselves as EIS system users, 1 of them
rated himself or herself as a beginner, 10 as intermediate users, 11 as
advanced users and 1 as an expert user.
The last question in this part was related to the executives’ level of satisfaction
with the EIS that they use or had used. The average score was a 5.3 on a scale
from 0 to 10. As we can see, an average score of 5.3 out of 10 is not good
news and only confirms that we need to know more about the EIS systems and
senior executives.
ii. Statement sorting
I then gave executives the 94 cards inside an envelope with 15 paperclips.
Their instructions were to: “Group cards in a way that makes sense for you,”
though some restrictions applied:
Each statement can only be placed in one group;
The statements cannot all be put into a single group; and,
The statements cannot be their own individual group.
I also informed them that they shouldn’t take into account the number on the
cards. These numbers were only to facilitate analysis and had been assigned
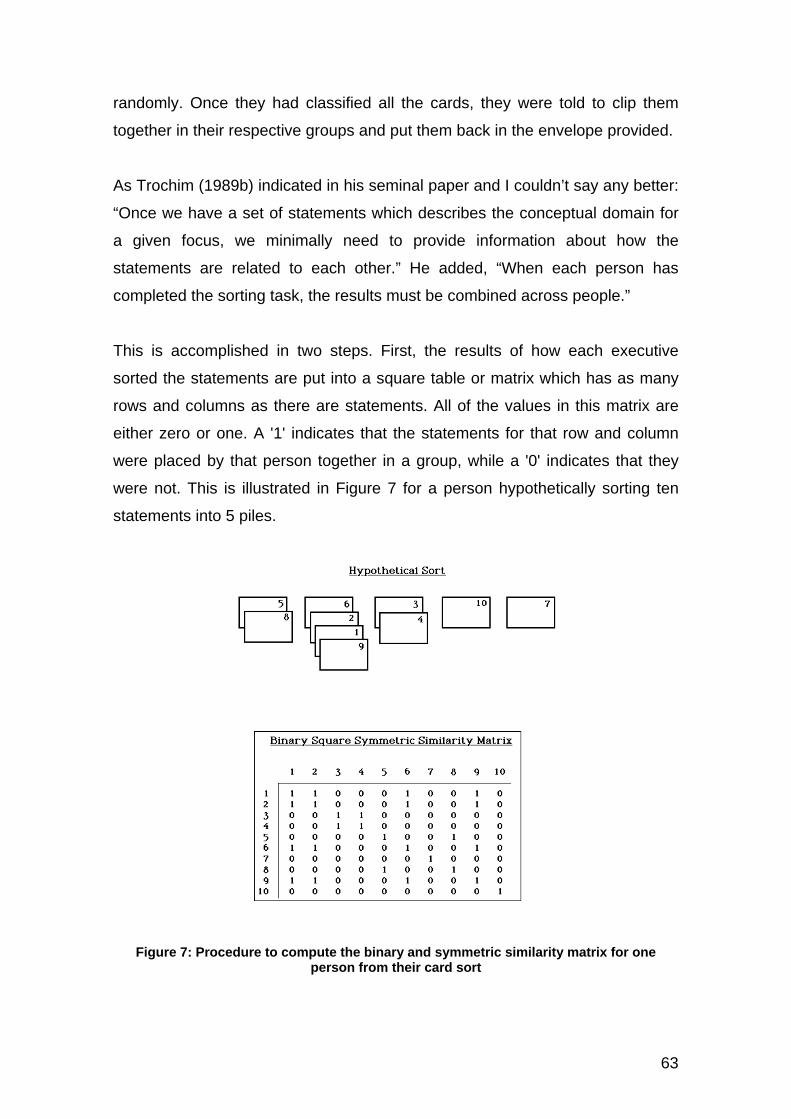
63
randomly. Once they had classified all the cards, they were told to clip them
together in their respective groups and put them back in the envelope provided.
As Trochim (1989b) indicated in his seminal paper and I couldn’t say any better:
“Once we have a set of statements which describes the conceptual domain for
a given focus, we minimally need to provide information about how the
statements are related to each other.” He added, “When each person has
completed the sorting task, the results must be combined across people.”
This is accomplished in two steps. First, the results of how each executive
sorted the statements are put into a square table or matrix which has as many
rows and columns as there are statements. All of the values in this matrix are
either zero or one. A '1' indicates that the statements for that row and column
were placed by that person together in a group, while a '0' indicates that they
were not. This is illustrated in Figure 7 for a person hypothetically sorting ten
statements into 5 piles.
Figure 7: Procedure to compute the binary and symmetric similarity matrix for one person from their card sort

64
In the above example, we can see that statements 5 and 8 were sorted together
in a group. Therefore, in row 5 - column 8 and row 8 - column 5 the entries are
'1'. Because statement 5 was not sorted with statement 6, row 5 - column 6 and
row 6 - column 5 entries are '0'. This individual matrix is termed a binary
symmetric similarity matrix. Notice that all of the diagonal values are equal to '1'
because a statement is always considered to be sorted into the same group as
itself.
After the senior executives finished sorting the 94 statements in my study, I
added this information to an Excel spreadsheet indicating the groups for every
senior executive; this is illustrated in Figure 8.
Figure 8: Spreadsheet with part of the groups for one interview
On another spreadsheet using a VLOOKUP formula, I obtained one matrix for
every senior executive with 0 and 1 between the variables, as represented in
Figure 9.
Figure 9: Part of a symmetric similarity matrix for interview number 1 from their card sort

65
In Figure 9, row 1 and column A indicate the factor number, while cell A1
indicates that this matrix is for interview number 1. As we can see, this senior
executive put statements 1, 5, 6, 9, and 11 into the same group. So, in column
B or row 2 (the same due to the symmetric similarity matrix) we can find a ‘1’
between pairs 1-1, 5-1, 6-1, 9-1, and 11-1, and a ‘0’ between 2-1, 3-1, 4-1, 8-1,
9-1 and 10-1 because factors 2, 3, 4, 8, 9, and 10 are not in the same group as
factor 1.
And, as Trochim (1989b) said:
Second, the individual sort matrices are added together to obtain a combined group similarity matrix. This matrix also has as many rows and columns as there are statements. Here, however, the value in the matrix for any pair of statements indicates how many people placed that pair of statements together in a pile regardless of what the pile meant to each person or what other statements were or were not in that pile. Values along the diagonal are equal to the number of people who sorted. Thus, in this square group similarity matrix, values can range from zero to the number of people who sorted. This final similarity matrix is considered the relational structure of the conceptual domain because it provides information about how the participants grouped the statements. A high value in this matrix indicates that many of the participants put that pair of statements together in a pile and implies that the statements are conceptually similar in some way. A low value indicates that the statement pair was seldom put together in the same pile and implies that they are conceptually more distinct. This is what I did as can be seen in Figure 10.
Figure 10: Part of the added symmetric similarity matrix for all the interviewees

66
The interpretation of every cell is the number or times that the senior executives
grouped two factors together. In the matrix diagonal there is a ’23’, representing
the number of the interviewees because every factor will always be in the same
group with itself. Additionally, a ‘3’ appears in the pair V1 and V3. This means
that 3 of the executives placed factor 1 and factor 3 in the same group of cards.
iii. Statement rating
After the executives finished grouping the cards, I then asked them to rate every
phrase or statement using a Lykert-type response scale (1-to-5). Specifically,
executives had to use the following scale (from “much less” – 1 – to “much
more” – 5) to indicate how much more likely they would have used the
Executive Information System depending on the different conditions:
1. Much less
2. Less
3. No more, no less
4. More
5. Much more
All the factors are presented in a positive manner; I did so to facilitate the
comparison between factors.
e. Step 4: Statement representation (map computation) The main objective of this step is show the relationship between the factors. As
Trochim (1989b) indicates:
There are three steps involved in the way in which we typically represent the conceptual domain. First, we conduct an analysis which locates each statement as a separate point on a map (i.e., the point map). Statements which are closer to each other on this map were likely to have been sorted together more frequently; more distant statements on the map were in general sorted together less frequently. Second, we group or partition the statements on this map into clusters (i.e., the cluster map) which represent higher order conceptual groupings of the original set of statements.
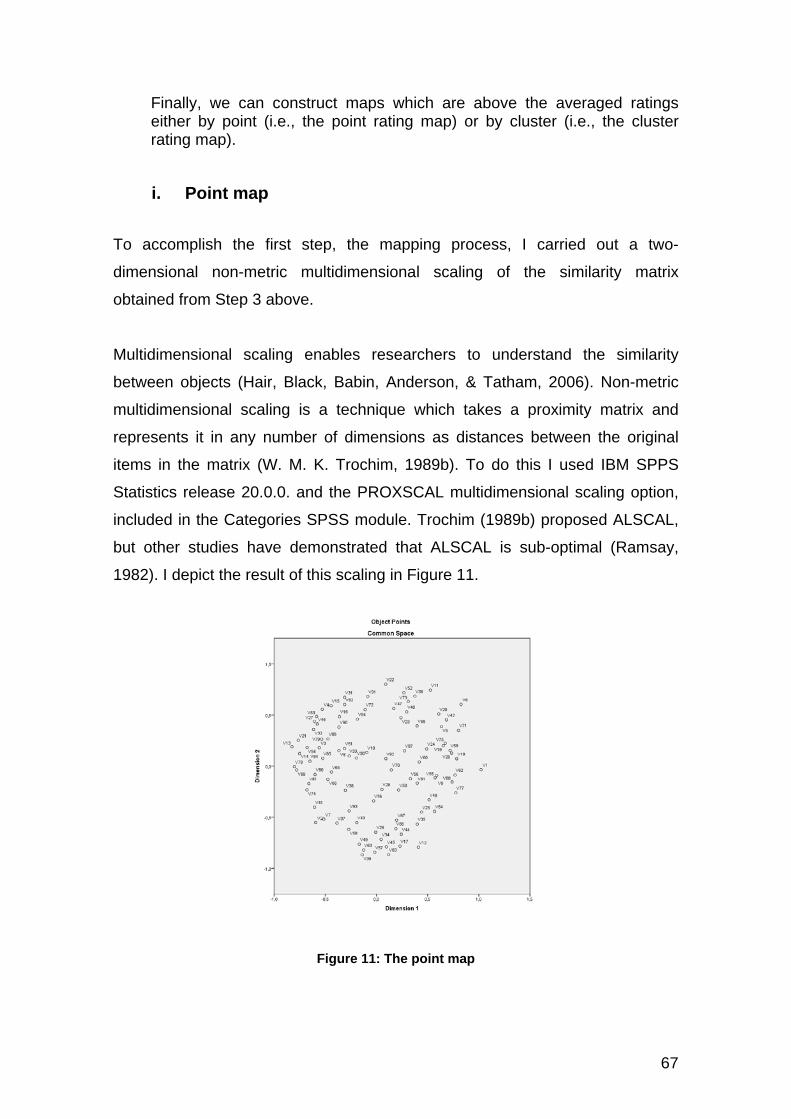
67
Finally, we can construct maps which are above the averaged ratings either by point (i.e., the point rating map) or by cluster (i.e., the cluster rating map).
i. Point map
To accomplish the first step, the mapping process, I carried out a two-
dimensional non-metric multidimensional scaling of the similarity matrix
obtained from Step 3 above.
Multidimensional scaling enables researchers to understand the similarity
between objects (Hair, Black, Babin, Anderson, & Tatham, 2006). Non-metric
multidimensional scaling is a technique which takes a proximity matrix and
represents it in any number of dimensions as distances between the original
items in the matrix (W. M. K. Trochim, 1989b). To do this I used IBM SPPS
Statistics release 20.0.0. and the PROXSCAL multidimensional scaling option,
included in the Categories SPSS module. Trochim (1989b) proposed ALSCAL,
but other studies have demonstrated that ALSCAL is sub-optimal (Ramsay,
1982). I depict the result of this scaling in Figure 11.
Figure 11: The point map
68
Every dot represents a single factor. I coded all the factors with the letter ‘V’
plus the number of the factor. The interpretation of the point map is as follows:
the closer two variables are in this map, the greater their similarity according to
the senior executives interviewed. The position of each point on the map (e.g.,
top, bottom, right, left) is not important. The only important question here is the
distance or spatial relationship between the different points.
As can be seen in Figure 12 below, the goodness of fit of these results is ‘poor’
(Stress-I 0.30769 >0.20) in keeping with Shepard and Kruskal (1964). However,
the Dispersion Accounted for is 0.90533, and Trucker’s Coefficient of
Congruence is close to 1. Bartholomew, Steele, Moustaki and Galbraith (2008)
consider that Shepard and Kruskal “based their studies on empirical experience
rather than theoretical criteria.” As such, Bartholomew et al. (2008) believe that
goodness of fit “should always be used flexibility with an eye on interpretability
of the solution which you lead.” In the next sections I discuss the interpretability
of the results obtained.
Figure 12: Stress and fit measures
ii. Cluster map
The second analysis I conduct to represent the conceptual domain is called a
hierarchical cluster analysis. This analysis is used to group individual

69
statements onto a map of statement clusters which presumably reflect similar
concepts (W. M. K. Trochim, 1989b). Cluster analysis defines the structure by
grouping objects according to their profiles on a set of variables (the cluster
variables) in which objects in close proximity to each other are grouped together
(Hair et al., 2006). In this research, I used a hierarchical agglomerative cluster
analysis using Ward’s algorithm on the Multidimensional Scaling (MDS) map
coordinates to determine how the statements cluster together based on their
similarities.
I applied a 20-to-8 cluster analysis (using IBM SPPS Statistics) to decide on the
appropriate cluster solution. This analysis begins with each statement as its
own cluster and tracks the merging of the statements into clusters up to a 20-
cluster solution. The output from this analysis generates two outputs: 1) a list of
the 20-8-cluster solution; and 2) the merging of clusters for each cluster solution
(a list version of a dendogram). The two outputs together help guide our
analysis about the goodness of fit for the final cluster solution.
As Jackson and Trochim (2002) indicate:
Each proposed cluster solution is then examined to determine how appropriate the merging or splitting of statement groups is. A final cluster solution is chosen by examining all of the cluster solutions within a certain range to determine how appropriate the merging or splitting of statement groups is. It is important to note that the central decision being made here is on the number of clusters to select—the hierarchical cluster tree structure is entirely determined by the analysis and is not the subject of researcher discretion or judgment. The reason such judgment is required with cluster analysis is that there is no sensible mathematical criterion that can be used to select the number of clusters. This is because the “best” number of clusters depends on the level of specificity desired and the context at hand, factors that can only be judged subjectively. So this issue of cluster number selection illustrates how concept mapping is a blending of human judgment based on the more objective mathematical algorithm of cluster analysis”.
This coincides with Hair et al. (2006) who indicate that, when not finding a
systematic trait which determines the number of clusters, researchers can then
decide to establish a number of clusters in which merely statistical groupings
also provide a conceptual meaning coherent with the ideas contained in each
group.

70
I thus decided that a 12-cluster solution was the most appropriate solution as
depicted in Figure 13.
Figure 13: The cluster map
After conducting the multidimensional scaling and cluster analysis, I was able to
generate a point and a cluster map as indicated by Trochim (1989b). The final
analysis involves obtaining average ratings across participants for each
statement and for each cluster.
1
2
3
4 5
6
7
8
9
10
1112
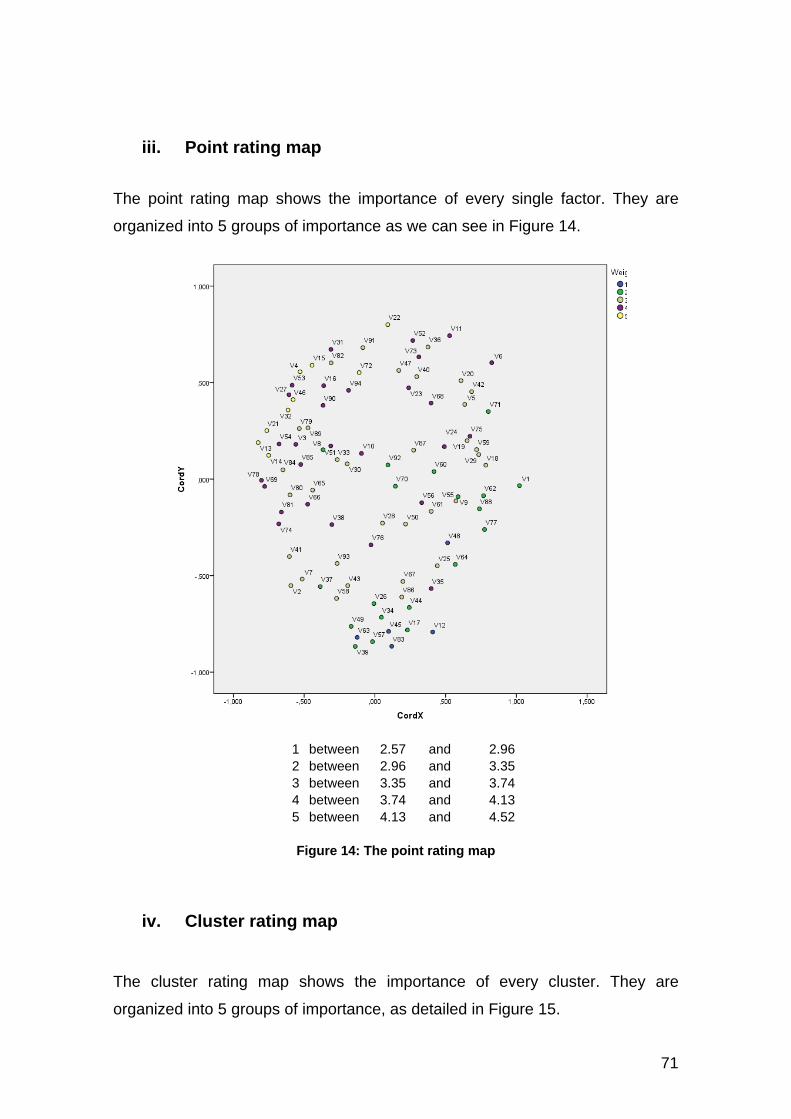
71
iii. Point rating map
The point rating map shows the importance of every single factor. They are
organized into 5 groups of importance as we can see in Figure 14.
1 between 2.57 and 2.962 between 2.96 and 3.353 between 3.35 and 3.744 between 3.74 and 4.135 between 4.13 and 4.52
Figure 14: The point rating map
iv. Cluster rating map
The cluster rating map shows the importance of every cluster. They are
organized into 5 groups of importance, as detailed in Figure 15.

72
Figure 15: The cluster rating map
f. Reflection on the methodology used I have adapted the original Concept Mapping methodology from Trochim
(1989b) to answer the second and third research question as I discuss in the
next sections. This methodology allows senior executives to group and rate the
factors. But, to answer my first research question, I need to compare the
median rated values for factors coming from the interviews and from the
literature review. Concept Mapping does not provide this as I discuss in the next
sections. As such, I combine Concept Mapping (qualitative and quantitative)
with other quantitative methods.
As Morgan (1998) argued:
The core of this approach [combining qualitative and quantitative methods] is an effort to integrate the complementary strengths of different methods through a division of labor. This amounts to using a qualitative and quantitative method for different but well coordinated purposes within the same overall research project. This division of labor is accomplished through two basic decisions: a priority decision that pairs a principal method with a complementary method and a sequence decision that
73
determines whether the complementary method precedes or follows the principal method.
The main advantage of Concept Mapping is that this methodology mixes
qualitative and quantitative methods in keeping with Morgan (1998). My priority
decision was to use Concept Mapping from Trochim (1989b). The qualitative
method in Concept Mapping allowed me to find the factors to be compared to
the factors from the literature review. By contrast, the quantitative method in
Concept Mapping allowed me to obtain the data to answer my first research
question and answered my second and third research questions. The
interviews with senior executives to identify the factors that they considered
could affect their use of EIS were critical to be to compare them later with the
literature review factors.
Another interesting lesson learned came from the process of selecting the
factors in the literature review. I recorded 347 factors in total. As this is a difficult
number of factors to manage, I added some general labels to find similarities
and work with groups that were more manageable. This step also enabled
providing traceability to every factor.
The application of Concept Mapping in my research has some limitations, as we
can see. The choice to use Concept Mapping implies, as Trochim recommends
(1989b), between 15 and 30 subjects to be studied. In those cases when you
need a higher number to increase validity, you should design the study with
different groups. This research design has done that and offers added value in
that, by comparing results from different groups, researchers can clearly show
the reliability of their research. My study has one limitation due to the fact that it
is only based on one group. Some of the senior executives also noted during
this study that “it’s not easy to group 94 cards.”

74
5. Analysis and findings In this section I present my analysis and main findings of my research. This
section includes the 6 sections withinstep number 5 in the adapted Concept
Mapping methodology, namely, “Map interpretation” as presented in Section 4
under “Research methodology.”
i. Statement list
In keeping with Trochim’s recommendations (1989b), I obtained the mean
ratings for the statements, their standard deviation and ordered them by their
scores. Results are shown in Table 6 ordered by the factors’ importance (mean
score) in terms of their probability of increasing senior executives’ use of EIS
systems.
Factor number
Factor Factor origins
Mean Standard deviation
Rank
13 If the executive information system had included the information you needed … EIS 4.52 0.79 1
32 If it had been easy to interpret the information in the executive information system’s graphs, tables, reports, etc. …
EIS 4.43 0.66 2
72 If the executive information system had contributed more to your job performance … General 4.39 0.84 3
4 If the quality of the executive information system information had been better … General 4.35 0.78 4
14 If the executive information system had been more reliable … General 4.35 0.65 4
21 If you had needed less time to find the information required … EIS 4.26 0.69 6
46 If the executive information system had been better designed to suit your tasks … General 4.22 0.80 7
22 If the executive information system and the business objectives had been better linked … General 4.17 0.98 8
15 If the executive information system had offered a greater wealth of information … General 4.13 0.81 9
27 If the executive information system had had a drill-down function, enabling you to go from aggregated information to detailed data, …
EIS 4.09 0.67 10
53 If the executive information system could have been customized … General 4.09 0.85 10
10 If there had been a problem and you could have used the executive information system to focus on the issue, disregarding the details, …
EIS 4.04 0.82 12
16 If the executive information system had included more external information ... General 4.00 1.15 13
31 If the executive information system had been multidimensional in terms of functionality … EIS 4.00 0.85 13
75 If there had been organizational support on the executive information system … General 4.00 0.80 13
85 If the first screen had contained the most important information about all key areas … EIS 4.00 0.95 13
6 If the use of the executive information system had been a part of the organization's culture ... General 3.96 0.93 17
51 If the executive information system had offered clear and precise help … EIS 3.96 0.88 17
56 If you had been involved in the executive information system's design … General 3.96 0.98 17
52 If you had participated in the executive information system's development … General 3.91 0.95 20
68 If management had been more supportive during the project's implementation … General 3.91 0.90 20
73 If there had been internal training programs for the executive information system … General 3.91 0.73 20
35 If you had trusted the executive information system … General 3.87 0.81 23
69 If the executive information system had been more accurate … General 3.86 0.89 24

75
3 If the executive information system screens had been designed better … General 3.83 0.94 25
66 If it had been easier to understand the information model used … EIS 3.83 0.83 25
74 If it had been easier to access the executive information system … General 3.83 0.78 25
81 If the executive information system had needed less response time … General 3.83 0.78 25
90 If the executive information system had been compatible with other executive information systems … General 3.83 0.94 25
23 If the project's implementation process had been better… General 3.78 0.67 30
24 If the project's implementation had been incremental … General 3.78 0.74 30
76 If you had identified the decision-making criteria you wanted to use … General 3.78 1.00 30
94 If the executive information system information had been updated more often … General 3.78 0.80 30
11 If the executive information system could have been adapted to the different executive leadership styles …
General 3.74 0.81 34
38 If it had been easier to know what information the executive information system contained … EIS 3.74 0.92 34
54 If the system graphics had been better … General 3.74 1.01 34
78 If it had been easier to browse the executive information system … General 3.74 0.69 34
20 If the project had had more visibility … General 3.70 0.97 38
30 If the system's infrastructures had been better … General 3.70 0.82 38
36 If resources had been available for the executive information system … General 3.70 0.76 38
40 If the designers had instilled a more favorable attitude among executives by involving them during the implementation project …
General 3.70 0.76 38
41 If it had been less difficult to use the executive information system … General 3.70 0.93 38
58 If you had had more time to play with and explore the executive information system … General 3.70 1.06 38
87 If you had participated during the implementation project … General 3.70 0.97 38
28 If you had had support from information specialists … General 3.65 0.88 45
50 If there had been back-end support for executive information system users … General 3.65 0.78 45
65 If the terminology used in the executive information system had been clearer … General 3.65 0.83 45
42 If the organization had used the executive information system more … General 3.61 0.89 48
55 If the executive information system had been more important … General 3.61 0.72 48
91 If there had been conditions making it easier to access the executive information system … General 3.61 0.78 48
19 If there had been organizational pressure to use the executive information system … General 3.57 0.90 51
59 If there had been organizational polices supporting the executive information system ... General 3.57 0.79 51
79 If the executive information system had included "What if" functionalities … General 3.57 0.84 51
80 If the executive information system had been more attractive … General 3.57 0.66 51
84 If the executive information system had offered greater security … General 3.57 0.73 51
89 If the executive information system had had a "map-like function" in case you got lost … EIS 3.52 0.73 56
5 If the executive group had been more innovative … General 3.48 0.85 57
7 If the executive information system had been easier to learn … EIS 3.48 1.08 57
25 If you had felt greater cultural affinity with the executive information system ... General 3.48 0.99 57
61 If you had participated in the training program … General 3.48 0.73 57
67 If you had been better able to innovate… General 3.48 0.85 57
86 If you had felt happier using the executive information system … General 3.48 1.12 57
2 If the executive information system had been easier to remember… EIS 3.43 1.04 63
47 If there had been external courses on how to use the executive information system … General 3.43 0.95 63
18 If someone had demonstrated the positive results obtained from using the executive information system …
General 3.39 1.16 65
29 If there had been institutional control over the executive information system's use ... General 3.39 0.89 65
33 If the executive information system had had the same functionalities as Windows or the Internet … EIS 3.39 1.16 65
43 If you had had more experience with the executive information system … General 3.35 0.78 68
82 If access to the executive information system director had been easier ... General 3.35 0.71 68
93 If you had known how the calculations were done (having the option to check them) … EIS 3.35 0.65 68
70 If the developer had been more responsive … General 3.32 0.78 71
9 If you had been closer to sources of power … General 3.22 0.90 72
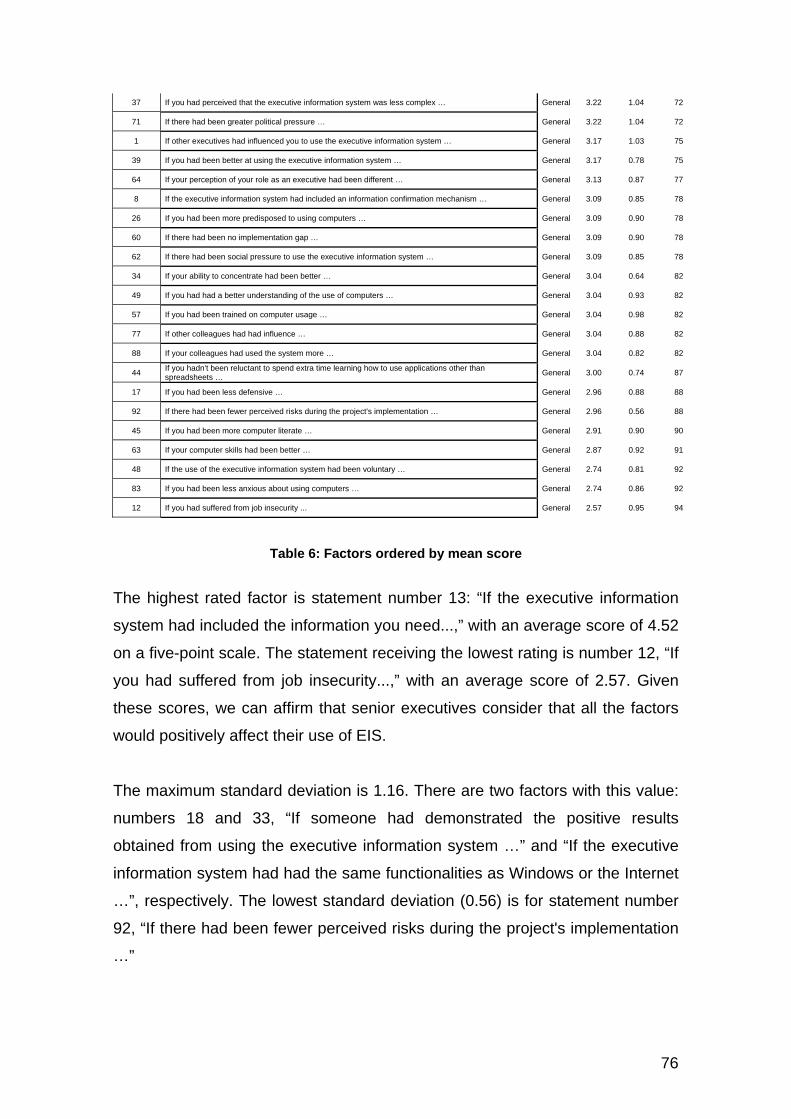
76
37 If you had perceived that the executive information system was less complex … General 3.22 1.04 72
71 If there had been greater political pressure … General 3.22 1.04 72
1 If other executives had influenced you to use the executive information system … General 3.17 1.03 75
39 If you had been better at using the executive information system … General 3.17 0.78 75
64 If your perception of your role as an executive had been different … General 3.13 0.87 77
8 If the executive information system had included an information confirmation mechanism … General 3.09 0.85 78
26 If you had been more predisposed to using computers … General 3.09 0.90 78
60 If there had been no implementation gap … General 3.09 0.90 78
62 If there had been social pressure to use the executive information system … General 3.09 0.85 78
34 If your ability to concentrate had been better … General 3.04 0.64 82
49 If you had had a better understanding of the use of computers … General 3.04 0.93 82
57 If you had been trained on computer usage … General 3.04 0.98 82
77 If other colleagues had had influence … General 3.04 0.88 82
88 If your colleagues had used the system more … General 3.04 0.82 82
44 If you hadn't been reluctant to spend extra time learning how to use applications other than spreadsheets …
General 3.00 0.74 87
17 If you had been less defensive … General 2.96 0.88 88
92 If there had been fewer perceived risks during the project's implementation … General 2.96 0.56 88
45 If you had been more computer literate … General 2.91 0.90 90
63 If your computer skills had been better … General 2.87 0.92 91
48 If the use of the executive information system had been voluntary … General 2.74 0.81 92
83 If you had been less anxious about using computers … General 2.74 0.86 92
12 If you had suffered from job insecurity ... General 2.57 0.95 94
Table 6: Factors ordered by mean score
The highest rated factor is statement number 13: “If the executive information
system had included the information you need...,” with an average score of 4.52
on a five-point scale. The statement receiving the lowest rating is number 12, “If
you had suffered from job insecurity...,” with an average score of 2.57. Given
these scores, we can affirm that senior executives consider that all the factors
would positively affect their use of EIS.
The maximum standard deviation is 1.16. There are two factors with this value:
numbers 18 and 33, “If someone had demonstrated the positive results
obtained from using the executive information system …” and “If the executive
information system had had the same functionalities as Windows or the Internet
…”, respectively. The lowest standard deviation (0.56) is for statement number
92, “If there had been fewer perceived risks during the project's implementation
…”

77
In Table 7 I detail all the factors’ main descriptives for average and standard
deviation.
Descriptives
Statistic Std. Error Average Mean 3.5892 .04318
95% Confidence Interval for Mean
Lower Bound 3.5034
Upper Bound 3.6749
5% Trimmed Mean 3.5897
Median 3.6300
Variance .175
Std. Deviation .41867
Minimum 2.57
Maximum 4.52
Range 1.95
Interquartile Range .57
Skewness -.111 .249
Kurtosis -.398 .493
StandardDev Mean .8579 .01282
95% Confidence Interval for Mean
Lower Bound .8324
Upper Bound .8833
5% Trimmed Mean .8551
Median .8500
Variance .015
Std. Deviation .12430
Minimum .56
Maximum 1.16
Range .60
Interquartile Range .16
Skewness .257 .249
Kurtosis -.053 .493
Table 7 List of descriptives for factors’ average and standard deviation
Table 8 details results if we carry out the same analysis on the two groups of
factors (those stemming from interviews are labeled ‘EIS’ while those from the
literature review ‘General’).

78
Descriptives
Statistic Std. Error Average EIS Mean 3.8696 .09759
95% Confidence Interval for Mean
Lower Bound 3.6603
Upper Bound 4.0789
5% Trimmed Mean 3.8623
Median 3.9565
Variance .143
Std. Deviation .37796
Minimum 3.35
Maximum 4.52
Range 1.17
Interquartile Range .61
Skewness .154 .580
Kurtosis -1.019 1.121
General Mean 3.5359 .04575
95% Confidence Interval for Mean
Lower Bound 3.4449
Upper Bound 3.6270
5% Trimmed Mean 3.5368
Median 3.6100
Variance .165
Std. Deviation .40665
Minimum 2.57
Maximum 4.39
Range 1.82
Interquartile Range .66
Skewness -.153 .271
Kurtosis -.491 .535
StandardDev EIS Mean .8481 .04100
95% Confidence Interval for Mean
Lower Bound .7602
Upper Bound .9360
5% Trimmed Mean .8421
Median .8341
Variance .025
Std. Deviation .15878
Minimum .65
Maximum 1.16
Range .51
Interquartile Range .26
Skewness .502 .580
Kurtosis -.611 1.121
General Mean .8597 .01325
95% Confidence Interval for Lower Bound .8334
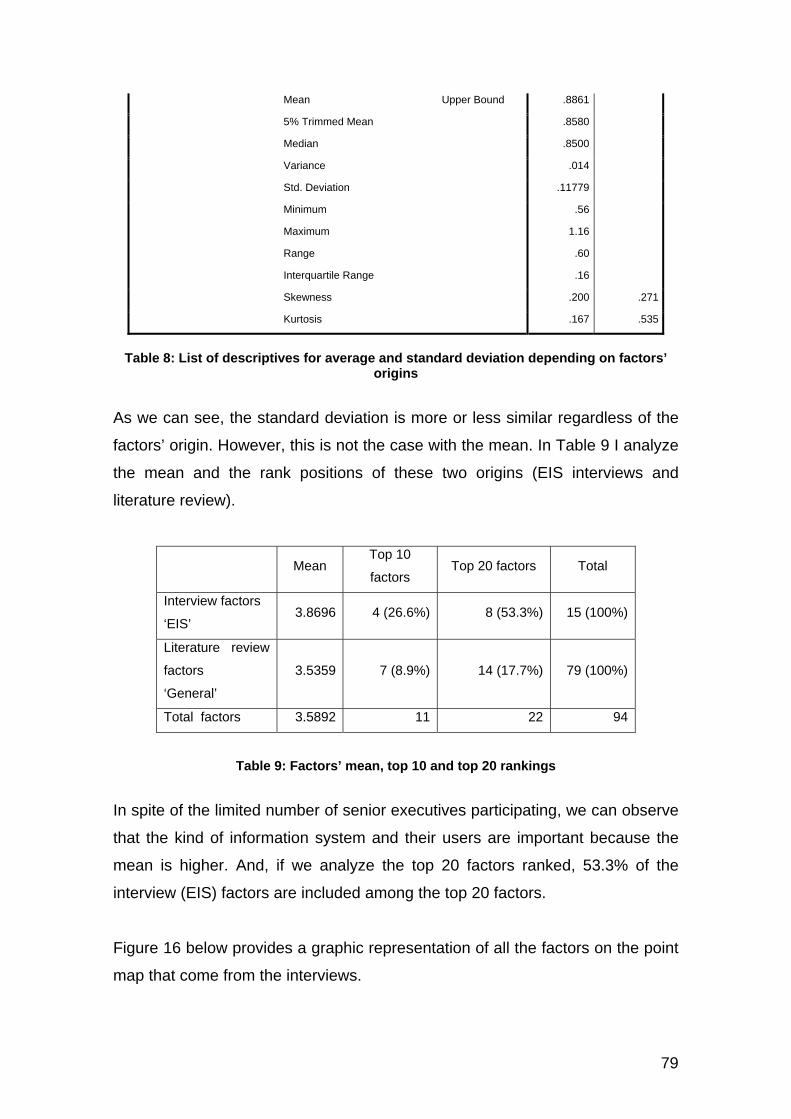
79
Mean Upper Bound .8861
5% Trimmed Mean .8580
Median .8500
Variance .014
Std. Deviation .11779
Minimum .56
Maximum 1.16
Range .60
Interquartile Range .16
Skewness .200 .271
Kurtosis .167 .535
Table 8: List of descriptives for average and standard deviation depending on factors’
origins
As we can see, the standard deviation is more or less similar regardless of the
factors’ origin. However, this is not the case with the mean. In Table 9 I analyze
the mean and the rank positions of these two origins (EIS interviews and
literature review).
Mean
Top 10
factors Top 20 factors Total
Interview factors
‘EIS’ 3.8696 4 (26.6%) 8 (53.3%) 15 (100%)
Literature review
factors
‘General’
3.5359 7 (8.9%) 14 (17.7%) 79 (100%)
Total factors 3.5892 11 22 94
Table 9: Factors’ mean, top 10 and top 20 rankings
In spite of the limited number of senior executives participating, we can observe
that the kind of information system and their users are important because the
mean is higher. And, if we analyze the top 20 factors ranked, 53.3% of the
interview (EIS) factors are included among the top 20 factors.
Figure 16 below provides a graphic representation of all the factors on the point
map that come from the interviews.

80
Figure 16: Interview factors in red
Most of these factors are in the zone with the highest average scores, as can be
seen in the cluster rating map (Figure 13). Now we have to test if the difference
between the two groups of factors is statistically significant. The null hypothesis
is that they are equal, so the alternative hypothesis is that they are different. To
carry out this test, I did a comparison of means. We can assume the normality
of the two groups as a condition to compare the means. Results are detailed in
Figure 17.
Figure 17: Graphs for normality of the two groups of factors

81
In Figure 18 we can see the box plot graph showing the two groups.
Figure 18: Box plot graph for the two groups of variables
And, lastly, I detail T-test results in Table 10.
Levene's Test
for Equality of
Variances T-test for Equality of Means
F Sig. t df
Sig. (2-
tailed)
Mean
Difference
Std. Error
Difference
95%
Confidence
Interval of the
Difference
Lower Upper
Average Equal variances
assumed
.099 .754 2.943 92 .004 .33362 .11334 .10851 .55872
Equal variances
not assumed
3.095 20.651 .006 .33362 .10778 .10924 .55799
Table 10: T-test results

82
The p-value in Levene’s Test for equality of variances is 0.754 (>0.05). We can
thus assume that the variances are equal. In this case, the significance of the T-
test is 0.004 (<0.05). As such, I had to reject the null hypothesis. The test
demonstrated that the mean of the variables is not equal. The group of
factors stemming from the interviews thus has a greater effect on senior
executives’ use of EIS systems than the factors from the literature review.
This is the affirmative answer to my first research question.
ii. Cluster list and names
I have named all the clusters and ordered and calculated the average of each
group.
To name the clusters, I included all the factors on post-its and stuck them on a
glass wall as we can see in Figure 19. They are placed according to their
respective positions on the point map (see Figure 9 above).
Figure 19: Picture of the factors on a glass wall

83
I did this in order to facilitate the interpretation of every cluster, taking into
account the centered factors for every cluster, their position on the map and
their relative position compared to other clusters.
This exercise helped me understand the interpretation of the map dimensions
as I discuss in the next sections.
The cluster names and their descriptions are as follows:
1. EIS organizational behavior: this cluster is related to organizational
support, organizational polices and resources, EIS use, influence and
recommendations from peers, pressure to use it, control, peer usage and
importance of EIS in the organization. The highest average score is 4.00
for factor number 75: “If there had been organizational support for the
executive information system …” Two factors tie with the lowest average
score: factors 77 and 88, namely, “If other colleagues had had influence
…” and “If your colleagues had used the system more …” This cluster is
in position number 10 (out of 12 clusters) in the ranking of averages
compared to the rest of the clusters with an average score of 3.40. The
most centered factor in the cluster is number 62, “If there had been social
pressure to use the executive information system …”
2. EIS ease of use: this cluster includes factors such as that the EIS is less
difficult to use, easy to remember and learn, less complex, more time to
play with and explore with the EIS, and the traceability of calculations.
The highest average factor score in the cluster is 3.70, with a tie between
factors 41 and 58: “If it had been less difficult to use the executive
information system …” and “If you had had more time to play with and
explore the executive information system …,” respectively. This cluster
received an average score of 3.46 and is in position number 9 in the
ranking of the averages compared to the rest of the clusters. The most
centered factor in the cluster is number 37, “If you had perceived that the
executive information system was less complex …”

84
3. EIS design: this cluster includes information that users need, reliability,
screens, graphics, first screen with the most important information, “map-
like” function, less time to find the information that you need, etc. Factor
number 13, “If the executive information system had included the
information you needed …”, is ranked the highest, with a 4.52, while
factor 89, “If the executive information system had had a "map-like
function" in case you got lost …,” received the lowest average score with
a 3.52. This cluster occupies position number 3 out of 12 in the ranking
of clusters and has an average score of 3.97. The most centered factor
in the cluster is number 54, “If the system graphics had been better …”
4. EIS content and access to information: this cluster includes factors
such as the EIS is easy to interpret (graphs, tables, reports), quality of
the EIS, adapted to senior executives’ tasks, greater wealth of
information, drill-down function, user customization, compatibility with
other EIS, and access to the EIS director. Factor number 32, “If it had
been easy to interpret the information in the executive information
system’s graphs, tables, reports, etc. …,” scored the highest with a 4.43.
Factor 82, “If access to the executive information system director had
been easier ...,” scored the least, with a 3.35. This cluster occupies the
top position with the highest average score: 4.05. The most centered
factor in this cluster is number 15, “If the executive information system
had offered a greater wealth of information …”
5. Importance of EIS use in the organization: this cluster includes factors
such as if EIS is a part of the organization’s culture, EIS project visibility,
EIS use, executives’ innovativeness and political pressure. The highest
average score is 3.96 for factor 6, “If the use of the executive information
system had been a part of the organization's culture ...” The factor with
the lowest average score is number 71, “If there had been greater
political pressure …” This cluster holds position number 7 with an
average score of 3.59. This is the same rating as the average of all the
factors. The most centered factor in the cluster is number 42, “If the
organization had used the executive information system more …”

85
6. EIS confidence: this cluster includes the capacity to access the
information to solve problems with the EIS, clear and precise help,
infrastructures, information confirmation mechanisms, and the same
functionalities as Windows or Internet. The highest averaged factor is
number 10, “If there had been a problem and you could have used the
executive information system to focus on the issue, disregarding the
details…” The lowest rated factor is number 8, “If the executive
information system had included an information confirmation mechanism
…” This cluster holds position number 6 with an average score of 3.63.
The most centered factor in the cluster is number 33, “If the executive
information system had had the same functionalities as Windows or the
Internet …”
7. Executives’ involvement in EIS: this cluster includes executives’
participation in EIS development, management support for the project,
internal and external courses, implementation process, designers’
attitudes, and adaptability to different executive leadership styles. There
is a triple tie with respect to the highest averaged factors: number 52, “If
you had participated in the executive information system's development
…”, number 68, “If management had been more supportive during the
project's implementation …,” and number 73, “If there had been internal
training programs for the executive information system …” This cluster
holds position number 4 out of 12 with an average score of 3.76. The
most centered factor in the cluster is number 73, “If there had been
internal training programs for the executive information system …”
8. Executives’ attitudes: this cluster includes executive trust in the EIS,
executive innovation, cultural affinity to the EIS, pleasure in using the
EIS, role perception, reluctance to spend extra time learning the EIS,
less defensive attitudes and job insecurity. There is a triple tie between
the highest average factors: number 25, “If you had felt greater cultural
affinity with the executive information system ...”, number 67, “If you had
been better able to innovate…,” and number 86, “If you had felt happier
86
using the executive information system …” The lowest scoring factor is
number 12, “If you had suffered from job insecurity ...” This cluster
occupies position number 11 with an average score of 3.19. The most
centered factor in the cluster is number 35, “If you had trusted the
executive information system …”
9. EIS focus: this cluster includes the EIS’ contribution to the executives’
job performance and linkage with business objectives, as well as ability
to access the EIS and time to update. Factor 72, “If the executive
information system had contributed more to your job performance …,” is
scored the highest with a 4.39. The poorest scoring factor in this cluster
is number 91, “If there had been conditions making it easier to access
the executive information system …” This cluster holds position number
2 out of 12 with an average score of 3.99. The most centered factor in
this cluster is number 72, “If the executive information system had
contributed more to your job performance …”
10. Executives’ ability to use EIS: this cluster includes the executives’
ability to use the EIS, executive predisposition to use computers,
executives’ ability to concentrate, executives’ training and understanding
of the use of computers, executive computer literacy and skills and their
anxiousness when using computers. The highest averaged factor is
number 39, “If you had been better at using the executive information
system …” The factor with the lowest average is number 83, “If you had
been less anxious about using computers …” This cluster occupies
position number 12 with an average score of 2.99. The most centered
factor in the cluster is number 57, “If you had been trained on computer
usage …”
11. Executives’ proximity to EIS: this cluster includes executive
participation in EIS design and in decision-making criteria, availability of
information specialists and back-end support, participation in the training
program, relationship with the developer and lower perceived risk during
the project’s implementation. The factor with the highest score is number

87
56, “If you had been involved in the executive information system's
design …” The factor with the lowest score is number 92, “If there had
been fewer perceived risks during the project's implementation …” This
cluster is ranked 8 of 12 with an average score of 3.54. The most
centered factor in the cluster is number 70, “If the developer had been
more responsive …”
12. EIS accessibility: this cluster includes factors such as EIS accuracy, it is
easy to understand, access, easy to find information and browse, as well
as lower response time, clear terminology, EIS attractiveness and
security. The highest averaged factor is number 69, “If the executive
information system had been more accurate …” The lowest rated factors
are number 80, “If the executive information system had been more
attractive …,” and number 84, “If the executive information system had
offered greater security …” This cluster occupies position number 5 out
of 12 with an average score of 3.73. The most centered factor in the
cluster is number 80, “If the executive information system had been more
attractive …”
The names of the clusters are the answer to my second research
question, as we can see in more detail in section 6 below.
Table 11 below details the complete list of factors and clusters.
Cluster name Factor number
Factor Mean Factor origins
EIS Organizational behavior
1
If other executives had influenced you to use the executive information system … 3.17 General
9 If you had been closer to sources of power … 3.22 General
18
If someone had demonstrated the positive results obtained from using the executive information system … 3.39 General
19
If there had been organizational pressure to use the executive information system … 3.57 General
24 If the project's implementation had been incremental … 3.78 General
29
If there had been institutional control over the executive information system's use ... 3.39 General
55 If the executive information system had been more important … 3.61 General
59
If there had been organizational polices supporting the executive information system ... 3.57 General
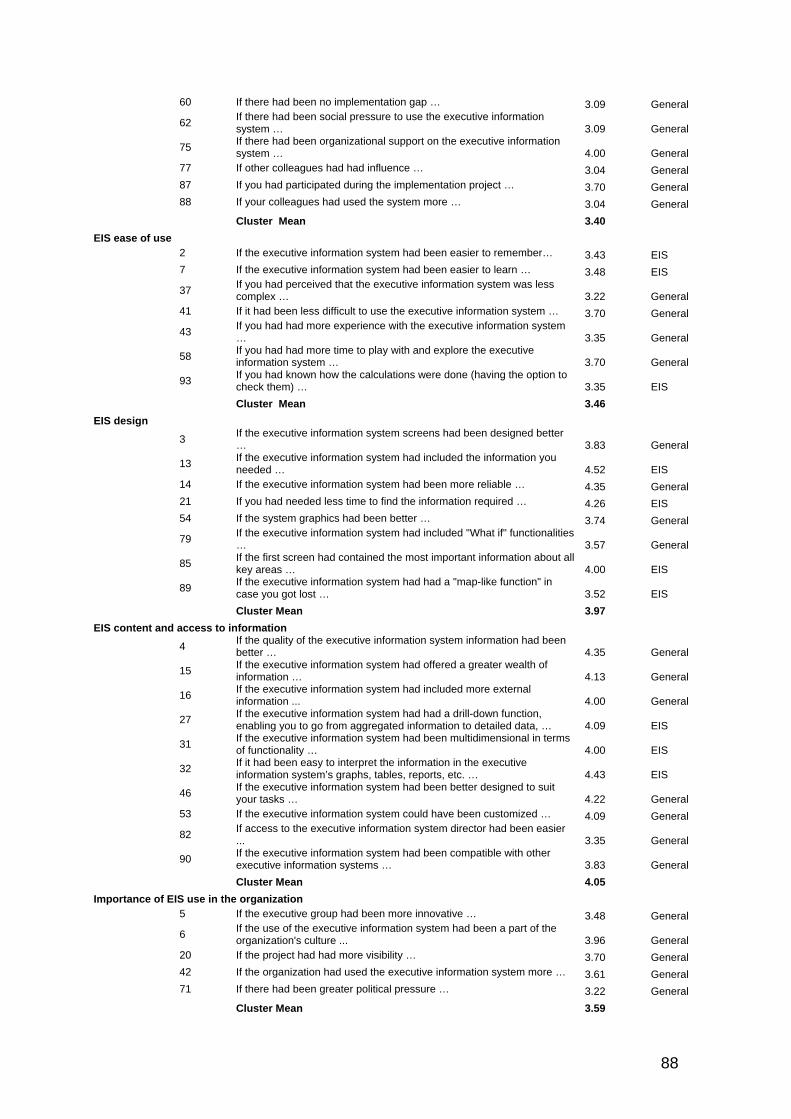
88
60 If there had been no implementation gap … 3.09 General
62
If there had been social pressure to use the executive information system … 3.09 General
75
If there had been organizational support on the executive information system … 4.00 General
77 If other colleagues had had influence … 3.04 General
87 If you had participated during the implementation project … 3.70 General
88 If your colleagues had used the system more … 3.04 General
Cluster Mean 3.40
EIS ease of use
2 If the executive information system had been easier to remember… 3.43 EIS
7 If the executive information system had been easier to learn … 3.48 EIS
37
If you had perceived that the executive information system was less complex … 3.22 General
41 If it had been less difficult to use the executive information system … 3.70 General
43
If you had had more experience with the executive information system … 3.35 General
58
If you had had more time to play with and explore the executive information system … 3.70 General
93
If you had known how the calculations were done (having the option to check them) … 3.35 EIS
Cluster Mean 3.46
EIS design
3
If the executive information system screens had been designed better … 3.83 General
13
If the executive information system had included the information you needed … 4.52 EIS
14 If the executive information system had been more reliable … 4.35 General
21 If you had needed less time to find the information required … 4.26 EIS
54 If the system graphics had been better … 3.74 General
79
If the executive information system had included "What if" functionalities … 3.57 General
85
If the first screen had contained the most important information about all key areas … 4.00 EIS
89
If the executive information system had had a "map-like function" in case you got lost … 3.52 EIS
Cluster Mean 3.97
EIS content and access to information
4
If the quality of the executive information system information had been better … 4.35 General
15
If the executive information system had offered a greater wealth of information … 4.13 General
16
If the executive information system had included more external information ... 4.00 General
27
If the executive information system had had a drill-down function, enabling you to go from aggregated information to detailed data, … 4.09 EIS
31
If the executive information system had been multidimensional in terms of functionality … 4.00 EIS
32
If it had been easy to interpret the information in the executive information system’s graphs, tables, reports, etc. … 4.43 EIS
46
If the executive information system had been better designed to suit your tasks … 4.22 General
53 If the executive information system could have been customized … 4.09 General
82
If access to the executive information system director had been easier ... 3.35 General
90
If the executive information system had been compatible with other executive information systems … 3.83 General
Cluster Mean 4.05
Importance of EIS use in the organization
5 If the executive group had been more innovative … 3.48 General
6
If the use of the executive information system had been a part of the organization's culture ... 3.96 General
20 If the project had had more visibility … 3.70 General
42 If the organization had used the executive information system more … 3.61 General
71 If there had been greater political pressure … 3.22 General
Cluster Mean 3.59

89
EIS confidence
8
If the executive information system had included an information confirmation mechanism … 3.09 General
10
If there had been a problem and you could have used the executive information system to focus on the issue, disregarding the details, … 4.04 EIS
30 If the system's infrastructures had been better … 3.70 General
33
If the executive information system had had the same functionalities as Windows or the Internet … 3.39 EIS
51
If the executive information system had offered clear and precise help … 3.96 EIS
Cluster Mean 3.63
Executives’ involvement in EIS
11
If the executive information system could have been adapted to the different executive leadership styles … 3.74 General
23 If the project's implementation process had been better… 3.78 General
36 If resources had been available for the executive information system … 3.70 General
40
If the designers had instilled a more favorable attitude among executives by involving them during the implementation project … 3.70 General
47
If there had been external courses on how to use the executive information system … 3.43 General
52
If you had participated in the executive information system's development … 3.91 General
68
If management had been more supportive during the project's implementation … 3.91 General
73
If there had been internal training programs for the executive information system … 3.91 General
Cluster Mean 3.76
Executives’ attitudes
12 If you had suffered from job insecurity ... 2.57 General
17 If you had been less defensive … 2.96 General
25
If you had felt greater cultural affinity with the executive information system ... 3.48 General
35 If you had trusted the executive information system … 3.87 General
44
If you hadn't been reluctant to spend extra time learning how to use applications other than spreadsheets … 3.00 General
48 If the use of the executive information system had been voluntary … 2.74 General
64 If your perception of your role as an executive had been different … 3.13 General
67 If you had been better able to innovate… 3.48 General
86 If you had felt happier using the executive information system … 3.48 General
Cluster Mean 3.19
EIS focus
22
If the executive information system and the business objectives had been better linked … 4.17 General
72
If the executive information system had contributed more to your job performance … 4.39 General
91
If there had been conditions making it easier to access the executive information system … 3.61 General
94
If the executive information system information had been updated more often … 3.78 General
Cluster Mean 3.99
Executives’ ability to use EIS
26 If you had been more predisposed to using computers … 3.09 General
34 If your ability to concentrate had been better … 3.04 General
39 If you had been better at using the executive information system … 3.17 General
45 If you had been more computer literate … 2.91 General
49 If you had had a better understanding of the use of computers … 3.04 General
57 If you had been trained on computer usage … 3.04 General
63 If your computer skills had been better … 2.87 General
83 If you had been less anxious about using computers … 2.74 General
Cluster Mean 2.99
Executives’ proximity to EIS
28 If you had had support from information specialists … 3.65 General
50
If there had been back-end support for executive information system users … 3.65 General
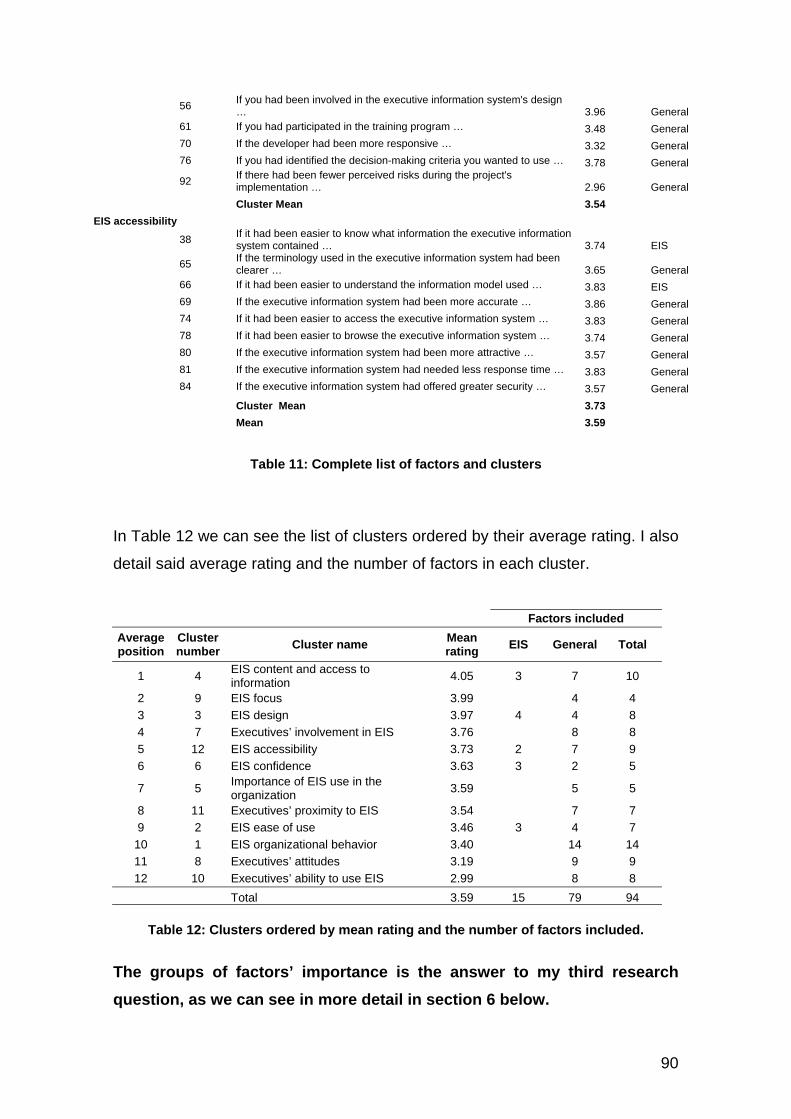
90
56
If you had been involved in the executive information system's design … 3.96 General
61 If you had participated in the training program … 3.48 General
70 If the developer had been more responsive … 3.32 General
76 If you had identified the decision-making criteria you wanted to use … 3.78 General
92
If there had been fewer perceived risks during the project's implementation … 2.96 General
Cluster Mean 3.54
EIS accessibility
38
If it had been easier to know what information the executive information system contained … 3.74 EIS
65
If the terminology used in the executive information system had been clearer … 3.65 General
66 If it had been easier to understand the information model used … 3.83 EIS
69 If the executive information system had been more accurate … 3.86 General
74 If it had been easier to access the executive information system … 3.83 General
78 If it had been easier to browse the executive information system … 3.74 General
80 If the executive information system had been more attractive … 3.57 General
81 If the executive information system had needed less response time … 3.83 General
84 If the executive information system had offered greater security … 3.57 General
Cluster Mean 3.73
Mean 3.59
Table 11: Complete list of factors and clusters
In Table 12 we can see the list of clusters ordered by their average rating. I also
detail said average rating and the number of factors in each cluster.
Factors included
Average position
Cluster number
Cluster name Mean rating
EIS General Total
1 4 EIS content and access to information
4.05 3 7 10
2 9 EIS focus 3.99 4 4
3 3 EIS design 3.97 4 4 8
4 7 Executives’ involvement in EIS 3.76 8 8
5 12 EIS accessibility 3.73 2 7 9
6 6 EIS confidence 3.63 3 2 5
7 5 Importance of EIS use in the organization
3.59 5 5
8 11 Executives’ proximity to EIS 3.54 7 7
9 2 EIS ease of use 3.46 3 4 7
10 1 EIS organizational behavior 3.40 14 14
11 8 Executives’ attitudes 3.19 9 9
12 10 Executives’ ability to use EIS 2.99 8 8
Total 3.59 15 79 94
Table 12: Clusters ordered by mean rating and the number of factors included.
The groups of factors’ importance is the answer to my third research
question, as we can see in more detail in section 6 below.

91
iii. Point map
I presented the point map above (Figure 11). This numbered point map
illustrates the 94 factors as they were placed by multidimensional scaling. It
illustrates the statements that were sorted together more frequently by senior
executives, appearing closer to each other on the map.
Figure 20: Interpretation of the point map
For example in Figure 20, looking at the bottom center (marked with a blue
circle), we can see several factors that have been sorted in a similar manner by
senior executives. For example, factor number 49, “If you had had a better
understanding of the use of computers …,” number 63, “If your computer skills
had been better …,” and number 39, “If you had been better at using the
executive information system …,” are located in close proximity to each other.

92
In contrast, if we look at the far right side of the map (red ellipse) in Figure 20,
statements such as number 6, “If the use of the executive information system
had been a part of the organization's culture ...,” and number 1, “If other
executives had influenced you to use the executive information system …,” are
quite isolated from each other. This indicates that these factors were not sorted
in a similar manner by senior executives.
iv. Cluster map
The twelve-solution cluster map visually portrays the same clustering
relationship that appears in the point map in Figure 11 and Figure 20. Like the
dots on the point map, the smaller clusters contain statements that are, from the
participants’ perspective, conceptually similar. Conversely, clusters that are
farther apart reflect conceptual differences. The closer the clusters are together
on the map, the more similar senior executives feel those items are. The
clusters located on the left side of Figure 21 below, ‘EIS design” and “EIS
confidence” (marked in magenta), are good illustrations of clusters that senior
executives perceive to be similar.
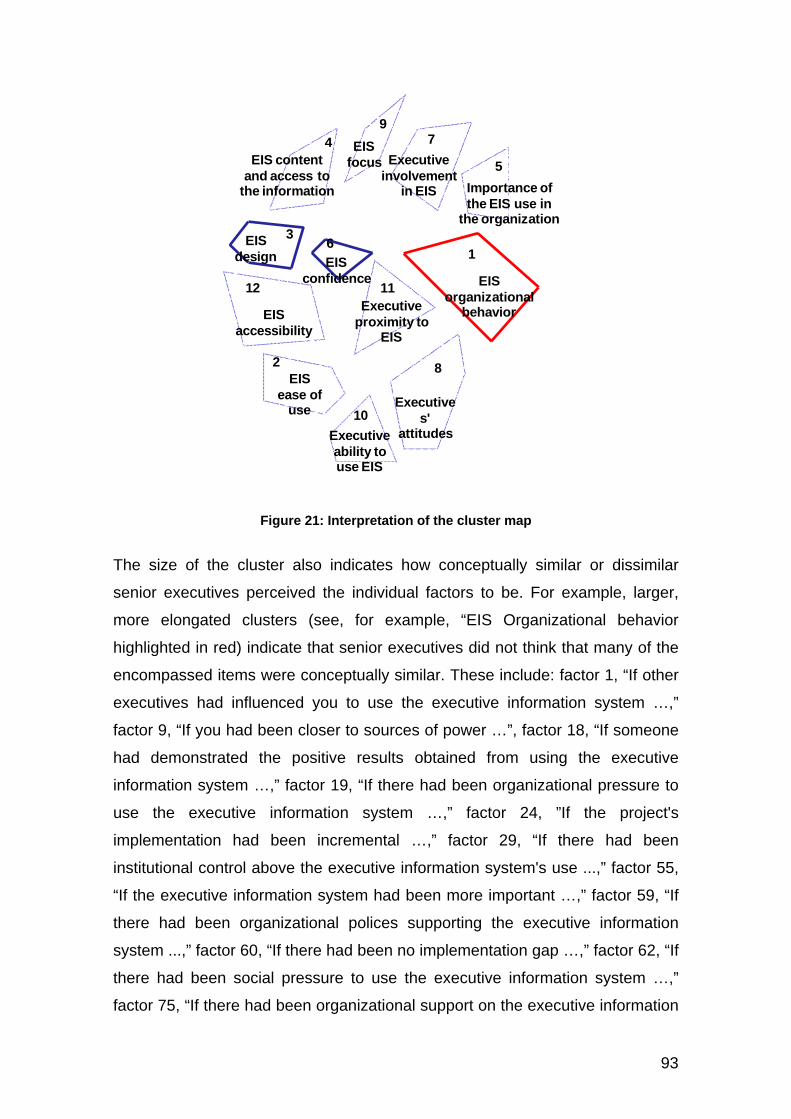
93
Figure 21: Interpretation of the cluster map
The size of the cluster also indicates how conceptually similar or dissimilar
senior executives perceived the individual factors to be. For example, larger,
more elongated clusters (see, for example, “EIS Organizational behavior
highlighted in red) indicate that senior executives did not think that many of the
encompassed items were conceptually similar. These include: factor 1, “If other
executives had influenced you to use the executive information system …,”
factor 9, “If you had been closer to sources of power …”, factor 18, “If someone
had demonstrated the positive results obtained from using the executive
information system …,” factor 19, “If there had been organizational pressure to
use the executive information system …,” factor 24, ”If the project's
implementation had been incremental …,” factor 29, “If there had been
institutional control above the executive information system's use ...,” factor 55,
“If the executive information system had been more important …,” factor 59, “If
there had been organizational polices supporting the executive information
system ...,” factor 60, “If there had been no implementation gap …,” factor 62, “If
there had been social pressure to use the executive information system …,”
factor 75, “If there had been organizational support on the executive information
1
2
3
4
5
6
7
8
9
10
1112 EIS organizational
behavior
EIS ease of
use
EIS design
EIS content and access to
the information Importance of the EIS use in
the organization
EIS confidence
Executive involvement
in EIS
Executives'
attitudes
EIS focus
Executive ability to use EIS
Executive proximity to
EIS
EIS accessibility

94
system …,” factor 77, “If other colleagues had had influence …,” factor 87, “If
you had participated during the implementation project …,” and factor 88, “If
your colleagues had used the system more …”
Conversely, the cluster labeled “EIS confidence” is relatively compact, indicating
that senior executives perceived the factors within this group to be similar.
These include factor 8, “If the executive information system had included an
information confirmation mechanism …,” factor 10, “If there had been a problem
and you could have used the executive information system to focus on the
issue, disregarding the details …,” factor 30, “If the system's infrastructures had
been better …,” factor 33, “If the executive information system had had the
same functionalities as Windows or the Internet …,” and factor 51, “If the
executive information system had offered clear and precise help …”
This is the main finding of this research and represents the response to
my second research question.
v. Point rating map
The point rating map in Figure 22 below illustrates the average item ratings by
respondents. The colored dots for each of the factor numbers indicate the
average importance executives assigned to that item. The factors are grouped
in five level scales, from 2.57 to 4.52.
Figure 22: Interpretation of the point rating map

95
We should recall that I asked executives to rate statements regarding how likely
they would have used the Executive Information System depending on the
different conditional statements using a scale from one (much less likely) to five
(much more likely). Senior executives felt that several factors were very
important in terms of how they affected their EIS use. These include factor 22,
“If the executive information system and the business objectives had been
better linked …,” factor 72, “If the executive information system had contributed
more to your job performance …,” and factor 13, “If the executive information
system had included the information you needed …” Conversely, the
statements they identified as not centrally important include factor 48, “If the use
of the executive information system had been voluntary …,” factor 12, “If you
had suffered from job insecurity ...,” and factor 83, “If you had been less anxious
about using computers …”.
vi. Cluster rating map
Figure 23 below displays the same data as Figure 15 in a two-dimensional
visual cluster format. Similar to the point rating map, this graphic illustrates the
average ratings by senior executives in a cluster format. The legend in Figure
23 indicates that the lowest rated items (i.e., 2.99–3.20) are denoted by a single
layer. Conversely, the highest rated items (i.e., 3.84–4.05) are denoted with five
layers. The highest rated cluster by senior executives was “EIS content and
access to information” (cluster rating average: 4.05), followed closely by “EIS
focus” (3.99) and “EIS design” (3.97). Conversely, the lowest rated clusters
were “Executives’ attitudes” (cluster rating average 3.19) and “Executives’
ability to use EIS” (2.99).

96
Figure 23: Interpretation of the cluster rating map
This is the answer to my third question research.
Certain groups of factors could have a greater effect on EIS use by senior
executives. As we can see in the analysis of Figure 21 above, we can identify
two general regions (see Figure 24):
Figure 24: Higher and lower impact regions in the cluster rating map
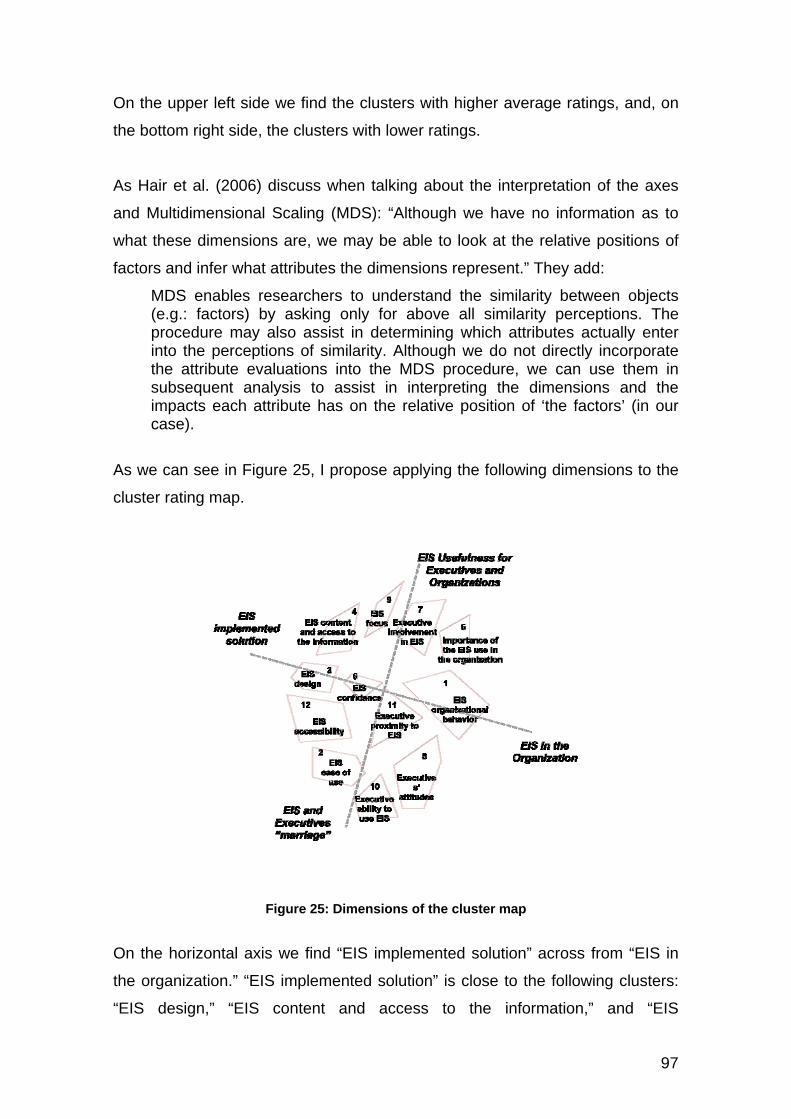
97
On the upper left side we find the clusters with higher average ratings, and, on
the bottom right side, the clusters with lower ratings.
As Hair et al. (2006) discuss when talking about the interpretation of the axes
and Multidimensional Scaling (MDS): “Although we have no information as to
what these dimensions are, we may be able to look at the relative positions of
factors and infer what attributes the dimensions represent.” They add:
MDS enables researchers to understand the similarity between objects (e.g.: factors) by asking only for above all similarity perceptions. The procedure may also assist in determining which attributes actually enter into the perceptions of similarity. Although we do not directly incorporate the attribute evaluations into the MDS procedure, we can use them in subsequent analysis to assist in interpreting the dimensions and the impacts each attribute has on the relative position of ‘the factors’ (in our case).
As we can see in Figure 25, I propose applying the following dimensions to the
cluster rating map.
Figure 25: Dimensions of the cluster map
On the horizontal axis we find “EIS implemented solution” across from “EIS in
the organization.” “EIS implemented solution” is close to the following clusters:
“EIS design,” “EIS content and access to the information,” and “EIS

98
accessibility.” As the reader can see, the three clusters depend on the concrete
implementation of an EIS. “EIS in the organization” is close to the clusters: “EIS
organizational behavior,” and “Importance of EIS use in the organization.”
In the vertical axis we find “EIS usefulness for executives and organizations”
and “EIS and executive ‘marriage.’”3 “EIS usefulness for executives and
organizations” is close to the clusters: “EIS focus,” “Executives’ involvement in
EIS,” and “Importance of EIS use in the organization.” “EIS and executive
‘marriage’” is close to: “EIS ease of use,” “Executives’ ability to use EIS” and
“Executives’ attitudes.”
I believe that these findings are also useful because the X axis confirms that we
cannot isolate information systems from the organizations in which they are
implemented and the concrete solution that the organization was looking for.
The Y axis provides another finding, namely, we cannot separate the EIS
system’s usefulness for senior executives and its usefulness for the
organization as a whole as we can see a clear relation between them. In later
sections I will defend the validity of my research. At this point, however, we can
see that the findings are consistent with the literature review. As an example,
Mawhinney and Lederer (1990) said that the senior executives use computers
based on their contribution to the managers’ job performance and depending on
their level of competence. This is consistent with my findings.
vii. Differences between senior executives
In this section I aim to carry out a deeper analysis demonstrating the differences
between senior executives and how they rated the different factors. Despite the
sample’s limitations, I found some differences between executives. This could
serve to open up new opportunities for future research. In Figure 26 below, I
highlight the biggest differences between how senior executives rated the
groups of factors using a green ellipse to facilitate interpretation.
3 I use the term ‘marriage’ to attempt to show that there is a more complex relationship between the senior executive and the EIS.

99
In this section, I have chosen not to use the same graphs Trochim et al. (W. M.
K. Trochim et al., 2004; W. Trochim & Kane, June 2005) utilize. Instead, I adopt
radar graphs as used by other researchers (Burke et al., 2005; Sutherland &
Katz, 2005) because, in my opinion, they are better at revealing the differences
between groups.

100
(1) Prior experience
As we can see in Figure 26, there are differences between senior executives
that have prior experience with EIS (N=20) compared to those with no prior
experience using EIS (N=3), as asked in question B1 in the survey. The
correlation of this group is r = .803** (**Correlation is significant at the 0.01 level
(2-tailed).
Figure 26: Rating values by senior executives that have prior experience with EIS and
senior executives without it
As we can see, senior executives without prior experience using EIS rate the
factors higher than those with prior experience. As such, it seems that prior
experience with EIS systems might reduce the importance the different factors
have.
The greatest differences occur with cluster 5, “Importance of EIS use in the
organization,” and cluster 2, “EIS Ease of use.”
0,00
0,50
1,00
1,50
2,00
2,50
3,00
3,50
4,00
4,501. EIS Organizational behavior
2. EIS Ease of use
3. EIS design
4. EIS content and access to the information
5. Importance of the EIS use in the organization
6. EIS conf idence
7. Executive involvement in EIS
8. Executives' attitudes
9. EIS focus
10. Executive ability to use EIS
11. Executive proximity to EIS
12. EIS accessibility
Prior experience
Prior experience with EIS No prior experience with EIS

101
(2) Frequency of use
In Figure 27 below, I detail executives’ ratings based on frequency of use. I
divided users into groups based on how they responded to survey question B2:
below average frequency of use (N=17) and above average frequency of use
(N=6). The correlation in this group is r = .681* (*Correlation is significant at the
0.05 level (2-tailed).
Figure 27: Rating values between senior executives based on EIS frequency of use
The biggest differences are in cluster 5, “Importance of EIS use in the
organization,” and cluster 1, “EIS organizational behavior.”
As we can see, senior executives with the lowest frequency of use rate the
factors higher.
0,00
0,50
1,00
1,50
2,00
2,50
3,00
3,50
4,00
4,50
1. EIS Organizational behavior
2. EIS Ease of use
3. EIS design
4. EIS content and access to the information
5. Importance of the EIS use in the organization
6. EIS conf idence
7. Executive involvement in EIS
8. Executives' attitudes
9. EIS focus
10. Executive ability to use EIS
11. Executive proximity to EIS
12. EIS accessibility
Frequency of use
Below average f requency of use Above average f requency of use

102
(3) Time dedicated
In Figure 28, I detail users by time of use. There are two groups based on
executives’ responses to survey question B3 regarding the time they dedicate to
EIS use: below average time spent (N=13) and above average time spent
(N=10). The correlation in this group is r = .852** (**Correlation is significant at
the 0.01 level (2-tailed):
Figure 28: Rating values between senior executives based on the time spent using the EIS
The largest difference is in cluster 5, “Importance of EIS use in the
organization.”
As we can see, the less time spent using the EIS, the higher the rating given by
executives. This is the same pattern as with frequency of use.
0,00
0,50
1,00
1,50
2,00
2,50
3,00
3,50
4,00
4,501. EIS Organizational behavior
2. EIS Ease of use
3. EIS design
4. EIS content and access to the information
5. Importance of the EIS use in the organization
6. EIS conf idence
7. Executive involvement in EIS
8. Executives' attitudes
9. EIS focus
10. Executive ability to use EIS
11. Executive proximity to EIS
12. EIS accessibility
Time dedicated
Below average time dedicated Above average time dedicated

103
(4) Years of experience
Figure 29 compares users in terms of their number of years’ experience using
EIS. The two groups are based on their response to survey question B4: below
average number of years’ experience (N=14) and above average number of
years using EIS (N=9). The correlation in this group is r = .827** (**Correlation
is significant at the 0.01 level (2-tailed).
Figure 29: Rating values between senior executives based on their years of experience as EIS users
The biggest differences are in cluster 5, “Importance of EIS use in the
organization,” and cluster 9, “EIS focus.”
Once more, the lower the number of years of experience using EIS, the higher
the ratings.
0,00
0,50
1,00
1,50
2,00
2,50
3,00
3,50
4,00
4,50
1. EIS Organizational behavior
2. EIS Ease of use
3. EIS design
4. EIS content and access to the information
5. Importance of the EIS use in the organization
6. EIS conf idence
7. Executive involvement in EIS
8. Executives' attitudes
9. EIS focus
10. Executive ability to use EIS
11. Executive proximity to EIS
12. EIS accessibility
Years of experience
Below average experience using the EIS Above average experience using the EIS

104
(5) Percentage of EIS system used
Figure 30 details ratings from two groups of users based on survey question B5
in terms of the percentage of the EIS system used: below average percentage
used (N=11) and above average percentage used (N=12). The correlation in
this group is r = .926** (**Correlation is significant at the 0.01 level (2-tailed).
Figure 30: Rating values between senior executives based on the percentage of the EIS system used
In this case, the higher the percentage of the EIS system used, the higher the
ratings. However, there is no significant difference between group ratings of the
clusters.
0,00
0,50
1,00
1,50
2,00
2,50
3,00
3,50
4,00
4,501. EIS Organizational behavior
2. EIS Ease of use
3. EIS design
4. EIS content and access to the information
5. Importance of the EIS use in the organization
6. EIS conf idence
7. Executive involvement in EIS
8. Executives' attitudes
9. EIS focus
10. Executive ability to use EIS
11. Executive proximity to EIS
12. EIS accessibility
Percentage of EIS system used
Below average % of EIS used Above average % of EIS used

105
(6) Executives’ self-evaluation as users
Figure 31 details ratings by two groups based on their responses to survey
question B6 regarding their self-evaluations as EIS users: high self-evaluation
as a user (N=12) and low self-evaluation as a user (N=11). The correlation in
this group is r = .917** (**Correlation is significant at the 0.01 level (2-tailed).
Figure 31: Rating values by executives’ self-evaluations
As we can see, ratings are essentially the same between executives who
evaluate themselves as advanced users and low-level users.
0,00
0,50
1,00
1,50
2,00
2,50
3,00
3,50
4,00
4,50
1. EIS Organizational behavior
2. EIS Ease of use
3. EIS design
4. EIS content and access to the information
5. Importance of the EIS use in the organization
6. EIS conf idence
7. Executive involvement in EIS
8. Executives' attitudes
9. EIS focus
10. Executive ability to use EIS
11. Executive proximity to EIS
12. EIS accessibility
Executives’ self-evaluation as users
High self -evaluation as a user Low self -evaluation as a user

106
(7) Satisfaction with EIS
Figure 32 describes executives’ ratings based on their response to survey
question B7 regarding their satisfaction with the EIS system used: below
average satisfaction levels (N=10) and above average satisfaction levels
(N=13). The correlation in this group is r = .922** (**Correlation is significant at
the 0.01 level (2-tailed).
Figure 32: Rating values by executives’ satisfaction with their EIS
As we can see, executives with below average levels of satisfaction rate the
factors slightly higher.
0,00
0,50
1,00
1,50
2,00
2,50
3,00
3,50
4,00
4,501. EIS Organizational behavior
2. EIS Ease of use
3. EIS design
4. EIS content and access to the information
5. Importance of the EIS use in the organization
6. EIS conf idence
7. Executive involvement in EIS
8. Executives' attitudes
9. EIS focus
10. Executive ability to use EIS
11. Executive proximity to EIS
12. EIS accessibility
Satisfaction with EIS
Below average satisfaction with EIS Above average satisfaction with EIS
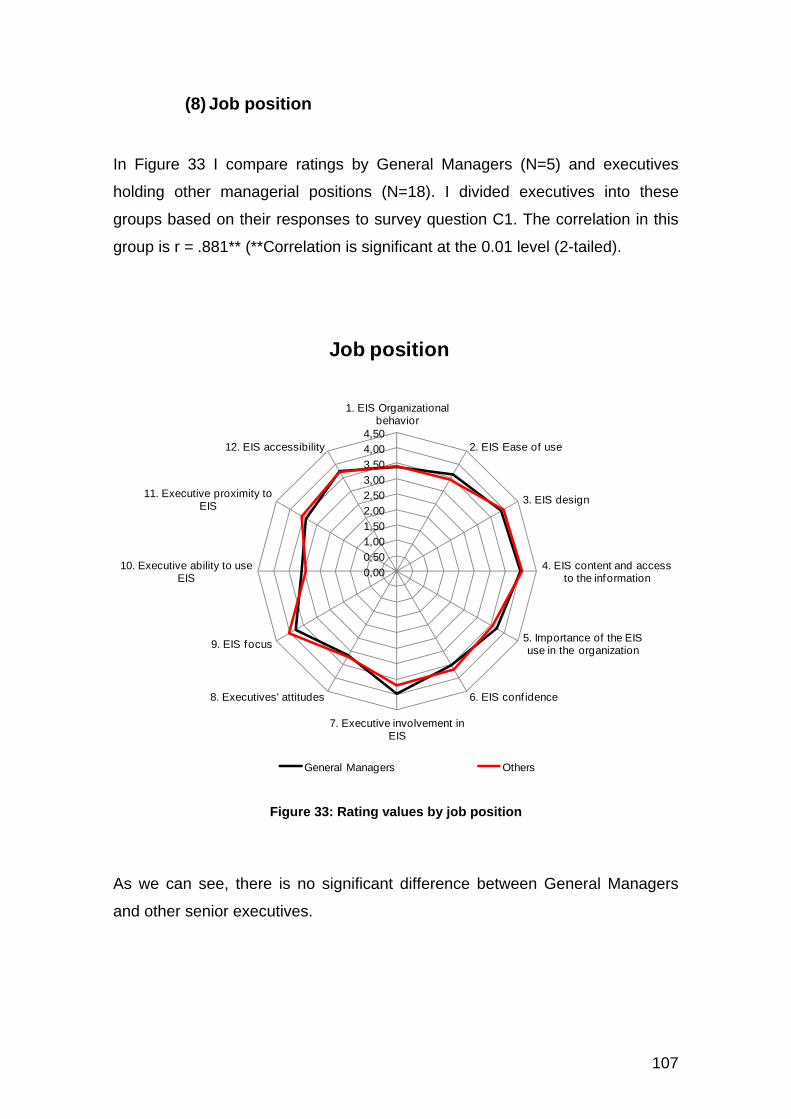
107
(8) Job position
In Figure 33 I compare ratings by General Managers (N=5) and executives
holding other managerial positions (N=18). I divided executives into these
groups based on their responses to survey question C1. The correlation in this
group is r = .881** (**Correlation is significant at the 0.01 level (2-tailed).
Figure 33: Rating values by job position
As we can see, there is no significant difference between General Managers
and other senior executives.
0,00
0,50
1,00
1,50
2,00
2,50
3,00
3,50
4,00
4,50
1. EIS Organizational behavior
2. EIS Ease of use
3. EIS design
4. EIS content and access to the information
5. Importance of the EIS use in the organization
6. EIS conf idence
7. Executive involvement in EIS
8. Executives' attitudes
9. EIS focus
10. Executive ability to use EIS
11. Executive proximity to EIS
12. EIS accessibility
Job position
General Managers Others

108
(9) Executives’ age
Figure 34 compares ratings form younger senior executives, under the age of
45 (N=19) and older senior executives, over 45 (N=4). These groups were
created based on survey question C2. The correlation in this group is r = .892**
(**Correlation is significant at the 0.01 level (2-tailed).
Figure 34: Rating values based on the senior executives’ ages
As we can see, older senior executives rate the factors higher than younger
executives.
0,00
0,50
1,00
1,50
2,00
2,50
3,00
3,50
4,00
4,501. EIS Organizational behavior
2. EIS Ease of use
3. EIS design
4. EIS content and access to the information
5. Importance of the EIS use in the organization
6. EIS conf idence
7. Executive involvement in EIS
8. Executives' attitudes
9. EIS focus
10. Executive ability to use EIS
11. Executive proximity to EIS
12. EIS accessibility
Executives' age
Younger than 45 years Older than 45 years

109
(10) Gender
Figure 35 details ratings based on senior executives’ gender: men (N=19) and
women (N=4). I defined these groups based on executives’ responses to survey
question C3. The correlation in this group is r = .722** (**Correlation is
significant at the 0.01 level (2-tailed).
Figure 35: Rating values based on senior executives’ gender
The biggest differences signaled are in cluster 2, “EIS ease of use,” cluster 6,
“EIS confidence” and cluster 7, “Executives’ involvement in EIS.
0,00
0,50
1,00
1,50
2,00
2,50
3,00
3,50
4,00
4,50
1. EIS Organizational behavior
2. EIS Ease of use
3. EIS design
4. EIS content and access to the information
5. Importance of the EIS use in the organization
6. EIS conf idence
7. Executive involvement in EIS
8. Executives' attitudes
9. EIS focus
10. Executive ability to use EIS
11. Executive proximity to EIS
12. EIS accessibility
Gender
Men Women
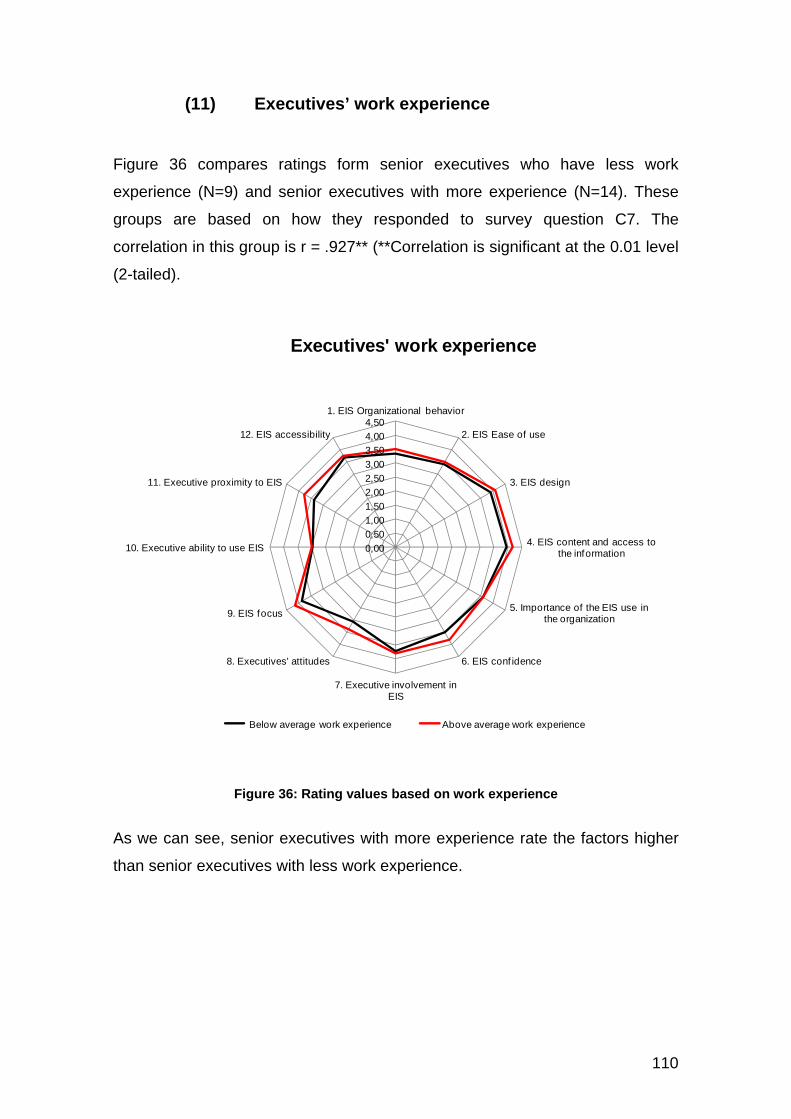
110
(11) Executives’ work experience
Figure 36 compares ratings form senior executives who have less work
experience (N=9) and senior executives with more experience (N=14). These
groups are based on how they responded to survey question C7. The
correlation in this group is r = .927** (**Correlation is significant at the 0.01 level
(2-tailed).
Figure 36: Rating values based on work experience
As we can see, senior executives with more experience rate the factors higher
than senior executives with less work experience.
0,00
0,50
1,00
1,50
2,00
2,50
3,00
3,50
4,00
4,501. EIS Organizational behavior
2. EIS Ease of use
3. EIS design
4. EIS content and access to the information
5. Importance of the EIS use in the organization
6. EIS conf idence
7. Executive involvement in EIS
8. Executives' attitudes
9. EIS focus
10. Executive ability to use EIS
11. Executive proximity to EIS
12. EIS accessibility
Executives' work experience
Below average work experience Above average work experience

111
(12) Seniority
In Figure 37, I detail ratings form senior executives who have worked less time
at their current firm (N=8) compared to senior executives who have worked
more time at their current firm (N=15). I divided executives into these groups
based on their responses to survey question C8. The correlation in this group is
r = .913** (**Correlation is significant at the 0.01 level (2-tailed).
Figure 37: Rating values by executives’ seniority
As we can see, there is no remarkable difference.
0,00
0,50
1,00
1,50
2,00
2,50
3,00
3,50
4,00
4,50
1. EIS Organizational behavior
2. EIS Ease of use
3. EIS design
4. EIS content and access to the information
5. Importance of the EIS use in the organization
6. EIS conf idence
7. Executive involvement in EIS
8. Executives' attitudes
9. EIS focus
10. Executive ability to use EIS
11. Executive proximity to EIS
12. EIS accessibility
Seniority
Below average seniority in their f irm Above average seniority in their f irm

112
I summarize the differences between groups and how each rated the clusters of
factors in Table 13 below.
Lower ratings Higher ratings Prior experience with EIS No prior experience with EIS Above average frequency of use Below average frequency of use Above average time of use Below average time of use Above average experience using the EIS Below average experience using the EIS Above average satisfaction with EIS Below average satisfaction with EIS Below average % of EIS used Above average % of EIS used Low self-evaluation as a user High self-evaluation as a user General Manager Other managerial positions Younger than 45 Older than 45 Women Men Below average work experience Above average work experience Above average seniority in their firm Below average seniority in their firm
Table 13: Lower and higher ratings by groups
In a detailed analysis of how different groups of senior executives rate the
factors, the highest differences can be seen between senior executives with no
prior experience in EIS use and those who have prior experience. Those
without prior experience consider the factor, “Importance of EIS use in the
organization,” as the second most important group of factors compared to the
group average which rates this cluster as the fifth most important. Conversely,
executives with above average frequency of use consider that the same cluster
of factors is the least important, relegating it to the twelfth position.
I cannot end this section without discussing the validity of my findings. As
Jackson and Trochim (2002) indicate:
Qualitative data pose an interesting obstacle to validity. If we don’t know anything about the subject, we cannot capture the meaning effectively—conversely, if we do know a lot about the subject, our own biases might interfere (Miles & Huberman, 1994). Concept mapping helps us to solve this tension somewhat by combining statistical analysis and human judgment. The degree to which theory guides the concept mapping analysis is introduced through different choices about whom to include as decision makers and as a researchers during the analysis. The more respondents are used at each stage of the analysis, the greater the
113
resulting map represents their collective understanding. Because concepts are social constructions, there is really no way to establish a standard by which to judge the degree of error (Krippendorff, 2004). The main strength that concept mapping offers to validity is that by using multidimensional scaling and cluster analysis to represent the similarity judgments of multiple coders, it allows meaning and relationships to emerge by aggregating the “biases” or “constructions” of many.
My main intention here was to group the factors that senior executives take into
account when they use an EIS. To do this, I started with an empirical research
study. I realized that the factors these executives mentioned were related to the
implemented EIS solution, but there was no relationship with factors mentioned
in the literature. As such, I decided to broaden the scope of my research by
adding some factors mentioned in the literature focused on TAM and the
relationship between executives and their use of computers and applications.
To do this I analyzed 125 papers to select the factors.
Though the goodness of fit is considered ‘poor’, the clusters presented are
explicit, and the axes are clear. In addition, the clusters are consistent with the
literature review presented in the conceptual framework.
114
6. Reflection and discussion In this last section, I set out to explore the answers to my research questions in
addition to other findings, scientific contributions, methodological contributions,
and future lines of research.
i. Answers to research questions:
I analyzed results in the previous section but I now formally present the answers
to my research questions.
The first research question was:
Is additional qualitative research needed to find more valuable information
about the factors?
I can confirm that more qualitative research is necessary to uncover more
valuable information about the factors (as presented in section 5.i. above). I
extracted 15 factors from the initial interviews and 79 factors from the literature
review. However, senior executives rated the 15 initial factors taken from
interviews higher than the rest of factors. This reveals that, should the situations
based on those 15 factors arise, they would more likely increase their use of
EIS compared to the other factors. At no time did the executives know that the
factors came from interviews with other senior executives. I tested this with
senior executives and EIS specifically. As such, it should also be tested with
other IT artifacts and other users.
This was one of the motivations behind my research because there are many
differences between different kinds of ITs and between different kinds of users.
Scholars should carry out qualitative research to identify the particularities of the
users and the systems and their relationship. This is one the main criticisms of
TAM. Though we can measure an information system’s perceived usefulness
and perceived ease of use, we need to know what the antecedents are in order

115
to manage the project better. This first question thus attempts to answer a well-
known limitation of TAM, as some researchers have pointed out, namely, the
necessity to find the external factors that can affect usage (Hong et al., 2001;
Venkatesh & Davis, 1996; Venkatesh & Davis, 2000; Venkatesh, 2000;
Venkatesh et al., 2003; Yousafzai, Foxall, & Pallister, 2007a; Yousafzai, Foxall,
& Pallister, 2007b).
In terms of generalizing this research and results, numerous studies attempt to
confirm general theories. TAM is an example of this. Though findings are very
helpful, TAM has been tested with different kinds of information systems and
different users. Also, there are many differences between information systems
and their users; as such, general theories are sometimes simply too general.
When we try to apply them to concrete situations, they add little value in terms
of the concrete project or little help is available for practitioners when they would
like to use them.
The second research question was:
What groups of factors do senior executives believe affect their use of
executive information systems?
Examining the results of the survey with MDS and cluster analysis, I have
presented twelve groups of factors in section 5.ii. These groups are:
1. EIS content and access to information
2. EIS focus
3. EIS design
4. Executives’ involvement in EIS
5. EIS accessibility
6. EIS confidence
7. Importance of EIS use in the organization
8. Executives’ proximity to EIS
9. EIS ease of use
10. EIS organizational behavior

116
11. Executives’ attitudes
12. Executives’ ability to use EIS
These groups of factors are more detailed than the clusters proposed by
Pijpers, Bemelmans, Heemstra and van Montfort (2001) and Ikart (2005). The
first authors proposed an aggregation based on: individual characteristics,
organizational characteristics, task-related characteristics, and IT resource
characteristics. The second author proposed another aggregation based on:
social factors, habits and facilitating conditions. Some of my groups of factors
could be included in these aggregations, but I believe that the level of detail in
my research is greater and more specific.
I have also tried to propose a theory with the limitations presented in previous
sections. I believe that this theory could help practitioners involved in one kind
of information system project with one kind of user to be more specific: EIS
projects and senior executives, finding a reduced number of factor groups. This
is also a generalization. Not all EIS systems are the same, and there are also
differences between senior executives. However, the factors presented are a
reference with which to further explore a concrete situation.
The third research question was:
How important are these groups of factors for senior executives?
In table 14 below I detail the list of clusters ordered by their average ranking in
terms of importance and the average score received. This represents the
response to my third question research.

117
Average position
Cluster name Average
rating
1 EIS content and access to information 4.05
2 EIS focus 3.99
3 EIS design 3.97
4 Executives’ involvement in EIS 3.76
5 EIS accessibility 3.73
6 EIS confidence 3.63
7 Importance of EIS use in the organization 3.59
8 Executives’ proximity to EIS 3.54
9 EIS ease of use 3.46
10 EIS organizational behavior 3.40
11 Executives’ attitudes 3.19
12 Executives’ ability to use EIS 2.99
Total 3.59
Table 14 Clusters ordered by average rating
As can be gathered, there is not a lot of difference in terms of the factors’
importance. In my opinion this is due to the complexity of this kind of system as
well as its users. The bad news for practitioners, then, is that they shouldn’t omit
any group of factors to ensure the success of their EIS project because the
different factors’ rating average is very similar. I would also underscore that the
most highly rated factors are the factors related with the EIS solution itself.
ii. Other findings
Another finding worth highlighting is related to the analysis of the cluster map
dimensions. The ‘vertical’ dimension contrasts “EIS usefulness for executives
and organization” with “EIS and executive ‘marriage.’” On one side, then, we
have EIS usefulness and, on the other, the relationship between the information
system and its users. This could be interpreted as a trade-off between utility and
effort, and we can easily find examples in our own lives. Some studies have
attempted to explain the use of an IT artifact as a function of its perceived cost
and benefits, for example, Mawhinney and Lederer (1990) when discussing
personal computer utilization by managers. I believe that relationships between
senior executives and the executive information systems they use are more
complex than their level of competence with respect to that kind of system. This
118
is because the relationship between them depends on: the executives’ ability to
use EIS, executives’ attitudes, EIS ease of use, EIS accessibility and
executives’ proximity to EIS, all the clusters that have led me to call this
relationship a ‘marriage.’
Based on my findings, when senior executives think about usefulness, they
think about the EIS’ usefulness for them but also for the organization, as
presented in the section analyzing the dimensions of the cluster rating map
(“EIS usefulness for executives and organizations”). We can affirm that the
proximity between the clusters represents the value for the organization and for
the executives. As such, it seems that the value for them is close. This point
should be largely discussed because regrettably, managers’ interests are not
aligned at times with those of their organizations.
Another additional finding is that senior executives think that the factors that
would increase their use of an EIS are more related to the EIS itself.
Specifically, this refers to the usefulness of the EIS for them and for the
organization, and the relationship between senior executives and the EIS. This
finding reveals the importance the IT artifact has and also underscores that we
can’t isolate the IT artifact to try to understand its use; nor can we isolate our
research from the organizational point of view.
Finally, despite the limitations stemming from the number of subjects studied, I
found some interesting differences between groups as discussed in section
5.vii. This part of my research should be further explored with a higher number
of senior executives.
iii. Scientific contributions
The main scientific contribution of this thesis is having completed one small part
of research on one of the most tested and studied theories in IT: TAM. This
thesis demonstrates the importance that qualitative research has in terms of

119
studying one type of IT and one type of user before carrying out quantitative
research.
The second most important contribution is presenting a model to understand
how senior executives group together the factors that they think could affect
their use of EIS and also the importance those groups of factors have. In this
respect, I have presented a general model for this kind of user and IT.
Another scientific contribution is presenting a theory that shows how senior
executives group the factors affecting their use of EIS to contrast with the two
theories proposed by Pijpers et al. (2001) and Ikart (2005), factors these
authors don’t specifically test.
iv. Methodological contributions
It is not easy to do research with senior executives, but, as this thesis shows,
the Concept Mapping methodology can help facilitate this process. I adapted
this methodology to ensure success. In hindsight, after completing this study, I
do feel that 94 factors are a high number to sort, especially for senior
executives. Some of these executives commented on this difficulty specifically.
In future research I would probably try to reduce the number of factors if
feasible.
The second methodological contribution is determining that by increasing the
number of initial interviews in future research I would probably increase the
model’s internal consistency.
Now, we can conclude that Concept Mapping is a methodology we should take
into account with senior executives whenever applicable.
Furthermore, I also think that this methodology applied in one concrete
situation, with one system and one group of users working in a single company
120
would provide additional findings that could help IT managers better assign the
resources they manage.
I have also used radar graphs instead of the line graphs typically used by most
researchers. I did so to present the differences between groups of users. In my
opinion, we can see the differences between all the clusters better by using
these types of graphs.
v. Future lines of research
I would encourage other researchers to study the importance of previous
qualitative studies applied to other kinds of users and systems. This would
serve to confirm others’ hypotheses (Yousafzai, Foxall, & Pallister, 2007a;
Yousafzai, Foxall, & Pallister, 2007b) about the need to do more qualitative
studies to better understand the factors that may affect users and IT solutions.
Another possible line of research is exploring if different factors affect different
kinds of IT systems or different kinds of users. Similarly, worth exploring would
be if one kind of user considers the same factors as important for different kinds
of IT applications, in this case, isolating that specific system.
These two possible lines of research should also evaluate the importance of
every factor and group of factors.
I have found new opportunities for research through this thesis, especially in the
analysis of the differences between senior executives and how they rate the
groups of factors based on if they have prior experience or not with EIS
systems, by the frequency of their EIS use, by the time of their EIS use, by
experience in EIS use, by the % of EIS used, by their own self-evaluations as
EIS users, by gender, by work experience, and user seniority.
Another opportunity for research is to use concept maps to develop
implementation projects and compare the success of those projects with other
projects which didn’t use the concept map as a tool to define the project itself. In

121
future research I believe that I should reduce the number of cards to sort. I need
to balance between reducing the number and reducing the detail or the scope of
analysis. Based on this study, I believe that Concept Mapping is useful to do
research with senior executives and IT solutions. Reducing the number of
factors would probably help increase the map’s internal coherence.
We know that all the factors affect senior executives’ use of EIS. But, due to the
high number of factors we didn’t relate with perceived usefulness (PU) and
perceived ease of use (PEOU), researchers interested in TAM could carry out
further studies to clearly comprehend what senior executives understand as PU
and PEOU.
My last reflection is for EIS software vendors. As we’ve seen, senior executives
only use 39% of the EIS’ functionalities, a low percentage. It seems that
software vendors need to give serious consideration to this low percentage.
They should analyze if they are developing the functionalities that senior
managers need or, contrarily, if they should invest more in methodologies to
increase the senior executives’ level of satisfaction with EIS. A 5.3 on a 0 to 10
scale is not a good mark.
To conclude, I would like to end this thesis by citing Louis Pasteur. I came
across this quote when I began my research:
To the individual who devotes his or her life to science, nothing can give more happiness than when results immediately find practical application. There are not two sciences. There is science and the application of science, and these two are linked as the fruit is to the tree.
This is, I believe, my modest contribution to offering senior executives EIS
projects which understand them and their needs more and better while also
providing researchers new opportunities for research.

122
7. References

123
Adams, D. A., Nelson, R. R., & Todd, P. A. (1992). Perceived usefulness, ease
of use, and usage of information technology - a replication. Mis Quarterly,
16(2), 227-247.
Agarwal, R., & Prasad, J. (1998a). The antecedents and consequents of user
perceptions in information technology adoption. Decision Support Systems,
22(1), 15.
Agarwal, R., & Prasad, J. (1998b). A conceptual and operational definition of
personal innovativeness in the domain of information technology.
Information Systems Research, 9(2), 204-215.
Anónimo. (1995). Making EIS work. International Journal of Health Care Quality
Assurance, 8(4), 7-8.
Arnott, D., & Pervan, G. (2005). A critical analysis of decision support systems
research. Journal of Information Technology (Palgrave Macmillan), 20(2),
67-87.
Ault, J. T., & Gleason, J. M. (1998). Expectations and patterns of use of
emerging and existing information technologies by federal government
decision-makers. Effective Utilization and Management of Emerging
Information Technologies, , 687-691.
Bailey, J. E., & Pearson, S. W. (1983). Development of a tool for measuring and
analyzing computer user satisfaction. Management Science, 29(5), 530-
545.

124
Bajwa, D. S., Rai, A., & Brennan, I. (1998). Key antecedents of executive
information system success: A path analytic approach. Decision Support
Systems, 22(1), 31-43.
Bartholomew, D. J., Steele, F., Moustaki, I., & Galbraith, J. I. (2008). In
Chapman &Hall/CRC (Ed.), Analysis of multivariate social science data
(2nd Edition ed.). Boca Raton, FL:
Benbasat, I., & Barki, H. (2007). Quo vadis, TAM? Journal of the Association for
Information Systems, 8(4), 211-218.
Bigné, J. E., Aldas-Manzano, J., Kuster, I., & Vila, N. (2002). The concept
mapping approach in marketing: An application in the travel agencies
sector. Qualitative Market Research: An International Journal, 5, 87-95(9).
Brady, R. H. (1967). Computers in top-level decision making. Harvard Business
Review, 45(4), 67-76.
Buchanan, L., & O'Connell, A. (2006). A brief history of decision making.
Harvard Business Review, 84(1), 32-+.
Burkan, W. (1988). Making executive information systems work. DSS-88
Transactions - Eighth International Conference on Decision Support
Systems, Boston, Massachusetts. pp. 121-136.
Burke, J. G., O’Campo, P., Peak, G. L., Gielen, A. C., McDonnell, K. A., &
Trochim, W. M. K. (2005). An introduction to concept mapping as a
participatory public health research method. Qualitative Health Research,
15(10), 1392-1410.
125
Burton-Jones, A., & Hubona, G. S. (2006). The mediation of external variables
in the technology acceptance model. Information & Management, 43(6),
706-717.
Cano Giner, J. L. (2011). Use of computers and applications by senior
executives. Journal of Industrial Engineering and Management, 4(2), 326-
326-338.
Cano, J. L., Fernández Alarcon, V., & Díaz Boladeras, M. (2008). Factors that
affect perceived usefulness and perceived ease of use of executive
information systems among executives. International Conference and
Doctoral Consortium "Organization Development and Change" ISEOR and
Academy of Management, Lyon, Francia. , 1. pp. 321-321-331.
Compeau, D. R., & Higgins, C. A. (1995). Computer self-efficacy - development
of a measure and initial test. Mis Quarterly, 19(2), 189-211.
Crockett, F. (1992). Revitalizing executive information systems. Sloan
Management Review, 23(4), 39-47.
Davis, F. D. (1989). Perceived usefulness, perceived ease of use, and user
acceptance of information technology. Mis Quarterly, 13(3), 319-340.
Davis, F. D., Bagozzi, R. P., & Warshaw, P. R. (1989). User acceptance of
computer-technology - a comparison of 2 theoretical-models. Management
Science, 35(8), 982-1003.
Davis, F. D., & Venkatesh, V. (1996). A critical assessment of potential
measurement biases in the technology acceptance model: Three

126
experiments. International Journal of Human-Computer Studies, 45(1), 19-
45.
Davis, F. D., & Venkatesh, V. (2004). Toward preprototype user acceptance
testing of new information systems: Implications for software project
management. IEEE Transactions on Engineering Management, 51(1), 31-
46.
Davis, S., & Wiedenbeck, S. (2001). The mediating effects of intrinsic
motivation, ease of use and usefulness perceptions on performance in first-
time and subsequent computer users. Interacting with Computers, 13(5),
549-580.
Drucker, P. F. (1998, 08/24). The next information revolution., 46.
Elbeltagi, I., McBride, N., & Hardaker, G. (2005). Evaluating the factors affecting
DSS usage by senior managers in local authorities in egypt. Journal of
Global Information Management, 13(2), 42-65.
Fitzgerald, G. (1992). Executive information systems and their development in
the U.K.: A research study. International Information Systems, 1(2), 1–35.
Friend, D. (1986). Executive information systems: Successes, failures, insights,
and misconceptions. DSS 86 Transactions, , 35-40.
Gefen, D., Karahanna, E., & Straub, D. W. (2003a). Inexperience and
experience with online stores: The importance of TAM and trust. IEEE
Transactions on Engineering Management, 50(3), 307-321.

127
Gefen, D., Karahanna, E., & Straub, D. W. (2003b). Trust and TAM in online
shopping: An integrated model. Mis Quarterly, 27(1), 51-90.
Gefen, D., & Keil, M. (1998). The impact of developer responsiveness on
perceptions of usefulness and ease of use: An extension of the technology
acceptance model. Data Base for Advances in Information Systems, 29(2),
35-49.
Gefen, D., & Straub, D. W. (1997). Gender differences in the perception and
use of E-mail: An extension to the technology acceptance model. Mis
Quarterly, 21(4), 389-400.
Goodhue, D. L. (2007). Comment on benbasat and barki's "quo vadis TAM"
article Association for Information Systems.
Guimaraes, T., & Saraph, J. V. (1991). The role of prototyping in executive
decision systems. Information & Management, 21(5), 257-267.
Hair, J. F., Black, W. C., Babin, B. J., Anderson, R. E., & Tatham, R. L. (2006).
Multivariate data analysis (6th ed.). Upper Saddle River, New Yersey
07458: Pearson Prentice Hall.
Hasan, H., & Lampitsi, S. (1995). Executive access to information-systems in
australian public organizations. Journal of Strategic Information Systems,
4(3), 213-223.
Hirschheim, R. (2007). Introduction to the special issue on "quo vadis TAM --
issues and reflections on technology acceptance research". Journal of the
Association for Information Systems, 8(4), 204-205.
128
Hong, W. Y., Thong, J. Y. L., Wong, W. M., & Tam, K. Y. (2001). Determinants
of user acceptance of digital libraries: An empirical examination of individual
differences and system characteristics. Journal of Management Information
Systems, 18(3), 97-124.
Houdeshel, G., & Watson, H. J. (1987). The management information and
decision support (mids) system at lockheed-georgia. Mis Quarterly, 11(1),
127-140.
Hung, S. Y. (2003). Expert versus novice use of the executive support systems:
An empirical study. Information & Management, 40(3), 177-189.
Igbaria, M. (1993). User acceptance of microcomputer technology - an
empirical-test. Omega-International Journal of Management Science, 21(1),
73-90.
Igbaria, M., Guimaraes, T., & Davis, G. B. (1995). Testing the determinants of
microcomputer usage via a structural equation model. J.Manage.Inf.Syst.,
11(4), 87-114.
Igbaria, M., & Iivari, J. (1995). Effects of self-efficacy on computer usage.
Omega-International Journal of Management Science, 23(6), 587-605.
Igbaria, M., & Tan, M. (1997). The consequences of information technology
acceptance on subsequent individual performance. Information &
Management, 32(3), 113-121.

129
Igbaria, M., Zinatelli, N., Cragg, P., & Cavaye, A. L. M. (1997). Personal
computing acceptance factors in small firms: A structural equation model.
Mis Quarterly, 21(3), 279-305.
Ikart, E. M. (2005). A theory-based model for the study of executive information
systems adoption by the top-level managers
Jackson, C. M., Chow, S., & Leitch, R. A. (1997). Toward an understanding of
the behavioral intention to use an information system. Decision Sciences,
28(2), 357-389.
Jackson, K. M., & Trochim, W. M. K. (2002). Concept mapping as an alternative
approach for the analysis of open-ended survey responses. Organizational
Research Methods, 5(4), 307-336.
Kaplan, R. S., & Norton, D. P. (1992). The balanced scorecard--measures that
drive performance. Harvard Business Review, 70(1), 71-79.
Karahanna, E., & Straub, D. W. (1999). The psychological origins of perceived
usefulness and ease-of-use. Information & Management, 35(4), 237-250.
Karahanna, E., Straub, D. W., & Chervany, N. L. (1999). Information technology
adoption across time: A cross-sectional comparison of pre-adoption and
post-adoption beliefs. Mis Quarterly, 23(2), 183-213.
Karten, N. (1987). Why executives don't compute. Information Strategy, 4(1),
38.
130
Kogan, J. N. (1986). Information for motivation: A key to executive information
systems that translate strategy into results for management. DSS 86
Transactions, , 6-13.
Krippendorff, K. (2004). In SAGE Publications Inc (Ed.), Content analysis: An
introduction to its methodology (2nd Revised edition ed.)
Lee, Y., Kozar, K. A., & Larsen, K. R. T. (2003). The technology acceptance
model: Past, present, and future. Communications of AIS, 2003(12), 752-
780.
Legris, P., Ingham, J., & Collerette, P. (2003). Why do people use information
technology? A critical review of the technology acceptance model.
Information & Management, 40(3), 191-204.
Lucas Jr., H. C., Burton Swanson, E., & Zmud, R. W. (2007). Implementation,
innovation, and related themes over the years in information systems
research. Journal of the Association for Information Systems, 8(4), 206-
210.
Madlin, N. (1986, 08). Executive information systems. Management Review, ,
21-22.
Marginson, D., King, M., & McAulay, L. (2000). Executives' use of information
technology: Comparison of electronic mail and an accounting information
system. Journal of Information Technology, 15(2), 149-164.

131
Martin, N. J., & Rice, J. L. (2010). Building better government IT: Understanding
community beliefs and attitudes toward smart card technologies. Behaviour
& Information Technology, 29(4), 433-444.
Martinsons, M. G., & Davison, R. M. (2007). Strategic decision making and
support systems: Comparing american, japanese and chinese
management. Decision Support Systems, 43(1), 284-300.
Mawhinney, C. H., & Lederer, A. L. (1990). A study of personal-computer
utilization by managers. Information & Management, 18(5), 243-253.
McBride, N. (1997). The rise and fall of an executive information system: A case
study. Information Systems Journal, 7(4), 277-287.
Miles, M. B., & Huberman, A. H. (1994). Qualitative data analysis: An expanded
sourcebook (2nd ed.). Thousand Oaks, California: SAGE Publications, Inc.
Mohan, L., Holstein, W. K., & Adams, R. B. (1990). Eis - it can work in the
public-sector. Mis Quarterly, 14(4), 435-448.
Morgan, D. L. (1998). Practical strategies for combining qualitative and
quantitative methods: Applications to health research. Qualitative Health
Research, 8(3), 362-76.
Nabitz, U., Van den Brink, W., & Jansen, P. (2005). Using concept mapping to
design an indicator framework for addiction treatment centres. International
Journal for Quality in Health Care, 17(3), 193-201.
132
Nabitz, U., Severens, P., Brink, W. V. D., & Jansen, P. (2001). Improving the
EFQM model: An empirical study on model development and theory
building using concept mapping. Total Quality Management, 12(1), 69.
Nandhakumar, J., & Avison, D. E. (1999). The fiction of methodological
development: A field study of information systems development.
Information Technology & People, 12(2), 176-191.
Pijpers, G. G. M., Bemelmans, T. M. A., Heemstra, F. J., & van Montfort, K. A.
G. M. (2001). Senior executives' use of information technology. Information
and Software Technology, 43(15), 959-971.
Pijpers, G. G. M., & van Montfort, K. (2006). An investigation of factors that
influence senior executives to accept innovations in information technology.
International Journal of Management, 23(1), 11-23.
Poon, P., & Wagner, C. (2001). Critical success factors revisited: Success and
failure cases of information systems for senior executives. Decision Support
Systems, 30(4), 393-418.
Puuronen, S., & Savolainen, V. (1997). Mobile information systems - executives'
view. Information Systems Journal, 7(1), 3-20.
Rainer, R. K., & Watson, H. J. (1995). What does it take for successful
executive information-systems. Decision Support Systems, 14(2), 147-156.
Ramsay, J. O. (1982). Some statistical approaches to multidimensional scaling
data. Journal of the Royal Statistical Society.Series A (General), 145(3), pp.
285-312.

133
Roberts, P., & Henderson, R. (2000). Information technology acceptance in a
sample of government employees: A test of the technology acceptance
model. Interacting with Computers, 12(5), 427-443.
Rockart, J. F. (1979). Chief executives define their own data needs. Harvard
Business Review, 57(2), 81-93.
Rockart, J. F., & Crescenzi, A. D. (1984). Engaging top management in
information technology. Sloan Management Review, 25(4), 3-16.
Rockart, J. F., & DeLong, D. W. (1988). Executive support systems: The
emergence of top management computer use. Illinois: Dow Jones-Irwin.
Rockart, J. F., & Morton, M. S. S. (1984). Implications of changes in information
technology for corporate-strategy. Interfaces, 14(1), 84-95.
Rockart, J. F., & Treacy, M. E. (1982). The ceo goes online. Harvard Business
Review, 60(1), 82-88.
Rosas, S. R. (2005). Concept mapping as a technique for program theory
development: An illustration using family support programs. notes.
American Journal of Evaluation, 26(3), 389-401.
Rosas, S. R., & Camphausen, L. C. (2007). The use of concept mapping for
scale development and validation in evaluation. Evaluation and Program
Planning, 30(2), 125-135.
Salmeron, J. L. (2002). EIS evolution in large spanish businesses. Information &
Management, 40(1), 41-50.

134
Salmeron, J. L., & Herrero, I. (2005). An AHP-based methodology to rank
critical success factors of executive information systems. Computer
Standards & Interfaces, 28(1), 1-12.
Seeley, M., & Targett, D. (1999). Patterns of senior executives' personal use of
computers. Information & Management, 35(6), 315-330.
Seeley, M. E., & Targett, D. (1997). A senior executive end-user framework.
Information Systems Journal, 7(4), 289-308.
Seyal, A. H., & Pijpers, G. G. M. (2004). Senior government executives' use of
the internet: A bruneian scenario. Behaviour & Information Technology,
23(3), 197-210.
Shepard, R. N., & Kruskal, J. B. (1964). Nonmetric methods for scaling and for
factor-analysis. American Psychologist, 19(7), 557-558.
Stenfors, S., Tanner, L., Syrjanen, M., Seppala, T., & Haapalinna, I. (2007).
Executive views concerning decision support tools. European Journal of
Operational Research, 181(2), 929-938.
Stevenson, M. (1994). He sees all, he knows all. Canadian Business, Special
Technology Issue, 67(3), 26-35.
Straub, D., Keil, M., & Brenner, W. (1997). Testing the technology acceptance
model across cultures: A three country study. Information & Management,
33(1), 1-11.

135
Straub, D. W., & Burton-Jones, A. (2007). Veni, vidi, vici: Breaking the TAM
logjam. Journal of the Association for Information Systems, 8(4), 223-229.
Sutherland, S., & Katz, S. (2005). Concept mapping methodology: A catalyst for
organizational learning. Evaluation and Program Planning, 28(3), 257-269.
Szajna, B. (1996). Empirical evaluation of the revised technology acceptance
model. Management Science, 42(1), 85-92.
Tang, V. (1991). The organizational implications of an eis implementation.
Journal of Systems Management, 42(11), 10-12.
Trochim, W. M., Cabrera, D. A., Milstein, B., Gallagher, R. S., & Leischow, S. J.
(2006). Practical challenges of systems thinking and modeling in public
health. American Journal of Public Health, 96(3), 538-546.
Trochim, W. M. K. (1985). Pattern matching, validity, and conceptualization in
program evaluation. Evaluation Review, 9(5), 575-604.
Trochim, W. M. K. (1989a). Concept mapping : Soft science or hard art?
Evaluation and Program Planning, 12(1), 87-110.
Trochim, W. M. K. (1989b). An introduction to concept mapping for planning and
evaluation. Evaluation and Program Planning, 12(1), 1-16.
Trochim, W. M. K., & Linton, R. (1986). Conceptualization for planning and
evaluation. Evaluation and Program Planning, 9(4), 289-308.
Trochim, W. M. K., Milstein, B., Wood, B. J., Jackson, S., & Pressler, V. (2004).
Setting objectives for community and systems change: An application of

136
concept mapping for planning a statewide health improvement initiative.
Health Promotion Practice, 5(1), 8-19.
Trochim, W. W. K. (1993). The reliability of concept mapping. Annual
Conference of the American Evaluation Association, Dallas, Texas.
Trochim, W., & Kane, M. (June 2005). Concept mapping: An introduction to
structured conceptualization in health care. International Journal for Quality
in Health Care, 17(3), 187-191.
Venkatesh, V. (2000). Determinants of perceived ease of use: Integrating
control, intrinsic motivation, and emotion into the technology acceptance
model. Information Systems Research, 11(4), 342-365.
Venkatesh, V., & Davis, F. D. (1996). A model of the antecedents of perceived
ease of use: Development and test. Decision Sciences, 27(3), 451-481.
Venkatesh, V., & Davis, F. D. (2000). A theoretical extension of the technology
acceptance model: Four longitudinal field studies. Management Science,
46(2), 186-204.
Venkatesh, V., Davis, F. D., & Morris, M. G. (2007). Dead or alive? the
development, trajectory and future of technology adoption research. Journal
of the Association for Information Systems, 8(4), 267-286.
Venkatesh, V., Morris, M. G., Davis, G. B., & Davis, F. D. (2003). User
acceptance of information technology: Toward a unified view. Mis
Quarterly, 27(3), 425-478.
137
Vlahos, G. E., & Ferratt, T. W. (1995). Information technology use by managers
in greece to support decision making: Amount, perceived value, and
satisfaction. Information & Management, 29(6), 305-315.
Volonino, L., & Watson, H. J. (1990). The strategic business objectives method
for guiding executive information systems development. Journal of
Management Information Systems, 7(3), 27-39.
Volonino, L., Watson, H. J., & Robinson, S. (1995). Using eis to respond to
dynamic business conditions. Decision Support Systems, 14(2), 105-116.
Wang, P., & Turban, E. (1991). Filtering strategic environmental information
processing using EIS. Proceedings of the Twenty-Fourth Annual Hawaii
International Conference, Kauai, HI, USA. , 3. pp. 126-134.
Watson, H. J. (1990). Avoiding hidden EIS pitfalls. Computerworld, 24(26), 87.
Watson, H. J. (2006). Dashboards and scorecards. Business Intelligence
Journal, 11(2), 4-7.
Watson, H. J., & Frolick, M. N. (1993). Determining information requirements for
an EIS. Mis Quarterly, 17(3), 255-269.
Watson, H. J., Houdeshel, G., & Rainer, R. K. (1997). Building executive
information systems and other decision support applications. New York:
John Wiley.
138
Watson, H. J., Rainer, R. K., & Koh, C. E. (1991). Executive information-
systems - a framework for development and a survey of current practices.
Mis Quarterly, 15(1), 13-30.
Witkin, B. R., & Trochim, W. W. K. (1997). Toward a synthesis of listening
constructs: A concept map analysis. International Journal of Listening,
11(1), 69.
Wöber, K., & Gretzel, U. (2000). Tourism managers’ adoption of marketing
decision support systems. Journal of Travel Research, 39(2), 172-181.
Xu, X. Z. M., & Kaye, G. R. (2002). Knowledge workers for information support:
Executives' perceptions and problems. Information Systems Management,
19(1), 81-88.
Yampolskaya, S., Nesman, T. M., Hernandez, M., & Koch, D. (2004). Using
concept mapping to develop a logic model and articulate a program theory:
A case example. American Journal of Evaluation, 25(2), 191-207.
Yi, Y. D., Wu, Z., & Tung, L. L. (2005). How individual differences influence
technology usage behavior? toward an integrated framework. Journal of
Computer Information Systems, 46(2), 52-63.
Young, D., & Watson, H. J. (1995). Determinates of EIS acceptance.
Information & Management, 29(3), 153-164.
Yousafzai, S. Y., Foxall, G. R., & Pallister, J. G. (2007a). Technology
acceptance: A meta-analysis of the TAM: Part 1. Journal of Modelling in
Management, 2(3), 251-280.
139
Yousafzai, S. Y., Foxall, G. R., & Pallister, J. G. (2007b). Technology
acceptance: A meta-analysis of the TAM: Part 2. Journal of Modelling in
Management, 2(3), 281-304.
Zairi, M., Oakland, J., & Chang, S. (1998). Achieving a successful EIS: Linking
TQM and best practice. Integrated Manufacturing Systems, 9(1), 50-61.
Zmud, R. W. (1986). In McLean E.R., & H. G. Sol (Eds.), Decision support
systems: A decade in perspective (pp. 87-101). North-Holland, Amsterdam:
Elsevier Science Publishers B.V.

140
8. Annexes
141
Annex 1: EIS state of the art conceptual map

ExecutiveInformation Systems
Información
Primera información que se presenta
Información para crear el interés Si la información no es corporativa se puede perder el interés
Indicadores de rendimiento
En contra los ejecutivos no tienen suficiente con esta información ,necesitan también información "soft"
Información relacionada con la consecución de los objetivos estratégicos de la organización
Orígenes de lainformación
Transaccionales
Otras fuentes
de clientes
Nivel de detalle
Al ser utilizados por distintos niveles organizativos se necesita más información operativa
Se va incorporando la información que puede servir a más usuarios
Dependen de
sector
empresa
compartidos por los ejecutivos
individuales del ejecutivo
Información necesaria para los ejecutivos
Contienen información sobrevariables de negocio, a travésdel tiempo y por unidad denegocio, comparables: actual,presupuesto, año anterior.
Algunos incluyen informaciónsin embargo incompleta de lamayoría de competidores, y desegmentos.
Tipos de información
Hard
Soft
Puede influir en el resultadode la organización.Normalmente es entrada porlos propios usuarios.
Facilidad de uso Normalmente proveen de pocas capacidades de análisis, requieren solo unas pocas, y fáciles pulsaciones.
Condición indispensable ser "intuitivos" o "seductores"
Nivel de uso
Uso a otros niveles
resultados del uso
Toma de decisiones
Disminuye la toma dedecisiones en niveles inferiores
Evolución de uso
1. Uso a nivel individual
2. Uso a nivel colectivo 1987
3. Uso a distintos niveles 1989
Diferente en el tiempo, primero mucho, euforia,posteriormente uso intermitente.
Impresión de éxito con fracasoposterior
Efecto "Me-too"
De arriba a abajo ylateralmente a otras unidadesde negocio
Por "goteo" ("trickle down"), según el organigrama, seañade la información que será necesaria.
Enfoque estratégico, se les proporciona a aquellos ejecutivos dondela necesidad y el retorno esperado es mayor.
Usos
Problemas no estructurados
Medir el resultado
Tiempo
Uso inicial por efecto euforia,uso posterior intermitente
A veces da sensación de éxitohasta que pasan 6 meses
Dos métodos principales deuso
Acceso a la situación actual ya tendencias: "read only"
Entornos muy competitivos lainformación de lo que estásucediendo es muy importante
Para análisis personalizados
Los tipos de análisis dependende los ejecutivos
Implementaciones Crecimiento del uso
Desarrollo
Modelos de cómo desarrollar
Critical Success Factors
Balanced Scorecards
Método de los objetivos estratégico de negocio,Strategic Business Objectives (SBO).
Esta pensado para el desarrollo inicial y su posterior evolución.
Aplicado en Fisher-Price
A mediados de los 80 se plantean un cambio estratégico de empresa fabricante auna "empresa de marketing que fabrica" "Satisfacer al cliente"
Problemas clásicos de acceso a información, reprocesada, tarde, etc.
Planificación del desarrollo
Debe recoger la información detallada anivel de procesos para
Colaboración entre Ejecutivos y el equipo del EIS.
Qué dirige el negocio
Qué oportunidades de negocio existen
Y que se puede hacer para mejorar la productividad de los ejecutivos
Qué responsabilidades tienen
Qué información necesita cada unidad de negocio
De donde viene la información
Cómo se usa
Los analistas participan en distintas reuniones de planificación estratégica para
Conocer la estrategia
Como será implementada
Cuál es la información necesaria
Permite conocer también relaciones con los ejecutivos, lo que permite aprender a los analistas: cómo, acerca de quéy de que manera los ejecutivos se comunican con los demás.
Está metodología permite el desarrollo rápido del EIS
Comenzó en 1986 y se completo a primeros de 1989, sigue en evolución
El EIS permite acceder a información para planificación, análisis y monitorización de las actividades asociadas con el negocio.
La base de datos se actualiza cada noche
La información se muestra en "pantallas": conjuntos de pantallas estándar y informes.
El EIS se gestiona mediante menus, y dispone de un HELP que lo hace extremadamente fácil de aprender y usar. Los usuarios pueden obtener instrucciones, definiciones de la información yinformes de ejemplo del HELP.
Módulos: Sales Info Link, Distribution, Historical Planning, Human Resource, Retail
Impacto
Funciona bien ya que se ha desarrollado para que los ejecutivos, managers y personal de ventas dispongan de la información necesaria para mejorar su trabajo.
Soporta información completa y actualizada de distintas fuentes.
Sin el EIS no podrían operar tan eficaz y eficientemente
Han crecido sin incorporar más personal
Toda la información relevante para la estrategia está disponible en el EIS
Alguna información se actualiza en tiempo real, otra diariamente
Toda la información esta organizada de forma común para facilitar su comparación y comunicación en los distintos niveles de la organización.
Aunque el EIS no esta definido a nivel de usuario, los menús fáciles de usar les permiten escoger la información importante para ellos.
Les permite hacer proyecciones para identificar tendencias
El sistema es completamente accesible para los usuarios no técnicos de la compañía
Enfoque a nivel de compañía, el sistema debe soportar los objetivos estratégicos y la necesidad de información de laspersonas de la organización. Enfoque Top Down
Potencia más la información necesaria para la organización que para los individuos.
Los pasos son:
Identificar los objetivos de la organización Debemos mostrar si se están consiguiendo, o no y cómo.
Participar en reuniones deplanificación
Algunas organizaciones no lo permiten, unejecutivo debe comunicar la informaciónnecesaria para desarrollar el EIS
Identificar los procesos críticos para conseguir los objetivos
En algunos casos estos procesos pueden ser transversales adistintas áreas.
No siempre es fácil establecer la relación entre los objetivos ylos procesos. En algunos casos aparecen intereses contrapuestos
Establecer las prioridades de objetivos y por lo tanto de los procesos críticos
Nos permite establecer un plan de desarrollo, aseguraademás que el EIS sirva a la organización en función de laimportancia de las necesidades.
Definir la información clave para soportar los procesos críticos
Al establecer las prioridades determinamos los usuarios y susnecesidades, nivel de agregación, horizonte temporal, alcance, fuentes,actualización.
Para definir la información
Reuniones informales
Análisis de la información que se está utilizando
Asistir a reuniones
Establecer la relación entre la información y los procesos
Algunos procesos comparten información (por ejemplo: Ventas y capacidad productiva). Elnivel de detalle puede no ser el mismo.
Establecer un plan para un desarrollo modular del EIS, implementación y su evolución.
El sistema es desarrollado por módulos
El primer módulo se diseña para soportar losobjetivos estratégicos más importantes.
La información que se provee sirve para planificar, analizar ycontrolar los procesos críticos y aquellos que son claves para laconsecución de los objetivos estratégicos.
Debates informales con los ejecutivos
Analizar la actividad de los ejecutivos
Participación en las reuniones de planificación
Debates con el personal de soporte: staff y secretarias
Examinar la información no proveniente de los sistemas
Participar en las reuniones de las áreas funcionales
Analizar el uso de los EIS
formal CSF sesions
Debates formales con los ejecutivos
seguimiento de la actividad de los ejecutivos
Se necesita una combinación de métodos
Barreras
Definición de los requerimientos de información de los ejecutivos
Problemas con la información
Justificación del coste
Resistencia
Cultura corporativa
Mejores prácticas
Definición cuidadosa de cuál o cuáles son los propósitos que elEIS va ha servir
Esponsorización de un ejecutivo
Definición cuidadosa de los requerimientos
Mejora continua de la calidad de información
esponsor operativoDebatible
solo si el ejecutivo no participa la suficiente
Equipo de trabajoEquilibrio entre los intereses delnegocio y de tecnología
Aumentar la base de usuarios
Desarrollo evolutivo Con un plan de evolución
Selección cuidadosa de Hardware y Software
Desarrollados por personal con skills de negocio y técnicos
Relación clara con los objetivos de negocioCon la misión, objetivos y estrategia
En la evolución del EIS sedeben seguir soportando
Gestión de la resistencia organizativa
Equipo de soporte para los ejecutivos
Prototiping Permite la participación de los ejecutivos
Qué preocupa a los desarrolladores
Conseguir que los ejecutivos especifiquen lo que quieren
Asegurar la calidad de la información
Combinar información de distintas fuentes
Tener suficientes recursos para soportar el EIS
Mostrar los resultados
Asegurar que los ejecutivos dispondrán de tiempo para utilizarlos
Estar atentos de los cambios de necesidades y deseos de los ejecutivos
Evitar que participen rápidamente pero sin interés y que no lo valoren
Gestionar que a los directivos no les gusta la tecnología
Decidir que software y hardware utilizar
Funcionalidades
Acceso on-line
Web
OLAP
Datamining
Capacidades analíticas
Riesgo
Valor aportadoMejor acceso
Intuición
Uso de los ordenadores por parte de los directivos
A favor
Terminales orientadas a los usuarios han disminuido de precio
Los ejecutivos están mejor informados de la disponibilidad y las capacidadesde las nuevas tecnologías
Debido a la volatilidad de las condiciones competitivas los ejecutivos requiereninformación más actualizada y análisis.
En contra
Los propios ejecutivos
La naturaleza del trabajo directivo
Tienen personal que lo puede hacer por ellos
Incluyen tecnologías que son difíciles de utilizar desde unaperspectiva de los ejecutivos
Algunos sistemas contienen información de poco valor para los ejecutivos
Conocimientos técnicos pero no de negocio
ESS
similares
diferentes
Permiten análisis einformación
Contienen herramientasorganizativas
Soportan comunicacioneselectrónicas
Casos
Uso
Merill Lynch, Roger E. Brik Presidente, y Gregory Fiztgerald CFO
Wasau Insurance Companies, chairman of the board, Gerald G. Viste,President y CIO
Thermo Electron, George N. Hatsopoulos, Presidente
Éxito
Lockheed-Georgia MIDS System
Venta de aviones de transporte aéreo
Situación de partida habitual: muchos sistemas, volúmenes ingentes de información,no actualizada, cada problema nuevo preparar toda la información.
Aprobación informal
Desarrollo evolutivo
Equipo mixto de finanzas (información) y sistemas (hard y soft).
Qué información, en que forma y a que nivel de detalle
Entrevistas
Preguntas a las secretarias
Informes existentes
Selección de las fuentes de informaciónMayor nivel de detalle
Compatibles entre las distintasáreas
Seis meses para desarrollar 31 pantallas.
Perspectiva de los usuarios
Dialogo
Lenguaje de comandos con los que el usuario accede al sistema
El lenguaje de presentación
El conocimiento que el usuario tiene que tener para usar el sistema
Acceso mediante un password
Información de los periodos de mantenimiento
Accede a las pantallas que está autorizado.
Puede seleccionar las pantallas que han sido actualizadas
Presionando RETURN/ENTER accede al menú principal, lepermite navegar a las distintas pantallas por menús
Accede a la lista de palabras clave, puede buscar las pantallasrelacionadas, para acceder directamente
o obtiene la lista de todas las personas que tienen acceso al sistema
El acceso a la información es del máximo nivel de agregación (visiónglobal) al de detalle.
Normalmente prefieren ver mucha información en una pantalla, que tenerlaseparada en distintas pantallas.
Posibilidad de detener el cálculo de una pantalla, pulsando una tecla, cuando noes de su interés.
Posibilidad de ver una secuencia predefinida de pantallas por elusuario, se prepara por los responsables técnicos del EIS
Pantallas muestran: número de pantalla, título, fecha última actualización, fuentes de lainformación, teléfono de contacto de la fuente, responsable técnico del mantenimiento de lapantalla, y sustituto. (Esta información de la fuente y el responsable es importante cuandolos ejecutivos tienen preguntas sobre la misma).
colores semáforo: verde,amarillo y rojo
Todos los informes se puedenimprimir en blanco y negro
Gráficos: de línea para tendencias, de barras paracomparaciones, y pastel o barras apiladas para laspartes del total.
En los gráficos: el texto en vertical y las abreviaturas y acronimosestán limitadas a algunos términos de una lista autorizada
Todos los gráficos comienzan por cero para evitar distorsiones, las escalas son"correctas", y las barras que exceden la escala se muestra sus valores.
Las pantallas se basan en standards de los términos usados, colores, formatos de gráficos. Loque elimina las posibles malas interpretaciones y facilita la comunicación en la compañía.Ejemplo: "signup"
Se añaden comentarios para explicar condiciones anormales, explicar las descripciones de los gráficos, referenciar pantallas relacionadas, e informarsobre cambios pendientes.
Las pantallas se crearon teniendo en cuenta los CSF, pero incluyen otras informaciones.
Se forma a los usuarios mediante un tutorial de 15 minutos, se decidió no hacer manuales escritos ya quese quería desarrollar un sistema lo suficientemente fácil que no fuera necesario hacerlo, que losejecutivos no lo tengan que leer, y si tienen dudas que pregunten al personal cualificado.
El sistema les permite trabajar offline
Utilizan mensajería
Componentes del sistema
Hardware
Software
Desarrollado
Crear y actualizar las pantallas
Proveer información acerca del uso y del estado del sistema
Gestionar la seguridad
Personal
Información
Proviene de: transaccionales, aplicaciones financieras y de recursos humanos. Esmuy importante el peso de la información externa.
Se carga mediante software o reprocesándola
Beneficios
Mejor información
Mejoras de comunicación
Desarrollo de la comprensión de los requerimientos
Es imposible desarrollar un EISde partida con toda lainformación necesaria.
Test de desarrollo de sistemas frente a nuevas tecnologías
Reducciones de costes
Éxito
Medidas cualitativas
Posibilidades de uso
Número de pantallas y directivosSolo cómo indicador
Declaraciones de los ejecutivos
Razones del éxito
Compromiso de un esponsor ejecutivo
Definición cuidadosa de los requerimientos del sistema
Definición cuidadosa de los requerimientos de información
Desarrollo en equipo
Desarrollo evolutivo
Selección cuidadosa de Hardware y Software
Planes futuros
Expansión a niveles inferiores
A otras compañías del grupo
Cambios de Hardware
Mejoras en los gráficos
Informes de excepción cuando se difiere de límites
Audio
Inteligencia artificial
Proyectores de gran formato
Phillips Petroleum
Sector Público
Salud
Phillips 66
Xerox Corporation:ESS
Conoco
Reading Rehabilitation Hospital
Fisher-Price
Hardee Food
Northwest Industries, Presidente y CEO
FracasoGenericorp
Fracaso
No cumplir las expectativas de los usuarios
Falta de soporte de los ejecutivos
Objetivos no definidos
Definición pobre de los requerimientos
Soporte inadecuado
Plan de evolución pobre
Poca preparación de los ejecutivos
Tecnologías inadecuadas o inapropiadas
Resistencia de los ejecutivos al uso de las tecnologías
Consecuenciasimplementación
Reducción de nivelesorganizativos
Aprobación del proyectoFormal
InformalNo tiene sentido calcular el retorno de algo desconocido,seguir en función de su utilidad
Razones implementación
Aportan ventaja competitiva
Control entorno
Rapidez en la toma de decisiones
Incremento de eficiencia y control
Acceso rápido a información de calidad
Incremento de la comprensión del negocio
Mayor confianza
Aumento de productividad
soporte a los objetivos
Adaptación a las necesidades de información individuales de los ejecutivos
Soporte a la planificación estratégica
Proveer información para laplanificación estratégica
Mejorar la calidad de la planificación estratégicay el control de los procesos
Proveer información clara de la consecución deobjetivos y de las actividades y de los resultados
Mayor predisposición a cambiar las condiciones demercado
Contribuir a un programa decalidad total
Monitorización
Finanzas
Clientes
Operaciones
Inovación
Aprendizaje
Los costes de inversióniniciales son bajos, menos de100.000$
CriticasMucho esfuerzo y poco valor
Necesidad de establecer modelos que aporten valor a losejecutivos, tradicionalmente no ha sido así
Definición
definición EIS
Sistemas de soporte a los Ejecutivos
Sistemas basados en ordenadores que permiten a los ejecutivos acceder fácilmente ainformación interna y externa que es relevante para sus factores críticos de éxito
Un propósito central: información para la planificación y el control
Características
Son usados directamente por los ejecutivos sin la asistencia de intermediarios
Proveen fácil acceso online a información sobre la situación actual de la organización
Son definidos teniendo en cuenta los CSF
Permiten acceder e integrar un amplio rango de información interna y externa
Están personalizados para los ejecutivos
Extraen, filtran, comprimen y siguen el curso de información crítica
Permiten acceder a la situación actual, tendencias, informes de excepción, y ir al detallede la información desde su agregación.
Son fáciles de usar y no requieren formación
Utilizan gráficos, comunicaciones, almacenamiento de información y sistemas pararecuperarla.
Presentan información gráfica, en tablas y/o en texto
Tipos de EIS
Proveer de acceso más fácil y rápido a la información
Mejorar las comunicaciones mediante mensajería electrónica,buzón de voz, agenda, procesadores de texto u otrossistemas de automatización.
Resolver un problema completo, estos incluyen capacidades desoporte a la toma de decisiones.
Conseguir obtener resultados
143
Annex 2: Paper - “Framework for the analysis of executive information systems based on the perceived usefulness and the perceived ease of use”

©© Intangible Capital, 2009 – 5(4):370-386 – ISSN: 1697-9818
doi: 10.3926/ic.2009.v5n4.p370-386
Framework for the analysis of executive information systems based on… 370
J.L. Cano Giner – V. Fernandez – M. Díaz Boladeras
Framework for the analysis of executive
information systems based on the perceived
usefulness and the perceived ease of use
Josep Lluís Cano Giner ESADE Business School
(Spain)
Vicenc Fernandez Universitat Politècnica de Catalunya
(Spain)
Marta Díaz Boladeras Universitat Politècnica de Catalunya
(Spain)
Received September, 2009
Accepted November, 2009
Abstract:
The acquisition and use of information are key factors in successful executive
performance. Although there are various and different media that executives use to
obtain information, in the last decade the academic research has emphasised
computer-based systems. Inside this group of systems, we can find the Executive
Information Systems (EIS), which are tools that can help executives to obtain
relevant informationmore efficiently.Recently, EIS have been analyzed through the
Technology Acceptance Model (TAM) with significant results. A deeper review of
these results, the existing literature, as well as our own experience, suggest there
are some factors that affect to the use of EIS indirectly or as moderating variables,
instead of directly as recent studies suggest. The objective of our research is to
propose a framework based on the TAM, which shows the different types of factors
that affect to the Perceived Usefulness (U) and Perceived Ease of Use(EOU) of EIS,
as well as how the kind of influence of these factors on U and EOU.
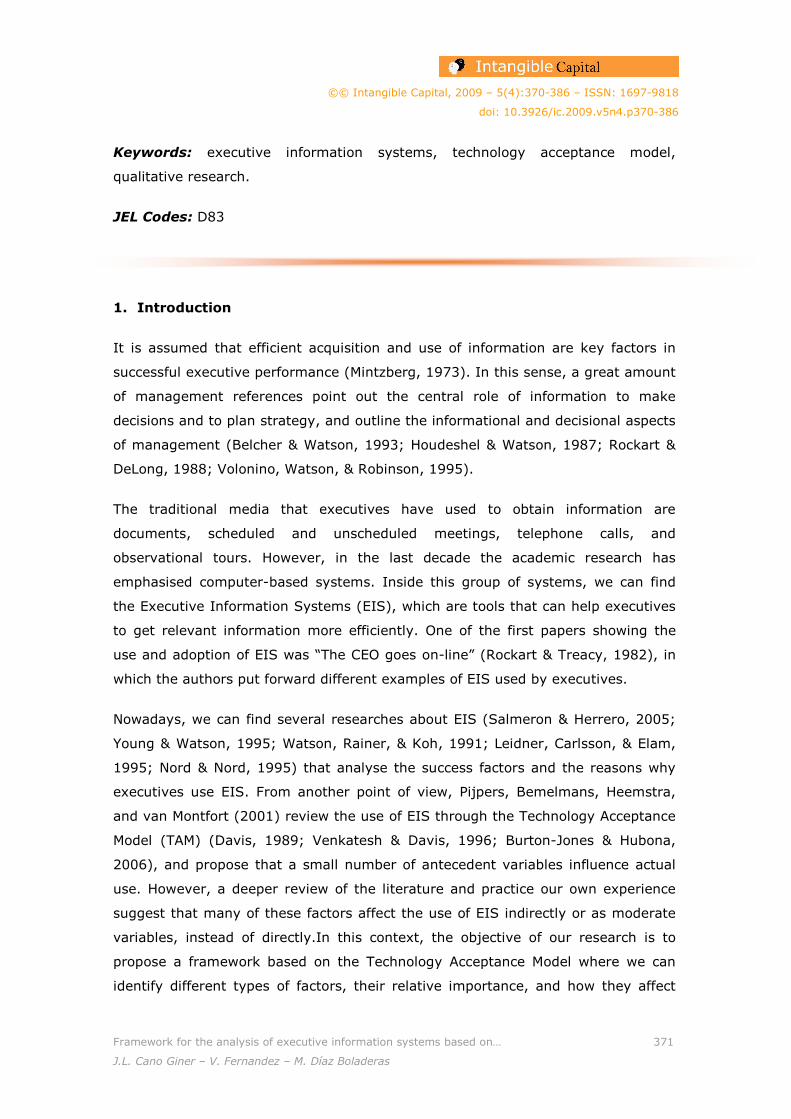
©© Intangible Capital, 2009 – 5(4):370-386 – ISSN: 1697-9818
doi: 10.3926/ic.2009.v5n4.p370-386
Framework for the analysis of executive information systems based on… 371
J.L. Cano Giner – V. Fernandez – M. Díaz Boladeras
Keywords: executive information systems, technology acceptance model,
qualitative research.
JEL Codes: D83
1. Introduction
It is assumed that efficient acquisition and use of information are key factors in
successful executive performance (Mintzberg, 1973). In this sense, a great amount
of management references point out the central role of information to make
decisions and to plan strategy, and outline the informational and decisional aspects
of management (Belcher & Watson, 1993; Houdeshel & Watson, 1987; Rockart &
DeLong, 1988; Volonino, Watson, & Robinson, 1995).
The traditional media that executives have used to obtain information are
documents, scheduled and unscheduled meetings, telephone calls, and
observational tours. However, in the last decade the academic research has
emphasised computer-based systems. Inside this group of systems, we can find
the Executive Information Systems (EIS), which are tools that can help executives
to get relevant information more efficiently. One of the first papers showing the
use and adoption of EIS was “The CEO goes on-line” (Rockart & Treacy, 1982), in
which the authors put forward different examples of EIS used by executives.
Nowadays, we can find several researches about EIS (Salmeron & Herrero, 2005;
Young & Watson, 1995; Watson, Rainer, & Koh, 1991; Leidner, Carlsson, & Elam,
1995; Nord & Nord, 1995) that analyse the success factors and the reasons why
executives use EIS. From another point of view, Pijpers, Bemelmans, Heemstra,
and van Montfort (2001) review the use of EIS through the Technology Acceptance
Model (TAM) (Davis, 1989; Venkatesh & Davis, 1996; Burton-Jones & Hubona,
2006), and propose that a small number of antecedent variables influence actual
use. However, a deeper review of the literature and practice our own experience
suggest that many of these factors affect the use of EIS indirectly or as moderate
variables, instead of directly.In this context, the objective of our research is to
propose a framework based on the Technology Acceptance Model where we can
identify different types of factors, their relative importance, and how they affect

©© Intangible Capital, 2009 – 5(4):370-386 – ISSN: 1697-9818
doi: 10.3926/ic.2009.v5n4.p370-386
Framework for the analysis of executive information systems based on… 372
J.L. Cano Giner – V. Fernandez – M. Díaz Boladeras
the core variables: Perceived Usefulness and Perceived Ease of Use of Executive
Information Systems.
We have carried out an exploratory study based on interviews with Spanish
executives from international firms and a review of the literature about Information
System and more specifically the EIS in organization. The results can contribute to
define new EIS tools and to manage EIS projects more efficiently. It could be one
way of increasing EIS use among executives, thus improving their work and
reducing the number of EIS project failures.
2. Review of the literature
Obtaining relevant information is a crucial and necessary process for decision-
making in organizations (Mintzberg, 1973), but this information should be correctly
modelled to maximize the performance of the organizational decisions (Kaplan &
Norton, 1992; Little, 1970; Little, 2004; Rockart, 1979). Besides, it is necessary to
develop practicable and usable systems (Brady, 1967) that can help executives in
decisions making. In this line, the Information Technologies can help executives
mainly in improving delivery of their products and services and potentially increase
their effectiveness and productivity in business administration (Rockart &
Crescenzi, 1984).
A key question addressed by researchers and practitioners is how computers can
change management decision-making. Brady (1967) suggested that computers had
not much impact on top-level decision-making. Brady also noticed different reasons
why managers were not making maximum use of the computer: lack of
appreciation (or even education), a defensive attitude, a lag in the development of
currently practicable systems which are geared primarily to assist top managers in
making decisions, hesitancy on the part of some top managers to formally identify
the criteria which they wish used in decision making, a tendency for top managers
to wait for other firms to incur the expense and risk of pioneering and testing new
areas of computer applications.
Henry Mintzberg (1973) proposed that the acquisition and use of information are
key factors in successful executive performance, stressing the informational and
decisional aspects of management. From that research until now, it has appeared a
great amount of management references, which show the central role of

©© Intangible Capital, 2009 – 5(4):370-386 – ISSN: 1697-9818
doi: 10.3926/ic.2009.v5n4.p370-386
Framework for the analysis of executive information systems based on… 373
J.L. Cano Giner – V. Fernandez – M. Díaz Boladeras
information to make decisions and to plan strategy (Belcher & Watson, 1993;
Houdeshel & Watson, 1987; Rockart & DeLong, 1988; Volonino et al., 1995). Later,
Rockart (1979) worked in a method of providing information to top management,
which was called ‘Critical Success Factors’ (CSF). ‘CSF thus are, for any business
the limited number of areas in which results, if they are satisfactory, will ensure
successful competitive performance for the organization’. Recently, researchers
have developed new models to help executives to manage resources as Balanced
Scorecard (Kaplan & Norton, 1992).
Executive Information Systems (EIS)
Executive Information Systems (EIS) are flexible tools that provide broad and deep
information support and analytic capability for a wide range of executive decision-
making (Houdeshel & Watson, 1987; Rockart & DeLong, 1988). EIS content
internal and external data (Watson et al., 1991; Young & Watson, 1995), which
comes from different sources of information with different origins: transactional
systems, financial reporting systems, commercial information sources, text files
and manual recollection (Vandenbosch & Huff, 1997). EIS’s may also include
environmental scanning data, access to external databases (Young & Watson,
1995) and soft information (Watson, OHara, Harp, & Kelly, 1996). EIS support the
work of senior management by providing rapid access to critical information
(Arnott, Jirachiefpattana, & O'Donnell, 2007) and executives must utilize this
software technology for strategic decision-making and managing daily business
activities in order to remain competitive (Nord & Nord, 1995).
The main characteristics of EIS summarized by Young and Watson (1995) are: (a)
direct, hands-on usage by top executives, that implies that executives are direct
users of EIS; (b) a repository for compressing, filtering, organizing, and delivering
data; (c) "drilling down" to examine supporting detail, EIS should permit going
throw more aggregated to more detailed data; (d) reporting exception conditions
to highlight variances, as alerts; (e) combining text, graphics, and tabular data on
one screen, to facilitate interpretation by executives; (f) offering internal and
external data; (g) monitoring key performance indicators, or other variables; (h)
providing current status access to performance data, in right time; (i) tailoring the
EIS to each user's decision-making style in order to adapt to his o her necessities;
(j) focusing on the information needs of each executive, there are differences
©© Intangible Capital, 2009 – 5(4):370-386 – ISSN: 1697-9818
doi: 10.3926/ic.2009.v5n4.p370-386
Framework for the analysis of executive information systems based on… 374
J.L. Cano Giner – V. Fernandez – M. Díaz Boladeras
between executives information necessities; (k) tracking critical success factors; (l)
incorporating both hard data (e.g., sales figures) and soft data (e.g., opinions).
EIS access data from datamarts and/or datawarehouses. On one hand, these data
stores make it easer to access clean, consistent, integrated data (Singh, Watson, &
Watson, 2002). On the other hand, the introduction of data warehousing
technology and Online Analytical Processing (OLAP) techniques has improved
traditional EIS (Chen, 1995). Most EIS use also a Web browser for the user
interface, which provides easy access to data and even –some of them – data
mining capabilities (Singh et al., 2002). There is also a change in EIS users, EIS
used to be reserved to executives but nowadays the use of EIS is moving down the
organizational structure (Nord & Nord, 1995; Stein, 1995; Volonino et al., 1995)
In general, the terms Executive Information Systems (EIS) and Executive Support
Systems (ESS) have been used interchangeably by the literature. However, an ESS
is usually considered to be a system with more capabilities than an EIS (Rockart &
DeLong, 1988; Watson et al., 1991). While EIS implies a system providing
summary information for executives, ESS is a comprehensive support system that
goes beyond providing information to include communications, data analysis, office
automatization, organizing tools and intelligence.
There are many examples about the use of EIS by organizations reported in the
literature in different contexts and for different specific purposes: Lockheed-
Georgia MIDS System (Houdeshel & Watson, 1987); several examples (Rockart &
DeLong, 1988); Public sector (Mohan, Holstein, & Adams, 1990); Conoco (Belcher
& Watson, 1993); some pitfalls (Bussen & Myers, 1997; Watson, 1990); Nestle
(Oggier, Fragniere, & Stuby, 2005), EIS uses in human resources (Schenk &
Holzbach, 1993), in strategic management process (Singhet al., 2002; Walters,
Jiang, & Klein, 2003). Other lines of research are related with the information that
EIS content (Volonino et al., 1995), how to select the information for an EIS
(Volonino & Watson, 1990), about the users (Stein 1995; Walstrom & Wilson
1997a, 1997b), the use in concrete markets or in emerging economies (Arnottet
al., 2007; Salmeron, 2002a), technologies related with EIS (Cheung & Babin,
2006a, 2006b; Chi & Turban, 1995; Frolick & Ramarapu, 1993; Gopal & Tung,
1999).
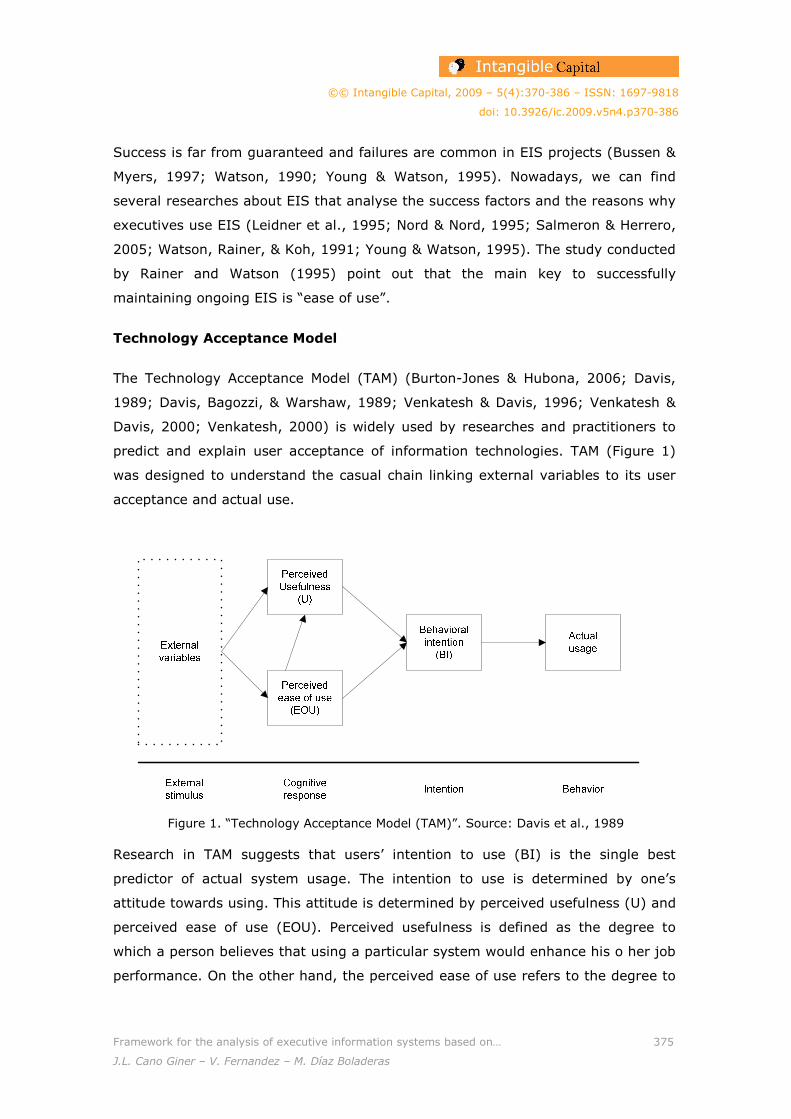
©© Intangible Capital, 2009 – 5(4):370-386 – ISSN: 1697-9818
doi: 10.3926/ic.2009.v5n4.p370-386
Framework for the analysis of executive information systems based on… 375
J.L. Cano Giner – V. Fernandez – M. Díaz Boladeras
Success is far from guaranteed and failures are common in EIS projects (Bussen &
Myers, 1997; Watson, 1990; Young & Watson, 1995). Nowadays, we can find
several researches about EIS that analyse the success factors and the reasons why
executives use EIS (Leidner et al., 1995; Nord & Nord, 1995; Salmeron & Herrero,
2005; Watson, Rainer, & Koh, 1991; Young & Watson, 1995). The study conducted
by Rainer and Watson (1995) point out that the main key to successfully
maintaining ongoing EIS is “ease of use”.
Technology Acceptance Model
The Technology Acceptance Model (TAM) (Burton-Jones & Hubona, 2006; Davis,
1989; Davis, Bagozzi, & Warshaw, 1989; Venkatesh & Davis, 1996; Venkatesh &
Davis, 2000; Venkatesh, 2000) is widely used by researches and practitioners to
predict and explain user acceptance of information technologies. TAM (Figure 1)
was designed to understand the casual chain linking external variables to its user
acceptance and actual use.
Figure 1. “Technology Acceptance Model (TAM)”. Source: Davis et al., 1989
Research in TAM suggests that users’ intention to use (BI) is the single best
predictor of actual system usage. The intention to use is determined by one’s
attitude towards using. This attitude is determined by perceived usefulness (U) and
perceived ease of use (EOU). Perceived usefulness is defined as the degree to
which a person believes that using a particular system would enhance his o her job
performance. On the other hand, the perceived ease of use refers to the degree to

©© Intangible Capital, 2009 – 5(4):370-386 – ISSN: 1697-9818
doi: 10.3926/ic.2009.v5n4.p370-386
Framework for the analysis of executive information systems based on… 376
J.L. Cano Giner – V. Fernandez – M. Díaz Boladeras
which a person believes that using a particular system would be free of effort
(Davis et al., 1989). They concluded their research with three main insights:
• People’s computer use can be predicted reasonably well from their
intentions.
• Perceived usefulness is a major determinant of people’s intentions to use
computers.
• Perceived ease of use is a significant secondary determinant of people’s
intentions to use computers.
Davis (1989) developed new scales to assess perceived usefulness and perceived
ease of use. These scales exhibited high convergent, discriminant, and factorial
validity. After this work, Venkatesh and Davis (2000) and Venkatesh (2000)
extended the model to a new version called TAM2. Finally, they develop two
longitudinal field experiments that showed that pre-prototype usefulness measures
could closely approximate hands-on based usefulness measures, and are
significantly predictive of usage intentions and behaviour up to six months after
workplace implementation.
Main external variables or factors– these terms are used interchangeably in TAM
(Davis, 1989) – are related both to individuals, design and contextual variables
are: objective design characteristics, training, computer self-efficacy, user
involvement in design, and the nature of the implementation process (Davis &
Venkatesh, 1996), system’s technical design characteristics, user involvement in
system development, the type of system development process used, cognitive
style, training, documentation, user support consultants, system features, user
characteristics, ultimate behaviour (Davis et al., 1989). Further analysis based on
reviewed the articles published which notes that there is no clear pattern with
respect to the choice of the external variables considered (Legris, Ingham, &
Collerette, 2003). The authors also remarked the 39 factors affecting information
system satisfaction (Bailey & Pearson, 1983) and proposed a factor’s classification
(Cheney, Mann, & Amoroso 1986).
Later, there has been an attempt to unify the user acceptance of information
technology factors (Venkatesh, Morris, Davis, & Davis, 2003), but they do not take

©© Intangible Capital, 2009 – 5(4):370-386 – ISSN: 1697-9818
doi: 10.3926/ic.2009.v5n4.p370-386
Framework for the analysis of executive information systems based on… 377
J.L. Cano Giner – V. Fernandez – M. Díaz Boladeras
into account the characteristics of the software solution nor the characteristics of
the implementation project can affect the perceived usefulness (U) or the
perceived ease of use (EOU). Pijpers et al. (2001) selected the external variables
from Venkatesh and Davis works (1996, 2000) and categorized them in four
groups: individual characteristics, organizational characteristics, task-related
characteristics and characteristics of the information technology resource.
The goal of this paper is to establish a framework that can help us to understand
why some EIS systems are adopted and used successfully in companies’
administration and others are not. From the previous review of the literature, we
have been able to identify many factors that can explain this process. However, the
results of some researches and our own experience in the EIS development
suggest that there are more factors than the current identified ones. Besides, we
made out that many of these factors affect to the final result indirectly or as
moderate variables, instead of directly as stated in the majority of papers.
3. Method
This research aims to study the adoption process that involves many and diverse
actors and stakeholders, complex collaborative processes, technologies, and
contexts. Moreover and although there are many researches about the Information
Systems and more specifically the EIS in organizations, this area is very young in
comparison to other areas into the social sciences. Due to these facts, we have
proposed an exploratory inductive research to get a framework that can help to
design and develop successful –acceptable, usable and useful – EIS tools.
We have carried out an empirical study that consists in depth interviews to nine
Spanish executives from multinational firms. In this context, we have preferred the
qualitative approach that provides comprehension of the complex social processes
that we investigate. We prepared the interviews scripts according to the review of
the literature about the success and failure of EIS and some of our perceptions
about the use of them. The interviews were personal and private, following a semi-
structured script, where the interviewees were asked about their experience in the
use of EIS.
The interviews had two parts. The first section was made up of various relevant
questions according to the review of the literature. For instance, we asked to the

©© Intangible Capital, 2009 – 5(4):370-386 – ISSN: 1697-9818
doi: 10.3926/ic.2009.v5n4.p370-386
Framework for the analysis of executive information systems based on… 378
J.L. Cano Giner – V. Fernandez – M. Díaz Boladeras
interviews about individual characteristics (demographics, professional experience,
personality of the manager, individual culture, etc.), group characteristics (group
size, group maturity, commitment, etc.), organizational characteristics
(organizational structure, organizational culture, competitor behaviour, etc.), task-
related characteristics (difficulty and variability), project characteristics
(management, time, etc.) and characteristics of the Information Technology
(accessibility, interface, formation, etc.).
In the second section, we proposed to the interviewees to explain how an EIS
should be really a useful tool for successfully project management. In both
sections, interviewees were allowed to freely explain any idea or perception about
the topics, without time constrain.
4. Analysis and results
The interviews were recorded digitally and transcribed. The information of the
interviews were reduced and processed following the strategies proposed by Miles
& Huberman (1994). The reduction of data was centred on referring all the
fragments to two main factors: perceived easy of use and perceived usefulness of
EIS. This step permitted us to reduce various pages of interviews into a smaller
number of analytic units. Then, we created a checklist matrix to coherently
organize several components of every interview. The matrix had the different
interviews in the rows and the topics (individual characteristics, group
characteristics, organizational characteristics, task-related characteristics,
characteristics of Information Technolgies, etc.) in the columns. Finally, we get the
factors or antecedent variables into two groups: factors that can affect to the
perceived easy of use of EIS and factors that can affect to the perceived usefulness
of EIS.
We identified nine factors in the first group (the perceived easy of use of EIS): (a)
Easy to know what is the information that the EIS content; (b) Easy to know the
model which support the information; (c) EIS content information that you are
interested in; (d) Easy navigation from aggregated information to detailed
information; (e) Help should be simple, short and clear, but they prefer initial
training; (f) The same “functionalities” than Windows or Web; (g) Easy to learn;
(h) Easy to remember; and (i) Easy to interpret the information: graphic, tables,

©© Intangible Capital, 2009 – 5(4):370-386 – ISSN: 1697-9818
doi: 10.3926/ic.2009.v5n4.p370-386
Framework for the analysis of executive information systems based on… 379
J.L. Cano Giner – V. Fernandez – M. Díaz Boladeras
etc. On the other hand, we detected six factors in the second group (the perceived
usefulness of EIS): (a) The first screen must content the most important
information of the most important key areas; (b) If there is a problem that you can
realize about it and going throwing the details; (c) “Something”, likes a map that
helps you when you are getting lost; (d) Know how the calculation is done (Have
the possibility to check the formulas); (e) Multidimensionality; and (f) Spend little
time to find the information that you need.
These results coincide with Human Computer Interaction (HCI) studies in
Management Information Systems (MIS) that are concerned with the ways people
interact with information, technologies, and tasks, especially in business,
managerial, organizational, and cultural contexts (Zhang & Li, 2004). These
authors consider that the interaction experience is relevant and important only
when people use technologies to support their primary tasks within certain
contexts, being organizational, social or societal, so there is an interaction between
systems and users. So we suggest the next proposition:
• Proposition 1: The characteristics of the system are related to the perceived
ease of use and the perceived usefulness of EIS.
The executives’ implication in the EIS’s project is another group of characteristics
that is considered in the literature (Bajwa, Rai, & Brennan, 1998; Belcher &
Watson, 1993; Houdeshel & Watson, 1987; Leidner, Carlsson, & Elam, 1995;
Leidner & Elam, 1995; Mohan et al., 1990; Nord & Nord, 1995; Poon & Wagner,
2001; Rockart & DeLong, 1988; Rockart, 1979; Rockart & Treacy, 1982; Rockart &
Crescenzi, 1984; Salmeron, 2002b; Schenk & Holzbach, 1993; Volonino & Watson,
1990; Walstrom & Wilson, 1997b; Watson et al., 1991; Watson & Frolick, 1993)
and that is reflected in the results of our study. In this sense we suggest the
following proposition:
• Proposition 2: The implication of executives in the EIS project
implementation is related to the perceived ease of use and the perceived
usefulness of EIS.
Finally, we have detected that the degree of influence of the previous
characteristics – systemdesign and executives’ implication– onthe perceived ease
of use and the perceived usefulness of EIS is moderated by other kind of

©© Intangible Capital, 2009 – 5(4):370-386 – ISSN: 1697-9818
doi: 10.3926/ic.2009.v5n4.p370-386
Framework for the analysis of executive information systems based on… 380
J.L. Cano Giner – V. Fernandez – M. Díaz Boladeras
characteristics: for instance, the individual and organizational characteristics. For
example, traditionally the age has been considered as a direct factor on the
perceived easy of use and the perceived usefulness of EIS. However, our results
suggest that the age could be a moderating variable of the characteristics of the
system and the implication of the executives in the project.
• Proposition 3: Individual and organizational factors have a moderating
effect between the characteristics of the system and project, and the
perceived ease of use and the perceived usefulness of EIS.
5. Conclusions
In our opinion, Technology Acceptance Model is a useful tool to validate our
preliminary results. However, we consider that it is necessary to adapt the model
introducing the influence of EIS design and of the project characteristics. Besides,
we suggest that there could be a set of factors that moderates the system and
project characteristics. According to this model, we have proposed three
propositions that have been translated graphically in the Figure 2. As this one, the
external characteristics can modulate the effects of the system design and project
characteristics.
Figure 2. “Adapted Technology Acceptance Model”. Source: authors

©© Intangible Capital, 2009 – 5(4):370-386 – ISSN: 1697-9818
doi: 10.3926/ic.2009.v5n4.p370-386
Framework for the analysis of executive information systems based on… 381
J.L. Cano Giner – V. Fernandez – M. Díaz Boladeras
Based on preliminary results of gathered data, the interaction between the
executive and the EIS, as well as the interaction between the executive and the
EIS’s implementation project can affect perceived usefulness and perceived easy of
use. Other external variables as age, gender, or professional experience can also
modulate the effects of system or project characteristics. These relationships
appeared in our interviews, so we should work in deep to identify and assess the
antecedent variables and also test TAM for EIS. We propose to keep working in this
line, developing a new research where to interview more executives and to use
other information sources to explore what the antecedent variables are.
Respondents should be asked directly which factors are or the EIS system or the
EIS project that affect usefulness or ease of use rather than to respond to a
predefined list and after they have responded they should fill a questionnaire with
questions relatives to other external variables to establish the possible
relationships.
These results could contribute to define new EIS tools and to manage EIS projects
more efficiently. It could be one way of increasing EIS use among executives, thus
improving their work and reducing the number of EIS project failures. In our
research we find that we can’t miss the relationship between the executive and the
EIS system because it seems there is here the main cause of the success o the
failure, so we should adapt the EIS at the executives’ demands.
References
ARNOTT, D.; JIRACHIEFPATTANA, W.; O'DONNELL, P. (2007). Executive
information systems development in an emerging economy. Decision Support
Systems, 42(4): 2078-2084.
BAILEY, J.E.; PEARSON, S.W. (1983). Development of a tool for measuring and
analyzing computer user satisfaction. Management Science, 29(5): 530-545.
BAJWA, D.S.; RAI, A.; BRENNAN, I. (1998). Key antecedents of executive
information system success: A path analytic approach. Decision Support Systems,
22(1): 31-43.
BELCHER, L.W.; WATSON, H.J. (1993). Assessing the value of conocos eis. MIS
Quarterly, 17(3): 239-253.
©© Intangible Capital, 2009 – 5(4):370-386 – ISSN: 1697-9818
doi: 10.3926/ic.2009.v5n4.p370-386
Framework for the analysis of executive information systems based on… 382
J.L. Cano Giner – V. Fernandez – M. Díaz Boladeras
BRADY, R.H. (1967). Computers in top-level decision making. Harvard business
review,45(4): 67-76.
BURTON-JONES, A.; HUBONA, G.S. (2006). The mediation of external variables in
the technology acceptance model. Information & Management, 43(6): 706-717.
BUSSEN, W.; MYERS, M.D. (1997). Executive information system failure: A new
Zealand case study. Journal of Information Technology, 12(2): 145-153.
CHEN, M. (1995). A model-driven approach to accessing managerial information:
The development of a repository-based executive information system. Journal of
Management Information Systems, 11(4): 33-63.
CHENEY, P.H.; MANN, R.I.; AMOROSO, D.L. (1986). Organizational factors affecting
the success of end-user computing. Journal of Management Information
Systems,3(1): 65-80.
CHEUNG, W.; BABIN, G. (2006a). A metadatabase-enabled executive information
system (part A): A flexible and adaptable architecture. Decision Support Systems,
42(3): 1589-1598.
CHEUNG, W.; BABIN, G. (2006b). A metadatabase-enabled executive information
system (part B): Methods for dynamic multidimensional data analysis. Decision
Support Systems, 42(3): 1599-1612.
CHI, R.T.; TURBAN, E. (1995). Distributed intelligent executive information-
systems. Decision Support Systems, 14(2): 117-130.
DAVIS, F.D. (1989). Perceived usefulness, perceived ease of use, and user
acceptance of information technology. MIS Quarterly, 13(3): 319-340.
DAVIS, F.D.; BAGOZZI, R.P.; WARSHAW, P.R. (1989). User acceptance of
computer-technology - a comparison of 2 theoretical-models. Management
Science, 35(8): 982-1003.
DAVIS, F.D.; VENKATESH, V. (1996). A critical assessment of potential
measurement biases in the technology acceptance model: Three experiments.
International Journal of Human-Computer Studies, 45(1): 19-45.

©© Intangible Capital, 2009 – 5(4):370-386 – ISSN: 1697-9818
doi: 10.3926/ic.2009.v5n4.p370-386
Framework for the analysis of executive information systems based on… 383
J.L. Cano Giner – V. Fernandez – M. Díaz Boladeras
FROLICK, M.; RAMARAPU, N.K. (1993). Hypermedia - the future of eis. Journal of
Systems Management, 44(7): 32-36.
GOPAL, R.D.; TUNG, Y.A. (1999). An examination of the role of internet
technologies in developing next generational executive information systems.
Journal of Computer Information Systems, 39(3): 81-91.
HOUDESHEL, G.; WATSON, H.J. (1987). The management information and decision
support (mids) system at lockheed-Georgia. MIS Quarterly, 11(1): 127-140.
KAPLAN, R.S.; NORTON, D.P. (1992). The balanced scorecard--measures that drive
performance. Harvard business review, 70(1): 71-79.
LEGRIS, P.; INGHAM, J.; COLLERETTE, P. (2003). Why do people use information
technology? A critical review of the technology acceptance model. Information &
Management, 40(3): 191-204.
LEIDNER, D.E.; CARLSSON, S.; ELAM, J.J. (Eds.). (1995). A cross-cultural study of
executive information systems. Wailea, HI, USA: System Sciences.
LEIDNER, D.E.; ELAM, J.J. (1995). The impact of executive information systems on
organizational design, intelligence, and decision making. Organization Science,
6(6): 645-664.
LITTLE, J.D.C. (1970). Models and managers - concept of a decision calculus.
Management Science Series B-Application, 16(8): B466-B485.
LITTLE, J.D.C. (2004). Comments on "models and managers: The concept of a
decision calculus". Management Science, 50(12 Supplement): 1854-1860.
MILES, M.B.; HUBERMAN, A.H. (1994). Qualitative data analysis: An expanded
sourcebook (2nd ed.). Thousand Oaks, California: SAGE Publications, Inc.
MINTZBERG, H. (1973). The nature of managerial work. New York: Harper and
Row.
MOHAN, L.; HOLSTEIN, W.K.; ADAMS, R.B. (1990). EIS - It can work in the public-
sector. MIS Quarterly, 14(4): 435-448.

©© Intangible Capital, 2009 – 5(4):370-386 – ISSN: 1697-9818
doi: 10.3926/ic.2009.v5n4.p370-386
Framework for the analysis of executive information systems based on… 384
J.L. Cano Giner – V. Fernandez – M. Díaz Boladeras
NORD, J.H.; NORD, G.D. (1995). Why managers use executive support systems -
selecting and using information technology for strategic advantage. Industrial
Management & Data Systems, 95(9): 24-&.
OGGIER, C.; FRAGNIERE, E.; STUBY, J. (2005). Nestle improves its financial
reporting with management science. Interfaces, 35(4): 271-280.
PIJPERS, G.G.M.; BEMELMANS, T.M.A.; HEEMSTRA, F.J.; VAN MONTFORT, K.A.G.M.
(2001). Senior executives' use of information technology. Information and
Software Technology,43(15): 959-971.
POON, P.; WAGNER, C. (2001). Critical success factors revisited: Success and
failure cases of information systems for senior executives. Decision Support
Systems,30(4): 393-418.
ROCKART, J.F.; DELONG, D.W. (1988). Executive support systems: The emergence
of top management computer use. Illinois: Dow Jones-Irwin.
ROCKART, J.F. (1979). Chief executives define their own data needs. Harvard
business review, 57(2): 81-93.
ROCKART, J.F.; CRESCENZI, A.D. (1984). Engaging top management in information
technology. Sloan management review, 25(4): 3-16.
ROCKART, J.F.; TREACY, M.E. (1982). The CEO goes online. Harvard business
review, 60(1): 82-88.
SALMERON, J.L. (2002a). EIS evolution in large Spanish businesses. Information &
Management, 40(1): 41-50.
SALMERON, J.L. (2002b). EIS profitability, costs and benefits: An evolutionary
approach. Industrial Management & Data Systems, 102(5-6): 284-288.
SALMERON, J.L.; HERRERO, I. (2005). An AHP-based methodology to rank critical
success factors of executive information systems. Computer Standards &
Interfaces,28(1): 1-12.
SCHENK, K.D.; HOLZBACH, R.L. (1993). Getting the job done with HuRBIE: A
human resources EIS. Interfaces, 23(3): 41-50.
©© Intangible Capital, 2009 – 5(4):370-386 – ISSN: 1697-9818
doi: 10.3926/ic.2009.v5n4.p370-386
Framework for the analysis of executive information systems based on… 385
J.L. Cano Giner – V. Fernandez – M. Díaz Boladeras
SINGH, S.K.; WATSON, H.J.; WATSON, R.T. (2002). EIS support for the strategic
management process. Decision Support Systems, 33(1): 71-85.
STEIN, A. (1995). Reengineering the executive - the 4th generation of eis.
Information & Management, 29(1): 55-62.
VANDENBOSCH, B.; HUFF, S.L. (1997). Searching and scanning: How executives
obtain information from executive information systems. MIS Quarterly, 21(1): 81-
107.
VENKATESH, V. (2000). Determinants of perceived ease of use: Integrating control,
intrinsic motivation, and emotion into the technology acceptance model.
Information Systems Research, 11(4): 342-365.
VENKATESH, V.; DAVIS, F.D. (1996). A model of the antecedents of perceived ease
of use: Development and test. Decision Sciences, 27(3): 451-481.
VENKATESH, V.; DAVIS, F.D. (2000). A theoretical extension of the technology
acceptance model: Four longitudinal field studies. Management Science, 46(2):
186-204.
VENKATESH, V.; MORRIS, M.G.; DAVIS, G.B.; DAVIS, F.D. (2003). User acceptance
of information technology: Toward a unified view. MIS Quarterly, 27(3): 425-478.
VOLONINO, L.; WATSON, H.J.; ROBINSON, S. (1995). Using eis to respond to
dynamic business conditions. Decision Support Systems, 14(2): 105-116.
VOLONINO, L.; WATSON, H.J. (1990). The strategic business objectives method for
guiding executive information systems development. Journal of Management
Information Systems, 7(3): 27-39.
WALSTROM, K.A.; WILSON, R.L. (1997a). An examination of executive information
system (EIS) users. Information & Management, 32(2): 75-83.
WALSTROM, K.A.; WILSON, R.L. (1997b). Gaining user acceptance of an EIS.
Information Systems Management, 14(1): 54-59.
WALTERS, B.A.; JIANG, J.J.; KLEIN, G. (2003). Strategic information and strategic
decision making: The EIS. Information & Management, 40(6): 487-495.
Framework for the analysis of executi
J.L. Cano Giner – V. Fernandez –
WATSON, H.J.; FROLICK, M.N. (1993). Determining information requirements for
an eis. MIS Quarterly, 17(3): 255
WATSON, H.J.; OHARA, M.T.; HARP, C.G.; KELLY, G.G. (1996). Including soft
information in EISs. Information Systems Management
WATSON, H.J.; RAINER, R.K.; KOH, C.E. (1991). Executive information
framework for development and a survey of current practices.
15(1): 13-30.
WATSON, H. (1990). Avoiding hidden EIS pitfalls. , 24(26): 87.
YOUNG, D.; WATSON, H.J. (1995). Determinates of eis acceptance.
Management, 29(3): 153
ZHANG, P.; LI, N. (2004). An assessment of human
in management information systems: Topics and methods.
Behavior, 20(2): 125-147.
©© Intangible Capital
El artículo está con Reconocimientocomunicarlo públicamente siempre que cite
licencia completa se puede consultar en
©© Intangible Capital, 2009 – 5(4):370-386
doi: 10.3926/ic.2009.v5n4.p
Framework for the analysis of executive information systems based on…
– M. Díaz Boladeras
WATSON, H.J.; FROLICK, M.N. (1993). Determining information requirements for
, 17(3): 255-269.
WATSON, H.J.; OHARA, M.T.; HARP, C.G.; KELLY, G.G. (1996). Including soft
Information Systems Management, 13(3): 66-
WATSON, H.J.; RAINER, R.K.; KOH, C.E. (1991). Executive information
framework for development and a survey of current practices.
WATSON, H. (1990). Avoiding hidden EIS pitfalls. , 24(26): 87.
.; WATSON, H.J. (1995). Determinates of eis acceptance.
, 29(3): 153-164.
ZHANG, P.; LI, N. (2004). An assessment of human-computer interaction research
in management information systems: Topics and methods. Computers in Human
147.
©© Intangible Capital, 2009 (www.intangiblecapital.org)
Reconocimiento-NoComercial 2.5 de Creative Commons. Puede copiarlo, distribuirlo y comunicarlo públicamente siempre que cite a su autor y a Intangible Capital. No lo utilice para fines comerciales. La
licencia completa se puede consultar en http://creativecommons.org/licenses/by-nc/2.5/es/
– ISSN: 1697-9818
doi: 10.3926/ic.2009.v5n4.p370-386
386
WATSON, H.J.; FROLICK, M.N. (1993). Determining information requirements for
WATSON, H.J.; OHARA, M.T.; HARP, C.G.; KELLY, G.G. (1996). Including soft
-77.
WATSON, H.J.; RAINER, R.K.; KOH, C.E. (1991). Executive information-systems - a
framework for development and a survey of current practices. MIS Quarterly,
.; WATSON, H.J. (1995). Determinates of eis acceptance. Information &
computer interaction research
Computers in Human
Puede copiarlo, distribuirlo y o lo utilice para fines comerciales. La
nc/2.5/es/

161
Annex 3: Paper - “Use of computers and applications by senior executives”
doi:10.3926/jiem.2011.v4n2.p326-338 JIEM, 2011 – 4(2): 326-338 – Online ISSN: 2013-0953
Print ISSN: 2013-8423
Use of computers and applications by senior executives 326
J. L. Cano Giner
Use of computers and applications by senior executives
Josep Lluís Cano Giner
ESADE Business School (SPAIN)
[email protected] Received March 2011 Accepted June 2011
Abstract:
Purpose: Analyze the relationship between the senior executive and ICT use.
Design/methodology/approach: Empirical research through which we propose
a framework to establish the main factors that might lead to an increase in ICT use
by senior executives.
Findings: The main contribution of the present study is the creation of the list of
factors that affect the use of computers and applications by senior executives and a
smaller group of categories.
Research limitations/implications: A limitation of this research is that it should
be confirmed by means of quantitative research that would allow us to test the
validity of the proposed framework, and also to ascertain the relative importance of
each factor.
Practical implications: Thus reducing the number of factors and forming a
smaller group of categories that can facilitate research.
Originality/value: The list of factors that affect the use of computers and
applications by senior executives and the smaller group of categories.
Keywords: senior executive, users, information and communication technologies,
executive information system

doi:10.3926/jiem.2011.v4n2.p326-338 JIEM, 2011 – 4(2): 326-338 – Online ISSN: 2013-0953
Print ISSN: 2013-8423
Use of computers and applications by senior executives 327
J. L. Cano Giner
1 Introduction
The information and communication technologies (ICTs) have increased the
productivity of various groups within organisations, but one of the groups that has
adopted ICTs least is that of senior executives. The aim of the present paper is to
analyse the factors that affect the use of ICTs by senior executives, gathering them
together within a reference framework that will enable us to take them into
account when implementing systems intended for this group. If senior executives
adopted ICTs more widely, they would increase their productivity.
The beginnings of the relationship between ICTs, executives and decision making
can be traced back to the times of the first computers. Over the years several
arguments have been put forward to explain the lack of computer use among
executives, including: their poor keyboard skills, their lack of training and
experience in computer use, and even concern about their status, as they felt that
using a computer was not part of their job, along with a set of other reasons
related to the alternative between the flexibility or simplicity of systems, that is, if
systems were inflexible or over-simple they added no value. But there are other
cases in which executives overcome these reasons, for example that of Lockheed-
Georgia (Houdeshel & Watson, 1987). In the mid 1950s, it was the opinion of most
scientists that computers would have a notable impact on scientific calculation
(e.g., in astronomy and the military sphere). A few (including Russell Ackoff, John
Diebold and J.W. Forrester) agreed that computers would, in the immediate future,
revolutionise the work of executives in policies, strategy and decision making
(Drucker, 1998). The possibility that computers and applications would affect the
way executives work was already anticipated. Although computers existed before
this date, 1965 marked an unprecedented change when IBM presented their
System/360 family. At that moment, scientists began to ask themselves how
computers might help humans to improve decision making. Collaborations between
scientists at the Carnegie Institution, together with Marvin Minsky of the
Massachusetts Institute of Technology and John McCarthy of Stanford University,
developed the first cognitive computer models, which were the embryo of artificial
intelligence (Buchanan & O’Connell, 2006).

doi:10.3926/jiem.2011.v4n2.p326-338 JIEM, 2011 – 4(2): 326-338 – Online ISSN: 2013-0953
Print ISSN: 2013-8423
Use of computers and applications by senior executives 328
J. L. Cano Giner
The paper starts with a description of the methodology and a literature review to
establish a definition of the senior executive. We then go on to examine the various
research projects that have been carried out on the use of applications or
computers by senior executives, and conclude with a proposal of what we consider
to be the key factors in the development of applications intended for senior
executives.
As we will see presently, the key factors are related to the senior executives
themselves, the system or application, and the project.
2 Methodology
The paper starts with a review of the existing literature, in two parts: one related
to how we define a senior executive, and the other to analyse the relationship
between the senior executive and ICT use. In the first part a definition is adopted,
on the basis of a single previous literature review, as it is not the purpose of this
paper to examine senior executives as such but rather their relationship with ICTs.
In this second part we analyse, in chronological order, the contributions of various
authors, separating out the reasons against the use of computers and applications
by executives; the reasons in favour of the use of computers and applications by
executives; and the factors to increase the use of computers and their applications.
After analysing the literature, we group the factors according to whether they are
related to the senior executives, the system or application, the project, or other
reasons; and we propose a framework of factors that should be taken into account
to increase ICT use by senior executives.
3 Senior executives
In the present paper we will adopt the definition of the senior executive proposed
by Seeley and Targett (1997): “an executive who is concerned with the strategic
direction of their organization’s business”. Furthermore, the senior executive: “is in
a position to influence significantly the strategic decision-making processes for
their function and/or the organization; has substancial control and authority over
how resources are deployed; is in a position to influence the strategic direction of
the Business of their function/organization; may have other senior managers
reporting to him or her”.
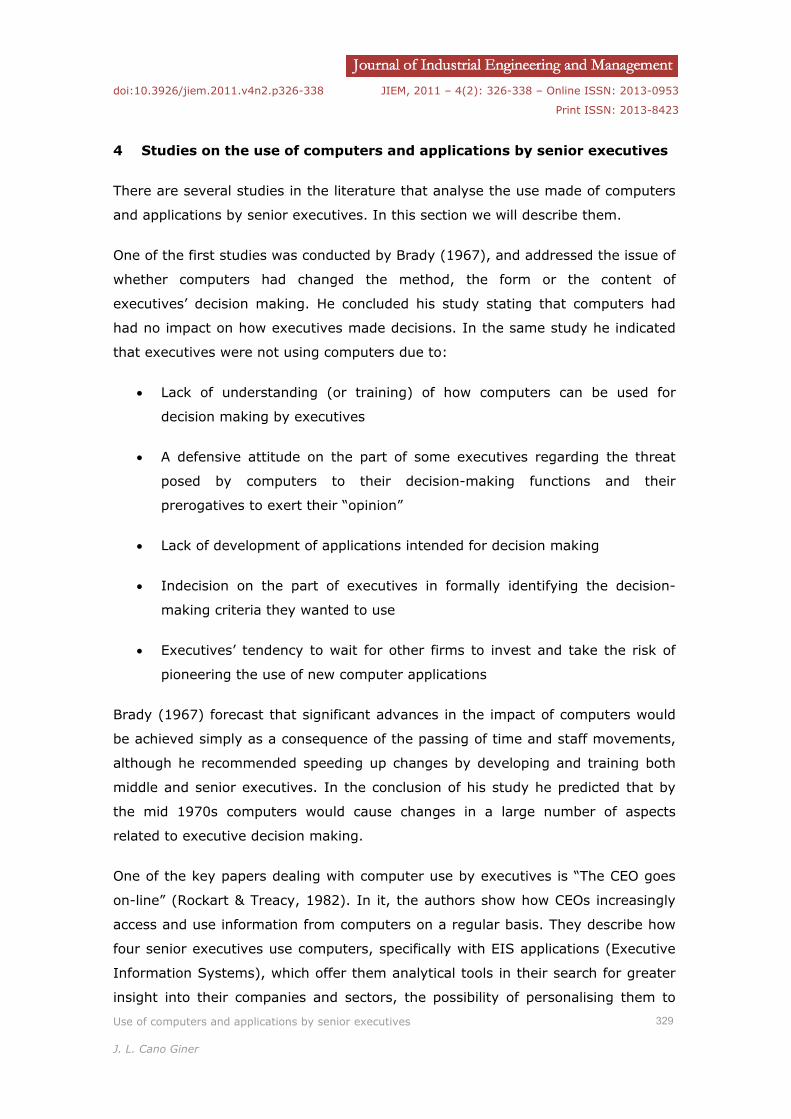
doi:10.3926/jiem.2011.v4n2.p326-338 JIEM, 2011 – 4(2): 326-338 – Online ISSN: 2013-0953
Print ISSN: 2013-8423
Use of computers and applications by senior executives 329
J. L. Cano Giner
4 Studies on the use of computers and applications by senior executives
There are several studies in the literature that analyse the use made of computers
and applications by senior executives. In this section we will describe them.
One of the first studies was conducted by Brady (1967), and addressed the issue of
whether computers had changed the method, the form or the content of
executives’ decision making. He concluded his study stating that computers had
had no impact on how executives made decisions. In the same study he indicated
that executives were not using computers due to:
x Lack of understanding (or training) of how computers can be used for
decision making by executives
x A defensive attitude on the part of some executives regarding the threat
posed by computers to their decision-making functions and their
prerogatives to exert their “opinion”
x Lack of development of applications intended for decision making
x Indecision on the part of executives in formally identifying the decision-
making criteria they wanted to use
x Executives’ tendency to wait for other firms to invest and take the risk of
pioneering the use of new computer applications
Brady (1967) forecast that significant advances in the impact of computers would
be achieved simply as a consequence of the passing of time and staff movements,
although he recommended speeding up changes by developing and training both
middle and senior executives. In the conclusion of his study he predicted that by
the mid 1970s computers would cause changes in a large number of aspects
related to executive decision making.
One of the key papers dealing with computer use by executives is “The CEO goes
on-line” (Rockart & Treacy, 1982). In it, the authors show how CEOs increasingly
access and use information from computers on a regular basis. They describe how
four senior executives use computers, specifically with EIS applications (Executive
Information Systems), which offer them analytical tools in their search for greater
insight into their companies and sectors, the possibility of personalising them to
doi:10.3926/jiem.2011.v4n2.p326-338 JIEM, 2011 – 4(2): 326-338 – Online ISSN: 2013-0953
Print ISSN: 2013-8423
Use of computers and applications by senior executives 330
J. L. Cano Giner
meet each executive’s information needs, and the possibility of implementing them
by starting with small projects that can grow gradually. EISs are intended to help
executives to use information more effectively. The authors conclude their paper
with the following statement:
“Not all senior managers, of course, will find and EIS
system to their taste, but enough user-friendly technology
now exists to accommodate the needs of those who wish to
master a more data-intensive approach to their jobs”.
PC use by executives was subsequently analysed by Mawhinney and Lederer
(1990), employing a model formed by four groups of variables: manager’s
attributes in the organisation (level, span of control, type of work, control of the
system, contribution to job performance), personal attributes (age, sex, level of
training, typing skills, competence in using the system), system attributes (ease of
learning, ease of use, accessibility, response time, suitability), and process
attributes (participation in the acquisition, satisfaction with the system, training in
its use, technical support). The authors analyse how these variables affected PC
use by the executives, discovering that none of the groups of variables seemed to
dominate the model and that the two items with the strongest correlation with
reported use time were (1) the system’s contribution to job performance and (2)
the managers’ level of competence with the system.
Managers are reluctant to spend extra time learning other applications when they
can do what they want on a spreadsheet, even if this is not the most efficient way
of doing it, according to Seeley and Targett (1997). The authors report on several
studies analysing senior executives as computer users. In the conclusions of their
paper they state that senior executives use computers more extensively than
before, that they use a larger number of applications more competently than they
used to, and that the number of applications they use can be related to age
(younger executives use a wider range of applications).
In his article “The next information revolution” (1998), Drucker investigates the
meaning and the purpose of information. The author states that senior executives
did not use new technologies because these technologies did not provide them with
the information they needed for their work; likewise, he argues that the accounting
systems at their disposal do not help them in decision making. Another aspect he

doi:10.3926/jiem.2011.v4n2.p326-338 JIEM, 2011 – 4(2): 326-338 – Online ISSN: 2013-0953
Print ISSN: 2013-8423
Use of computers and applications by senior executives 331
J. L. Cano Giner
highlights is that senior executives have a degenerative tendency, especially in the
big corporations: to focus inwards (on costs and results) rather than outwards (on
opportunities, changes and threats). Consequently he predicted a trend over the
following 10 to 15 years towards collecting outside information. One of the factors
that can cause a change in the trend is the stronger training in technologies that he
forecasts senior executives will have in the future. Another issue that is addressed
is whether system employees and chiefs are prepared to attend to senior
executives about ICTs in the medium they require.
In their study on senior executives’ personal use of computers, Seeley and Targett
(1999) conclude that it is related to the dynamic and complex iteration between
both internal factors, such as executives’ perception of their role as managers,
modus operandi and personality, and certain external factors, such as system
infrastructures, the nature of the task and organisational culture.
Poon and Wagner (2001) revise the Critical Success Factors model (Rockart &
DeLong, 1988) to apply it to information systems for executives, confirming the
applicability of Rockart and DeLong’s eight original factors plus two additional ones.
Nevertheless, they consider that, out of all the success factors, we will achieve
success if we manage just three of them: support at both executive and
operational levels; resources; and linking the system to the business objectives.
According to Pijpers, Bemelmans, Heemstra and van Montfort (2001), the
perception of fun/enjoyment that senior executives may have when using an
information system is an external variable that influences beliefs about, attitude to
and use of systems.
Xu and Kaye (2002) analyse the support needs of executives, concluding that they
need support from information specialists rather than technology specialists, the
function of the former being to scan external information in the outside world, turn
it into meaningful information and make it easily accessible to managers so that
they can use it. Consequently, when EISs are designed and implemented, we must
train the executives not only to use the system but also about what information
they will find, systematically updated, analysed and formatted by information
specialists before the executives use the system. These specialists must therefore
be familiar with the culture of the executives; they must exploit and obtain the

doi:10.3926/jiem.2011.v4n2.p326-338 JIEM, 2011 – 4(2): 326-338 – Online ISSN: 2013-0953
Print ISSN: 2013-8423
Use of computers and applications by senior executives 332
J. L. Cano Giner
vision of the executives and the knowledge to judge and interpret the information
and make explicit that which must be shared among information specialists.
We must take into account the differences between expert and novice executive
computer users, as shown by Hung (2003). Executives’ skills affect system use;
expert users require less time to reach a solution and view more screens when
performing analytical tasks, whereas novices view more screens when performing
more intuitive ones, and executives feel more useful when they use more powerful
systems. Furthermore, expert users consider intuitive systems to be more useful
than analytical ones, whereas the difference is not significant for novices.
Senior executives are not benefiting from the use of technologies (Seyal & Pijpers,
2004). Lack of commitment to the use of ICTs and their applications can be
regarded as a threat to competitiveness. According to the authors there are several
reasons accounting for impediments to ICT use: (1) senior executives have little
time to play around with new technologies, (2) senior executives are reluctant to
use the technology due to PC anxiety, and (3) senior executives lack skill and
proficiency in ICT use, and moreover lack support staff to answer their queries.
Some senior executives argue that they see no connection what ICTs do and their
task as senior executives. The reaction to ICTs is even worse if they took no IT-
related course during their college years.
Internationalisation has created the need to assess whether senior executives
make strategic decisions differently depending on their origin. Martinsons and
Davison (2007) analyse the differences among American, Japanese and Chinese
executives, between whom they establish different decision styles; hence
information technologies must be adapted to the different styles of their users.
5 Analysis and results
On the basis of the above literature review, we present the various studies in Table
1, separating: reasons against the use of computers and applications; reasons in
favour of the use of computers and applications; and key factors to increase the
use of computers and applications by senior executives. For each factor we indicate
in parentheses whether they are related to: Senior Executives (SE), the System
(S), the Project (P), or Other factors (O). This classification will then enable us to
sort and aggregate them. For most factors their relationship with SE, S, P, and O is

doi:10.3926/jiem.2011.v4n2.p326-338 JIEM, 2011 – 4(2): 326-338 – Online ISSN: 2013-0953
Print ISSN: 2013-8423
Use of computers and applications by senior executives 333
J. L. Cano Giner
clear, and when they can be related to more than one factor the most relevant is
chosen. It is not necessary to state the justification for each factor, but by way of
example, one of the reasons against computer use for Brady (1967) is “Lack of
understanding of computer use”, as can be seen in Table 1, and this has been
related to Senior Executives, as it clearly depends on them. In turn, “Link system
to business objectives”, for example, as proposed by Poon and Wagner (2001), has
been related to the Project, as it depends on the definition of each particular
project, and so on for the rest of the factors.
Author Reasons against use Reasons in favour of use Factors to increase use
Brady (1967) Lack of understanding of computer use. (SE) A defensive attitude. (SE) Lack of development of applications. (S) Indecision on the part of executives in formally identifying the decision-making criteria they wanted to use. (SE) Executives’ tendency to wait for other firms to invest and take the risk of being pioneers. (SE)
Stronger training in computer use. (SE) Passing of time. (O) Management changes due to staff movements. (O)
Rockart and Treacy (1982)
Availability of applications designed for executives’ tasks. (S) Personalisation of applications. (S) Incremental projects. (P)
Mawhinney and Lederer (1990)
Contribution to job performance. (SE) Level of competence with the system. (SE)
Seeley and Targett (1997)
Reluctance to spend extra time learning applications other than spreadsheets. (SE) Older executives use a narrower range of applications. (SE)
Drucker (1998) System did not provide them with the necessary information. (P)
Need for systems to collect more external information. (P) Stronger ICT training for executives. (SE) System chiefs capable of attending to executives’ demands. (P)
Seeley and Targett (1999)
Executives’ perception of their role as managers. (SE) Modus operandi. (SE) Personality. (SE) System infrastructures. (P) Nature of the task. (SE) Organisational culture. (O)

doi:10.3926/jiem.2011.v4n2.p326-338 JIEM, 2011 – 4(2): 326-338 – Online ISSN: 2013-0953
Print ISSN: 2013-8423
Use of computers and applications by senior executives 334
J. L. Cano Giner
Poon and Wagner (2001)
Support at both executive and operational levels. (P) Available resources. (P) Linking the system to the business objectives. (P)
Pijpers, Bemelmans, Heemstra and van Montfort (2001)
Perception of fun or enjoyment in ICT use. (SE)
Xu and Kaye (2002)
Support from information specialists. (P)
Hung (2003) Need to adapt systems to executives’ experience. (S)
Seyal and Pijpers (2004)
Little time to play around with new technologies. (SE) Reluctance to use the technology due to PC anxiety. (SE) Lack of skill and dexterity in ICT use. (SE) Lack of support staff to answer their queries. (P) No connection seen between what ICTs do and their task as executives. (SE)
Martinsons and Davison (2007)
Adapt to the different styles of their users. (S)
Table 1. “Summary of reasons against, reasons in favour of, and factors to increase the use
of computers and applications by senior executives”.
The 37 reasons cited by various authors and studies and presented in Table 1 were
each allocated to one of the following categories: Senior Executives, System,
Project, or Others. Subsequently, with the object of reducing the number of
factors, whenever possible they were grouped together taking into account those
that are alike and had been cited in more than one of the studies involved. In the
event of the factors being insufficiently alike they were maintained in different
groups. Table 2 shows all the groups and each factor allocated within the new
classification, which includes all the contributions of the various studies. For
example, the factors grouped together owing to their relationship with the Project
as “availability of resources” are: lack of support staff to answer their queries,
support from information specialists, system chiefs capable of attending to
executives’ demands, available resources, and system infrastructures; each of
these factors is clearly related to the availability of resources (both economic and
personal) in a project. However, the factors grouped together under “resource
availability” are not related to other project groups, i.e., they are not related to:
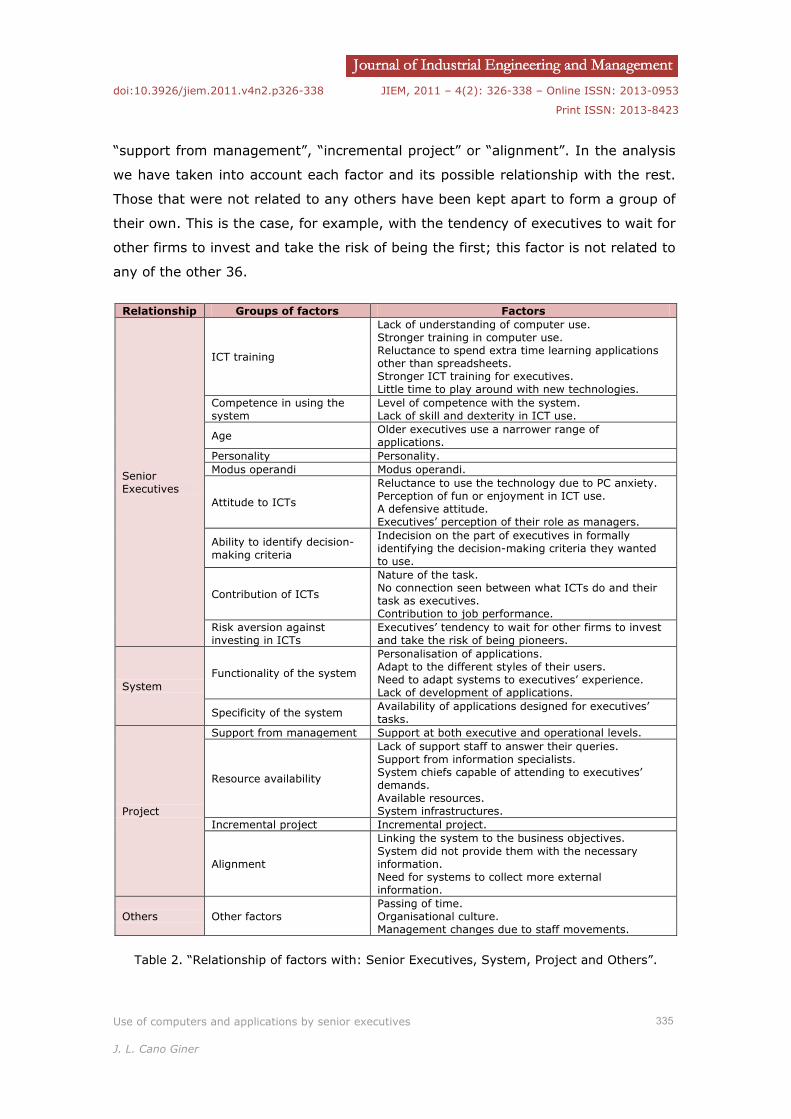
doi:10.3926/jiem.2011.v4n2.p326-338 JIEM, 2011 – 4(2): 326-338 – Online ISSN: 2013-0953
Print ISSN: 2013-8423
Use of computers and applications by senior executives 335
J. L. Cano Giner
“support from management”, “incremental project” or “alignment”. In the analysis
we have taken into account each factor and its possible relationship with the rest.
Those that were not related to any others have been kept apart to form a group of
their own. This is the case, for example, with the tendency of executives to wait for
other firms to invest and take the risk of being the first; this factor is not related to
any of the other 36.
Relationship Groups of factors Factors
Senior Executives
ICT training
Lack of understanding of computer use. Stronger training in computer use. Reluctance to spend extra time learning applications other than spreadsheets. Stronger ICT training for executives. Little time to play around with new technologies.
Competence in using the system
Level of competence with the system. Lack of skill and dexterity in ICT use.
Age Older executives use a narrower range of applications.
Personality Personality. Modus operandi Modus operandi.
Attitude to ICTs
Reluctance to use the technology due to PC anxiety. Perception of fun or enjoyment in ICT use. A defensive attitude. Executives’ perception of their role as managers.
Ability to identify decision-making criteria
Indecision on the part of executives in formally identifying the decision-making criteria they wanted to use.
Contribution of ICTs
Nature of the task. No connection seen between what ICTs do and their task as executives. Contribution to job performance.
Risk aversion against investing in ICTs
Executives’ tendency to wait for other firms to invest and take the risk of being pioneers.
System Functionality of the system
Personalisation of applications. Adapt to the different styles of their users. Need to adapt systems to executives’ experience. Lack of development of applications.
Specificity of the system Availability of applications designed for executives’ tasks.
Project
Support from management Support at both executive and operational levels.
Resource availability
Lack of support staff to answer their queries. Support from information specialists. System chiefs capable of attending to executives’ demands. Available resources. System infrastructures.
Incremental project Incremental project.
Alignment
Linking the system to the business objectives. System did not provide them with the necessary information. Need for systems to collect more external information.
Others Other factors Passing of time. Organisational culture. Management changes due to staff movements.
Table 2. “Relationship of factors with: Senior Executives, System, Project and Others”.
doi:10.3926/jiem.2011.v4n2.p326-338 JIEM, 2011 – 4(2): 326-338 – Online ISSN: 2013-0953
Print ISSN: 2013-8423
Use of computers and applications by senior executives 336
J. L. Cano Giner
Those factors that are not directly related to Senior Executives, the System or the
Project have been grouped together in the category Others, and they have not
been merged owing to their diversity. This is one of the limitations of the study.
6 Conclusions, implications and limitations
In this paper we report the results of empirical research through which we propose
a framework to establish the main factors that might lead to an increase in ICT use
by senior executives. We group these factors together into three categories: those
related to the senior executive, to the system, and to the project. In the literature
review, it is shown that none of the existing studies take the totality of the factors
into account simultaneously. Thus the main contribution of the present study is the
creation of the list of factors that affect the use of computers and applications by
senior executives.
The creation of this list of factors has a practical research implication, namely to
provide researchers with a common list of factors that they can use in their work
(Cano Giner, Fernandez, Diaz Boladera, 2009). On the basis of the literature
review, we represent the information in Table 1, making the various factors easier
to understand and indicating the relationship each of them has with the Senior
Executives, the System, the Project and Others. We then group the factors
together within each of these categories, thus reducing the number of factors and
forming a smaller group of categories that can facilitate research, as shown in
Table 2. As the intermediate steps are displayed, researchers can check for
themselves the appropriateness of the groupings.
A limitation of this research is that it should be confirmed by means of quantitative
research that would allow us to test the validity of the proposed framework, and
also to ascertain the relative importance of each factor.
References
Brady, R. H. (1967). Computers in top-level decision making. Harvard Business
Review, 45(4): 67-76.
Buchanan, L., & O’Connell, A. (2006). A brief history of decision making. Harvard
Business Review, 84(1): 32-41.

doi:10.3926/jiem.2011.v4n2.p326-338 JIEM, 2011 – 4(2): 326-338 – Online ISSN: 2013-0953
Print ISSN: 2013-8423
Use of computers and applications by senior executives 337
J. L. Cano Giner
Cano Giner, J., Fernandez, V., & Díaz Boladeras, M. (2009). Framework for the
analysis of executive information systems based on the perceived usefulness and
the perceived ease of use. Intangible Capital, 5(4): 370-386
doi: 10.3926/ic.2009.v5n4.p370-386
Drucker, P.F. (1998). The next information revolution. Forbes ASAP, August 24, 47-
58.
Houdeshel, G., & Watson, H. J. (1987). The Management Information and Decision
Support (MIDS) system at Lockheed-Georgia. MIS Quarterly, 11(1): 127-140.
doi:10.2307/248834
Hung, S. Y. (2003). Expert versus novice use of the executive support systems: An
empirical study. Information & Management, 40(3): 177-189.
doi:10.1016/S0378-7206(02)00003-4
Martinsons, M. G., & Davison, R. M. (2007). Strategic decision making and support
systems: Comparing American, Japanese and Chinese management. Decision
Support Systems, 43(1): 284-300.
doi:10.1016/j.dss.2006.10.005
Mawhinney, C. H., & Lederer, A. L. (1990). A study of personal-computer utilization
by managers. Information & Management, 18(5): 243-253.
doi:10.1016/0378-7206(90)90026-E
Pijpers, G. G. M., Bemelmans, T. M. A., Heemstra, F. J., & van Montfort, K. A. G. M.
(2001). Senior executives’ use of information technology. Information and
Software Technology, 43(15): 959-971.
doi:10.1016/S0950-5849(01)00197-5
Poon, P., & Wagner, C. (2001). Critical success factors revisited: Success and
failure cases of information systems for senior executives. Decision Support
Systems, 30(4): 393-418.
doi:10.1016/S0167-9236(00)00069-5
Rockart, J.F., & DeLong, D.W. (1988). Executive Support Systems: The Emergence
of Top Management Computer Use. Illinois: Dow Jones-Irwin.

doi:10.3926/jiem.2011.v4n2.p326-338 JIEM, 2011 – 4(2): 326-338 – Online ISSN: 2013-0953
Print ISSN: 2013-8423
Use of computers and applications by senior executives 338
J. L. Cano Giner
Rockart, J. F., & Treacy, M. E. (1982). The CEO goes on-line. Harvard Business
Review, 60(1): 82-88.
Seeley, M., & Targett, D. (1999). Patterns of senior executives’ personal use of
computers. Information & Management, 35(6): 315-330.
doi:10.1016/S0378-7206(99)00002-6
Seeley, M. E., & Targett, D. (1997). A senior executive end-user framework.
Information Systems Journal, 7(4): 289-308.
doi:10.1046/j.1365-2575.1997.00019.x
Seyal, A. H., & Pijpers, G. G. M. (2004). Senior government executives’ use of the
internet: A Bruneian scenario. Behaviour & Information Technology, 23(3): 197-
210.
Xu, X. Z. M., & Kaye, G. R. (2002). Knowledge workers for information support:
Executives’ perceptions and problems. Information Systems Management, 19(1):
81-88.
Journal of Industrial Engineering and Management, 2011 (www.jiem.org)
Article's contents are provided on a Attribution-Non Commercial 3.0 Creative commons license. Readers are allowed to copy, distribute and communicate article's contents, provided the author's and Journal of Industrial
Engineering and Management's names are included. It must not be used for commercial purposes. To see the complete license contents, please visit http://creativecommons.org/licenses/by-nc/3.0/.

175
Annex 4: Survey

176
Dear executive, I would like to invite you to take part in a survey designed to improve our understanding of executives and their use of Executive Information Systems. I am a Lecturer in the Department of Information Systems Management at ESADE Business School (Universitat Ramon Llull), and this study is a part of the research I’m carrying out for my doctoral thesis. As Britannica Academic Edition says “an information system is an integrated set of components for collecting, storing, processing, and communicating information” so in our study an Executive Information System is one kind of information system designed on executive needs and used by executives. The aim of this survey is to understand and categorize the factors that executives feel can affect their use of Executive Information Systems and make it easier to manage these factors in both new projects as well as in organizations that already have these types of solutions in place. This survey consists of three parts:
1. In this first section, you will have to answer a series of questions regarding the position you currently hold and your use of Executive Information Systems.
2. In the next section, you have to organize 94 cards into different groups as you see fit. However, the following restrictions apply: each card can only be included in one group; you cannot classify all the cards into a single group; and the individual cards cannot be individual groups. (The numbers appearing on the cards are only for their later processing.)
3. In the last part, you will have to evaluate 94 statements to indicate to what degree you would have used the Executive Information System depending on the different conditions.
This entire survey should take no more than 40 minutes of your time. Your answers are anonymous and confidential. Do not include your name on your survey. In addition, the results are always presented in the aggregate, never individually. Your participation is also completely voluntary. Returning the survey implies that you consent to participate in this study. The results of the latter shall be presented at ESADE Business School (Universitat Ramon Llull) and published in professional journals. Please feel free to contact me if you have any questions or doubts: (34) 629 128 126 or [email protected]. Thank you in advance for your time and consideration. Josep Lluís Cano Giner Lecturer, ESADE Department of Information Systems Management

177
Part 1 Instructions: Please answer the questions by checking the correct response, for example:
Yes No I don’t know
or by introducing your answer in the space provided
……My answer…..
EXECUTIVE INFORMATION SYSTEM USED
A11 Do you use a computer-based executive information system on your own?
Yes No I don’t know
A2 Does this executive information system provide data in graphs, tables and text format?
Yes No I don’t know
A3 Does this executive information system provide you internal and external information and data?
Yes No I don’t know
A4 Does this executive information system provide you information in real time?
Yes No I don’t know
A5 Is this executive information system’s design based on your needs? Yes No I don’t know
A6 Did you need a few training sessions on how to use this executive information system?
Yes No I don’t know
A7 Does this executive information system allow you to drill down from the aggregate information level to detailed information?
Yes No I don’t know
If the last answer is ‘No’ or ‘I don’t know’, go to question A8 below. If the answer is ‘Yes’, please go to question A11:
A11 Do you use the functionality enabling you to go from the aggregate information level to detailed information?
Yes No I don’t know
A88 Does this executive information system provide analytical functionalities?
Yes No I don’t know
If the last answer is ‘No’ or ‘I don’t know’, go to question A9 below. If the answer is ‘Yes’, please answer question A12:
A12 Do you use these analytical functionalities? Yes No I don’t know
A98 Does this executive information system provide you tendency analysis?
Yes No I don’t know
If the last answer is ‘No’ or ‘I don’t know’, go to question A10. If the answer is ‘Yes’, please answer question A13:
A13 Do you use this tendency analysis? Yes No I don’t know
A108 Does this executive information system alert you about exception information?
Yes No I don’t know

178
A14 On what vendor solution is the executive information system you use in your company based?
EXECUTIVE INFORMATION SYSTEM USER EXPERIENCE
B18 Did you work with other executive information systems prior to the system you currently use?
Yes No I don’t know
B38 How many hours per week do you use this executive information system? ………………
B48 How long have you used this executive information system in your current job (in years)? ………………
B5 What percentage of this executive information system do you think you actually use? ………………
B6 How would you rate yourself as an user of this executive information systems (high or low)?
High Low
B7 What is your level of satisfaction with the executive information system (from 0 - not satisfied to 10 - very satisfied)? ………………
PERSONAL INFORMATION
C18 What is your current job title? ……………………………………………………………….
between 25 and 34
between 35 and 44
between 45 and 54
between 55 and 64
above 65
C3 What is your gender? Female Male
High School diploma
Bachelor’s degree
Master degree
PhD degree
Business Objects Qlikview
Cognos Board
Microstrategy SAS
Oracle Information Builders
Microsoft Excel
Hyperion Other (please specify): …………...………………
B28 How often do you use this executive information system (indicate either per day, per week or per month)?
………………… times every day
………………... times every week
………………... times every month
C28 How old are you?
C48 What is the highest level of formal education you have attained to date?

179
C6 Are you concerned with the strategic direction of your organization’s business?
Yes No
C78 How many years’ work experience do you have? ………………
C88 How long have you worked for your current firm (in years)? ………………
C9 How long have you held your current position (in years)? ………………
Beginner Intermediate Advanced Expert COMPANY INFORMATION
D28 In what country do you work? ………………
between 1 and 9 employees
between 10 and 49 employees
between 50 and 249 employees
more than 250 employees
less than €2 million
between €2 and €10 million
between €10 and €50 million
more than €50 million
C58 In what area or department do you work?
General Management Information Systems
Accounting or Finance Production or Purchasing
Human Resources Marketing or Sales
Other (please specify): …………...………………
C10 What kind of information systems user do you think that you are?
D1 In what industry is your company?
Telecommunications Manufacturing
Aerospace & Defense Chemicals
Automotive Financial Services
Transportation Consumer Products/Retail
Education Energy & Utilities
Pharmaceutical
Other (please specify): …………...………………
D38 How many employees does your company have?
D4 What is your company's sales volume?
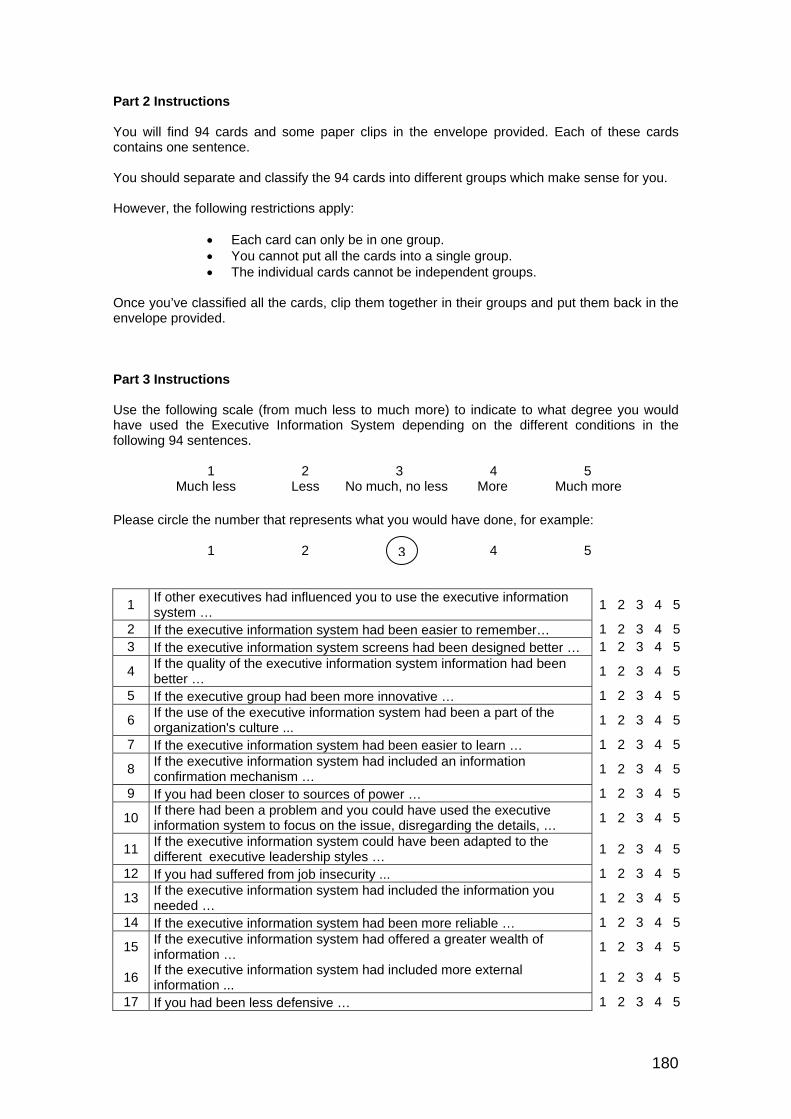
180
Part 2 Instructions You will find 94 cards and some paper clips in the envelope provided. Each of these cards contains one sentence. You should separate and classify the 94 cards into different groups which make sense for you. However, the following restrictions apply:
Each card can only be in one group. You cannot put all the cards into a single group. The individual cards cannot be independent groups.
Once you’ve classified all the cards, clip them together in their groups and put them back in the envelope provided. Part 3 Instructions Use the following scale (from much less to much more) to indicate to what degree you would have used the Executive Information System depending on the different conditions in the following 94 sentences. 1 2 3 4 5 Much less Less No much, no less More Much more Please circle the number that represents what you would have done, for example: 1 2 4 5
1 If other executives had influenced you to use the executive information system …
1 2 3 4 5
2 If the executive information system had been easier to remember… 1 2 3 4 53 If the executive information system screens had been designed better … 1 2 3 4 5
4 If the quality of the executive information system information had been better …
1 2 3 4 5
5 If the executive group had been more innovative … 1 2 3 4 5
6 If the use of the executive information system had been a part of the organization's culture ...
1 2 3 4 5
7 If the executive information system had been easier to learn … 1 2 3 4 5
8 If the executive information system had included an information confirmation mechanism …
1 2 3 4 5
9 If you had been closer to sources of power … 1 2 3 4 5
10 If there had been a problem and you could have used the executive information system to focus on the issue, disregarding the details, …
1 2 3 4 5
11 If the executive information system could have been adapted to the different executive leadership styles …
1 2 3 4 5
12 If you had suffered from job insecurity ... 1 2 3 4 5
13 If the executive information system had included the information you needed …
1 2 3 4 5
14 If the executive information system had been more reliable … 1 2 3 4 5
15 If the executive information system had offered a greater wealth of information …
1 2 3 4 5
16 If the executive information system had included more external information ...
1 2 3 4 5
17 If you had been less defensive … 1 2 3 4 5
3

181
18 If someone had demonstrated the positive results obtained from using the executive information system …
1 2 3 4 5
19 If there had been organizational pressure to use the executive information system …
1 2 3 4 5
20 If the project had had more visibility … 1 2 3 4 521 If you had needed less time to find the information required … 1 2 3 4 5
22 If the executive information system and the business objectives had been better linked …
1 2 3 4 5
23 If the project's implementation process had been better… 1 2 3 4 524 If the project's implementation had been incremental … 1 2 3 4 5
25 If you had felt greater cultural affinity with the executive information system ...
1 2 3 4 5
26 If you had been more predisposed to using computers … 1 2 3 4 5
27 If the executive information system had had a drill-down function, enabling you to go from aggregated information to detailed data, …
1 2 3 4 5
28 If you had had support from information specialists … 1 2 3 4 5
29 If there had been institutional control over the executive information system's use ...
1 2 3 4 5
30 If the system's infrastructures had been better … 1 2 3 4 5
31 If the executive information system had been multidimensional in terms of functionality …
1 2 3 4 5
32 If it had been easy to interpret the information in the executive information system’s graphs, tables, reports, etc. …
1 2 3 4 5
33 If the executive information system had had the same functionalities as Windows or the Internet …
1 2 3 4 5
34 If your ability to concentrate had been better … 1 2 3 4 535 If you had trusted the executive information system … 1 2 3 4 536 If resources had been available for the executive information system … 1 2 3 4 5
37 If you had perceived that the executive information system was less complex …
1 2 3 4 5
38 If it had been easier to know what information the executive information system contained …
1 2 3 4 5
39 If you had been better at using the executive information system … 1 2 3 4 5
40 If the designers had instilled a more favorable attitude among executives by involving them during the implementation project …
1 2 3 4 5
41 If it had been less difficult to use the executive information system … 1 2 3 4 542 If the organization had used the executive information system more … 1 2 3 4 543 If you had had more experience with the executive information system … 1 2 3 4 5
44 If you hadn't been reluctant to spend extra time learning how to use applications other than spreadsheets …
1 2 3 4 5
45 If you had been more computer literate … 1 2 3 4 5
46 If the executive information system had been better designed to suit your tasks …
1 2 3 4 5
47 If there had been external courses on how to use the executive information system …
1 2 3 4 5
48 If the use of the executive information system had been voluntary … 1 2 3 4 549 If you had had a better understanding of the use of computers … 1 2 3 4 5
50 If there had been back-end support for executive information system users …
1 2 3 4 5
51 If the executive information system had offered clear and precise help … 1 2 3 4 5
52 If you had participated in the executive information system's development …
1 2 3 4 5
53 If the executive information system could have been customized … 1 2 3 4 554 If the system graphics had been better … 1 2 3 4 555 If the executive information system had been more important … 1 2 3 4 556 If you had been involved in the executive information system's design … 1 2 3 4 5
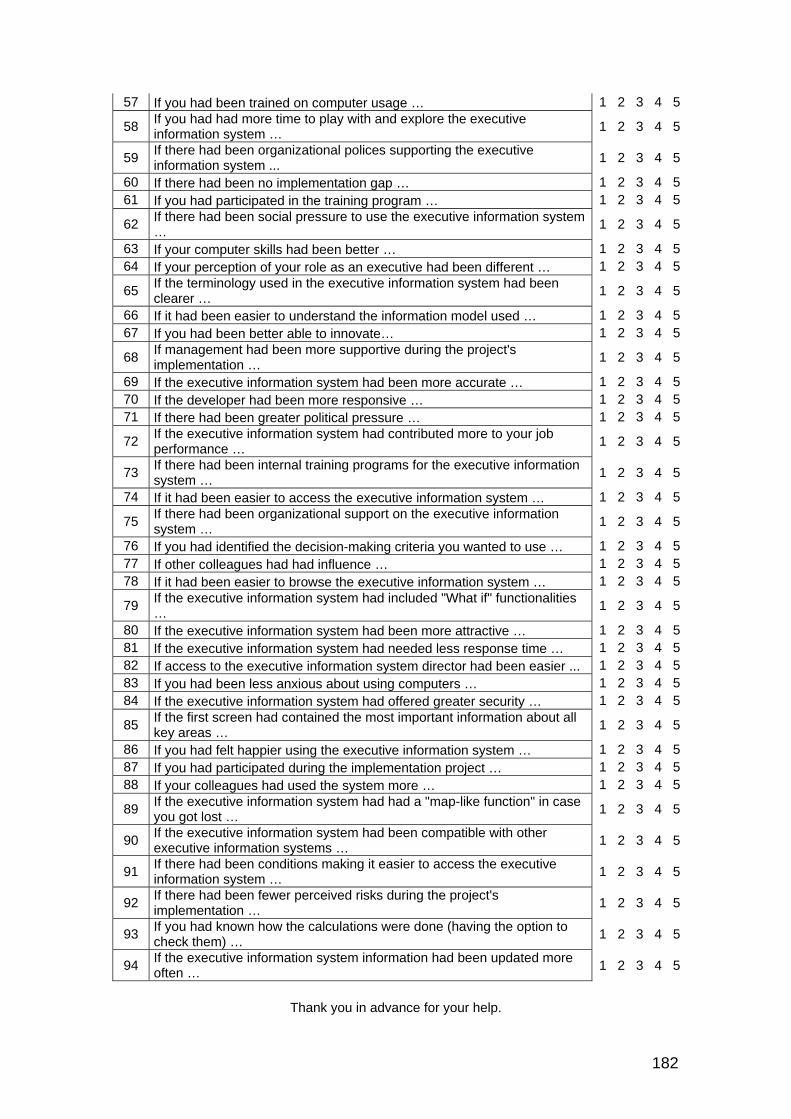
182
57 If you had been trained on computer usage … 1 2 3 4 5
58 If you had had more time to play with and explore the executive information system …
1 2 3 4 5
59 If there had been organizational polices supporting the executive information system ...
1 2 3 4 5
60 If there had been no implementation gap … 1 2 3 4 561 If you had participated in the training program … 1 2 3 4 5
62 If there had been social pressure to use the executive information system …
1 2 3 4 5
63 If your computer skills had been better … 1 2 3 4 564 If your perception of your role as an executive had been different … 1 2 3 4 5
65 If the terminology used in the executive information system had been clearer …
1 2 3 4 5
66 If it had been easier to understand the information model used … 1 2 3 4 567 If you had been better able to innovate… 1 2 3 4 5
68 If management had been more supportive during the project's implementation …
1 2 3 4 5
69 If the executive information system had been more accurate … 1 2 3 4 570 If the developer had been more responsive … 1 2 3 4 571 If there had been greater political pressure … 1 2 3 4 5
72 If the executive information system had contributed more to your job performance …
1 2 3 4 5
73 If there had been internal training programs for the executive information system …
1 2 3 4 5
74 If it had been easier to access the executive information system … 1 2 3 4 5
75 If there had been organizational support on the executive information system …
1 2 3 4 5
76 If you had identified the decision-making criteria you wanted to use … 1 2 3 4 577 If other colleagues had had influence … 1 2 3 4 578 If it had been easier to browse the executive information system … 1 2 3 4 5
79 If the executive information system had included "What if" functionalities …
1 2 3 4 5
80 If the executive information system had been more attractive … 1 2 3 4 581 If the executive information system had needed less response time … 1 2 3 4 582 If access to the executive information system director had been easier ... 1 2 3 4 583 If you had been less anxious about using computers … 1 2 3 4 584 If the executive information system had offered greater security … 1 2 3 4 5
85 If the first screen had contained the most important information about all key areas …
1 2 3 4 5
86 If you had felt happier using the executive information system … 1 2 3 4 587 If you had participated during the implementation project … 1 2 3 4 588 If your colleagues had used the system more … 1 2 3 4 5
89 If the executive information system had had a "map-like function" in case you got lost …
1 2 3 4 5
90 If the executive information system had been compatible with other executive information systems …
1 2 3 4 5
91 If there had been conditions making it easier to access the executive information system …
1 2 3 4 5
92 If there had been fewer perceived risks during the project's implementation …
1 2 3 4 5
93 If you had known how the calculations were done (having the option to check them) …
1 2 3 4 5
94 If the executive information system information had been updated more often …
1 2 3 4 5
Thank you in advance for your help.


![[Copia conforme] UNPA-103 - Prot. 3485-30/09/2019 · 2019. 10. 1. · schillaci domenico venturella fabio schillaci domenico venturella fabio titolo tesi antimicrobici da nuove fonti](https://static.fdocuments.us/doc/165x107/60dd1d34f8db2c074938b298/copia-conforme-unpa-103-prot-3485-30092019-2019-10-1-schillaci-domenico.jpg)