Tertiary Education in Portugal BACKGROUND REPORT
188
Reviews of National Policies for Education Tertiary Education in Portugal BACKGROUND REPORT MINISTRY OF SCIENCE, TECHNOLOGY AND HIGHER EDUCATION Lisbon, 2006
Transcript of Tertiary Education in Portugal BACKGROUND REPORT

Reviews of National Policies for Education
Tertiary Education in Portugal BACKGROUND REPORT
MINISTRY OF SCIENCE, TECHNOLOGY
AND HIGHER EDUCATION Lisbon, 2006

TERTIARY EDUCATION IN PORTUGAL: BACKGROUND REPORT
2
In June 2005, the Portuguese Minister of Science, Technology and Higher Education, José Mariano
Gago, approached the OECD to conduct a review of the Portuguese higher education system, under the Education Committee’s programme of national reviews. The report of the OECD review team draws upon the Background Report prepared by Portuguese authorities, literature searches and evidence gathered during a two-week study visit to Portugal in May 2006. Published by the OECD in 2007, Reviews of National Policies for Education: Tertiary Education in Portugal (ISBN 978-92-64-00975-2) contains the analysis and recommendations of the review team.
This Background Report, prepared by Portugal’s Ministry of Science, Technology and Higher Education, is available at http://dx.doi.org/10.1787/104853273381 and on the OECD website at www.oecd.org/edu/reviews/nationalpolicies.

TERTIARY EDUCATION IN PORTUGAL: BACKGROUND REPORT
3
TABLE OF CONTENTS
PREFACE .......................................................................................................................................................5 INTRODUCTORY NOTE..............................................................................................................................5
List of Abbreviations ...................................................................................................................................9 PART I - THE CONTEXT............................................................................................................................11
1. Introduction to the tertiary education system in Portugal ......................................................................11 2. The country at large ...............................................................................................................................31 3. The duality of the Portuguese society ....................................................................................................35 4. The education system: from basic to higher education..........................................................................40 5. The levels and perspectives for student enrolments...............................................................................43 References..................................................................................................................................................48
PART II - PUBLIC REGULATION AND INSTITUTIONAL DEVELOPMENT......................................49 1. Access to higher education and overall enrolment trends......................................................................49 2. Students’ social support system.............................................................................................................57 3. Accreditation and quality assessment ....................................................................................................65 4. Public Funding of higher education.......................................................................................................68 5. Institutional autonomy and development, relationships with government and the management of human resources ........................................................................................................................................93 References................................................................................................................................................103
PART III - THE NETWORK OF TERTIARY EDUCATION...................................................................105 III.1. THE GEOGRAPHY OF TERTIARY EDUCATION IN PORTUGAL ............................................105
1. Introduction and regional distribution of institutions ..........................................................................105 2. Regional distribution of vacancies, enrolments and graduates ............................................................110 3. Regional distribution of the academic staff .........................................................................................116 References................................................................................................................................................118
PART III.2 - A FUNCTIONAL ANALYSIS .............................................................................................119 1. Post-secondary education ....................................................................................................................119 3. Graduate studies...................................................................................................................................123 3. Post-graduate programmes...................................................................................................................132 4. Academic Research..............................................................................................................................135 References................................................................................................................................................165
PART III.3 - A CAPACITY ANALYSIS...................................................................................................166 1. The academic and teaching staff..........................................................................................................166 2. The installed physical capacity ............................................................................................................172 3. New publics and the adequacy to the labour market ...........................................................................174 4. Internationalisation as an opportunity for increasing enrolments ........................................................178 References................................................................................................................................................180
PART IV - MAIN ISSUES AND CHALLENGES.....................................................................................181 1. Main activities taken by the Ministry of Science, Technology and Higher Education in 2006...........185

TERTIARY EDUCATION IN PORTUGAL: BACKGROUND REPORT
4

TERTIARY EDUCATION IN PORTUGAL: BACKGROUND REPORT
5
PREFACE
This Background Report provides an overview of the tertiary education system in Portugal and raises the main concerns that need political attention. It was written based on the terms of reference agreed in November 2005 between the Portuguese Government and OECD and considers the guidelines provided by OECD in January 2006 for the accomplishment of the evaluation exercise.
The report includes information on the Portuguese tertiary education system, including statistical data, legislation and installed capacity. It also considers a characterisation of the number, type, dimension, geographical location and distribution of the higher education institutions, as well as their study programmes and networking activities, including both public and private, university and polytechnic institutions and addressing at least the following topics: access to tertiary education; the profile of the students’ population; enrolment trends; funding schemes and levels; research assessment and statistics.
The writing-up of this report included a throughout discussion with major actors in tertiary education, following the circulation of an initial draft document in March 2006. The final version includes many of the contributions received. In addition, it should be remembered that the OECD invited all interested parties to submit directly their own views and reflections on the Portuguese tertiary education.
In this context, thanks are due to those individuals and institutions that helped in various ways, including the National Council of Education, CNE, the Council of Rectors, CRUP, the Council of Polytechnic Institutes, CCISP, The Association of Private Institutions of Higher Education, APESP, the Council of Associate Laboratories, CLA, the Confederation of Industries, CIP, the Association of Industries, AIP, and the various unions and students’ associations that have provided continuous criticism, comments and information that allowed the preparation of the report.
It is also acknowledged the contribution of all the institutions that made available the information necessary for the report, including the Directorate General for Higher Education, DGES, the Observatory for Science and Higher Education, OCES, the Planning Office, GEFCES, and the Foundation for Science and Technology, FCT.
Lisbon, May 5, 2006 Manuel Heitor Secretary of State for Science, Technology and Higher Education
INTRODUCTORY NOTE
The review of the tertiary education system and policies commissioned by the Portuguese Government to the OECD in November 2005 is expected to examine the performance of the Portuguese tertiary education by reference to other OECD countries and to provide recommendations for its improvement. The goal is to conduct an extensive, independent and objective assessment of the Portuguese system of tertiary education following international criteria with the ultimate goal of guiding the reorganisation and rationalisation of the system.

TERTIARY EDUCATION IN PORTUGAL: BACKGROUND REPORT
6
The review is being complemented by two other major exercises. First, the European Network for Quality Assurance in Higher Education, ENQA, will review the accreditation and quality assurance practices of the Portuguese tertiary education and will provide advice on appropriate structures for implementing a national accreditation and evaluation agency following examples of quality assurance and accreditation practices in Europe. Second, an independent, voluntary and objective review of Portuguese higher education institutions (universities and polytechnics, public and private, and their units) was launched under the coordination of the European University Association, EUA, following international criteria.
The overall exercise was designed to ensure that the tertiary education system and its stakeholders gain maximum benefit from comprehensive evaluations by teams of experienced international experts and that the procedures and processes in place in the Portuguese tertiary education system can be benchmarked against best practice internationally. The Government will use the results of the review as a contribution to the decision-making process of reforming the Portuguese tertiary education.
In this context, and following the terms agreed with OECD, the Background Report provides an overview of the tertiary education system in Portugal to support the evaluation exercise. It was based on a thorough discussion with major actors in tertiary education, following the circulation of an initial draft document in March 2006. The final version includes written contributions received from many of those actors and thanks are due to many individuals and institutions that helped in various ways.
The report raises various concerns that need political attention and the reviewers will certainly select those that require particular analysis. Nevertheless, from a national point of view, particular attention should be focused on the following points of concern:
1. Regulating and accrediting the supply of tertiary education: how to foster diversity and quality, with the necessary specialisation? Which level of public regulation to facilitate the adequacy of the supply of tertiary education to the labour market? How should tertiary education contribute to the reform and promotion of the knowledge base of the Portuguese labour market? The structure and network of tertiary education institutions is a major concern. The system grew unabated in the last decades, with a number of institutions achieving excellence, but many others still requiring human resources to provide quality education and research. Initially the growth and rapid increase in the number of higher education institutions responded to student demand, but this slowed down due to declining student enrolment. At the same time, the needs of the labour market have changed. The use of the numerus clausus as policy instrument became increasingly questioned in many fields of study. As a result, the objective and mission of public and private universities and polytechnics need clarification, while the rationalisation of the system requires attention. The main issues to be assessed include the number and type of higher education institutions; the accreditation of degree courses; the geographical spread of higher education institutions throughout the country, as well as the level of internationalization of most institutions. But in order to address the overall system, it is important to look carefully at the various sub-systems, in a way that fosters their individual and specific characteristics. How can the binary model (university – polytechnic) best meet the needs of the Portuguese society, given the historical context in which its higher education institutions developed? Should public policies differentiate the adequacy of the supply of tertiary education to the labour market in function of the specific characteristics of each sub-system?
2. Strengthening scientific excellence in higher education: Which level of public funding to guarantee the adequate level of science and technology and the growth of the knowledge base? What are the implications for the organisation of the supply of higher education and, in particular, for post-graduation education? Which research and academic careers? Strengthening

TERTIARY EDUCATION IN PORTUGAL: BACKGROUND REPORT
7
science and technology in Europe became a major concern, while the duality between research intensive universities and teaching institutions was strengthened in many countries. At the same time, the need to promote learning societies leading to knowledge economies called increasing attention to the role of research in any learning environment. How to promote at the same time scientific excellence and the growth of the knowledge base? Does Portugal provide enough human resources to fulfil this ambition, as well as adequate access to research infrastructures and skills? How to ensure that all students in any Portuguese higher education institution have access to quality research? How to regulate and organise the supply of undergraduate and post-graduate degree programmes in order to guarantee the necessary research-based environments for higher education? Which should be the level of national and international networking of research centres, the role of associated laboratories and of other R&D institutions beyond the higher education system? Still under this context, it is clear that women have a remarkable significant participation in Portuguese higher education and science, but their participation in S&T careers remained low at senior levels. In addition, while the attractiveness of research careers was the focus of much policy action throughout OECD countries, which policy measures should be implemented to foster modern academic and scientific careers in Portuguese higher education institutions? How can public policies foster a network of Portuguese institutions competing internationally with an increasingly diversified and sophisticated system of institutional arrangements and research and academic careers?
3. Governance and institutional autonomy in higher education: Which legal statutes and frameworks to foster modern institutions? New structures of governance of tertiary education have been layered in Portugal, as well as in many other OECD countries, creating an amalgam of complex, and sometimes ineffective, systems of governance. Nevertheless, the majority of the systems of tertiary education remain within public administration, with teachers, researchers and staff managed as public servants. This led many authors to argue that tertiary education needs modern and efficient governance systems, focusing on the emerging challenges and opportunities facing institutions and their resources. They need to be attuned to the social and economic needs of the country, as well as to the increasingly emerging opportunities of science and technology. This requires an examination of the legal status and regulatory framework of the tertiary education institutions to make them more responsive to societal needs, but in a way to foster their own independence in guiding the frontiers of science and knowledge.
4. Broadening the tertiary education spectrum: How to enlarge the number of students and help qualify the Portuguese population? Which social support and loan systems? Despite the large increase in tertiary education over the last decades, Portugal is still characterised by low qualification levels of the population in general, together with high retention and drop-out rates from the education system. Which public policies need implementation to guarantee broadening access to higher education and to foster post-secondary education? How can policy measures facilitate tertiary education institutions to attract new publics for lifelong learning, adult and vocational training? Furthermore, under the current financial restraints, how to ensure equity in the access to tertiary education, together with adequate loan and social support systems to students?
Improving the understanding of these main aspects of concern will contribute for implementing the necessary system level reforms, including the definition of the network of tertiary education institutions and study programmes, widening participation to non-traditional publics and promoting lifelong education activities in order to develop a national system of tertiary education following best worldwide concepts.
In order to achieve these objectives, the Background Report provided basic information to the OECD team of evaluators, which was complemented with interviews, meetings and visits to a number of people

TERTIARY EDUCATION IN PORTUGAL: BACKGROUND REPORT
8
and institutions. In addition, the OECD invited institutions, teachers, students, unions and professional associations to submit their own independent brief assessments of the tertiary education in Portugal, so that complementary views of emerging challenges will be brought together. The review took place in the wider context of the Government’s strategic objective of guarantying a system of tertiary education fully integrated at the European level, namely in terms of quality, levels of participation and employability of graduates.
Thanks are due to all the institutions that made available the information necessary for the report.

TERTIARY EDUCATION IN PORTUGAL: BACKGROUND REPORT
9
List of Abbreviations
ADISPOR Association of the Portuguese Polytechnics Institutes APESP Portuguese Association of Private Higher Education Institutions Adi Innovation Agency CCISP Coordinating Council of the Portuguese Polytechnics Institutes CERN European Organisation for Nuclear Research CET Specialised Technology Courses CESE Specialised Higher Education Courses CIES Centre for Research and Studies in Sociology CIRIUS Research Centre on Regional and Urban Economics CLES Comprehensive Law of the Education System CNASES National Council of Student Social Support CNAVES National Council for Evaluation of Higher Education CRUP Council of Rectors of Portuguese Universities DAPP Department for Evaluation, Prospective and Planning (Ministry of Education) DEPGEF Department for Financial Management and Planning DGES Directorate General for Higher Education EFTA European Free Trade Association EHEA European Higher Education Area EMBL European Molecular Biology Laboratory EMBO European Molecular Biology Organisation ESA European Space Agency ESF European Social Fund ESO European Southern Observatory ESRF European Synchrotron Research Facility EU European Union EUROSTAT Statistical Office of the European Communities FAE Federation of Student Unions FCT Foundation for Science and Technology FEANI European Federation of Engineering National Associations FTE Full Time Equivalent FUP Foundation of Portuguese Universities GDP Gross Domestic Product GNP Gross National Product HEI Higher Education Institution ICT Information and Communication Technologies IICTI Research Institute for Industrial Science and Technology INE National Institute for Statistics ISCED International Standard Classification of Education ISCTE Higher Institute for Work and Enterprise Sciences IT Information Technologies JNICT National Committee of Scientific and Technological Research MCTES Ministry for Science, Technology and Higher Education NEOTEC New Technologies Initiative NEST New Technology Based Companies NUTS Nomenclature of Territorial Units for Statistics OCES Observatory of Science and Higher Education OCT Observatory of Sciences and Technologies PALOPs African Countries with Portuguese as Official Language

TERTIARY EDUCATION IN PORTUGAL: BACKGROUND REPORT
10
POCTI Operational Program for Science, Technology and Innovation POSI Operational Program for Information Society RCTS Network of Science, Technology and Society R&D Research and Development SILATEE Longitudinal Information System for Following the Entrepreneurial Trajectories and Enterprises S&T Science and Technology

TERTIARY EDUCATION IN PORTUGAL: BACKGROUND REPORT
11
PART I - THE CONTEXT
1. Introduction to the tertiary education system in Portugal
The current evaluation of the Portuguese tertiary education system takes place in a period of slightly declining and/or relative stagnation in the growth of students after a period of more than 30 years of consecutive growth (Figure 1.1). The system grew from 30,000 students in the sixties to nearly 400,000 students by the end of the 20th century. This rapid increase in the student population, comparatively to the development in other European countries during the same period (Figures 1.2 and 1.3) should be acknowledged, although the recent decrease in the number of students since 2002 was expected for a number of years based on several estimates1,2. This raises a series of new challenges and opportunities for the higher education system, in terms of strengthening its capacity and level of specialisation, as well as broadening the qualification of the Portuguese population and its knowledge base in an international context.
Figure 1.1 – Evolution of the overall number of students (graduate and post-graduate) enrolled in higher education in Portugal, 1990/91 – 2005/06
0
50 000
100 000
150 000
200 000
250 000
300 000
350 000
400 000
1990
/91
1991
/92
1992
/93
1993
/94
1994
/95
1995
/96
1996
/97
1997
/98
1998
/99
1999
/00
2000
/01
2001
/02
2002
/03
2003
/04
2004
/05
2005
/06
Total Enrolments
Total PublicHigher Education
Public Universities
Private HigherEducation
PublicPolytechnics
Source: OCES-MCTES.
1 CIPES, Previsão da Evolução do número de alunos e das necessidades de financiamento Ensino Superior
1995 a 2005, February 1999, which forecasted an expected decrease of 32,600 students of the 12th year (or 26.6%), between 1995/1996 and 2005/2006.
2 Expectation of decrease in the number of students of the secondary education of 51,442 students of the 12th year, between 1997/1998 e 2002/2003, as in “Alunos matriculados no ensino público e privado – Evolução e projecção” em: http://www.min-edu.pt/Scripts/ASP/estatisticas.asp

TERTIARY EDUCATION IN PORTUGAL: BACKGROUND REPORT
12
Figure 1.2 – Total number of students in the higher education system for the period 1960-2002 in a selected group of small European countries
Belgium
Greece
Ireland Portugal0
50
100
150
200
250
300
350
400
450
1960
/1961
1966
/1967
1975
/1976
1980
/1981
1985
/1986
1990
/1991
1995
/1996
1996
/1997
2000
/2001
BelgiumGreeceIreland Portugal
(1000)
Source: Conceição and Heitor, (2005), “Innovation for All? Learning from the Portuguese path to technical change and the dynamics of innovation”. Westport and London: Praeger; Primary data from Eurostat, UOE, INE, DAPP.
Figure 1.3 – Compound annual growth rate of the number of students enrolled in tertiary education (ISCED 5 and 6), 1975/76 – 2000/01
0% 1% 2% 3% 4% 5% 6%
D NL
I F
DKB
EU-15A
UKS
FINE
IRLELPT
Source: Eurydice (2005), Key data on Education in Europe 2005, Luxembourg, Office for Official Publications of the European Communities
The female population represented about 61% of the total number of students enrolled in the Portuguese tertiary education in 2004 (Figure 1.4), with 55% of all students staying with their families after enrolment in tertiary education (Figure 1.5). This shows a pattern typical of other southern European countries.
TERTIARY EDUCATION IN PORTUGAL: BACKGROUND REPORT
13
Figure 1.4 – Overall percentage of women enrolled in higher education, 2004
5 %
22 % 23 % 24 %
35 % 37 % 38 %42 %
55 %
69 %76 %
Finlândia ReinoUnido
Alemanha Áustria Irlanda Holanda Letónia França Portugal Espanha Itália
Source: CIES-ISCTE, Eurostudent 2005
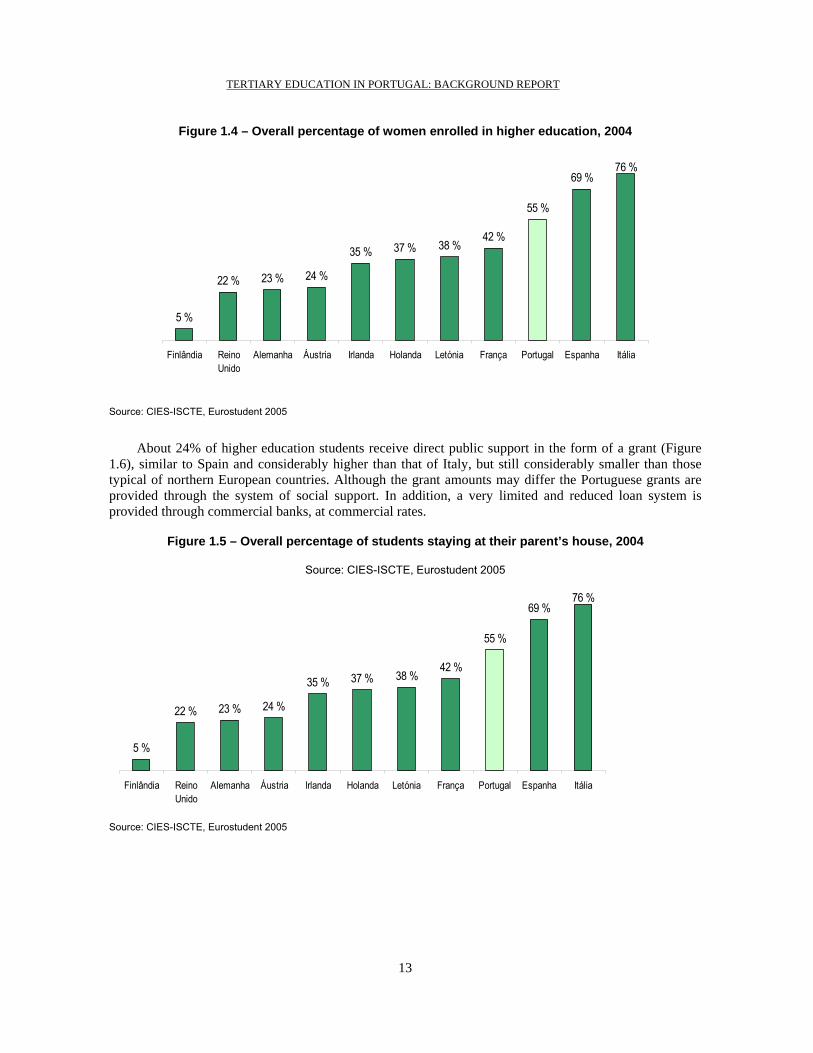
About 24% of higher education students receive direct public support in the form of a grant (Figure 1.6), similar to Spain and considerably higher than that of Italy, but still considerably smaller than those typical of northern European countries. Although the grant amounts may differ the Portuguese grants are provided through the system of social support. In addition, a very limited and reduced loan system is provided through commercial banks, at commercial rates.
Figure 1.5 – Overall percentage of students staying at their parent’s house, 2004
Source: CIES-ISCTE, Eurostudent 2005
5 %
22 % 23 % 24 %
35 % 37 % 38 %42 %
55 %
69 %76 %
Finlândia ReinoUnido
Alemanha Áustria Irlanda Holanda Letónia França Portugal Espanha Itália
Source: CIES-ISCTE, Eurostudent 2005
TERTIARY EDUCATION IN PORTUGAL: BACKGROUND REPORT
14
Figure 1.6 – Percentage of students receiving direct public support, 2004
9 %
23 % 23 % 24 % 27 %31 %
53 %62 %
71 %
85 %
Itália Alemanha Espanha Portugal Áustria Irlanda França Holanda Finlândia ReinoUnido
9 %
23 % 23 % 24 % 27 %31 %
53 %62 %
71 %
85 %
Itália Alemanha Espanha Portugal Áustria Irlanda França Holanda Finlândia ReinoUnido
Source: CIES-ISCTE, Eurostudent 2005
Occupancy of student residences covers only about 4% of the total population in higher education and, therefore, is still comparatively lower than in most European countries (Figure 1.7). Most students live with their family.
Figure 1.7 – Percentage of students staying at student residences, 2004
35 3143
14
42
11 1532
66
15
41 49
50
63
36
52
70
54
21
32
12 8
7
18 23
34
11 411
49
12 12 5 3 4 102 4
Alemanha Áustria Espanha Finlândia França Holanda Irlanda Letónia Portugal ReinoUnido
Família Trabalho Estado Outras
Source: CIES-ISCTE, Eurostudent 2005
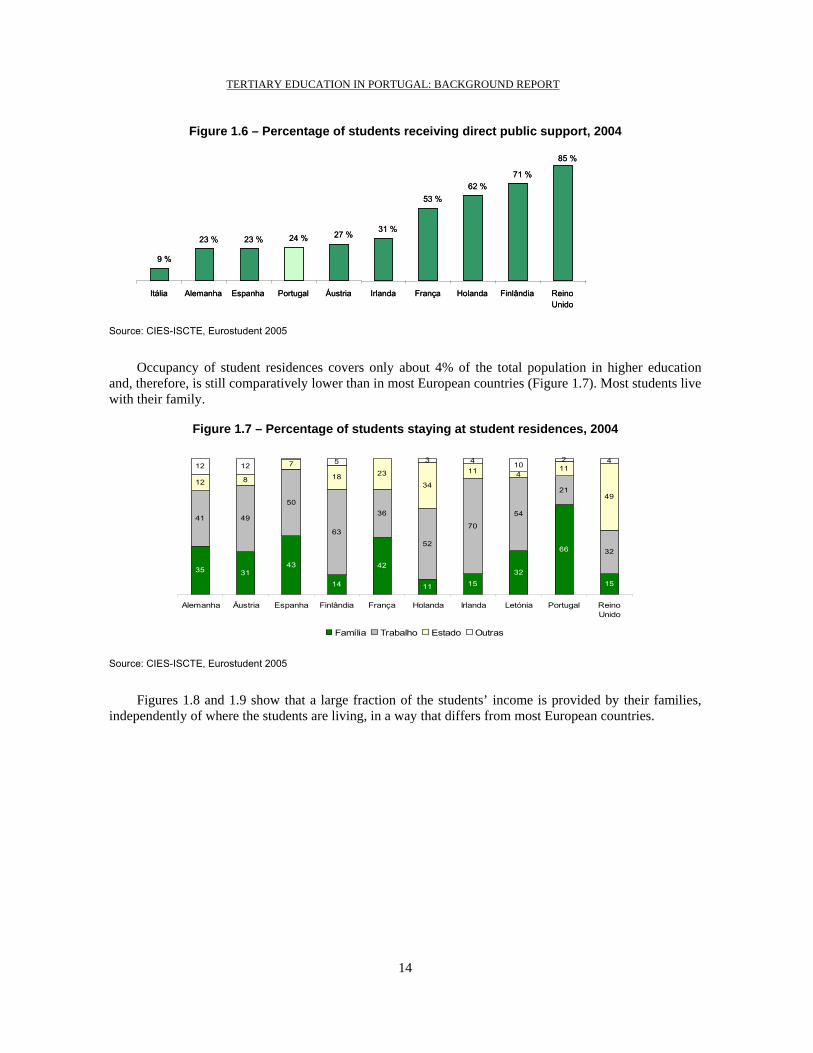
Figures 1.8 and 1.9 show that a large fraction of the students’ income is provided by their families, independently of where the students are living, in a way that differs from most European countries.
TERTIARY EDUCATION IN PORTUGAL: BACKGROUND REPORT
15
Figure 1.8 – Relative level of the sources of income for students staying at their parent’s house, 2004;
5134 45
1138 28 28
42
70
26
2744
45
52
33 4357
44
21
17
13 98
3029 27
11 48
52
9 13 7 4 10 4
Alemanha Áustria Espanha Finlândia França Holanda Irlanda Letónia Portugal ReinoUnido
Família Trabalho Estado Outras
5134 45
1138 28 28
42
70
26
2744
45
52
33 4357
44
21
17
13 98
3029 27
11 48
52
9 13 7 4 10 4
Alemanha Áustria Espanha Finlândia França Holanda Irlanda Letónia Portugal ReinoUnido
Família Trabalho Estado Outras
Source: CIES-ISCTE, Eurostudent 2005
Figure 1.9 – Relative level of the sources of income for students that are not staying at their parent’s house, 2004;
5134 45
1138 28 28
42
70
26
2744
45
52
33 4357
44
21
17
13 98
3029 27
11 48
52
9 13 7 4 10 4
Alemanha Áustria Espanha Finlândia França Holanda Irlanda Letónia Portugal ReinoUnido
Família Trabalho Estado Outras
5134 45
1138 28 28
42
70
26
2744
45
52
33 4357
44
21
17
13 98
3029 27
11 48
52
9 13 7 4 10 4
Alemanha Áustria Espanha Finlândia França Holanda Irlanda Letónia Portugal ReinoUnido
Família Trabalho Estado Outras
Source: CIES-ISCTE, Eurostudent 2005
Higher education is provided through a diversified system of institutions (Table 1.1), including 27 universities, 40 university schools (not integrated), 17 polytechnic institutes and 76 polytechnic schools (not integrated), with an overall of 160 units. This includes 14 Public universities, with 6 of them organised in 48 schools (i.e., “faculdades”).

TERTIARY EDUCATION IN PORTUGAL: BACKGROUND REPORT
16
Table 1.1 – Number of university and polytechnic institutions, 2006
University Polytechnic Universities Other Schools
(not integrated) Polytechnic Institutes
Other Schools (not integrated)
Public 14 5 15 16 Private 13 35 2 60 TOTAL 27 40 17 76
The system includes 15 Public Polytechnic Institutes and 2 Private Polytechnic Institutes. Table 1.2 quantifies the network of polytechnic schools, including those integrated in universities and in polytechnic institutes, with an overall number of 173 schools.
Table 1.2 – Number of polytechnic schools, 2006
Polytechnic schools integrated in polytechnic institutes
Polytechnic schools integrated in universities
Other polytechnic schools (not integrated)
TOTAL
Public 75 15 16 106 Private 4 3 60 67 TOTAL 79 18 76 173
These institutions offered about 80 bachelor degree programmes (i.e., three-year degrees, “bacharelato”), 1932 “licenciaturas” and 622 masters in 2005/06 (Table 1.3).
Table 1.3 – Number of degree programmes registered for the academic year 2005/06
Number of degree programmes registered, 2005-2006 Sub-system of Higher Education “Bachalerato” “Licenciatura” “Mestrado”
University 5 723 528Polytechnic 27 619 --
Public Higher Education
Sub-total 32 1342 528University 10 308 63Polytechnic 38 213 --
Private Higher Education
Sub-total 48 521 63Catholic University
University -- 69 31
Sub-total 69 31TOTAL 80 1932 622
Source: DGES
Table 1.4 quantifies the number of new entrants, the total number of students and the number of new graduates for 1995/96, 2004/05 and 2005/06 including graduate and post-graduate degree programmes in public and private institutions. The results show that the number of higher education graduates duplicated over the last decade, with those in the field of science and technology accounting for about 20% of the total number of new graduates, while those in social sciences and management accounted for 29% (in relation to 2003/04). It should be pointed out that the higher education expansion resulted mainly from the increase of the non-university higher education over the 80´s and 90´s, which grew at a rate considerably higher than that of university education, representing, in 2001, nearly 42% of all students. However, it is important to stress that, according to a prospective analysis (Gago 1994), the education level that most contributed to the strengthening of qualification of the Portuguese middle management staff was the undergraduate level.

TERTIARY EDUCATION IN PORTUGAL: BACKGROUND REPORT
17
New graduates in the field of science and technology represent about 31% of the number of new graduates from the public university system and only 11% of those graduating from the private system, with these relative figures keeping rather constant over the last years. On the other hand, the number of new graduates in the health field increased from 6% to 11% of the total number of graduates from the public system, while they increased from 16% to 20% of the number of graduates from the private system.
Table 1.4 – New entrants, total students and new graduates for different fields of study
a. Overall number of (public and private systems) new entrants, total students and new graduates for different fields of study (graduate and post-graduate degree programmes): 1995/96 to 2005/06
Total Registrations
Registrations 1st year/1 st time Graduations Field of
Study 1995/96 2004/05 2005/06 1995/96 2004/05 2005/06 1995/96 2003/04 2004/05 Education 30 290 32 928 26 277 8 765 8 293 7 185 6 131 12 166 10 246 Arts & Humanities 28 627 32 658 31 553 6 961 7 738 8 199 4 270 6 037 6 144
Social Sciences, Law
125 499 119 339 116 262 32 133 26 320 25 565 15 361 19 664 19 638
Science & Technology 87 502 111 999 107 430 22 085 20 331 19 098 7 200 14 000 14 696
Agriculture 8 974 7 585 7 045 2 014 1 061 1 024 834 1 331 1 359 Health Sciences 21 708 55 201 58 823 5 516 15 937 16 899 4 101 11 643 13 528
Services 10 835 20 842 20 544 3 629 4 657 4 720 1 319 3 827 4 412 Total 313 435 380 552 367 934 81 103 84 337 82 690 39 216 68 668 70 023
Source: OCES
TERTIARY EDUCATION IN PORTUGAL: BACKGROUND REPORT
18
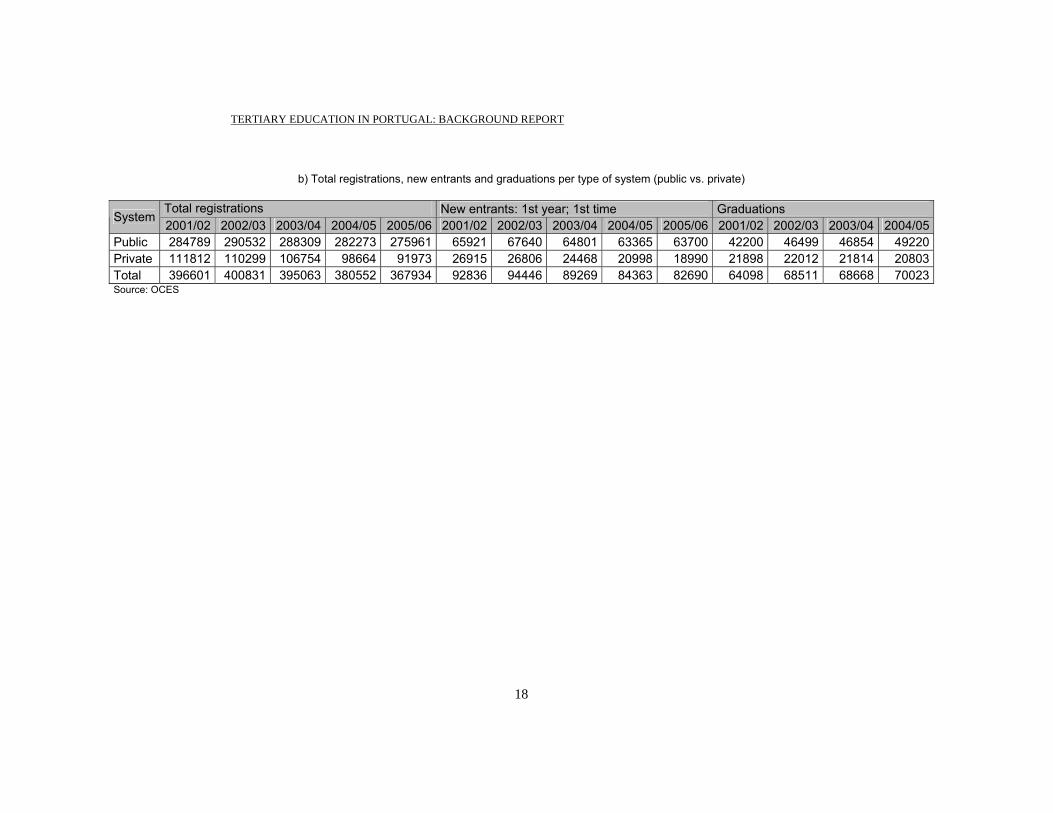
b) Total registrations, new entrants and graduations per type of system (public vs. private)
Total registrations New entrants: 1st year; 1st time Graduations System 2001/02 2002/03 2003/04 2004/05 2005/06 2001/02 2002/03 2003/04 2004/05 2005/06 2001/02 2002/03 2003/04 2004/05
Public 284789 290532 288309 282273 275961 65921 67640 64801 63365 63700 42200 46499 46854 49220Private 111812 110299 106754 98664 91973 26915 26806 24468 20998 18990 21898 22012 21814 20803Total 396601 400831 395063 380552 367934 92836 94446 89269 84363 82690 64098 68511 68668 70023Source: OCES
TERTIARY EDUCATION IN PORTUGAL: BACKGROUND REPORT
19
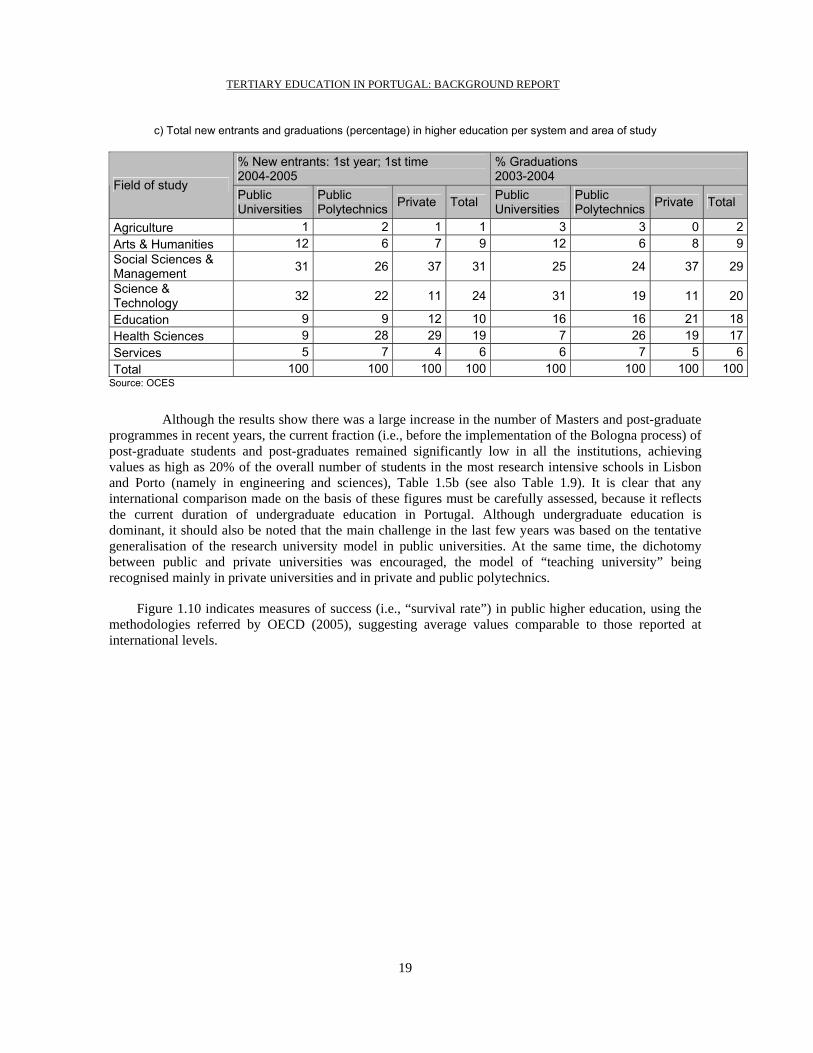
c) Total new entrants and graduations (percentage) in higher education per system and area of study
% New entrants: 1st year; 1st time 2004-2005
% Graduations 2003-2004
Field of study Public Universities
Public Polytechnics Private Total Public
Universities Public Polytechnics Private Total
Agriculture 1 2 1 1 3 3 0 2Arts & Humanities 12 6 7 9 12 6 8 9Social Sciences & Management 31 26 37 31 25 24 37 29
Science & Technology 32 22 11 24 31 19 11 20
Education 9 9 12 10 16 16 21 18Health Sciences 9 28 29 19 7 26 19 17Services 5 7 4 6 6 7 5 6Total 100 100 100 100 100 100 100 100
Source: OCES
Although the results show there was a large increase in the number of Masters and post-graduate programmes in recent years, the current fraction (i.e., before the implementation of the Bologna process) of post-graduate students and post-graduates remained significantly low in all the institutions, achieving values as high as 20% of the overall number of students in the most research intensive schools in Lisbon and Porto (namely in engineering and sciences), Table 1.5b (see also Table 1.9). It is clear that any international comparison made on the basis of these figures must be carefully assessed, because it reflects the current duration of undergraduate education in Portugal. Although undergraduate education is dominant, it should also be noted that the main challenge in the last few years was based on the tentative generalisation of the research university model in public universities. At the same time, the dichotomy between public and private universities was encouraged, the model of “teaching university” being recognised mainly in private universities and in private and public polytechnics.
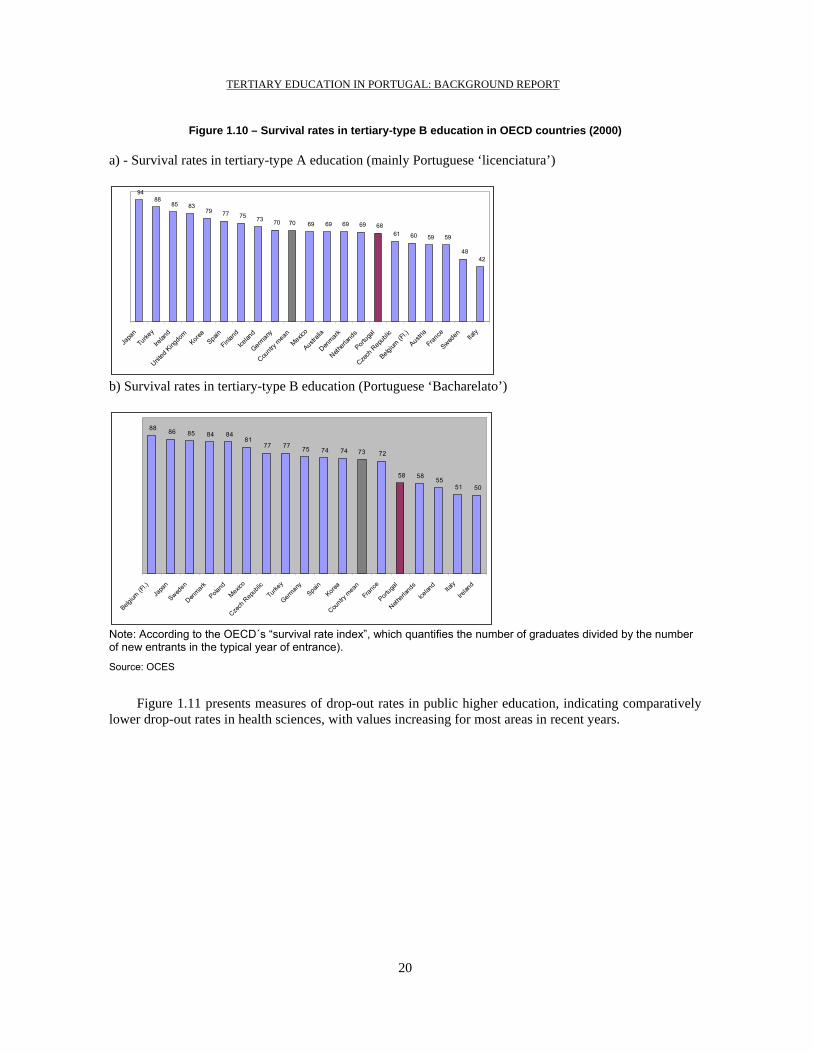
Figure 1.10 indicates measures of success (i.e., “survival rate”) in public higher education, using the methodologies referred by OECD (2005), suggesting average values comparable to those reported at international levels.
TERTIARY EDUCATION IN PORTUGAL: BACKGROUND REPORT
20
Figure 1.10 – Survival rates in tertiary-type B education in OECD countries (2000)
a) - Survival rates in tertiary-type A education (mainly Portuguese ‘licenciatura’)
94 88
85 83 79 77 75 73 70 70 69 69 69 69 68
61 60 59 59
48 42
Japa
n
Turke
y
Irelan
d
United
Kingdo
mKore
aSpa
in
Finlan
d
Icelan
d
German
y
Countr
y mean
Mexico
Austra
lia
Denmark
Netherl
ands
Portug
al
Czech
Rep
ublic
Belgium
(Fl.)
Austria
France
Sweden Ita
ly
b) Survival rates in tertiary-type B education (Portuguese ‘Bacharelato’)
88 86 85 84 84 81
77 77 75 74 74 73 72
58 58 55 51 50
Belgium
(Fl.)
Japa
n
Sweden
Denmark
Poland
Mexico
Czech
Rep
ublic
Turke
y
German
ySpa
inKore
a
Countr
y mea
n
Franc
e
Portug
al
Netherla
nds
Icelan
dIta
ly
Irelan
d
Note: According to the OECD´s “survival rate index”, which quantifies the number of graduates divided by the number of new entrants in the typical year of entrance).
Source: OCES
Figure 1.11 presents measures of drop-out rates in public higher education, indicating comparatively lower drop-out rates in health sciences, with values increasing for most areas in recent years.

TERTIARY EDUCATION IN PORTUGAL: BACKGROUND REPORT
21
Figure 1.11 – Academic drop-out rates in public higher education for 2002 – 2004
0%
2%
4%
6%
8%
10%
12%
14%
16%
18%
Arts HealthSciences
Science &Technology
EducationSciences
Management& Economy
SocialSciences &Humanities
Agriculture
2001/02
2002/03
2003/04
Note: the “drop-out rate” represents the fraction of students enrolled that have left the programme without a diploma, as calculated in percentage of that year’s total enrolments.
Source: OCES
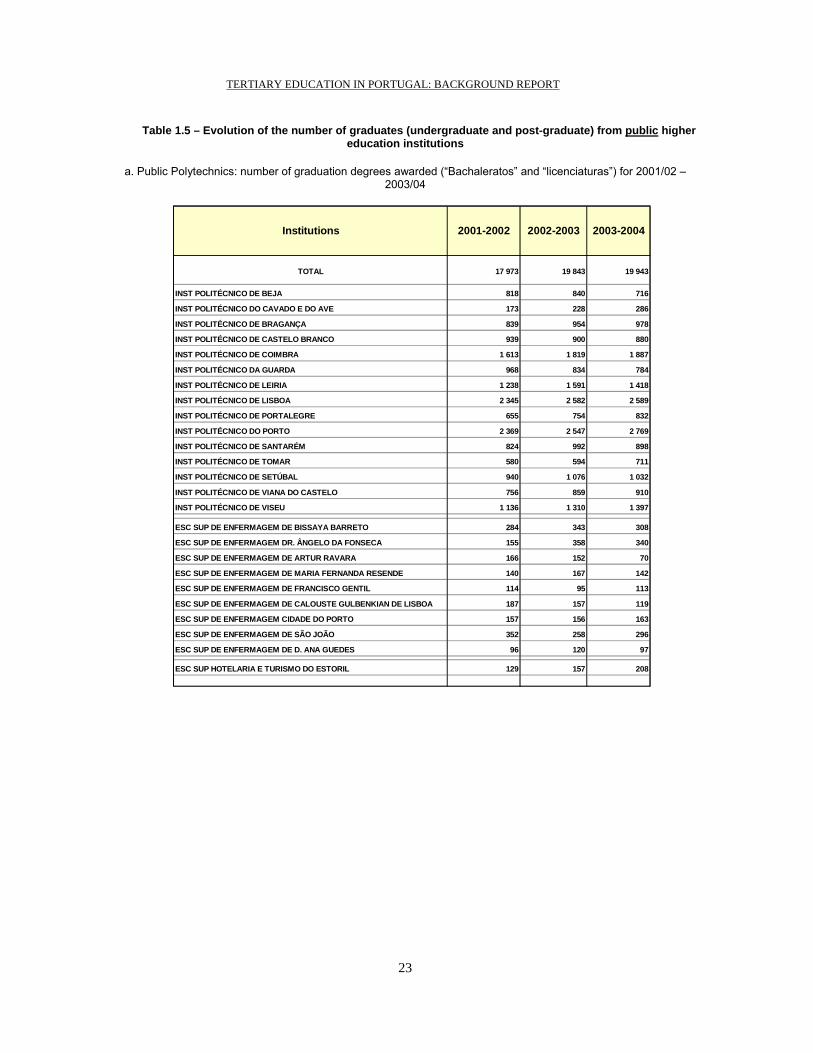
Table 1.5 quantifies the evolution of the number of graduates (undergraduate and post-graduate degrees) from higher education institutions in recent years and, for comparative purposes, Figure 1.12 shows the percentage of engineering graduates in the active population aged between 25 and 64 in several OECD countries throughout the 20th century. This indicator is clearly limited in scope, but confirms a considerable rate of growth since the 80’s, after a remarkable poor performance over most of the 20th century.

TERTIARY EDUCATION IN PORTUGAL: BACKGROUND REPORT
22
Figure 1.12 – Percentage of graduated engineers in active population aged between 25 and 64 years old in a selected group of OECD countries
0,00%
0,50%
1,00%
1,50%
2,00%
2,50%
3,00%
1900 1920 1940 1960 1980 2000
Portugal United States Ireland Belgium Germany
United States
Germany
Belgium Ireland
Portugal
Sources: Conceição and Heitor (2005). Primary data from: Germany - Bundesanstalt für Arbeit/German Federal Statistics Office/International Labour Organization; USA – U.S. Department of Labor, Department of Labor Statistics, Digest of Education Statistics, 2001, U.S. Education Department/International Labour Organization; BE – Statistics Belgium/ International Labour Organization; Ireland – Central Statistics Office/International Labour Organization; Portugal – Instituto Nacional de Estatística/DAPP/DGES/ International Labour Organization.
TERTIARY EDUCATION IN PORTUGAL: BACKGROUND REPORT
23
Table 1.5 – Evolution of the number of graduates (undergraduate and post-graduate) from public higher education institutions
a. Public Polytechnics: number of graduation degrees awarded (“Bachaleratos” and “licenciaturas”) for 2001/02 – 2003/04
17 973 19 843 19 943
INST POLITÉCNICO DE BEJA 818 840 716
INST POLITÉCNICO DO CAVADO E DO AVE 173 228 286
INST POLITÉCNICO DE BRAGANÇA 839 954 978
INST POLITÉCNICO DE CASTELO BRANCO 939 900 880
INST POLITÉCNICO DE COIMBRA 1 613 1 819 1 887
INST POLITÉCNICO DA GUARDA 968 834 784
INST POLITÉCNICO DE LEIRIA 1 238 1 591 1 418
INST POLITÉCNICO DE LISBOA 2 345 2 582 2 589
INST POLITÉCNICO DE PORTALEGRE 655 754 832
INST POLITÉCNICO DO PORTO 2 369 2 547 2 769
INST POLITÉCNICO DE SANTARÉM 824 992 898
INST POLITÉCNICO DE TOMAR 580 594 711
INST POLITÉCNICO DE SETÚBAL 940 1 076 1 032
INST POLITÉCNICO DE VIANA DO CASTELO 756 859 910
INST POLITÉCNICO DE VISEU 1 136 1 310 1 397
ESC SUP DE ENFERMAGEM DE BISSAYA BARRETO 284 343 308
ESC SUP DE ENFERMAGEM DR. ÂNGELO DA FONSECA 155 358 340
ESC SUP DE ENFERMAGEM DE ARTUR RAVARA 166 152 70
ESC SUP DE ENFERMAGEM DE MARIA FERNANDA RESENDE 140 167 142
ESC SUP DE ENFERMAGEM DE FRANCISCO GENTIL 114 95 113
ESC SUP DE ENFERMAGEM DE CALOUSTE GULBENKIAN DE LISBOA 187 157 119
ESC SUP DE ENFERMAGEM CIDADE DO PORTO 157 156 163
ESC SUP DE ENFERMAGEM DE SÃO JOÃO 352 258 296
ESC SUP DE ENFERMAGEM DE D. ANA GUEDES 96 120 97
ESC SUP HOTELARIA E TURISMO DO ESTORIL 129 157 208
TOTAL
2003-20042002-20032001-2002Institutions

TERTIARY EDUCATION IN PORTUGAL: BACKGROUND REPORT
24
b. Public Universities: number of graduation degrees awarded (“Bachaleratos” and “licenciaturas”) and post-graduate diplomas (non-degree specialisations, master
degrees, and doctorate degrees) for 2001/02 – 2003/04
Bacharelatos Bacharelatos BacharelatosLicenciaturas Licenciaturas Licenciaturas
Compl Form Compl Form Compl Form
19 675 907 1 865 642 23 089 20 949 1 112 2 382 813 25 256 21 173 1 249 2 534 854 25 810
UNIVERSIDADE DOS AÇORES 504 0 12 0 516 603 29 45 8 685 565 0 43 0 608
UNIVERSIDADE DO ALGARVE 1 735 6 23 15 1 779 1 610 0 70 13 1 693 1 751 57 67 24 1 899
UNIVERSIDADE DE AVEIRO 1 146 0 98 37 1 281 1 295 0 139 44 1 478 1 450 75 152 50 1 727
UNIVERSIDADE DA BEIRA INTERIOR 475 0 35 18 528 480 11 18 19 528 538 42 48 17 645
UNIVERSIDADE DE COIMBRA 2 447 95 169 52 2 763 2 655 72 267 93 3 087 2 437 53 265 69 2 824
UNIVERSIDADE DE ÉVORA 627 14 47 28 716 875 44 54 27 1 000 800 16 73 27 916
UNIVERSIDADE DE LISBOA 2 348 121 225 88 2 782 2 477 194 377 106 3 154 2 473 181 377 123 3 154
UNIVERSIDADE TÉCNICA DE LISBOA 2 208 290 310 142 2 950 2 254 354 348 143 3 099 2 255 362 368 129 3 114
UNIVERSIDADE NOVA DE LISBOA 1 208 118 166 49 1 541 1 326 116 197 93 1 732 1 476 86 183 107 1 852
UNIVERSIDADE DO MINHO 1 938 94 227 64 2 323 2 305 173 243 81 2 802 2 200 153 289 82 2 724
UNIVERSIDADE DO PORTO 2 594 169 450 132 3 345 2 756 117 436 130 3 439 2 908 217 472 150 3 747
UNIVERSIDADE TRAS-OS-MONTES E ALTO DOURO 1 328 0 14 0 1 342 1 232 0 48 24 1 304 1 204 0 54 32 1 290
UNIVERSIDADE DA MADEIRA 475 0 0 1 476 455 0 0 5 460 488 0 11 12 511
INST SUP DE CIÊNCIAS DO TRABALHO E DA EMPRESA 642 0 89 16 747 626 2 140 27 795 628 7 132 32 799
2003-20042002-2003
TOTAL TOTAL
TOTAL
Especializ Mestres (Master)
Doutor (PhD)
InstitutionsDoutor (PhD)
Mestres (Master)
Especializ
2001-2002
Doutor (PhD)
Mestres (Master)
Especializ TOTAL

TERTIARY EDUCATION IN PORTUGAL: BACKGROUND REPORT
25
According to the OECD (2005), Portugal has, after Turkey, the lowest share of the population aged 25-64 with at least an upper secondary education level. This share is about 20% for Portugal, while the OECD average is three times larger, at 60%. In the United States it is 76%, in Finland it is 67% and in Ireland it is 50%. In the Czech Republic almost 3/4 of the population aged 25-64 have at least an upper secondary education level.
Table 1.6 – Indicators of the qualification progress of the Portuguese population (%)
1961 1971 1981 1991 2001 Literacy rate 33 26 19 11 9 Students in higher education/population18-22 years old 4 7 11 23 53 Population with higher education 0.8 1.6 3.6 6.3 10 Schooling rate at 18 years of age - - 30 45 62
Sources: INE, General Population Census; Ministry of Education, GIASE, Education statistics
Table 1.7 summarises the latest available statistical data on the academic qualification of the Portuguese population aged 25-64. The deficit in qualifications, especially at the level of secondary education, was considered by many authors and analysts to be the most serious obstacle to the adoption of organisational structures that would allow greater labour flexibility and adaptation, associated with increasingly competitive markets, and scientific development.
Table 1.7 – Academic qualification 2001 (%)
No academic qualification 11 4 years of schooling 36 6 years of schooling 15 9 years of schooling 13 Upper secondary education (12 years of schooling) 13 Tertiary education 11 Others 1
Source: INE, 2001 Population census
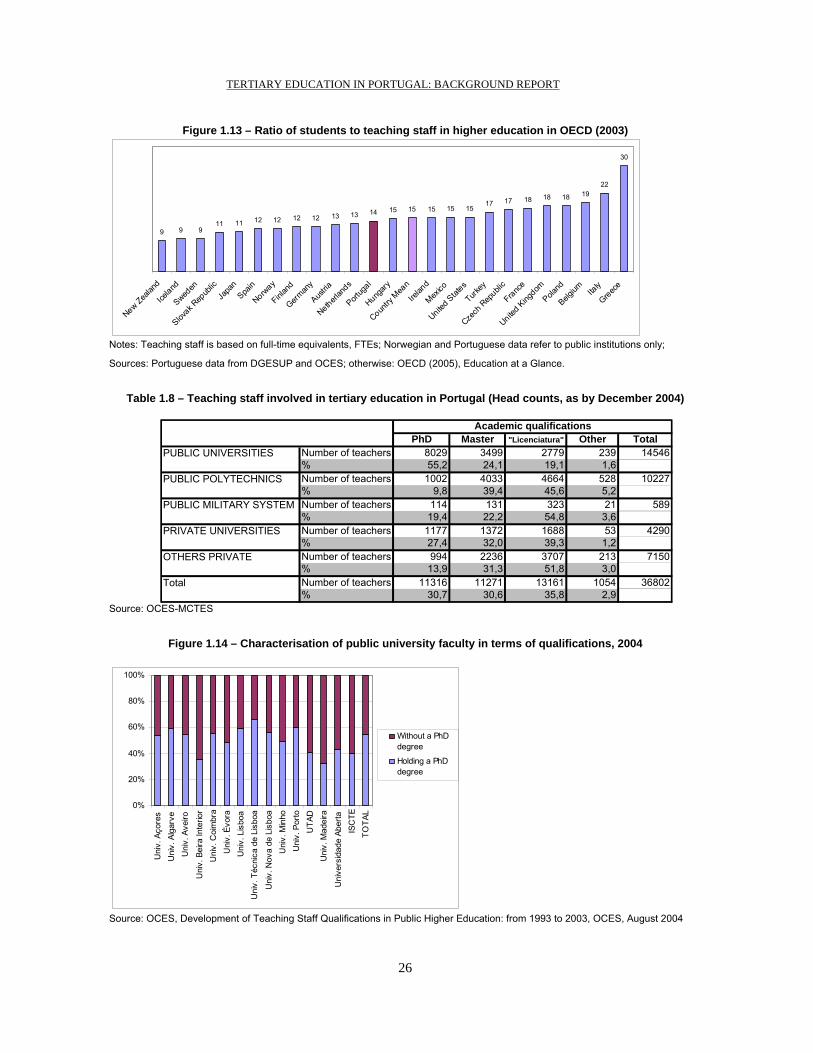
The issues raised in terms of the evolution of supply and demand in higher education should be complemented with the characterisation of the installed capacity, namely in terms of qualified human resources, and Figure 1.13 quantifies the relation student/teachers for various OECD countries. Any extrapolations should be done with caution, because of the diversified methodologies used, namely in the definition of the number of students, with some countries using “full time equivalent”, FTE.
Table 1.8 shows the qualifications of the teaching staff, as registered in December 2004. Teachers with a doctoral degree represent only 55% of the teaching staff in public universities (Figure 1.14), with values ranging from about 35% to 65% across the various public universities. If the total system of higher education is considered, PhD holders represent only 30% of the total number of teachers (Table 1.8).
TERTIARY EDUCATION IN PORTUGAL: BACKGROUND REPORT
26
Figure 1.13 – Ratio of students to teaching staff in higher education in OECD (2003)
9 9 9 11 11 12 12 12 12 13 13 14 15 15 15 15 15
17 17 18 18 18 19 22
30
New Zealan
d
Iceland
Sweden
Slovak R
epub
licJa
pan
Spain
Norway
Finlan
d
German
y
Austria
Netherlan
ds
Portug
al
Hungary
Country
Mea
n
Irelan
d
Mexico
United Stat
es
Turkey
Czech
Rep
ublic
France
United King
domPola
nd
Belgium Ita
ly
Greece
Notes: Teaching staff is based on full-time equivalents, FTEs; Norwegian and Portuguese data refer to public institutions only;
Sources: Portuguese data from DGESUP and OCES; otherwise: OECD (2005), Education at a Glance.
Table 1.8 – Teaching staff involved in tertiary education in Portugal (Head counts, as by December 2004)
PhD Master "Licenciatura" Other TotalNumber of teachers 8029 3499 2779 239 14546% 55,2 24,1 19,1 1,6Number of teachers 1002 4033 4664 528 10227% 9,8 39,4 45,6 5,2Number of teachers 114 131 323 21 589% 19,4 22,2 54,8 3,6Number of teachers 1177 1372 1688 53 4290% 27,4 32,0 39,3 1,2Number of teachers 994 2236 3707 213 7150% 13,9 31,3 51,8 3,0Number of teachers 11316 11271 13161 1054 36802% 30,7 30,6 35,8 2,9
Academic qualifications
PUBLIC UNIVERSITIES
Total
PUBLIC POLYTECHNICS
PUBLIC MILITARY SYSTEM
PRIVATE UNIVERSITIES
OTHERS PRIVATE
Source: OCES-MCTES
Figure 1.14 – Characterisation of public university faculty in terms of qualifications, 2004
0%
20%
40%
60%
80%
100%
Uni
v. A
çore
sU
niv.
Alg
arve
Uni
v. A
veiro
Uni
v. B
eira
Inte
rior
Uni
v. C
oim
bra
Uni
v. É
vora
Uni
v. L
isbo
aU
niv.
Téc
nica
de
Lisb
oa
Uni
v. N
ova
de L
isbo
aU
niv.
Min
hoU
niv.
Por
toU
TAD
Uni
v. M
adei
ra
Uni
vers
idad
e Ab
erta
ISC
TETO
TAL
Without a PhDdegree
Holding a PhDdegree
Source: OCES, Development of Teaching Staff Qualifications in Public Higher Education: from 1993 to 2003, OCES, August 2004

TERTIARY EDUCATION IN PORTUGAL: BACKGROUND REPORT
27
Figure 1.15 quantifies the number of PhDs granted by Portuguese Universities, revealing an increasing capability to offer PhD programmes, although the relative figures are still considerably low when compared internationally. For example, Table 1.9 shows that, in Portugal, a new PhD is awarded for 51 new graduates (as measured four years before), while the corresponding number for Spain is 30, and 9 and 7 for Holland and Germany, respectively. This comparison is important as it reveals the considerably small dimension of post-graduate education in Portugal, justifying the need to strengthen the research environments in universities. Beyond the need to reinforce post-graduate education, this issue also raises the need to build up internationalisation.
Figure 1.15 – PhDs concluded in Portugal, or abroad and recognised by Portuguese universities, in the period 1970-2002
0 100 200 300 400 500 600 700 800 900
1000
1970
1971
1972
1973
1974
1975
1976 19
77
1978
1979
1980
1981
1982
1983
1984
1985
1986
1987
1988
1989
1990
1991
1992
1993
1994
1995
1996
1997
1998
1999
2000
2001
2002
PhDs concluded in Portugal
PhDs concluded abroad Total
Source: Science and Higher Education Observatory, PhDs concluded or recognised by Portuguese Universities, April 2003; Official Journal (II Series): Semester break down of PhD diplomas obtained abroad and recognised in Portugal under Decree-Law 216/97, of 18 August; Director-general for Higher Education: Registry of PhDs obtained in the European University Institute of Florence under Decree-Law 93/96, of 16 July.
The continuous increase in the number of doctorates, especially when considering European and international figures, was systematically referred to by the generality of the evaluation panels that visited Portugal since 1996 in the context of international evaluations of R&D Centres as a decisive factor to guarantee the critical mass essential for scientific development (Heitor, 2000). It is also important to note that in 2001 Portugal was, for the first time in history, part of the group of the countries of excellence that contributed to the share of top 1% of the world’s highly cited publications (King, D.A. 2004). This is important because the number of citations by scientific paper are the best quality and impact measure of research produced by an individual, a group or, in this case, a country. Between 1997 and 2001, Portuguese researchers contributed with 96 publications to this restricted group, accounting for 0.25% of the overall figure. Naturally, the United States were in the leading position with 63% of the overall number of publications, followed by the UK with 13%. Spain was responsible for 2.08%, whereas Ireland and Greece accounted for 0.36% and 0.3%, respectively. Not only was the Portuguese presence relevant, but it also has significantly increased in the second half of the nineties (Figure 1.15). In fact, between 1993 and 1997, Portugal had contributed 0.12%, less than half of the contribution for the most recent period. It is worth mentioning that between 1991 and 2001, the total funding for R&D activities grew from 0.4% to 0.79% of the GDP, and that the annual flux of new PhD holders was nearly three times higher.

TERTIARY EDUCATION IN PORTUGAL: BACKGROUND REPORT
28
Table 1.9 – Relation between the annual flux of new graduates and doctorates
a) Average number of new graduates per each new PhD awarded in several countries
Country
Source of information
Number of new PhD’s/Year (Latest Available year, Y)
Number of new graduates/Year (4 years before Y)
New Graduates per each new PhD
Portugal OCES 1 068 54 255 51
Norway
Norway Statistics and NIFU STEP 855 29 376 34
Spain
Instituto Nacional de Estadística 6 936 208 543 30
United Kingdom
Higher Education Statistics Agency 10 660 233 610 22
Holland Statistics Netherlands 2 556 23 954 9
Germany
Federal Statistical Office 23 138 159 115 7
b) Number of new graduates per each new PhD awarded in Portugal for various scientific areas
Scientific Area New graduates in 1998 per each new PhD in 2002
New graduates in 1999 per each new PhD in 2003
New graduates in 2000 per each new PhD in 2004
Agriculture 22 30 30Arts & Humanities 234 473 404Social Sciences, Economics, Management & Law 69 67 58Education 155 169 166Sciences & Engineering 18 18 18Health and Social Protection 58 76 91Source: OCES
TERTIARY EDUCATION IN PORTUGAL: BACKGROUND REPORT
29
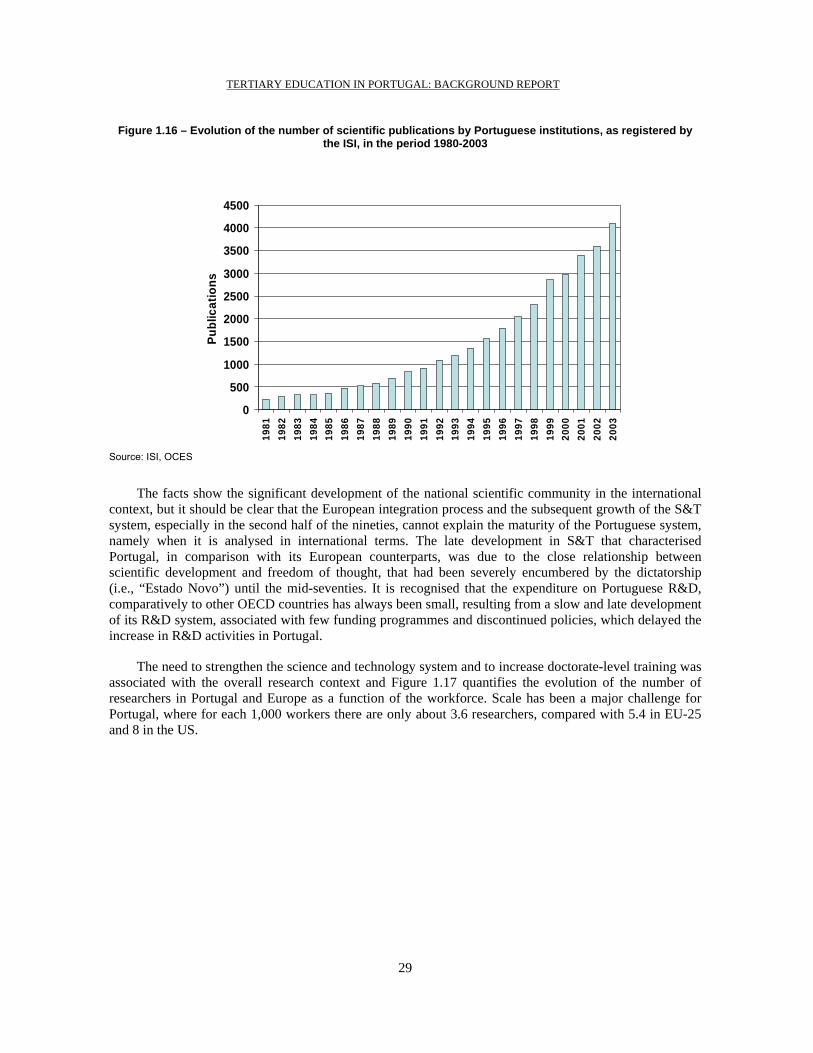
Figure 1.16 – Evolution of the number of scientific publications by Portuguese institutions, as registered by the ISI, in the period 1980-2003
0
500
1000
1500
2000
2500
3000
3500
4000
4500
1981
1982
1983
1984
1985
1986
1987
1988
1989
1990
1991
1992
1993
1994
1995
1996
1997
1998
1999
2000
2001
2002
2003
Publ
icat
ions
Source: ISI, OCES
The facts show the significant development of the national scientific community in the international context, but it should be clear that the European integration process and the subsequent growth of the S&T system, especially in the second half of the nineties, cannot explain the maturity of the Portuguese system, namely when it is analysed in international terms. The late development in S&T that characterised Portugal, in comparison with its European counterparts, was due to the close relationship between scientific development and freedom of thought, that had been severely encumbered by the dictatorship (i.e., “Estado Novo”) until the mid-seventies. It is recognised that the expenditure on Portuguese R&D, comparatively to other OECD countries has always been small, resulting from a slow and late development of its R&D system, associated with few funding programmes and discontinued policies, which delayed the increase in R&D activities in Portugal.
The need to strengthen the science and technology system and to increase doctorate-level training was associated with the overall research context and Figure 1.17 quantifies the evolution of the number of researchers in Portugal and Europe as a function of the workforce. Scale has been a major challenge for Portugal, where for each 1,000 workers there are only about 3.6 researchers, compared with 5.4 in EU-25 and 8 in the US.

TERTIARY EDUCATION IN PORTUGAL: BACKGROUND REPORT
30
Figure 1.17 – Evolution of the number of researchers (FTE, full time equivalent) in terms of the workforce for Portugal and Europe, in the period 1980-2003
Source: OCES
It should be noted that about 50% of the overall number of researchers (FTE; full time equivalent) work at higher education institutions and related R&D centres (Table 1.10), in a way that is very much specific of Portugal. In addition, 14% of the total number of researchers works at private, non-profit institutions, which are closely linked to higher education centres. These two groups represented in 2003 about 64% of the Portuguese researchers (FTE).
Table 1.10 – Distribution of researchers per type of institution in Portugal, 2001, 2003
Execution Sectors
Companies Government Higher Education Private, non-
profit Total
Personnel 2001 2003 2001 2003 2001 2003 2001 2003 2001 2003 Researchers H ead counting
4 625
6 102
5 211
5 027
17
276
19
906
4
034
4
820
31
146
35
855
FTE
2 721,9
3 793,9
3 646,4
3 439,6
8
941,6
10
062,4
2
415,2
2
946,1
17
725,1
20
242,0
% FTE / Head counts
15 21
21 19
50
57
14
17
100
100
Research ers (FTE)/ Workforce
(‰)
0,5 0,7
0,7 0,6
1,7
1,9
0,5
0,5
3,3
3,7
Total I&D personnel H ead counting
6 821 9 882
8 478 7 273
19 112
21 488
4 752
5 393
39 163
44 036
FTE
3
874,9
6 123,7 5 971,4
4 917,0
10 173,6
11 146,9
2 951,2
3 341,9
22 971,1
25 529,4
% FTE
/ Head counts 17
27 26
21
44
49
13
15
100
100 Total personnel
(FTE)/ Workforce (‰)
0,7
1,1 1,1
0,9
1,9
2,1
0,6
0,6
4,3
4,7
Source, OCES, IPCTN 2003
Beyond scale in science and technology, Table 1.11 refers to intensity figures and shows that the total funding available per researcher in Portugal in 2001 was only 1/3 of the European average (considering the new EU-25), while the average funding available for a university researcher in Europe was half of that for an American university researcher. Also, the gross expenditure in R&D per inhabitant in Portugal in 2001

TERTIARY EDUCATION IN PORTUGAL: BACKGROUND REPORT
31
was about 22% of the average value for EU-15, 26% for EU-25 and only 64% of the value for Spain. For comparison, the gross domestic product per capita for Portugal was in 2001 only about 75% of the average European value, confirming a considerably low investment in R&D for Portugal.
Table 1.11 – Expenditure in R&D per researcher (1000 € / FTE) and per inhabitant, 2001
Expenditure in R&D per Researcher
Gross expenditure
Business sector
Higher Education Government
Gross expenditure in R&D per inhabitant
1000 € / FTE € Poland 23 49 12 39 34 Hungary 37 54 24 30 53 Greece 54 101 38 86 73 Czech Rep. 55 87 31 41 80 Portugal 58 121 41 59 99 Turkey 60 125 50 35 - Spain 78 172 41 74 155 Finland 125 156 76 103 890 Ireland 139 151 111 130 309 UK 145 164 92 214 382 Belgian 153 201 90 127 450 Norway 154 165 137 144 675 UE-25 156 214 90 147 375 UE-15 171 225 103 170 442 France 180 239 94 205 525 Austria 180 183 168 228 420 USA 182 169 171 361 845 Holland 186 223 145 170 490 Denmark 188 254 121 132 666 Italy 188 239 150 165 215 Germany 199 236 121 186 628 Japan 212 245 103 404 1 133 Sweden 227 291 128 132 1 175 Switzerland 266 312 171 222 951
Sources: Conceição and Heitor, (2005); OECD (2004); Eurostat; http://europa.eu.int/comm/eurostat/
Notes: data on “PPS”, for 2001 or last year available (Austria, United Kingdom: 1998; Belgium, Denmark, Greece, USA: 1999; France, Ireland, Italy, Netherlands, UE-15, UE-25, Turkey, Switzerland: 2000); “FTE” refers to “full time equivalent”
2. The country at large
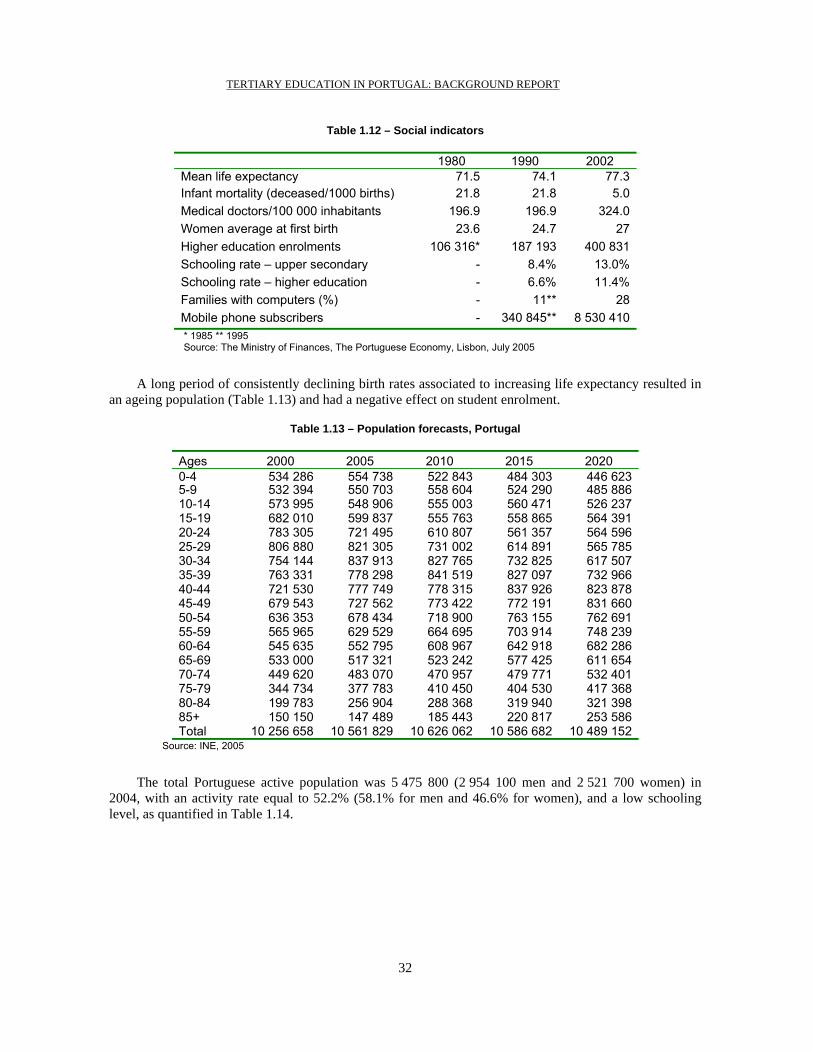
Portugal has a population of 10.4 million inhabitants (112.4 inhabitants/km2) and social indicators show steady progress in the last two decades (Table 1.12). The country is formed by three territorial areas: mainland (88 889 km2) and the archipelagos of the Azores (2 355 km2; nine islands) and Madeira (741 km2; two main islands).
TERTIARY EDUCATION IN PORTUGAL: BACKGROUND REPORT
32
Table 1.12 – Social indicators
1980 1990 2002 Mean life expectancy 71.5 74.1 77.3 Infant mortality (deceased/1000 births) 21.8 21.8 5.0 Medical doctors/100 000 inhabitants 196.9 196.9 324.0 Women average at first birth 23.6 24.7 27 Higher education enrolments 106 316* 187 193 400 831 Schooling rate – upper secondary d ti
- 8.4% 13.0% Schooling rate – higher education - 6.6% 11.4% Families with computers (%) - 11** 28 Mobile phone subscribers - 340 845** 8 530 410
* 1985 ** 1995 Source: The Ministry of Finances, The Portuguese Economy, Lisbon, July 2005
A long period of consistently declining birth rates associated to increasing life expectancy resulted in an ageing population (Table 1.13) and had a negative effect on student enrolment.
Table 1.13 – Population forecasts, Portugal
Ages 2000 2005 2010 2015 2020 0-4 534 286 554 738 522 843 484 303 446 623 5-9 532 394 550 703 558 604 524 290 485 886 10-14 573 995 548 906 555 003 560 471 526 237 15-19 682 010 599 837 555 763 558 865 564 391 20-24 783 305 721 495 610 807 561 357 564 596 25-29 806 880 821 305 731 002 614 891 565 785 30-34 754 144 837 913 827 765 732 825 617 507 35-39 763 331 778 298 841 519 827 097 732 966 40-44 721 530 777 749 778 315 837 926 823 878 45-49 679 543 727 562 773 422 772 191 831 660 50-54 636 353 678 434 718 900 763 155 762 691 55-59 565 965 629 529 664 695 703 914 748 239 60-64 545 635 552 795 608 967 642 918 682 286 65-69 533 000 517 321 523 242 577 425 611 654 70-74 449 620 483 070 470 957 479 771 532 401 75-79 344 734 377 783 410 450 404 530 417 368 80-84 199 783 256 904 288 368 319 940 321 398 85+ 150 150 147 489 185 443 220 817 253 586 Total 10 256 658 10 561 829 10 626 062 10 586 682 10 489 152
Source: INE, 2005
The total Portuguese active population was 5 475 800 (2 954 100 men and 2 521 700 women) in 2004, with an activity rate equal to 52.2% (58.1% for men and 46.6% for women), and a low schooling level, as quantified in Table 1.14.

TERTIARY EDUCATION IN PORTUGAL: BACKGROUND REPORT
33
Table 1.14 – Active population (%) by age group and qualification level Age range
Year None Basic 1st cyclea
Basic 2nd cycleb
Basic 3rd cyclec
Upper secondaryd
Higher education
1998 10.1 34.6 19.2 16.7 12.4 7.116-64 2004e 5.7 29.3 19.3 19.3 15.6 10.81998 2.2 7.5 29.2 36.2 22.2 2.815-24 2004e 1.0 3.5 20.7 42.5 28.4 3.91998 4.7 33.1 24.4 13.8 13.7 10.224-44 2004e 3.2 20.0 26.7 16.9 17.4 15.71998 21.9 54.2 6.2 7.4 4.4 6.045-64 2004e 11.2 54.7 9.2 10.2 6.4 8.3
Notes: a - 4 years of schooling b – 6 years c – 9 years d – 12 years e – First three trimesters
Source: INE, “Inquérito ao Emprego”
The Portuguese GDP (current prices) is 135 078 million euros (2004) and the per capita GNP (ppp) is 16 370 euros (2004), Tables 1.15 and 1.16.
Table 1.15 – Economic indicators, Portugal
Real GDP
Rate of change %
Difference to EU ppp
Work Productivity (ppp; EU = 100)
Inflation rate (%)
2002 0.4 -0.6 62.4 3.6
2003 -1.1 -2.0 59.8 3.3
2004 1.0 -1.4 59.0 2.4
2005a 0.8 -1.2 58.4 2.7
Notes: a – estimate, Ministry of Finances, Programa de Estabilidade e Crescimento 2005-9, July 2005
Sources: INE, Eurostat, European Commission, Bank of Portugal, Ministry of Finances
Table 1.16 – Per capita GDP
Per capita GDP, current prices Per capita GDP, current prices (in ppp)
EUR UE15 = 100 EUR UE15 = 100 1998 9 907 48.7 13 922 68.5 1999 10 620 49.8 14 979 70.2 2000 11 300 49.9 15 953 70.4 2001 11 931 51.1 16 481 70.6 2002 12 495 51.9 17 048 70.9 2003 12 536 51.6 16 727 68.8
ppp – purchasing power parity
Source: European Commission, AMECO data base, April 2004;
The evolution of the overall economic situation has negatively reflected upon the unemployment rate (Table 1.17) and some traditional sectors, such as the textile and shoe industries, have been badly hit by competition from emerging economies. As it has been recognised in various OECD documents, the population’s lack of qualifications is one of the factors that most contributes to the low Portuguese productivity in comparison with other OECD countries.

TERTIARY EDUCATION IN PORTUGAL: BACKGROUND REPORT
34
Table 1.17 – Labour market indicators
2003
2004
2005
Homologous change rates (%) Salaries implicit in collective
t t2.9 2.9 2.7
Work cost index1 3.0 1.6 3.5 Total employment -0.4 0.1 -0.3 Unemployment rate (%)2 6.3 6.7 7.5 Activity rate (15-64 years) (%)3 72.8 72.9 73.1
1 – Without the Public Administration;
2 – Unemployed population/Active population;
3 – Active population (15-64 years)/Total population (15-64 years)
Sources: INE, Ministry of Work and Social Security and Ministry of Finances
The Portuguese population is ageing. As a direct consequence of low birth rates combined with increasing life expectancy, the number of elderly people has been steadily increasing while the number of young people has been consistently decreasing. During the 1990s, the population of Continental Portugal lost 390 000 people of the “normal” age cohort expected to enrol in basic and in upper secondary education. Population forecasts made by the National Institute of Statistics (INE) for 2006 show that the situation will not significantly change in the near future, Table 1.183. So far the effects of immigration have not compensated this phenomenon.
Table 1.18 shows that, for 2006, the number of students in the second cycle of basic education (10-11 years), or in the third cycle (12-14 years) and in upper secondary education (15-17 years) was lower than in 2001 by up to 12%. There was a slight increase relative to 2001 only for the age group 6-9 years (first cycle of basic education).
Table 1.18 – Population by age groups (mainland Portugal)
Age interval 1991 (1) 2001 (2) �� �� � (%) 2006* (3) � � �� � � (%)
6 – 9 494 495 406 428 -88 067 -18 410 199 +3 771 +110 - 11 277 757 213 368 -64 389 -23 199 680 -13 688 -612 - 14 457 871 330 128 -127 743 -28 315 292 -14 836 -415 - 17 484 535 372 523 -112 012 -23 328 660 -43 863 -12Total: 6 – 17 1 714 658 1 322 447 -392 211 -23 1 253 -68 616 -5
* estimates
Sources: XIII and XIV Population census, INE
3 The 2006 estimate includes both the resident population (by age intervals, data from 2001) and the migratory flows. It was assumed that all the individuals below 12 years of age have survived until 2006, as mortality is very low at this age, and that migration flows, which in the 1990s have resulted in a net population increase of 405,000 people, will continue at the same rate over the next lustrum, originating an additional increase of 202,500 people and were divided following a specified age structure).

TERTIARY EDUCATION IN PORTUGAL: BACKGROUND REPORT
35
The importance of the population decrease is not the same for all age groups, due to changes in the birth rates. Until 1995 there was a consistent decline in the number of births (although this decline was very low between 1990 and 1993), followed by a five year period (1996 to 2000) of increase in the annual number of births. This explains that the most significant population decrease from 2001 to 2006 occurred for the population older than 15 years. The ageing of the population also explains the illiteracy rate’s slow decrease, which has only fallen from 11% to 9% between 1991 and 2001. Indeed, it is among individuals older than 65 years that the illiteracy percentage is highest (Table 1.19), while among the younger age groups the illiteracy rate is negligible. In 1991 the number of people aged 15 years or less was 1.5 times higher than those aged 65 years and more. However, in 2001 this relation was reversed, with the number of older people surpassing the number of younger people.
Table 1.19 – People (%) without any schooling, by age groups (Portugal) – 2001
25-29 30-34 35-39 40-44 45-49 50-54 55-59 60-64 65-69 70-74 75+ Total 1.0 1.4 1.5 1.8 2.3 2.9 6.0 18.7 25.8 31.2 42.2 Men 1.1 1.5 1.7 1.9 2.1 2.5 4.3 13.1 18.8 23.4 31.5 Women 0.9 1.2 1.4 1.8 2.4 3.4 7.6 23.5 31.6 37.2 48.7
Source: XIV Population census, INE
The highest proportion of illiterate people is observed for women, mainly above 60 years old. For people aged over 75 years, almost half of the women are illiterate against a third of the men.
3. The duality of the Portuguese society
It is important to note that the deficiency in the level of qualifications in the Portuguese population is not due to differences in levels of achievement in university or tertiary education. In fact, while the share of the Portuguese population with university education is low (about 9%), it is only about half of the OECD average, and is comparable to that of countries such as Italy and Austria. This reveals a duality of Portuguese society that looking at average and aggregate numbers may obscure (Conceição and Heitor 2005).
Figure 1.18 shows that, for the entire population, Portugal exhibits one of the lowest scores in average literacy, as measured by OECD. But the low literacy levels do not seem to be dramatically punished by the economy, as Portugal has one of the highest levels of labour participation for people with the lowest level of literacy (Figure 1.19). This is partially explained by the overall high rate of labour participation in Portugal (note the high figure for the United States and Switzerland as well), but the low unemployment rate is not the only explanation (compare with the Netherlands and Ireland). Part of the reason may be associated with the demands of large sectors of the economy, which so far have not required advanced skills, or even literacy.

TERTIARY EDUCATION IN PORTUGAL: BACKGROUND REPORT
36
Figure 1.18 – Average Literacy Survey Results in OECD Countries4
200 220 240 260 280 300 320
Chile
Portugal
Poland
Slovenia
Irland
UK
Hungary
New Zealand
US
Australia
Canada
Belgium
Finland
Netherlands
Germany
Norway
Czech Republic
Denmark
Sweden
Average Score (0-500), Population Age 16-65 Years, 1994-1998
QuantitativeReadingWriting
Figure 1.19 – Labour Force Participation of the Population Segment with the Lowest Level of Literacy in OECD Countries4
0 10 20 30 40 50 60 70 80 90 100
Netherlands
Ireland
Germany
Belgium
Hungary
Australia
Poland
Chile
Canada
New Zealand
UK
Finland
Denmark
Norway
Slovenia
Sweden
Czech Republic
US
Portugal
Switzerland
Labor Force Participation (%), Population Age 25-65 Years with the Lowest Level of Document Literacy
The duality of the Portuguese society clearly emerges after dividing the overall population into finer
segments. As an example, consider only young people that are relatively educated (20 to 25 years of age
4 Primary data obtained from OECD (2002). See Conceição and Heitor (2005), for details and related analysis.

TERTIARY EDUCATION IN PORTUGAL: BACKGROUND REPORT
37
with upper secondary education). For this segment of the population, Portugal ranks on a par with the Netherlands, Germany and Norway, Figure 1.20.
Figure 1.20 – Literacy Scores of People Aged 20-25 Years and with Upper Secondary Education in OECD Countries5
200 220 240 260 280 300 320 340
Chile
Hungary
Poland
US
Slovenia
Irland
New Zealand
UK
Australia
Canada
Czech Republic
Denmark
Belgium
Norway
Germany
Portugal
Netherlands
Sweden
Finland
Average Literacy Score (0-500), Population Age 20-25 Years with Upper Secondary Education
Figure 1.21 compares the share of university degrees in various OECD countries (2003), illustrating
the relative weakness of the Portuguese society in terms of technical qualifications (considering both engineering and natural sciences), which to a large extent can be explained by the high school retention rates in these areas of study. Comparable 1st year enrolments reached 25% (against 19% of degrees), which was approximately Switzerland’s position, and quite close to the European average. But looking at Portugal in an international context does require considering both absolute and relative figures, so that the scale and intensity are taken into account over time.
5 see footnote 4.

TERTIARY EDUCATION IN PORTUGAL: BACKGROUND REPORT
38
Figure 1.21 – National shares of university degrees among different fields (2003)
0% 20% 40% 60% 80% 100%
EUUnited States
PortugalSpain
The NetherlandsCanadaTurkeyGreece
ItalySwitzerland
JapanUnited Kingdom
AustriaMexico
GermanyFinland
HungaryCzech Republic
SwedenFrance
DenmarkIreland
Distribution of University Degrees per Scientific Areas
Basic sciencesEngineeringSocial sciencesOthers
Source: National Science Foundation.
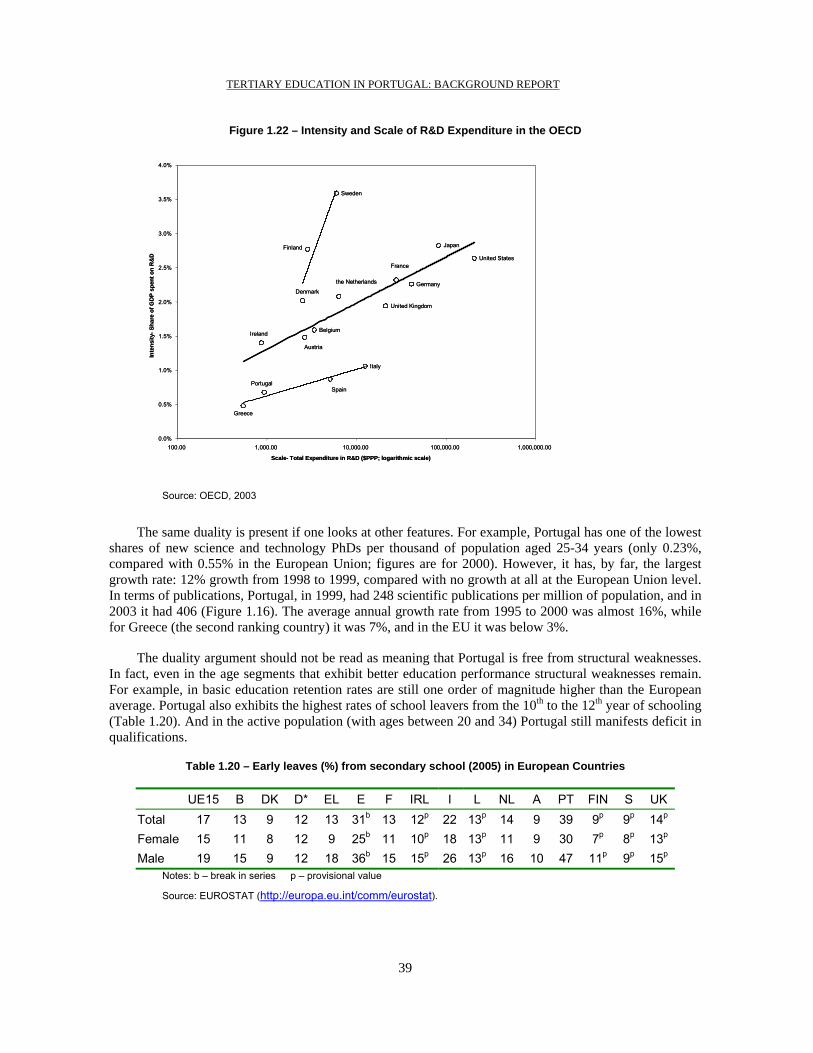
Duality is also present when one looks at science and technology indicators. Figure 1.22 shows both the scale and the intensity of national expenditures on R&D for several OECD countries, with the horizontal axis, representing the scale of the expenditure, on a logarithmic scale. The relationship between scale and intensity shows decreasing returns: as the scale of the investment grows, the increase in intensity also grows but at a decreasing (in fact, logarithmic) rate. The results also suggest that there are three different “paths” in which this relationship is expressed. The thick line in Figure 1.22 represents a simple fitting of the position of most countries. Nordic countries have a path of their own, with a much higher responsive intensity to increases in scale. Portugal is shown in the lower left-hand corner of the figure, part of a line that includes other Southern European countries.
The duality is manifest when one looks not at static comparisons of levels, but at dynamic comparisons of rates of change. Portugal shows one of the largest increases on R&D gross domestic expenditure of all OECD countries from 1995 to 2000. During this five-year period, R&D expenditure grew at an annual rate of 10% in Portugal, while in the European Union as a whole it grew at a 3% annual rate. This growth represented a recovery from the slowdown of 1991-1995, when the Portuguese R&D expenditure grew only 3.8%, while from 1985 to 1990 it grew 14%.
TERTIARY EDUCATION IN PORTUGAL: BACKGROUND REPORT
39
Figure 1.22 – Intensity and Scale of R&D Expenditure in the OECD
Sweden
Finland Japan
France
Germanythe Netherlands
Denmark
United Kingdom
United States
Belgium
Austria
Ireland
Italy
SpainPortugal
Greece
0.0%
0.5%
1.0%
1.5%
2.0%
2.5%
3.0%
3.5%
4.0%
100.00 1,000.00 10,000.00 100,000.00 1,000,000.00
Scale- Total Expenditure in R&D ($PPP; logarithmic scale)
Inte
nsity
-Sha
re o
f GD
P sp
ent o
n R
&D
Source: OECD, 2003
The same duality is present if one looks at other features. For example, Portugal has one of the lowest shares of new science and technology PhDs per thousand of population aged 25-34 years (only 0.23%, compared with 0.55% in the European Union; figures are for 2000). However, it has, by far, the largest growth rate: 12% growth from 1998 to 1999, compared with no growth at all at the European Union level. In terms of publications, Portugal, in 1999, had 248 scientific publications per million of population, and in 2003 it had 406 (Figure 1.16). The average annual growth rate from 1995 to 2000 was almost 16%, while for Greece (the second ranking country) it was 7%, and in the EU it was below 3%.
The duality argument should not be read as meaning that Portugal is free from structural weaknesses. In fact, even in the age segments that exhibit better education performance structural weaknesses remain. For example, in basic education retention rates are still one order of magnitude higher than the European average. Portugal also exhibits the highest rates of school leavers from the 10th to the 12th year of schooling (Table 1.20). And in the active population (with ages between 20 and 34) Portugal still manifests deficit in qualifications.
Table 1.20 – Early leaves (%) from secondary school (2005) in European Countries
UE15 B DK D* EL E F IRL I L NL A PT FIN S UK
Total 17 13 9 12 13 31b 13 12p 22 13p 14 9 39 9p 9p 14p
Female 15 11 8 12 9 25b 11 10p 18 13p 11 9 30 7p 8p 13p
Male 19 15 9 12 18 36b 15 15p 26 13p 16 10 47 11p 9p 15p
Notes: b – break in series p – provisional value
Source: EUROSTAT (http://europa.eu.int/comm/eurostat).

TERTIARY EDUCATION IN PORTUGAL: BACKGROUND REPORT
40
To conclude, there is a wide diversity of performance across the Portuguese society and economy. Averages are low, but they may be misleading, since there is large dispersion across cohorts. Portugal can be characterised as exhibiting a dual nature, with high levels of performance co-existing with low levels. This, however, does not mean that it is enough to hope for the best-performing cohorts to “take over” the low-performing ones, since structural weaknesses remain and may affect even the best performing sectors.
4. The education system: from basic to higher education
Figure 1.23 presents a schematic diagram of the Portuguese educational system, as by January 2006, which includes the following components:
• Pre-school education (i.e., "educação pré-escolar") complements and/or supplements the role the family plays in early learning for children aged 3 to 6. Attendance is optional.
• Basic education (i.e., "ensino básico") lasts 9 years and begins at 6 years of age. The education programme at this level aims to provide all individuals with general and common education, enabling them to continue to higher levels of education or to join programmes geared to working life. Basic education involves three successive cycles: 1st cycle of 4 years, 2nd cycle of 2 years, and a 3rd cycle of 3 years. There is also a system of basic education for adults (i.e., "ensino básico recorrente") that provides a second opportunity to those who failed to complete their education at the usual age, or who dropped out of school early, or to those seeking cultural or professional improvement.
• Secondary education in Portugal (i.e., "ensino secundário") corresponds to what in Europe is currently called "Upper Secondary Education". It is structured in different ways to provide general programmes (i.e., "cursos gerais"), aimed at those wishing to continue to higher education, and other programmes aimed at those seeking to enter the labour market. Students may change from one programme to another. Each of these programmes lasts three years, corresponding to the 10th, 11th and 12th grades of school.

TERTIARY EDUCATION IN PORTUGAL: BACKGROUND REPORT
41
Figure 1.23 – Diagrammatic representation of the Portuguese education system, as by January 2006, before the implementation of the Bologna Process
PRE-SCHOOL EDUCATION
1st CYCLE
BA
SIC
ED
UCA
TIO
N
1st 2nd 3rd 4th
2nd CYCLE 5th 6th
3rd CYCLE 7th 8th 9th
General Courses
Techonology. Courses
Vocational Courses
Specialised artistic
education 10th 11th 12th SECONDARY
EDUCATION
University education Polytechnic education
Licenciatura 4-6 years
1st cycle Bacharelato 3 years
2nd cycle Licenciatura
Mestrado
Doutoramento
3-6
6-9
10-1
1 12
-14
15-1
7 18
-20
21-2
3
Source: Estia, 2003, http://www.des.min-edu.pt/estia/edu/diagindex.html
Technological programmes represent only 22% of regular upper secondary education, which contrasts with the situation in most European countries where vocational-type education represents in general more than 50% of the number of students.
Table 1.21 – Number of students enrolled in secondary education in 2005/06
Total Public Private General 175 154 158 290 16 864 Technological 49 800 44 114 5 686 Specialised artistic 2 063 1 948 115 Professional 33 341 3 607 29 734 Qualifying 3 103 2 411 692 Recurrent 61 660 54 277 7 383 Total 325 121 264 647 60 474
Source: Ministry of Education, 2006
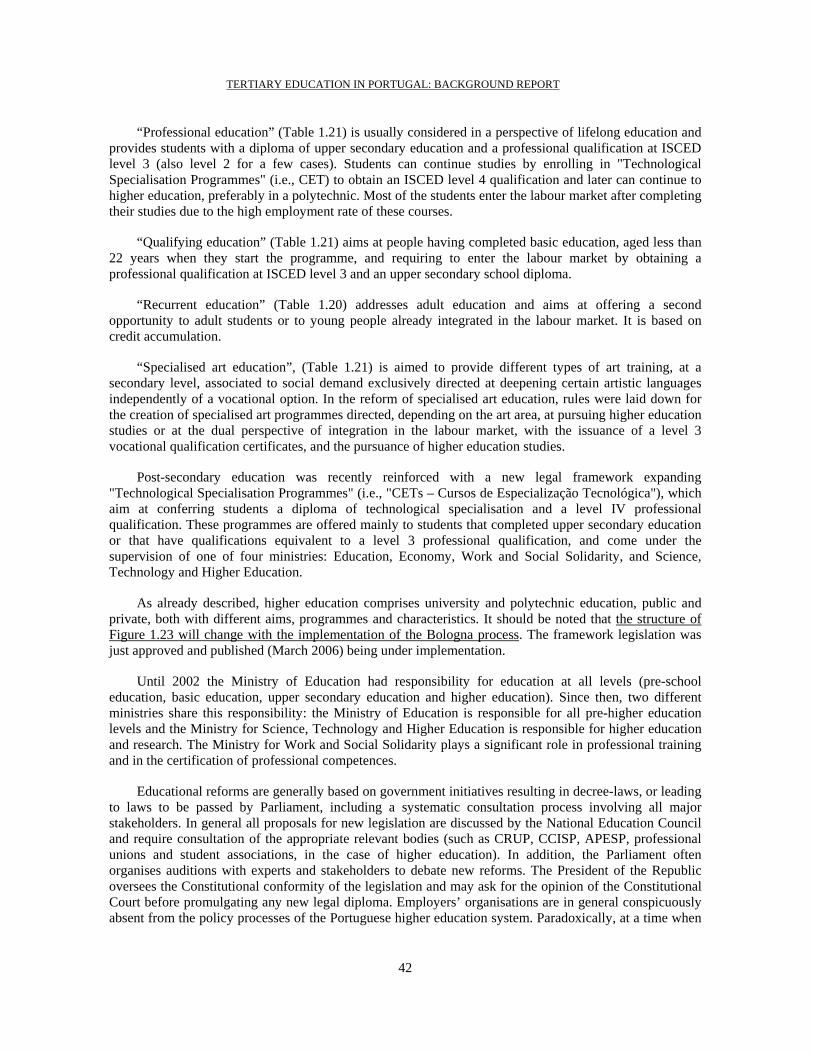
TERTIARY EDUCATION IN PORTUGAL: BACKGROUND REPORT
42
“Professional education” (Table 1.21) is usually considered in a perspective of lifelong education and provides students with a diploma of upper secondary education and a professional qualification at ISCED level 3 (also level 2 for a few cases). Students can continue studies by enrolling in "Technological Specialisation Programmes" (i.e., CET) to obtain an ISCED level 4 qualification and later can continue to higher education, preferably in a polytechnic. Most of the students enter the labour market after completing their studies due to the high employment rate of these courses.
“Qualifying education” (Table 1.21) aims at people having completed basic education, aged less than 22 years when they start the programme, and requiring to enter the labour market by obtaining a professional qualification at ISCED level 3 and an upper secondary school diploma.
“Recurrent education” (Table 1.20) addresses adult education and aims at offering a second opportunity to adult students or to young people already integrated in the labour market. It is based on credit accumulation.
“Specialised art education”, (Table 1.21) is aimed to provide different types of art training, at a secondary level, associated to social demand exclusively directed at deepening certain artistic languages independently of a vocational option. In the reform of specialised art education, rules were laid down for the creation of specialised art programmes directed, depending on the art area, at pursuing higher education studies or at the dual perspective of integration in the labour market, with the issuance of a level 3 vocational qualification certificates, and the pursuance of higher education studies.
Post-secondary education was recently reinforced with a new legal framework expanding "Technological Specialisation Programmes" (i.e., "CETs – Cursos de Especialização Tecnológica"), which aim at conferring students a diploma of technological specialisation and a level IV professional qualification. These programmes are offered mainly to students that completed upper secondary education or that have qualifications equivalent to a level 3 professional qualification, and come under the supervision of one of four ministries: Education, Economy, Work and Social Solidarity, and Science, Technology and Higher Education.
As already described, higher education comprises university and polytechnic education, public and private, both with different aims, programmes and characteristics. It should be noted that the structure of Figure 1.23 will change with the implementation of the Bologna process. The framework legislation was just approved and published (March 2006) being under implementation.
Until 2002 the Ministry of Education had responsibility for education at all levels (pre-school education, basic education, upper secondary education and higher education). Since then, two different ministries share this responsibility: the Ministry of Education is responsible for all pre-higher education levels and the Ministry for Science, Technology and Higher Education is responsible for higher education and research. The Ministry for Work and Social Solidarity plays a significant role in professional training and in the certification of professional competences.
Educational reforms are generally based on government initiatives resulting in decree-laws, or leading to laws to be passed by Parliament, including a systematic consultation process involving all major stakeholders. In general all proposals for new legislation are discussed by the National Education Council and require consultation of the appropriate relevant bodies (such as CRUP, CCISP, APESP, professional unions and student associations, in the case of higher education). In addition, the Parliament often organises auditions with experts and stakeholders to debate new reforms. The President of the Republic oversees the Constitutional conformity of the legislation and may ask for the opinion of the Constitutional Court before promulgating any new legal diploma. Employers’ organisations are in general conspicuously absent from the policy processes of the Portuguese higher education system. Paradoxically, at a time when
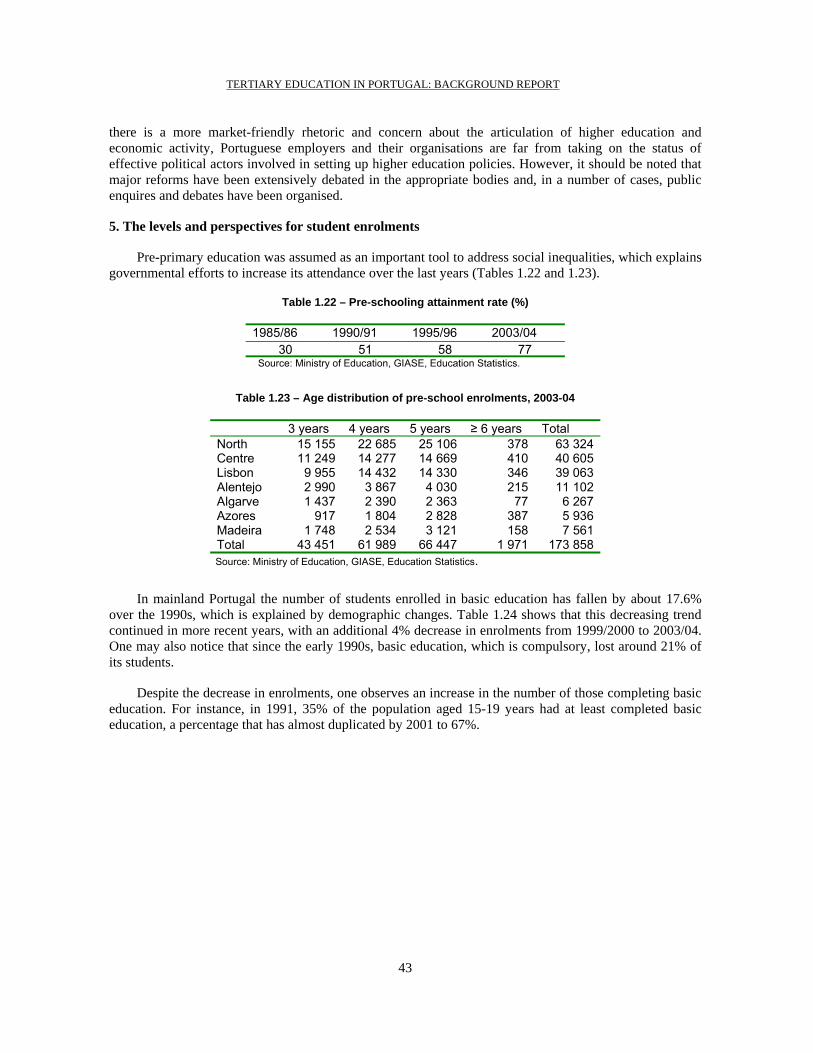
TERTIARY EDUCATION IN PORTUGAL: BACKGROUND REPORT
43
there is a more market-friendly rhetoric and concern about the articulation of higher education and economic activity, Portuguese employers and their organisations are far from taking on the status of effective political actors involved in setting up higher education policies. However, it should be noted that major reforms have been extensively debated in the appropriate bodies and, in a number of cases, public enquires and debates have been organised.
5. The levels and perspectives for student enrolments
Pre-primary education was assumed as an important tool to address social inequalities, which explains governmental efforts to increase its attendance over the last years (Tables 1.22 and 1.23).
Table 1.22 – Pre-schooling attainment rate (%)
1985/86 1990/91 1995/96 2003/04 30 51 58 77
Source: Ministry of Education, GIASE, Education Statistics.
Table 1.23 – Age distribution of pre-school enrolments, 2003-04
3 years 4 years 5 years ≥ 6 years Total North 15 155 22 685 25 106 378 63 324 Centre 11 249 14 277 14 669 410 40 605 Lisbon 9 955 14 432 14 330 346 39 063 Alentejo 2 990 3 867 4 030 215 11 102 Algarve 1 437 2 390 2 363 77 6 267 Azores 917 1 804 2 828 387 5 936 Madeira 1 748 2 534 3 121 158 7 561 Total 43 451 61 989 66 447 1 971 173 858
Source: Ministry of Education, GIASE, Education Statistics.
In mainland Portugal the number of students enrolled in basic education has fallen by about 17.6% over the 1990s, which is explained by demographic changes. Table 1.24 shows that this decreasing trend continued in more recent years, with an additional 4% decrease in enrolments from 1999/2000 to 2003/04. One may also notice that since the early 1990s, basic education, which is compulsory, lost around 21% of its students.
Despite the decrease in enrolments, one observes an increase in the number of those completing basic education. For instance, in 1991, 35% of the population aged 15-19 years had at least completed basic education, a percentage that has almost duplicated by 2001 to 67%.
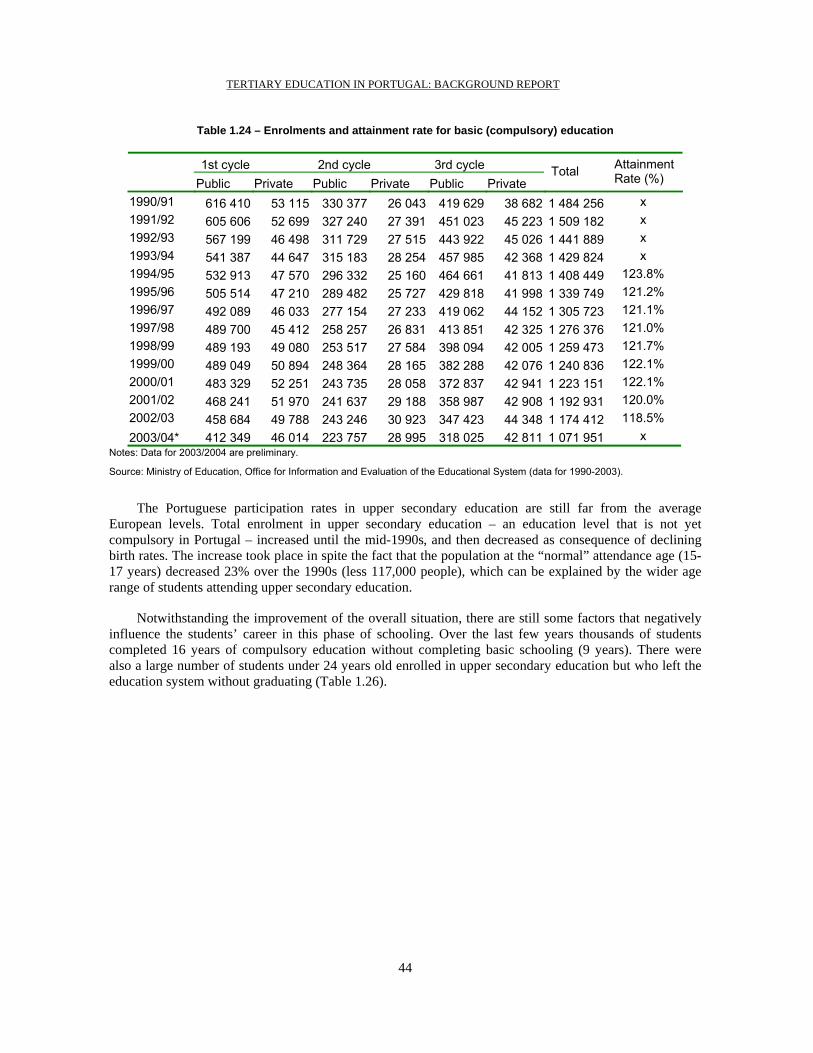
TERTIARY EDUCATION IN PORTUGAL: BACKGROUND REPORT
44
Table 1.24 – Enrolments and attainment rate for basic (compulsory) education
1st cycle 2nd cycle 3rd cycle Public Private Public Private Public Private
Total Attainment Rate (%)
1990/91 616 410 53 115 330 377 26 043 419 629 38 682 1 484 256 x 1991/92 605 606 52 699 327 240 27 391 451 023 45 223 1 509 182 x 1992/93 567 199 46 498 311 729 27 515 443 922 45 026 1 441 889 x 1993/94 541 387 44 647 315 183 28 254 457 985 42 368 1 429 824 x 1994/95 532 913 47 570 296 332 25 160 464 661 41 813 1 408 449 123.8% 1995/96 505 514 47 210 289 482 25 727 429 818 41 998 1 339 749 121.2% 1996/97 492 089 46 033 277 154 27 233 419 062 44 152 1 305 723 121.1% 1997/98 489 700 45 412 258 257 26 831 413 851 42 325 1 276 376 121.0% 1998/99 489 193 49 080 253 517 27 584 398 094 42 005 1 259 473 121.7% 1999/00 489 049 50 894 248 364 28 165 382 288 42 076 1 240 836 122.1% 2000/01 483 329 52 251 243 735 28 058 372 837 42 941 1 223 151 122.1% 2001/02 468 241 51 970 241 637 29 188 358 987 42 908 1 192 931 120.0% 2002/03 458 684 49 788 243 246 30 923 347 423 44 348 1 174 412 118.5% 2003/04* 412 349 46 014 223 757 28 995 318 025 42 811 1 071 951 x
Notes: Data for 2003/2004 are preliminary.
Source: Ministry of Education, Office for Information and Evaluation of the Educational System (data for 1990-2003).
The Portuguese participation rates in upper secondary education are still far from the average European levels. Total enrolment in upper secondary education – an education level that is not yet compulsory in Portugal – increased until the mid-1990s, and then decreased as consequence of declining birth rates. The increase took place in spite the fact that the population at the “normal” attendance age (15-17 years) decreased 23% over the 1990s (less 117,000 people), which can be explained by the wider age range of students attending upper secondary education.
Notwithstanding the improvement of the overall situation, there are still some factors that negatively influence the students’ career in this phase of schooling. Over the last few years thousands of students completed 16 years of compulsory education without completing basic schooling (9 years). There were also a large number of students under 24 years old enrolled in upper secondary education but who left the education system without graduating (Table 1.26).

TERTIARY EDUCATION IN PORTUGAL: BACKGROUND REPORT
45
Table 1.25 – Upper secondary education – enrolments
Year Public Private Total 1990/91 318 239 29 672 347 911 1991/92 360 924 40 339 401 263 1992/93 367 083 48 778 415 861 1993/94 385 348 52 952 438 300 1994/95 400 102 57 092 457 194 1995/96 416 309 60 912 477 221 1996/97 398 166 60 066 458 232 1997/98 382 261 60 522 442 783 1998/99 362 143 58 862 421 005 1999/00 354 832 62 873 417 705 2000/01 344 135 69 613 413 748 2001/02 326 045 71 487 397 532 2002/03 316 848 68 741 385 589 2003/04* 283 678 62 314 345 992
* Only for the mainland
Source: Ministry of Education, GIASE, 2005
Table 1.26 – Population aged 18-24 years, not enrolled in education, 1991-2001.
1991 2001
n % n %
Total population, 18-24 years 1 097 208 100 1 083 320 100Without completing the 3rd cycle of basic education
594 004 54 266 052 25
Without completing upper secondary education 104 560 10 219 155 20Total, < upper secondary education 698 564 64 485 207 45
Source: INE, General Population Census, 1991 and 2001
Each year a significant number of students with low education level will enter segments of the labour market that employ workers with low qualifications. These young people will most likely not return to the education system to complete secondary school. One of the possible reasons for the lack of attractiveness of secondary education is the predominantly academic character of this education level. Indeed, most of the upper secondary education provision aims at providing a route to enter higher education, with only less than 30% having technological or vocational emphasis.
Table 1.27 shows that in 2001 the drop-out rate (abandonment rate)6 in basic education was no longer significant, but anticipated leaves7 and early leaves8 were still a major problem. Furthermore, persistently high retention rates in upper secondary education continued to be around 35% since 1995 (Table 1.28).
6 Drop-out rate (%) – students in the compulsory education age (6-15 years) leaving the education system
without completing compulsory education (9 years) for every 100 people in that age range.

TERTIARY EDUCATION IN PORTUGAL: BACKGROUND REPORT
46
Table 1.27 – Abandonment rates, anticipated leaves and early leaves (%)
1991 2001 Abandonment rates 13 3Anticipated leaves 54 25Early leaves 64 45
Source: INE, General Population Census, 1991 and 2001
Table 1.28 – Evolution of retention rates and drop-outs
95/96 96/97 97/98 98/99 99/00 00/01 01/02 02/03 Basic education 13.8 15.2 13.8 13.2 12.6 12.7 13.6 13.0Upper secondary 33.1 35.7 35.6 36.0 36.8 39.4 37.4 33.7
Source: Ministry of Education, GIASE, Education Statistics
The highest percentage of retention and drop-out occurs in the first year of every cycle and it is especially significant in the 10th grade, which marks the transition from basic education to upper secondary education.
The present government’s recent initiative of the “New Opportunity Programme” includes a set of actions aiming at improving the qualification of the Portuguese population and developing lifelong learning. These objectives are an integral component of the national effort under the EU Lisbon Strategy and consider the following goals:
• Increase the offer of vocational education in upper secondary education to enrol an additional number of 100,000 students. By 2010 vocational education should represent 50% of the total offer of upper secondary education, the other 50% corresponding to general education leading directly to higher education.
Table 1.29 – Estimated increase of vocational education in upper secondary education
2005 2006 2007 2008 2009 2010 Additional vacancies + 5 000 +5 000 +10 000 +10 000 +5 000Accumulated new +5 000 +10 000 +20 000 +30 000 +35 000Total yearly vacancies 110 000 115 000 120 000 130 000 140 000 145 000
Source: Ministry of Education and Ministry of Work and Social Solidarity, Programme New Opportunities
• Offer a new opportunity to students that would leave the education system before completing basic education. Until 2010 there will be an adequate number of vacancies in vocational programme offering an alternative route for the completion of basic education.
7 Anticipated leave (%) – students in the age range 18-24 years that have left the education system without
completing compulsory education for every 100 people in that age range. 8 Early leaves (%) – students in the age range 18-24 years that have left the education system without
completing upper secondary education (12 years) for every 100 people in that age range.

TERTIARY EDUCATION IN PORTUGAL: BACKGROUND REPORT
47
Table 1.30 – Estimated increase in the supply of vocational education in basic education
2005 2006 2007 2008 2009 2010 Additional vacancies +2 500 +2 500 +2 500 +2 500 +2 500Accumulated new +2 500 +5 000 +7 500 +10 000 +12 500Total yearly vacancies 15 000 17 500 20 000 22 500 25 000 27 500
Source: Ministry of Education and Ministry of Work and Social Solidarity, Programme New Opportunities
• Integrate vocational courses in upper secondary schools that traditionally only provided general courses leading to higher education.
Table 1.31 – Estimated new vocational programmes in upper secondary schools
2005/06 2006/07 2007/08 2008/09 2009/10 New courses 40 100 200 300 450
Source: Ministry of Education and Ministry of Work and Social Solidarity, Programme New Opportunities
• Implement a system for the recognition and certification of competencies and to offer new vocational training opportunities to adults with low qualifications.
The decreasing number of young people is diminishing the demand for higher education, and enhanced competition for students among higher education institutions. This phenomenon favours the reconfiguration and rationalisation of the network of higher education institutions and their study programmes. As demographic trends will take time to reverse, possible ways to increase demand for higher education include improving success rates in upper secondary education, increasing the access of new publics and eventually making upper secondary education compulsory.
The implementation of the Bologna process is also providing pressure for change at the level of higher education. Parliament passed a law adapting the Education System Act (Law 46/86 of 14 October) to the Bologna degree structure and the Government passed a decree regulating the implementation of the new degree system (Decree-Law 74/2006 of 24 March). Higher education institutions will be able to start implementing the new system from 2006/07.
The implementation of the Bologna process will also influence the present national system of quality assessment, as an accreditation system will be implemented in order to meet the European Standards and Guidelines for Quality Assurance in the European Higher Education Area, EHEA, as adopted by ministers in Bergen in May 2005.

TERTIARY EDUCATION IN PORTUGAL: BACKGROUND REPORT
48
References
Amaral, A. and Teixeira, P. (1999), Previsão da Evolução do número de alunos e das necessidades de financiamento Ensino Superior 1995 a 2005, Coimbra, CIPES – Fundação das Universidades Portuguesas.
Conceição, P. and Heitor, M.V. (2005), “Innovation for All? Learning from the Portuguese path to technical change and the dynamics of innovation”. Westport and London: Praeger.
Gago, J.M. (1994) Prospective Study of Higher Education in Portugal, Lisbon, CNE.
Heitor, M. V. (2000), Evaluation of Research Units, 1999/2000 – Final Report. Lisbon: Observatory for Science and Technology, Portuguese Ministry of Science and Technology
King, D.A., The Scientific Impact of Nations – What difference countries for their research spending, Nature, vol. 430, 15 July 2004.
OECD (2005), Education at Glance: OECD Indicators 2005, OECD, Paris.

TERTIARY EDUCATION IN PORTUGAL: BACKGROUND REPORT
49
PART II - PUBLIC REGULATION AND INSTITUTIONAL DEVELOPMENT
This part of the report addresses main aspects of public regulation and institutional development in higher education, which represent areas of particular concern in tertiary education in Portugal and worldwide. They shape the relationships between governments, higher education institutions and society at large, which have been subject of recent reforms in many countries.
In Portugal public regulation of tertiary education has been implemented through four basic processes discussed in this part of the report, namely: i) access; ii) social support to students; iii) accreditation and quality assessment; and iv) public funding. The efficiency of most past and existing schemes in Portugal in these four areas has been a major cause of concern, and increasingly questioned by many actors in society. It has also justified the overall evaluation requested to OECD and to ENQA in November 2005. The main data available is briefly described in this part of the report.
Beyond those four processes mentioned, the development of higher education was also determined by the level of institutional development and degree of autonomy, including the management of human resources, which is influenced by the relationship between Government and the institutions. Details related with the institutional characteristics of the network of higher education institutions are provided in Part III of the report.
1. Access to higher education and overall enrolment trends
Table 2.1 presents the increase in enrolment in the public and private sectors, as well as the total enrolment for the higher education system. The 1990´s were characterised by the duplication of the students’ enrolment, in a way that exhibited an uneven distribution throughout the system. Enrolment in public universities increased by 62%, while enrolment in public polytechnics increased 225% and enrolments in the private sector increased 122%. In 1983/84 the share of enrolments was 78% in public universities, 11% in public polytechnics and 11% in the private sector. In 1990/91 those shares became, respectively, 56%, 17% and 28%, while in 1996/97 those values were 44%, 20% and 36%. In 2000/01 enrolment shares were, respectively, 44%, 27% and 30%, and in 2004/05 these values were 45%, 29% and 26%.
Initially the development was mainly determined by the private sector, which in 1991 registered a 34% annual enrolment increase (Table 2.2), after increase rates of 23% in 1989 and 33% in 1990. This expansion started to slow down after the mid 1990s and in 1997 it became negative, a trend that has not changed until today. Public polytechnics registered a more sustained expansion (Table 2.2) and their total enrolment is today higher than that of the total private sector, although they present a recent tendency towards decreasing enrolments. This slow-down of enrolments was also observed for public universities since 2003.
Successive governments consistently used access to higher education to regulate the system and parts of the sub-sectors, with numerus clausus used to control the number of vacancies in every study programme. Students enter higher education by means of a national competition and a centralised placement system that takes into account the students’ preferences and their grades. After an education route of 12 years (9 years of basic education and 3 years of upper secondary education), the eligibility

TERTIARY EDUCATION IN PORTUGAL: BACKGROUND REPORT
50
conditions to enter a higher education programme requires the combination of the students’ performance in upper secondary education with their performance in the national examinations in the core disciplines for the chosen study programme.
Table 2.1 – Enrolments for the different sectors of the higher education system (Graduate and post-graduate degree programmes)
Enrolments in higher education institutions at 31st December 1991 1992 1993 1994 1995 1996 1997 1998 1999 2000 2001 2002 2003 2004
Public University 111 550 119 292 126 009 131 309 138 286 146 499 150 493 155 563 160 970 167 435 171 014 171 667 169 481 165 866Armed forcesa 1042 1 015 994 890 835 850 907 917 996 1 082 1 138 1 163 1 252 1 352Total P.Univ. 112 592 120 307 127 003 132 199 139 121 147 349 151 400 156 480 161 966 168 517 172 152 172 830 170 733 167 218Polyt- General 36 220 43 085 48 262 53 032 58 482 64 187 71 458 78 889 89 101 100 481 106 889 110 761 109 641 107 518Polyt- Others 532 702 722 755 897 885 928 839 929 1 116 1 279 1 430 1 473 502Armed forcesa 323 339 222 300 294 305 305 279 256 198 318 341 368 356Total P. Polyt. 37 075 44 126 49 206 54 087 59 673 65 377 72 691 80 007 90 286 101 795 108 486 112 532 111 482 108 376Total Public 149 667 164 433 176 209 186 286 198 794 212 726 224 091 236 487 252 252 270 312 280 638 285 362 282 215 275 594Private University 29 637 33 750 36 541 41 369 43 623 48 528 46 207 50 022 48 560 43 949 41 331 38 789 36 071 31 981Other schools 31 285 39 228 48 426 53 220 61 444 62 380 64 243 57 313 59 711 59 501 60 186 60 915 59 797 56 161Catholic univ. 7 728 8 671 8 813 9 473 9574 10 491 10 327 10 528 10 267 10 560 10 136 10 412 10 641 10 213Total Private 68 650 81 649 93 780 104 062 114 641 121 399 120 777 117 863 118 538 114 010 111 653 110 116 106 509 98 355TOTAL 218 317 246 082 269 989 290 348 313 435 334 125 344 868 354 350 370 790 384 322 392 291 395 478 388 724 373 949GPR 20-24b% 27.6 30.5 32.8 34.6 37.0 40.0 42.2 44.2 47.3 49.8 51.7 52.9 52.9 -
Notes: a – Police and military schools; b – Gross participation rate 20-24 years;
Source: OCES, 2005
Table 2.2 – Higher education enrolments’ annual increase (%)
1992 1993 1994 1995 1996 1997 1998 1999 2000 2001 2002 2003 2004 Public Universities 6.9 5.6 4.1 5.2 5.9 2.7 3.4 3.5 4.0 2.2 0.4 -1.2 -2.1Public Polytechnics 19.0 11.5 9.9 10.3 9.6 11.2 10.1 12.8 12.7 6.6 3.7 -0.9 -2.8Sub-Total Public 9.9 7.2 5.7 6.7 7.0 5.3 5.5 6.7 7.2 3.8 1.7 -1.1 -2.3Private sector 18.9 14.9 11.05 10.25 5.9 -0.5 -2.4 0.6 -3.8 -2.1 -1.4 -3.3 -7.7TOTAL 12.7 9.7 7.5 8.0 6.6 3.2 2.7 4.6 3.6 2.1 0.8 -1.7 -3.8Source: OCES, 2005
Figure 2.1 quantifies the evolution of public vacancies and candidates since the late 1970´s and identifies a major change in 1989, associated with an increase of over 20,000 candidates (more than 60%) relative to the previous year, which the public sector could not accommodate. This was due to the government’s decision that entrance examinations were only to be used for ranking students in the national tender for vacancies, without required minimum marks for admission. As a result, the private share of student enrolments jumped from 10% in 1982-83 to 24% in 1989-90, and to 36% in 1996-97.
A second major change in the number of candidates occurred in 1994 with a reform of upper secondary education that facilitated access to higher education. However, by 1996 access conditions became very much determined by demographic factors, and since then the number of candidates has continuously decreased until 2002, becoming more stable since then.
Legislation introduced in the mid 1990s implemented pass examinations at the end of the 10th and 11th grades of secondary education, and national examinations for each subject at the end of the 12th

TERTIARY EDUCATION IN PORTUGAL: BACKGROUND REPORT
51
grade, while allowing higher education institutions, or even encouraging them, to set minimum marks in the access examinations to higher education.
Analysis from the mid 1990´s shows different factors affecting access to higher education, namely: a consistent decline in the number of candidates due to changes in demography; increasingly difficult conditions to enter higher education by reintroducing national examinations at the end of the upper secondary education; and increasing public vacancies, due to large investments made in the public sector. Institutional responses to the increased competition for students differed, with a few of the most recognised institutions setting high minimum marks, while less prestigious institutions set lower entrance standards, thus making evident to the general public the different strategies of institutions and the different segments of the student population they were aiming at attracting.
Figure 2.1 – Number of public vacancies (series 1) and candidates (series 2), for 1978 - 2005
0
10000
20000
30000
40000
50000
60000
70000
80000
90000
78/79 80/81 82/83 84/85 86/87 88/89 90/91 92/93 94/95 96/97 98/99 00/01 02/03 04/05
Academic year
Series1 Series2
Source: OCES, 2006
The recent introduction of the Portuguese Comprehensive Law on the Education System (i.e., “Lei de Bases do Sistema Educativo”) of August 2005, followed by Decree-Law 74/06, of 24 March, adapted the system to the Bologna principles, and introduced a national accreditation system and a new regulatory framework.
In parallel with the “Bologna reform”, two major regulatory initiatives were implemented from the academic year 2005/06:
• access rules enforced minimum grades of 95/200 in the national access examinations for all candidates in every sector of higher education; and
• a minimum number of 10 students per degree programme was required for public funding, with this limit being announced to increase to 20 students from 2006/07.
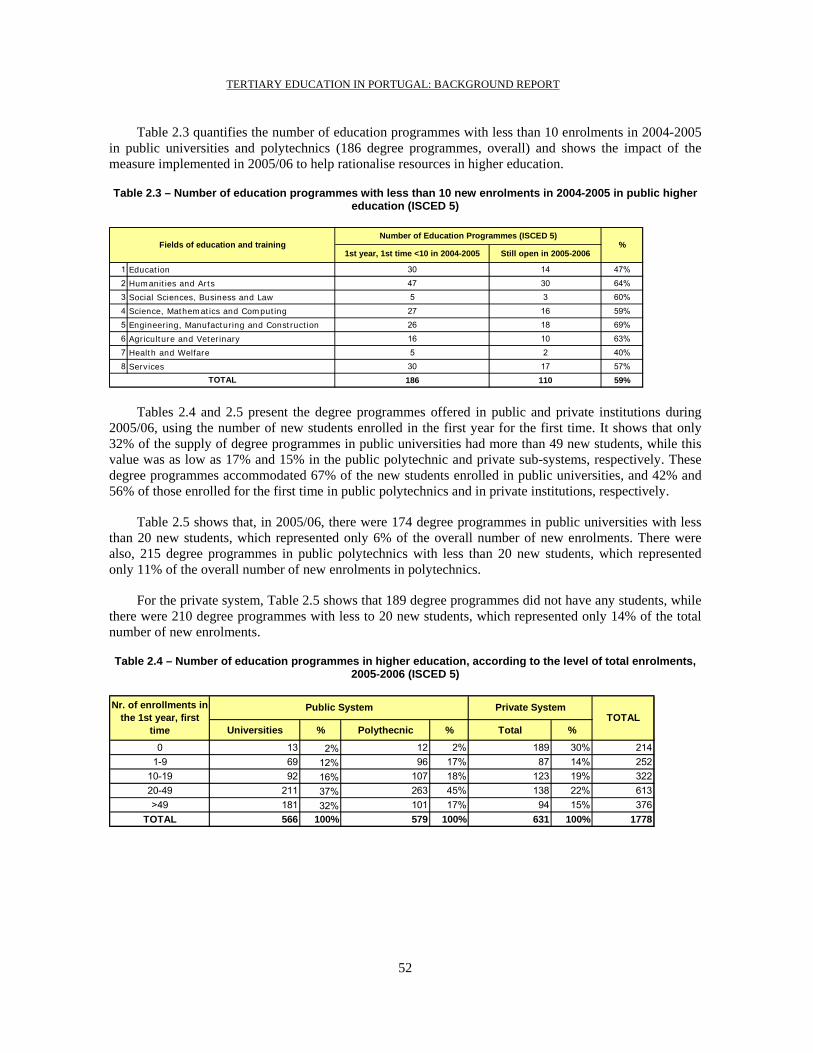
TERTIARY EDUCATION IN PORTUGAL: BACKGROUND REPORT
52
Table 2.3 quantifies the number of education programmes with less than 10 enrolments in 2004-2005 in public universities and polytechnics (186 degree programmes, overall) and shows the impact of the measure implemented in 2005/06 to help rationalise resources in higher education.
Table 2.3 – Number of education programmes with less than 10 new enrolments in 2004-2005 in public higher education (ISCED 5)
1st year, 1st time <10 in 2004-2005 Still open in 2005-2006
1 Education 30 14 47%
2 Humanities and Arts 47 30 64%3 Social Sciences, Business and Law 5 3 60%
4 Science, Mathematics and Computing 27 16 59%5 Engineering, Manufacturing and Construction 26 18 69%
6 Agriculture and Veterinary 16 10 63%
7 Health and Welfare 5 2 40%8 Services 30 17 57%
186 110 59%TOTAL
Number of Education Programmes (ISCED 5)Fields of education and training %
Tables 2.4 and 2.5 present the degree programmes offered in public and private institutions during 2005/06, using the number of new students enrolled in the first year for the first time. It shows that only 32% of the supply of degree programmes in public universities had more than 49 new students, while this value was as low as 17% and 15% in the public polytechnic and private sub-systems, respectively. These degree programmes accommodated 67% of the new students enrolled in public universities, and 42% and 56% of those enrolled for the first time in public polytechnics and in private institutions, respectively.
Table 2.5 shows that, in 2005/06, there were 174 degree programmes in public universities with less than 20 new students, which represented only 6% of the overall number of new enrolments. There were also, 215 degree programmes in public polytechnics with less than 20 new students, which represented only 11% of the overall number of new enrolments in polytechnics.
For the private system, Table 2.5 shows that 189 degree programmes did not have any students, while there were 210 degree programmes with less to 20 new students, which represented only 14% of the total number of new enrolments.
Table 2.4 – Number of education programmes in higher education, according to the level of total enrolments, 2005-2006 (ISCED 5)
Universities % Polythecnic % Total %
0 13 2% 12 2% 189 30% 2141-9 69 12% 96 17% 87 14% 252
10-19 92 16% 107 18% 123 19% 32220-49 211 37% 263 45% 138 22% 613>49 181 32% 101 17% 94 15% 376
TOTAL 566 100% 579 100% 631 100% 1778
TOTALPublic System Private SystemNr. of enrollments in
the 1st year, first time

TERTIARY EDUCATION IN PORTUGAL: BACKGROUND REPORT
53
Table 2.5 – Number of new enrolments in higher education, according to the level of total enrolments in specific education programmes, 2005-2006 (ISCED 5)
Universities % Polythecnic % Total %
0 0 0% 0 0% 0 0% 01-9 343 1% 518 3% 508 3% 1.369
10-19 1.283 5% 1.545 8% 1.747 11% 4.57520-49 7.074 26% 8.880 47% 4.451 29% 20.406>49 18.055 67% 7.786 42% 8.549 56% 34.391
TOTAL 26.755 100% 18.729 100% 15.255 100% 60.741
Nr. of enrollments in the 1st year, first
time
Private SystemPublic SystemTOTAL
Female enrolment in higher education
Table 2.6 quantifies the increasing percentage of female students in higher education, which is explained by various factors, including the progressive liberalisation of social conventions, but above all due to the high rate of female participation in the labour force. This occurred initially at the lower qualification levels, due to the acceleration of industrialisation, largely supported by labour intensive industries, and associated with the integration of the Portuguese economy within the European Free Trade Association (EFTA). These industries heavily recruited female workers. Later, during the 1960s and early 1970s, a growing proportion of males were drafted to the colonial war, thus opening new opportunities for women in terms of higher education and the labour market.
Table 2.6 – Percentage of female students in higher education
Sector 1961 1971 1980 1991 1997 2003 2004 Public – 43.8 43.6 55.4 54.6 54.1 53.8 Private – 53.6 46.3 56.4 60.8 61.6 61.3 University – 45.8 46.4 55.2 55.2 54.2 53.3 Polytechnic – 34.6 33.3 60.1 58.5 58.6 58.9 All institutions 29.1 44.4 43.9 55.5 56.6 56.2 55.8
Source: Barreto 1996; OCES various years
In the early 1990s women became the majority of enrolled students and graduates in all sub-systems of higher education. This might be explained by the higher success rate of female students in compulsory education and upper secondary education (Table 1.20, early leaves from secondary school). However, the expansion has not been uniform across disciplines. Initially it began in those areas regarded as socially more acceptable and those that more easily allowed women to pursue a professional career. Eventually, a growing proportion emerged in less traditional areas such as economics, law and engineering, and today they are a majority in every programme except the more technological ones. Their significant presence in polytechnic schools (Table 2.6) might be explained by the fact that this sector includes the colleges of education and nursing with high percentage of female students. Also, the high percentage of women in the private sector might be explained by factors such as fewer technological programmes and higher percentage of teacher training and health courses in this sub-sector.
On the socio-economic origins of students
The nature of the Portuguese higher education system is reflected by the socio-economic composition of student enrolments. Until the 1970s enrolments were low, the number of candidates being restricted by the low literacy levels of the population. Those few students graduating from secondary education and

TERTIARY EDUCATION IN PORTUGAL: BACKGROUND REPORT
54
struggling to remain in the system faced adversity, as families were unwilling or unable to invest in their children’s education. Employment opportunities were somewhat limited. Qualified labour could either join the civil service or find employment with a few industrial groups that expanded their activities in the highly protected economic system of corporatism and colonialism.
The expansion of higher education during the 1960s was associated with important economic transformations occurring during that decade, namely a period of accelerated economic growth and, above all, increasing pressure for economic liberalisation. The student population in the 1960s had a high proportion of students whose father had a higher education degree, or at least some secondary education. Bearing in mind the poor levels of literacy of the overall population, this shows a clear over-representation of those groups with higher cultural capital and an under-representation of those from more deprived backgrounds. Analysis has shown that in the following decades this picture changed, with increasing access for students from families with limited qualifications. However, families with formal qualifications well above the average retained their traditional prominence.
Nevertheless, changes to the social composition of the student population were not homogeneous across sub-sectors (Table 2.7). First, public universities have a more homogeneous population in terms of cultural capital than public polytechnics, suggesting that students from families with lower qualifications choose shorter vocational degrees. Second, there are no major differences between public universities and private institutions in terms of cultural capital of origin.
The analysis of enrolments by level of income mostly confirms the influence of cultural capital on enrolment patterns (Table 2.8). Public polytechnics are clearly more socially inclusive than public universities. Again, in terms of the students’ economic level there are no major differences between public universities and private institutions. This suggests that middle and upper class groups with higher cultural capital retained a good grip on access to the most prestigious institutions and programmes (Vieira, 1995).
The EUROSTUDENT 2005 survey confirms that the university-polytechnic divide presents a clearer difference between the socio-economic family origins of the students in the Portuguese higher education system than the public-private divide.
Table 2.7 – Distribution of enrolments by level of schooling of the householda (%)
1997 2004 Level 63/64 91/92
Public univer.
Public polytech. Private Total Public
univers. Public polytech. Private Total
Illiterate/ Primary 35.2 25.3 39.3 53.3 47.2 45.0 30.0 50.0 27.2 34.9
Secondary 27.4 19.2 35.7 36.3 34.4 35.4 29.2 29.6 29.4 29.4
Vocational degree 8.7 8.1 6.5 – – – –
Higher education 27.5 18.1 24.7 10.4 18.3 13.1 40.8 20.4 43.4 35.7
Other/NA 1.2 27.1 – – – –
a – level of schooling of the parent with highest income
Source: Vieira (1995); CNASES (1997); CIES-ISCTE. (2005)
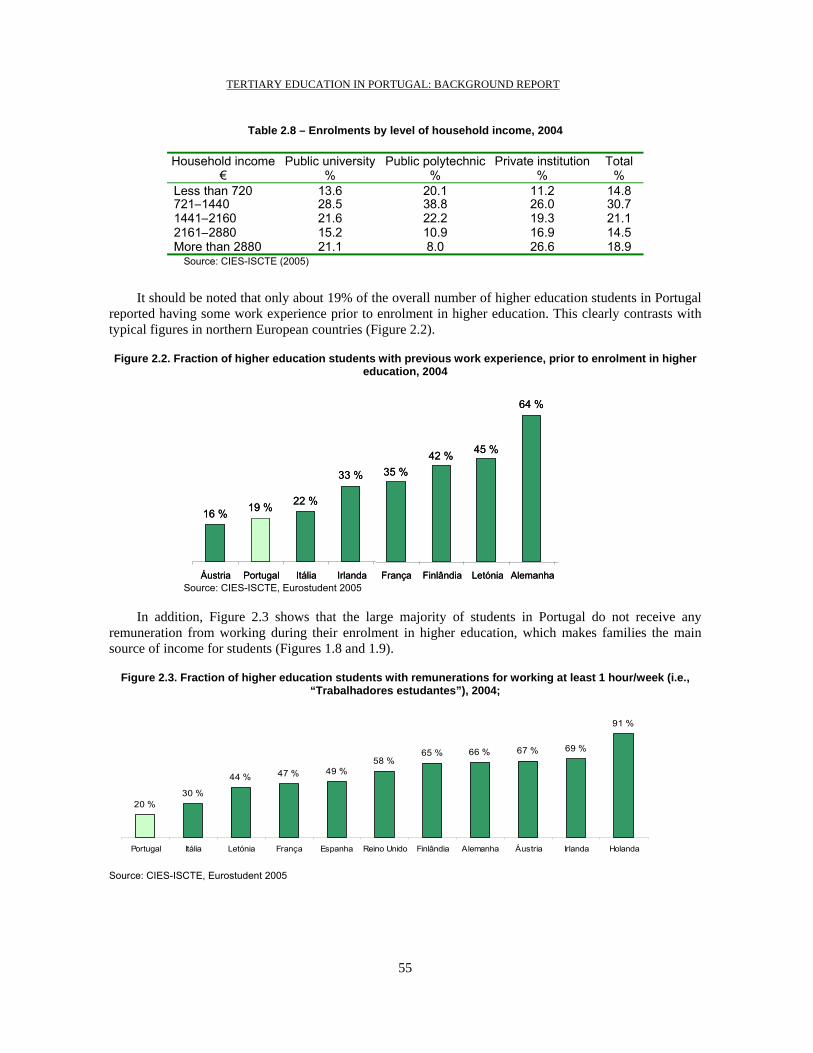
TERTIARY EDUCATION IN PORTUGAL: BACKGROUND REPORT
55
Table 2.8 – Enrolments by level of household income, 2004
Household income €
Public university%
Public polytechnic%
Private institution %
Total %
Less than 720 13.6 20.1 11.2 14.8 721–1440 28.5 38.8 26.0 30.7 1441–2160 21.6 22.2 19.3 21.1 2161–2880 15.2 10.9 16.9 14.5 More than 2880 21.1 8.0 26.6 18.9
Source: CIES-ISCTE (2005)
It should be noted that only about 19% of the overall number of higher education students in Portugal reported having some work experience prior to enrolment in higher education. This clearly contrasts with typical figures in northern European countries (Figure 2.2).
Figure 2.2. Fraction of higher education students with previous work experience, prior to enrolment in higher education, 2004
Source: CIES-ISCTE, Eurostudent 2005
In addition, Figure 2.3 shows that the large majority of students in Portugal do not receive any remuneration from working during their enrolment in higher education, which makes families the main source of income for students (Figures 1.8 and 1.9).
Figure 2.3. Fraction of higher education students with remunerations for working at least 1 hour/week (i.e., “Trabalhadores estudantes”), 2004;
91 %
69 %67 %66 %65 %58 %
49 %47 %44 %
30 %20 %
Portugal Itália Letónia França Espanha Reino Unido Finlândia Alemanha Áustria Irlanda Holanda
Source: CIES-ISCTE, Eurostudent 2005
16 % 19 % 22 %
33 % 35 %42 % 45 %
64 %
Áustria Portugal Itália Irlanda França Finlândia Letónia Alemanha
16 % 19 % 22 %
33 % 35 %42 % 45 %
64 %
Áustria Portugal Itália Irlanda França Finlândia Letónia Alemanha

TERTIARY EDUCATION IN PORTUGAL: BACKGROUND REPORT
56
Student mobility
Figure 2.4 compares the fraction of higher education students with experience in studying abroad for several European countries and, for example, shows that the fraction of Spanish students with experience abroad is almost three times larger than that for Portugal. This experience has been promoted above all through the Erasmus Programme and, again, families must support a large part of the costs of their students studying abroad.
In terms of national mobility, another dimension of the selective nature of the Portuguese higher education system was its high regional concentration. Until the early 1970s there were no universities outside the three major cities (Lisbon, Porto, Coimbra). The regional expansion of the system started slowly, before becoming an important characteristic from the mid-1980s onwards. Arguably, the main driving force of regional diversification was the development of the polytechnic public sector. Public polytechnics had strong regional orientation ever since their creation and were always regarded as the primary instrument for providing higher education to the more remote areas of the country.

TERTIARY EDUCATION IN PORTUGAL: BACKGROUND REPORT
57
Figure 2.4. Fraction of higher education students with experience in studying abroad, 2004;
8 % 8 % 8 %
12 %13 %
15 %16 % 17 %
21 %
Portugal Letónia Irlanda Holanda Áustria França Finlândia Alemanha Espanha
8 % 8 % 8 %
12 %13 %
15 %16 % 17 %
21 %
Portugal Letónia Irlanda Holanda Áustria França Finlândia Alemanha Espanha Source: CIES-ISCTE, Eurostudent 2005
Regional expansion of higher education – especially of the public network – had initially a small impact on geographical mobility, as the establishment of new institutions started by attracting candidates of the surrounding regions. By the mid-1990s the proportion of the total number of applicants and successful applicants coming from the same region to the institutions located in the two most populated regions (Lisbon and Porto) was over 60%. In contrast, regions with smaller populations were filling about half of their vacancies with candidates from outside their region. Distance to the institution is one of the main determinants of students’ preferences.
There is an increasing pattern of student mobility between study programmes and between institutions, which is determined by the number of vacancies that institutions open for specific purposes. Table 2.9 quantifies the students that change programme and institution for the academic year 2004/05 (first year enrolments) and shows that some 12% of students change their choice of programme, 3% move to other institution and only 1% are students aged over 25 years and have access to the university through a special entrance system for students not holding an upper secondary school diploma.
Table 2.9 – Students changing programme and institution, 1st year, 2004-05
% filled vacancies
New students
Change of programme
Change of institution
≥ 25 years old
Public universities
86.8 21 201 2 083 524 238
Public polytechnics
79.6 14 111 1 799 418 145
Private institutions
48.0 13 362 1 880 711 168
Total 69.7 49 674 5 762 1 653 551 Source: OCES, 2005
2. Students’ social support system
The Portuguese higher education student social support system aims to mitigate the economic difficulties faced by students from disadvantaged social backgrounds. This is particularly important since the last decade was characterised by increasing cost-sharing, both by raising the level of tuition fees in public institutions and by expanding full-cost fee private institutions.
Decree-Law 132/80 of 17 May has established a comprehensive student support system by creating an autonomous service associated to each university or university institute. At the time these services were
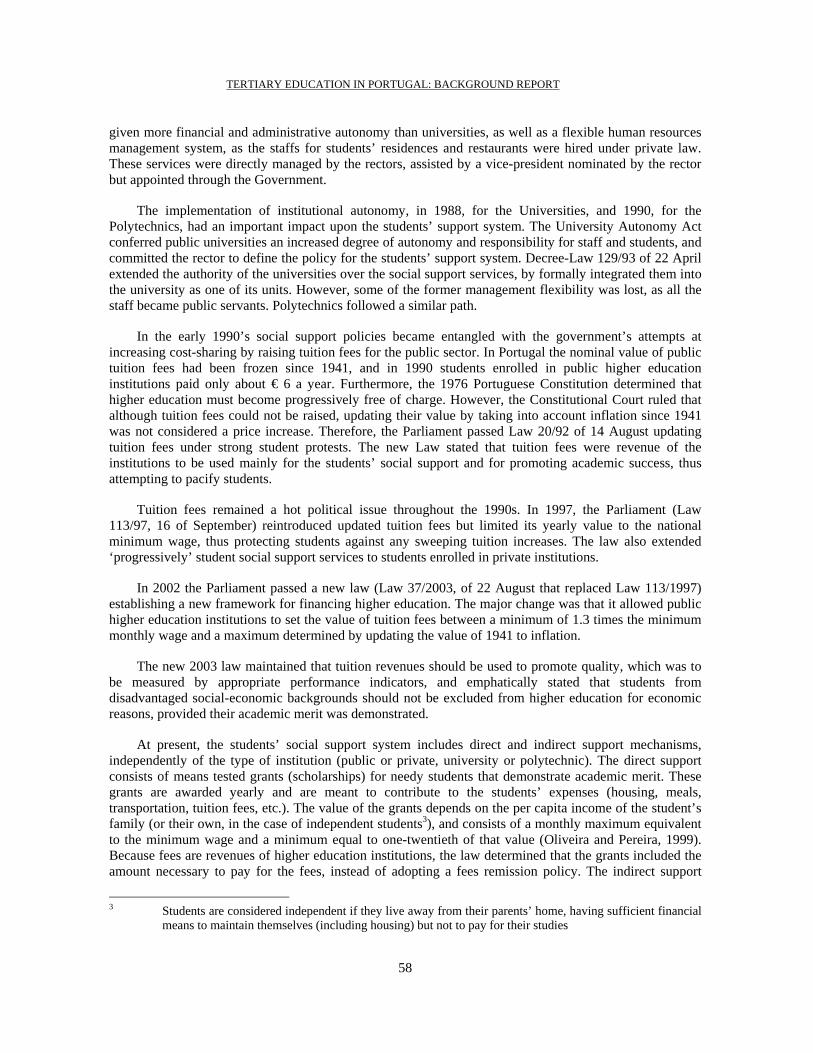
TERTIARY EDUCATION IN PORTUGAL: BACKGROUND REPORT
58
given more financial and administrative autonomy than universities, as well as a flexible human resources management system, as the staffs for students’ residences and restaurants were hired under private law. These services were directly managed by the rectors, assisted by a vice-president nominated by the rector but appointed through the Government.
The implementation of institutional autonomy, in 1988, for the Universities, and 1990, for the Polytechnics, had an important impact upon the students’ support system. The University Autonomy Act conferred public universities an increased degree of autonomy and responsibility for staff and students, and committed the rector to define the policy for the students’ support system. Decree-Law 129/93 of 22 April extended the authority of the universities over the social support services, by formally integrated them into the university as one of its units. However, some of the former management flexibility was lost, as all the staff became public servants. Polytechnics followed a similar path.
In the early 1990’s social support policies became entangled with the government’s attempts at increasing cost-sharing by raising tuition fees for the public sector. In Portugal the nominal value of public tuition fees had been frozen since 1941, and in 1990 students enrolled in public higher education institutions paid only about € 6 a year. Furthermore, the 1976 Portuguese Constitution determined that higher education must become progressively free of charge. However, the Constitutional Court ruled that although tuition fees could not be raised, updating their value by taking into account inflation since 1941 was not considered a price increase. Therefore, the Parliament passed Law 20/92 of 14 August updating tuition fees under strong student protests. The new Law stated that tuition fees were revenue of the institutions to be used mainly for the students’ social support and for promoting academic success, thus attempting to pacify students.
Tuition fees remained a hot political issue throughout the 1990s. In 1997, the Parliament (Law 113/97, 16 of September) reintroduced updated tuition fees but limited its yearly value to the national minimum wage, thus protecting students against any sweeping tuition increases. The law also extended ‘progressively’ student social support services to students enrolled in private institutions.
In 2002 the Parliament passed a new law (Law 37/2003, of 22 August that replaced Law 113/1997) establishing a new framework for financing higher education. The major change was that it allowed public higher education institutions to set the value of tuition fees between a minimum of 1.3 times the minimum monthly wage and a maximum determined by updating the value of 1941 to inflation.
The new 2003 law maintained that tuition revenues should be used to promote quality, which was to be measured by appropriate performance indicators, and emphatically stated that students from disadvantaged social-economic backgrounds should not be excluded from higher education for economic reasons, provided their academic merit was demonstrated.
At present, the students’ social support system includes direct and indirect support mechanisms, independently of the type of institution (public or private, university or polytechnic). The direct support consists of means tested grants (scholarships) for needy students that demonstrate academic merit. These grants are awarded yearly and are meant to contribute to the students’ expenses (housing, meals, transportation, tuition fees, etc.). The value of the grants depends on the per capita income of the student’s family (or their own, in the case of independent students3), and consists of a monthly maximum equivalent to the minimum wage and a minimum equal to one-twentieth of that value (Oliveira and Pereira, 1999). Because fees are revenues of higher education institutions, the law determined that the grants included the amount necessary to pay for the fees, instead of adopting a fees remission policy. The indirect support
3 Students are considered independent if they live away from their parents’ home, having sufficient financial
means to maintain themselves (including housing) but not to pay for their studies

TERTIARY EDUCATION IN PORTUGAL: BACKGROUND REPORT
59
consists of housing in halls of residence (with priority given to displaced students with grants), subsidised meals in canteens, and other services related to health, culture and sports.
The expenditure in students’ social support increased faster than the expenditure in higher education, the latter increasing also faster that the expenditure in education (in 2001 higher education represented about 20% of the public expenditure with education). Public expenditure in education increased from 1.5 % of the GDP in 1974 to 5.5% of the GDP in 20014. From 1988 to 2001, public expenditure in education and higher education increased from 4.0% to 5.5% of the GDP and from 0.46% to 1.13% of the GDP, respectively.
Figure 2.5 indicates the percentage of students with public grants in the various sub-systems, and shows that public universities have a higher percentage of grants than public polytechnics although students from the less affluent backgrounds are more present in the polytechnic sector.
To overcome the differences between the private and the public sub-systems (in 1991 the private sub-system received 29% of all students enrolled in HE and only 3% of the public expenses in student social support), the grant system was extended to the private sub-sector in 1997, with an extra allowance to compensate for the higher fees in the private sector5 Nevertheless the State established a limit to the amount awarded for tuition, to deter private institutions from excessively increasing fees.
The more equitable treatment of students in public and private institutions is confirmed by the analysis of the evolution of the total funds per sub-system and the average value of grants, as shown in figure 2.6 and table 2.10. Grants became on average higher for students enrolled in the private sector, and that explains why the budget for the private sector already exceeds the budget for public polytechnics. It is important to notice, in this context, that a large fraction of students only receive a grant equal to the tuition fee, which explains the low average annual values of grants in public universities and polytechnics.
4 The collected data on education, higher education and social support are not always available by source of
financing. So the term “public expense” frequently represents different realities, such as the State budget transferences or the transferences from the budget including own resources from public entities. For such reason the data used will be precisely identified.
5 The grant system was extended to private sector only in 1997, when there was already a clear tendency of decreasing enrolments in this HE sub-sector. However decreasing enrolments have continued in private higher education after the extension of the grants’ system to this sub-sector.

TERTIARY EDUCATION IN PORTUGAL: BACKGROUND REPORT
60
Figure 2.5 – Percentage of students with grants in public universities, public polytechnics and private institutions;
0,0%
5,0%
10,0%
15,0%
20,0%
25,0%
1991 1992 1993 1994 1995 1996 1997 1998 1999 2000 2001 2002 2003 2004
Year
Public universities Public polytechnics Privates Source: DEPGEF, FAE, DGESUP and DSAT.
Table 2.11 extends the information provided in Figure 1.5 and quantifies the type of residence used by higher education students in Portugal.
Grants are means-tested, depending on the families’ per capita income. Table 2.12 presents the monthly income of students receiving grants and shows that 80% of the grant-holders belong to families with a maximum income of € 1 440, while 33% have an income below € 720.
Figure 2.6 – Total expenditure in student support (grants) per sub-system
0
5 000
10 000
15 000
20 000
25 000
30 000
35 000
40 000
45 000
50 000
1989
1990
1991
1992
1993
1994
1995
1996
1997
1998
1999
2000
2001
2002
2003
2004
Year
Public Universities Public Polytechnics Privates Sources: Medina (2004), DGES (2006)

TERTIARY EDUCATION IN PORTUGAL: BACKGROUND REPORT
61
Table 2.10 – Average annual values of grants (€)
Public Institutions Year Universities Polytechnics
Private Institutions
1997 1 580 1 441 3 334 1998 1 373 1 265 3 8291999 1 335 1 147 3 2182000 1 279 1 121 2 2812001 1 387 1 118 2 0032002 1 491 1 129 1 8922003 1 329 1 028 1 8782004 1 481 1 201 1 698
Source: CIES-ISCTE, Eurostudent (2005)
Table 2.11 – The residence of higher education students
Age groups (%) Students
< 20 years old 20-23 years old
24-27 years old >28 years old
Parents/relatives 56.6 59.0 51.0 25.8 Own house/apartment 5.7 7.3 12.9 53.3 Rented house/apartment 16.8 15.4 14.4 11.6 Individual rented room 11.9 12.2 14.6 5.8 Shared rented room 3.7 2.4 3.3 1,2 Student residence 5.3 3.7 3.8 2.3
Source: CIES-ISCTE, Eurostudent (2005)
Table 2.12 – Parents’ net monthly income of students receiving grants (€)
families’ per capita income % of students receiving grants
< 720 € 32.9
721 € – 1440 € 47.1
1441 € – 2160 € 11.6
2161 € – 2880 € 5.0
> 2880 € 3.4
Total 100.0
Source: CIES-ISCTE, Eurostudent (2005)
Table 2.13 characterises the families of grant-holders in terms of their socio-professional category and level of educational attainment. It is not surprising that 73.5% of grant-holders’ families have at most completed basic education due to the low qualification level of the Portuguese population. What is perhaps more surprising is that 7.5% of grant-holders belong to families of “entrepreneurs, top management and liberal professionals” and 20.3% belong to families of “executives and specialised professionals”.

TERTIARY EDUCATION IN PORTUGAL: BACKGROUND REPORT
62
Table 2.13 – Characterisation of the parents of undergraduate students with grants
Household of origin %
Socio-professional categories
Entrepreneurs, top management, liberal professionals 7.5
Executives and specialised professionals 20.3
Independent workers 8.2
Independent workers, > 1 activity 7.2
Administrative employees 17.0
Blue collar workers 21.2
Salaried workers, > 1 activity 18.6
Total 100.0
Education
Not more than basic education 73.5
Upper secondary education 13.8
Tertiary education 12.7
Total 100.0
Source: CIES-ISCTE, Eurostudent (2005)
Table 2.14 extends the information of figures 1.8 and 1.9 and quantifies the contribution from both families and students to the costs of attending higher education at undergraduate level. Some 15.5% of all undergraduates contribute to the costs of higher education through their work revenues. For post-graduate education the annual expenditure is much higher than for undergraduate studies and the contribution from the state, although more generous in absolute terms, maintains its proportion of the total costs, while the percentage of students contributing with their work revenues increases very substantially to over 70%.
Tables 2.15 and 2.16 present the monthly average expenditures of students on different items taking into account the type of accommodation (Table 2.15) and the type of institution (Table 2.16). Accommodation is the most relevant item in the expenditures’ list and varies from zero for students living with their parents to an average of € 296 for those living in own or rented accommodations. Payments to institutions (fees) are lower for students in institutional residences, as a large percentage of them also has a grant and does not pay tuition fees.
Analysis shows that students from private institutions spend more, in absolute terms, than their colleagues from the public sector; the major difference being the higher fees paid to private institutions. Among public institutions, students from polytechnics spend less than those from universities. The item “other expenses” also presents a significant difference between types of institutions, being higher for

TERTIARY EDUCATION IN PORTUGAL: BACKGROUND REPORT
63
students enrolled in private institutions, probably because private institutions have higher concentration in the main towns of Porto and Lisbon, where living costs are also higher.
Table 2.14 – Sources of income (monthly average in € and in %)
Sources of income* € %
All students Family (money) 337 85.3 Family (intangibles)** 251 61.4 State 195 24.3 Work 625 18.1 Others 263 4.1 Undergraduate studies Family (money) 320 87.7 Family (intangibles) 250 62.8 State 155 24.4 Work 490 15.5 Others 214 4.0 Post-graduate studies Family (money) 1 173 37.1 Family (intangibles) 299 32.2 State 1 055 22.4 Work 1 213 70.6 Others 822 7.0
*NOTE 1: The calculated average only takes into account students with income from this source. The percentages refer to the proportion of students who in each sub-group state that they receive money from that source.
**NOTE 2: Intangible income refers to transfers in kind or direct payments made by their parents
Source: CIES-ISCTE, Eurostudent (2005)
Table 2.15 – Expenditure items and monthly average costs by type of accommodation
Type of accommodation All students Parents’ home Own or rented
house Rented room Student residence
Monthly expenses*
€ % € % € ‰ € ‰ € ‰Accommodation** 2 8 – – 2 8 2 9 1 7Food 1 8 8 8 1 9 1 9 1 9Clothes/hygiene 6 7 6 6 8 7 5 7 4 8Payments to institutions
147
55.4
154
51.1
158
57.5
123
52.0
81
66.1
Study 5 8 5 7 5 8 4 8 4 8Transport 5 8 5 7 6 8 5 8 3 8Computers/Internet 4 4 4 4 4 4 3 3 2 3Other expenses** 1 5 6 2 1 5 1 5 1 4Total 5 9 4 9 7 9 5 1 4 9
*NOTE 1: The calculation of the average only takes into account students with income from each source. The percentages refer to the proportion of students who in each sub-group state that they receive money from that source. **NOTE 2: Including intangible income, this refers to transfers in kind or direct payments made by their parents.
Source: CIES-ISCTE, Eurostudent, 2004

TERTIARY EDUCATION IN PORTUGAL: BACKGROUND REPORT
64
The small percentage of students that mention expenditure with “accommodation” (31.6% for public universities, 31.8% for public polytechnics and only 19.7% for private institutions) confirms that many students live with their family and that mobility is low. The lower value for the private institutions is consistent with the idea that their students are based locally and will try to keep the costs low. The exception seems to be students that already have local independent accommodation, in which case their average costs are also higher than those for their public university counterparts.
Although there was a legal framework for developing students’ loans for many years, such system remains to be implemented through the approval of regulations and funding. At the same time, students’ loans available from the commercial banking system are extremely limited, with available data listing only 397 students having bank loans for studying in higher education (318 for undergraduate studies, corresponding to 0.06% of the total enrolment, and 79 for post-graduate studies, corresponding to 1.3% of total enrolment). It should be noted that a universal loan system would require a public investment that is hardly compatible with current EU rules on public budget deficits. For example, a loan system for 100,000 students with an individual debt limit of € 20,000, repayable in 15 years, would represent a public investment of almost 1.7% of GDP.
Table 2.16 – Expenditure items and monthly average by educational sector
All students Public universities
Public polytechnics
Private Total monthly expenditure1
€ % € % € % € %
Accommodation 190 28.3 199 31.6 161 31.8 212 19.7
Accommodation2 216 53.7 201 56.4 181 50.6 317 5.0
Food 108 86.4 115 88.6 92 88.1 112 81.4Clothes/hygiene 68 69.8 69 68.8 56 72.7 78 68.6
Tuition fees 147 53.7 102 52.3 68 51.9 283 57.9
Study materials/books 54 80.9 52 82.5 40 83.5 75 75.8
Transport 59 80.0 57 81.4 57 80.8 65 77.0
Computers/Internet 41 42.4 37 43.4 30 42.6 61 40.6
Other expenses3 179 54.7 157 53.0 107 57.6 291 54.4
Total4 495 97.0 465 97.5 370 62.2 672 95.2
1NOTE1: The calculation of the average only takes into account students with monthly expenditure for the item. The percentages refer to the proportion of students who in each sub-group state that they made expenses on that item in relation to the total number of students in the same sub-group. 2NOTE2: Intangibles, corresponding only to values declared by students not living with their parents; percentage of students with this type of expenditure in relation to the total of those living independently in each sub-group. 3
NOTE3: Including intangibles. 4
NOTE4: The average figures for total expenditure on each sub-group do not include payments made directly by the family for accommodation and associated services.
Source: CIES-ISCTE, Eurostudent (2005)

TERTIARY EDUCATION IN PORTUGAL: BACKGROUND REPORT
65
3. Accreditation and quality assessment
A major review of the accreditation and quality assurance practices of Portuguese higher education is being performed by an international review committee formed through the European Network for Quality Assurance in Higher Education, ENQA, following a request made by the Government in November 2005, so that this section only briefly summarizes main issues under analysis. The review committee will provide advice on the current legal framework supporting accreditation and quality assurance methodologies, as well as on appropriate structures for implementing a national accreditation and evaluation agency following current best quality assurance and accreditation practices in Europe.
Although at present there is no national accreditation system, at least when considering international reference terms for independent accreditation of higher education, public regulation of higher education at the level of degree programmes have been largely exercised through the Directorate-General for Higher Education, DGES. This has involved over the last decade diversified arrangements for the different sub-systems of higher education, which may be briefly summarised as follows:
• Public Universities: have full autonomy in the creation and delivery of degree programmes, which are to be registered at DGES;
• Public Polytechnics: the creation of degree programmes requires their prior approval from Government, through DGES;
• Private Institutions: the creation and delivery of degree programmes require prior approval from the Government, through DGES, after assessment by experts’ teams, which are nominated by the Government.
This system has resulted in increasing manifestations of concern from polytechnic and, above all, private institutions, claiming against discretionary attitudes and considerable bureaucracy. Table 2.17 quantifies the number of degree-programme proposals submitted to DGES over the last three years and the related approvals.
As a result, the recent alteration of the Portuguese Comprehensive Law on the Education System (i.e., “Lei de Bases do Sistema Educativo”) in August 2005, followed by Decree-Law 74/06, 24 March 2006, adapted the system to the Bologna principles and introduced a national accreditation system.
Table 2.17 – Number of new degree programmes requested, approved and registered at DGES for 2003-2005
a) Number of public university degree programmes registered at DGES
Degree Type 2003 2004 2005Bacharelato 1
Licenciatura 33 42 16
Master 103 114 109
PhD 10 7 16
Total 147 163 141

TERTIARY EDUCATION IN PORTUGAL: BACKGROUND REPORT
66
b) Number of public polytechnic degree programmes requested and approved/registered
Requests Approved / Registered Requests Approved /
Registered Requests Approved / Registered
Bacharelato 4 3 4 2 7 4
Bacharelato+Licenciatura 49 10 51 36 80 38
Licenciatura 5 1 5 2 7 1
Total 58 14 60 40 94 43
2003 2004 2005Degree Type
c) Number of degree programmes requested from private institutions and approved
Quality assurance of higher education in Portugal was based on the Higher Education Evaluation Act, Law 38/94, passed by Parliament in November 1994, which was closely developed in collaboration with the Council of Rectors of Public Universities, CRUP.
The quality assurance system established by Law 38/94 was implemented over the last decade with characteristics that might be summarised as follows:
• the evaluation process to all higher education institutions and in two phases: self- and external evaluation;
• the responsibility for the coordination of external evaluation lays with representative entities which must be recognised as such by the Government.
• there are no direct links between the results of the evaluation and the financing of teaching activities, although continued negative results may have consequences on financing and on the recognition of degrees. However, the formula for the funding of higher education institutions does not contain any component dependent on the results of quality evaluation;
• the system aims at the improvement of the quality of higher education in the different fields of study, taking specially into account the nature and typology of teaching, the qualification of the academic staff and the conditions of functioning.
Soon after the publication of Law 38/94, the Minister of Education signed a protocol with the Presidents of CRUP and FUP, which recognised the Foundation of Portuguese Universities (FUP) as the representative entity for the public universities and the Catholic University and defined the general guidelines to be met by the evaluation system. A direct consequence of this process was that the pilot project launched by CRUP in 1993 was integrated into the new framework and considered as the “first
TERTIARY EDUCATION IN PORTUGAL: BACKGROUND REPORT
67
round of evaluations” to be concluded until 1999 under the coordination of the evaluation council already established by FUP.
The other sectors of higher education organised themselves for the creation of their own evaluation agencies, but had to wait for regulation that was finally established by Decree-Law 205/98, of 11 July, which instituted the practical principles for the recognition of the representative entities and created the National Council for the Evaluation of Higher Education (CNAVES), as a global coordinating body of the evaluation system. It includes people from the different sub-systems (i.e., public universities and polytechnics and private institutions), together with representatives from the Government and, therefore, it represented the system of higher education itself. A few foreign members were initially invited, but never had any significant role. For the operation of CNAVES, the protocols for the recognition of the new representative entities – the Association of the Portuguese Polytechnic Institutes (ADISPOR) and the Portuguese Association of Private Higher Education (APESP) – were only signed in December 1998 and March 1999, respectively.
The representative entities created four evaluation councils, corresponding to the different higher education sectors:
• the Evaluation Council for Public Universities (includes also the Catholic University and the military institutions for university education), managed through FUP;
• the Evaluation Council for Public Polytechnics, managed through ADISPOR;
• the Evaluation Council for Private Universities, managed through APESP;
• the Evaluation Council for Private Polytechnics managed through APESP.
The responsibility for the harmony, cohesion and credibility of the national quality assurance system rests with the CNAVES, bearing in mind the observance of standards for the overall operation of the system. Specific responsibilities of CNAVES are:
• to coordinate the proposals from the evaluation councils to ensure that the same review teams for external evaluation apply to both the public and the private sectors in each field of studies;
• to ensure the same guidelines for self-evaluation within the University and the Polytechnic subsystems, allowing however for differentiation between them;
• to produce global and prospective reports on quality assurance in higher education, as well as to issue recommendations for the rationalisation and improvement of the higher education system.
Two rounds of programme evaluations have taken place. The first round (1995-2000) included only the public universities and the Catholic University. It was exclusively a programme–oriented exercise, assessing 376 programmes in 44 fields of study. The second round (2000-2005) continued to be programme-oriented and included programmes at all the higher education institutions, assessing a total of 1 209 degree programmes (432 in public universities, 164 in private universities, 421 in public polytechnics and 192 in private polytechnics) (Table 2.18). The review teams involved 637 experts for the university subsystem, of which only 16% were foreign and 18% were from the external community, and 524 experts for the polytechnic subsystem (only with 4% foreign, 9% non-academics, 46% from the universities and 41% affiliated to polytechnic institutions). It should be noted that successive Governments took no action or position based on the reports from the evaluation teams.
TERTIARY EDUCATION IN PORTUGAL: BACKGROUND REPORT
68
Table 2.18 – Number of degree programmes evaluated through CNAVES
University Study Programmes Polytechnic Study Programmes Year Public Private Total Public Private Total
2000/01 86 11 97 66 61 127 2001/02 141 59 200 57 46 103 2002/03 100 24 124 75 13 88 2003/04 49 32 81 98 39 137 2004/05 56 38 94 125 33 158 TOTAL 432 164 596 421 192 613
Source: CNAVES; 2006
Professional accreditation
Professional accreditation has been pursued through professional associations. These are public corporations for liberal professions (lawyers, doctors, engineers and pharmacists), which are organised in the form of public bodies with an associative basis (i.e., “statutory membership organisations” in the English terminology), working within the public law. As the Constitution of the Portuguese Republic grants the freedom of professional exercise, professional associations with power to limit or to condition access need to be established by an Act of Parliament of by a government Decree-Law duly authorised by Parliament.
The requirements for becoming an effective member of a professional association vary substantially within each profession. In some cases holding the appropriate degree is a sufficient condition. In other cases admission follows a training period and/or an examination. In 1994 the Engineers’ Association (i.e., “Ordem dos Engenheiros”) established a system of accreditation, and apparently other professional associations are following suite. As a general rule when an accreditation system exists, graduates from accredited higher education institutions have direct access to effective membership. In the case of engineering, the accreditation system uses a methodology that is quite similar to the national quality assurance system. More complete information can be obtained from FEANI’s site in the NET: http://www.feani.org/.
The Architects’ Association also established an accreditation system similar to that of the Engineering, which was recently modified. The new statutes of the Pharmacists’ Association approved by Decree-Law 288/2001 of 10 of November allowed the association to start accreditation procedures. None of the other Professional associations has so far established a system of accreditation, and the statutes do not necessarily confer this capacity to them.
4. Public Funding of higher education
Portugal has spent 5.9% of the GDP in education in 2001, and this figure compares against an average of 5.1% for EU25 and 4.6% for Germany, 3.9% for Greece, 4.4% for Spain, 5.7% for France, 4.3% for Ireland, 5.0% for Italy and the Netherlands, 5.9% for Austria and 4.7% for the UK (EUROSTAT, 2004). Also in 2001, the percentage of expenditure with education relative to the total public expenditure was 12.8% in Portugal, against 10.8% for EU25 and 9.7% for Germany, 8.2% for Greece, 11.1% for Spain, 11.2% for France, 12.9% for Ireland, 10.2% for Italy, 10.7% for the Netherlands, 11.2% for Austria and 11.9% for the UK (EUROSTAT, 2004).
Figure 2.7 shows typical OECD data indicating that public expenditure on higher education in Portugal was in 2001 similar to that of the average Europe, EU15, and about 1.04% of GDP, although the figures for Portugal do not include the investment of private sources of higher education. However, when comparisons are made using absolute values of total per capita funding (i.e., total public and private

TERTIARY EDUCATION IN PORTUGAL: BACKGROUND REPORT
69
expenditure per student, including families and other private agents), the results for Portugal (and also for other southern European countries) are lower than for other OECD countries. There are some reasons why this happens in Portugal. First, in Portugal total student enrolments do not take into account the percentage of part-time students, which means that the calculated per capita funding is lower than if calculated using enrolments in FTEs. Second, some research funds are directly allocated to financially autonomous research centres, and not through the universities budgets, except the percentage allocated as institutional overheads. Also, reimbursable funds such as income contingency loans have not yet been used in Portugal, namely to support students in their personal and living expenses, which also helps to explain major differences in relation to other northern European and OECD countries, as presented in Figure 2.8.
Figure 2.7 – Public expenditure on higher education, as a fraction of GDP (%)
2,49%
2,01% 2,00%
1,45%1,32% 1,30% 1,30%
1,08% 1,05% 1,04% 1,04%0,97% 0,91%
0,83% 0,79%
0,0%
0,5%
1,0%
1,5%
2,0%
2,5%
DK FIN S A IRL B NL D EU15 F P E EL I UK
Source: “Education Across Europe 2003”, Eurostat; data from last year available or 2000
Figure 2.8 – Public subsidies for education in tertiary education, 2002
Note: The chart presents different public subsidies for education to households and other private entities as percentage of total public expenditure on education, by type of subsidy. Public subsidies to households provide finance as grants or loans, and include: i)

TERTIARY EDUCATION IN PORTUGAL: BACKGROUND REPORT
70
grants/scholarships; ii) public student loans; iii) family or child allowances contingent on student status; iv) public subsidies in cash or kind such as housing and transport; and v) subsidies to permit low-interest loans from private lenders.
Adapted from: OECD (2005), Education at a Glance: OECD Indicators 2005, OECD, Paris.
Table 2.19 shows the evolution of the annual budget for Science and Technology, Information Society and Higher Education for 2005-2006, as presented to the Parliament by Government for MCTES, which quantifies an increase of 17% in S&T, maintaining the overall level of expenditure in higher education, together with a considerable decrease in the public support of infra-structures.
Table 2.19 – Overall annual budget for Science and Technology, Information Society and Higher Education (as presented by Government for MCTES) for 2005 and 2006
Unit: €
2005 2006 Variation (%)
Science and Technology 335 022 495 392 232 372 17.1Information Society 138 998 098 147 904 824 6.4Higher Education 1 734 338 129 1 766 861 805 1.9Higher Education (current expenses) 1 420 189 201 1 468 370 035 3.4Social support system (grants, accommodation, meals) 191 900 499 204 744 588 6.7
Infra-structures (buildings and equipment) 122 248 429 93 747 182 -23.3
Administration and general services 11 012 681 12 020 234 9.1
TOTAL 2 219 371 403 2 319 019 235 4.5
Table 2.20 a) quantifies the sources of funding for Science and Technology, Information Society and Higher Education (as presented by Government for MCTES) for 2006. The results show private income (including tuition fees, but also other income) with about 40% of the overall budget for higher education, with a share among public universities and polytechnics as quantified in Table 2.20 b).
Table 2.20 – Sources of funding for 2006
a) Sources of funding for Science and Technology, Information Society and Higher Education (as presented by Government for MCTES)
Unit: €
State Budget Private income
European Structural Funds
Total
Science and Technology 219 989 671 21 112 182 151 130 519 392 232 372Information Society 42 434 946 3 343 534 102 126 344 147 904 824Higher Education 1 266 038 728 447 342 049 53 481 028 1 766 861 805current expenses (includes tuition fees) 1 077 303 628 391 066 407 1 468 370 035Social support system 155 735 100 49 009 488 204 744 588Infra-structures (buildings and equip.) 33 000 000 7 266 154 53 481 028 93 747 182Administration and general services 11 909 545 110 689 12 020 234
TOTAL 1 540 372 890 471 908 454 306 737 891 2 319 019 235

TERTIARY EDUCATION IN PORTUGAL: BACKGROUND REPORT
71
b) Sources of funding for Higher Education (as presented by Government)
Unit: €
State Budget Private income
European Structural Funds
Total
Sub-total for higher education – running costs) 1 077 303 628 391 066 407 1 468 370 035Universities 745 486 472 294 417 131 1 039 903 603Polytechnics 285 405 227 88 882 950 374 288 177Other (schools not integrated) (1) 26 180 667 7 269 341 33 450 008
Contractual Funding 20 231 262 496 985 20 728 247
Sub-total for social support system 155 735 100 49 009 488 204 744 588Universities 74 570 472 31 192 138 105 762 610Polytechnics 34 219 628 13 717 350 47 936 978EUL: University sports 1 025 000 4 100 000 5 125 000Other social support (Private system) 45 920 000 45 920 000Sub-total Investments (buildings) 33 000 000 7 266 154 53 481 028 93 747 182TOTAL 1 266 038 728 447 342 049 53 481 028 1 766 861 805
(1) Escolas Superiores de Enfermagem; Escola Superior de Hotelaria e Turismo do Estoril
Public funding for higher education, including teaching and research activities, is based on the main mechanisms described in Figure 2.9, namely:
• Public funding of higher education institutions:
− Direct basic funding of public institutions (through funding formula);
− Contractual funding of institutions (through contracts for specific issues);
− Direct funding of social support services (through funding formula since 2006) for: i) direct funding to students (i.e., social support of individual grants); and ii) indirect funding to students (i.e., meals, accommodation, sports, healthcare).
• Public funding for science and technology, S&T:
− Direct funding of institutions through R&D units based on their periodic evaluation and number of PhD researchers (through the Portuguese Science and Technology Foundation, FCT, defined upon evaluations every 3 years);
− Contractual funding of institutions (e.g., Associate Laboratories);
− Competitive funding for R&D activities (through R&D projects);
− Competitive funding for people (through individual grants for research students and contracts for researchers).
• Public funding for infrastructures (i.e., buildings and equipment)
• Public funding for the diffusion of information and communication technologies
TERTIARY EDUCATION IN PORTUGAL: BACKGROUND REPORT
72
Public funding of higher education institutions
Public funding of higher education institutions is implemented through central administration offices at the level of universities, polytechnic institutes and/or their schools (depending on internal autonomy levels) and includes three main components: i) basic funding through a funding formula; ii) contractual funding; and iii) direct funding of social support services (through a funding formula since 2006) for direct support through individual grants for students and for indirect funding of students through meals, accommodation, sports and healthcare.
Direct basic funding of public institutions has been based on a formula since the early 90’s, which was used to distribute the overall annual budget among public universities and polytechnics to cover for their running costs. The initial formula was designed in close collaboration with the Council of Rectors, CRUP, and the Coordinating Council of the Portuguese Polytechnics Institutes, CCISP, and it has evolved with time based on successive negotiations with CRUP and CCISP.
The distribution of funding through the formula is related with the costs supported by higher education institutions in their activity, related to the number of enrolled students, varying according to specific costs of each institution (in a way to account for diversity in the qualifications of teaching and non-teaching staffs) and the field of study (i.e., protecting some degrees that need more practical or laboratory classes, e.g., medical sciences and engineering). In general the formula takes into consideration the following aspects:
• the teacher/student ratio;
• the non-teaching staff/teacher ratio;
• the standard composition of the teaching and non-teaching staffs;
• the expenditure (and structure) of central administration (based on central administration personnel/student ratio); and
• the budget structure expressed in the percentage composition of personnel costs and other operational costs.
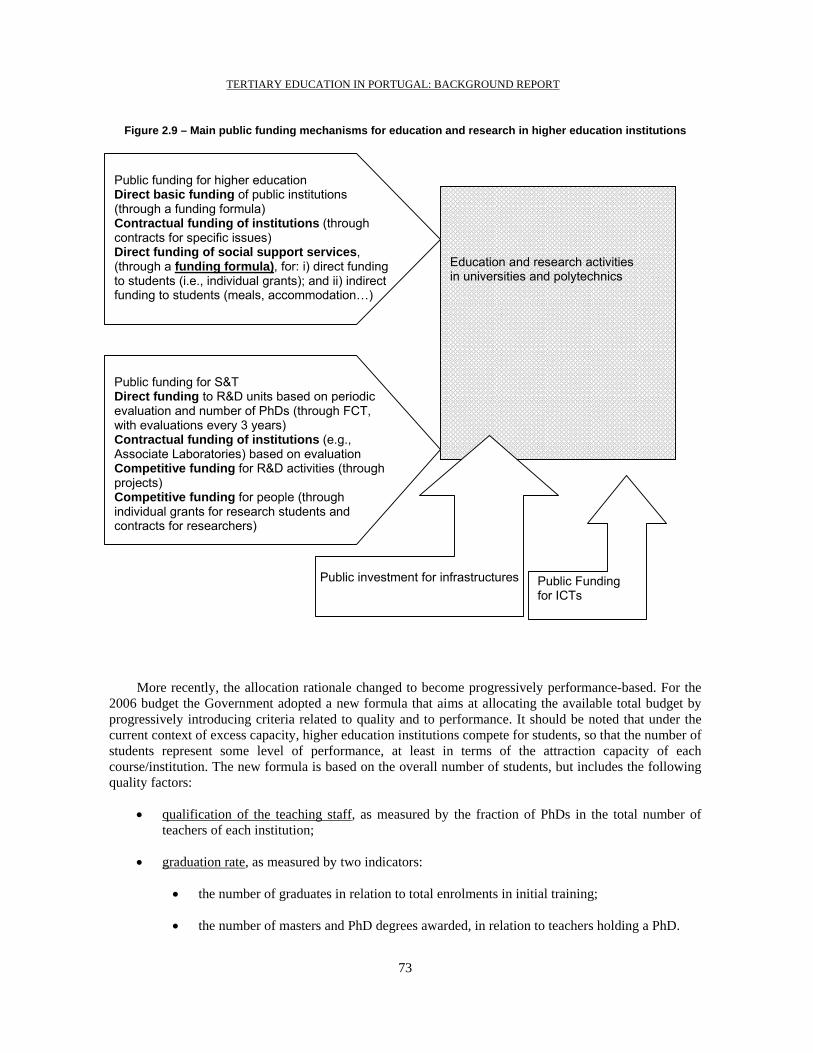
TERTIARY EDUCATION IN PORTUGAL: BACKGROUND REPORT
73
Figure 2.9 – Main public funding mechanisms for education and research in higher education institutions
u
More recently, the allocation rationale changed to become progressively performance-based. For the 2006 budget the Government adopted a new formula that aims at allocating the available total budget by progressively introducing criteria related to quality and to performance. It should be noted that under the current context of excess capacity, higher education institutions compete for students, so that the number of students represent some level of performance, at least in terms of the attraction capacity of each course/institution. The new formula is based on the overall number of students, but includes the following quality factors:
• qualification of the teaching staff, as measured by the fraction of PhDs in the total number of teachers of each institution;
• graduation rate, as measured by two indicators:
• the number of graduates in relation to total enrolments in initial training;
• the number of masters and PhD degrees awarded, in relation to teachers holding a PhD.
Education and research activities in universities and polytechnics
Public funding for S&T Direct funding to R&D units based on periodic evaluation and number of PhDs (through FCT, with evaluations every 3 years) Contractual funding of institutions (e.g., Associate Laboratories) based on evaluation Competitive funding for R&D activities (through projects) Competitive funding for people (through individual grants for research students and contracts for researchers)
Public investment for infrastructures Public Funding
for ICTs
Public funding for higher education Direct basic funding of public institutions (through a funding formula) Contractual funding of institutions (through contracts for specific issues) Direct funding of social support services, (through a funding formula), for: i) direct funding to students (i.e., individual grants); and ii) indirect funding to students (meals, accommodation…)

TERTIARY EDUCATION IN PORTUGAL: BACKGROUND REPORT
74
The formula includes the following two institutional factors to answer to specific characteristics of each individual institution and training area:
• average personnel cost for each institution, to account for the specific characteristics of the teaching and non-teaching staffs of each institution;
• student/teacher ratio for each scientific area.
In addition, the formula contains cohesion factors (maximum and minimum limits to the budget variation relative to the previous year) to ensure that no institution will be faced with excessive budget cuts, although it may attenuate the effects of the quality parameters.
Table 2.21 – Criteria used in the Funding Formula developed for 2006
Terms in the new funding formula Description
Overall number of students Number of students for all the courses approved for public funding
Staff average costs (indirect measure of qualification)
Teacher/student ratios
Teacher/non academic staff ratios Cost factor to allow considering specific institutional characteristics, as well as to differentiate areas of study Funding depends on reference costs calculated using the same criteria
for every institution, using a predefined relationship between other current expenses and personnel costs (15/85)
Level of the academic staff qualification (fraction of the academic staff holding PhDs)
Graduation efficiency rate Quality indicators
Post-graduation efficiency rates (masters and PhDs awarded)
The formula to distribute public basic funding for higher education institutions since 2006 is as
follows:
[ ] DQjEjFijIijOTji
****∑=
Where OTj = Public basic funding level for higher education institution j Iij = Student enrolments estimate in study area i of institution j Fij = Cost factor for study area i in institution j = Graduation efficiency for initial training students in institution j E = Scientific efficiency for advanced training students in institution j Qj = Faculty members qualification level in institution j D = Theoretical national minimum funding level constant
Table 2.22 quantifies the final application of the formula and the level of funding for each institution in 2006, which was obtained after applying the inter-institutional cohesion factor that limits the annual funding level variation to the interval [-2%; + 5%]. It shows that the overall level of basic funding per student (social support to be added) is about 4,022 € for initial graduate programmes, with values varying between 4,403 € for universities and 3,383 € for polytechnics.
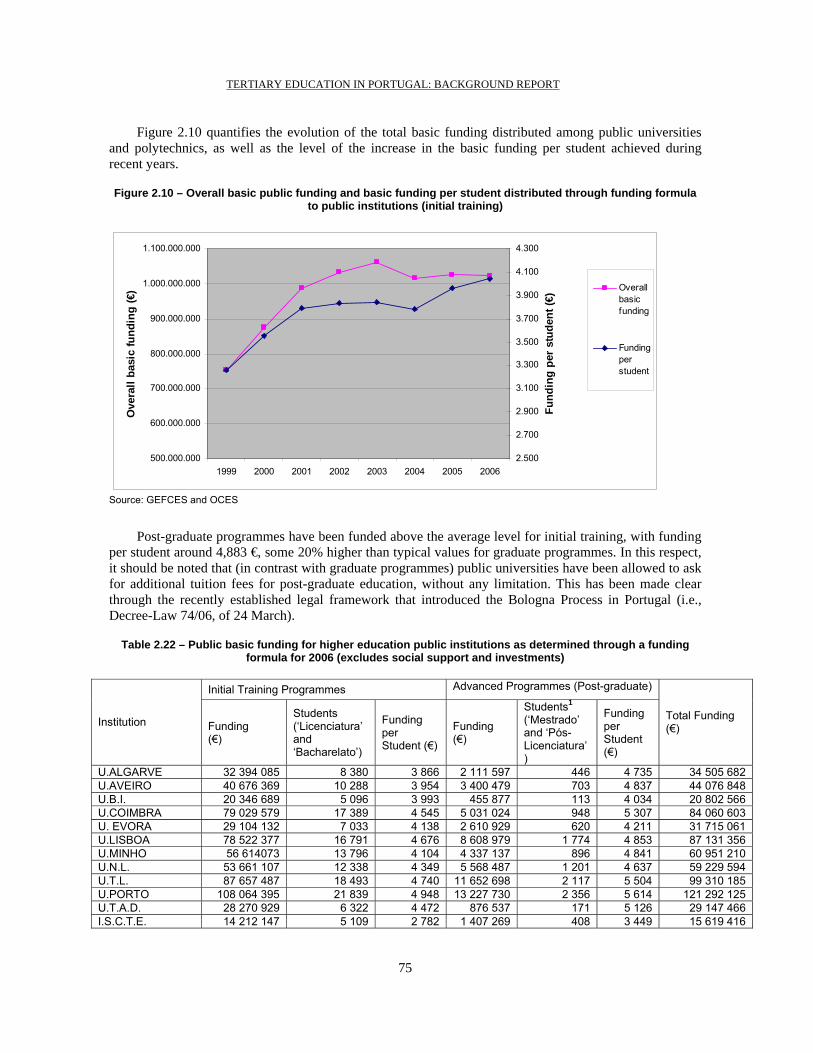
TERTIARY EDUCATION IN PORTUGAL: BACKGROUND REPORT
75
Figure 2.10 quantifies the evolution of the total basic funding distributed among public universities and polytechnics, as well as the level of the increase in the basic funding per student achieved during recent years.
Figure 2.10 – Overall basic public funding and basic funding per student distributed through funding formula to public institutions (initial training)
500.000.000
600.000.000
700.000.000
800.000.000
900.000.000
1.000.000.000
1.100.000.000
1999 2000 2001 2002 2003 2004 2005 2006
Ove
rall
basi
c fu
ndin
g (€
)
2.500
2.700
2.900
3.100
3.300
3.500
3.700
3.900
4.100
4.300
Fund
ing
per
stud
ent (
€)
Overallbasicfunding
Fundingperstudent
Source: GEFCES and OCES
Post-graduate programmes have been funded above the average level for initial training, with funding per student around 4,883 €, some 20% higher than typical values for graduate programmes. In this respect, it should be noted that (in contrast with graduate programmes) public universities have been allowed to ask for additional tuition fees for post-graduate education, without any limitation. This has been made clear through the recently established legal framework that introduced the Bologna Process in Portugal (i.e., Decree-Law 74/06, of 24 March).
Table 2.22 – Public basic funding for higher education public institutions as determined through a funding formula for 2006 (excludes social support and investments)
Initial Training Programmes Advanced Programmes (Post-graduate)
Institution Funding (€)
Students (‘Licenciatura’ and ‘Bacharelato’)
Funding per Student (€)
Funding (€)
Students1 (‘Mestrado’ and ‘Pós-Licenciatura’)
Funding per Student (€)
Total Funding (€)
U.ALGARVE 32 394 085 8 380 3 866 2 111 597 446 4 735 34 505 682 U.AVEIRO 40 676 369 10 288 3 954 3 400 479 703 4 837 44 076 848 U.B.I. 20 346 689 5 096 3 993 455 877 113 4 034 20 802 566 U.COIMBRA 79 029 579 17 389 4 545 5 031 024 948 5 307 84 060 603 U. EVORA 29 104 132 7 033 4 138 2 610 929 620 4 211 31 715 061 U.LISBOA 78 522 377 16 791 4 676 8 608 979 1 774 4 853 87 131 356 U.MINHO 56 614073 13 796 4 104 4 337 137 896 4 841 60 951 210 U.N.L. 53 661 107 12 338 4 349 5 568 487 1 201 4 637 59 229 594 U.T.L. 87 657 487 18 493 4 740 11 652 698 2 117 5 504 99 310 185 U.PORTO 108 064 395 21 839 4 948 13 227 730 2 356 5 614 121 292 125 U.T.A.D. 28 270 929 6 322 4 472 876 537 171 5 126 29 147 466 I.S.C.T.E. 14 212 147 5 109 2 782 1 407 269 408 3 449 15 619 416

TERTIARY EDUCATION IN PORTUGAL: BACKGROUND REPORT
76
U.AÇORES 13 830 580 2 731 5 064 916 449 176 5 207 14 747 029 U.MADEIRA 9 736.517 2 484 3 920 604 076 139 4 346 10 340 593 TOTAL UNIVERSITIES 651.963.745 148 089 4 403 60 965 989 12 068 5 052 712 929 734
IP BEJA 11 872 337 2 965 4 004 11 872 337 IP BRAGANÇA 17 427 958 5 098 3 419 17 427 958 IP C.BRANCO 16 128 549 4 298 3 753 138 471 25 5 539 16 267 020 IP CAV E AVE 2 804 546 1 465 1 914 2 804 546 IP COIMBRA 28 722 800 8 846 3 247 28 722 800 IP GUARDA 11 885 396 3 212 3 700 11 885 396 IP LEIRIA 22 784 204 8 847 2 575 22 784 204 IP LISBOA 46 864 246 13 482 3 476 46 864 246 IP PORTALEGR. 9 262 527 2 962 3 127 9 262 527 IP PORTO 46 267 794 14 907 3 104 46 267 794 IP SANTAREM 12 812 994 3 517 3 643 12 812 994 IP TOMAR 9 320 814 3 101 3 006 9 320 814 IP SETUBAL 18 509 090 5 506 3 362 18 509 090 IP V.CASTELO 10 552 540 2 852 3 700 10 552 540 IP VISEU 18 271 489 5 770 3 167 310 880 60 5 181 18 582 369 ESUP HOT. TUR. ESTORIL 2 482 334 1 072 2 316 2 482 334
ESUP ENF BISS. BARRETO 3 931 022 714 5 506 3 931 022
ESUP ENF DR. ÂNG FONSECA 4 544 372 714 6 365 4 544 372
ESUP ENF ARTUR RAVARA 1 876 764 288 6 517 1 876 764
ESUP ENF Mª Fª RESENDE 2 329 869 290 8 034 2 329 869
ESUP ENF FRANC. GENTIL 1 874 588 238 7 876 1 874 588
ESUP ENF CAL GULB. LISBOA 2 927 951 384 7 625 2 927 951
ESUP ENF CIDADE PORTO 1 633 603 181 9 025 1 633 603
ESUP ENF SÃO JOÃO 2 588 813 522 4 959 158 667 29 5 471 2 747 480
ESUP ENF D. ANA GUEDES 1 832 684 265 6 916 1 832 684
TOTAL POLYTECHNICS 309 505 021 91 496 3 383 612 281 114 5 371 310 117 302
TOTAL 963 559 068 239 585 4 022 59 487 968 12 182 4 883 1 023 047 036
Contractual funding with institutions was established under the current funding law of higher education through specific contracts. It represented public funding above the basic funding for higher education (as determined through a funding formula) and the contracts established in recent past are quantified in Tables 2.23 and 2.24, respectively for specific “contract-programmes” and for new buildings through “development contracts”.

TERTIARY EDUCATION IN PORTUGAL: BACKGROUND REPORT
77
Table 2.23 – Overall contractual funding with institutions of higher education in recent years as established through “Contract-Programmes” funded by the State Budget
(Euros)
Public Higher Education System 2004 2005 2006 2007 Total
Universities* 5.076.985 6.383.664 6.442.617 7.448.334 25.351.600
Polytechnics 4062538 3027901 2584499 1196062 10.871.000
Total 9.139.523 9.411.565 9.027.116 8.644.396 36.222.600
* Includes one contract with the Portuguese Catholic University (Private)
Table 2.24 – Overall contractual funding with institutions of higher education as established through “Development Contracts”, funded by the State Budget and FEDER (only partly spent, as by April 2006)
PIDDAC+EU Public BudgetUniversidade do Minho 2000-03 20.674.000Universidade da Beira Interior started 2000 20.674.000Universidade de Lisboa 2002-06 21.024.000 289.300Universidade de Nova de Lisboa 2002-06 17.870.000 239.423Universidade de Coimbra 2002-06 33.638.000 224.459Universidade do Porto 2002-06 37.842.000 319.230Universidade Técnica de Lisboa - IST 2005-10 14.000.000Instituto Politécnico de Beja 2005-10 12.289.305Universidade Politécnico de Castelo Branco 2004-10 16.487.034
Funding (€)PeriodHigher Education Institutions
Until 2005 funding of the social support services had been based on expenses from the previous year, a form of historical record, through the direct funding of public institutions (public universities and polytechnics) and of students in private institutions. It accounted for: i) direct funding to students (i.e., social support of individual grants); and ii) indirect funding to students (i.e., meals, accommodation, sports, health care), as quantified in Table 2.25.
Table 2.25 – Direct funding of social support services, 2000-2006 (Unit: €)
Funding to Public Institutions 94.475.744 97.536.477 102.963.308 102.963.308 117.824.068 132.728.745 127.710.100
Funding to Private Institutions 25.830.055 27.433.884 29.429.076 27.430.059 27.000.000 27.000.000 27.000.000
Total (1+2) 120.305.799 124.970.361 132.392.384 130.393.367 144.824.068 159.728.745 154.710.100
2004 2005 2006Higher Education System 2000 2001 2002 2003
NOTE: Does not include other sources of private income and public investments for infrastructure and equipment.
Source: DGES
Since the 2006 annual budget, the direct funding of social support services of public institutions has been defined through a funding formula, that is based on two calculation elements:
• the service level of each support service, measured trough the number and average cost of scholarships, meals and occupied places in student residences registered in the previous year;
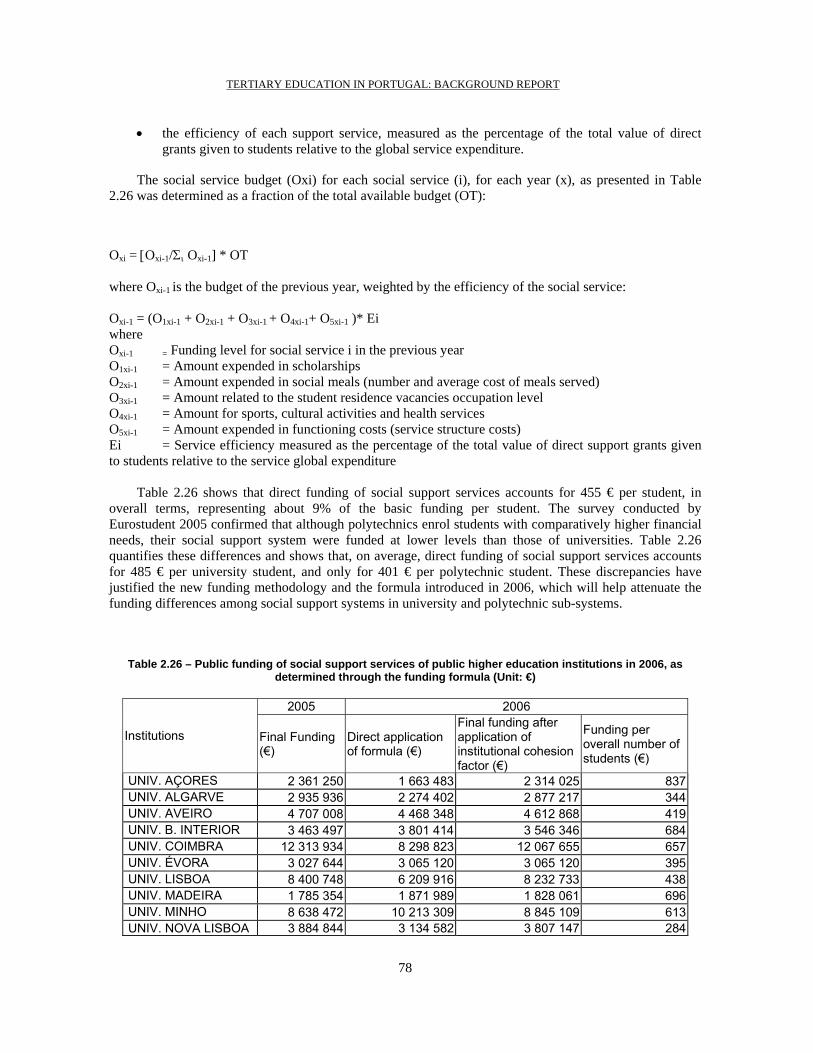
TERTIARY EDUCATION IN PORTUGAL: BACKGROUND REPORT
78
• the efficiency of each support service, measured as the percentage of the total value of direct grants given to students relative to the global service expenditure.
The social service budget (Oxi) for each social service (i), for each year (x), as presented in Table 2.26 was determined as a fraction of the total available budget (OT):
Oxi = [Oxi-1/Σι Oxi-1] * OT where Oxi-1 is the budget of the previous year, weighted by the efficiency of the social service: Oxi-1 = (O1xi-1 + O2xi-1 + O3xi-1 + O4xi-1+ O5xi-1 )* Ei where Oxi-1 = Funding level for social service i in the previous year O1xi-1 = Amount expended in scholarships O2xi-1 = Amount expended in social meals (number and average cost of meals served) O3xi-1 = Amount related to the student residence vacancies occupation level O4xi-1 = Amount for sports, cultural activities and health services O5xi-1 = Amount expended in functioning costs (service structure costs) Ei = Service efficiency measured as the percentage of the total value of direct support grants given to students relative to the service global expenditure
Table 2.26 shows that direct funding of social support services accounts for 455 € per student, in overall terms, representing about 9% of the basic funding per student. The survey conducted by Eurostudent 2005 confirmed that although polytechnics enrol students with comparatively higher financial needs, their social support system were funded at lower levels than those of universities. Table 2.26 quantifies these differences and shows that, on average, direct funding of social support services accounts for 485 € per university student, and only for 401 € per polytechnic student. These discrepancies have justified the new funding methodology and the formula introduced in 2006, which will help attenuate the funding differences among social support systems in university and polytechnic sub-systems.
Table 2.26 – Public funding of social support services of public higher education institutions in 2006, as determined through the funding formula (Unit: €)
2005 2006
Institutions Final Funding (€)
Direct application of formula (€)
Final funding after application of institutional cohesion factor (€)
Funding per overall number of students (€)
UNIV. AÇORES 2 361 250 1 663 483 2 314 025 837 UNIV. ALGARVE 2 935 936 2 274 402 2 877 217 344 UNIV. AVEIRO 4 707 008 4 468 348 4 612 868 419 UNIV. B. INTERIOR 3 463 497 3 801 414 3 546 346 684 UNIV. COIMBRA 12 313 934 8 298 823 12 067 655 657 UNIV. ÉVORA 3 027 644 3 065 120 3 065 120 395 UNIV. LISBOA 8 400 748 6 209 916 8 232 733 438 UNIV. MADEIRA 1 785 354 1 871 989 1 828 061 696 UNIV. MINHO 8 638 472 10 213 309 8 845 109 613 UNIV. NOVA LISBOA 3 884 844 3 134 582 3 807 147 284

TERTIARY EDUCATION IN PORTUGAL: BACKGROUND REPORT
79
UNIV. PORTO 10 043 897 7 330 043 9 843 019 407 UNIV. T.LISBOA 9 356 004 7 602 403 9 168 884 446 U.T.M.A. DOURO 4 451 314 3 889 828 4 362 288 713 TOTAL UNIVERSITIES 75 369 902 63 823 660 74 570 472 485 IP BEJA 1 547 402 2 135 174 1 584 417 538 IP BRAGANÇA 2 908 698 4 175 433 2 978 276 592 IP C. BRANCO 2 241 453 3 478 110 2 295 070 529 IP COIMBRA 3 097 601 4 035 034 3 171 697 367 IP GUARDA 1 617 899 2 305 985 1 656 600 517 IP LEIRIA 3 278 990 4 809 247 3 357 425 395 IP LISBOA 2 959 266 3 625 684 3 030 053 222 IP PORTALEGRE 1 737 722 2 187 565 1 779 289 541 IP PORTO 2 607 125 3 221 653 2 669 489 183 IP SANTARÉM 1 904 952 2 288 344 1 950 520 549 IP SETÚBAL 2 493 636 3 570 610 2 553 285 438 IP TOMAR 1 989 620 2 505 998 2 037 213 645 IP V. CASTELO 1 570 164 2 210 209 1 607 723 555 IP VISEU 3 465 670 4 417 395 3 548 571 622 TOTAL POLYTECHNICS 33 420 198 44 966 440 34 219 628 401
TOTAL 108 790 100 108 790 100 108 790 100 455 Source: DGESUP
Table 2.27 quantifies the type of support through the budget devoted to social support services and shows that direct student support through scholarships accounted only for about 53% of the overall budget. Again, the funding methodology adopted in 2006 aims to increase that value by rewarding those services that maximise the direct support to students.
Table 2.27 – Allocation of the state budget for social support services in 2006
Type of Expenses Funding (€) % / Total
1. Current Expenses 108.686.100 85,1%
(a) Personnel 33.800.172 26,5%
(a) Student Grants 67.788.505 53,1%
(b) Other Expenses 7.097.423 5,6%
2. Capital Expenses 104.000 0,1%
3. Nursing and Health Technologies Schools 3.280.681 2,6%
4.Common Endowments 15.639.319 12,2%
Total Funding to Public Institutions (1+2+3+4) 127.710.100 100,0%
Public funding for science and technology, S&T, in higher education
Tables 2.28 and 2.29 provide a general picture of the funding level for science and technology in Portugal when compared internationally. Gross expenditure in R&D has increased steadily since 1995 from 0.57% of GDP to 0.85% of GDP in 2001, but decreased since then to 0.78% of GDP in 2003.

TERTIARY EDUCATION IN PORTUGAL: BACKGROUND REPORT
80
Table 2.28 – Total expenditure in R&D, 1982-2003
Current prices Constant prices1 t.m.c.a.2 PPCC3 GERD/GDPYear 1 000 € 1 000 € % (Millions US$) %
1982 32 627.4 196 745.5 - 185.3 0.30 1984 56 402.1 218 927.1 5.5 222.4 0.34 1986 99 099.2 262 331.1 9.5 280.8 0.38 1988 149 194.4 322 691.9 10.9 367.1 0.41 1990 259 535.5 448 933.2 17.9 550.6 0.51 1992 401 022.5 565 400.6 12.2 734.2 0.61 1995 460 037.1 544 404.2 -1.3 753.5 0.57 1997 576 882.9 638 583.2 8.3 907.6 0.62 1999 814 746.7 842 966.2 14.9 1 255.1 0.75 2001 1 038 431.7 995 909.8 8.7 1 578.4 0.85 2003 1 019 581.0 911 467.1 -4.3 1 527.3 0.78
Notes: 1 GDP Implicit deflectors (2000=1), Main Science and Technology Indicators, OECD, 2005(1) - Database; 2 Average yearly growth rate at constant prices; 3 PPPs at constant prices, OECD (ibid); 4 GDP values published by OECD (ibid).
Government expenditure accounts for more than 60% of the overall expenditure in R&D in Portugal, while the average European value is below 35%. On the other hand, private expenditure in R&D in the European Union accounts for almost 55% of the overall expenditure, whereas it is only 32% in Portugal.
Table 2.29 – Gross domestic expenditure on R&D (GERD) by source of funds (%)
1994 1995 1996 1997 1998 1999 2000 2001 2002 2003
EU15 36.8s 35.9s 35.5s 34.1s 33.8s 33.7s 33.7s 34.7s
Gov
ernm
ent
Portugal 59.4e 65.3 66.9e 68.2 69.1e 69.7 64.8e 61 60.5e 60.1
EU15 53.4s 53.6s 54.2s 55.5s 55.5s 55.6s 55.3s 54.6s
Indu
stry
Portugal 20.2e 19.5 20.5e 21.2 21.3 21.3 27.1 31.5 31.6e 31.7
EU15 7.7s 8.2s 8.2s 8.2s 8.4s 8.5s 8.7s 8.5s
Abr
oad
Portugal 15.0e 11.9b 8.7e 6.1b 5.7 5.3 5.2 5.1 5e 5
s – EUROSTAT estimate; e – Estimated value; b – Break in series; Source: EUROSTAT, 2005
Table 2.30 presents the evolution of the total expenditure in R&D at constant and current prices and shows that higher education institutions represent the largest share of the expenditure in R&D. Since most non-profit institutions are also associated to universities, analysis shows that higher education represents almost 50% of the total expenditure in R&D.
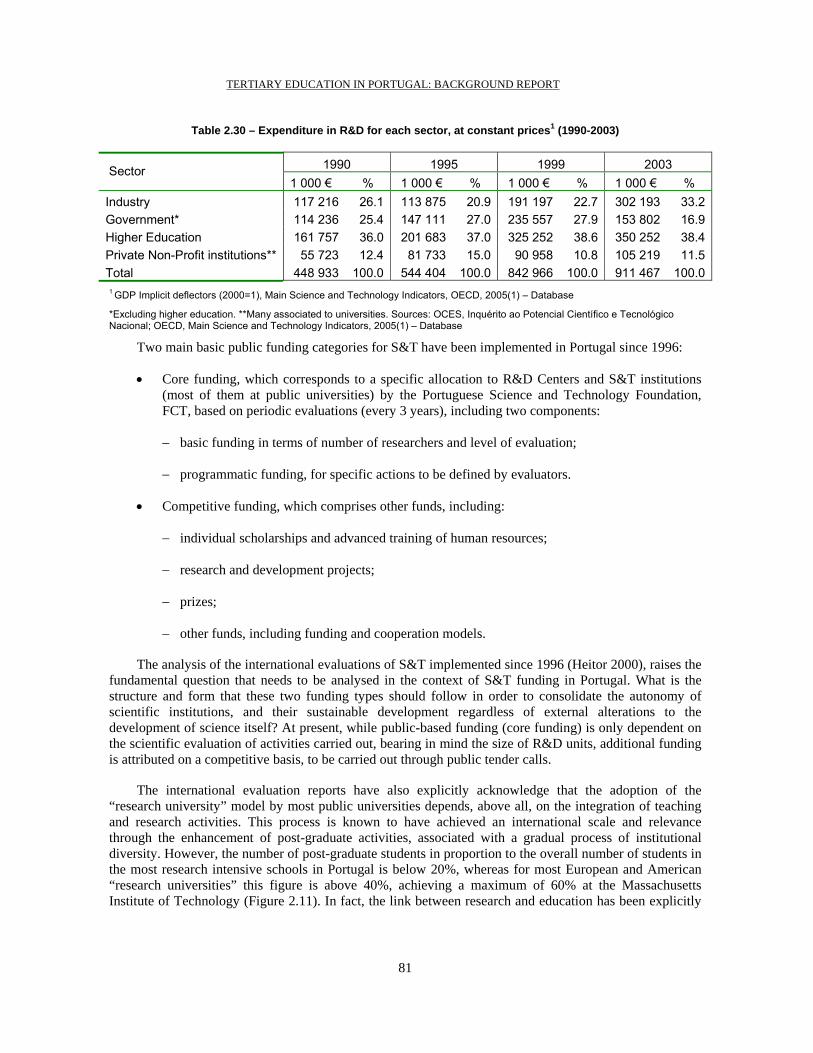
TERTIARY EDUCATION IN PORTUGAL: BACKGROUND REPORT
81
Table 2.30 – Expenditure in R&D for each sector, at constant prices1 (1990-2003)
1990 1995 1999 2003 Sector 1 000 € % 1 000 € % 1 000 € % 1 000 € %
Industry 117 216 26.1 113 875 20.9 191 197 22.7 302 193 33.2Government* 114 236 25.4 147 111 27.0 235 557 27.9 153 802 16.9Higher Education 161 757 36.0 201 683 37.0 325 252 38.6 350 252 38.4Private Non-Profit institutions** 55 723 12.4 81 733 15.0 90 958 10.8 105 219 11.5Total 448 933 100.0 544 404 100.0 842 966 100.0 911 467 100.0
1 GDP Implicit deflectors (2000=1), Main Science and Technology Indicators, OECD, 2005(1) – Database
*Excluding higher education. **Many associated to universities. Sources: OCES, Inquérito ao Potencial Científico e Tecnológico Nacional; OECD, Main Science and Technology Indicators, 2005(1) – Database
Two main basic public funding categories for S&T have been implemented in Portugal since 1996:
• Core funding, which corresponds to a specific allocation to R&D Centers and S&T institutions (most of them at public universities) by the Portuguese Science and Technology Foundation, FCT, based on periodic evaluations (every 3 years), including two components:
− basic funding in terms of number of researchers and level of evaluation;
− programmatic funding, for specific actions to be defined by evaluators.
• Competitive funding, which comprises other funds, including:
− individual scholarships and advanced training of human resources;
− research and development projects;
− prizes;
− other funds, including funding and cooperation models.
The analysis of the international evaluations of S&T implemented since 1996 (Heitor 2000), raises the fundamental question that needs to be analysed in the context of S&T funding in Portugal. What is the structure and form that these two funding types should follow in order to consolidate the autonomy of scientific institutions, and their sustainable development regardless of external alterations to the development of science itself? At present, while public-based funding (core funding) is only dependent on the scientific evaluation of activities carried out, bearing in mind the size of R&D units, additional funding is attributed on a competitive basis, to be carried out through public tender calls.
The international evaluation reports have also explicitly acknowledge that the adoption of the “research university” model by most public universities depends, above all, on the integration of teaching and research activities. This process is known to have achieved an international scale and relevance through the enhancement of post-graduate activities, associated with a gradual process of institutional diversity. However, the number of post-graduate students in proportion to the overall number of students in the most research intensive schools in Portugal is below 20%, whereas for most European and American “research universities” this figure is above 40%, achieving a maximum of 60% at the Massachusetts Institute of Technology (Figure 2.11). In fact, the link between research and education has been explicitly

TERTIARY EDUCATION IN PORTUGAL: BACKGROUND REPORT
82
recognised in the different international evaluations carried out by FCT as a priority for scientific development.
Figure 2.11 shows that the high number of post-graduate students is associated with highly competitive based funding schemes devoted to research activities, indicating that these students are important to form essential critical masses for the accomplishment of research activities in a framework of competitive R&D funding.
Figure 2.12 compares the financial resources allocated to sample Portuguese, European and American universities, quantifying to a certain extent the under funding level of S&T activities, which has thwarted research activities in Portugal. In comparison with well considered universities worldwide (namely intensive research universities6 and master colleges/universities7, according to the Carnegie Classification), the analysis shows that the total budget of a typical Portuguese University (i.e., the Technical University of Lisbon, UTL) is about 20% of the overall budget of the extensive research universities8 with a smaller budget, such as Georgia Institute of Technology and University of Maryland Baltimore. Considering only European universities, it can be concluded that the UTL overall budget is three times smaller than that of the University of Karlsruhe (German university with the smallest budget) and half the overall budget of Trinity College, Ireland.
6 These institutions offer a wide variety of undergraduate programmes, and give emphasis to post-graduate
education, through doctoral programmes. In general, at least ten PhD diplomas are awarded in three or more courses, or a total of 20 PhD awards every year.
7 These institutions offer a wide variety of undergraduate programmes, and give emphasis to post-graduate education, through Master’s programmes. In general, at least forty Master’s diplomas are awarded every year, in three or more courses.
8 These institutions offer a wide variety of undergraduate programmes, and give emphasis to post-graduate education, through doctoral programmes. In general, at least fifty PhD diplomas are awarded every year in, at least, 15 courses.
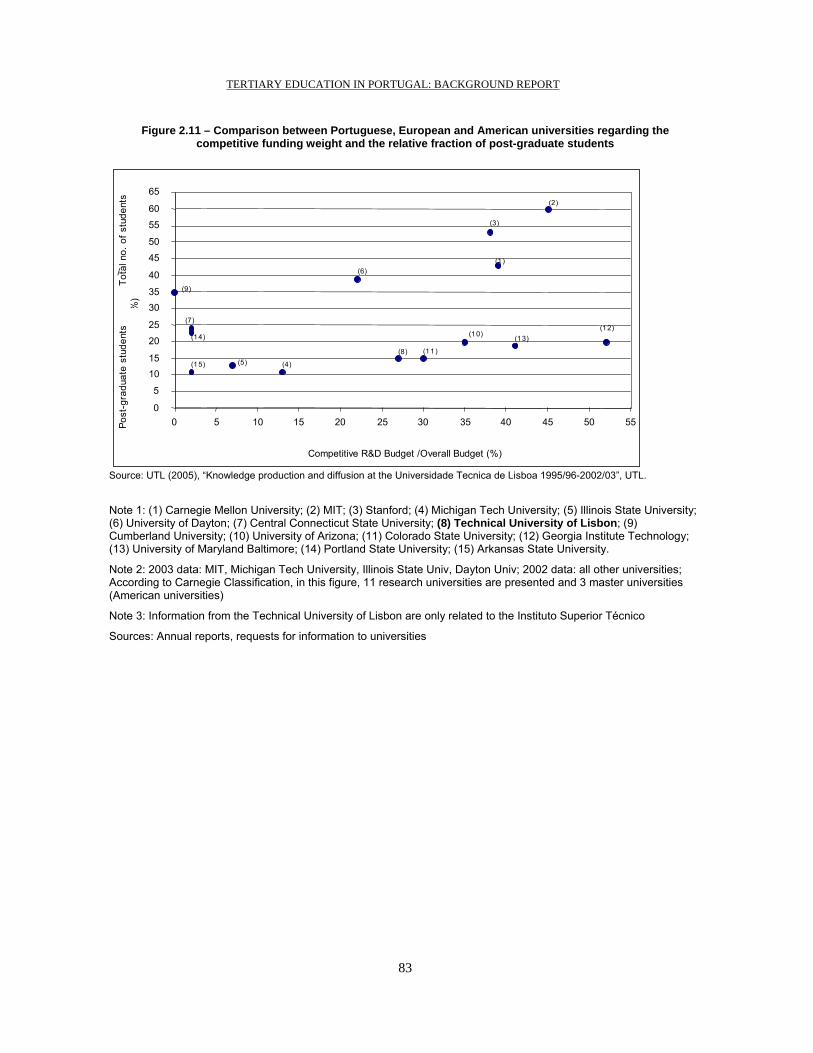
TERTIARY EDUCATION IN PORTUGAL: BACKGROUND REPORT
83
Figure 2.11 – Comparison between Portuguese, European and American universities regarding the competitive funding weight and the relative fraction of post-graduate students
(6)
(3)
(9)
(4)
(10) (13)
(7)
(5) (11 )
(2)
(8)
(1 )
(15)
(14) (12)
0 5
10 15 20 25 30 35 40 45 50 55 60 65
0 5 10 15 20 25 30 35 40 45 50 55
Competitive R&D Budget /Overall Budget (%)
Post
-gra
duat
e st
uden
ts
/
Tota
l no.
of s
tude
nts
%)
Source: UTL (2005), “Knowledge production and diffusion at the Universidade Tecnica de Lisboa 1995/96-2002/03”, UTL.
Note 1: (1) Carnegie Mellon University; (2) MIT; (3) Stanford; (4) Michigan Tech University; (5) Illinois State University; (6) University of Dayton; (7) Central Connecticut State University; (8) Technical University of Lisbon; (9) Cumberland University; (10) University of Arizona; (11) Colorado State University; (12) Georgia Institute Technology; (13) University of Maryland Baltimore; (14) Portland State University; (15) Arkansas State University.
Note 2: 2003 data: MIT, Michigan Tech University, Illinois State Univ, Dayton Univ; 2002 data: all other universities; According to Carnegie Classification, in this figure, 11 research universities are presented and 3 master universities (American universities)
Note 3: Information from the Technical University of Lisbon are only related to the Instituto Superior Técnico
Sources: Annual reports, requests for information to universities

TERTIARY EDUCATION IN PORTUGAL: BACKGROUND REPORT
84
Figure 2.12 – Comparison between the level of funding in Portuguese, European and American universities in terms of volume of the overall budget of universities and the funding weight allocated to R&D on a competitive
basis
(18)
(17) (12)
(14) (15)
(1)
(8)
(2)
(11)
(5) (7)
(19)
(13)
(10)
(4)
(20)
(16)
(21)
(9)
(3)
(6)
0
500.000
1.000.000
1.500.000
2.000.000
0 5 10 15 20 25 30 35 40 45 50 55 60
Competitive R&D funding / Global budget (%)
Glo
bal B
udge
t (th
ousa
nd d
olla
rs
Source: UTL(2005), “Knowledge production and diffusion at the Universidade Tecnica de Lisboa 1995/96-2002/03”, UTL.
Note 1: (1) Carnegie Mellon University; (2) MIT; (3) Stanford; (4) Michigan Tech University; (5) Illinois State University; (6) University of Dayton; (7) Central Connecticut State University; (8) Technical University of Lisbon; (9) Cumberland University; (10) University of Arizona; (11) Colorado State University; (12) Georgia Institute of Technology; (13) University of Maryland Baltimore; (14) Portland State University; (15) Arkansas State University; (16) Trinity College; (17) U Karlsruhe; (18) U Erlangen-Nürnberg; (19) TU Berlin; (20) U Frankfurt a.M.; (21) TH Aachen
Note 2: 2003 data: MIT, Michigan Tech University, Illinois State Univ, Dayton Univ; 2002 data: all other characteristics; According to Carnegie Classification, this figure shows 11 research universities and 3 master universities (American universities)
Note 3: In the absence of other information, the UTL data only refer to the Instituto Superior Técnico
The funding differences identified have, naturally, an impact on teaching and research results, and are
an element that distinguishes Portuguese universities on an international scale. In terms of teaching, because a larger funding effort allows students to be provided with more resources to support learning, more professors and support staff can be hired, and more infrastructures can be created and maintained in order to improve the quality of teaching programmes. As for research, it allows professors, researchers, technicians and administrative staff to be recruited, and makes it possible to acquire and maintain laboratory and research material, thus providing the institution with larger capacity to capture and maintain post-graduate students. Thus, Figure 2.13 shows that in comparison with MIT of Boston and Carnegie Mellon of Pittsburgh, the competitive funding per professor in a typical Portuguese university is, respectively, about sixteen and six times smaller. In turn, the funding per student in Portuguese universities is at least ten times smaller than in those universities

TERTIARY EDUCATION IN PORTUGAL: BACKGROUND REPORT
85
Figure 2.13 – Comparison of the degree of competitive funding per professor and funding per student between Portuguese and American universities
(6)
(3)
(9) (4) (10)
(7) (5)
(2)
(8)
(1)
(12) (11)
0
100.000
200.000
300.000
400.000
500.000
600.000
700.000
800.000
0 20.000 40.000 60.000 80.000 100.000 120.000 140.000 160.000 180.000
Competitive R&D funding / Teaching body (US dollars)
Tota
l bud
get /
Tot
al s
tude
nts
(US
dolla
rs)
Source: UTL (2005), “Knowledge production and diffusion at the Universidade Tecnica de Lisboa 1995/96-2002/03”, UTL.
Note 1: (1) Carnegie Mellon University; (2) MIT; (3) Stanford; (4) Michigan Tech University; (5) Illinois State Note 1: (1) Carnegie Mellon University; (2) MIT; (3) Stanford; (4) Michigan Tech University; (5) Illinois State University; (6) University of Dayton; (7) Central Connecticut State University; (8) Technical University of Lisbon; (9) Cumberland University; (10) University of Maryland Baltimore; (11) Portland State University; (12) Arkansas State University.
Note 2: 2003 data: MIT, Michigan Tech University, Illinois State Univ, Dayton Univ; 2002 data: all other universities; According to Carnegie Classification, this figure shows 11 research universities and 3 master universities (American universities)
Note 3: In the absence of other information, the UTL data refers only to the Instituto Superior Técnico
Public funding for infrastructures in higher education (i.e., buildings and equipment)
Public support for infrastructures in higher education has considered investments in new buildings and equipment over the last three decades, with major investment made since 1990, as quantified in Figure 2.14. The institutions have negotiated individually with the Government, through DGES, their own development plans, which resulted in a considerable extension of physical infrastructures throughout the country. Table 2.31 shows that the overall public investment, over 15 years, per current student was about 4 647 €.

TERTIARY EDUCATION IN PORTUGAL: BACKGROUND REPORT
86
Figure 2.14 – Evolution of public investment for buildings and equipments in higher education (€) for 1990 - 2004 (i.e., PIDDAC; includes national funds, FN, and European structural funds, FE)
Source: GEFCES
Table 2.31 – Overall public investment in buildings and equipments in higher education (€) for 1990 – 2004
Sub-system Contribution from the State budget
(1990-2004) (1)
European Structural
Funds (1990-2004)
(2)
Total funding (1990-2004)
(3) = (1)+(2)
Total funding per student*
(1990-2004) (4)
Universities 689 632 925 207 699 698 897 332 623 5 162 Polytechnics 236 503 279 104 755 595 341 258 874 3 881 Nursing schools 26 508 140 0 26 508 140 2 525 Total 952 644 344 312 455 293 265 099 637 4 647 * number of students calculated in December 2004. Source: GEFCES
Public funding for the diffusion of information and communication technologies, ICTs
In addition to public funding for teaching and research activities, public support of higher education institutions also considered the support for the diffusion of information and communication technologies, including the promotion of “e-learning” and the establishment of “virtual campus”, as quantified in Table 2.32.
“Virtual campus” is an initiative aiming at the creation and development of Services, Contents, Applications and Mobile Communications Networks (inside and outside University) for students and teachers of higher education, inciting and easing the production, access and share of knowledge. Various integrated projects were supported since 2003, including wireless connectivities (WIFI networks) and new contents (teaching and academic services) aiming at:

TERTIARY EDUCATION IN PORTUGAL: BACKGROUND REPORT
87
• the creation of educational contexts enabling teachers and students to use means and tools of the information society in order to improve the quality and effectiveness of educational system;
• the creation of didactic contents supported by multidisciplinary educational programmes, including collaboration activities between agents of the educational system.
Table 2.32 – Public funding for the establishment of “virtual campus” in Portugal
Nr. of projects Funding (€) Nr. of projects Funding (€) Nr. of projects Funding (€)
Universities 10 9.874.098 4 3.656.181 14 13.530.278
Politechnics 10 5.413.939 7 3.469.174 17 8.883.113
Private Institutions 11 4.424.669 21 5.584.149 32 10.008.818
Total 31 19.712.706 32 12.709.504 63 32.422.210
1st phase (2003-2006) 2nd phase (2004-2006)Higher Education System
Total
Source: UMIC, Agency for Knowledge Society
Evolution of the main categories of income
The evolution of the funds available for the public sub-system indicates different trends according to the source considered. During the expansion phase of the 90´s there was a clear increase in the funds transferred to public universities from the public budget. From 2001 to 2004 the increase in enrolments has slowed down and there was an average annual increase of the overall budget equal to 3.39% (Table 2.33) at current prices. It can be observed that public funds for investment decreased on average 5.37% over the same period. Indeed, due to the large investments in infrastructures over the last decades and the decreasing number of candidates to higher education, it is possible that the existing physical capacity be already under utilised.
Table 2.33 – The annual rate of change of the budget of public higher education institutions
Income – annual variation rate (%)
Public budget Fees Earned
income Investment Total
2001-02 3.64 11.80 6.55 -0.30 4.462002-03 0.42 8.46 -0.28 1.17 0.852003-04 -1.77 44.59 18.26 -16.99 4.87Average 0.76 21.62 8.18 -5.37 3.39
Source: GEFCES, MCTES, 2005
Table 2.33 also shows an increase in the revenues from tuition fees (average of 21.62% over the 2001-04 period), which was due to the increase in the absolute value of fees. Besides tuition fees, institutions have other sources of revenue (earned income), including the transfer of accumulated net balances and EU funds, which had an average increase of 8.18% over the same period.
Table 2.34 refers to the annual net balance of public higher education institutions, which presents an annual rate of change equal to 26.13%, despite the apparent economic difficulties claimed by some institutions. Occasionally, the Ministry of Finance has frozen these net balances, due to the EU restrictions to the national budget public deficit.

TERTIARY EDUCATION IN PORTUGAL: BACKGROUND REPORT
88
Table 2.34. The annual rate of change of the net balance of public higher education institutions
Net balance - annual variation rate (%) 2001-2002 50.062002-2003 20.632003-2004 7.69Average rate 26.13
Source: GEFCES, 2005
Table 2.35 presents the average composition of the income budget of public higher education institutions and quantifies the dominant role of public funding. Despite a slow steady decrease, the combined effect of public funds for current expenses and for investment still represented 64% in 2004 (compared with 71 % in 2001).
Table 2.35. The average relative weight of different types of income
Percentage of total income
Public budget Tuition Fees Earned income Investment Total
2001 61.69 6.14 23.15 9.02 100.00 2002 61.20 6.58 23.61 8.61 100.00 2003 60.95 7.07 23.35 8.64 100.00 2004 57.09 9.75 26.32 6.84 100.00 Average 60,23 7.39 24.11 8.28 100.00
Source: GEFCES, 2005
The second major source of funding is earned income (without tuition fees) and it also expanded throughout the last years. This funding source acquired a more prominent role in recent years and often contributed with about a quarter of the funds to many institutions, though its importance achieved considerably higher values in the most intensive research schools, namely in the area of engineering.
The third source of funding is provided by student fees, which presented a clear growth pattern in nominal terms in recent years, especially due to the changes in the funding law in 1997 and 2003. Student fees clearly increased their role as a funding source in recent years, though they still represent less than 10% of overall income and, therefore, still play a small role for public higher education institutions when compared with other systems in Europe and the USA.
Law 37/2003 of 22 August determined that each institution decide upon the level of fees paid by students between a minimum and a maximum value, which were indexed to the minimum national salary (i.e., between €450 and €850 for academic year 2003-2004).
The results of the exercise for 2005-06 are presented in Tables 2.36 and 2.37, respectively for public universities and polytechnics, with current fees at most public universities at a value very close to the maximum limit of € 902. The Universities of Algarve and Évora have set lower fees. Some schools within the University of Lisbon and of the New University of Lisbon set lower fees to meet agreements with the students’ unions The Universities of Madeira and Azores followed a non-aligned policy due to what is traditionally seen as the “costs of insularity”. In general, fees in Polytechnics are lower than in Universities.
Public Universities are free to set the level of fees for postgraduate studies. In general those fees in 2005 averaged € 1,820 (Table 2.38), the only exception being fees charged in areas of economics.
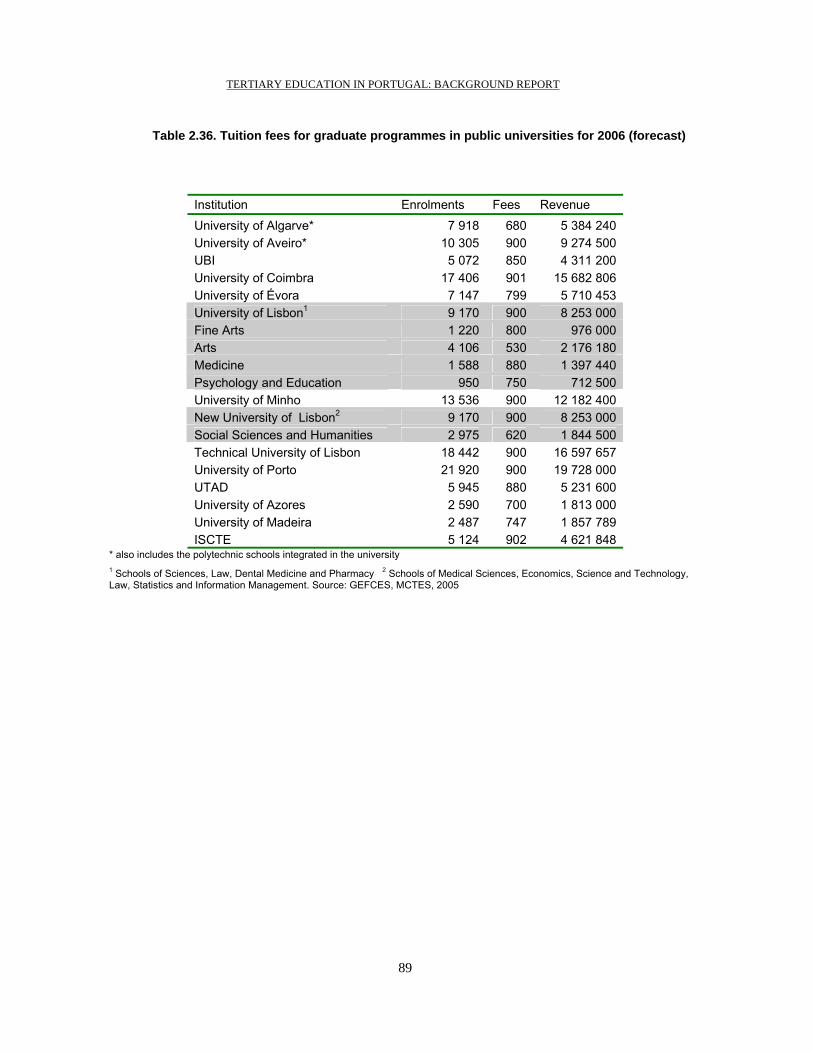
TERTIARY EDUCATION IN PORTUGAL: BACKGROUND REPORT
89
Table 2.36. Tuition fees for graduate programmes in public universities for 2006 (forecast)
Institution Enrolments Fees Revenue
University of Algarve* 7 918 680 5 384 240 University of Aveiro* 10 305 900 9 274 500 UBI 5 072 850 4 311 200 University of Coimbra 17 406 901 15 682 806 University of Évora 7 147 799 5 710 453 University of Lisbon1 9 170 900 8 253 000 Fine Arts 1 220 800 976 000 Arts 4 106 530 2 176 180 Medicine 1 588 880 1 397 440 Psychology and Education 950 750 712 500 University of Minho 13 536 900 12 182 400 New University of Lisbon2 9 170 900 8 253 000 Social Sciences and Humanities 2 975 620 1 844 500 Technical University of Lisbon 18 442 900 16 597 657 University of Porto 21 920 900 19 728 000 UTAD 5 945 880 5 231 600 University of Azores 2 590 700 1 813 000 University of Madeira 2 487 747 1 857 789 ISCTE 5 124 902 4 621 848
* also includes the polytechnic schools integrated in the university 1 Schools of Sciences, Law, Dental Medicine and Pharmacy 2 Schools of Medical Sciences, Economics, Science and Technology, Law, Statistics and Information Management. Source: GEFCES, MCTES, 2005

TERTIARY EDUCATION IN PORTUGAL: BACKGROUND REPORT
90
Table 2.37. Tuition fees for graduate programmes in public polytechnics for 2006 (forecast)
Institution Enrolments Fees Revenue Beja1 2 639 487 1 285 193 School of Health 308 600 184 800 Bragança 5 027 487 2 448 149 Castelo Branco 4 309 487 2 098 483 Cávado e Ave 1 465 600 879 000 Coimbra1 2 529 550 1 390 950 Coimbra2 3 127 500 1 563 500 Coimbra3 2 981 487 1 451 747 Guarda 3 207 550 1 763 850 Leiria 8 508 700 5 955 600 Lisboa4 2 392 675 1 614 600 School of Journalism 1 089 900 980 100 School of Dance 121 825 99 825 School of Education 867 680 589 560 S. Accountancy & Administration 2 581 660 1 703 460 School of Engineering 6 581 705 4 639 605 Porto 14 608 800 11 686 400 Santarém 3 550 700 2 485 000 Portalegre5 2 768 487 1 348 016 School of Agriculture 255 600 153 000 School of Health 268 650 174 200 Tomar 3 159 680 2 148 120 Setúbal 5 835 850 4 959 750 Viana do Castelo 2 897 750 2 172 750 Viseu 5 649 700 3 954 300 Nursing schools Coimbra 1 448 487 705 176 Lisbon 1 177 903 1 062 831 Porto 962 900 865 800
1 Agriculture and Education 2 Accountancy & Administration and Health 3 Engineering and Technology and Management 4 Theatre and Cinema, Music and Health 5 Education and Technology and Management
Source: GEFCES, MCTES, 2005

TERTIARY EDUCATION IN PORTUGAL: BACKGROUND REPORT
91
Table 2.38. Sample survey of tuition fees for master degree programmes in public universities, 2005
Tuition Fees (Euros) University
Field of study 1st
Year 2nd Year
Annual average
Students enrolled
Sciences & Engineering 2000 2000 2000 Technical University of Lisbon, UTL Economy 5025 0 2513 2030
ISCTE Social Sciences & Management 4670 520 2595 621
University of Minho 1375 1375 1375 732Law 3140 0 1570 Sciences 1000 1000 1000
University of Lisboa
Humanities 1500 1500 1500 1830
Engineering 1480 1480 1480 University of Porto Economy 2960 325 1642 2358Arts, Sciences & Engineering 2250 2250 2250
Economy & Management 1875 1875 1875
Maths & Education 1875 1875 1875
University of Aveiro
Social Sciences 1500 1500 1500
559
Economy 15000 - 15000 Health Sciences 2500 2500 2500 Social Sciences 1250 1250 1250
New University of Lisbon, UNL
Sciences & Engineering 1540 1540 1540
1263
University of Coimbra Sciences & Engineering 1150 1075 1113 1335Sciences & Engineering 1575 1575 1575 UBI Social Sciences 1325 1325 1325 206
University of Azores 2020 2020 2020 87VERIFICAR
Evolution of the main categories of expenditure
The basic funding transferred by the government to public higher education institutions is given as a lump sum, calculated by a funding formula. Although institutions are autonomous to decide the internal distribution of funding, the largest share goes to staff salaries. Some institutions replicated internally the criteria defined in the national formula, whereas others made some adjustments. There are also some important differences in terms of the degree of financial autonomy enjoyed by schools/departments in each institution.
Table 2.39 presents the relative weight of the different categories of expenditure and Table 2.40 presents the annual rate of change of the different categories of expenditure. It can be seen that while personnel expenditures are still increasing, all the other expenditure categories are decreasing, especially the investment expenditures.

TERTIARY EDUCATION IN PORTUGAL: BACKGROUND REPORT
92
Table 2.39. The relative weight of different types of expenditure (public institutions)
Percentage of total expenditure
Personnel (1)
Others (2)
Current expenses(3) = (1) + (2)
Investments(4)
Net balance (5)
Total (6)
2001 54.67 28.42 83.09 6.52 10.39 100.00 2002 55.70 23.68 79.38 5.70 14.92 100.00 2003 56.39 21.53 77.91 4.24 17.85 100.00 2004 55.00 23.68 78.67 3.00 18.33 100.00 Average 55.44 24.33 79.76 4.87 15.37 100.00
Source: GEFCES, 2005
Table 2.40. The annual rate of change of the expenditure categories
Expenditure - annual variation rate (%) Personnel Others Investment Total 2001-2002 6.41 -12.94 -8,74 4.46 2002-2003 2.10 -8.33 -25,02 0.85 2003-2004 2.29 15.34 -25,78 4.87 Average rate 3.60 -1.98 -19,84 3.39
Source: GEFCES, 2005
The increase in personnel expenditure is not so much due to changing the ratio between staff and students, but rather to the improvement of the qualifications of the teaching staff. Until recently most Portuguese higher education institutions had a high portion of their academic staff in categories below the Professor level (i.e., without a doctorate degree). A large portion of academic staff completed Master and Doctorate degrees in recent years and this in general meant an automatic promotion in the academic hierarchy with consequences at financial level. This is confirmed by the fact that the institutions with the highest fraction of salary expenditures are precisely those with the highest qualifications in the academic staff (i.e., the oldest institutions).

TERTIARY EDUCATION IN PORTUGAL: BACKGROUND REPORT
93
5. Institutional autonomy and development, relationships with government and the management of human resources
From the perspective of emerging higher education policies worldwide, the need to preserve institutional integrity of the higher education system so as to foster institutional autonomy, has called for increased attention from governments, institutions and society at large. In this context, higher education institutions are considered as knowledge infrastructures where research and teaching activities should be guaranteed under diversified actions and policies, especially at a time were knowledge creation is increasingly important and societies are increasingly dominated by market-based economies While this may seem like a platitude, in many countries, including Portugal, the social standing of research in universities is still undervalued in comparison with education. Portugal has quantitative shortcomings, but, at the same time, the country has been making progress, in a catching-up dynamic that has been documented. Reference is made to institutions in a broad sense and this includes the institutional framework for higher education relationships, namely with the state and with a broad social and economic fabric of actors. In particular, to two main aspects should be mentioned: (i) a state–centred higher education system, lacking the potential for self reforming and behaving in a reactive way to top-down measures, which are very often driven by short-term political cycles; and (ii) limited participation of social and economic actors and limited industry-science networks.
Within the system of tertiary education, it should be noted that different sub-systems have diversified degrees of autonomy, as a result of their particular establishment throughout history. This is briefly described in this part of the report.
Public universities
The public university system includes 14 public universities (including the Open University) and a non-integrated university school, ISCTE. The University of Coimbra, the oldest university, was founded in 1290. The University of Évora was founded in 1559 through the Jesuits, but it was closed down in February 1759 when the Marquis of Pombal expelled the Jesuits from Portugal. Coimbra remained the only Portuguese university until 1911 when the monarchy was overthrown. The new Republican regime established two new universities in 1911, the University of Lisbon and the University of Porto. In 1930 the Technical University was created in Lisbon by integration four already existing schools: Veterinary Medicine, Agronomy, Engineering (i.e., Instituto Superior Técnico, IST) and the Institute for Economy and Management.
Forty years later, in 1973, the University of Aveiro, the University of Minho and the New University of Lisbon were established while a University Institute was created in Évora and two Polytechnic Institutes were created at Vila Real and Covilhã. In 1976 the University of Azores was created, and in 1979 the University of Algarve was established, while the Évora University Institute was transformed into a university. In 1986 the Polytechnic Institutes of Vila Real and Covilhã were transformed respectively into the University of Trás-os-Montes and Alto Douro (UTAD) and the University of Beira Interior (UBI). In 1988 the University of Madeira was created, as well as the University Aberta – an Open University for long-distance education.
The autonomy of public universities is sanctioned by the Constitution and the University Autonomy Act (Law 108/88), which confers public universities a high degree of autonomy, including pedagogical, scientific and financial autonomy. In addition, all buildings have been transferred to the ownership of the institutions. Public universities receive public funds as a line budget that can be altered by decision of the rector. Earned income (including tuition fees) and net balances are considered assets of the university that the institution can use at its own discretion.

TERTIARY EDUCATION IN PORTUGAL: BACKGROUND REPORT
94
Portuguese public universities are usually considered as State’s indirect administration, as argued by specialists on administrative law (Amaral, D.F., 1999), although other legal experts have argued in favour of considering public universities as autonomous public administration (e.g., Sousa, 1999).
Each University has the right to elaborate its statutes, provided it complies with the applicable legislation. The statutes must define the organic structure of the University, the norms for its internal organisation on the scientific, pedagogic, financial and administrative levels of activity, and the autonomies of its units.
Public services are established by Portuguese law, meaning that the number of civil servants is also determined by law, which restricts the number of staff that can be hired on a permanent basis. Increasing staff numbers requires authorisation from the Ministry of Finances, which has been difficult to obtain, namely in periods of financial stringency.
For public higher education institutions, the academic, administrative and technical staff (full professor, associated professor, administrator, etc.) is also fixed by law. Although public universities have to keep constant the total number of staff, they may change its relative composition, while the total number of staff is reviewed every two years depending on student enrolments. (116 e 117 não traduzem a realidade e não chamam a atenção para a situação de menoridade dos politécnicos – relacionar com 141; por outro lado não mostram bem que as universidades gozam de algumas vantagens em relação aos outros services públicos).
Article 7 of the University Autonomy Act grants public universities full pedagogic autonomy, meaning that:
• In compliance with their pedagogic autonomy and in harmony with national policies of education, science and culture, universities shall have the right to create, suspend and cancel courses;
• Universities are autonomous in matters of designing study programmes and subject contents, defining educational methods, selecting methods of evaluating knowledge and trying new pedagogical experiments;
• Universities shall guarantee the plurality of doctrines and methods upholding the freedom in teaching and learning.
In practice, this means public universities have almost complete freedom to start, suspend or cancel courses and they have used this capacity quite extensively. It is true that DGES must register new degrees, but registration can only be denied if the degrees are illegal (for instance because of duration or number of credits). The only possibility open to Government to regulate the public university system is through funding rules or by controlling enrolments when defining the numeri clausi.
The governing bodies of the universities are strictly defined by law. They are the University Assembly (it approves the statutes and elects the Rector), the Rector (uninominal executive body), the University Senate (policy and legislative body) and the Administrative Council (for the current financial administration). The statutes may create other bodies that share functions from the Senate or the Administrative Council and under this provision some Universities have created Scientific or Academic Councils to coordinate the scientific-pedagogic policies of the University. Advisory Committees may also be foreseen in the statutes, both for the University and its constituent units.

TERTIARY EDUCATION IN PORTUGAL: BACKGROUND REPORT
95
The responsibilities of the collegiate bodies are defined by law. Their composition is defined in the statutes, under narrow limits set for participation of ex-officio members and for the number of elected representatives from the professors, other academic staff, students and non-academic staff, parity between the numbers of elected academic staff and students and balance in the representation of the units regardless of their dimension.
The governance of university’s units (Faculties, Schools, Institutes or, in some cases, Departments) include the Assembly of Representatives, the Directive Council, the Pedagogic Council and the Scientific Council (or a Pedagogical-Scientific Council). The law does not preclude the existence of a Dean, but the most frequent situation is having different Presidents for the several bodies (the unit is then represented by the President of the Directive Council), which may lead to conflict due to some overlap of competences.
The provisions on the composition of the governing bodies have raised several aspects of concern in recent years, such as:
• The lack of external orientation and advice, but above all of accountability facing external bodies. The autonomy law does not allow for external participation in the University Assembly, which elects the Rector from within the full professors of the University, in the form of an internal process. External participation in the Administrative Council is also inexistent;
• The limited role of pedagogical councils and the related passive participation of students, namely in educational/ pedagogical planning and supervision;
• The large dimension of most of the collegiate bodies (Simão et al. 2002): the number of members of the University Assembly in the 14 Public Universities in 2002 varied between 64 and 331, while the number of members of University Senates ranged from 36 to 179;
• The predominance of the collegiate approach in the university management leading to slow and cumbersome decision-making processes and a diffusion of personal responsibilities. Decision making tends to be corporative, lacking clarity and transparency, which does not contribute to the necessary institutional cohesion.
• Leadership is not favoured and strategic planning is not a common tool for institutional development.
University Senates may have external participation. Up to 15% of its composition may be external members, when it is foreseen in the statutes and they are nominated by the Rector, or by the Senate following a proposal from the Rector. The data available for 2002 (Simão et al., 2002: 422) shows that only half of the universities had external members in their Senates, ranging from 3% to 12%.
Most universities created “Advisory Committees” with participation of external members, but without decision capacity. In general such bodies meet seldom and have little influence in institutional strategies.
Public polytechnics
The idea of creating a polytechnic sector in Portugal can be traced back to the OECD´s Mediterranean Regional Project, MRP, of 1959. This project aimed at assessing future needs for skilled labour in five Mediterranean countries (Italy, Greece, Spain, Yugoslavia and Portugal) and had a lasting impact in terms of the political and social perception of education, with significant effects on the educational structure of the participating countries. These changes included the expansion of the higher education network by

TERTIARY EDUCATION IN PORTUGAL: BACKGROUND REPORT
96
creating new university-level institutions, while a binary system was initiated through the establishment of polytechnic institutes and several colleges of teacher training (Parliament Act 5/73 of 25 July).
After 1974 the existing polytechnics were transformed into “University Institutes” under the allegation that they should not remain “second class” institutions. It was in this context that successive governments established contact with the World Bank and, from 1978 to 1984 about nineteen different missions visited Portugal. The Bank’s approach was based on two main principles:
• A basic emphasis on an economic approach to higher education to improve efficiency by attaining objectives at the lowest possible cost, e.g. containing long term university degrees while promoting shorter technical degrees, shorter teacher training degrees, higher student/staff ratios, etc.
• A perspective of a world division of labour that led to the definition of country specific roles.
Although the 1997 Progress report welcomed the expansion of higher education9 correcting the prior situation of unequal and limited access, the World Bank did not favour further expansion “… the enrolment represents 8% of the 18-22 age group and could be considered adequate. … In view of the rapidly increased university enrolments, which represent an uneconomical drain in the economy…[the Bank recommends a] gradual introduction of quantitative restraints” (World Bank, 1977 Progress report). At the same time, the World Bank urged the Portuguese authorities to restrain enrolment quotas so as to make “better use” and rationalise the supply of higher education and improve the management of the system, namely in terms of accountability, coordination, and efficiency. Future expansions should be planned taking into account manpower needs, and demographic and enrolment trends. As for student/staff ratios, the Bank considered that they were too low: “…The student/teacher ratio of 6:1 was low… The average ratio set by Unesco, as a target for less developed countries is 15:1” (World Bank, 1977 Progress report).
Subsequently, the World Bank produced two “Staff Appraisal Reports”, which provided insights about the negotiations between the Bank’s Mission and the Portuguese government, and further confirmed the Bank’s priorities10 In the first Report of Assessment (No. 1807-PO, 1978), the Bank insisted on three criteria: balancing the supply of higher education graduates with the economic needs of the country, developing a persistent and consistent policy towards vocational education, and upgrading teacher training programs. The Bank suggested that Portugal needed not only to train high level technicians but also middle level personnel (on an yearly basis: 1400 technicians with short cycle post-secondary education, 500 agricultural technicians and 6000 middle level managers). Subsequently, the government passed Decree-Law 397/77 of 17 September, which established a numerus clausus for every study programme and thereby eliminated the threat to the new short vocational education programs.
The World Bank was critical of the erratic policies toward the existing technical institutes, and of the excessive enrolment in university engineering programmes and the lax approach on managing vacancies quotas, and raised the issue of diseconomies of scale in the system, suggesting that there were too many institutions with small dimension. The government replied to the Bank’s demands with Decree-Law 513-T/7911, which established a network of polytechnic institutes, including Higher Schools of Education. The 9 Enrolments increased dramatically from about 57,000 in 1974-75 to 72,000 in 1975-76 (about 26%),
corresponding to a change in participation rate from about 7.7% to 9.7%. 10 These priorities were the improvement of technical and management capacity of the higher education
system, and the promotion of technical and vocational post-secondary education for those that the system had been unable to retain or to prepare conveniently for the labour market.
11 This Decree-Law was later ratified by the Parliament with some changes – Law 29/80 of 28 July.

TERTIARY EDUCATION IN PORTUGAL: BACKGROUND REPORT
97
main objectives of Polytechnic education were to provide education with an applied and technical emphasis and strong vocational orientation, for training intermediate level technicians for industries, service companies and educational units (first cycle of basic education).
Under the Decree-Law 513-T/79, the curricular organisation of Polytechnic higher education was based on initial training programmes of three years providing a ‘bacharel’ degree. Higher Schools of Education were an exception because they could also confer a ‘licenciatura’ degree after a four-year programme allowing students to become teachers in the second cycle of basic schooling.
Decree-Law 513-T/79 created Polytechnics in several major cities (Beja, Bragança, Castelo Branco, Coimbra, Faro, Lisbon, Porto, Santarém, Setúbal and Viseu), a School of Management and Accountancy in Aveiro, a School of Technology in Tomar and Teacher Training Schools in Guarda, Leiria, Portalegre, Viana do Castelo and Vila Real. The Polytechnic of Faro was later integrated into the Universidade of Algarve. One year later, Decree-Law 303/80 of 16 August created new Polytechnics in Portalegre, Leiria, Guarda and Viana do Castelo, integrating the former Colleges of Teacher Training.
Following the World Bank’s recommendations, it has been assumed that a vocationally oriented segment was an important strategic objective to promote student enrolment in scientific and technological and economic/business programmes that would provide intermediate level qualified human resources. Diversification and regionalisation of higher education was another political argument in favour of establishing the polytechnic network. It was assumed that this network should be able to ensure, for instance:
• Increased equity of access to higher education.
• An answer to increasing demographic pressures resulting from enlarging the duration of compulsory education (at the time from 6 to 9 years).
• A stronger recruitment among vocational secondary education students.
• Regional preference mechanisms by establishing regional quotas in favour of students resident in the area of the institution.
By the end of the 1980s the supply of courses exhibited diversified designations, offering a well-defined professional profile corresponding to a narrow spectrum of specialised training. In many cases, these different designations covered an array of disciplinary and technological areas of knowledge that coincided with the initial training programmes of the new universities or of the schools of engineering and management/economics of the more traditional universities. In general, polytechnic institutes have followed, at least partially, the philosophy of the new universities’ curricular organisation, particularly in relation to curricular flexibility and a discourse addressed at closer connections with local communities.
Fifteen years later, Decree-Law 304/94 of 19 December created the Polytechnic of Cávado and Ave. The integration of the former schools of the Polytechnic of Santarém located in Tomar resulted in the creation of the Polytechnic of Tomar. In Aveiro the former School of Management and Accountancy was integrated into the University of Aveiro, that also created other polytechnic schools: the Aveiro Health School, the Águeda School of Management and Technology, as well as an initiative at the post-upper secondary level (the school Aveiro-Norte).
The Comprehensive Law of the Educational System (Law 48/86) has helped consolidate the polytechnic network. Besides the declaration of intentions on the technical and cultural educational tasks allocated to this sub-system and the new mission of developing capacities of innovation and criticism, the

TERTIARY EDUCATION IN PORTUGAL: BACKGROUND REPORT
98
law reasserted the polytechnics’ vocation to train human resources for professional activities through theoretical and applied teaching based on the transmission of scientific knowledge.
The implementation of “Specialised Higher Education Courses” (i.e., CESES12 in polytechnics by the end of the 1980s was aimed to foster short vocational education, although they were never used to define a continuing education strategy promoting the distinctive profile of polytechnic education. In 1997 the CESES were eliminated and polytechnic degrees became two tier degrees” (3 years + 1 or 2 years), the first cycle conferring the traditional degree of “bacharel” and the second being the degree of ‘licenciatura’, similar to that at universities.
The statutes of each of each polytechnic institute define its organisational structure, but the law defines the governing bodies. These are the President (uninominal executive body), the General Council (a policy making body) and the Administrative Council (for the current financial administration).
The participation of external representatives is compulsory for the election of the President and in the body of the General Council; it is not required in the preparation and approval of the statutes. The General Council should include external members, but their number may not exceed the number of Schools in the Polytechnic. The external representation is therefore low, averaging 13.2% for the 15 polytechnics.
The legal framework regulating the autonomy of public polytechnics is the Polytechnic Autonomy Act (Law 54/90). It establishes that the polytechnic institutes are public collective entities with statutory, administrative, financial and patrimonial autonomy. However, the Schools integrated in the Polytechnics are juridical entities with scientific, pedagogic, administrative and financial autonomy. This is likely to generate conflicts and makes the coordination of the schools a more complex matter.
Polytechnics do not own their buildings, they cannot change the relative composition of the scales of their staffs and they do not have full pedagogic autonomy. Public polytechnics are not allowed to create, suspend and cancel study programmes, and they must submit these proposals to the approval of Government, through DGES. In addition, updating staff numbers is a lengthy and painful process, which explains that, contrary to public universities, the personnel hired under special contracts plays a quite significant role, representing over 50% of the total staff.
An electoral assembly with 20% of its members being representatives from local authorities and different economic activities elects the President. However, some polytechnics do not comply with this rule and on average the percentage of external members in the electoral assemblies was 15.5% in 2002 (Simão et al. 2002: 424-436). The President may be elected from among the qualified academic staff in the Polytechnic or in any other higher education institution, or from highly recognised personalities with relevant professional experience, although this last possibility has never occurred.
Community participation tends to be higher in the Schools of the Polytechnics, although mostly at an advisory level. The Schools’ governing bodies are the Director or the Directive Council, the Scientific Council and the Pedagogic Council (or the Pedagogical-Scientific Council), the Advisory Council and the Administrative Council. The external participation is very high in the Advisory Council (70,9% on average) and is also present, at a much lower level, in about half of the Scientific Councils (7,6% on average) (Simão et al. 2002: 119).
12 Entry to the CESES (18 months to 2 years) was open to holders of the ‘bacharel’ or ‘licenciatura’ degree.
This leads to a diploma, DESE equivalent to a ‘licenciatura’ for all academic and professional purposes, entitling its holders to attend masters and to be admitted to a doctorate. After obtaining a ‘bacharel’ degree, students should gain work experience before returning to complete their studies. In practice, most students will chose to complete their programmes without any intermediate work experience.

TERTIARY EDUCATION IN PORTUGAL: BACKGROUND REPORT
99
The private sector
Since 1979, with the publication of Law 9/79 of March 19 (the Basic Legal Framework for the Private and Cooperative Education), the possibility of creating private higher education institutions was wide open, which allowed the official recognition of several institutions even before specific regulation was passed. This only took place later in 1985, giving place to the creation and accreditation of several other institutions. One can accept though that the reasons behind the excessively fast development of the private sector in higher education were both pragmatic and ideological. On the one hand, private higher education could be seen as the possible solution to the increasing demand in higher education that could not be met by the public sector, especially in the years of severe economic stringency following the 1974 Revolution. On the other hand, there were agents that, since the approval of the new Constitution and particularly since the above mentioned Legal Framework for the Private and Cooperative Education, clearly argued in favour of the development of a private higher education sector.
The institutional development of the private sector has always been ambiguous. With the publication of the first statute for the private and cooperative higher education, in 1979, a legal framework was defined for the creation of private higher education institutions. However, at the same time, a close bureaucratic control has been kept over private institutions that were conferred less pedagogical autonomy than public universities. This has been continuously raised by the association of private institutions, APESP, which complains against scientific and pedagogic autonomy. These aspects were recognised by the World Bank that considered in its 1989 Report on the Portuguese higher education system that Portugal still lacked a policy on private HEI’s. This situation led the private sector to flourish mainly in areas of greater demand on the short term and low instruction costs.
The development of private institutions was initially rather slow, probably due to the lack of legislation and/or tradition. It should be noted that the Statute for the private and cooperative higher education was published only in 1989, ten years after the setting of an institutional framework. Nevertheless, in January 1979, the Government authorised the first private university by granting the Universidade Livre a temporary permit to initiate operations. It was, in fact, learning from this establishment that, later on, new private universities were created. In1984 the Universidade Internacional and in 1985, the Universidade Autónoma Luís de Camões, in Lisbon were allowed to start operations. After cancelling the licence to Universidade Livre. the Minister of Education authorised its replacement by recognising, Universidade Lusíada, in Lisbon and Universidade Portucalense in Porto. These were the first private universities, even considering that a number of smaller private institutions were already accredited in the end of 1984, namely Instituto Superior de Psicologia Aplicada, Instituto Superior de Gestão and Instituto Superior de Matemática Aplicada, all located in Lisbon.
Enrolments in private institutions in 1982-83 (including the Catholic University, which was established in 1971) were only about 11% of total enrolments. The pace of implementation accelerated after the mid-1980s. In 1986, the Government recognised new private universities and polytechnic-type institutions, some resulting from upgrading already existing medium level institutions, which until then were not allowed to confer higher education degrees. The new institutions concentrated most of their supply in areas of low investment/low running costs, such as languages and administration, management, journalism, training of secretaries and interpreters, and informatics.
Much of the initial development of the private sector, particularly from 1986-87 on, was due to the strong increase in demand, which could not be satisfied by the public sector and also to the 1989 decision of the Ministry of Education to lower the requirements for entering higher education. The private share of student enrolments jumped from 11% in 1982–83 to 21.6% in 1989–90, and then to 34.7% in 1996–97. From that year total enrolments started to consistently decrease.

TERTIARY EDUCATION IN PORTUGAL: BACKGROUND REPORT
100
The conditions for the creation and operation of private higher education are established in the Private and Cooperative Higher Education Act (Decree-Law 16/94). The founders may be collective private bodies set up specifically for this objective or foundations whose scope includes such a possibility. The founder must adopt the statutes of the higher education institution and present them for Governmental approval.
The founder has the responsibility for the administrative, economic and financial organisation and management, but the institutions must have pedagogic, scientific and cultural autonomy, dully specified in their statutes. Consequently, the law establishes that each private higher education institution must have at least the following governing bodies: a Rector (for university institutions) or a President (for polytechnic institutions); a Director or a Directive Council; a Scientific Council; a Pedagogic Council.
The key issue in the governance of private higher education institutions is the interface between the founder and the institution itself. The relationship between the founders and their higher education institutions is very heterogeneous, ranging from cases of ample scientific and pedagogic autonomy that fosters the independence of thought and of teaching, to examples of strong decisive intervention from the founder in the academic bodies of the institution.
There is no reference in the Private Higher Education Act to external participation in the academic governing bodies. The existence or presence of external personalities or entities, other than the ones associated in the founder entity, is left to the discretion of the institution.
Emerging aspects for concern: the institutional viewpoint
Institutions have raised several other concerns about lacking autonomy and below is a list of some additional restrictions to the full exercise of the autonomy within the limits prescribed by the Autonomy Acts, namely:
• Although the autonomy prerogatives of public higher education institutions are defined in Autonomy Acts passed by the Parliament, it is rather frequent that other laws passed by the government may restrict or change that level of institutional autonomy. For instance, successive Government have decided to freeze or to reduce the number of civil servants, thus preventing institutions from hiring new staff.
• Also, successive Governments have decided to freeze the earned income of institutions, especially in what concerns the accumulated net balances, as a measure to contain the public deficit.
• As the members of the academic staff of both public universities and polytechnics are civil servants, their salaries are fixed at national level, not allowing for the establishment of pecuniary incentives.
• The difficulty in updating the staffs of public polytechnics, which until recently has been through a process of very fast enrolment increase, created increasingly difficulties to the development of academic careers in polytechnics.
• The Autonomy Acts are too prescriptive about the governance structure of public higher education institutions. The Acts define too strictly not only the governance structure of the universities and polytechnics, but also of their schools, without taking into consideration the institutional diversity of the system.

TERTIARY EDUCATION IN PORTUGAL: BACKGROUND REPORT
101
• The autonomy of the university regarding physical assets is complex and can prevent institutions from a rational management of their assets.
Human resource management
The academic and non-teaching staffs of public higher education institutions are public servants. Each higher education institution hires their own staff and each institution makes the decisions about new contracts and promotions. But, in general, academic staff careers are strongly regulated by law and salaries are national, with related values being ruled by law.
Current public university academic staff career has five steps: assistant in training, assistant, assistant professor, associate professor and full professor.
• Assistants in training are hired for a period of one year following a public tender. The contract can be renewed twice for the same period and they need to complete a master degree to be promoted to assistants. Assistants are hired for a period of six years that can be extended for an additional two-years period and they need to complete a PhD until the end of their contract. They have the right to a three-year period without teaching duties to work for their PhD. Once they have completed a PhD and if they have been teaching for at least five years, they have a right to be immediately hired as assistant professors. If they do not complete a PhD their contract will not be renewed.
• After five years following their appointment as Assistant Professors, academics need to present to the Scientific Council of their school a detailed report on their activity over that period. The Scientific Council appoints a board of experts (jury) to decide if their activity is worthy of awarding them tenure or if they will be hired for a new experimental period of five years, after which they are either tenured or fired.
• Promotion to Associate professor and to Full professor depends on public tenders in competition with candidates from the same or different institutions or from abroad. Decisions are made by a board of experts (jury) proposed by the school and appointed by the rector and needs to include a number of members from outside the institution.
• It needs to be recognised that the mobility of university professors is rather low and that in a high percentage of cases those promoted belong to the institution itself.
The public polytechnic academic career differs from the university academic career in structure and in the number of teaching hours. The structure differs mainly because the major post-graduate requirement for career progression is the master level (i.e., a PhD is not being required). The career has three steps (assistant, aggregate and coordinator).
• Assistants are hired following a public tender for an initial period of three years than can be renewed once, for an equal period, and they have to complete a masters degree until the end of this period.
• After this initial period, assistants are automatically hired as aggregate-professors if they hold a masters degree. Otherwise, their contract is discontinued.
• After a period of three years as aggregate professors, a tenure track may be followed. Promotion to Coordinator Professor depends on the results of a public tender.
TERTIARY EDUCATION IN PORTUGAL: BACKGROUND REPORT
102
There are no set rules for the academic careers of the private sector.
There is also a research career in the public sector, which is organised in three steps: assistant researcher, principal researcher and coordinator researcher.
• Assistant researchers are hired following a public tender and candidates need to hold a PhD.
• Promotion to the higher ranks depends on competition in a public tender. The number of people hired as researchers in public universities is rather low and the researcher career is not available in polytechnics.
TERTIARY EDUCATION IN PORTUGAL: BACKGROUND REPORT
103
References
Amaral, D. F. (1999), Curso de Direito Administrativo, 2nd ed. Almedina, Coimbra.
Amaral, A. and Teixeira, P., (2000), "The rise and fall of the private sector in Portuguese higher education?", Higher Education Policy, 13.3, pp. 245-266.
Amaral, A. and Rosa, M.J.,(2004), “Portugal: Professional and Academic Accreditation – The Impossible Marriage?”, in Westerheijden, D. and Schwarz, S. (eds), Accreditation and Evaluation in the European Higher Education Area, Dordrecht, Springer.
Cabrito, B. (2002), O Financiamento do Ensino Superior. Lisboa: EDUCA.
Caraça, J., Conceição, P. e Heitor, M.V. (1997). “Perspectivas sobre o Financiamento das Universidades: Portugal no Contexto Internacional”. Estudos de Economia, Vol. XVI-XVII (4), pp. 447-492.
Conceição, P. and Heitor, M.V. (1999). “On the role of the university in the knowledge-based economy”. Science and Public Policy, 26.1, pp. 37-51.
Heitor, M. V. (2000). Evaluation of Research Units, 1999/2000 – Final Report. Lisbon: Observatory for Science and Technology, Portuguese Ministry of Science and Technology
Heitor, M., Horta, H. e Conceição, P. (2004). “Do Ensino Técnico ao ensino da engenharia em Portugal”, em M. Heitor, J.M.B. Brito, M.F. Rollo (eds.), “Momentos de Inovação e Engenharia em Portugal no século XX”, Lisboa: Dom Quixote.
Heitor, M., e Horta, H. (2004). “Engenharia e desenvolvimento científico”, em M. Heitor, J.M.B. Brito, M.F. Rollo (eds.), “Momentos de Inovação e Engenharia em Portugal no século XX”, Lisboa: Dom Quixote.
Martins, S.C., Mauritti, R. and Costa, A.F., CIES-ISCTE (2005) Social and Economic Conditions of Student Life in Portugal, EUROSTUDENT 2005; Lisboa, Direcção de Serviços de Acção Social, DGES.
Medina, F. (2004), 10 Anos de Acção Social no Ensino Superior – Contributos e Reflexões. Lisboa: Fundo de Acção Social.
Oliveira, T. and P. Pereira (1999) “Who Pays the Bill? Study Costs and Students’ Income in Portuguese Higher Education.” European Journal of Education 34.1, pp. 111–121.
Simão, J. V., Santos, S. M. & Costa, A. A. (2002) Ensino Superior: Uma Visão para a Próxima Década. Gradiva. pp 421-422.
Sousa, M. R. (1999), Lições de Direito Administrativo, 2nd ed., Lisboa.
Teixeira, P., Amaral, A. and Rosa, M.J. (2003), "Mediating the Economic Pulses: The International Connection in Portuguese Higher Education", Higher Education Quarterly, 57.2: 181-203.
Vieira, M.M. (1995), “Transformação Recente no campo do Ensino Superior.” Análise Social XXX, pp. 315–373.

TERTIARY EDUCATION IN PORTUGAL: BACKGROUND REPORT
104
World Bank (1978), Staff Appraisal Report – Education Project – Portugal, 1807 – PO; Education and Manpower Development Division
World Bank (1977), Portugal – The Education & Training System: Issues, Strategies and Priorities, Education and Manpower Development Division

TERTIARY EDUCATION IN PORTUGAL: BACKGROUND REPORT
105
PART III - THE NETWORK OF TERTIARY EDUCATION
III.1. THE GEOGRAPHY OF TERTIARY EDUCATION IN PORTUGAL
The Portuguese Higher Education system has considerable degree of institutional diversity. It developed faster than any other European system, creating a diversified and heterogeneous network of institutions and study programmes. This part of the report presents main facts related to institutional, geographical, and functional aspects, and to the installed capacity at the level of its integrating sectors (i.e., universities and polytechnics, public and private).
1. Introduction and regional distribution of institutions
There are in Portugal more than 150 higher education institutions. The public sector includes 14 public universities and a non-integrated university school, 15 polytechnics and a number of polytechnic schools integrated in universities, 9 non-integrated nursing schools13, 4 university level military schools and 5 polytechnic military schools. The private sector includes 34 university level institutions and 66 polytechnic schools. The Catholic University has activities in a number of places, such as Lisbon, Sintra, Porto, Braga, Viseu, Figueira da Foz and Caldas da Rainha.
Table 3.1 presents the regional distribution of higher education institutions showing that there is a strong concentration in the most populated regions, namely in Lisbon and in the North region.
13 The nursing schools in Lisbon, Porto and Coimbra are in a merger process that will transform the 9
autonomous institutions into only three, one in each town.

TERTIARY EDUCATION IN PORTUGAL: BACKGROUND REPORT
106
Table 3.1 – Regional distribution of higher education institutions
Public Private Public Others Region University Polytechnic University Polytechnic
Catholic univ. University Polytechnic
Total
Algarve 1 1 2 1 5 Alentejo 1 3 5 9 Centre 3 8 7 9 3 2i 32 Lisbon 5 4 20 23 2 4ii 9iii 67 North 3 6 14 25 2 3i 53 Azores 1 1 Madeira 1 2 3 Total 15 22 48 60 7 4 14 170 NOTES: i – nursing schools; ii – military institutions; iii – 5 military institutions and 4 nursing schools
Source: OCES, 2006
Figures 3.1 and 3.2 present the location of public universities and polytechnics, respectively and of their campi in those cases where they are located in different cities.
The location of private higher education institutions is presented in Figure 3.3 (university education) and in Figure 3.4 (polytechnic education). It comprises more than one hundred institutions, including very small private schools. The average size of the student population is around 1,000 students per institution, but in 2003 there were 29 institutions with less than 200 students and 35 institutions with student enrolment between 200 and 500 students.

TERTIARY EDUCATION IN PORTUGAL: BACKGROUND REPORT
107
Figure 3.1 – Location of public universities
Source: DGES, 2006

TERTIARY EDUCATION IN PORTUGAL: BACKGROUND REPORT
108
Figure 3.2 – Location of public polytechnics
Source: DGES, 2006

TERTIARY EDUCATION IN PORTUGAL: BACKGROUND REPORT
109
Figure 3.3 – Private university higher education
Source: DGES, 2006

TERTIARY EDUCATION IN PORTUGAL: BACKGROUND REPORT
110
Figure 3.4 – Private polytechnic higher education
Source: DGES, 2006
2. Regional distribution of vacancies, enrolments and graduates
Figure 3.5 presents the overall distribution of vacancies as well as the distribution of the public and private sectors for the different regions (NUT II). The country average is 8/1,000 inhabitants, with the Region of Lisbon above the average (12/1,000), while the North and Centre are below average and there are quite smaller values for the islands of Madeira and Azores. When only the public sector is considered, the Centre is the most favoured region (6/1,000), closely followed by Lisbon (5/1,000), both above the national average (4.6/1,000). Alentejo and Algarve are slightly below the national average, while the North is well below the national average.
The private sector has a more unbalanced regional distribution, with Lisbon and North above the national average. The Lisbon indicator is well above the national average, almost doubling the national value, while the North region is only slightly above the national average, and all the other regions are below the national average. Therefore, the more favourable situation of Lisbon is mainly due to the contribution of the private sector that concentrates a large proportion of vacancies there. It is also interesting to notice the almost negligible presence of the private sector in the region of the Alentejo and the island of Madeira, and its absence in the Azores archipelago.

TERTIARY EDUCATION IN PORTUGAL: BACKGROUND REPORT
111
Figure 3.5 – The Regional distribution of total vacancies (2005-06)
0,81
2,44
1,50
6,44
3,77
0,000,71
3,514,37 4,44
5,72
3,61
2,52 2,26
4,585,18
6,887,22
11,84
7,38
2,522,97
8,09
5,40
0,00
2,00
4,00
6,00
8,00
10,00
12,00
14,00
Alentejo Algarve Centro Lisboa Norte Azores Madeira TotalRegion
PrivatePublicTotal
Source: OCES, 2005
Figure 3.6 presents the regional distribution of vacancies by sub-sector, differentiating university education from polytechnic institutions. The graphic shows a regional concentration of universities that favours the Lisbon Region, almost double the national average. However, polytechnics are more evenly distributed throughout the mainland than universities, with only the Centre Region slightly above the national average.
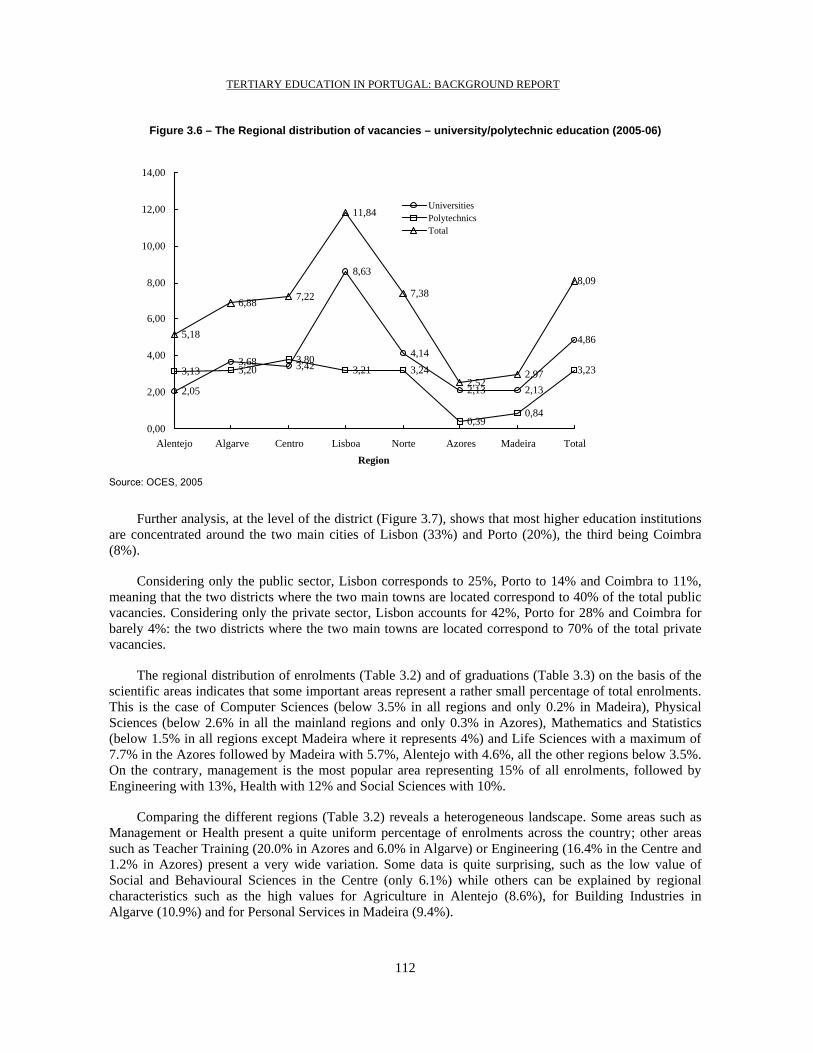
TERTIARY EDUCATION IN PORTUGAL: BACKGROUND REPORT
112
Figure 3.6 – The Regional distribution of vacancies – university/polytechnic education (2005-06)
2,05
3,68 3,42
8,63
4,14
2,13 2,13
4,86
3,13 3,203,80
3,21 3,24
0,390,84
3,23
5,18
6,88 7,22
11,84
7,38
2,522,97
8,09
0,00
2,00
4,00
6,00
8,00
10,00
12,00
14,00
Alentejo Algarve Centro Lisboa Norte Azores Madeira TotalRegion
UniversitiesPolytechnicsTotal
Source: OCES, 2005
Further analysis, at the level of the district (Figure 3.7), shows that most higher education institutions are concentrated around the two main cities of Lisbon (33%) and Porto (20%), the third being Coimbra (8%).
Considering only the public sector, Lisbon corresponds to 25%, Porto to 14% and Coimbra to 11%, meaning that the two districts where the two main towns are located correspond to 40% of the total public vacancies. Considering only the private sector, Lisbon accounts for 42%, Porto for 28% and Coimbra for barely 4%: the two districts where the two main towns are located correspond to 70% of the total private vacancies.
The regional distribution of enrolments (Table 3.2) and of graduations (Table 3.3) on the basis of the scientific areas indicates that some important areas represent a rather small percentage of total enrolments. This is the case of Computer Sciences (below 3.5% in all regions and only 0.2% in Madeira), Physical Sciences (below 2.6% in all the mainland regions and only 0.3% in Azores), Mathematics and Statistics (below 1.5% in all regions except Madeira where it represents 4%) and Life Sciences with a maximum of 7.7% in the Azores followed by Madeira with 5.7%, Alentejo with 4.6%, all the other regions below 3.5%. On the contrary, management is the most popular area representing 15% of all enrolments, followed by Engineering with 13%, Health with 12% and Social Sciences with 10%.
Comparing the different regions (Table 3.2) reveals a heterogeneous landscape. Some areas such as Management or Health present a quite uniform percentage of enrolments across the country; other areas such as Teacher Training (20.0% in Azores and 6.0% in Algarve) or Engineering (16.4% in the Centre and 1.2% in Azores) present a very wide variation. Some data is quite surprising, such as the low value of Social and Behavioural Sciences in the Centre (only 6.1%) while others can be explained by regional characteristics such as the high values for Agriculture in Alentejo (8.6%), for Building Industries in Algarve (10.9%) and for Personal Services in Madeira (9.4%).

TERTIARY EDUCATION IN PORTUGAL: BACKGROUND REPORT
113
The analysis of the number of graduates (Table 3.3) reveals a different picture. Teacher Training with only 7.4% of the total enrolments represents 14.9% of all graduates, and Health with 12.1% of total enrolments represents 14.4% of the graduates. On the other hand, Engineering with 13% of all enrolments, contributes with only 7.5% of all graduates.
Figure 3.7 – The distribution at district level (public, private and total) (2005-06)
0
5 000
10 000
15 000
20 000
25 000
30 000
Aveiro
BejaBrag
a
Bragan
¨a
Castelo
Branco
Coimbra
�vora
Faro
Guarda
Leiria
Lisboa
Portale
grePort
o
R. A. A
¨ores
R. A. M
adeir
a
Santar
ˇmSet�
bal
Viana C
astelo
Vila Real
Viseu
District
Public Private Total Source: OCES, 2005

TERTIARY EDUCATION IN PORTUGAL: BACKGROUND REPORT
114
Table 3.2 – Total enrolments in higher education per scientific area, 2004/05
Algarve Alentejo Lisbon Centre North Azores Madeira Areas Sub-areas n % n % n % n % n % n % n %
Education Teacher training 636 6.0 2 293 11.4 8 927 6.1 5 977 7.3 9 136 7.8 671 20.0 415 13.0 Education Sciences 193 1.8 181 0.9 1 291 0.9 871 1.1 2 150 1.8 46 1.4 141 4.4Arts and Arts 202 1.9 783 3.9 6 198 4.3 4 306 5.3 4 312 3.7 0 0.0 176 5.5Humanities Humanities 488 4.6 637 3.2 7 676 5.3 2 831 3.5 4 772 4.1 194 5.8 83 2.6Social Sciences Social & Behavioural Sciences 1 037 9.8 1 263 6.3 18 520 12.7 4 964 6.1 10 431 8.9 447 13.3 383 12.0Commerce Communication and Journalism 244 2.3 320 1.6 4 036 2.8 2 039 2.5 1 649 1.4 44 1.3 0 0.0and Law Management 1 756 16.5 3 284 16.4 21 448 14.8 13 365 16.4 16 592 14.2 535 15.9 484 15.1 Law 0 0.0 142 0.7 8 093 5.6 3 551 4.4 4 844 4.1 0 0.0 0 0.0Sciences, Life Sciences 485 4.6 661 3.3 2 427 1.7 1 762 2.2 2 072 1.8 259 7.7 183 5.7Mathematics Physical Sciences 254 2.4 490 2.4 3 163 2.2 2 047 2.5 2 157 1.8 9 0.3 113 3.5and Informatics Mathematics and Statistics 122 1.1 60 0.3 1 852 1.3 818 1.0 1 318 1.1 21 0.6 127 4.0 Informatics 214 2.0 641 3.2 3 680 2.5 891 1.1 3 106 2.7 45 1.3 5 0.2Engineering, Engineering 1 055 9.9 1 268 6.3 18 845 13.0 13 342 16.4 14 490 12.4 40 1.2 416 13.0Manufacturing Manufacturing Industries 189 1.8 697 3.5 764 0.5 1 335 1.6 1 450 1.2 34 1.0 0 0.0& Building Ind. Architecture and Building 1 153 10.9 1 097 5.5 10 873 7.5 6 417 7.9 9 507 8.1 72 2.1 35 1.1Agriculture Agriculture, Silviculture & Fisheries 150 1.4 1 716 8.6 899 0.6 1 378 1.7 1 365 1.2 128 3.8 0 0.0 Veterinary Sciences 0 0.0 335 1.7 766 0.5 304 0.4 714 0.6 21 0.6 0 0.0Health and Health 995 9.4 1 523 7.6 14 943 10.3 9 275 11.4 18 580 15.9 526 15.7 379 11.8Social Protection Social Services 154 1.5 1 052 5.2 3 141 2.2 1 688 2.1 2 799 2.4 146 4.3 0 0.0Services Personal Services 1 041 9.8 1 247 6.2 3 701 2.5 2 566 3.1 4 046 3.5 0 0.0 262 8.2 Transport Services 0 0.0 0 0.0 306 0.2 0 0.0 18 0.0 0 0.0 0 0.0 Environment Protection 247 2.3 336 1.7 2 022 1.4 1 676 2.1 1 233 1.1 120 3.6 0 0.0 Security Services 0 0.0 34 0.2 1 698 1.2 80 0.1 209 0.2 0 0.0 0 0.0 TOTAL 10 615 100.0 20 060 100.0 145 269 100.0 81 483 100.0 116 950 100.0 3 358 100.0 3 202 100.0
Source: OCES, 2005

TERTIARY EDUCATION IN PORTUGAL: BACKGROUND REPORT
115
Table 3.3 – Total number of graduates in higher education per scientific area, 2003/04
Algarve Alentejo Lisbon Centre North Azores Madeira Areas Sub-Areas n % n % n % n % n % n % n %
Education Teacher training 277 13.6 797 21.7 3 051 12.2 2 073 14.5 3 633 16.1 168 27.6 219 34.5 Education Sciences 18 0.9 82 2.2 485 1.9 287 2.0 1 065 4.7 5 0.8 6 0.9Arts and Arts 54 2.7 124 3.4 1 195 4.8 784 5.5 933 4.1 0 0.0 36 5.7Humanities Humanities 155 7.6 45 1.2 1 155 4.6 628 4.4 812 3.6 64 10.5 52 8.2
Social Sciences Social & Behavioural Sciences 119 5.8 146 4.0 2 468 9.9 586 4.1 1 529 6.8 31 5.1 0 0.0
Commerce Communication & Journalism 73 3.6 63 1.7 713 2.9 486 3.4 200 0.9 0 0.0 0 0.0
and Law Management 342 16.8 556 15.1 4 389 17.6 2 128 14.9 3 259 14.5 33 5.4 63 9.9 Law 0 0.0 27 0.7 1 379 5.5 388 2.7 686 3.0 0 0.0 0 0.0Sciences, Life Sciences 82 4.0 73 2.0 272 1.1 284 2.0 321 1.4 44 7.2 24 3.8Mathematics Physical Sciences 58 2.9 45 1.2 409 1.6 348 2.4 401 1.8 3 0.5 29 4.6& Informatics Mathematics & Statistics 37 1.8 21 0.6 305 1.2 191 1.3 267 1.2 9 1.5 28 4.4 Informatics 29 1.4 45 1.2 553 2.2 128 0.9 436 1.9 0 0.0 0 0.0Engineering, Engineering 131 6.4 88 2.4 1 666 6.7 1 472 10.3 1 783 7.9 0 0.0 8 1.3Manufacturing & Manufacturing Industries 70 3.4 170 4.6 140 0.6 221 1.6 316 1.4 4 0.7 0 0.0Building Industr. Architecture and Building 83 4.1 93 2.5 1 437 5.8 771 5.4 1 105 4.9 0 0.0 0 0.0
Agriculture Agriculture, Silviculture & Fisheries 32 1.6 298 8.1 179 0.7 240 1.7 325 1.4 26 4.3 0 0.0
Veterinary Sciences 0 0.0 21 0.6 92 0.4 0 0.0 118 0.5 0 0.0 0 0.0Health and Health 115 5.7 519 14.1 3149 12.6 2183 15.3 3 626 16.1 178 29.3 110 17.3Social Protection Social Services 68 3.3 239 6.5 579 2.3 246 1.7 607 2.7 24 3.9 0 0.0Services Personal Services 231 11.4 157 4.3 712 2.9 507 3.6 788 3.5 0 0.0 60 9.4 Transport Services 0 0.0 0 0.0 73 0.3 0 0.0 6 0.0 0 0.0 0 0.0 Environment Protection 61 3.0 67 1.8 290 1.2 265 1.9 236 1.0 19 3.1 0 0.0 Security Services 0 0.0 0 0.0 260 1.0 39 0.3 56 0.2 0 0.0 0 0.0
TOTAL 2 035 100.0 3 676 100.0 24 951 100.0 14 255 100.022
508 100.0 608 100.0 635 100.0Source: OCES, 2005

TERTIARY EDUCATION IN PORTUGAL: BACKGROUND REPORT
116
3. Regional distribution of the academic staff
Table 3.4 and Figure 3.8 present information on the regional distribution of the academic staff and its qualification.
The academic staff is largely concentrated in the regions of Lisbon, North and Centre, where most of the population lives and where the main public universities are located. Only 31% of the academic staff holds a PhD and only 31% holds masters degree as their maximum academic qualification.
Figure 3.8 – Regional distribution of academic staff by qualification
0
1000
2000
3000
4000
5000
6000
PhD Masters Graduation OtherRegion
AlgarveAlentejoCentreLisbonNorthAzoresMadeira
OCES, 2006
At the system level, the analysis of the distribution of the academic staff indicates that the public universities account for 72% of all the PhD holders and for 32% of those holding at least a masters degree. These percentages are respectively 9% and 36% for public polytechnics, 16% and 21% for private university institutions and only 3% and 11% for private polytechnics.
The analysis of the qualification of the academic staff within each sector indicates the public universities have 55% of their staff with a PhD and 24% with a masters degree. These percentages are respectively 10% and 39% for public polytechnics, 27% and 32% for private university level institutions and only 14% and 31% for private polytechnics.

TERTIARY EDUCATION IN PORTUGAL: BACKGROUND REPORT
117
Table 3.4 – The regional distribution of the academic staff
Region Type of institution PhD Masters Graduation Other Total Public University 226 87 28 2 343 Public Polytechnic 42 201 264 21 528 Private University 46 58 77 1 182 Private Polytechnic 10 13 44 1 68
Alg
arve
Total 324 359 413 25 1 121 Public University 342 231 95 3 671 Public Polytechnic 71 407 362 17 857 Private University 43 69 109 2 223 Private Polytechnic 0 18 17 0 35
Ale
ntej
o
Total 456 725 583 22 1 786 Public University 1 583 728 634 55 3 000 Public Polytechnic 332 1 451 1 518 126 3 427 Private University 173 250 310 10 743 Private Polytechnic 31 124 201 9 365
Cen
tre
Total 2 119 2 553 2 663 200 7 535 Public University 3 449 1 313 1 309 102 6 173 Public Polytechnic 263 872 1 277 227 2 639 Private University 901 1 183 1 762 80 3 926 Private Polytechnic 168 476 895 90 1 629
Lisb
on
Total 4 781 3 844 5 243 499 14 367 Public University 2 260 1 052 795 71 4 178 Public Polytechnic 323 1 109 1 239 147 2 818 Private University 660 825 956 46 2 487 Private Polytechnic 135 567 944 24 1 670
Nor
th
Total 3 378 3 553 3 934 288 11 153 Public University 168 112 54 8 342 Public Polytechnic 6 21 81 2 110 Private University 2 0 0 2 4 Private Polytechnic 0 0 0 0 0
Azo
res
Total 176 133 135 12 456 Public University 76 66 65 7 214 Public Polytechnic 4 13 45 0 124 Private University 0 0 0 0 0 Private Politechnic 2 25 80 1 108
Mad
eira
Total 82 104 190 8 446
TOTAL 11 316 11 271 13 161 1 054 36 802
Source: OCES, 2006

TERTIARY EDUCATION IN PORTUGAL: BACKGROUND REPORT
118
References
Correia, F., Amaral, A. and Magalhães, A. (2002), “Public and private higher education in Portugal: unintended effects of deregulation”, European Journal of Education, 37.4, pp. 457-472.

TERTIARY EDUCATION IN PORTUGAL: BACKGROUND REPORT
119
PART III.2 - A FUNCTIONAL ANALYSIS
In order to better understand the Portuguese higher education system and its network of institutions and study programmes, a functional analysis of the system including the contribution of each sector – public and private, universities and polytechnics – is undertaken. The analysis focuses on the adequacy of the educational provision in terms of the needs of the Portuguese society, including strengthening the research capacity and the levels of internationalisation, as well as the access of new publics and the provision of lifelong education and industry-science relationships.
1. Post-secondary education
Post-secondary education has been recently reinforced with a new legal framework expanding "Technological Specialisation Programmes" (i.e., "CETs – Cursos de Especialização Tecnológica"), which aimed at conferring students a diploma of technological specialisation and a level IV professional qualification. These programmes are offered mainly to students that completed upper secondary education or that have qualifications equivalent to a level III professional qualification, and are run under the supervision of one of four ministries beyond Higher Education, namely: Education, Economy, Work and Social Solidarity, and Agriculture.
It should be noted that Portugal remains one of the European countries with the lowest supply of lifelong education and retraining opportunities (Table 3.5). Access routes to higher education are, in general, very traditional and most institutions do not have institutionalised practices for enrolling students from other than traditional access routes. Also, the lack of experience and knowledge in the recognition of informal training activities makes transfer between institutions and credit recognition very uncertain for students.
Table 3.5 – Population aged 25 to 64 participating in education and training (%)
1994 1995 1996 1997 1998 1999 2000 2001 2002 2003 2004 2005EU15 - - 5.7e 5.7e - 8.2e 8.4e 8.3e 8.5 9.9b 11.1 11.9Belgium 2.7 2.8 2.9 3.0 4.4 6.9b 6.8 7.3 6.5 8.5 9.5b 10.0Denmark 15.1 16.8 18.0 18.9 19.8 19.8 20.8 17.8 18.4 25.7b 27.6 27.6Germany – – 5.7 5.4 5.3 5.5 5.2 5.2 5.8 6.0 7.4 –Greece 1.0 0.9 0.9 0.9 1.0 1.3 1.1 1.4 1.2 2.7b 2.0 1.8Spain 3.9 4.3 4.4 4.4 4.2 5.0 5.0 4.8 4.9 5.8 5.1 12.1b
France 2.9 2.9 2.7 2.9 2.7 2.6 2.8 2.7 2.7 7.4b 7.8 7.6Ireland 3.9 4.3 4.8 5.2 – – – – 7.6 9.6b 7.2 8.0Italy 3.4 3.8 4.1 4.6 4.8 5.5 5.5 5.1 4.6 4.7 6.8b 6.2Luxemburg 3.3 2.9 2.9 2.8 5.1b 5.3 4.8 5.3 7.7 6.3b 9.4 9.4p
Netherlands 13.6 13.1 12.5 12.6 12.9 13.6 15.6 16.3 16.4 17.4b 17.3 16.9Austria – 7.7 7.9 7.8 – 9.1 8.3 8.2 7.5 12.5b 12.0 13.9Portugal 3.5 3.3 3.4 3.5 3.1b 3.4 3.4 3.4 2.9 3.7 4.8b 4.6Finland – – 16.3 15.8 16.1 17.6 19.6b 19.3 18.9 25.3b 24.6 24.8Sweden – – 26.5 25.0 – 25.8 21.6 17.5b 18.4 34.8b 33.3 34.7UK 11.5 – – – – 19.2 21.0 21.7 22.3 21.2 29.1 29.1p
NOTES: - not available; e – estimated value; b – break in series; p – provisional value
Source: EUROSTAT, 2005

TERTIARY EDUCATION IN PORTUGAL: BACKGROUND REPORT
120
Forms of post-secondary education and lifelong learning were formally introduced with the 1986 Comprehensive Law of the Education System, which defined professional training as an important objective in the structure of the educational system, and established a framework of training activities designed to promote the participation of working people, for the purposes of both professional enhancement and professional conversion (article 19, § 2). For non-formal educational activities (article 23, § 3), the law emphasised the development of technological aptitudes and technical knowledge, which would foster adult adaptation to contemporary life. The educational system was therefore awarded both responsibilities and competencies for continuing education, and the connection between education and professional activity was explicitly assumed, as was the need to prepare students for transition to the labour market.
So far, continuing education has not been provided on a widespread scale, and little has been developed in the way of structures or mechanisms to fulfil this objective (Table 3.6). In particular, higher education institutions, including public polytechnics and universities, have not yet focused their attention on post-secondary education. It is possible that the difficulties created by the declining number of traditional students will force institutions to assume an increasing role in the ‘less traditional’ educational market, including continuing education.
Table 3.6 – Number of people participating in education and training activities
Number of people Years of formal schooling Year Total Men Women <4
years 4
years 6
years 9
years 12
years >12
years
2000 43 22 20 383 2001 35 19 16 671 2002 37 20 17 019 2003 50 27 22 276 2004 55 30 25 245 206 4 10 16 12 11 August 34 19 15 514 46 2 6 10 7 6
Source: Ministry of Work and Social Solidarity, 2005
Most activities oriented towards continuing education and lifelong learning were to a large extent the results of expectations or demands from the European Union. In this respect too, Portugal’s entry to the European Community in 1986 can be seen as a turning point in the country’s participation in lifelong learning, mainly as result of activities developed with support from the European Social Fund (ESF). This has become the main source of financing for training systems, and indeed the main inspiration behind the organisation of national training policies. In addition to European resources, national programmes, private companies and the students themselves have also financed continuing education, but up to now, all of these latter resources have played a less visible role.
Table 3.7 shows that “Technological Specialisation Courses”, CETs, offered through higher education institutions have involved only 1 302 students in 2005. These CETs were offered through 13 public institutions and 8 private institutions of higher education and represent only 24% of the total number of programmes. Table 3.8 presents the supply of programmes through the different types of schools existing under different ministries.

TERTIARY EDUCATION IN PORTUGAL: BACKGROUND REPORT
121
Table 3.7 – Number of students enrolled in "Technological Specialisation Programmes", CETs, publicly funded through MCTES in 2005
Type of courses Computer Applications to Management 79 Automation, Robotics and Industrial Control 14 Building Work Management 50 Irrigated Cultures 25 Project and Design of Mechanical Constructions/ moulds 59 Development of Multimedia Products 149 Design of footwear and morocco 10 Furniture Design 20 Documentation and Information 15 Electronics and Telecommunications 20 Automatic Manufacture – Design an Manufacture of metal-mechanic products 27 Quality Management 25 Management of Tourist Activity 46 Network Management 36 Installation and Maintenance of Computer Networks and Systems 162 Industrial Maintenance 20 Work Organisation and Planning 59 Mechanic Production 20 Food Quality 63 Environment Quality 55 Industrial Chemistry 14 Social service and Community Development 54 Tourism Management Techniques 20 Hotel Management Techniques 36 Food Technology 23 Mechatronics Technology 36 Information Systems Technologies and Programming 123 Telecommunications and networks 42 Total 1 302
Source: MCTES, 2006

TERTIARY EDUCATION IN PORTUGAL: BACKGROUND REPORT
122
Table 3.8 – Technology specialisation courses, CETs, in 2005/2006
a) Number of available courses per area
Secondary and Technical Schools
Universities and Polytechnics
Technological Schools
Training Schools
Area (Ministry of Education)
(Ministry of ST and Higher Education)
(Ministry of Economy)
(Ministry of Work)
Total
Management 3 2 5 0 10 Informatics 21 16 3 7 47 Electronics and Automation 8 3 9 4 24 Construction 16 2 0 0 18 Accounting 25 2 0 0 27 Design 1 0 0 0 1 Marketing and Publicity 2 1 0 0 3 Tourism 9 3 0 0 12 Textile Industry 1 0 3 0 4 Environment Protection 0 1 0 0 1 Metallurgy and Metal-mechanics 2 5 4 2 13 Transforming Industries 0 0 0 0 0 Food Industries 2 1 0 0 3 Chemical Engineering 0 0 1 0 1 Finance, Banking and Insurance 0 0 0 1 1 Personal Services 0 2 0 0 2 Materials 0 0 0 0 0 Agriculture 0 0 0 0 0 Archive Sciences 1 2 0 0 3 Total 91 40 25 14 170 Percentage 54% 24% 15% 8% 100%
b) Number of available technology specialisation courses per area and region
Area North Region Center Region Lisbon Region Algarve Alentejo Total Management 4 4 2 0 0 10 Informatics 15 14 17 1 0 47 Electronics and Automation 6 9 8 0 1 24 Construction 7 3 4 2 2 18 Accounting 17 4 1 3 2 27 Design 1 0 0 0 0 1 Marketing and Publicity 3 0 0 0 0 3 Tourism 7 4 0 0 1 12 Textile Industry 3 1 0 0 0 4 Environment Protection 0 1 0 0 0 1 Metallurgy and Metal mechanics 4 6 3 0 0 13 Transforming Industries 0 0 0 0 0 0 Food Industries 0 1 2 0 0 3 Chemical Engineering 0 1 0 0 0 1 Finance, Banking and Insurance 0 0 1 0 0 1 Personal Services 0 2 0 0 0 2 Materials 0 0 0 0 0 0 Agriculture 0 0 0 0 0 0 Archive Sciences 0 2 0 1 0 3 Total 67 52 38 7 6 170 Percentage 39% 31% 22% 4% 4% 100%

TERTIARY EDUCATION IN PORTUGAL: BACKGROUND REPORT
123
3. Graduate studies
Graduate education is the main activity of the Portuguese higher education institutions and Table 3.9 presents the number of enrolled students in each sector. Public universities represent 44% of the total number of students, followed by public polytechnics, with 30%, and the private sector, with 27%.
Table 3.10 presents the number of degrees awarded, with public universities contributing with 31% of the total, public polytechnics with 35% and the private sector with 34%. The results report student survival rates and call attention for the increasing importance of guaranteeing student success. There are numerous social, economic and psychological reasons for not completing higher education. Some reasons point to the influence of rhetorical and passive methods of teaching, others to excessively long study programmes, although the inadequacy of student choices has also been indicated as a possible justification. The challenge posed by unsuccessful completion rates of higher education may be helped with the transition of a system based on the transmission of knowledge to a system based on the development of competencies, as discussed within the Bologna process.

TERTIARY EDUCATION IN PORTUGAL: BACKGROUND REPORT
124
Table 3.9 – Number of students enrolled in graduate programmes
Enrolments in 31st December Type of institution 1991 1992 1993 1994 1995 1996 1997 1998 1999 2000 2001 2002 2003 2004Public
University 107 644
114 807
121 459
126 221 133055 140892 144220 148
973153 522
160 120
163 634
162 441
160 093
156 114
Armed forces
1 042
1 015 994 890 835 850 907 917 996 1
082 1
138 1
1631
2521
352Total P.Univ.
108 686
115 822
122 453
127 111
133 890
141 742
145 127
149 890
154 518
161 202
164 772
163 604
161 345
157 466
Polytechnic General
33 822
40 431
45 479
49 877 54 091 60 026 67 349 74
74083
81592
998 98
461 101 779
100 289
97 018
Polyt- Health 2398 2
894 3
043 3
450 4 664 4 574 4 582 4 612
5 791
8 081
9 190
9 892
10 353
10 500
Armed forces 323 339 222 300 294 305 305 279 256 198 318 341 368 356
Total Public Polytechnic
36 543
43 664
48 744
53 627 59 049 64 905 72 236 79
63189
862101 277
107 969
112 012
111 010
107 874
Total Public 145 229
159 486
171 197
180 738
192 939
206 647
217 363
229 521
244 380
262 479
272 741
275 616
272 355
265 340
Private
University 29 540
33 684
36 473
41 191 43 304 48 123 45 680 49
51247
98243
429 40
891 38
29935
45631
337
Polytechnics 31 285
39 228
48 426
53 220 61 444 62 380 64 243 57
31359
71159
501 60
186 60
91559
79756
161Catholic univ.
7 461
8 138
8 294
9 050 9 190 10 021 9 839 10
0559
8339
964 9
536 9
7629
7419
370
Total Private 68 286
81 050
93 193
103 461
113 938
120 524
119 762
116 880
117 526
112 894
110 613
108 976
104 994
96 868
TOTAL 213 515
240 536
264 390
284 199
306 877
327 171
337 125
346 401
361 906
375 373
383 354
384 592
377 349
362 208
Source: OCES, 2006

TERTIARY EDUCATION IN PORTUGAL: BACKGROUND REPORT
125
Table 3.10 – Number of students concluding graduate courses
Number of graduates Type of institution 1993/4 1994/5 1995/6 1996/7 1997/8 1998/9 1999/0 2000/01 2001/02 2002/03 2003/04Public
University 12 318 12 715 13 680 14 478 14 913 15 161 15 401 15 599 17 223 18 606 18 953
Armed forcesa 177 143 130 126 147 102 149 162 140 181 178
Total Public Univ. 12 495 12 858 13 810 14 604 15 060 15 263 15 550 15 761 17 363 18 787 19 131
Polyt- General 5 933 6 226 7 323 7 593 8 647 10 512 11 567 14 771 16 364 17 879 18 156
Polyt- Health 868 1 370 1 303 1 848 1 298 1 659 2 518 4 248 3 753 3 951 3 906
Armed forcesa 138 93 90 68 92 83 103 66 130 106 81
Total P. Polyt. 6 939 7 689 8 716 9 509 10 037 12 254 14 188 19 085 20 247 21 936 22 143Total Public 19 434 20 547 22 526 24 113 25 097 27 517 29 738 34 846 37 610 40 723 41 274Private institutions 10 676 12 339 13 117 14 537 16 648 19 332 20 028 20 613 20 052 20 067 19 622Catholic
i1 074 1 004 1 267 1 453 1 644 1 580 1 512 1 570 1 496 1 587 1 770
Total Private 11 750 13 343 14 384 15 990 18 292 20 912 21 540 22 183 21 548 21 654 21 392TOTAL 31 184 33 890 36 910 40 103 43 389 48 429 51 278 57 029 59 158 62 377 62 666
Source: OCES, 2006.

TERTIARY EDUCATION IN PORTUGAL: BACKGROUND REPORT
126
The funding formula adopted in 2006 introduced a performance indicator aimed to foster the implementation of measures to promote success in higher education. It uses a graduation index (i.e., TEPj, Graduation index for each graduate programme, j; Tables 3.11 and 3.12), defined as follows:
nI
ADTEPjt
tt1
21-t2
*4
IPV*3−
−− −+=
where: 2−tD = Number of graduates, year t-2 1−tI = Total enrolment, year t-1 1-tIPV = Number of new students in the first year, year t-1 2−tA = Number of drop-outs, year t-2 n = Nominal duration of the programme (years)
The graduation index of each institution is obtained as an average of the graduation index of each programme weighted by the number of students enrolled in the programme.
The funding formula adopted in 2006 also introduced a post-graduation index for post-graduate programmes (Table 3.11), which aims at measuring the relation between the number of awarded degrees (masters and PhDs) and the number of teachers with a PhD degree, as follows:
TECj = Number of awarded Masterst-2 + 3xPhDs awardedt-2
Number of PhD holding academic staff, FTEt-2
The indicator’s initial value for university j is calculated as the ratio between the numbers of post-graduate degrees awarded by the institution in year t-2, the number of PhDs being weighted by 3.
Analysis of Tables 3.11 and 3.12 show comparable graduation indexes in universities and polytechnics, although public polytechnics show drop-out and failure rates higher than those typical of other European contexts (with measured survival rate indexes of 54% in 2003, and 59% in 2004), namely in the area of technologies.
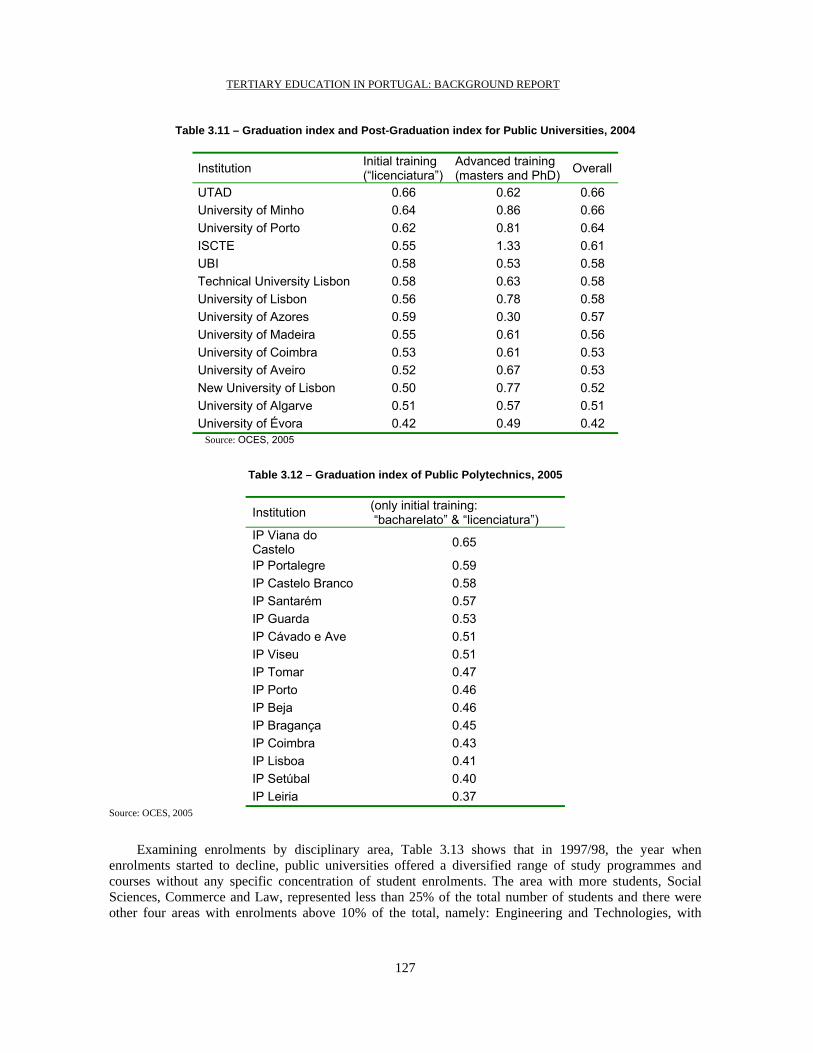
TERTIARY EDUCATION IN PORTUGAL: BACKGROUND REPORT
127
Table 3.11 – Graduation index and Post-Graduation index for Public Universities, 2004
Institution Initial training (“licenciatura”)
Advanced training (masters and PhD) Overall
UTAD 0.66 0.62 0.66 University of Minho 0.64 0.86 0.66 University of Porto 0.62 0.81 0.64 ISCTE 0.55 1.33 0.61 UBI 0.58 0.53 0.58 Technical University Lisbon 0.58 0.63 0.58 University of Lisbon 0.56 0.78 0.58 University of Azores 0.59 0.30 0.57 University of Madeira 0.55 0.61 0.56 University of Coimbra 0.53 0.61 0.53 University of Aveiro 0.52 0.67 0.53 New University of Lisbon 0.50 0.77 0.52 University of Algarve 0.51 0.57 0.51 University of Évora 0.42 0.49 0.42
Source: OCES, 2005
Table 3.12 – Graduation index of Public Polytechnics, 2005
Institution (only initial training: “bacharelato” & “licenciatura”)
IP Viana do Castelo 0.65
IP Portalegre 0.59 IP Castelo Branco 0.58 IP Santarém 0.57 IP Guarda 0.53 IP Cávado e Ave 0.51 IP Viseu 0.51 IP Tomar 0.47 IP Porto 0.46 IP Beja 0.46 IP Bragança 0.45 IP Coimbra 0.43 IP Lisboa 0.41 IP Setúbal 0.40 IP Leiria 0.37
Source: OCES, 2005
Examining enrolments by disciplinary area, Table 3.13 shows that in 1997/98, the year when enrolments started to decline, public universities offered a diversified range of study programmes and courses without any specific concentration of student enrolments. The area with more students, Social Sciences, Commerce and Law, represented less than 25% of the total number of students and there were other four areas with enrolments above 10% of the total, namely: Engineering and Technologies, with

TERTIARY EDUCATION IN PORTUGAL: BACKGROUND REPORT
128
23%, Sciences, Mathematics and Computer Sciences with 15%, Arts and Humanities with 12% and Education with 11%.
Public Polytechnics concentrated their enrolments in Engineering (32%), Management and Business Administration (31%), Education/Teacher training (14%), Health and Social Protection (9%) and Agriculture (5%), which corresponded to the initial recommendations made by the World Bank (Teixeira, Amaral and Rosa, 2003). Private universities concentrated their study programmes in the area of Social Sciences, Commerce and Law, which represented 66% of the total number of students, while each of all other areas represented less than 10% of total enrolment. Private polytechnics concentrated their programmes in the areas of Education/Teacher training (36%) and Management and Business Administration (36%). Education in Health and Social Protection was delivered essentially at nursing schools, representing 9.8% of the total number of students.
Table 3.13 – Enrolments in Public and Private Institutions by disciplinary area, 1997/98
Private sector Public sector Polytechnic University Polytechnic University Scientific area Number % Number % Number % Number %
Education 9 614 35.7 280 0.3 10 276 14.1 16 615 10.8Arts and Humanities 1 766 6.6 7 599 8.1 2 868 3.9 19 006 12.3Social Sc., Commerce, Law 9 570 35.6 61 523 65.5 22 321 30.7 38 031 24.7Sciences, Maths, Informatics 1 089 4.0 5 925 6.3 1 349 1.9 23 188 15.1
Engineering, Manufacturing and Building Industries 1 162 4.3 9 324 9.9 23 518 32.4 35 166 22.8
Agriculture 0 0.0 59 0.1 3 379 4.6 6 441 4.2Health and Social Protection 2 651 9.8 5 864 6.2 6 560 9.0 8 925 5.8Services 1 065 4.0 3 340 3.6 2 420 3.3 6 579 4.3Total 26 917 100.0 93 914 100.0 72 691 100.0 153 951 100.0Source: OCES, 2005
The effects of declining enrolments
From the mid 1990s the context of Portuguese higher education has shifted as a result of declining birth rates and increasing policy concerns with quality. For example, Table 3.14 presents the evolution of enrolments since 1997/98, showing that the enrolments of private universities decreased 29% since 1997/98. The private polytechnics have been more stable, showing declining enrolments only after 2002/03. The declining trend in the public sector began only in 2003/04.
Table 3.14 – Enrolments in higher education
97/98 98/99 99/00 00/01 01/02 02/03 03/04 04/05 Universities 153 951 158 850 164 722 171 735 176 303 178 000 176 827 173 897Polytechnics 72 691 80 007 90 286 101 795 108 486 112 532 111 482 108 376
Pub
lic
Total Public 226 642 238 857 255 008 273 530 284 789 290 532 288 309 282 273Universities 93 914 89 361 88 190 82 979 79 908 77 109 73 708 67 157Polytechnics 26 917 28 572 30 547 31 194 31 904 33 190 33 046 31 507
Priv
ate
Total Private 120 831 117 933 118 737 114 173 111 812 110 299 106 754 98 664 Total 347 473 356 790 373 745 387 703 396 601 400 831 395 063 380 937
Source: OCES, 2005

TERTIARY EDUCATION IN PORTUGAL: BACKGROUND REPORT
129
Table 3.15 lists those private institutions that have closed down in recent years. The low levels of enrolments question the survival of institutions and/or their capacity to meet accreditation standards. Indeed, it will be difficult for some institutions to guarantee the availability of resources to hire good quality academic staff, maintain a good library and provide the appropriate institutional environment in the context of continuing student enrolment decline. In particular, institutions have shown strong “isomorphic” behaviour, in that new programmes attracting students are followed by a duplicating phenomenon giving rise to similar programmes created elsewhere without adequate attention to the necessary conditions for providing good quality education. This has happened in certain degree programmes such as “management”, “environment”, and more recently “health”.
Table 3.15 – Private institutions that have ceased activity in 2005
Enrolments in 31st DecemberInstitution 1990 1991 1992 1993 1994 1995 1996 1997 1998 1999 2000 2001 2002 2003 2004
Autónomak 234 423 543 717 796 826 812 672 538 371 232 104 60 24 Internacionalg 181 191 233 199 152 93 62 30 COCITEa 41 63 15 COCITEb 62 114 117 78 65 52 36 I.Erasmusc 361 703 1055 1276 1747 2186 I.Erasmusd 163 343 375 366 257 IESFe 70 117 238 285 266 201 127 73 87 83 ISCIEe 630 997 1280 1669 1812 2066 ISGa 177 133 99 79 58 ISHTf 54 99 147 142 119 162 151 137 62 51 18 ISHTa 11 11 11 19 34 30 16 ISTHl 33 41 59 110 108 105 78 68 61 50 42 ISMGe 344 730 1213 3001 4415 5723 7394 7588 ISMGf 145 169 178 184 148 106 88 38 16 10 ISMGl 109 180 211 246 413 379 397 335 284 258 247 ISPIg 58 53 33 ISPPh 88 138 209 120 106 42 ISPPi 172 304 462 529 608 619 523 393 248 115 70 29 20 ISPPj 52 102 131 123 ISTEe 22 ISTre 24 46 62 56 58 54 42 42 16 11 ISTrCome 40 73 104 139 161 165 145 134 127 104 37 22
a – Torres Vedras; b – Setúbal; c – Porto; d – Ponte de Lima; e – Lisboa; f – Castelo Branco; g – Chaves;
h – Lamego; i – Penafiel; j – Santo Tirso; k – Caldas da Rainha; l – Portimão
Source: OCES, 2005.
Decreasing enrolments are not confined to the private sector and Figure 3.9 presents the number of institutions with less than 100 first year students.
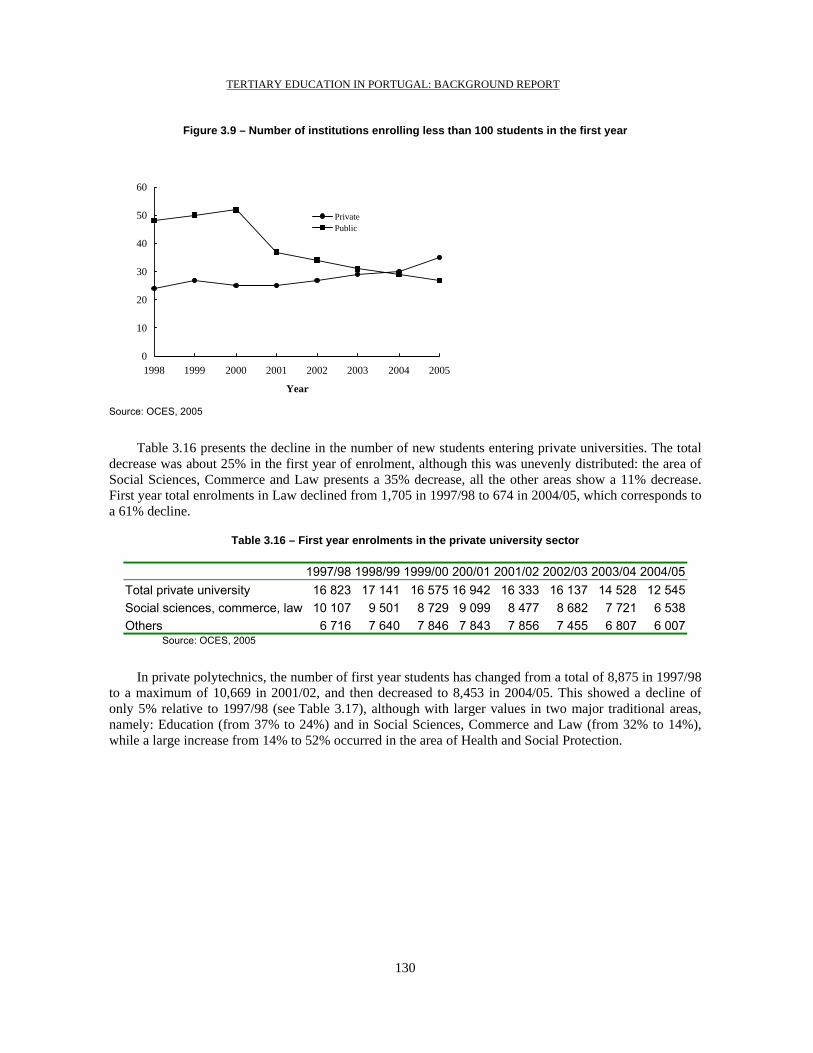
TERTIARY EDUCATION IN PORTUGAL: BACKGROUND REPORT
130
Figure 3.9 – Number of institutions enrolling less than 100 students in the first year
0
10
20
30
40
50
60
1998 1999 2000 2001 2002 2003 2004 2005
Year
PrivatePublic
Source: OCES, 2005
Table 3.16 presents the decline in the number of new students entering private universities. The total decrease was about 25% in the first year of enrolment, although this was unevenly distributed: the area of Social Sciences, Commerce and Law presents a 35% decrease, all the other areas show a 11% decrease. First year total enrolments in Law declined from 1,705 in 1997/98 to 674 in 2004/05, which corresponds to a 61% decline.
Table 3.16 – First year enrolments in the private university sector
1997/98 1998/99 1999/00 200/01 2001/02 2002/03 2003/04 2004/05Total private university 16 823 17 141 16 575 16 942 16 333 16 137 14 528 12 545Social sciences, commerce, law 10 107 9 501 8 729 9 099 8 477 8 682 7 721 6 538Others 6 716 7 640 7 846 7 843 7 856 7 455 6 807 6 007
Source: OCES, 2005
In private polytechnics, the number of first year students has changed from a total of 8,875 in 1997/98 to a maximum of 10,669 in 2001/02, and then decreased to 8,453 in 2004/05. This showed a decline of only 5% relative to 1997/98 (see Table 3.17), although with larger values in two major traditional areas, namely: Education (from 37% to 24%) and in Social Sciences, Commerce and Law (from 32% to 14%), while a large increase from 14% to 52% occurred in the area of Health and Social Protection.

TERTIARY EDUCATION IN PORTUGAL: BACKGROUND REPORT
131
Table 3.17 – Evolution of first year enrolments in the private polytechnic sector (%)
1997/98 1998/99 1999/00 2000/01 2001/02 2002/03 2003/04 2004/05Education 36.9 38.3 53.3 48.5 44.4 39.3 33.0 24.4Arts and Humanities 7.7 6.0 4.1 4.7 3.5 3.8 3.5 4.3Social Sc., Commerce, Law 31.6 27.3 17.7 14.0 13.2 12.5 12.9 14.0Sciences, Mathematics, I f ti
3.8 3.7 2.9 2.9 2.4 2.3 1.9 1.9Engineering, Manufacturing and Building Industries 3.2 4.1 2.2 2.5 2.3 1.7 1.9 1.8Agriculture 0.0 0.1 0.1 0.0 0.0 0.0 0.0 0.0Health and Social Protection 13.7 17.6 18.0 25.7 32.6 38.1 44.4 52.1Services 3.2 2.9 1.7 1.7 1.6 2.3 2.4 1.5Total 100.0 100.0 100.0 100.0 100.0 100.0 100.0 100.0
Source: OCES, 2005
The decrease in enrolments in the public sector is more recent. Nevertheless, the health sector in the public polytechnics has increased its first year enrolments from 2,543 in 1997/98 to 5,680 in 2004/05. Similarly, architecture that in 1997/98 had total first year enrolments in universities equal to 1,498, offers a total number of vacancies equal to 2,166 for the next academic year, 2006/07, 546 of them in the public sector and the other 1,620 in private institutions, while the number of study programmes has doubled from 12 to 24.
Following the data presented in Part II of this report, the analysis of enrolments in all programmes across the whole system show programmes with very few students. For example, in 2005 there were 286 programmes in public universities with less than 100 students (and of these 161 had less than 50 students and 70 had less than 25 students), and there were 227 programmes in public polytechnics with less than 100 students (and of these 125 had less than 50 students and 39 had less than 25 students). In addition, some public institutions opened campi in several towns around its main campus, as listed in Table 3.18. These initiatives were often taken in answer to the demands of local authorities and in most cases resulted in establishing small schools.

TERTIARY EDUCATION IN PORTUGAL: BACKGROUND REPORT
132
Table 3.18 – Number of students in new campi established by public institutions outside their main centre of activity
Institution Area and localization of school 1st year, 1st
time 03-041st year, 1st
time 04-05 1st year, 1st
time 05-06
Universities
Algarve Gestão, Hotelaria e Turismo de Faro (Portimão) 129 124 90
Aveiro Tecnologia e Gestão (Águeda) 217 234 190
Aveiro Design, Gestão e Tecnologias da Produção Aveiro-Norte 0 0 30
UTAD UTAD (Miranda do Douro) 87 54 51UTAD UTAD (Chaves) 145 113 108 Polytechnics Bragança Tecnologia e Gestão (Mirandela) 183 251 221Castelo Branco Gestão (Idanha-a-Nova) 139 193 208Coimbra Tecnologia e Gestão (Oliveira do Hospital) 100 123 107Guarda Turismo e Telecomunicações (Seia) 94 94 80Leiria Artes e Design (Caldas da Rainha) 276 266 311Leiria Educação (Caldas da Rainha) 0 0 0Leiria Tecnologia (Peniche) 207 169 233Portalegre Agrária (Elvas) 63 82 59
Porto Estudos Industriais e de Gestão (Vila do Conde) 247 249 267
Porto Tecnologia e Gestão (Felgueiras) 105 158 171Santarém Desporto (Rio Maior) 105 147 145Setúbal Tecnologia (Barreiro) 84 90 46Viana do Castelo Agrária (Ponte de Lima) 82 45 31Viana do Castelo Ciências Empresariais (Valença) 26 45 38Viseu Educação (Lamego) 127 106 117Viseu Tecnologia (Lamego) 106 137 145Tomar Tecnologia (Abrantes) 91 80 99TOTAL 2 613 2 760 2 747
Source: OCES, 2006
3. Post-graduate programmes
Post-graduate programmes are still a minor activity at the university level, representing less than 12,000 students in 2005 (Table 3.19). At present, the traditional Masters offered by university level institutions corresponds to about 8% of total enrolments in public universities (Table 3.20). It should be noted that the new Decree-Law regulating the implementation of the Bologna process gives polytechnics the possibility of offering the new Bologna second cycle of studies.
Students enrolled in masters’ programmes in public universities represented in 2004 about 85% of the total number of post-graduation students, with the Catholic University representing 50% of the private sector.
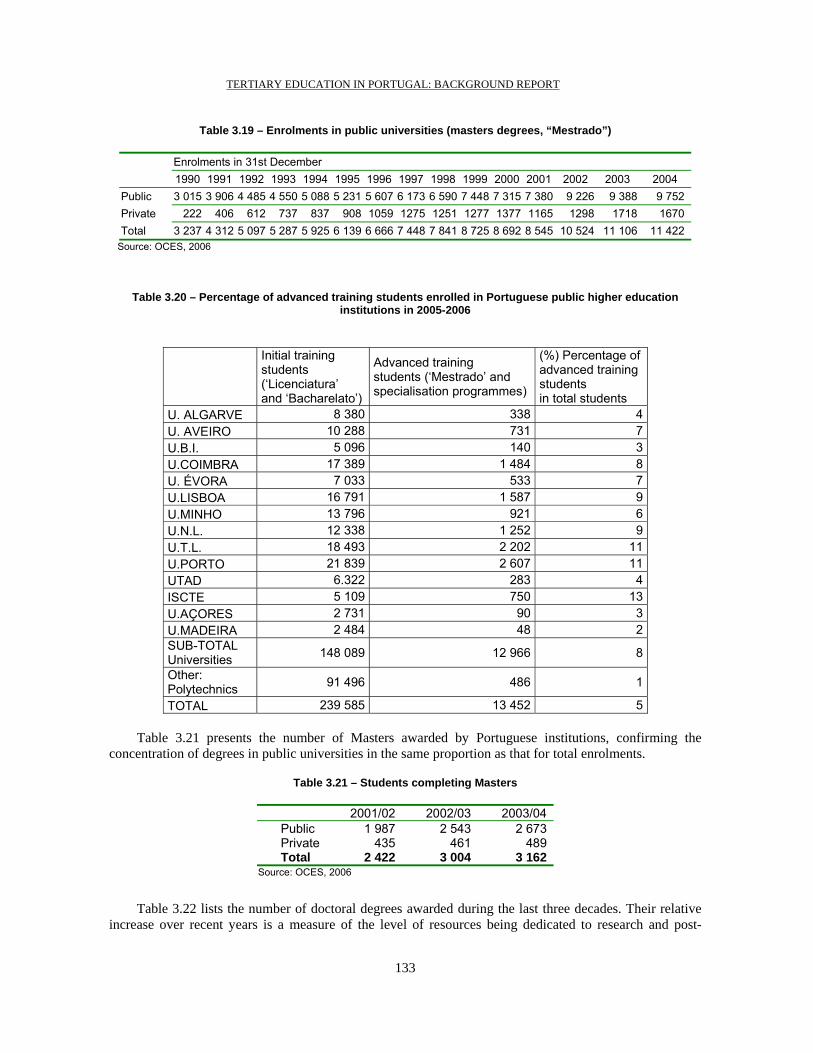
TERTIARY EDUCATION IN PORTUGAL: BACKGROUND REPORT
133
Table 3.19 – Enrolments in public universities (masters degrees, “Mestrado”)
Enrolments in 31st December 1990 1991 1992 1993 1994 1995 1996 1997 1998 1999 2000 2001 2002 2003 2004 Public 3 015 3 906 4 485 4 550 5 088 5 231 5 607 6 173 6 590 7 448 7 315 7 380 9 226 9 388 9 752 Private 222 406 612 737 837 908 1059 1275 1251 1277 1377 1165 1298 1718 1670 Total 3 237 4 312 5 097 5 287 5 925 6 139 6 666 7 448 7 841 8 725 8 692 8 545 10 524 11 106 11 422
Source: OCES, 2006
Table 3.20 – Percentage of advanced training students enrolled in Portuguese public higher education
institutions in 2005-2006
Initial training students (‘Licenciatura’ and ‘Bacharelato’)
Advanced training students (‘Mestrado’ and specialisation programmes)
(%) Percentage of advanced training students in total students
U. ALGARVE 8 380 338 4 U. AVEIRO 10 288 731 7 U.B.I. 5 096 140 3 U.COIMBRA 17 389 1 484 8 U. ÉVORA 7 033 533 7 U.LISBOA 16 791 1 587 9 U.MINHO 13 796 921 6 U.N.L. 12 338 1 252 9 U.T.L. 18 493 2 202 11 U.PORTO 21 839 2 607 11 UTAD 6.322 283 4 ISCTE 5 109 750 13 U.AÇORES 2 731 90 3 U.MADEIRA 2 484 48 2 SUB-TOTAL Universities 148 089 12 966 8
Other: Polytechnics 91 496 486 1
TOTAL 239 585 13 452 5
Table 3.21 presents the number of Masters awarded by Portuguese institutions, confirming the concentration of degrees in public universities in the same proportion as that for total enrolments.
Table 3.21 – Students completing Masters
2001/02 2002/03 2003/04Public 1 987 2 543 2 673Private 435 461 489Total 2 422 3 004 3 162
Source: OCES, 2006
Table 3.22 lists the number of doctoral degrees awarded during the last three decades. Their relative increase over recent years is a measure of the level of resources being dedicated to research and post-

TERTIARY EDUCATION IN PORTUGAL: BACKGROUND REPORT
134
graduate training. Public universities awarded 71% of all degrees, 28% being awarded by foreign universities and the remaining 2% by Portuguese private institutions. From the total number of 12,849 PhD degrees awarded since 1970, there are 11,316 PhD holders in the academic staff of higher education institutions.
Table 3.22 – Number of PhDs awarded by Portuguese and foreign universities
1970-9 1980-9 1990 1991 1992 1993 1994 1995 1996 1997 1998 1999 2000 2001 2002 2003 2004 Total
Portugal 293 1 247 250 223 245 378 319 432 459 467 480 575 693 699 799 836 926 9 321
Abroad 477 818 87 96 106 115 133 137 149 120 236 196 161 206 175 174 142 3 528
Total 770 2 065 337 319 351 493 452 569 608 587 716 771 854 905 974 1 010 1 068 12 849Source: OCES, 2005.
A recent study conducted on the student composition (Figure 3.10) of one of the Portuguese schools with the largest number of post graduate students (i.e., IST of UTL, as in Table 3.20) compares its student structure with those of some master universities and some research universities, as classified by the Carnegie Foundation. Analysis must be done with caution due to the relative duration of the various programmes. Indeed, hosting foreign professors and students at the post-graduate level is a characteristic of the American research universities, which has become an important condition to guarantee university excellence. Research universities in the USA are responsible for nearly 70% of all foreign students, the great majority being post-graduate students.
Portugal graduates only three fifths of the total number of PhDs of Spain for each 1,000 graduates from higher education. This corresponds to about 1/5 of those PhDs annually graduated in the Netherlands, or 1/7 of those graduated in Germany, for each 1000 graduates from higher education (see Table 1.9 for details).
In terms of the active population, Portugal graduated in 2001 about 3 new PhDs in science and engineering for each 10,000 inhabitants aged 25-34, while this figure for the EU15 was about 5.5.

TERTIARY EDUCATION IN PORTUGAL: BACKGROUND REPORT
135
Figure 3.10 – Comparison between the student structure of IST- UTL and some American masters and research universities
(11 )
(13)
(14)
(1 )
(7)
(2)
(10) (5) (12)
(9)
(4)
(8)
(3)
(6)
0 5
10 15 20 25 30 35 40 45 50 55 60
0 5 10 15 20 25 30
International students/Total Students (%)
Post
-gra
duat
ed s
tude
nts/
Tota
l Stu
dent
s (%
)
Source: UTL(2005), “Knowledge production and diffusion at UTL, 1995/95-2002/03”, UTL.
Note 1: (1) Carnegie Mellon University; (2) MIT; (3) Stanford; (4) Michigan Tech University; (5) Illinois State University; (6) University of Dayton; (7) Technical University of Lisbon (as based on figures only from engineering students at Instituto Superior Técnico); (8) Cumberland University; (9) University of Arizona; (10) Colorado State University; (11) Georgia Institute Technology; (12) University of Maryland Baltimore; (13) Portland State University; (14) Arkansas State University
Note 2: Data for 2003: MIT, Michigan Tech University, Illinois State Univ, Dayton Univ; Data for 2002: all other universities; According to Carnegie Classification, this figure show 11 research universities and 3 master universities (American universities)
Sources: Annual reports, requests to universities for information
4. Academic Research
In 2003 academic research represented about 50% of the total expenditure in R&D (including expenditure by higher education and related non-profit institutions), accounting for 510 M€. Total expenditure (public and private) in R&D was 0.78% of the GDP, reaching 0.85% in 2001, when the European average was 1.98% for the EU15 (Figure 3.11). Higher education and related non-profit institutions represented in 2003 about 74% of Portuguese researchers (FTE), with a total value of 24,726 researchers (i.e., head counts) or 13,008 FTE researchers. In December 2004, higher education institutions included 11,316 teaching staff members holding a PhD degree.
In the context of this discussion, it is important to note that in 2001 Portugal was, for the first time in history, part of the group of the countries of excellence that contributed to the share of top 1% of the world’s highly cited publications (King, 2004). Between 1997 and 2001, Portuguese researchers contributed with 0.25% of the overall figure. Spain was responsible for 2.08%, whereas Ireland and Greece accounted for 0.36% and 0.3%, respectively.

TERTIARY EDUCATION IN PORTUGAL: BACKGROUND REPORT
136
Figure 3.11 – Portuguese gross expenditure in R&D (GERD, %) as a fraction of GDP, with identification of the various Governments
Source, ISI; OCES
Source: EUROSTAT
Figure 3.12 – Number of scientific publications in ISI Journals over time for a sample of small nations
The development of Portuguese science and, in particular, academic research has been achieved in a comparatively high international context and Figure 3.13 shows that 53% of the scientific publications registered at ISI in 2003 were made in international co-authorship.
0
2000
4000
6000
8000
10000
12000
14000
16000
18000
20000
1981
1982
1983
1984
1985
1986
1987
1988
1989
1990
1991
1992
1993
1994
1995
1996
1997
1998
1999
2000
2001
2002
2003
BELGIUM
CZECH REPUBLIC
DENMARK
FINLAND
IRELAND
NETHERLANDS
PORTUGAL
SLOVENIA
TAIWAN
SINGAPORE
0,00
0,100,20
0,30
0,40
0,500,60
0,70
0,80
0,90
1,00
1971
1972
1976
1978
1980
1981
1982
1983
1984
1985
1986
1987
1988
1989
1990
1991
1992
1993
1994
1995
1996
1997
1998
1999
2000
2001
2002
2003
2004
2005
2005
-...
VIII IX X XI XII XIII XIV XV XVI XVII
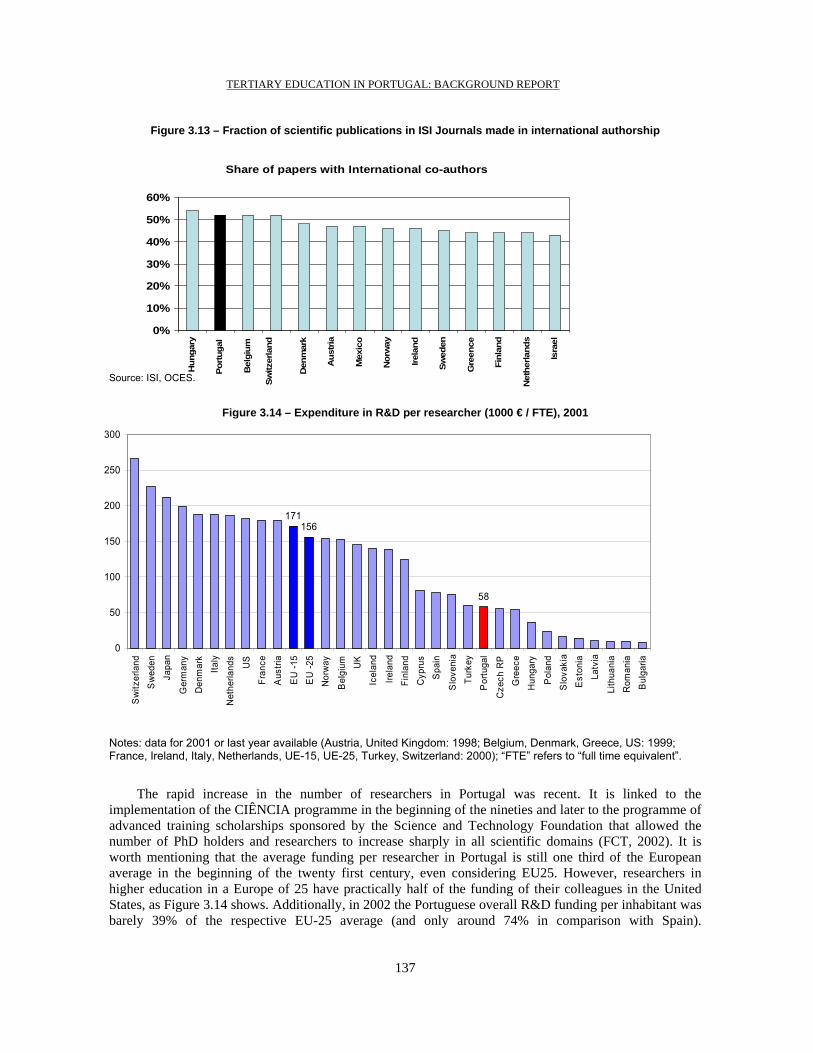
TERTIARY EDUCATION IN PORTUGAL: BACKGROUND REPORT
137
Figure 3.13 – Fraction of scientific publications in ISI Journals made in international authorship
Source: ISI, OCES.
Figure 3.14 – Expenditure in R&D per researcher (1000 € / FTE), 2001
Figure 1.
Sources: Eurostat; http://europa.eu.int/comm/eurostat/;
Notes: data for 2001 or last year available (Austria, United Kingdom: 1998; Belgium, Denmark, Greece, US: 1999; France, Ireland, Italy, Netherlands, UE-15, UE-25, Turkey, Switzerland: 2000); “FTE” refers to “full time equivalent”.
The rapid increase in the number of researchers in Portugal was recent. It is linked to the
implementation of the CIÊNCIA programme in the beginning of the nineties and later to the programme of advanced training scholarships sponsored by the Science and Technology Foundation that allowed the number of PhD holders and researchers to increase sharply in all scientific domains (FCT, 2002). It is worth mentioning that the average funding per researcher in Portugal is still one third of the European average in the beginning of the twenty first century, even considering EU25. However, researchers in higher education in a Europe of 25 have practically half of the funding of their colleagues in the United States, as Figure 3.14 shows. Additionally, in 2002 the Portuguese overall R&D funding per inhabitant was barely 39% of the respective EU-25 average (and only around 74% in comparison with Spain).
Share of papers with International co-authors
0%
10%
20%
30%
40%
50%
60%H
unga
ry
Portu
gal
Bel
gium
Switz
erla
nd
Den
mar
k
Aus
tria
Mex
ico
Nor
way
Irela
nd
Swed
en
Gre
ence
Finl
and
Net
herla
nds
Isra
el
171156
58
0
50
100
150
200
250
300
Sw
itzer
land
Sw
eden
Japa
n
Ger
man
yD
enm
ark
Italy
Net
herla
nds
US
Fran
ce
Aus
tria
EU
-15
EU
-25
Nor
way
Bel
gium U
KIc
elan
d
Irela
ndFi
nlan
dC
ypru
sS
pain
Slo
veni
aTu
rkey
Por
tuga
l
Cze
ch R
PG
reec
eH
unga
ry
Pol
and
Slo
vaki
aE
ston
iaLa
tvia
Lith
uani
aR
oman
iaB
ulga
ria

TERTIARY EDUCATION IN PORTUGAL: BACKGROUND REPORT
138
Furthermore, Portugal’s GDP per capita was at that time just about 75% of the EU-15 average, which demonstrates the real deficit in R&D funding in Portugal.
The funding structure of R&D activities is characterised by a strong State participation. In 2001 the State sector funded around 56% of total R&D activities in the EU, while it represented 61% in Portugal. It is also known that these figures differ from the R&D funding structure in more economically and technologically developed countries (i.e., countries where private R&D funding is larger, as is the case of the United States of America: 66%, Sweden: 72%, Finland: 71%).
The funding structure is consistent with the low employment percentage in knowledge-intensive sectors (Table 3.23). Also, the number of PhDs working in industry is very low (Table 3.24). Nevertheless, in the second half of the 1990's, the number of companies active in R&D doubled in Portugal. These companies compete internationally with qualified human resources, R&D and innovation, marketing, design, training and quality, co-operating with S&T institutions.
Table 3.23 – Employment in knowledge-intensive service sectors (share of total employment, %) for EU15, Portugal and some selected countries
1994 1995 1996 1997 1998 1999 2000 2001 2002 2003 2004 EU15 6.33s 6.29s 6.24s 6.32 6.29 6.28 6.17 6.07 5.89s 5.7s
Greece 2.13 2.12 2.08 2.01 2.21b 2.000 1.97 1.99 1.91 1.75 2.05Spain 4.79 4.67 4.61 4.84 4.92 4.85 4.78 4.92 4.87 4.55 4.34Ireland 4.45 4.30 4.35 4.40 3.94b 4.05 3.53 3.71 3.69 3.38 3.77Finland 5.17 5.28 5.11 5.27 5.18 5.25 5.25 5,38 5.09 4.85Portugal 3.14 3.17 3.14 3.05 2.91 2.87 3.08
Notes: s – EUROSTAT estimate; f – Break in series Source: EUROSTAT (2005)
The deficit of Portuguese private R&D can be better understood through recent analysis of private R&D in Europe (e.g., DTI, 2004). This study identified the critical role of multinational corporations in Europe, as well as the importance of research and development activities for their success. Nevertheless, it is worth mentioning that whereas a medium-sized multinational in the north of Europe invests more than 6% of its turnover in R&D, one of the largest Portuguese companies (for instance, in the car component sector), with a turnover 10 times lower, invests around 3%. This results in a ratio of 1 to 20 in terms of resources – but only 1 to 2 in terms of turnover – allocated to research and development activities. As multinationals have not moved to Portugal14, at least in a way that might increase the private sector R&D, and within the current context of foreign direct investment in southern Europe and particularly in Portugal, it is urgent to rethink the relationship of the university with the private sector to ensure a process of European convergence in terms of the S&T at the national level.
Table 3.24 – Number of researchers with a PhD working in industry*
Year Number of PhDs 1995 41 1997 94 1999 104 2001 113 2003 189
* includes those with equivalence to a PhD Source: OCES, 2005
14 There are exceptions such as the recent development of the Centre for Innovation of Siemens Portugal, in
Carnaxide.

TERTIARY EDUCATION IN PORTUGAL: BACKGROUND REPORT
139
Strengthening S&T
Science and technology got a major boost in the mid 1990s with the implementation of specific policies focused on the promotion of human resources and scientific institutions. The Ministry of the Science and Technology was created in 1995, resulting in profound institutional changes. Three new organisations were created: the Foundation for Science and Technology (FCT) with evaluation and financing responsibilities, the Institute for International Cooperation in S&T (ICCTI) for promoting international cooperation in science and technology, and the Observatory of Sciences and Technologies (OCT), with observation, inquiry and data analysis responsibilities. In addition, the development of the Portuguese scientific and technological system was stimulated within the framework of a deep reform in the evaluation of R&D institutions, to guarantee the independence and effectiveness of the evaluations, the publication of the respective methodologies and results, as well as the exercise of the right of appeal. This exercise included all academic research units, and the implementation of new programmes to foster advanced training, namely at the PhD level, and to promote the mobility of human resources.
Major reforms implemented in the second half of the 90’s to increase the R&D potential by investing in advanced training of human resources and in competitive funding of R&D activities, as well as in strengthening R&D institutions and their internationalisation, included the following measures (OECD, 2002):
• R&D programmes integrated scholarship grants for initial (graduate) and advanced (PhD and Post-doc) training and the launching of scientific careers. This was based on funding research projects in all scientific domains on a competitive basis by international quality standards. Similar measures were contemplated for advanced human resources training and research targeted to ICT.
• Project funding was dependent on quality assessment by independent evaluation panels that included a majority of international experts. Application for funding was opened yearly by the FCT for all areas of knowledge. Beneficiaries were research teams in public or private institutions with R&D activities, and business enterprises in consortia with R&D institutions or engaging in integrated R&D programmes. Since the aim was to develop the general science base, there was no thematic prioritisation in the general funding programme. Project selection was based on project and team quality assessment.
• Dedicated thematic programmes also addressed public interest issues (e.g. forest fires, marine science, ethnic minorities, protection of natural environments, drug addiction) and participation in international R&D institutions of which Portugal was a member (EMBL, ESO, ESRF, ESA, CERN, ESO). Evaluation parameters and procedures were similar to those of the general programme. In the context of Information Society, new R&D programs were set up, targeted at ICT and their use in social and economic contexts, and computational processing in Portuguese language.
Academic research is organised in “Research Units”, most of them associated to public universities (Table 3.25). To strengthen the institutional development of sample units, “Associated Laboratories” have been created and promoted since 2000 and incentives were provided for the continuous implementation of independent scientific evaluations. This process has involved the reorganisation of part of the R&D system and strengthened the level of responsibility and accountability to society.

TERTIARY EDUCATION IN PORTUGAL: BACKGROUND REPORT
140
Table 3.25 – Research centers accredited by FCT, 2004
Type of institution Centres Public universities 384Public Polytechnics 8Catholic University 14Private universities 7Other private institutions 20Total 433
Source: FCT
The network of associated laboratories created since 2000 consisted in specific contracts with networks of existing R&D units with strategic orientations and missions considered of public utility. The status of “associated laboratory” was conferred by the Ministry of Science and Technology for a period of up to ten years, through a contract that specified the amount of public funding of the laboratory and their missions. These laboratories had an initial funding for five years, being evaluated after that period and at the end of the contract period, which can be renewed after positive evaluation.
Fifteen associated laboratories were established in 2000 and 2001, integrating 31 R&D institutions. There are today 21 associated laboratories involving 38 R&D institutions in Physics, Chemistry, Earth and Space Sciences, Marine Sciences, Geological Sciences, Health Sciences, Materials Sciences and Engineering, Chemical and Biotechnological Engineering, Electrical and Computational Engineering and Social Sciences. These laboratories include 41 research units, have 2,200 researchers, 1,452 of them holding a PhD, and had funds totalling € 268 Million for the first 10 years (as in http://www.fct.mct.pt/pt/apoios/laboratoriosassociados/quaissao/).
An important infrastructure in the networking of R&D institutions was the creation of an information network (i.e., RCTS), linking universities and research centers, libraries and elementary and secondary schools by broadband. All linked institutions were provided sub-domains, e-mail accounts and space for web pages. One of its developments was the creation of a Network Science and Technology Library connecting all adherent institutions to common library resources online and to international databases. The first step towards the creation of this Science and Technology Library has already been taken through an agreement with the Institute for Scientific Information, making ISI’s databases available online to all Portuguese research institutions.
The Innovation Agency (AdI, http://www.fct.mces.pt/pt/empresas/inovacao/), was created in 1993, co-coordinated with the S&T policy, implementing support for consortia of business and R&D institutions and promoting the economic use of R&D results.
New policies to foster the public understanding of science and technology were also introduced, particularly during the second half of the 90’s. The “Ciência Viva” has been particularly ambitious in promoting dissemination activities and supporting cooperative networks of basic and secondary schools with research centres. The importance of promoting science education and/or creating science culture has been widely identified and discussed (Gago, 1990). There were two main arguments to consider: first, S&T should be seen as an open system, with different and diversified ways of participation, mainly derived from the fact that scientific activity is increasingly part of people’s life, so that the training of scientists should not be confined to a specific group of people, but rather developed broadly and part of today’s education; and second, the goal of fostering the public understanding of science, where schools and other institutional settings (e.g, science museums) have a determinant role in stimulating curiosity and the interest for scientific knowledge.

TERTIARY EDUCATION IN PORTUGAL: BACKGROUND REPORT
141
Assessing of R&D Institutions
The implementation of a new model for funding and assessment of R&D units was launched in 1996, covering all 270 units existent at the time. International expert panels rated the units in a five degrees scale, ranking from ‘poor’ to ‘excellent’, and making recommendations for strategic orientation, future investment and activity plans. Quality assessment took into account research performance by international standards, including publications in international journals and patenting activity, where appropriate. Subsequent evaluations took into account the compliance with the recommendations and the good use of the previous funding, besides R&D performance and publications (OECD, 2002). Following the assessment exercise, funding for units classified as Poor was discontinued. The remaining 257 units were funded under the multi-year funding Programme for R&D Units of FCT, receiving base funding per post-doc, with the level of funding being partially based on the assessment. Following consideration of appeals submitted by certain units, distribution of the classifications Excellent, Very Good, Good and Fair among the units receiving funding was 17%, 31%, 32% and 19% respectively.
The second assessment of 1999/00 included the units assessed in 1996 and funded under the multi-year funding Program of FCT, covering a total of 263 units and 4,068 PhDs, and including new units that had become autonomous or were the result of mergers of units assessed in 1996. Around 160 foreign scientists, organised in 21 separate panels, took part in the 1999 assessment, which included the analysis of reports and activity plans, as well as visits by the assessment panels to the research units.
The third assessment of 2002/04 involved the Units financed through the multi-year funding Program of FCT, including those resulting from the partition or merger of Units evaluated in 1998 or 1999. It focused on the assessment of the activities carried out in the period 1999/01, as well as on the activity plans for 2003/05. It also assessed the applications submitted to the 2001/02 calls for proposals for new Research Units. One hundred and eighty international and Portuguese experts, belonging almost entirely to foreign institutions, made up the panels responsible for the evaluation.
The results of the assessment are given in detail elsewhere (FCT, 2005), but a number of general observations clearly expressed during the evaluations are of particular interest. Table 3.26 presents the main indicators of the Portuguese Research Units in 1996, 1999 and 2003. The steady increase of the number of PhDs and Units from one evaluation cycle to the other is clearly evident, reflecting the impact of a stable financing model on the R&D system that is becoming progressively more mature. The number of PhDs increased at an average rate of 19%/year in the period 1996-2003. The average size of the Units increased too, but the growth seems to be stabilising from 1999 to 2003.
Table 3.26 – Situation of the Portuguese Research Units in 1996, 1999 and 2003
Indicators 1996 1999* 2003
Number of PhDs 3 575 5 823 8 324 Number of units 270 354 473 Average number PhD/unit 13.2 16.4 17.6
*Consolidated in December 2000.
Source: FCT, Evaluation of Research Units 2002-2004, overall report
Research Units have a significantly smaller dimension in the Arts, Social and Human Sciences areas than in the remaining part of the Portuguese R&D system (Figure 3.16). The numbers, however, also show that those areas are growing at a faster rate, increasing their share of the overall system in terms of the

TERTIARY EDUCATION IN PORTUGAL: BACKGROUND REPORT
142
number of Units and PhDs, respectively from 27% to 39% and 21% to 30%, from 1996 to 2003. In spite of these increases, the average dimension is still small, probably below a critical threshold value.
Figure 3.15 shows the evolution of the number of Full Time Equivalent (FTE) PhDs in the Research Units, per scientific area, from 1996 to 2003. Considering the 2003 data inclusive of the Associated Laboratories, it can be observed that the number of PhDs increased steadily, for almost all areas, from one evaluation to the other. Between 1999 and 2003, this general increase was particularly noteworthy for areas such as Philosophy, Art and Architecture, Economics and Management, Health Sciences, History, Sociology, Anthropology, Demography and Geography, Literature and Electrical and Computer Engineering, which grew 88.7%, 88.0%, 79.6%, 62.3%, 61.6%, 57.9%, 54.7% and 54.6%, respectively. Figure 3.15 also reflects the heterogeneous distribution of the number of PhDs integrated in the 15 Associated Laboratories (AL) existing in December 2003 across the different scientific areas.
Figure 3.15 – Evolution of the number of FTE PhDs in research units per scientific area, 1996 to 2003
Source: FCT, Evaluation of Research Units 2002-2004, overall report
The analysis can be taken a step further by considering the data in Figure 3.16, which represents the evolution of the number of Research Units from 1996 to 2003. Again, the growth in the number of Units in the Arts, Social and Human Sciences areas from 1996 to 2003 was evident, being particularly important in Art and Architecture, History and Economy and Management (300%; 200%; 182%). The distribution of the number of Units integrated in Associated Laboratories was also not homogeneous, although the differences were smaller than in that case of the number of PhDs.
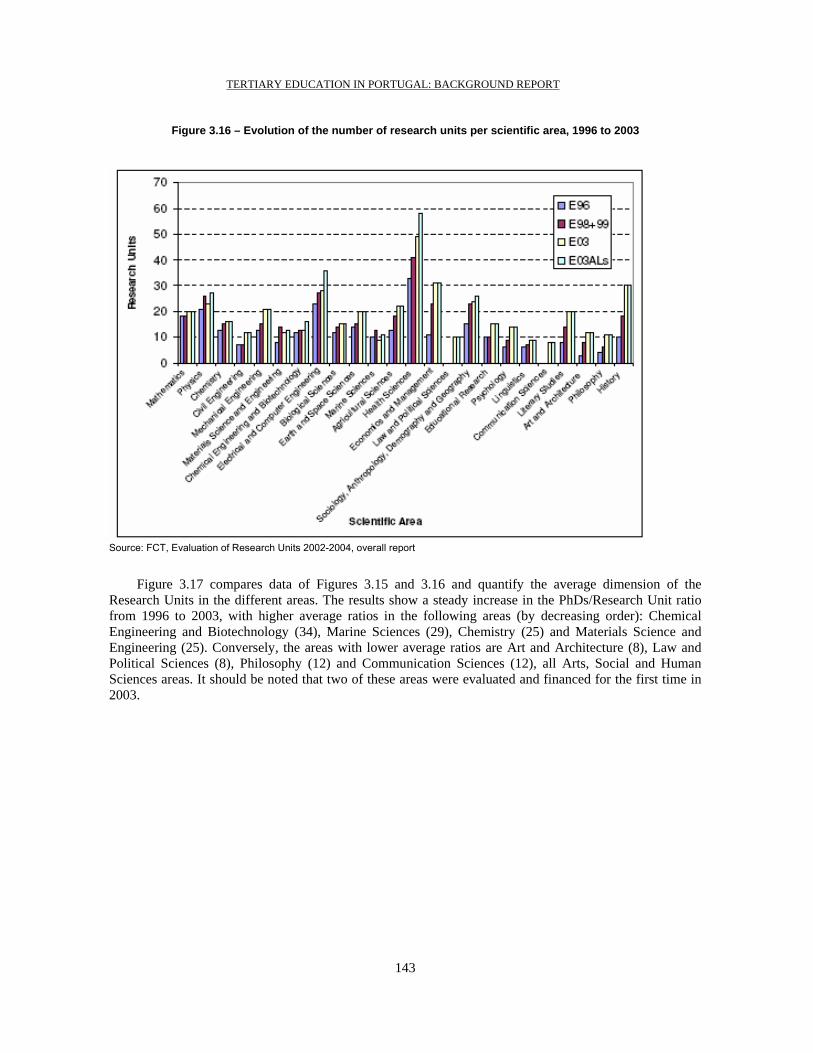
TERTIARY EDUCATION IN PORTUGAL: BACKGROUND REPORT
143
Figure 3.16 – Evolution of the number of research units per scientific area, 1996 to 2003
Source: FCT, Evaluation of Research Units 2002-2004, overall report
Figure 3.17 compares data of Figures 3.15 and 3.16 and quantify the average dimension of the Research Units in the different areas. The results show a steady increase in the PhDs/Research Unit ratio from 1996 to 2003, with higher average ratios in the following areas (by decreasing order): Chemical Engineering and Biotechnology (34), Marine Sciences (29), Chemistry (25) and Materials Science and Engineering (25). Conversely, the areas with lower average ratios are Art and Architecture (8), Law and Political Sciences (8), Philosophy (12) and Communication Sciences (12), all Arts, Social and Human Sciences areas. It should be noted that two of these areas were evaluated and financed for the first time in 2003.

TERTIARY EDUCATION IN PORTUGAL: BACKGROUND REPORT
144
Figure 3.17 – Evolution of the ratio PhD/unit per scientific area, 1996 to 2003
Source: FCT, Evaluation of Research Units 2002-2004, overall report
These policies have resulted in continuous increase in the number of doctorates, especially when
considering European and international figures. This fact has been referred by the generality of the evaluation panels as decisive (Heitor, 2000). The number of scholarships for advanced training awarded by the Foundation for Science and Technology (Figure 3.18) gave an important contribution for the progress registered in research activities.
Figure 3.18 – Scholarships for advanced training (Masters, PhD and post-doctoral)
Portugal54%
Abroad29%
Mixed17%

TERTIARY EDUCATION IN PORTUGAL: BACKGROUND REPORT
145
The growth of academic research during the last decade can also be assessed in terms of the number of research collaborations at European level and Figure 3.19 quantifies the relative strength of the Portuguese participation in the 6th Framework Programme by scientific field.
Figure 3.19 – Number of projects for the Portuguese participation if the 6th Framework Programme, by scientific area
Food Safety and Health Risks
4%
Mobility9%
Aeronautics and space8%
INCO7%
Life Sciences6%
Nanotechnologies6%
PMEs12%
Citizens and Governance
5%
Technologies of the Information Society
25%
Sustainable Development
19%
Fostering industry-science relationships
Existing programmes seeking to develop university-industry links include:
• Doctors and Masters in Companies and Technology Centres, aiming at encouraging firms to recruit human resources holding a doctoral or a master degree, in order to strengthen the companies’ R&D, technological innovation and competitiveness.
• IDEIA – Applied R&D in Companies, aiming at supporting cooperative R&D projects involving companies and S&T organisations, in order to develop new products, process or services. The programme gives special emphasis on product innovation.
• Centres of Excellence – Competence building making use of ICT – is a programme aimed at supporting networking of companies, research centres, Universities, Polytechnic Institutes, Public bodies and business associations. The main goals are the following:
− encouraging linkages between companies, research centres, high education and universities to develop networks;
− promoting the development of new and better services and new technologies;
− orienting sector and regional S&T development toward key areas;

TERTIARY EDUCATION IN PORTUGAL: BACKGROUND REPORT
146
− contributing to improve education curricula.
• NEST – New Technology Based Companies, to provide financial support to the creation, launching and development of technology-based firms that have a close relationship with domestic S&T organisations and/or are expected to reach a high level of technological capacity.
• The NEOTEC Initiative is concerned with the provision of seed capital for the creation of new technology-based firms, by supporting them in the different stages, from the identification of market potential to the commercialisation. Its aims include encouraging the carrying out of research activities and the exploitation of its results and stimulating entrepreneurship and an innovation culture.
Figure 3.20 presents the results (accumulated values) of the programme “Doctors and Masters in Companies and Technology Centres” which is contributing to increase the number of industry-employed people holding a postgraduate degree.
Figure 3.20 – Number of successful applications and of new companies in the programme “Doctors and masters in Companies and Technological Centres”.
3648 51
69
104
148
186
22 26 2838
53
79
99
273
17
150
130
50
100
150
200
250
300
1997 1998 1999 2000 2001 2002 2003 2004 2005
New successful applications New companies
Source: Adi, 2006
The diffusion character of R&D consortia may be analysed basis of the projects approved by the Innovation Agency, AdI, in the period 2001/2002, which involved 119 research projects undertaken by consortia of science and technology (S&T) companies and academic R&D units. Although most of the support was concentrated on projects led by companies from the high and medium-high technological intensity sectors (69%), there was significant participation of projects in sectors with greater weight in the Portuguese economic fabric that are generally classified as being of low technological intensity (44.3% of the number of participations), as shown in Table 3.27. The impact of these projects in the modernisation of the economic fabric is even more important given the high diffusing potential of the consortia. As was the case with the projects supported in 1996-2000, the great majority concern product innovation (77%), in order to facilitate adding value to national production. Furthermore, as most of the product innovation projects are for items of equipment and software, which represent production means for other economic sectors, they will contribute towards technological modernisation of those sectors, spreading the results of innovation. This is readily apparent in the matrix shown in Table 3.28, which juxtaposes the main technological areas of the projects and the main application sectors of the technologies being developed.

TERTIARY EDUCATION IN PORTUGAL: BACKGROUND REPORT
147
Chemical technology is spread through the textile, clothing and footwear sectors, as well as to the wood and cork and environmental sectors. Material technologies are strongly co-related with the construction, mechanical, and plastics sectors, as well as to the electronics sector. Mechanic technologies are playing a spreading role in the transport materials, textile, and electronics sectors. Finally, the information and communication technologies (ICT), with their horizontal characteristics, are spreading their innovative effects throughout virtually all sectors, including those such as maritime activities, public works, metal-mechanical working, and transport and company services. Taking the textile/clothing and footwear sectors as examples, one can note that these sectors are benefiting from the diffusion of technological innovation developed by technology companies working in such diverse areas as mechanics, ICT, materials, chemicals and biotechnology.
Table 3.27. Distribution of R&D consortia approved by the Innovation Agency, AdI, in the period 2001/2002 by
technological intensity levels
Source: AdI, November 2002
Table 3.28 – Distribution of R&D consortia approved by the Innovation Agency, AdI, in the period
2001/2002, by application area
Source: AdI, November 2002
(%)
Application SectorsAgro-food Biotech. Chemical Mats +Civil EngMechanics ITC Total
1 Sea 0,8 3,4 4,22 Agro-food 8,4 2,5 0,8 11,83 Environment 0,8 1,7 2,54 Health 7,6 1,7 0,8 2,5 12,65 Chemicals 2,5 2,56 Plastics 0,8 1,7 0,8 1,7 5,07 Wood +Cork 1,7 0,8 2,58 Construction 3,4 2,5 5,99 Textiles / Clothing Footwear 0,8 2,5 0,8 2,5 0,8 7,6
10 Metal working 0,8 0,8 1,711 Mechanical 2,5 1,7 2,5 6,712 Transport Equipment 0,8 4,2 5,013 Electronics+Instruments. 1,7 1,7 1,7 5,014 Software 7,6 7,615 Telecom 10,1 10,116 Transport 4,2 4,217 Other Services 5,0 5,0
Total 9,2 10,9 10,9 12,6 11,8 44,5 100,0
Technological Areas
T echnological Intensity Levels
N um ber of Partic ipations
E ligib le Investm ent
Total Public Support
Low 44 ,3% 30,6% 29 ,1%M edium -low 6 ,3% 2,5% 1,9%M edium -high 12 ,5% 9,5% 9,6%H igh 37 ,0% 57,4% 59 ,4%
Tota l 100 ,0% 100,0% 100 ,0%

TERTIARY EDUCATION IN PORTUGAL: BACKGROUND REPORT
148
It should be noted that 30% of the R&D consortia funded through AdI (by number) were undertaken in collaboration with S&T companies and institutions from other countries, within Europe, but also from America and Asia. The international projects accounted for more than 44% of the eligible investment expenditure and when this is set against the number of projects it can be seen that these projects were larger than average. Furthermore, about 22% of the projects were led by multinational companies, or companies with significant foreign-owned share capital. This significant presence of companies with foreign capital is a good indication of the trend that has been seen for the up-grading of foreign investment in Portugal. Adding the two percentages (and subtracting the effect of the intersection of the two types of internationalisation) one finds an internationalisation rate of 45% (measured by the number of projects) and 56% (by the relative importance of the investment sums involved).
Table 3.29 – Distribution of R&D consortia approved by the Innovation Agency, AdI, in the period 2001/2002 in
terms of the level of internationalisation
Classification of proposing company
Against the background of these initiatives, the process of technology transfer in Portugal has consistently been considered from a short-term perspective, based on specific contracts, mainly of a consultancy nature. Today, it is clear that science and technology cannot be promoted independently of an innovation policy and that in turn innovation determines and is determined by the market. However, it is also clear that research and innovation are structurally distinct activities, each with its own incentives, which are complementary but not interchangeable. While it is necessary to be aware of the reality in Portugal and its lag in science, technology and innovation compared to the European average, the important changes in progress should not be forgotten, particularly in terms of the internalisation of a “culture of monitoring and accountability”, as well as the international recognition of the enormous potential for expanding research activities and technological development. Against this background, any consideration of the opportunities available to Portugal, must reflect on the need for a “culture of change” and of rigour, thus fostering quality in the light of increasing numbers of Portuguese PhDs, which continue to rise at rates far higher than the European average.
In many evaluation reports produced over the last years by FCT, there is mention that various coordinators of research units often referred to the difficulty in implementing intellectual property protection mechanisms as a way to promote scientific impact and ensuring institutional integrity of the R&D units and the university. The main obstacle identified was a deficit in administration competences and technology commercialisation, but it was above all related to the problem in defining market strategies and connections with large companies that helped launch new technology-based companies. The analysis of the data provided by one of the Portuguese engineering schools, IST (AURIL, NUBS, 2003), shows that between 1995 and 2003, 4.1 patents per year were submitted through this service, of which 2.37 were international patents and 1.75 national patents. These figures contrast with the average of 7.5 patents submitted in 2002, by 98 English universities (ibid), where the links between the universities and the productive sector are more intense. But the weak submission of patents is also due to the low competences
Project Context National Foreign TotalNational 55,5% 14,3% 69,7%International 22,7% 7,6% 30,3% Total 78,2% 21,8% 100,0%
Distribution of Nº of ProjectsSource of Capital*
Project Context National Foreign TotalNational 44,2% 11,4% 55,7%International 34,2% 10,1% 44,3%Total 78,5% 21,5% 100,0%
Distribution of eligible expenditureSource of Capital*
TERTIARY EDUCATION IN PORTUGAL: BACKGROUND REPORT
149
of technology commercialisation and, above all, to the diffusion of innovation that today demands expert structures. For instance, a case usually referred to in the literature consists in the evolution of the Technology Licensing Office of MIT that today employs about 30 experts, most of whom have technical training, with special focus on engineering areas, and professional experience in industry. Thus, the commercialisation of patent portfolios, together with market strategies can be promoted. It is evident that organisational practices and institutional incentives play a relevant role in the effective technology transfer processes, so that institutional policies should focus on:
• The competences and the capacities of technology transfer offices;
• The incentive systems that are inconsistent with a more dynamic and pro-active attitude;
• The encouragement of faculty, researchers and postgraduate students in terms of their entrepreneurial potential capability and the development of new technology-based business projects.
Private research financing
Both business and public funding for R&D activities in Portugal, taken as a proportion of the GDP, have grown, although not always steadily, since the mid-1980s. In the second half of the 1990's, the number of companies active in R&D doubled. Analysis has shown that there are two main, inter-linked sources of restrictions to the kind of financing R&D and innovative activities receive from the business sector in Portugal.
The first of these sources has to do with the relatively low levels of in-house R&D done by most Portuguese industrial firms, which are particularly small in size, as well as with their concentration in activities that are mostly into mature stages of their life-cycles. The largest companies (namely in the energy, telecom, transports and construction sectors) invest relatively small amounts of resources in R&D.
This leads to a second source of restrictions: since Portuguese firms are unable to absorb, and therefore finance the development of a large part of the R&D results generated by universities and research institutions, new firm start-ups and technology-based entrepreneurship need to assume a stronger role in introducing new innovations to the market, and creating jobs. While Portugal has a large proportion of SMEs, entrepreneurial activity (i.e. the proportion of people engaged in new firm start-ups) is relatively low, and concentrates mostly on micro-firms (less than 10 employees) that are unable to grow significantly.
An additional point worth addressing is that many evaluation panels that visited Portugal in the last years noted that direct funding from industry was on a small scale, and that it had had no significant impact on the quality of research and has been used almost exclusively for short-term goals and for technological development. Examples of actions suggested by the evaluation panels include the establishment of: i) monitoring committees for research centres and state laboratories, to include representatives from the business world; ii) cooperation networks, supported by public funding; iii) exchange mechanisms for teachers, researchers and students.
Furthermore, as the industrial base in Portugal is mostly composed of small enterprises and many micro enterprises, this corresponds to quite low levels of education of many entrepreneurs.
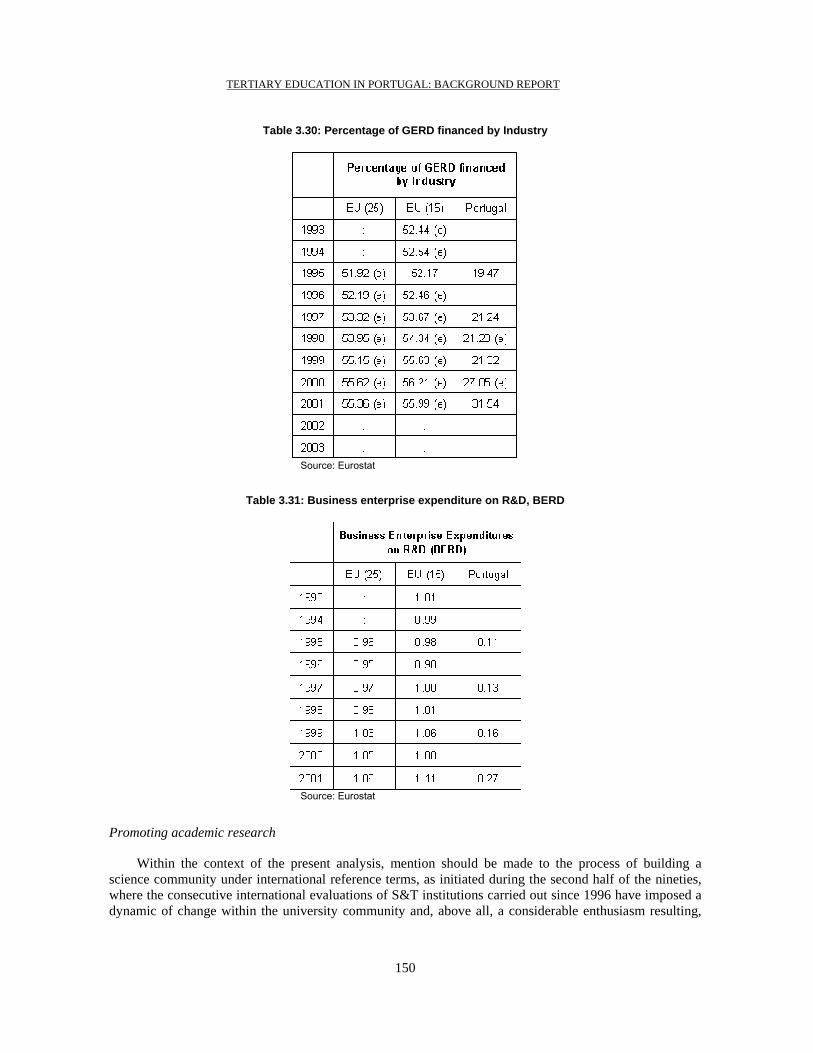
TERTIARY EDUCATION IN PORTUGAL: BACKGROUND REPORT
150
Table 3.30: Percentage of GERD financed by Industry
Source: Eurostat
Table 3.31: Business enterprise expenditure on R&D, BERD
Source: Eurostat
Promoting academic research
Within the context of the present analysis, mention should be made to the process of building a science community under international reference terms, as initiated during the second half of the nineties, where the consecutive international evaluations of S&T institutions carried out since 1996 have imposed a dynamic of change within the university community and, above all, a considerable enthusiasm resulting,

TERTIARY EDUCATION IN PORTUGAL: BACKGROUND REPORT
151
undoubtedly, from the fast increase in the presence of young doctorates and of PhD students, as well as a high expression of international connections.
In fact, the continuous increase in the number of doctorates, especially when considering European and international figures, was systematically referred to by the generality of the evaluation panels as a decisive factor. However, in 2003, the number of researchers in terms of the active population represented still only half of the European average (2.9 and 4.9, respectively for every thousand inhabitants) and analysis led review teams to indicate the need for structural actions, including:
• Reinforce infra-structural aspects, including the support to libraries and the widespread electronic access to documentation centres, and fast and efficient access to the Internet.
• Intensify the technical and administrative support that continued to be below the European average when analysed in terms of the personnel per researcher (respectively, 3.9 and 9.5 for every thousand inhabitants), but also because of its reduced quality in most cases.
• Complement the current lines of public R&D funding with thematic programmes of multi-disciplinary nature, to be naturally associated with national priorities, namely with reference to the large public investments of coming years (e.g., information society, telecommunications, transports, as well as public risks). It is important to note the structuring nature these types of programmes can have, namely to promote the connection of the scientific community to the civil society.
• Facilitate the scientific activity within knowledge integrated communities and networks that stimulate institutional relationships, not only between academic centres, but also between these centres and other actors, namely State Laboratories, secondary schools and companies. The valorisation of those scientific-based networks, in addition to decreasing the effects related with the reduced dimension of the units, should certainly promote the creation and diffusion of new knowledge, motivating the scientific development in a context of continuous change and growing internationalisation of the scientific base.
• Privilege the national and international mobility of researchers, primarily valuing the European area in a context of effective need to promote the internationalisation of the research community.
• Implement coherent protective measures of intellectual property as a way to promote scientific impact, in addition to preserving its institutional integrity, in a context of growing importance of innovation as a critical factor of economic development.
• Develop own competences at the level of technology management, in addition to the reinforcement of strategies that promote links with companies and the release of new technological-based companies.
The evaluation reports produced over the last years are clear when discussing the implementation of measures, such as for promoting the Portuguese scientific and technological development, where their effectiveness was strongly conditioned by structural deficiencies in the organisation and constitution of the majority of the units, particularly in their relationship with universities, including:
• A deficient articulation between education and research, requiring an improved partition of the workloads of teachers and students, considering not only the distribution of the academic schedules, but above all, the valorisation of post-graduate education and of the research activities in the structure and organisation of the universities.

TERTIARY EDUCATION IN PORTUGAL: BACKGROUND REPORT
152
• Relative ageing of research and university personnel, demanding the adoption of rejuvenation policies and the integration of young researchers, in a way that allows the valorisation of their careers, the materialisation of the fair aspirations of promotions of the younger teachers/researchers, the integration of new doctors, and the promotion of a dynamic of international world-wide collaboration with centres of excellence.
• Insufficient support structures, in a way that requires reinforcement, and the adoption of development strategies and flexible approaches for university operation.
As pointed out by the Evaluation Panel in the area of Mathematics in 2000, “it is not the education mission that is being challenged or questioned, but the lack of flexibility in recruitment and in the management of teaching duties of each faculty member”. Generally, many of these comments confirm the observations made in several reports drawn up in the context of the evaluations conducted in 1996, 2000 and 2003. In fact, the need to promote the link between university R&D units and society and with companies in particular has been mentioned. Although these aspects were particularly applicable to the areas of Exact Sciences, Engineering/Technology Sciences, Natural Sciences and Heath Sciences, it has been systematically mentioned the need to promote scientific-based cooperation and national and international mobility, within the European area, as one of the processes to get past difficulties of relationship with the hosting institutions.
It is also imperative to refer that many of the evaluation panels that visited Portugal over the last years concluded that the direct funding by industry, reduced as it was, had not had a significant impact on the quality of the research and has been, almost exclusively, used for short term purposes and at the level of technological development. Actually, the analysis shows that the current situation was primarily due to the absence, in the past, of integrating science and technology policies, and it required making a priority the promotion of collaboration forms between research centres and the entrepreneurial reality.
The recent European report on the “Benchmarking the promotion of RTD culture and Public Understanding of Science” (Miller et al., 2002) acknowledges the leading role of the “Ciencia Viva” programme implemented in Portugal since 1996, but it also recognises the still difficult climate for promoting science culture in Portugal. Although the country is commonly characterised for its low science literacy levels, it is interesting to note the increasing participation trend in science and technology courses, as illustrated in Figure 3.21. This has been called the “Ciência Viva Effect” and reflects the openness of the Portuguese society to measures associated with science culture. In fact, the continued implementation of actions fostering “science for all” is a practice to follow, where the role of the Ministry of Science, Technology and Higher Education appears particularly suitable to facilitate the joint enrolment of researchers and basic and secondary schools in specific projects driving society at large. It is clear that this requires new knowledge about social behaviours, as well as new methodological developments, namely at European wide level, and the work of “Ciência Viva” programme provides important guidelines to help promote a “Portugal of knowledge” in a fast moving environment.

TERTIARY EDUCATION IN PORTUGAL: BACKGROUND REPORT
153
Figure 3.21 – Students enrolled in secondary education (10th to 12th grades) in Portugal for 1996-2004, per type of studies
0
50000
100000
150000
200000
250000
300000
350000
1995
/199
6
1996
/199
7
1997
/199
8
1998
/199
9
1999
/200
0
2000
/200
1
2001
/200
2
2002
/200
3
2003
/200
4
Total TotalTotal Agrup. 1Total Agrup. 2Total Agrup. 3Total Agrup. 4
group 1 Sciences group 2 Arts group 3 Socio-economics group 4 Humanities
Source: Conceição and Heitor (2005); Primary data from DAPP, Min. Education
Figure 3.23 – Percentage of students enrolled in secondary education (10th to 12th grades) in Portugal for 1994-2004, as function of the type of studies
0
0,1
0,2
0,3
0,4
0,5
0,6
1993
/199
4
1994
/199
5
1995
/199
6
1996
/199
7
1997
/199
8
1998
/199
9
1999
/200
0
2000
/200
1
2001
/200
2
2002
/200
3
2003
/200
4
Agrup. 1Agrup. 2Agrup. 3Agrup. 4
Source: Conceição and Heitor (2005); Primary data from DAPP, Min. Education
Note: key as in Figure 3.22
TERTIARY EDUCATION IN PORTUGAL: BACKGROUND REPORT
154
Research financing by the Foundation for Science and Technology
The Fundação para a Ciência e Tecnologia (FCT – Foundation for Science and Technology) is currently dependent on the Ministry of Science, Technology and Higher Education. FCT’s mission is to promote the advancement of scientific and technological knowledge in Portugal, exploiting and fostering opportunities with the potential to meet the highest international standards for the creation of knowledge in different domains. Its task is also to stimulate suitable dissemination and absorption of such knowledge, thereby contributing towards the sustained strengthening of the quality of life and standard of living of the population, seeking to increase their respective endogenous capacities for producing wealth and expanding the country’s cultural potential.
FCT’s mission is mainly carried out through the award of funding, decided upon after considering the merits of the proposals submitted for its approval, which are usually promoted by scientific institutions, research teams or duly qualified citizens. Such a process normally takes the form of public tenders specifically requested for this purpose. Consideration is also given in this area to other forms of support in partnership with both public and private institutions.
FCT’s participation in the funding of the Sistema Científico e Tecnológico (SC&T – Scientific and Technological System) follows the policies established for the sector at both a national and European level.
In order to carry out this mission, FCT enjoys the support of six Scientific Councils, acting in an advisory capacity, each of which is composed of people of recognised merit in their respective scientific area.
In strategic terms, FCT’s mission centres around certain key areas of intervention, established in keeping with five main guidelines:
Promotion of advanced human resources training, through the continued funding of postgraduate awards, mainly for the preparation of doctorates and post-doctoral research; Besides individual awards, FCT also provides scholarships for researchers involved in research projects and working at R&D units; This area of intervention is of crucial importance for the country, since training and advanced qualification are frequently highlighted as one of the main impediments to the implementation of the SCT&I.
Funding of scientific research and technological development projects in all scientific areas, financed by national and Community funds, as well as in strategic areas and in relation to specific themes that are of particular importance for Portuguese society. The assessment of applications consists of a process of ex-ante appreciation by mainly foreign peers. The implementation of projects is also closely monitored with a view to optimising results. In parallel with national programmes and European structural support, FCT is increasingly involved in ensuring the integration of its programmes for the funding of projects within the European space, in keeping with the concept of “open coordination” that is included in the Lisbon Strategy. This integration has been carried out in a gradual and selective manner in the coordination programmes reserved for national funding agencies, implemented both under the scope of the European Union Framework Programme for Research and Technological Development, the ERA-NETs, and under the scope of the European Science Foundation, namely the EUROCORES. Mention should also be made of the funding afforded to the work of teams involved in multilateral cooperation activities, under the scope of international organisations of which Portugal is a member, such as CERN, ESO and ESA.

TERTIARY EDUCATION IN PORTUGAL: BACKGROUND REPORT
155
Support for the development and management of R&D infrastructures through a funding programme based on a model whose criteria depend on the results of external assessment. This will take into account the levels of scientific activity and knowledge transfer. This area of intervention is subject to criteria of economic, social and cultural relevance, favouring the development of a critical mass, the creation of networks, and the internationalisation of research and innovation, particularly when linked to the business world. Associate Laboratory status has been awarded to those R&D infrastructures whose scientific development is considered excellent by international standards, showing a high performance capacity and providing support in the formulation and implementation of public policies. This area of intervention includes the modernisation of the infrastructures of public research institutes.
Promotion of the mobility of researchers involves the publicising of research opportunities in national and foreign organisations through the national mobility portal, Astrolabium. The creation of this portal is included in the implementation in Portugal of the European Commission’s Mobility Strategy, which seeks to give an international dimension to scientific careers and develop the mobility of researchers between the academic world and the business world.
Promotion of scientific communication through the funding of a series of activities aimed at promoting communication between scientists and disseminating the national scientific production: participation at scientific meetings, production of scientific periodical and non-periodical publications and funding of scientific societies. FCT is also associated with different scientific prizes that recognise the value and merit of the work undertaken by researchers and help to make this known to the general public.
In conclusion, FCT sees its strategic responsibility as ensuring the achievement of the great objectives of the national policy for Science and Technology, in keeping with a perspective that includes consolidation, growth, sustainability and the international affirmation of the skills and capacities of the Portuguese scientific and technological community.
The overall financing of the FCT for the period between 1995 and 2005 can be seen in the following Table. Column (1) reports to overall investment payments and column (2) reports to current expenses with the FCT. The total corresponds to the overall financing of FCT.

TERTIARY EDUCATION IN PORTUGAL: BACKGROUND REPORT
156
Table 3.32: Overall Financing of FCT
€
INVESTMENT OPERATION
YEAR PIDDAC (1)
CURRENT EXPENSES (2)
TOTAL (1 + 2 )
1995 62 120 319.62 9 945 097.42 72 065 417.03
1996 73 232 737.27 13 129 619.26 86 362 356.53
1997 79 972 868.62 11 392 438.55 91 365 307.17
1998 113 635 484.72 9 943 538.57 123 579 023.29
1999 114 025 643.33 9 359 015.33 123 384 658.66
2000 137 125 784.20 7 012 338 .66 144 138 122.86
2001 175 270 390.31 7 181 382.13 182 451 772.44
2002 174 265 347.25 5 669 870 .94 179 935 218.19
2003 124 096 254.21 13 461 629.57 137 557 883.78
2004 159 865 692.34 21 762 330.74 181 628 023.08
2005 196 524 326.00 21 891 466.00 218 415 792.00
TOTAL 1 410 134 847.88 130 748 727.16 1 540 883 575.04

TERTIARY EDUCATION IN PORTUGAL: BACKGROUND REPORT
157
Table 3.33 identifies the amount of R&D which is financed by the Foundation for Science and Technology. The first part is presented by Scientific Council and includes the amount attributed through competitive based research projects. There is also the amount attributed to fellowships and advanced training and by last there is the amount attributed to research centres and associate labs.

TERTIARY EDUCATION IN PORTUGAL: BACKGROUND REPORT
158
Table 3.33: Main Programs of FCT Funding for Research and Development (a)
Programs 2000 2001 2002 2003 2004 2005 FCT Funding of Research Projects 9 281 747.22 21 835 801.15 33 005 582.17 25 489 747.50 24 800 935.90 28 709 005.99Biology and Biotechnology 1 641 674.57 4 275 253.98 6 178 161.96 4 068 667.86 4 112 856.06 5 105 876.13Engineering Sciences 2.848.176,04 4 842 592.40 8 532 304.54 7 066 312.88 8 375 084,50 7 338 046.93Health Sciences 539 270.39 3 058 527.81 4 912 131.00 3 759 759.00 3 119 822.35 4 186 622.01Earth and Space Sciences 442 333.99 1 281 872.88 1 594 861.12 1 194 671.00 1 036 037.50 2 216 420.58Marine and Environmental Sciences 1 757 823.64 2 707 016.14 1 866 759.28 1 782 165.45 577 607.19 1 782 114.68Exact Sciences 1 261 260.39 2 853 560.97 4 887 754.27 3 711 779.00 3 917 866.41 3 727 635.89Social Sciences and Humanities 791 208.20 2 816 976.97 5 033 610.00 3 906 392.31 3 661 661.89 4 352 289.77
FCT Funding for Fellowships 47 707 008.00 53 693 889.00 61 507 795.00 68 758 307.00 73 414 101.00 82 809 828.00 Biology and Biotechnology 8 632 314.00 10 449 711.00 12 234 774.00 13 560 398.00 13 227 877.00 14 393 058.00 Engineering Sciences and architecture 7 922 829.00 8 488 558.00 9 909 302.00 11 340 363.00 12 580 150.00 15 834 556.00 Health Sciences 6 497 336.00 7 099 580.00 7 916 796.00 9 048 378.00 10 406 361.00 12 090 354.00 Earth and Space Sciences 887 173.00 1 097 550.00 1 501 049.00 1 644 649.00 1 799 052.00 2 218 097.00 Marine and Environmental Sciences 2 485 928.00 3 356 850.00 4 338 780.00 5 152 067.00 5 845 867.00 6 320 195.00 Exact Sciences 8 765 335.00 9 235 632.00 10 279 513.00 11 663 050.00 12 535 440.00 12 965 833.00 Social Sciences and Humanities 12 516 093.00 13 966 008.00 15 327 581.00 16 349 402.00 17 019 354.00 18 987 735.00 FCT Funding for Research Centres and Associate Labs (b) (b) (b) 17 582 744.60 56 481 164.04 56 074 224.54Biology and Biotechnology (b) (b) (b) 340 248.54 1 273 842.13 1 010 572.98Engineering Sciences and architecture (b) (b) (b) 6 694 599.68 19 807 536.58 19 303 549.74Health Sciences (b) (b) (b) 3 463 566.91 8 941 198.51 10 892 697.49Earth and Space Sciences (b) (b) (b) 422 903.47 1 592 008.44 1 772 237.65Marine and Environmental Sciences (b) (b) (b) 938 780.80 2 785 113.13 3 003 028.74Exact Sciences (b) (b) (b) 2 562 .940.52 11 047 998.15 10 276 150.05Social Sciences and Humanities (b) (b) (b) 3 159 704.68 11 033 467.10 9 815 987.89
(a) The three sub-totals do not accomplish the total funding of FCT, according to table 1. The remaining part includes: Current Expenses (21M€ in 2005, according to table 1), researchers mobility, organisation of international scientific conferences, participation in international projects, international relations, R&D projects with university and companies cooperation, promotion of scientific culture and other programs with less expression in total funding. (b) Not presented here because of different methodology used in the process of gathering data.

TERTIARY EDUCATION IN PORTUGAL: BACKGROUND REPORT
159
Tables 3.34 and 3.35 provide information on the distribution of FCT funding and human resources.
Table 3.34: Distribution of total FCT funding for R&D by field (2003-2005)
2003 2004 2005 Biology and Biotechnology 16% 12% 12% Engineering Sciences 22% 26% 25% Health Sciences 15% 15% 16% Earth and Space Sciences 3% 3% 4% Marine and Environmental Sciences 7% 6% 7% Exact Sciences 16% 18% 16% Social Sciences and Humanities 21% 21% 20% Total 100% 100% 100%
Table 3.35: Human resources registered at Research Centers and Associate Labs per field (status 31/12/2005)
Researchers PhD Head Count % FTE % Biology and Biotechnology 2 739 13% 1 204 8% Engineering Sciences 5 718 27% 2 507 16% Health Sciences 2 549 12% 1 056.75 7% Earth and Space Sciences 665 3% 665 4% Marine and Environmental Sciences 1 368 6% 1 368 9% Exact Sciences 2 622 12% 2 622 17% Social Sciences and Humanities 5 825 27% 5 825 38% Total 21 486 100% 15 247.75 100%

TERTIARY EDUCATION IN PORTUGAL: BACKGROUND REPORT
160
Table 3.36 provides the number of PhDs attributed or recognised by Portuguese universities from 1970 to 2005 by scientific fields. The high growth rates of certain fields such as Biological Sciences, Health Sciences and Computer Sciences are evident. The attraction to science fields contrasts with a general trend throughout most of Europe where young people seem to shy away from science.
The general increase in PhDs can be largely attributed to the fellowship policy practiced by the FCT. The Foundation for Science and Technology attributes fellowships for PhDs in Portugal and abroad. Between 2000 and 2005 the FCT attributed over 12,000 fellowship grants for Masters, PhDs and post-docs.
The current Government Programme has defined as an objective for the legislature to increase the number of new PhDs per year in Portugal and abroad from about 1000 to 1500. This indicates that funding for PhD grants and fellowships will continue to increase.
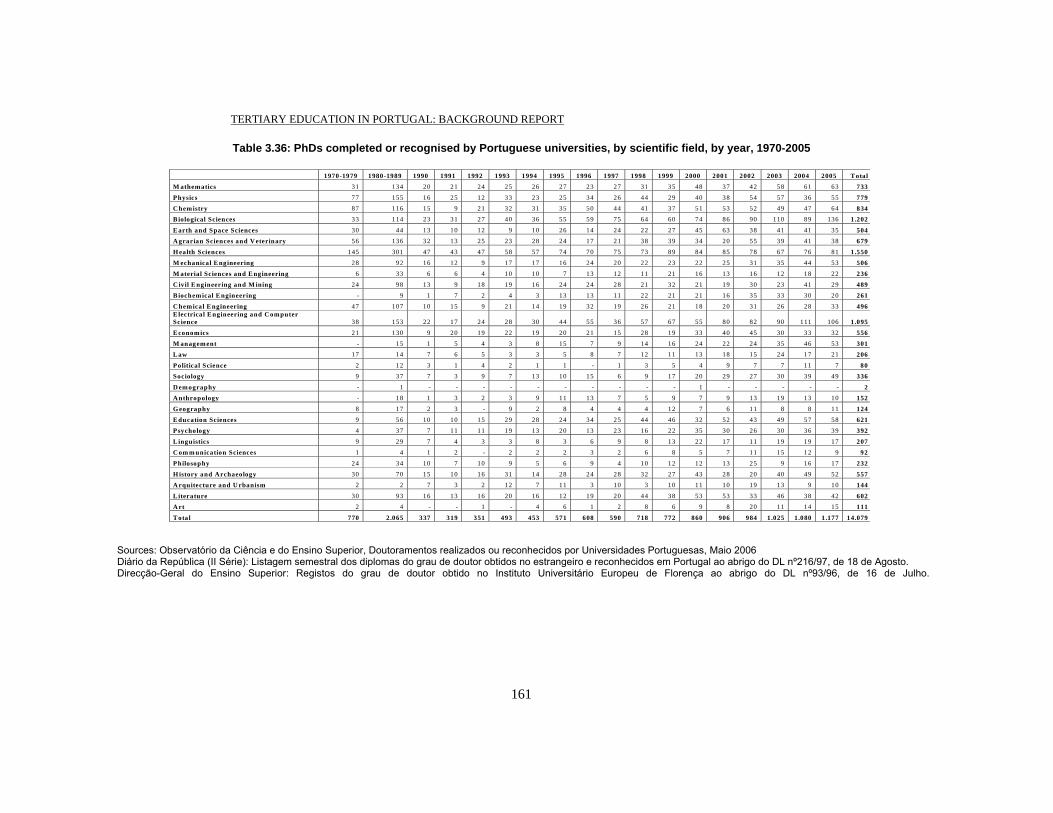
TERTIARY EDUCATION IN PORTUGAL: BACKGROUND REPORT
161
Table 3.36: PhDs completed or recognised by Portuguese universities, by scientific field, by year, 1970-2005
1970-1979 1980-1989 1990 1991 1992 1993 1994 1995 1996 1997 1998 1999 2000 2001 2002 2003 2004 2005 T otal
M athematics 31 134 20 21 24 25 26 27 23 27 31 35 48 37 42 58 61 63 733
Physics 77 155 16 25 12 33 23 25 34 26 44 29 40 38 54 57 36 55 779
C hemistry 87 116 15 9 21 32 31 35 50 44 41 37 51 53 52 49 47 64 834B iological Sciences 33 114 23 31 27 40 36 55 59 75 64 60 74 86 90 110 89 136 1.202
E arth and Space Sciences 30 44 13 10 12 9 10 26 14 24 22 27 45 63 38 41 41 35 504A grarian Sciences and V eterinary 56 136 32 13 25 23 28 24 17 21 38 39 34 20 55 39 41 38 679
H ealth Sciences 145 301 47 43 47 58 57 74 70 75 73 89 84 85 78 67 76 81 1.550
M echanical E ngineering 28 92 16 12 9 17 17 16 24 20 22 23 22 25 31 35 44 53 506
M aterial Sciences and E ngineering 6 33 6 6 4 10 10 7 13 12 11 21 16 13 16 12 18 22 236
C ivil E ngineering and M ining 24 98 13 9 18 19 16 24 24 28 21 32 21 19 30 23 41 29 489
B iochemical E ngineering - 9 1 7 2 4 3 13 13 11 22 21 21 16 35 33 30 20 261
C hemical E ngineering 47 107 10 15 9 21 14 19 32 19 26 21 18 20 31 26 28 33 496E lectrical E ngineering and Computer Science 38 153 22 17 24 28 30 44 55 36 57 67 55 80 82 90 111 106 1.095
E conomics 21 130 9 20 19 22 19 20 21 15 28 19 33 40 45 30 33 32 556
M anagement - 15 1 5 4 3 8 15 7 9 14 16 24 22 24 35 46 53 301
L aw 17 14 7 6 5 3 3 5 8 7 12 11 13 18 15 24 17 21 206
Political Science 2 12 3 1 4 2 1 1 - 1 3 5 4 9 7 7 11 7 80Sociology 9 37 7 3 9 7 13 10 15 6 9 17 20 29 27 30 39 49 336
D emography - 1 - - - - - - - - - - 1 - - - - - 2A nthropology - 18 1 3 2 3 9 11 13 7 5 9 7 9 13 19 13 10 152
G eography 8 17 2 3 - 9 2 8 4 4 4 12 7 6 11 8 8 11 124
E ducation Sciences 9 56 10 10 15 29 28 24 34 25 44 46 32 52 43 49 57 58 621
Psychology 4 37 7 11 11 19 13 20 13 23 16 22 35 30 26 30 36 39 392
L inguistics 9 29 7 4 3 3 8 3 6 9 8 13 22 17 11 19 19 17 207
C om m unication Sciences 1 4 1 2 - 2 2 2 3 2 6 8 5 7 11 15 12 9 92
Philosophy 24 34 10 7 10 9 5 6 9 4 10 12 12 13 25 9 16 17 232
H istory and Archaeology 30 70 15 10 16 31 14 28 24 28 32 27 43 28 20 40 49 52 557
A rquitecture and U rbanism 2 2 7 3 2 12 7 11 3 10 3 10 11 10 19 13 9 10 144
L iterature 30 93 16 13 16 20 16 12 19 20 44 38 53 53 33 46 38 42 602
A rt 2 4 - - 1 - 4 6 1 2 8 6 9 8 20 11 14 15 111
T otal 770 2.065 337 319 351 493 453 571 608 590 718 772 860 906 984 1.025 1.080 1.177 14.079
Sources: Observatório da Ciência e do Ensino Superior, Doutoramentos realizados ou reconhecidos por Universidades Portuguesas, Maio 2006 Diário da República (II Série): Listagem semestral dos diplomas do grau de doutor obtidos no estrangeiro e reconhecidos em Portugal ao abrigo do DL nº216/97, de 18 de Agosto. Direcção-Geral do Ensino Superior: Registos do grau de doutor obtido no Instituto Universitário Europeu de Florença ao abrigo do DL nº93/96, de 16 de Julho.

TERTIARY EDUCATION IN PORTUGAL: BACKGROUND REPORT
162
Capital/Investment funding in higher education institutions
Priority for capital investment in higher education institutions is determined on a case-by-case basis without reference to multi-year planning or priority assessment-based studies. Nevertheless, priority was assigned to capital investment in the health sciences through a multi-year planning for medical schools. For all other fields assessment occurred on a case-by-case basis. The introduction of a competitive process for assessing capital outlay of public funding whereby priorities that would be publicly evaluated and determined on a comparative basis is expected in order to organise and rationalise this process.
The EU Structural Funds for 2007 – 2013 have been approved and can therefore be seen as stable for that period of time. Following the approval of the Structural Funds there is a separate decision for allocation of those funds. Universities spend on current expenses with personnel and with “other” expenses. Within the “other” expenses there are as maintenance and administrative expenses. There are also expenses incurred with infrastructure such as buildings and equipment.
As previously indicated in the Background Report higher education institutions have a net balance of around 15%. The reasons for this have a lot to do with the necessary accounting involved with managing academic years within a fiscal year accounting procedure.
The procedures involved with the Auditors Court are conducted as a required annual exercise for all public bodies, including higher education institutions. The Auditors Court can further conduct audits in particular cases. Capital expenditure always requires previous approval by the Auditors Court.
Universities and other higher education institutions must also submit monthly requests to the Ministry of Finances for the release of funds for their current expenses (such as the salaries of teaching and administrative staff).
Admission to Higher Education
In 1988 the Ministry of Education determined to increase enrolment in higher education. This was a major policy objective. To increase the number of candidates the Ministry decided that entrance examinations for higher education were to be used only for ranking students in the national tender for places in higher education, without minimum marks. This meant that any student completing upper secondary education could enter higher education without any additional barriers provided there were vacant places. This raised some concerns about quality as at the time there were no national examinations at the end of upper secondary education. The exams for Access to Higher Education revealed that in some cases there were large discrepancies between the grades obtained at the examination and the grades given by the schools at the end of secondary education.
Indeed the idea of the entrance examinations was to compensate for the differences in criteria used by the different schools. The decision of the Ministry was to allow students to enter higher education, even with 0 marks in the entrance examinations, provided there were vacant places. This almost doubled the number of candidates seeking admission.
By 1996 the participation rate was over 40% and due to the extremely fast development of the system questions were raised about its quality and the government policy changed from a paradigm of expansion to one of consolidation and quality. Therefore the government decided to reintroduce national exams at the end of upper secondary education. Students can complete their studies provided that a weighted average (30% from national examinations) of the marks of national examinations and school marks is over 9.5 out

TERTIARY EDUCATION IN PORTUGAL: BACKGROUND REPORT
163
of 20. As, in general, school grades are higher than national examination marks, a student can complete upper secondary education with marks below 99.5 in the national examinations.
The grades of these national examinations are also used to rank students applying for a place in higher education. However, the Ministry has progressively enforced the rule that students entering higher education must have grades above 9.5 in those disciplines that are considered fundamental to enter a particular programme. For instance, a student in Electrical Engineering needs to have at least 9.5 in Mathematics and Physics to be allowed to register. From 1996 to 2003 the Ministry put pressure on institutions to raise the entrance standards, but then, in 2003 a new law enforced the use of minimum marks. This measure was introduced by a 2003 decree-law.
At present the concern lies with an installed overcapacity of the system: the number of candidates has been falling and many vacancies are not filled even if students have completed upper secondary education but they cannot register because they do not have minimum marks.
For each of their 1st cycle courses higher education institutions must choose one or two subjects as access examinations (“provas de ingresso”).
They can choose the subjects as one single set or as two or more alternative sets.
Examples: Mathematics (one subject) Mathematics and Physics (two subjects) Mathematics or Physics (one subject to choose between two) Mathematics and Physics or Mathematics and Chemistry (two subjects, to choose between two sets)
The subjects are chosen among a list set by Comissão Nacional de Acesso ao Ensino Superior.
To apply to a 1st cycle course students must pass national examinations on the subjects chosen by the institution with a minimum score fixed by the institution. For some 1st cycle courses students must fill some prerequisites (pré-requisitos), i.e., must satisfy to some special skills (physical or artistic) determined by the institutions. These requirements are for students leaving secondary education.
Adult applicants, (23 years and over) are submitted to (i) a curriculum analysis; (ii) an interview; (iii) a written and or practical examination on subjects defined by each institution.
The main reason for introducing the minimum admission national score was to ensure the quality of the students entering higher education as well as increasing concern with falling standards. As higher education institutions sought to attract students irrespective of their acquired competencies, the Ministry sought to impose more rigour through minimum standards (95 out of 200).

TERTIARY EDUCATION IN PORTUGAL: BACKGROUND REPORT
164
Table 3.37: Duration of Academic Programmes – Before and After Bologna
Before Bologna Degree Duration Obs. Bacharelato 3 years Bachelor's degree
License (FR) Licenciatura 4, 5 years depending on the
subject (v.g. Management, Economics, Literature, Nursery: 4 years; Engineering, Veterinary, 5 years) 6 years for some special cases (v.g Medicine, Dentistry)
Bachelor's degree with Honours Maîtrise (FR)
Mestrado 2 years after licenciatura: usually, course: one year; dissertation: one year
Master's degree
Doutoramento No fixed duration: 3 or 4 years average.
Ph. D.
In polytechnics most courses integrate bacharelato and licenciatura on a two cycle set: 3 years (bacharelato) + 1 to 2 years (licenciatura).
After Bologna Degree Duration Obs. Licenciatura 180 ECTS, 3 years (in
universities and polytechnics) 240 ECTS, 4 years (universities and, in some special cases, in polytechnics)
1st cycle. See articles 8 and 9 of decree-law 74/2006 (annex)
Mestrado 90 to 120 ECTS, 3 to 4 semesters (in special cases 60 ECTS, 2 semesters)
2nd cycle See article 18 of decree-law 74/2006 (annex)
Doutoramento No fixed duration: 3 or 4 years average.
3rd cycle
NOTE: In some special cases 1st and 2nd cycles are integrated in a single course (integrated master). See article 19 of decree-law 74/2006 (annex).

TERTIARY EDUCATION IN PORTUGAL: BACKGROUND REPORT
165
References
AURIL, NUBS (2003) UK University Commercialisation Survey: Financial Year 2002.
Bernardo, C.C. and Nóbrega, J.M. (2005), Evaluation of Research Units 2002-2004, Lisbon, FCT.
Conceição, P. and Heitor, M. (2005), Innovation for All? Learning from the Portuguese path to technical change and the dynamics of innovation. Westport and London: Praeger.
FCT (2002), FCT 1997-2001 – 5 years Report, Portuguese Science and Technology Foundation, Lisbon.
Gago, J. M. (1990), Manifesto para a Ciência em Portugal – ensaio. Viseu: Gradiva
Heitor, M. V. (2000). Evaluation of Research Units, 1999/2000 – Final Report. Lisbon: Observatory for Science and Technology, Portuguese Ministry of Science and Technology.
Heitor, M. V. and Horta, H. (2004). “Engenharia e Conhecimento: Ensino Técnico e Investigação”, in Brito, J. M. B., Heitor, M. V. and Rollo, M. F. (eds.), Engenho e Obra: Uma Abordagem à História da Engenharia em Portugal no Século XX. Lisboa: D. Quixote.
King, D.A., (2004), “The scientific Impact of Nations – What difference countries for their research spending”, Nature, vol. 430, 15 July 2004.
Miller, S., Caro, P., Koulaidis, V., Semir, V., Staveloz, W. and Vargas, R. (2002). Report from the Expert Group Benchmarking the promotion of RTD culture and Public Understanding of Science. Available at http://www.jinnove.com/upload/ documentaire/PP-fe-106.pdf
Teixeira, P., Amaral, A. and Rosa, M.J. (2003), “Mediating the Economic Pulses: The International Connection in Portuguese Higher Education”, Higher Education Quarterly, 57.2, pp. 181-203.
Teixeira, P. and Amaral, A. (2001), “Private Higher Education and Diversity: An exploratory survey”, Higher Education Quarterly, 55.4, pp. 359-395.
UTL (2005), “Knowledge production and diffusion at UTL 1995(96-2002/03).

TERTIARY EDUCATION IN PORTUGAL: BACKGROUND REPORT
166
PART III.3 - A CAPACITY ANALYSIS
The Portuguese higher education system has gone through a process of rapid expansion until 2002. Large investments were made in the qualification and expansion of the number of academic and non-academic staff and in new facilities. In this context, this chapter analyses the capacity installed and its relative adequacy to the labour market and to the present rates of total enrolment.
1. The academic and teaching staff
Table 3.38 quantifies the 2004/05 student/teacher ratios in public universities and polytechnics, which present average values of 14 (as calculated on the basis of FTE teachers). This compares with other European figures, as discussed in Part I of this report, although in Portugal staff qualification levels are lower. However, it should be noted that the overall student/academic staff ratio in terms of head counts is 10.4 for the whole system, with ratios equal to 11.6 for public universities, 10.4 for public polytechnics and 8.8 for the private sector. In any case, the results suggest that attention should be paid to factors that can improve the efficiency of the system, such as the level of qualification of the academic staff, the excessive number of courses and institutions with very low number of students, as well as in some cases an excessive number of weekly direct contact hours.
The situation changes when examining the qualification of the academic staff because the percentage of staff with a PhD is still low by international standards. Table 3.39 shows that the number of the academic staff in public universities with a PhD has been steadily increasing over the last decade, although it still represents only about 55% of the total number of university teachers.
It should be noted that the growth in the number of PhDs was largely based on “in-house” training programmes and, as can be seen in Figure 3.22, to the high inbreeding rate of Assistant Professors at the two largest Portuguese engineering schools, namely at the Instituto Superior Técnico of the Technical University of Lisbon and at the Faculty of Engineering of the University of Porto. Inbreeding does not allow structural changes, nor does it often permit new approaches to scientific research and education problems. It has in fact been internationally recognised (European Commission 1995) as an obstacle to the diffusion of new forms of organisation and knowledge. Although inbreeding is not exclusively a Portuguese problem, Spain also shows a very high inbreeding rate, around 95% (Navarro and Rivero 2001). On the other hand, countries like the United Kingdom have an inbreeding rate of only 17%, as high faculty mobility has been developed throughout decades. Despite these facts, it is worthwhile mentioning that PhD researchers mobility mainly occurs under the scope of R&D units, often at post-doctoral researchers’ level. This fact strengthens the critical role of R&D units because it helps the institutionalisation of mobility in the scientific community. Indeed, it was the growing number of young PhD holders in research units that led the international evaluation panels of R&D units, to consider that there were dynamics of change. Nevertheless, these dynamics had little impact on the university structure.

TERTIARY EDUCATION IN PORTUGAL: BACKGROUND REPORT
167
Table 3.38 – Ratio of students to teaching staff in higher education Portuguese institutions in 2004/05, calculations based on full-time equivalents
Students(total)
Teaching Staff (FTE)
Students per teacher
U.ALGARVE 9 116 619 15 U.AVEIRO 11 702 838 14 U.B.I. 5 273 406 13 U.COIMBRA 19 872 1 317 15 U. EVORA 8 384 573 15 U.LISBOA 20 411 1 517 13 U.MINHO 15 707 1 084 14 U.N.L. 14 840 999 15 U.T.L. 21 802 1 616 13 U.PORTO 26 387 1 841 14 U.T.A.D. 6 603 547 12 I.S.C.T.E. 5 739 373 15 U.AÇORES 3 342 260 13 U.MADEIRA 2 735 185 15 TOTAL UNIVERSITIES 171 913 12 175 14 IP BEJA 3 227 219 15 IP BRAGANÇA 5 348 439 12 IP C.BRANCO 4 652 328 14 IP CAVADO E AVE 1 447 162 9 IP COIMBRA 9 218 555 17 IP GUARDA 3 543 241 15 IP LEIRIA 9 187 506 18 IP LISBOA 13 992 1 030 14 IP PORTALEGRE 3 342 200 17 IP PORTO 15 395 1 030 15 IP SANTAREM 3 842 256 15 IP TOMAR 3 348 240 14 IP SETUBAL 6 029 450 13 IP V.CASTELO 3 352 257 13 IP VISEU 6 266 399 16 ESUP HOT. TUR. ESTORIL 1 063 47 23 ESC. SUP. ENF. NAO INT. 4 490 381 12 TOTAL POLYTECHNICS 97 741 6 740 15 TOTAL 269 654 18 915 14
Note: Universidade Aberta, the Portuguese distance education institution has been excluded from the analysis given its specificity in terms of student - teacher ratio
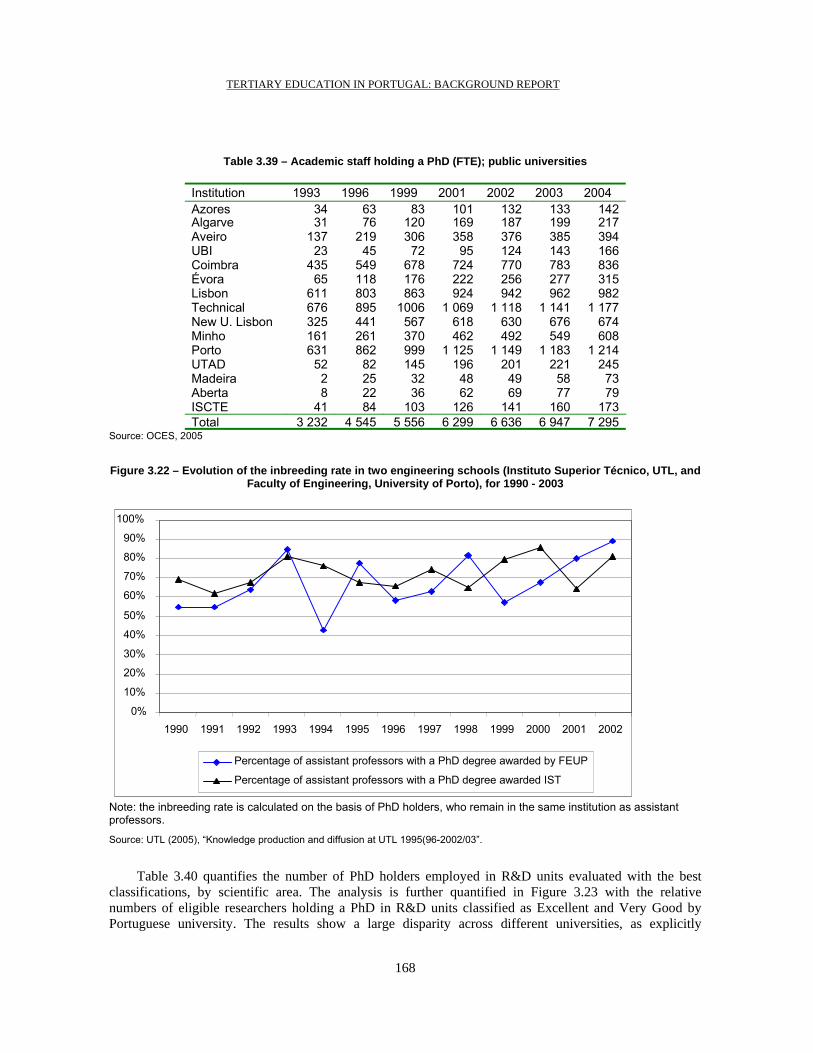
TERTIARY EDUCATION IN PORTUGAL: BACKGROUND REPORT
168
Table 3.39 – Academic staff holding a PhD (FTE); public universities
Institution 1993 1996 1999 2001 2002 2003 2004 Azores 34 63 83 101 132 133 142 Algarve 31 76 120 169 187 199 217 Aveiro 137 219 306 358 376 385 394 UBI 23 45 72 95 124 143 166 Coimbra 435 549 678 724 770 783 836 Évora 65 118 176 222 256 277 315 Lisbon 611 803 863 924 942 962 982 Technical 676 895 1006 1 069 1 118 1 141 1 177 New U. Lisbon 325 441 567 618 630 676 674 Minho 161 261 370 462 492 549 608 Porto 631 862 999 1 125 1 149 1 183 1 214 UTAD 52 82 145 196 201 221 245 Madeira 2 25 32 48 49 58 73 Aberta 8 22 36 62 69 77 79 ISCTE 41 84 103 126 141 160 173 Total 3 232 4 545 5 556 6 299 6 636 6 947 7 295
Source: OCES, 2005
Figure 3.22 – Evolution of the inbreeding rate in two engineering schools (Instituto Superior Técnico, UTL, and Faculty of Engineering, University of Porto), for 1990 - 2003
0% 10% 20% 30% 40% 50% 60% 70% 80% 90%
100%
1990 1991 1992 1993 1994 1995 1996 1997 1998 1999 2000 2001 2002
Percentage of assistant professors with a PhD degree awarded by FEUP Percentage of assistant professors with a PhD degree awarded IST
Note: the inbreeding rate is calculated on the basis of PhD holders, who remain in the same institution as assistant professors.
Source: UTL (2005), “Knowledge production and diffusion at UTL 1995(96-2002/03”.
Table 3.40 quantifies the number of PhD holders employed in R&D units evaluated with the best classifications, by scientific area. The analysis is further quantified in Figure 3.23 with the relative numbers of eligible researchers holding a PhD in R&D units classified as Excellent and Very Good by Portuguese university. The results show a large disparity across different universities, as explicitly

TERTIARY EDUCATION IN PORTUGAL: BACKGROUND REPORT
169
acknowledged by various review committees in the evaluations carried out though FCT. Many evaluation panels (Heitor 2000) that visited academic research centres mentioned the need to promote the mobility of researchers and professors through limitation of inbreeding processes. This requires further reflection on the structure of doctoral and post-graduate programmes in Portugal. Indeed, evaluation committees systematically pointed to the need to expand the recruitment base and to facilitate placements in post-graduate and post-doctoral programmes abroad, and to promote an effective internationalisation of the scientific community.
Table 3.40 – PhDs in R&D units rated Excellent and Very Good, by scientific area in 2000
Global figures for Portugal
Scientific areas Number of PhDs (FTE) in centres rated as “Excellent” and “Very Good”
Percentage of PhDs in centres rated as “Excellent” and “Very Good”
Mathematics 445 77 Physics 304.25 84 Chemistry 216 74 Earth and Space Sciences 128 57
Marine Sciences 209.5 88 Land Sciences 74 17 Health Sciences 600.5 79 Civil Engineering 79 40 Mechanical Engineering 161.75 64
Materials Science & Engineering 185.25 73
Chemical Engineering and Biotechnology 267 78
Electrical & Computer Engineering 432.75 81
Economics and Management 112 44
Sociology, Anthropology, Geography and Demography
134.75 51
History 145.25 53 Source: FCT

TERTIARY EDUCATION IN PORTUGAL: BACKGROUND REPORT
170
Figure 3.23 – Percentage of researchers in research centres that were rated as “Very Good” and “Excellent” in relation to the total of PhDs per university
Note: Only the research centres belonging to the universities that provided the number of eligible PhD holders per centre in 2000 were considered. The evaluation of the centres was updated according to the evaluation process conducted in 2002.
Source: FCT
The available data for polytechnics (Table 3.41) show that there was a modest career progress in public polytechnics. In 2005 there were 860 PhDs, which accounts for 24% of the staff in the academic career. This can be partly explained by the lack of updating of the number of places (“quadro”) for hiring academic staff. Furthermore, contrary to public universities, the personnel hired under special contracts are quite significant, representing over 50% of the total staff. Moreover, the polytechnic academic career differs from the university academic career in structure and in the number of required teaching hours. The structure differs also in that the major requirement for promotion in the polytechnics has been the master degree, while university careers require a PhD.
Analysis also shows that, from 1993 and 2003, the percentage of Coordinators increased from 5.4% to 7.4%, the percentage of aggregates increased from 17.8% to 25.3%, the percentage of assistants decreased from 24.7% to 13.4%, while the percentage of specially hired staff only slightly increased from 52.1% to 54.0%. This means that the intake of younger people (assistants) has slowed down, while a considerable number of staff members completed their masters’ degree being promoted to “aggregates”.
Table 3.42 presents the available data on the academic staff of private universities and the percentage of staff holding a PhD, together with student/staff ratio for undergraduate studies (which varies between 8.4 and 24.4).
Univ Algarve
Univ Minho
Univ LisboaUniv Aveiro
Univ Nova
Univ
Univ OportoUniv Coimbra
Univ Técnica
0
10
20
30
40
50
60
70
80
90
100
0 10 20 30 40 50 60 70 80 90 100
% faculty with PhD degrees comparatively to the total
%of
rese
arch
ers
inR
&D
Cla
ssifi
edas
Ver
yG
ood
and
Exce
llent
per
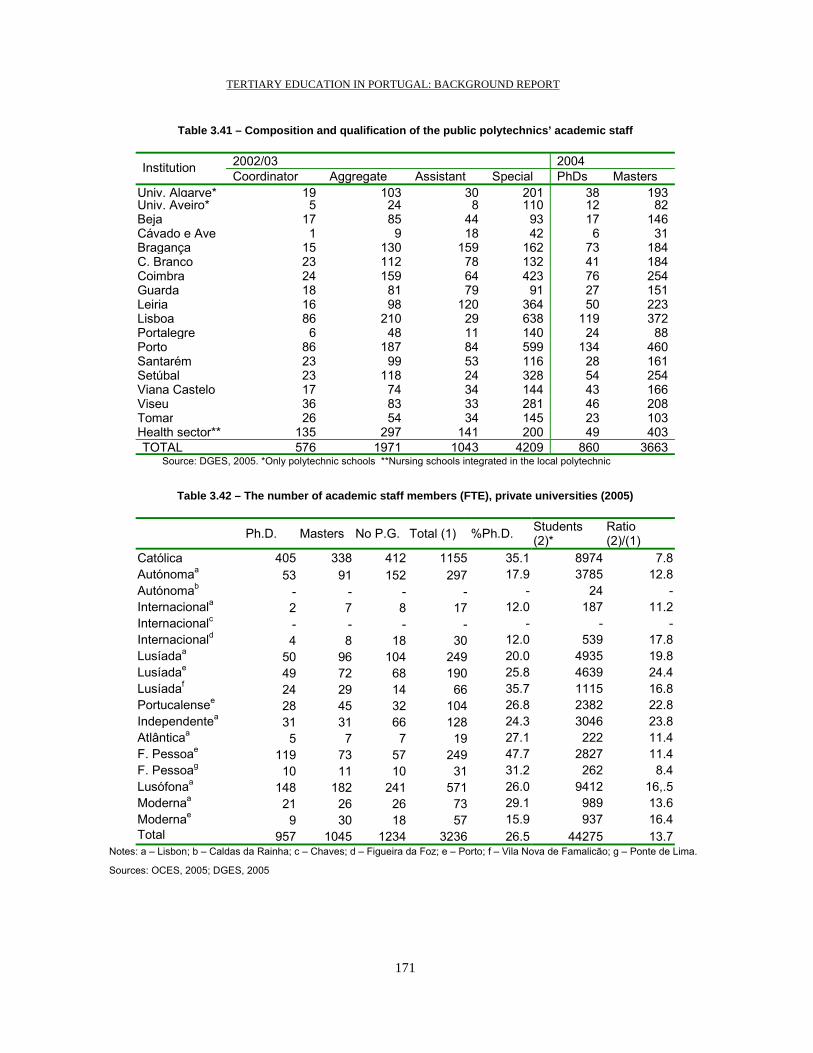
TERTIARY EDUCATION IN PORTUGAL: BACKGROUND REPORT
171
Table 3.41 – Composition and qualification of the public polytechnics’ academic staff
2002/03 2004 Institution Coordinator Aggregate Assistant Special PhDs Masters
Univ. Algarve* 19 103 30 201 38 193Univ. Aveiro* 5 24 8 110 12 82Beja 17 85 44 93 17 146Cávado e Ave 1 9 18 42 6 31Bragança 15 130 159 162 73 184C. Branco 23 112 78 132 41 184Coimbra 24 159 64 423 76 254Guarda 18 81 79 91 27 151Leiria 16 98 120 364 50 223Lisboa 86 210 29 638 119 372Portalegre 6 48 11 140 24 88Porto 86 187 84 599 134 460Santarém 23 99 53 116 28 161Setúbal 23 118 24 328 54 254Viana Castelo 17 74 34 144 43 166Viseu 36 83 33 281 46 208Tomar 26 54 34 145 23 103Health sector** 135 297 141 200 49 403TOTAL 576 1971 1043 4209 860 3663
Source: DGES, 2005. *Only polytechnic schools **Nursing schools integrated in the local polytechnic
Table 3.42 – The number of academic staff members (FTE), private universities (2005)
Ph.D. Masters No P.G. Total (1) %Ph.D. Students (2)*
Ratio (2)/(1)
Católica 405 338 412 1155 35.1 8974 7.8Autónomaa 53 91 152 297 17.9 3785 12.8Autónomab - - - - - 24 -Internacionala 2 7 8 17 12.0 187 11.2Internacionalc - - - - - - -Internacionald 4 8 18 30 12.0 539 17.8Lusíadaa 50 96 104 249 20.0 4935 19.8Lusíadae 49 72 68 190 25.8 4639 24.4Lusíadaf 24 29 14 66 35.7 1115 16.8Portucalensee 28 45 32 104 26.8 2382 22.8Independentea 31 31 66 128 24.3 3046 23.8Atlânticaa 5 7 7 19 27.1 222 11.4F. Pessoae 119 73 57 249 47.7 2827 11.4F. Pessoag 10 11 10 31 31.2 262 8.4Lusófonaa 148 182 241 571 26.0 9412 16,.5Modernaa 21 26 26 73 29.1 989 13.6Modernae 9 30 18 57 15.9 937 16.4Total 957 1045 1234 3236 26.5 44275 13.7
Notes: a – Lisbon; b – Caldas da Rainha; c – Chaves; d – Figueira da Foz; e – Porto; f – Vila Nova de Famalicão; g – Ponte de Lima.
Sources: OCES, 2005; DGES, 2005

TERTIARY EDUCATION IN PORTUGAL: BACKGROUND REPORT
172
2. The installed physical capacity
Tables 3.43 to 3.45 present data collected on all public institutions of higher education in 2006 and suggest that the available capacity is apparently adequate for the existing number of students, at least considering similar quantitative indicators of other EU countries. Even in those cases where the number of users exceeds the total available capacity (e.g. libraries and computer rooms) one has to consider that there may be several daily shifts, allowing for an increased number of users in good conditions.
Table 3.43 – Installed physical capacity of public institutions, total spaces (education and social support)
Number of spaces
Total Area (m2)
Estimated Capacity (users)
Number of typical users
Administrative areas 7 587 243 899 34 906 33 854Pedagogic areas 8 817 644 255 78 915 78 417Pedagogic/scientific support areas 15 870 433 004 56 034 91 852Social support infrastructures 3 258 508 331 69 221 79 704Other Infrastructures 2 353 135 971 12 227 53 311
TOTAL 37 885 1 965 460 251 303 337 138 Source: DGES, 2006
Table 3.44 – Installed physical capacity of public institutions, student support systems
Central administration Number of spaces
Total Area (m2)
Estimated Capacity (users)
Number of typical users
Administration 50 2 151 135 126Offices 1 15 Public attendance (a) 81 1 714 3 268 972 Technical personnel (b) 190 4 249 276 285Others 86 2 045 292 398Subtotal 408 10 174 3 972 1 782
Social support infrastructures
Canteens 152 87 053 32 592 38 387Bars/Restaurants 190 20 520 13 372 30 308Halls of residence 2 686 223 475 14 282 ndSports (Including university stadiums) 149 171 426 7 467 9 140Socio-cultural services 14 2 653 647 1 175Health services 43 1 949 494 453Others 24 1 254 367 107Subtotal 3 258 508 331 69 221 79 704Total SAS 3 666 518 505 73 193 81 486
Source: DGES, 2006

TERTIARY EDUCATION IN PORTUGAL: BACKGROUND REPORT
173
Table 3.45 – Installed physical capacity of public institutions, education and research
Central administration Number of spaces
Total Area (m2)
Estimated Capacity (users)
Number of typical users
Administration (Rector/President/Boards) 175 4 180 172 163 Meeting rooms 83 3 511 1 383 673 Secretariat 88 2 106 182 161 Accounts 83 2 226 210 213 Offices 464 7 763 772 690 Computer rooms 102 2 863 159 159 Personnel management 55 1 676 159 130 Acquisitions 37 1 036 46 46 Others 719 35 870 8 844 9 820 Subtotal 1 806 61 231 11 927 12 055
Schools – Administration Number of spaces
Total Area (m2)
Estimated Capacity (users)
Number of typical users
Administration (Boards) 705 15 527 1 004 925 Meeting rooms 311 12 397 5 051 4 390 Secretariat 554 20 001 1 511 2 348 Accounts 262 8 085 706 646 Officies 1 542 26 915 2 129 2 300 Computer rooms 339 10 161 829 855 Others 1 660 79 409 7 777 8 553 Subtotal 5 373 172 494 19 007 20 017
Schools – Pedagogical spaces Number of spaces
Total Area (m2)
Estimated Capacity (users)
Number of typical users
Classrooms 3 755 216 372 11 792 9 088 Conference rooms 659 86 035 20 465 18 883 Laboratories 2 802 179 724 35 572 37 088 Laboratory annexes and Workshops 976 29 487 2 230 5 829 Others 625 132 637 8 856 7 528 Subtotal 8 817 644 255 78 915 78 417
Schools – Support spaces Number of spaces
Total Area (m2)
Estimated Capacity (users)
Number of typical users
Academic staff – Offices 10 022 162 782 15 465 15 425 Academic staff – Meeting rooms 421 14 614 4 959 4 383 Research laboratories 2 061 95 618 3 171 2 311 Libraries 2 014 96 449 15 161 30 479 Photocopies 214 7 040 742 4 593 Computer rooms 645 35 473 10 230 21 857 Study rooms 493 21 029 6 306 12 805 Subtotal 15 870 433 004 56 034 91 852
Schools – Other spaces Number of spaces
Total Area (m2)
Estimated Capacity (users)
Number of typical users
Students Unions 434 25 340 1 891 14 646 Employment support centres 41 851 38 10 230 Others 1 878 109 780 10 298 28 435 Subtotal 2 353 135 971 12 227 53 311
TOTAL 34 219 1 446 955 178 110 255 652Source: DGES, 2006

TERTIARY EDUCATION IN PORTUGAL: BACKGROUND REPORT
174
Table 3.45 provides a global quantitative picture, but does not convey any information about the quality or adequacy of the facilities. It should be noted that various international review committees that have evaluated R&D units since 1996 identified a wide variety of situations concerning the availability and general quality of spaces to the practice of R&D activities. Main issues raised were about the morphology of the built environment, namely the implementation of dual-purpose spaces integrating teaching and research, in a way to foster the continuous interaction through proximity (and eventual share) of teaching (i.e.: study rooms) and research (i.e. laboratories and researchers offices) areas. This type of spatial organisation fosters a constant interaction between professors, researchers and students, allowing students to gain from R&D activities carried out in higher education institutions, as demonstrated through many international practices (University of Melbourne 2002), as well as systematically referred by specialised associations (Project Kaleidoscope 2004, SCUP 2005) and in the literature (O’Hare 1998). All of these practices are based on the creation of conditions able to promote students’ learning experiences through the nurturing of synergies between research and teaching.
3. New publics and the adequacy to the labour market
Table 3.46 presents data on new entrants into the labour market over the period from 1992 to 2002. Despite a consistent increase of the percentage of new employees with a higher education degree (from 2.1% in 1992, to 10.7% in 2002) the data shows that over that period only 5.7% of the almost 2 million new employees had a higher education degree.
Table 3.46 – Qualifications of the new entrants into the labour market
HE graduates Non HE graduates/unknown Total Year Number % Number % Number
1992 6 117 2.1 291 865 97.9 297 982 1993 5 292 2.5 202 661 95.5 207 953 1994 6 708 3.3 198 755 96.7 205 463 1995 6 470 4.2 148 384 95.8 154 854 1996 7 070 4.8 140 772 95.2 147 842 1997 9 048 5.8 146 903 94.2 155 951 1998 11 004 7.0 146 919 93.0 157 923 1999 12 583 7.8 148 592 92.2 161 175 2000 14 614 9.4 141 546 90.6 156 160 2002 29 931 10.7 249 045 89.3 278 976 Total 108 837 5.7 1 815 442 94.3 1 924 279
Note: Year 2002 accumulates data from 2001.
Source: SILATEE (2002) as cited in CIRIUS final report, (Escária 2004).
Table 3.47 presents sample data about the areas of graduation of the new entrants to the labour market for the period 1994-97 and shows a decline in the percentage of graduates in economics and management and an increase in graduates from social sciences, while the percentage of engineering graduates remained almost stable. It should be noted that a recent report (Alves, 2005) on the employment of the graduates from the University of Lisbon (1999-2003) shows some additional interesting conclusions. Graduates in Medicine, Physics, Computer Sciences and Pharmacy (representing 45.7% of all the University’s graduates) have become, in general, employed once they obtained their degrees; graduates in Geography, Mathematics, Fine Arts, Design, Education, Psychology and Dental Medicine (30% of all graduates) were generally employed shortly after completing their degrees, while graduates in Philosophy, Geology,

TERTIARY EDUCATION IN PORTUGAL: BACKGROUND REPORT
175
History and some graduates in Psychology (13.9% of all graduates) waited at least 12 months before finding employment.
Table 3.47 – Graduation areas of the new entrants into the labour market
1994 1995 1996 1997 Area n % n % n % n %
Economics/management 1 632 22.2 2 000 28.5 1 984 25.5 2 527 25.7Engineering 1 370 18.7 1 225 17.4 1 457 18.7 1 687 17.1Arts 253 3.4 222 3.2 261 3.4 357 3.6Sciences 469 6.4 393 5.6 509 6.5 583 5.9Education 560 7.6 546 7.8 489 6.3 551 5.6Health Sciences 345 4.7 299 4.3 289 3.7 342 3.5Social sciences 581 7.9 485 6.9 546 7.0 605 6.1Int. relations/communication 229 3.1 290 4.1 351 4.5 606 6.2Agriculture, Agro Industries 275 3.7 208 3.0 213 2.7 227 2.3Others 1 628 22.2 1 360 19.4 1 685 21.6 2 362 24.0Total 7 342 100.0 7 028 100.0 7 784 100.0 9 847 100.0
1998 1999 2000 2002 Area n % n % n % n %
Economics/management 3 161 26.8 2 997 22.6 3 006 21.4 5 610 19.8Engineering 1 822 15.5 1 609 12.1 2 571 18.3 4 877 17.2Arts 384 3.3 344 2.6 754 5.4 1 772 6.2Sciences 574 4.9 525 4.0 501 3.6 1 506 5.3Education 584 5.0 459 3.5 531 3.8 1 298 4.6Health Sciences 398 3.4 327 2.5 504 3.6 1 189 4.2Social sciences 795 6.7 756 5.7 2 157 15.3 4 536 16.0Int. relations/communication 728 6.2 675 5.1 317 2.3 663 2.3Agriculture, Agro Industries 265 2.2 192 1.4 173 1.2 294 1.0Others 3 072 26.1 5 381 40.6 3 565 25.3 6 627 23.4Total 11 783 100.0 13 265 100.0 14 079 100.0 28 372 100.0
Source: SILATEE (2002) as cited in CIRIUS final report (Escária 2004)
Despite the relative massification of higher education in recent decades, the rates of return of higher education degrees in Portugal have been persistently high, at the highest level for the 15 EU countries (Pereira and Martins, 2000). For example, Table 3.48 shows that 81.2% of the relative earnings of new employees with a higher education degree lie in the highest quintile, which compares against only 16.1% for non-graduates.

TERTIARY EDUCATION IN PORTUGAL: BACKGROUND REPORT
176
Table 3.48 – Relative earnings to the new entrants’ average earnings
HE graduates Non graduates/unknown Total Number % Number % Number % Quintile 1 1 120 1.3 265 959 18.9 267 079 17.9 Quintile 2 1 513 1.7 331 972 23.6 333 485 22.3 Quintile 3 3 105 3.5 295 960 21.1 299 065 20.0 Quintile 4 10 947 12.3 284 440 20.3 295 387 19.8 Quintile 5 72 190 81.2 225 456 16.1 297 646 19.9 Total 88 875 100.0 1 403 787 100.0 1 492 662 100.0
Source: SILATEE (2002) as cited in CIRIUS final report, 2004
However, Table 3.49 shows that until 2000 there has been an apparent convergence of the relative earnings of graduates and non-graduates, a trend that seems to have been reversed in 2001/02.
Table 3.49 – Evolution of the relative earnings to the new entrants’ average earnings
HE graduates Non graduates/unknown Total
Average Average Average 1992 2.74 0.96 1.00 1993 2.62 0.96 1.00 1994 2.47 0.95 1.00 1995 2.15 0.94 1.00 1996 2.04 0.94 1.00 1997 1.93 0.93 1.00 1998 1.93 0.86 0.94 1999 1.89 0.91 1.00 2000 1.77 0.90 1.00 2002 2.03 0.89 1.00 TOTAL 2.03 0.93 1.00
Source: SILATEE (2002) as cited in CIRIUS final report, 2004
Table 3.50 presents the evolution of the relative earnings of new labour market entrants with a higher education degree, by area of graduation and shows that engineering graduates have the highest earnings followed by the health professions. However, in the latter case it is necessary to take into account that most graduates have degrees in nursing and health technologies, not in medicine. It is also interesting to notice the decreasing trend in the earnings of graduates in economics/management.

TERTIARY EDUCATION IN PORTUGAL: BACKGROUND REPORT
177
Table 3.50 – Evolution of the relative earnings to the new entrants’ average earnings,
by area of graduation
1994 1995 1996 1997 1998 1999 2000 2002 Total Economics/management 2.56 2.31 2.20 2.05 1.92 2.00 1.83 1.75 1.99 Engineering 2.71 2.44 2.31 2.30 2.20 2.34 2.27 2.07 2.27 Arts 1.83 1.77 1.81 1.87 1.57 1.72 1.85 1.80 1.78 Sciences 2.13 1.93 1.81 1.75 1.81 1.78 1.96 1.96 1.90 Education 2.23 2.09 1.94 1.90 1.87 1.85 1.66 1.57 1.84 Health Sciences 2.28 2.35 2.40 2.32 2.17 2.17 2.10 1.93 2.13 Social sciences 2.13 2.04 1.89 1.88 1.85 1.74 1.83 1.72 1.81 Int. relations/communication 2.07 1.98 1.77 1.78 2.04 1.68 1.85 1.51 1.80 Agriculture, Agro Industries 1.97 1.91 1.80 1.81 1.77 1.76 1.65 1.61 1.78 Others 2.37 2.25 2.07 1.92 1.69 1.81 1.73 1.64 1.83 Total 2.40 2.23 2.10 2.01 1.90 1.92 1.90 1.78 1.95
Source: SILATEE (2002) as cited in CIRIUS final report, 2004
Beyond the aspects raised in terms of overall employment, it should be noted that brain drain has not been considered a problem for Portugal so far, but current international trends on competition for skilled people are representing new challenges for Portuguese policies. Portuguese universities increased the offer of PhD programmes, which in turn created new challenges for the mechanisms that guarantee their quality, and the need to strengthen their internationalisation and to establish international scientific research networks. Employing Portuguese PhD holders raised a series of new issues associated to emerging challenges and opportunities in terms of scientific employment, which can be analysed on the basis of three surveys carried out between 1999 and 2001 among former FCT scholarship holders since 1990. They clearly show that most of these former scholarship holders carry out their professional activity in Portugal, mainly in higher education institutions (Figure 3.24). It is, in fact, the capability to train and attract new PhD holders, fostering scientific employment that determines the full maturity of a scientific system, and it is also decisive to improve the scientific activity in networks to promote institutional relationships, either between university units, or between these units, State Laboratories and companies. The enhancement of these scientific-based networks, in addition to softening the effects related to the small size of research units, shall certainly encourage knowledge creation and diffusion, and scientific development in a context of constant change and growing scientific based internationalisation.

TERTIARY EDUCATION IN PORTUGAL: BACKGROUND REPORT
178
Figure 3.24 – Results of the surveys made to former FCT´s scholarship holders that develop their professional activity in Portugal or abroad
87% 83% 81%
13% 17% 19%
0%10%20%30%40%50%60%70%80%90%
100%
1990 until Oct1998
Nov 1998 untilDez 1999
Jan 2000 untilDez 2000
AbroadNacional
Source: FCT 1997-2001 – 5 years Report, Portuguese Science and Technology Foundation; Primary data from OCES, Survey on the professional situation of former PhD scholarship holders.
It should be noted that the improvement of the S&T system over the last few years has been associated with a critical challenge related to the need to restructure the university faculty career system. This includes devising forms of merit recognition devoted to young researchers, regardless of the existence of vacancies in the university faculty staff exclusively derived from the number of enrolled students. Indeed, the progressive saturation of these vacancies, at least in older universities, has stalled the attractiveness of scientific careers, which requires the change of university recruiting systems to schemes such as those in force in more developed S&T systems.
It is also worthwhile mentioning that, since 1998, there has been a visible absorption of PhD holders by the private higher education and by the polytechnic higher education systems. This fact corresponds to a new situation that Portugal is facing (FCT 2002), which needs to be duly analysed and dealt with, in particular by revising the faculty career statute in polytechnic institutes. These aspects obviously need a more detailed discussion about the institutional context in force, in particular the University Faculty Career (ECDU).
The information on the employability of Portuguese PhD holders since 1998 shows the importance new areas or fields of employment besides higher education sector have appeared. There has simultaneously been a slight growth in the number of former scholarship holders working abroad, namely in universities or in research centres. Thus, it should be clear that the national and international mobility of new PhD holders, mainly within the European area and in a context of effective need to promote the internationalisation of research units, is particularly pertinent in the current development stage of the national S&T system. However, it should also be clear that the different surveys reflect a possible brain drain trend in Portugal, with the increasing permanence of Portuguese scientists abroad, unless measures for the promotion of scientific employment are taken without much delay.
4. Internationalisation as an opportunity for increasing enrolments
The rationale for the internationalisation is based on the perception that “it is not possible to vindicate the quality of the education system isolated from the international, and in particular the European, context”. For Portugal, this is further rooted in the cultural rationale of language and in the co-operation

TERTIARY EDUCATION IN PORTUGAL: BACKGROUND REPORT
179
with Portuguese Speaking Countries. This has contributed to the relative internationalisation of the Portuguese higher education in countries where Portuguese is the official language (Angola, Mozambique, Cabo Verde, Guiné Bissau, S. Tomé e Príncipe – the African Countries with Portuguese as Official Language, PALOPs – East Timor and Brazil. In particular, there are special regimes for access to higher education for students from the ex-colonies, both in public and private higher education institutions (universities and polytechnics).
There are also foreign students enrolled as normal students within Portuguese higher education institutions and Figure 3.25 presents the number of these students by Continent of origin. Half of the students come from Africa (PALOPs). Among the European students the main percentage was from Luxembourg. More recently this scenario has changed, and citizens from Switzerland, France, Belgium and United Kingdom became the main European students in Portuguese higher education (OECD 2005).
Figure 3.25 – Foreign students enrolled in Portuguese institutions as regular students
0
2000
4000
6000
8000
10000
12000
2001/02 2002/03 2003/04 2004/05
Continent
Africa North America Central and South America Asia Europe Others Sources: OCES, 2005

TERTIARY EDUCATION IN PORTUGAL: BACKGROUND REPORT
180
References
Alves, N. (coord.) (2005), Trajectórias Académicas e de Inserção Profissional dos Licenciados. 1999-2003, Lisboa, Reitoria da Universidade de Lisboa.
Escária, V. (coord.) (2004), Relatório Final do Estudo Percursos de Inserção dos Diplomados no Ensino Superior, Lisboa, CIRIUS.
European Commission, (1995) White Paper on Education and Learning – Towards the Learning Society (COM(95)590).
FCT (2002), FCT 1997-2001 – 5 years Report, Portuguese Science and Technology Foundation, Lisbon.
Heitor, M. V. (2000), Evaluation of Research Units, 1999/2000 – Final Report. Lisbon: Observatory for Science and Technology, Portuguese Ministry of Science and Technology
Navarro, A. and Rivero, A., (2001), “High rate of Inbreeding in Spanish Universities”, Nature 14 1.
O’Hare, M., (1998), “Classroom design for discussion-based teaching”, Journal of Policy Analysis and Management, 17.4, pp. 706-720.
Pereira, P.T. and Martins, P.S., (2000), Does Education Reduce Wage Inequality? Quantile Evidence from Fifteen Countries. IZA Discussion Papers No. 120, Bonn.
Project Kaleidoscope (PKAL), 2004, in Volume IV: What works, what matters, what lasts http://www.pkal.org/template2.cfm?c_id=1048
SCUP (2005), SCUP Campus Facilities Inventory (CFI),
http://www.scup.org/knowledge/cfi/SCUP-2005-CFI-summary.pdf
UTL (2005), “Knowledge production and diffusion at UTL 1995(96-2002/03”, Lisbon.
University of Melbourne Teaching Spaces Management Plan 2003-2007:
http://www.ists.unimelb.edu.au/tic/tsmp.htm

TERTIARY EDUCATION IN PORTUGAL: BACKGROUND REPORT
181
PART IV - MAIN ISSUES AND CHALLENGES
The analysis presented in this report presents indicators that disclose the dual characteristics of Portuguese society and its commitment to the knowledge economy, given the impressive growth over the last decades. Indeed, the current emerging discussion on the role of higher education for a knowledge-based society should be understood in the context of the social and economic change in Portugal within the European Union, especially in terms of the need to evolve to a knowledge-driven economy.
It is important to note that the current policy challenges correspond to a period of relative stagnation in the growth of higher education students, after a period of more than 30 years of consecutive growth. Over the last decades Portugal was able to increase its higher education system at a growth rate that has no parallel in other European countries. Today the gross participation rate (18-22 years) is over 50% and the number of students increased almost 800% relative to the 1974 student population. Research activities also increased substantially over the last decade: the number of PhDs in Portuguese Research Units increased over 130% from 1996 to 2003, the yearly number of new PhDs increased more than three-fold from 1990 to 2004, while the yearly number of Portuguese scientific publications increased fourfold between 1991 and 2001.
This process is associated with the development of a complex network of institutions, integrating 14 public universities and one university institute and 15 public polytechnics, together with a network of about 117 private institutions. These include the Catholic University with campi in several towns, 14 universities, 3 polytechnics, other 27 diverse institutions teaching university level programmes, and around 70 other institutions teaching polytechnic programmes. In this context, a number of challenges and issues need to be addressed, including:
• How to improve the regulatory framework and to adequate the supply of tertiary education to the labour market, fostering quality with the necessary specialisation? How far does the country require strengthening lifelong learning, vocational training, and certification of formal or informal training, as well as more flexible study schemes?
• Which level of public funding is appropriate to guarantee the adequate growth of the knowledge base? What are the implications for the organisation of the supply of higher education and, in particular, for post-graduation education?
• Which governance system and level of autonomy for higher education institutions?
• How to enlarge the number of students, decrease dropout and retention rates and help qualifying the Portuguese population? Which student social support and loan systems?
• Which strategies to promote access for new publics, including students who have left the education system before enrolling in higher education, including those from working class and lower class backgrounds?

TERTIARY EDUCATION IN PORTUGAL: BACKGROUND REPORT
182
• How to promote the internationalisation of higher education and research units? Reflecting upon a possible brain drain trend in Portugal, which career prospects should be offered for research and academic staffs?
Clear policy options are essential for guaranteeing the qualification of the Portuguese people in the European space, implementing the Bologna process and reinforcing the system of higher education, promoting the quality of the system and extending access to new publics. Contrary to what is sometimes affirmed, Portugal does not have too many graduates, but actually has too few. Holding a qualification from higher education is a social resource that is critical for future learning, life plans and employability. Making higher education training more socially and culturally relevant and improving its quality will simultaneously attract more people to attend courses and assure better conditions for their successful completion.
In fact, Portugal is one of the European countries with the lowest number of graduates and increasing the academic and professional qualifications of the Portuguese society continues to be an essential factor for its economic, social and technological modernisation.
But the analysis of higher education should be framed conceptually within a systemic view of the role of science and technology, in which the main issue relate to knowledge sharing and diffusion. Therefore, the analysis should focus on the understanding of a complex national context, considering the following factors:
• People: it refers to the country’s human capital, in particular, to the levels of formal education held by its workforce. The country is still characterised by a workforce with rather low educational and training levels, contrasting with a younger population with qualification levels similar to other OECD countries. This fact has resulted in new challenges for the workforce qualification development, and for the attraction of new talents to S&T in order to foster scientific employment and to expand national and international knowledge networks.
• Knowledge: it is linked to the creation of new knowledge in Portugal, because the country has serious deficits in R&D scale and intensity in comparison with the other OECD countries.
• Ideas: in particular, knowledge diffusion and innovation capacity, to which the relationship of firms with academic research brings about new challenges and also an increasing accountability of its activities.
Moreover, other aspects should be noteworthy within a conceptual framework, such as:
• Infrastructures: consists on the necessary conditions for the development of tertiary education, namely for the functioning of scientific institutions and their relationship with higher education, society, and firms in particular.
• Institutions: consists on the sufficient conditions for a knowledge driven society, including the necessary reinforcement of the scientific institutions, as well as the legal framework under which higher education develops.
• Incentives: consists on the necessary conditions for a higher education system, especially in terms of public and private efforts that are vital to develop new and disseminate existing knowledge. In this context, market conditions, competitive structures and naturally public policies are considered, especially associated with higher education funding and evaluation.

TERTIARY EDUCATION IN PORTUGAL: BACKGROUND REPORT
183
Knowledge-based economies and their performance in competitive knowledge environments depends basically on the quality of human resources (namely, their specialisation, competences, educational level, and learning capacity) and on the activities and incentives, which are oriented towards knowledge creation and diffusion, an area where Portugal shows a clear deficit.
Several studies over the last decades have shown that the complexity of the innovation process favours societies organised around a demanding culture with evaluation routines and open to criticism. This requires structures that are prearranged formally and institutionally (i.e., schools, firms, universities, laboratories, governmental and non-governmental organisations, namely for the promotion of scientific culture). For that reason, it is vital for States to make the autonomy of universities and scientific institutions feasible, and to enable a sustainable development of science, possible regardless of external alterations. This is a major objective of the current government programme, and it represents a major challenge for the institutions themselves, as well as for the governance of the higher education system.
In order to allow scientific organisations and higher education institutions to develop and promote themselves autonomously, the diversification of funding sources should be facilitated and the governance of the system renewed. The institutions themselves must defend their own budgets, namely in face of independent peers. It is obvious that this process involves institutional reform, deriving from the higher education institutions’ need to evolve towards responsibility and accountability to society.
Within the higher education system, the strengthening of science and technology institutions necessarily involves the sustainability of incentive programmes and the continuous implementation of independent scientific evaluation models, which have been put in practice and disseminated in the most industrialised OECD countries. Portuguese institutions have experienced these processes in a systematic way only since 1996, and such practices should be continued and fully appropriated in Portugal.
In this context, Table 4.1 presents the main Governmental goals, as expressed through the revised country strategy to achieve the Lisbon Goals, as well as the Government’s Technological Plan. The main objective for higher education during the present legislature is to contribute towards overcoming the country's scientific and technological backwardness and to fulfil the urgent need to guarantee that new generations are qualified for the requirements of the European space, guaranteeing the full integration and qualification of national institutions of tertiary education in Europe.
The international qualification of the Portuguese tertiary education is essential for the development of the country and the employability of its graduates. This challenge involves assuring the transition from an education system based on the transmission of knowledge to a system based on competence building. This is a central and critical issue all over Europe, and particularly in Portugal, where there are high dropout and failure rates and the conservative influence of rhetorical and passive methods of teaching.
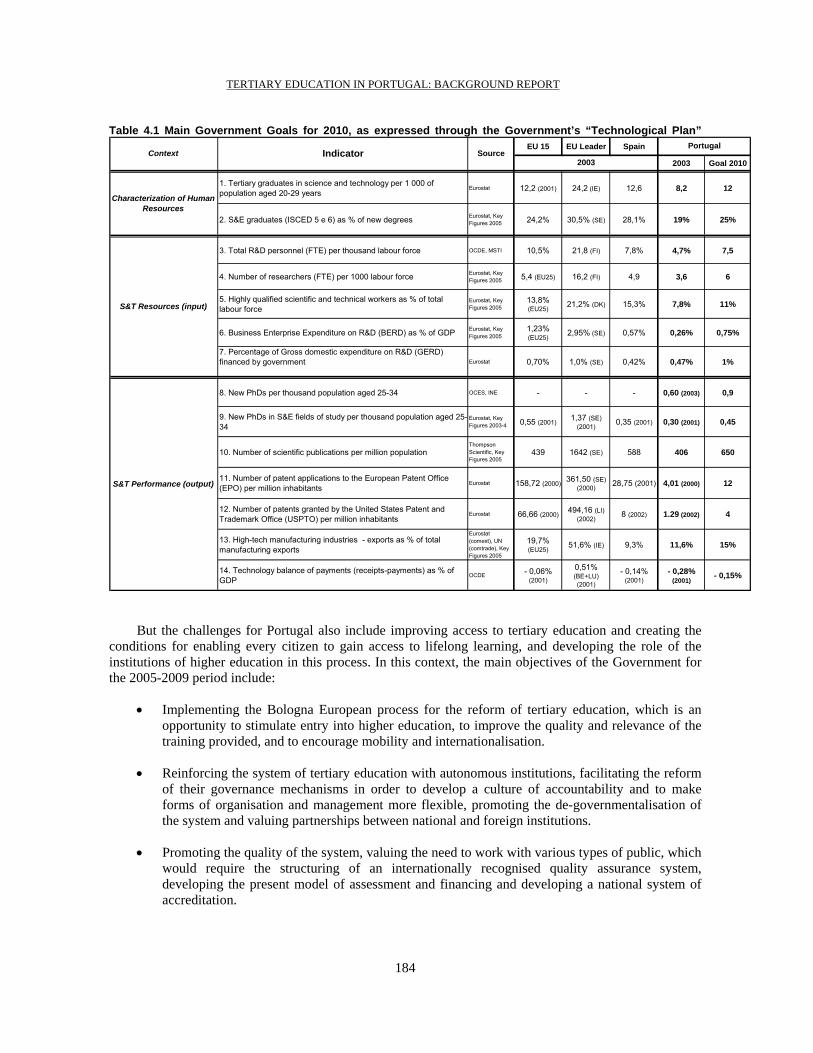
TERTIARY EDUCATION IN PORTUGAL: BACKGROUND REPORT
184
Table 4.1 Main Government Goals for 2010, as expressed through the Government’s “Technological Plan” EU 15 EU Leader Spain
2003 Goal 2010
1. Tertiary graduates in science and technology per 1 000 of population aged 20-29 years
Eurostat 12,2 (2001) 24,2 (IE) 12,6 8,2 12
2. S&E graduates (ISCED 5 e 6) as % of new degrees Eurostat, Key Figures 2005 24,2% 30,5% (SE) 28,1% 19% 25%
3. Total R&D personnel (FTE) per thousand labour force OCDE, MSTI 10,5% 21,8 (FI) 7,8% 4,7% 7,5
4. Number of researchers (FTE) per 1000 labour force Eurostat, Key Figures 2005 5,4 (EU25) 16,2 (FI) 4,9 3,6 6
5. Highly qualified scientific and technical workers as % of total labour force
Eurostat, Key Figures 2005
13,8% (EU25) 21,2% (DK) 15,3% 7,8% 11%
6. Business Enterprise Expenditure on R&D (BERD) as % of GDP Eurostat, Key Figures 2005
1,23% (EU25)
2,95% (SE) 0,57% 0,26% 0,75%
7. Percentage of Gross domestic expenditure on R&D (GERD) financed by government Eurostat 0,70% 1,0% (SE) 0,42% 0,47% 1%
8. New PhDs per thousand population aged 25-34 OCES, INE - - - 0,60 (2003) 0,9
9. New PhDs in S&E fields of study per thousand population aged 25-34
Eurostat, Key Figures 2003-4 0,55 (2001) 1,37 (SE)
(2001) 0,35 (2001) 0,30 (2001) 0,45
10. Number of scientific publications per million populationThompson Scientific, Key Figures 2005
439 1642 (SE) 588 406 650
11. Number of patent applications to the European Patent Office (EPO) per million inhabitants
Eurostat 158,72 (2000) 361,50 (SE) (2000) 28,75 (2001) 4,01 (2000) 12
12. Number of patents granted by the United States Patent and Trademark Office (USPTO) per million inhabitants
Eurostat 66,66 (2000) 494,16 (LI) (2002) 8 (2002) 1.29 (2002) 4
13. High-tech manufacturing industries - exports as % of total manufacturing exports
Eurostat (comext), UN (comtrade), Key Figures 2005
19,7% (EU25) 51,6% (IE) 9,3% 11,6% 15%
14. Technology balance of payments (receipts-payments) as % of GDP
OCDE - 0,06% (2001)
0,51% (BE+LU) (2001)
- 0,14% (2001)
- 0,28% (2001)
- 0,15%
Characterization of Human Resources
S&T Resources (input)
S&T Performance (output)
Context Indicator SourcePortugal
2003
But the challenges for Portugal also include improving access to tertiary education and creating the conditions for enabling every citizen to gain access to lifelong learning, and developing the role of the institutions of higher education in this process. In this context, the main objectives of the Government for the 2005-2009 period include:
• Implementing the Bologna European process for the reform of tertiary education, which is an opportunity to stimulate entry into higher education, to improve the quality and relevance of the training provided, and to encourage mobility and internationalisation.
• Reinforcing the system of tertiary education with autonomous institutions, facilitating the reform of their governance mechanisms in order to develop a culture of accountability and to make forms of organisation and management more flexible, promoting the de-governmentalisation of the system and valuing partnerships between national and foreign institutions.
• Promoting the quality of the system, valuing the need to work with various types of public, which would require the structuring of an internationally recognised quality assurance system, developing the present model of assessment and financing and developing a national system of accreditation.

TERTIARY EDUCATION IN PORTUGAL: BACKGROUND REPORT
185
• Promoting equal opportunities for access to tertiary education, improving attendance and completion of courses in higher education, attracting new types of public in a logic of lifelong learning and the improvement of student social support.
For these objectives to be achieved, it will be necessary to:
• Give priority to the consolidation and re-organisation of the system of tertiary education, avoiding further expansion of infrastructures without a serious critical review of the installed capacity;
• Promote the independent, transparent and rigorous assessment of the public and private, university and polytechnic systems, working with international standards (namely as set by OECD), to permit the necessary stream-lining and re-organisation of the present system in the light of the challenges in the future;
• Stimulate the diversity and flexibility of the higher education system, particularly in terms of specialisation and institutional performance and guaranteeing closer relationship between the university and polytechnic sub-systems, valuing excellence in both;
• Create and develop a system of accreditation for all of tertiary education according to international standards, which together with the progressive internationalization of the present system of assessment, may contribute to internationalizing the education system and improving the regulation of the system to benefit public interest, clarifying the role of the State in relation to the institutions;
• Clarify the public funding system of the institutions of higher education, guaranteeing the necessary stability in the institutions and building trust between the institutions and the State;
• Review both the laws regulating the autonomy of the universities and polytechnics and those regulating academic careers, in order to adapt the objectives of higher education to the European space.
Main activities taken by the Ministry of Science, Technology and Higher Education in 2006
The Government has taken measures aimed at the reorganisation of course offering in higher education. This includes the rationalisation of course offerings so as to provide better educational opportunities of higher quality for the highest number of people and to make more efficient use of resources. As part of this process:
• Courses with less than 20 students are no longer financed, except in exceptional cases.
• A policy of concentrating training at the 1st level is being developed, thus seeking to reduce dispersal of available courses.
The Government passed the regulatory framework for the reorganisation of the higher education system adopting the three stages (Bologna Process) of levels and diplomas. The Basic Law of the Education System by Law No. 49/2005, of 30 August, Decree Law No. 74/2006, of 24 March was approved, which regulated the three-level system, and set the conditions for course accreditation during the transitional model until the accreditation agency is set up and functional.

TERTIARY EDUCATION IN PORTUGAL: BACKGROUND REPORT
186
Higher education institutions have been reorganising their courses and programmes. In 2006-2007 about half of the first level courses have been reorganised in accordance with the Bologna model. In 2007-2008 the remaining courses are expected to have been organised. The process of adjustment is due to be completed in 2008-2009 so that, in 2010, the new organisational model will be fully applied to all educational stages.
The Government set a target to create a national quality assurance system for higher education, which is internationally recognised and based on four principles:
• The expansion of the assessment of institutions' performance
• Setting up evaluation criteria and translating the results into qualitative assessments, establishing comparable and clear consequences of the assessment.
• The internationalisation of the assessment process, namely in terms of institutional assessment
• Setting up certified quality assurance systems for universities and polytechnics.
A first revision of the financing system for public higher education institutions was carried out. It established:
• A distributional basis for the amounts earmarked in the State Budget based on cost factors by educational area.
• The financing of the 2nd level of higher education was assured.
• The expansion of training to new audiences, in terms of admitting adults to the system through a special process of admission and in terms of post-secondary level 4 training (technological specialisation courses).
According to the constitutional rules and the Government Program, tuition fees for the 2nd level of higher education studies (masters) were set, differentiating between those that are indispensable for professional activity, where the fee is identical to that for the 1st level, from the remainder the tuition fee is set freely by the higher education institutions. The same applies to third level of studies.
The Government decided that public national and community investments in new higher education buildings will be carried out by tender. This will permit the assessment of priority to each project and establish a framework of national priorities for higher education.
With the objective of promoting educational success and combating failure and drop-outs, a public tender was launched for higher education institutions. Two lines of projects were promoted and the assessment of applications is currently underway.
• Diagnostic projects that contribute to the analysis and understanding of situations of educational failure in higher education, as well as ways of eradicating structural or other causes that lead to educational failure and student drop-out.
• Intervention projects that develop corrective measures of a social and organisational nature to promote educational success, combat failure and dropping out of higher education.

TERTIARY EDUCATION IN PORTUGAL: BACKGROUND REPORT
187
Within the framework of promoting international partnerships to internationalise Portuguese higher education, contracts and protocols have been signed by universities and R&D centres with:
• The Massachusetts Institute of Technology, in the areas of engineering (Concept and Advanced Industrial Production Engineering, Power Systems, Transport Systems and Bio-engineering Systems) and management (including the setting up of an international MBA programme and a programme of PhD seminars).
• Carnegie Mellon University, with the aim of carrying out advanced training programs, granting joint degrees at the masters level (Software Engineering, Information Networks and Information Technology Security) and the doctorate level (Computer Engineering and Electro technical, Computer Sciences, Computer Processing of Speech, Information and Technology Management and Mathematics).
• In 2006 negotiations with the University of Texas at Austin will be concluded, with the aim of developing collaboration in the areas of Digital Media and Commercialisation of Technology.
Decree Law No. 88/2006, of 23 May was approved and reorganizes level IV training15 (technological specialization courses), namely the reorganization of their structure, focusing on the technological training component and altering conditions of admission in order to permit new audiences. This training will be provided mainly by higher education polytechnic schools (and may also be provided by universities), which will be financed for that purpose within the framework of their general financing. In 2006-2007 about 100 new courses are expected to be functional, half of them in technology fields.
Decree Law No. 64/2006, of 21 March created special entrance exams to evaluate the capacity of those aged over 23 to attend higher education. This new admission model values academic qualifications via exams results set by the higher education institutions as well as professional experience assessed by a curricular evaluation. The application of this new model of admission and entrance into higher education for new audiences began in 2006, and has led to significant new demand. Provisional figures show that around 7,500 applications were made for examinations in the public sector and 5,500 in the private sector.
Alongside the increase in budget for social support measures were taken to reduce the running costs of services and to increase the proportion of expenditure to support disadvantaged students.
The State Budget Law for 2006 authorised the Government to set up a system of guarantees of loans for higher education students (article 101 of Law No. 60-A/2005 of 30 December). The Government is currently in contact with financial institutions in order to study a model of financing student to attend higher education.
The government program of administrative and legislative simplification known as SIMPLEX 2006 has promoted a number of measures that help streamline administrative procedures in higher education:
• Following the adoption of Bologna’s process the Government decreed the approval of the plan of studies in higher education to rectors and polytechnics presidents.
• Facilitating specific budget alterations and their approval process concerning Public Institutions of Higher Education and Science and Technology.
15 Decision No. 85/368/EEC, of the Council, of 16th July, published in the Official European Community
Journal, No. L 199, of 31st July, 1985

TERTIARY EDUCATION IN PORTUGAL: BACKGROUND REPORT
188
• Facilitating ministerial ability to transfer and delegate responsibilities concerning Higher Education institutions to University Rectors and Presidents of the Polytechnics.
• Simplification of transference and change of studies procedures into one regime allowing greater mobility to students from national and foreign institutions thereby making the procedures less complex.
• Simplification of the procedures of attribution of social grants to students of higher education through the reduction of necessary documents and implementing a uniform application process.
• Simplifying the process of contracting foreign faculty and researchers, eliminating bureaucratic measures which made access to highly qualified teaching staff from foreign countries difficult.
• Application of the European system of transference and concentration of credits (ECTS) in a new regime granting recognition to continue studies in higher education.
• Introduction of a process of recognition of academic and professional experience for higher education degrees.
• Introduction of on-line application to pubic higher education institutions.