
TERRORIST RISK: INSURANCE MARKET FAILURES AND CAPITAL ... · SIA RESEARCH SIA RESEARCH DEPARTMENT...
36
SIA RESEARCH SIA RESEARCH DEPARTMENT Frank A. Fernandez, Senior Vice President, Chief Economist and Director, Research Kyle L Brandon, Vice President and Director, Securities Research Stephen L. Carlson, Vice Presi- dent and Director, Surveys Lenore Dittmar, Executive Assis- tant Carmen Lopez, Research Assis- tant Bella Mardakhaev, Research Assistant George R. Monahan, Vice Presi- dent and Director, Industry Studies Amy Sloane, Manager, Surveys Grace Toto, Vice President and Director, Statistics Volume V, No. 1 January 31, 2004 TERRORIST RISK: INSURANCE MARKET FAILURES AND CAPITAL MARKET SOLUTIONS Kyle L Brandon Frank A. Fernandez ECONOMIC UPDATE AND OUTLOOK Frank A. Fernandez MONTHLY STATISTICAL REVIEW Grace Toto SECURITIES INDUSTRY EMPLOYMENT George Monahan Bella Mardakhaev SECURITIES INDUSTRY ASSOCIATION • [email protected] , http://www.sia.com 120 Broadway, 35 th Floor, New York, NY 10271-0080 • 212-608-1500, fax 212-968-0703 1425 K Street, NW, Washington, DC 20005-3500 • 202-216-2000, fax 202-216-2119 Prepared by SIA Research Department • Copyright© 2004 Securities Industry Association • ISSN 1532-6667
Transcript of TERRORIST RISK: INSURANCE MARKET FAILURES AND CAPITAL ... · SIA RESEARCH SIA RESEARCH DEPARTMENT...

SIA RESEARCH
SIA RESEARCH DEPARTMENT Frank A. Fernandez, Senior Vice
President, Chief Economist and Director, Research
Kyle L Brandon, Vice President and Director, Securities Research
Stephen L. Carlson, Vice Presi-dent and Director, Surveys
Lenore Dittmar, Executive Assis-tant
Carmen Lopez, Research Assis-tant
Bella Mardakhaev, Research Assistant
George R. Monahan, Vice Presi-dent and Director, Industry Studies
Amy Sloane, Manager, Surveys Grace Toto, Vice President and
Director, Statistics
Volume V, No. 1 January 31, 2004
TERRORIST RISK: INSURANCE MARKET FAILURES
AND CAPITAL MARKET SOLUTIONS Kyle L Brandon
Frank A. Fernandez
ECONOMIC UPDATE AND OUTLOOK Frank A. Fernandez
MONTHLY STATISTICAL REVIEW Grace Toto
SECURITIES INDUSTRY EMPLOYMENT George Monahan
Bella Mardakhaev
SECURITIES INDUSTRY ASSOCIATION • [email protected], http://www.sia.com 120 Broadway, 35th Floor, New York, NY 10271-0080 • 212-608-1500, fax 212-968-0703 1425 K Street, NW, Washington, DC 20005-3500 • 202-216-2000, fax 202-216-2119 Prepared by SIA Research Department • Copyright© 2004 Securities Industry Association • ISSN 1532-6667
Table of Contents Page
3.......... Terrorist Risk: Insurance Market Failures and Capital Market Solutions, by Kyle Brandon and Frank Fernandez. Demand for terrorist risk insurance exists, but is not being supplied in sufficient amount at a reasonable price. This apparent market failure is primarily the result of two factors: the rein-surance industry not fully recapitalizing after losses stemming from a series of extraordinary, catastrophic events and the difficulties inherent in evaluat-ing or “pricing” terrorist risk. Whether the temporary Terrorism Risk Insur-ance Act of 2002 needs to be supplemented, modified or just allowed to ex-pire at end-2005, work is needed on longer term responses to terrorist risk, which is seen as a “generational problem.” Issuers of financing for public spaces (stadiums and airports, for example) and municipal and cross border projects, are concerned about terrorism and feel the need for protection. There is also still a need for more developed work on terrorist risk analysis and management, which will require public/private cooperation. Capital market instruments may provide an alternative in the current public debate on reinsurance issues.
12........ Economic Update and Outlook, by Frank Fernandez. The climate of uncer-tainty prevailing in early 2003 was dispelled by summer, and business and consumer confidence continue to strengthen into the New Year. Corporate profits and equity prices rose at a near record pace in response to this easing of concerns and the arrival of additional monetary and fiscal stimulus at mid-year, the effects of which are expected to continue during at least the first half of 2004. The combined impact of continued, albeit more moderate, declines in the dollar and accelerating growth in the world economy is expected to in-crease the demand for U.S. exports in 2004, while import growth slows across the course of the year.
18........ Monthly Statistical Review, by Grace Toto. Monthly review of equity prices and indices; daily share volume and dollar value traded; short and long-term interest rate movements; U.S. corporate bond and equity underwriting activ-ity, including IPOs; with tables covering two decades of data.
28........ Securities Industry Employment, by George Monahan and Bella Mardak-haev. According to the U.S. Department of Labor’s Bureau of Labor Statistics (BLS) the U.S. securities industry added 5,700 jobs in December, the third straight monthly increase. The jump brought national employment to a 25-month high of 811,600 jobs. Since May’s nadir of 793,700 jobs, the industry gained 17,900 positions, or 2.3%. New York State and New York City em-ployment showed a slight uptick in December as well.

SIA Research Reports, Vol. V, No. 1 (January 31, 2004) Page 3
TERRORIST RISK: INSURANCE MARKET FAILURES AND CAPITAL MARKET SOLUTIONS
emand for terrorist risk insurance exists, but is not being supplied in sufficient amount at a reasonable price. This apparent market failure is primarily the result of two factors: the
reinsurance industry not fully recapitalizing after losses stemming from a series of extraordinary, catastrophic events and the difficulties inherent in evaluating or “pricing” terrorist risk. Whether a temporary “Federal insurance backstop”1 set up at end-2002 needs to be supplemented, modified or just allowed to expire at end-2005, work is needed on longer term responses to terrorist risk, which is seen as a “generational problem.” Capital markets may provide some solutions to these problems.
Insurance Market Failures While it is common for catastrophic risk insurance to rise in price and become less available following an extraordinary event, these effects tend to be shorter and less severe than the current disruption in the provision of terrorist risk insurance. Insurers and reinsurers generally can absorb losses and recoup them over time in the form of higher premiums and greater demand for insurance in the wake of a catastrophic event. However, a series of extraordinary events hit the global insurance2 and reinsurance industry in recent years. In 1992 Hurricane Andrew produced losses of $20 billion in 2002 dollars and in 1994 the Northridge earthquake caused losses of $17 billion in 2002 dollars3. The industry was still recovering from these and, what appeared to be an increased incidence of lesser disasters, prior to 2001. Estimates of the insured losses arising from the terrorist attacks on September 11, 2001 remain imprecise, ranging from $40 billion4 to $75 billion.5 Even at a conservative $50 billion, it represents the single largest loss by the global insurance and reinsurance industry.6 Various types of insurance losses are represented in these totals, including: business interruption, commercial property, workers’ compensation, life, health, disability, aviation liability, aircraft hull and other liabilities.7 The insurance industry suffered substantial capital erosion due to these extreme events, as well as the poor investment environment (stock market losses and a low interest rate environment) in recent years. The insurance industry experienced $200 billion in capital losses since
1 “Terrorism Risk Insurance Program: Interim Final Rule with Requests for Comments,” U.S. Department of the
Treasury, 31 CFR Part 50, RIN 1505-AA96, April 18, 2003, (“TRIP”), p. 3. 2 Terms in bold italics are defined in the glossary at the end of this report. 3 Howard Kunreuther and Erwann Michel-Kerjan, “Insurability of Terrorism Risk: Outline,” Organisation for Economic
Co-operation and Development (OECD) Task Force on Terrorism Insurance, November 26, 2003 (“OECD Insur-ability”), p. 3.
4 OECD Insurability, p. 3. 5 Torben Juul Anderson, “International Private Solutions to Mega Terrorism Risk: Outline,” OECD Task Force on
Terrorism Insurance, November 2003 (“Private Solutions”), p. 2. 6 Andrew Bolger, “Insurance: Rates Fall as Competition Intensifies,” Financial Times, Special Report: World Secu-
rity, December 3, 2003 (“Insurance”), p. 6. 7 Howard Kunreuther, Erwann Michel-Kerjan and Beverly Porter, “Assessing, Managing and Financing Extreme
Events: Dealing with Terrorism,” November 20, 2003 (“Dealing with Terrorism”), p. 4.
D
Page 4 SIA Research Reports Vol. V, No. 1 (January 31, 2004)
September 11, 2001, and global insurance capacity has shrunk by 21% compared to early 2000.8 Attempts to increase capital have not been fully successful, with only an estimated $30 billion having been raised.9 The industry’s difficulties led to a reportedly severe shortage in terrorist catastrophe insurance and reinsurance. Premiums rose 10% to 15% for January 2003 renewals, the third annual increase in a row.10 According to a Conference Board survey, “insurance costs have risen a median 33% since 2001, while insurance costs of 20% of companies have doubled… More than half of the companies surveyed said they had faced difficulties getting insurance for city offices.”11 Terrorist risk insurance also suffered limited availability. Insurers were wary of extending coverage for terrorist risk. Pre-9/11 terrorist risk insurance was essentially free and included in many policies. Post-9/11 most policies exclude terrorist risk because there was no reinsurance available. Since the September 11, 2001 terrorist attacks, reinsurers have withdrawn from providing terrorist risk reinsurance due to massive losses, which has deprived the insurance industry of a method of laying off risk. In turn, insurance companies have been unwilling to offer anywhere near the amount of coverage previously offered. Pricing for terrorist risk coverage, which used to be included in general commercial property and casualty insurance, was so limited and priced at such a high level as to put it out of reach for some large commercial properties. In other words commercial entities are operating with little or no terrorist risk insurance, leaving the companies carrying the risk themselves, and causing the economy to be more broadly vulnerable to the economic consequences of a possible future terrorist attack. According to informal surveys conducted by the U.S. General Accounting Office, a lack of terrorist risk coverage may be retarding economic activity. While acknowledging that its information is largely anecdotal, the GAO cites several examples of projects that have not been able to find adequate terrorist risk insurance. In 2002 testimony the GAO outlined several particular concerns:
1 There are property companies in technical default on mortgages that require terrorist risk coverage, leading to the risk that mortgage holders could call the loans at any time;
2 New purchase, construction, and refinancing may be hampered due to the inability to find adequate and/or affordable terrorist risk coverage; and
3 Issuance of asset-backed securities may be constrained due to lack of coverage or fear of future inability to renew terrorist risk coverage.12
The Terrorism Risk Insurance Act of 2002 (“TRIA”) is a temporary federal reinsurance scheme designed to ensure the availability of property and casualty terrorist risk insurance and provide a “transition period for private markets to stabilize, resume pricing, and build capacity while
8 “Recent Developments in the Reinsurance Markets,” OECD, November 18, 2003 (“Recent Developments”), p. 2. 9 Recent Developments, p. 2. 10 Recent Developments, p. 2. 11 Insurance, p. 6. 12 “Terrorism Insurance: Rising Uninsured Exposure to Attacks Heightens Potential Economic Vulnerabilities,” State-
ment of Richard J. Hillman, Director, Financial Markets and Community Investment, U.S. General Accounting Of-fice in Testimony before the Subcommittee on Oversight and Investigations, Committee on Financial Services, House of Representatives, February 27, 2002, pp. 11 – 14.

SIA Research Reports, Vol. V, No. 1 (January 31, 2004) Page 5
preserving State insurance regulation and consumer protection.”13 The TRIA requires that insurers make terrorist risk coverage available in 2003 and 2004 with terms, amounts and limitations comparable to non-terrorist events. See Box 1 for a brief summary of the TRIA’s terms. The TRIA requires the Treasury Department annually to compile information on terrorist risk insurance rates and report to Congress, in addition to providing a wide range of information on market conditions, terrorist risk insurance availability, industry capacity and the effectiveness of the TRIA.14 These reports will be used to decide whether to require coverage in the third year of the program and whether to extend the program. Until such reports are published, and even once they are, it will be hard to determine whether this program has had the desired effect of making insurance available that would not otherwise have been available. Early indications are that TRIA is not having a marked impact.
Box 1: The Terrorism Risk Insurance Act of 2002 (“TRIA”)
On November 26, 2002, President Bush signed into law the Terrorism Risk Insurance Act of 2002 (Public Law 107-297, 116 Stat. 2322). Effective immediately, the Act established a temporary federal program (sunsetting on December 31, 2005) of shared public and private compensation for insured losses (commercial property and casualty) from an act of terrorism.15 Among the “Treasury’s objectives are to encourage new sources of capital in the market for terrorism risk in-surance.”16 A brief summary of some of its terms follows.
Insurer’s exposure equals the insurer’s deductible, plus 10% of the insured losses above the deductible. The program covers 90% of insured losses above the applicable deductible.
The insurer’s deductible equals a percentage of the issuer’s earned premiums in the previous year: 7% in 2003, 10% in 2004 and 15% in 2005.
The Federal government does not charge insurers a premium for this coverage. There are no mandates regarding the rates insurers may charge their clients.
TRIA only covers events certified as an “act of terrorism” by the U.S. Treasury and is explic-itly limited to acts carried out by foreign persons or interests.
An insurer’s losses must exceed a threshold of $5 million per event and the total annual liabil-ity cap is $100 billion.
Recent surveys by the Council of Insurance Agents and Brokers (“CIAB”) demonstrate that although insurers are now required to offer terrorist risk coverage as per TRIA, demand for coverage has been lower than expected. Nationally, half of the CIAB members covering large accounts reported that less than 20% of their clients purchased terrorist risk coverage.17 In July 2003, a CIAB survey showed that 72% of brokers reported that their commercial clients were not purchasing terrorist risk coverage.18 A survey by New York insurance broker Kaye Insurance
13 “Terrorism Risk Insurance Act of 2002,” presentation by Mark J. Warshawsky, Acting Assistant Secretary for Eco-
nomic Policy, U.S. Treasury, to the Risk and Insurance Management Society, October 23, 2003 (“TRIA”), p. 2. 14 TRIA, pp. 6 – 8. 15 An act of terrorism as defined in section 102(1) of the Act includes “an act that is violent or dangerous to human
life, property or infrastructure; that has resulted in damage in the U.S.” (also U.S. missions, certain aircarriers and vessels) committed by individuals on behalf of foreign interests or powers “to coerce the U.S. civilian population or to influence the policy or affect the conduct of the U.S. government by coercion.” TRIP, p.8.
16 TRIP, p. 13. 17 “Many Commercial Interests Are Not Buying Terrorism Insurance, New CIAB Survey Shows,” Council of Insurance
Agents and Brokers, News Release, March 24, 2003, p. 1. 18 “Commercial Market Index Survey,” Council of Insurance Agents and Brokers, News Release, July 22, 2003
(“CIAB July 2003”), p. 2.
Page 6 SIA Research Reports Vol. V, No. 1 (January 31, 2004)
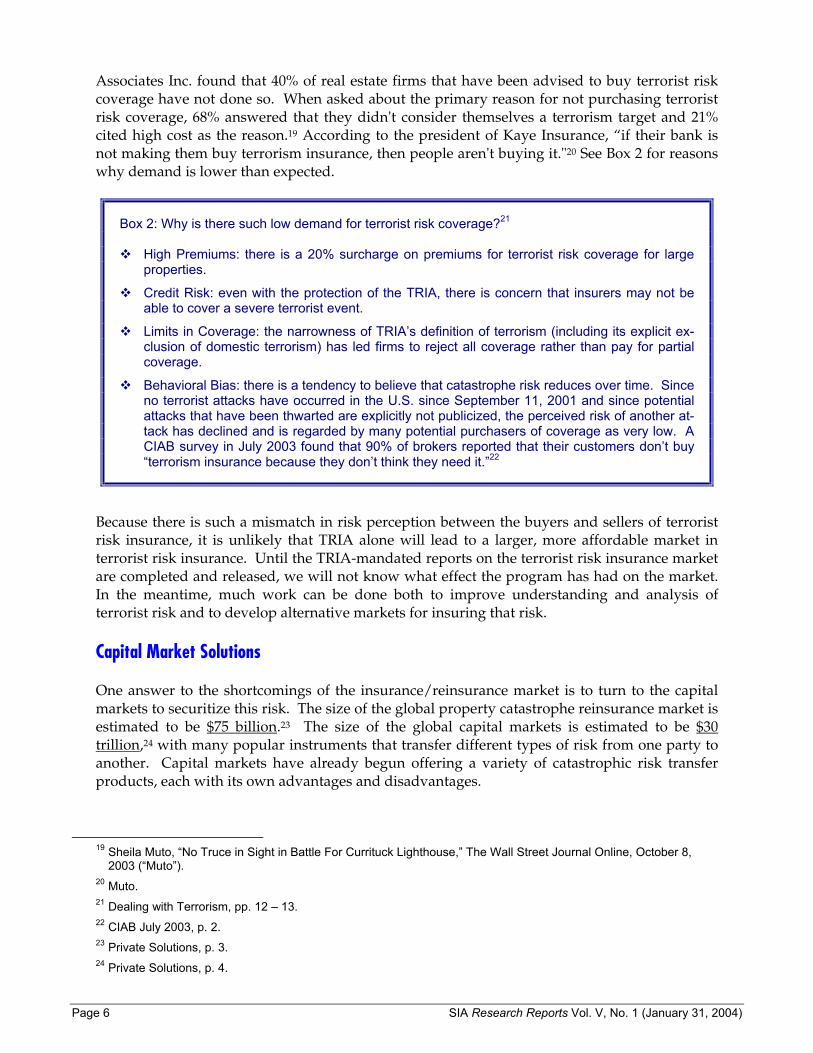
Associates Inc. found that 40% of real estate firms that have been advised to buy terrorist risk coverage have not done so. When asked about the primary reason for not purchasing terrorist risk coverage, 68% answered that they didn't consider themselves a terrorism target and 21% cited high cost as the reason.19 According to the president of Kaye Insurance, “if their bank is not making them buy terrorism insurance, then people aren't buying it."20 See Box 2 for reasons why demand is lower than expected.
Box 2: Why is there such low demand for terrorist risk coverage?21 High Premiums: there is a 20% surcharge on premiums for terrorist risk coverage for large
properties.
Credit Risk: even with the protection of the TRIA, there is concern that insurers may not be able to cover a severe terrorist event.
Limits in Coverage: the narrowness of TRIA’s definition of terrorism (including its explicit ex-clusion of domestic terrorism) has led firms to reject all coverage rather than pay for partial coverage.
Behavioral Bias: there is a tendency to believe that catastrophe risk reduces over time. Since no terrorist attacks have occurred in the U.S. since September 11, 2001 and since potential attacks that have been thwarted are explicitly not publicized, the perceived risk of another at-tack has declined and is regarded by many potential purchasers of coverage as very low. A CIAB survey in July 2003 found that 90% of brokers reported that their customers don’t buy “terrorism insurance because they don’t think they need it.”22
Because there is such a mismatch in risk perception between the buyers and sellers of terrorist risk insurance, it is unlikely that TRIA alone will lead to a larger, more affordable market in terrorist risk insurance. Until the TRIA-mandated reports on the terrorist risk insurance market are completed and released, we will not know what effect the program has had on the market. In the meantime, much work can be done both to improve understanding and analysis of terrorist risk and to develop alternative markets for insuring that risk.
Capital Market Solutions One answer to the shortcomings of the insurance/reinsurance market is to turn to the capital markets to securitize this risk. The size of the global property catastrophe reinsurance market is estimated to be $75 billion.23 The size of the global capital markets is estimated to be $30 trillion,24 with many popular instruments that transfer different types of risk from one party to another. Capital markets have already begun offering a variety of catastrophic risk transfer products, each with its own advantages and disadvantages.
19 Sheila Muto, “No Truce in Sight in Battle For Currituck Lighthouse,” The Wall Street Journal Online, October 8,
2003 (“Muto”). 20 Muto. 21 Dealing with Terrorism, pp. 12 – 13. 22 CIAB July 2003, p. 2. 23 Private Solutions, p. 3. 24 Private Solutions, p. 4.
SIA Research Reports, Vol. V, No. 1 (January 31, 2004) Page 7
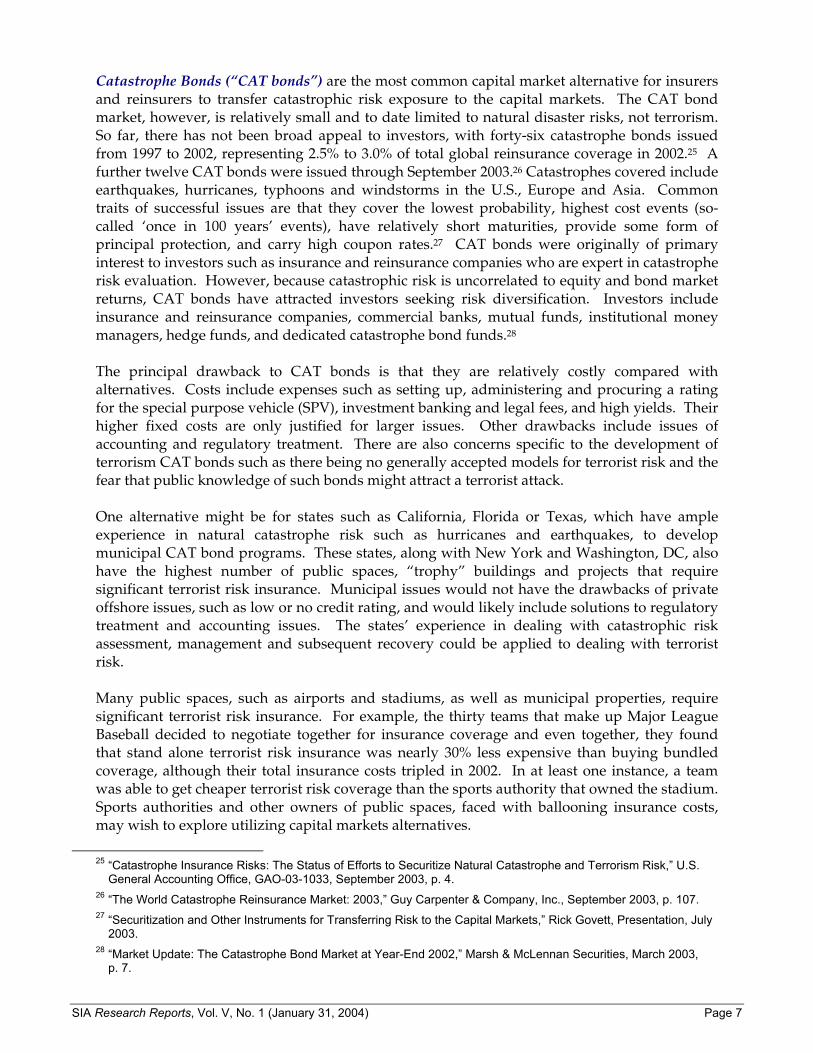
Catastrophe Bonds (“CAT bonds”) are the most common capital market alternative for insurers and reinsurers to transfer catastrophic risk exposure to the capital markets. The CAT bond market, however, is relatively small and to date limited to natural disaster risks, not terrorism. So far, there has not been broad appeal to investors, with forty-six catastrophe bonds issued from 1997 to 2002, representing 2.5% to 3.0% of total global reinsurance coverage in 2002.25 A further twelve CAT bonds were issued through September 2003.26 Catastrophes covered include earthquakes, hurricanes, typhoons and windstorms in the U.S., Europe and Asia. Common traits of successful issues are that they cover the lowest probability, highest cost events (so-called ‘once in 100 years’ events), have relatively short maturities, provide some form of principal protection, and carry high coupon rates.27 CAT bonds were originally of primary interest to investors such as insurance and reinsurance companies who are expert in catastrophe risk evaluation. However, because catastrophic risk is uncorrelated to equity and bond market returns, CAT bonds have attracted investors seeking risk diversification. Investors include insurance and reinsurance companies, commercial banks, mutual funds, institutional money managers, hedge funds, and dedicated catastrophe bond funds.28 The principal drawback to CAT bonds is that they are relatively costly compared with alternatives. Costs include expenses such as setting up, administering and procuring a rating for the special purpose vehicle (SPV), investment banking and legal fees, and high yields. Their higher fixed costs are only justified for larger issues. Other drawbacks include issues of accounting and regulatory treatment. There are also concerns specific to the development of terrorism CAT bonds such as there being no generally accepted models for terrorist risk and the fear that public knowledge of such bonds might attract a terrorist attack. One alternative might be for states such as California, Florida or Texas, which have ample experience in natural catastrophe risk such as hurricanes and earthquakes, to develop municipal CAT bond programs. These states, along with New York and Washington, DC, also have the highest number of public spaces, “trophy” buildings and projects that require significant terrorist risk insurance. Municipal issues would not have the drawbacks of private offshore issues, such as low or no credit rating, and would likely include solutions to regulatory treatment and accounting issues. The states’ experience in dealing with catastrophic risk assessment, management and subsequent recovery could be applied to dealing with terrorist risk. Many public spaces, such as airports and stadiums, as well as municipal properties, require significant terrorist risk insurance. For example, the thirty teams that make up Major League Baseball decided to negotiate together for insurance coverage and even together, they found that stand alone terrorist risk insurance was nearly 30% less expensive than buying bundled coverage, although their total insurance costs tripled in 2002. In at least one instance, a team was able to get cheaper terrorist risk coverage than the sports authority that owned the stadium. Sports authorities and other owners of public spaces, faced with ballooning insurance costs, may wish to explore utilizing capital markets alternatives.
25 “Catastrophe Insurance Risks: The Status of Efforts to Securitize Natural Catastrophe and Terrorism Risk,” U.S.
General Accounting Office, GAO-03-1033, September 2003, p. 4. 26 “The World Catastrophe Reinsurance Market: 2003,” Guy Carpenter & Company, Inc., September 2003, p. 107. 27 “Securitization and Other Instruments for Transferring Risk to the Capital Markets,” Rick Govett, Presentation, July
2003. 28 “Market Update: The Catastrophe Bond Market at Year-End 2002,” Marsh & McLennan Securities, March 2003,
p. 7.
Page 8 SIA Research Reports Vol. V, No. 1 (January 31, 2004)
The states’ expertise, gleaned in efforts to handle natural catastrophic risk, could lead the way in developing CAT bonds as a more cost effective way of buying up front coverage, as well as building reserves to deal with the consequences of terrorism. After all, most of the burden of dealing with the aftermath of terrorism, including loss of life, health, businesses, tourism and the like, falls to the states and municipalities. Developing new instruments such as CAT bonds or other risk-linked securities to give states and municipalities the tools to build needed reserves is certainly worth further examination. There have been several attempts to develop exchange-traded markets in catastrophic risk derivatives, but none have succeeded to date. One such attempt was on the Bermuda Commodity Exchange, where catastrophe options based on the Guy Carpenter Catastrophe Index were launched in 1997, but failed to attract adequate trading interest. The Chicago Board of Trade (“CBOT”) also attempted to build a catastrophe risk derivatives market. The CBOT offered futures and options contracts based on quarterly losses reported by the Insurance Services Office. These products were introduced in 1992, expanded in 1995 and finally delisted in 2000 due to lower than expected demand. Problems with such standardized contracts include basis risk, the frequency of settlement and index calculation, and the lack of liquidity.
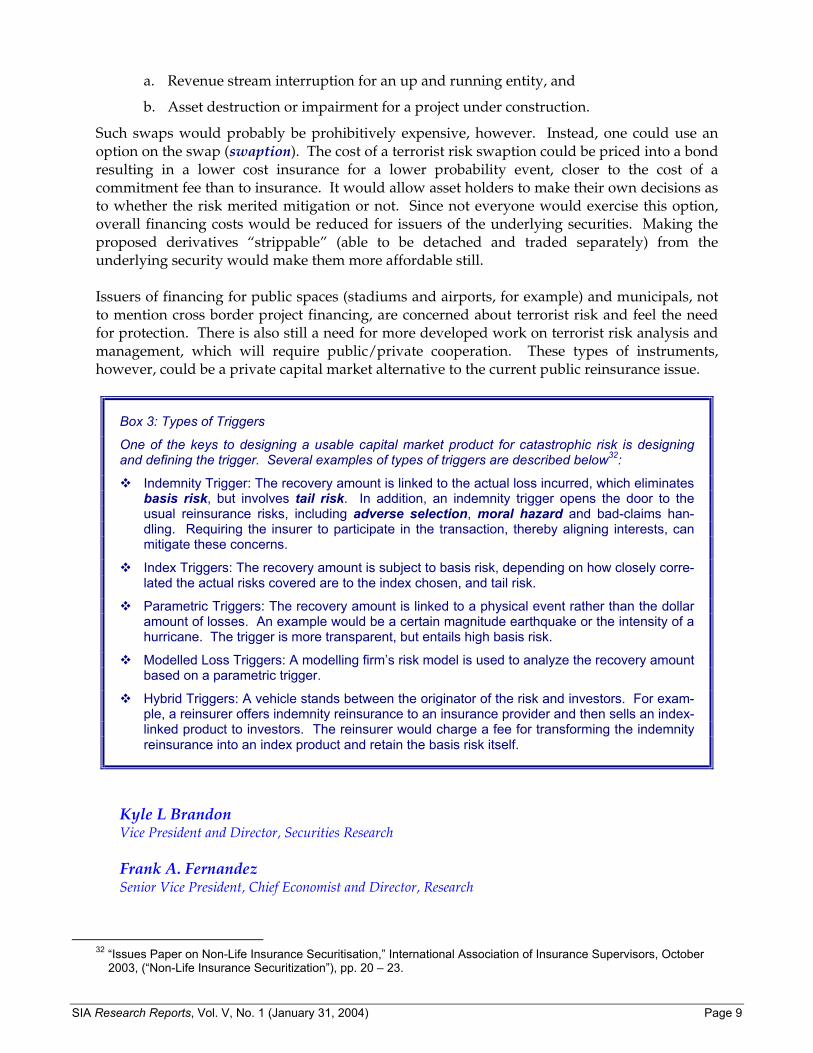
New proposal The credit derivatives market, which reached over $2.6 trillion in notional outstanding in the first half of 2003, according to the International Swaps and Derivatives Association (ISDA)29 is a potentially deep market for catastrophe-linked products. Credit default swaps, which make up 95% of the credit derivatives market, are the exchange of periodic payments for protection if a company or country defaults on a designated obligation.30 Such instruments could define the default trigger instead as a catastrophic event, creating catastrophe linked swaps. Such a CAT swap could provide returns linked to the occurrence of an insured event, but without exchange of principal, depending on the credit rating of the counterparty.31 If the cost of a swap is seen as too high, financing for assets and projects “at risk” either in the form of bonds or asset-backed securities could carry an option to purchase that swap. One of the difficulties in designing a new derivative instrument is defining the type of trigger to use, as demonstrated in Box 3 below. In a derivative instrument, the trigger is the defined event or condition under which the swap payment is activated. The difficulty of defining a “terrorist event” is a challenge to designing a terrorist risk swap. Rather than exclude significant risks (such as under TRIA) or try to include and list each and every event that would fall under the definition of “terrorist event,” use the result of the terrorist event – business interruption – as the trigger. There could be two types of interruptions:
29 “ISDA Announces 2003 Mid-Year Market Survey Results,” Business Wire, September 23, 2003. 30 Scott Moss, “Credit Default Swap Pricing,” Bloomberg Markets, September 2003, p. 113. 31 Isabel Martinez Torre-Enciso and John E. Laye, “Financing Catastrophe Risk in the Capital Markets,” International
Journal of Emergency Management, Vol. 1, No. 1, 2001, p. 67.
SIA Research Reports, Vol. V, No. 1 (January 31, 2004) Page 9
a. Revenue stream interruption for an up and running entity, and
b. Asset destruction or impairment for a project under construction.
Such swaps would probably be prohibitively expensive, however. Instead, one could use an option on the swap (swaption). The cost of a terrorist risk swaption could be priced into a bond resulting in a lower cost insurance for a lower probability event, closer to the cost of a commitment fee than to insurance. It would allow asset holders to make their own decisions as to whether the risk merited mitigation or not. Since not everyone would exercise this option, overall financing costs would be reduced for issuers of the underlying securities. Making the proposed derivatives “strippable” (able to be detached and traded separately) from the underlying security would make them more affordable still. Issuers of financing for public spaces (stadiums and airports, for example) and municipals, not to mention cross border project financing, are concerned about terrorist risk and feel the need for protection. There is also still a need for more developed work on terrorist risk analysis and management, which will require public/private cooperation. These types of instruments, however, could be a private capital market alternative to the current public reinsurance issue.
Box 3: Types of Triggers
One of the keys to designing a usable capital market product for catastrophic risk is designing and defining the trigger. Several examples of types of triggers are described below32:
Indemnity Trigger: The recovery amount is linked to the actual loss incurred, which eliminates basis risk, but involves tail risk. In addition, an indemnity trigger opens the door to the usual reinsurance risks, including adverse selection, moral hazard and bad-claims han-dling. Requiring the insurer to participate in the transaction, thereby aligning interests, can mitigate these concerns.
Index Triggers: The recovery amount is subject to basis risk, depending on how closely corre-lated the actual risks covered are to the index chosen, and tail risk.
Parametric Triggers: The recovery amount is linked to a physical event rather than the dollar amount of losses. An example would be a certain magnitude earthquake or the intensity of a hurricane. The trigger is more transparent, but entails high basis risk.
Modelled Loss Triggers: A modelling firm’s risk model is used to analyze the recovery amount based on a parametric trigger.
Hybrid Triggers: A vehicle stands between the originator of the risk and investors. For exam-ple, a reinsurer offers indemnity reinsurance to an insurance provider and then sells an index-linked product to investors. The reinsurer would charge a fee for transforming the indemnity reinsurance into an index product and retain the basis risk itself.
Kyle L Brandon Vice President and Director, Securities Research Frank A. Fernandez Senior Vice President, Chief Economist and Director, Research
32 “Issues Paper on Non-Life Insurance Securitisation,” International Association of Insurance Supervisors, October
2003, (“Non-Life Insurance Securitization”), pp. 20 – 23.

Page 10 SIA Research Reports Vol. V, No. 1 (January 31, 2004)
Glossary
Adverse Selection exists when the reinsured company (seller of risk) has private information about the true quality of its risks, and consciously and deliberately submits to a reinsurer, or other purchaser of risk, those risks, segments of risks, or coverages that appear less attractive for retention by the reinsured. Basis Risk is the risk that the trigger event in an insurance contract or, more likely, in a stan-dardized derivative instrument differs from the particular risk that instrument is supposed to cover. For example, an insurer wants to transfer a portion of its covered catastrophic risk and purchases an option based on a catastrophe index. The particular incidence of catastrophe un-der the insurer’s policies may differ significantly from the incidence captured by the index and the insurer may find itself paying out claims, without being able to collect on the option because the index and its own exposure did not match. Mismatches may also occur due to differences in location. Catastrophe Bonds (“CAT bonds,” also known as “Act of God bonds”) are typically struc-tured by forming a special purpose vehicle that issues a bond to investors, the proceeds of which are placed in a trust account. The price of the bond (spread over LIBOR) reflects the risk that in the case of certain defined trigger events in the insurer’s contract, the funds in the trust will be used to pay those claims. If no trigger event occurs, the bondholders are repaid from the trust. One of the advantages of the CAT bond is that it essentially eliminates counterparty risk. The funds that would pay a claim are held in trust, while under a reinsurance contract, the rein-surer could default on a claim. Council of Insurance Agents and Brokers (“CIAB”) represents the top 1% of U.S. insurance brokers and agents who collectively place 80%, over $90 billion, of all U.S. insurance products and services. Credit Default Swaps (“CDS”) represent 45% of the notional value of all credit derivatives. The CDS, or protection, buyer (the “Buyer”) pays a premium to the CDS, or protection, seller (the “Seller”) in exchange for a contingent payment in case a credit event involving the refer-ence credit (“RC”) occurs during the contract period. The premium (default swap spread) re-flects the credit risk of the RC, and is usually quoted as a spread over a reference rate (“RR”) such as LIBOR, to be paid upfront, quarterly or semiannually. If no credit event occurs before the end of the contract, the contract is terminated, with the Seller having received the premium payments. If a credit event occurs during the contract pe-riod, the contingent payment to the Buyer takes either of two forms (specified in advance in the contract): physical or cash settlement. The International Swaps and Derivatives Association (ISDA) set and defined standard credit events (bankruptcy, failure to pay, restructuring, etc.) and standardized terms of CDS contracts. Credit Derivatives (“CD”) are bilateral financial contracts that isolate the credit risk (from other forms of risk such as market or operational risk) of a reference credit (“RC”) and transfers that risk from one party to the other. CD payoffs are contingent on the realization of a credit event (bankruptcy, failure to pay, obligation acceleration, restructuring, repudiation, moratorium, etc.). These instruments should reflect market assessments of the likelihood of a credit event (esti-mate the probability of default) and the expected value of the reference security after the event (recovery value).
SIA Research Reports, Vol. V, No. 1 (January 31, 2004) Page 11
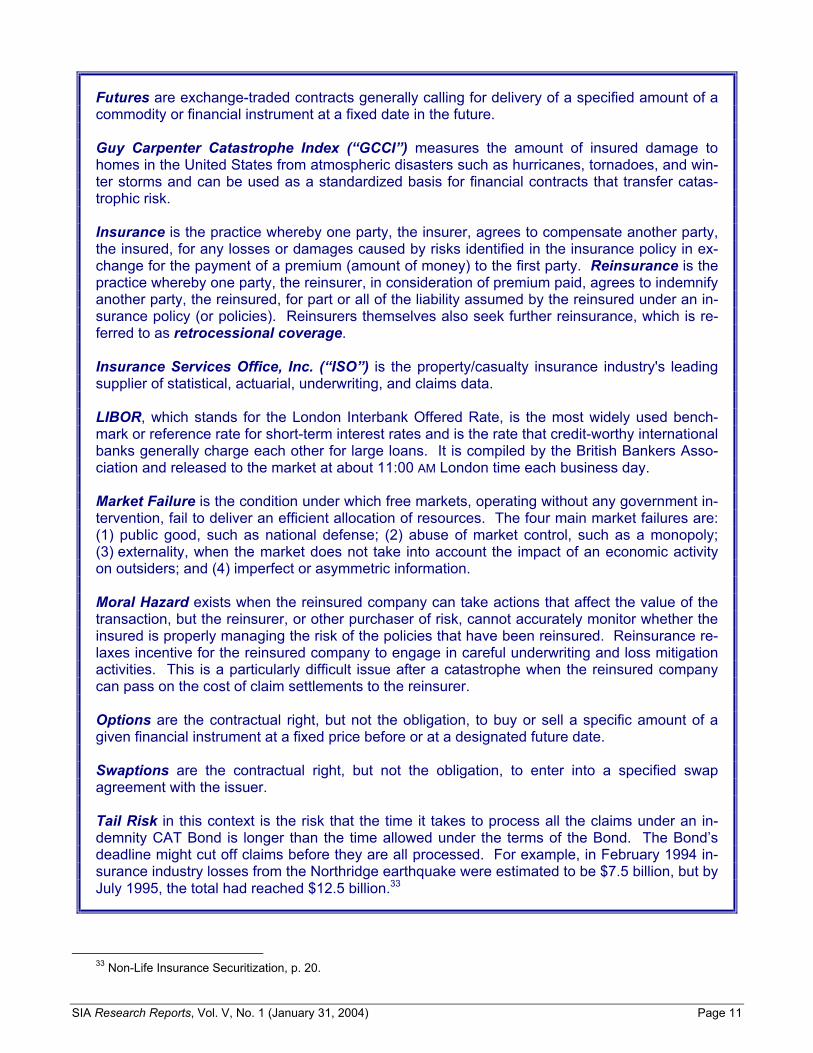
Futures are exchange-traded contracts generally calling for delivery of a specified amount of a commodity or financial instrument at a fixed date in the future. Guy Carpenter Catastrophe Index (“GCCI”) measures the amount of insured damage to homes in the United States from atmospheric disasters such as hurricanes, tornadoes, and win-ter storms and can be used as a standardized basis for financial contracts that transfer catas-trophic risk. Insurance is the practice whereby one party, the insurer, agrees to compensate another party, the insured, for any losses or damages caused by risks identified in the insurance policy in ex-change for the payment of a premium (amount of money) to the first party. Reinsurance is the practice whereby one party, the reinsurer, in consideration of premium paid, agrees to indemnify another party, the reinsured, for part or all of the liability assumed by the reinsured under an in-surance policy (or policies). Reinsurers themselves also seek further reinsurance, which is re-ferred to as retrocessional coverage. Insurance Services Office, Inc. (“ISO”) is the property/casualty insurance industry's leading supplier of statistical, actuarial, underwriting, and claims data. LIBOR, which stands for the London Interbank Offered Rate, is the most widely used bench-mark or reference rate for short-term interest rates and is the rate that credit-worthy international banks generally charge each other for large loans. It is compiled by the British Bankers Asso-ciation and released to the market at about 11:00 AM London time each business day. Market Failure is the condition under which free markets, operating without any government in-tervention, fail to deliver an efficient allocation of resources. The four main market failures are: (1) public good, such as national defense; (2) abuse of market control, such as a monopoly; (3) externality, when the market does not take into account the impact of an economic activity on outsiders; and (4) imperfect or asymmetric information. Moral Hazard exists when the reinsured company can take actions that affect the value of the transaction, but the reinsurer, or other purchaser of risk, cannot accurately monitor whether the insured is properly managing the risk of the policies that have been reinsured. Reinsurance re-laxes incentive for the reinsured company to engage in careful underwriting and loss mitigation activities. This is a particularly difficult issue after a catastrophe when the reinsured company can pass on the cost of claim settlements to the reinsurer. Options are the contractual right, but not the obligation, to buy or sell a specific amount of a given financial instrument at a fixed price before or at a designated future date. Swaptions are the contractual right, but not the obligation, to enter into a specified swap agreement with the issuer. Tail Risk in this context is the risk that the time it takes to process all the claims under an in-demnity CAT Bond is longer than the time allowed under the terms of the Bond. The Bond’s deadline might cut off claims before they are all processed. For example, in February 1994 in-surance industry losses from the Northridge earthquake were estimated to be $7.5 billion, but by July 1995, the total had reached $12.5 billion.33
33 Non-Life Insurance Securitization, p. 20.
Page 12 SIA Research Reports Vol. V, No. 1 (January 31, 2004)
ECONOMIC UPDATE AND OUTLOOK
Summary
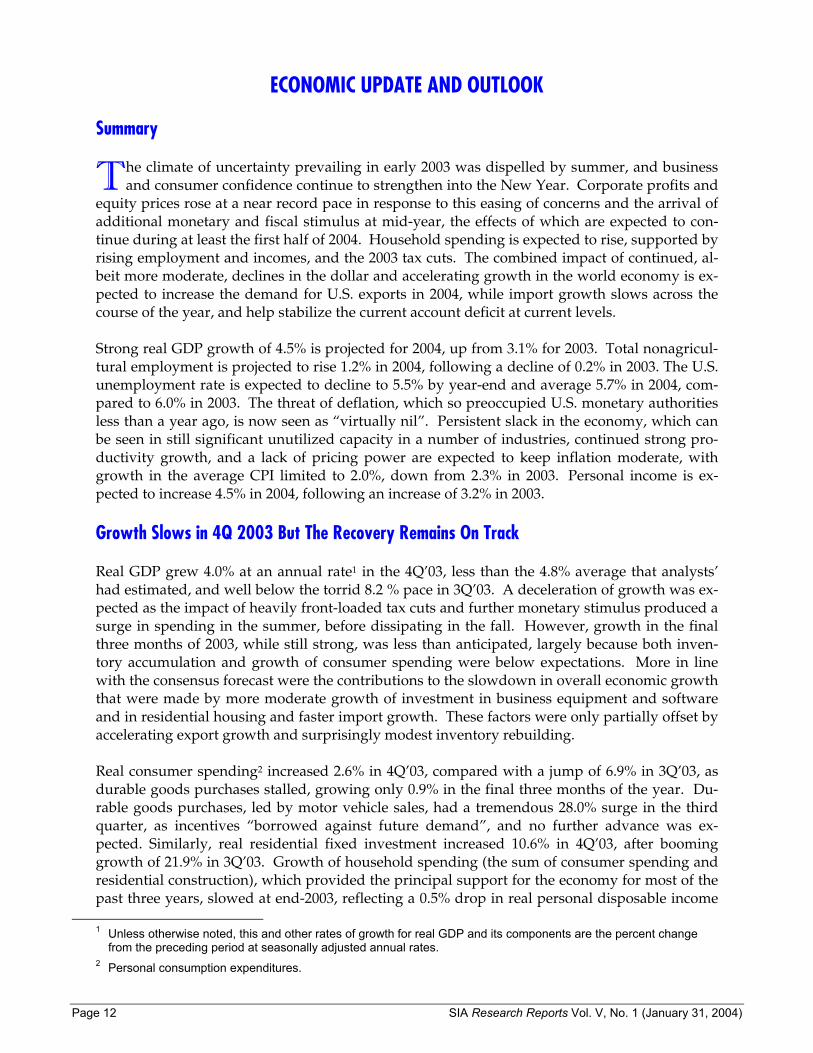
he climate of uncertainty prevailing in early 2003 was dispelled by summer, and business and consumer confidence continue to strengthen into the New Year. Corporate profits and
equity prices rose at a near record pace in response to this easing of concerns and the arrival of additional monetary and fiscal stimulus at mid-year, the effects of which are expected to con-tinue during at least the first half of 2004. Household spending is expected to rise, supported by rising employment and incomes, and the 2003 tax cuts. The combined impact of continued, al-beit more moderate, declines in the dollar and accelerating growth in the world economy is ex-pected to increase the demand for U.S. exports in 2004, while import growth slows across the course of the year, and help stabilize the current account deficit at current levels. Strong real GDP growth of 4.5% is projected for 2004, up from 3.1% for 2003. Total nonagricul-tural employment is projected to rise 1.2% in 2004, following a decline of 0.2% in 2003. The U.S. unemployment rate is expected to decline to 5.5% by year-end and average 5.7% in 2004, com-pared to 6.0% in 2003. The threat of deflation, which so preoccupied U.S. monetary authorities less than a year ago, is now seen as “virtually nil”. Persistent slack in the economy, which can be seen in still significant unutilized capacity in a number of industries, continued strong pro-ductivity growth, and a lack of pricing power are expected to keep inflation moderate, with growth in the average CPI limited to 2.0%, down from 2.3% in 2003. Personal income is ex-pected to increase 4.5% in 2004, following an increase of 3.2% in 2003.
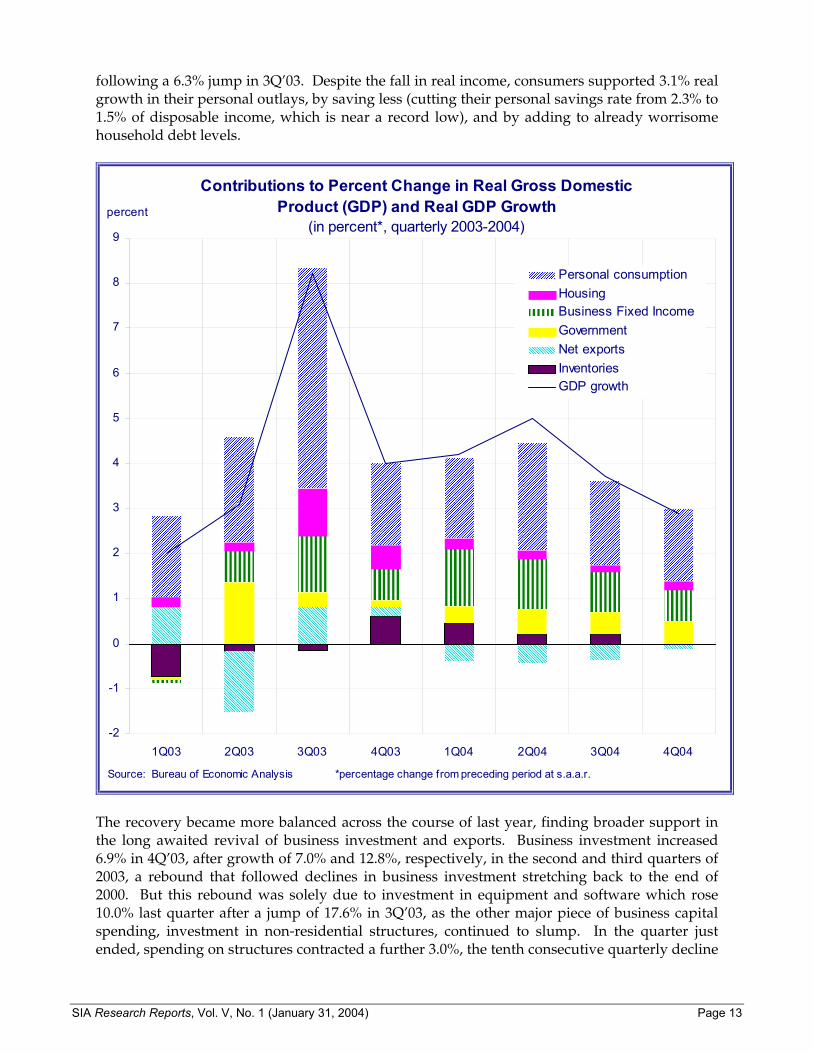
Growth Slows in 4Q 2003 But The Recovery Remains On Track Real GDP grew 4.0% at an annual rate1 in the 4Q’03, less than the 4.8% average that analysts’ had estimated, and well below the torrid 8.2 % pace in 3Q’03. A deceleration of growth was ex-pected as the impact of heavily front-loaded tax cuts and further monetary stimulus produced a surge in spending in the summer, before dissipating in the fall. However, growth in the final three months of 2003, while still strong, was less than anticipated, largely because both inven-tory accumulation and growth of consumer spending were below expectations. More in line with the consensus forecast were the contributions to the slowdown in overall economic growth that were made by more moderate growth of investment in business equipment and software and in residential housing and faster import growth. These factors were only partially offset by accelerating export growth and surprisingly modest inventory rebuilding. Real consumer spending2 increased 2.6% in 4Q’03, compared with a jump of 6.9% in 3Q’03, as durable goods purchases stalled, growing only 0.9% in the final three months of the year. Du-rable goods purchases, led by motor vehicle sales, had a tremendous 28.0% surge in the third quarter, as incentives “borrowed against future demand”, and no further advance was ex-pected. Similarly, real residential fixed investment increased 10.6% in 4Q’03, after booming growth of 21.9% in 3Q’03. Growth of household spending (the sum of consumer spending and residential construction), which provided the principal support for the economy for most of the past three years, slowed at end-2003, reflecting a 0.5% drop in real personal disposable income
1 Unless otherwise noted, this and other rates of growth for real GDP and its components are the percent change
from the preceding period at seasonally adjusted annual rates. 2 Personal consumption expenditures.
T
SIA Research Reports, Vol. V, No. 1 (January 31, 2004) Page 13
following a 6.3% jump in 3Q’03. Despite the fall in real income, consumers supported 3.1% real growth in their personal outlays, by saving less (cutting their personal savings rate from 2.3% to 1.5% of disposable income, which is near a record low), and by adding to already worrisome household debt levels.
������������������������������������������������ �������������
����������������������������������������������������
����������������������������������������������������
������������������������
������������������������
��������������������������
������������������������
������������
������������
���������������������������������������
����������������������������������������������������
������������������������������������
������������������������������������������������
�����������������������������������������������������������������
������������������������������������������������
������������������������������������
������������������������������������������������������������������������������������
��������������������������������������������������������������������������������������������������������
����������������������������������������������������������������������������������������������������������������������������������������������������������������������������������������������������������������
������������������������������������������������������������������������
������������������������������������������������������������������������
��������������������������������������������������������������������������������������������������������
������������������������������������������������������������������������������������
������������������������������������������������������������������������
Contributions to Percent Change in Real Gross Domestic Product (GDP) and Real GDP Growth
(in percent*, quarterly 2003-2004)
-2
-1
0
1
2
3
4
5
6
7
8
9
1Q03 2Q03 3Q03 4Q03 1Q04 2Q04 3Q04 4Q04
Source: Bureau of Economic Analysis *percentage change from preceding period at s.a.a.r.
percent
����������� Personal consumptionHousing�����������Business Fixed IncomeGovernment�����������
����������� Net exportsInventoriesGDP growth
The recovery became more balanced across the course of last year, finding broader support in the long awaited revival of business investment and exports. Business investment increased 6.9% in 4Q’03, after growth of 7.0% and 12.8%, respectively, in the second and third quarters of 2003, a rebound that followed declines in business investment stretching back to the end of 2000. But this rebound was solely due to investment in equipment and software which rose 10.0% last quarter after a jump of 17.6% in 3Q’03, as the other major piece of business capital spending, investment in non-residential structures, continued to slump. In the quarter just ended, spending on structures contracted a further 3.0%, the tenth consecutive quarterly decline

Page 14 SIA Research Reports Vol. V, No. 1 (January 31, 2004)
in this critical category of business spending, with two-thirds of those declines at double-digit annualized rates. Net exports of goods and services (exports minus imports) contributed 0.2 percentage points to the 4.0% rate of expansion for the economy in the final quarter of last year, compared to a con-tribution of 0.8 percentage points in 3Q’03. Export growth surged 19.1% in 4Q’03, as U.S. trade performance, with appropriate lags, began to reflect the significant on-going decline in the value of the dollar, particularly against the euro. However, efforts by Asian monetary authori-ties, particularly those in China and Japan, have, thus far, prevented the dollar from declining against those currencies to levels more reflective of economic fundamentals and more in line with market forces. Strong growth of final domestic demand in the U.S. spurred import growth, which rose to 11.3% in Q4’03, largely offsetting the positive impact of higher exports. Government spending continued to grow, albeit only at a 0.8% annual rate, and made only a modest positive contribution to overall growth of 0.2%, comparable to the contribution made by net exports during 4Q’03. Meanwhile, private inventory accumulation contributed 0.6 percent-age points to overall growth of 4.0 percent in the final quarter of the year. This largely reversed stock drawdowns in each of the first three quarters of last year, which cumulatively were equal to 1.0% of GDP.
Quarterly Change in After-Tax Corporate Profits*vs. S&P 500 Earnings(vs. same year earlier period)
-30%
-20%
-10%
0%
10%
20%
30%
40%
91 92 93 94 95 96 97 98 99 00 01 02 03
*after tax with inventory valuation and capital consumption adjustmentsSources: Bureau of Economic Analysis; Thomson First Call
S&P 500 EarningsCorporate Profits
4Q03 forecast
1991 1992 1993 1994 1995 1996 1997 1998 1999 2000 2001 2002 2003
The Outlook In January 2004, the savings rate fell further, to 1.3%, despite a rise in real incomes. Most indi-cators of activity for the month suggest that growth of consumer spending continuing at the same pace as in the quarter just ended, roughly 2.5% at an annual rate. Severe winter weather has not seemed to slow retail sales, nor have higher home heating bills. Consumer spending is
SIA Research Reports, Vol. V, No. 1 (January 31, 2004) Page 15
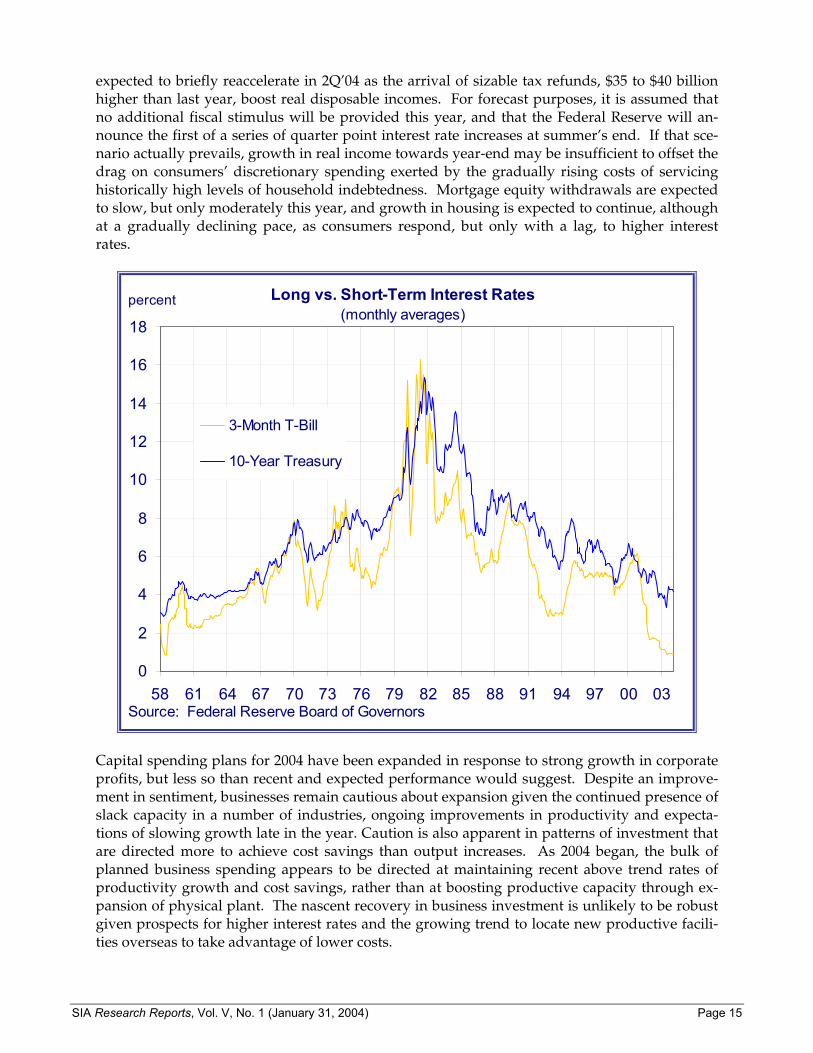
expected to briefly reaccelerate in 2Q’04 as the arrival of sizable tax refunds, $35 to $40 billion higher than last year, boost real disposable incomes. For forecast purposes, it is assumed that no additional fiscal stimulus will be provided this year, and that the Federal Reserve will an-nounce the first of a series of quarter point interest rate increases at summer’s end. If that sce-nario actually prevails, growth in real income towards year-end may be insufficient to offset the drag on consumers’ discretionary spending exerted by the gradually rising costs of servicing historically high levels of household indebtedness. Mortgage equity withdrawals are expected to slow, but only moderately this year, and growth in housing is expected to continue, although at a gradually declining pace, as consumers respond, but only with a lag, to higher interest rates.
Long vs. Short-Term Interest Rates(monthly averages)
0
2
4
6
8
10
12
14
16
18
58 61 64 67 70 73 76 79 82 85 88 91 94 97 00 03Source: Federal Reserve Board of Governors
percent
3-Month T-Bill
10-Year Treasury
Capital spending plans for 2004 have been expanded in response to strong growth in corporate profits, but less so than recent and expected performance would suggest. Despite an improve-ment in sentiment, businesses remain cautious about expansion given the continued presence of slack capacity in a number of industries, ongoing improvements in productivity and expecta-tions of slowing growth late in the year. Caution is also apparent in patterns of investment that are directed more to achieve cost savings than output increases. As 2004 began, the bulk of planned business spending appears to be directed at maintaining recent above trend rates of productivity growth and cost savings, rather than at boosting productive capacity through ex-pansion of physical plant. The nascent recovery in business investment is unlikely to be robust given prospects for higher interest rates and the growing trend to locate new productive facili-ties overseas to take advantage of lower costs.

Page 16 SIA Research Reports Vol. V, No. 1 (January 31, 2004)
Export growth is expected to remain a small, albeit growing contributor to the ongoing recov-ery, more than offsetting continued high, though slowing import growth. Chinese and Japanese exchange rate policies and the resultant large U.S. bilateral trade imbalances with those coun-tries are expected to persist, while the overall current account deficit of the U.S., already at wor-risome levels, should stabilize this year.
Monetary Policy: A Nod to Inflation and Higher Interest Rates These forecasts depend importantly upon the assumption, which is already priced into the markets, that a tightening phase of monetary policy will begin with a 25 basis point (a quarter of a percentage point) increase in base interest rates in August 2004, followed by one or two matching increases, raising the Fed Funds rate to 1.5% or 1.75% by year end. When the Fed ac-tually moves and how frequently depends on whether assumptions about the evolution of a several variables in the first half of this year, prove to be correct. These assumptions include that the recent rise in leading indicators of inflation actually results in some acceleration in core consumer prices and that there is a clear, sustained pickup in the job market reflecting the con-tinued solid growth outlined above. Recently released Fed statements appear to support this view, and were seen by the market to be a nod towards higher interest rates. “Fed officials likely wanted to signal greater probability of tightening in 2004 than had been priced into the markets” observed one economist and they did so in an effective, well timed manner. Yields on 10-year Treasury bonds had recently sunk, but moved quickly back into the middle of a trading range of 4.1% to 4.4% following the conclu-sion of the recent two-day meeting of the Federal Open Market Committee (“FOMC”) on Janu-ary 28th. Repeating past encouraging comments about the U.S. economy, the Fed left un-changed both its target for the Fed Funds rate at 1% and its “balance of risks” statement (the upside and downside risks to attaining sustainable growth over the coming few quarters are roughly equal). But the markets did perceive a significant change in that the FOMC replaced the phrase “the Committee believes policy accommodation can be maintained for a considerable period” with “the Committee believes it can be patient in removing its policy accommodation”. The market may have made more of this change than it deserves. First, it is worth noting that Mr. Greenspan had already dropped the earlier phrasing in his address to the SIA Annual Con-ference in early November 2003. The tone and phrasing may have changed, but the underlying message being sent has not. The timing of any increase in interest rates is tied to inflation and resource usage. The Fed did, however, gain much-valued flexibility to move if and when it deemed necessary and to continue to tie any change in monetary policy and interest rates to the evolution of economic data on employment and inflation in the “next quarters” and gradually eased the market towards recognition that the probability of interest rate increases is rising. The release of the minutes of the previous, December 9, FOMC meeting showed differing views and considerable debate about dropping the “considerable period” language and seemed to confirm the belief that the actual change at the following meeting was largely “tactical” in na-ture; designed to gain flexibility by removing an open-ended commitment, rather than intended to give any indication that tightening was imminent, or that there was any less of a commitment to keeping the Fed Funds rate at 1%, ...at least for now. Frank A. Fernandez Senior Vice President, Chief Economist and Director, Research

SIA Research Reports, Vol. V, No. 1 (January 31, 2004) Page 17
SIA Economic Outlook
INDICATOR (annual average % change, unless noted)
US OUTPUT 2000 2001 2002 2003 2004
Real GDP 3.7 0.5 2.2 3.1 4.5
Private Consumption 4.7 2.5 3.4 3.1 2.7
Business Investment 8.7 -4.5 -7.2 2.8 9.0
Residential Investment 0.8 0.4 4.9 7.6 3.8
Government spending 2.7 3.7 4.4 3.4 2.6
Exports 8.7 -5.2 -2.4 1.9 8.9
Imports 13.1 -2.6 3.3 3.7 4.0 Net Exports* -379.5 -398.1 -470.6 -505.5 -475.1
Change in Inventories* 56.5 -36.0 5.7 -1.5 60.0
*In billions of chained 2000 dollars.
Page 18 SIA Research Reports Vol. V, No. 1 (January 31, 2004)
MONTHLY STATISTICAL REVIEW
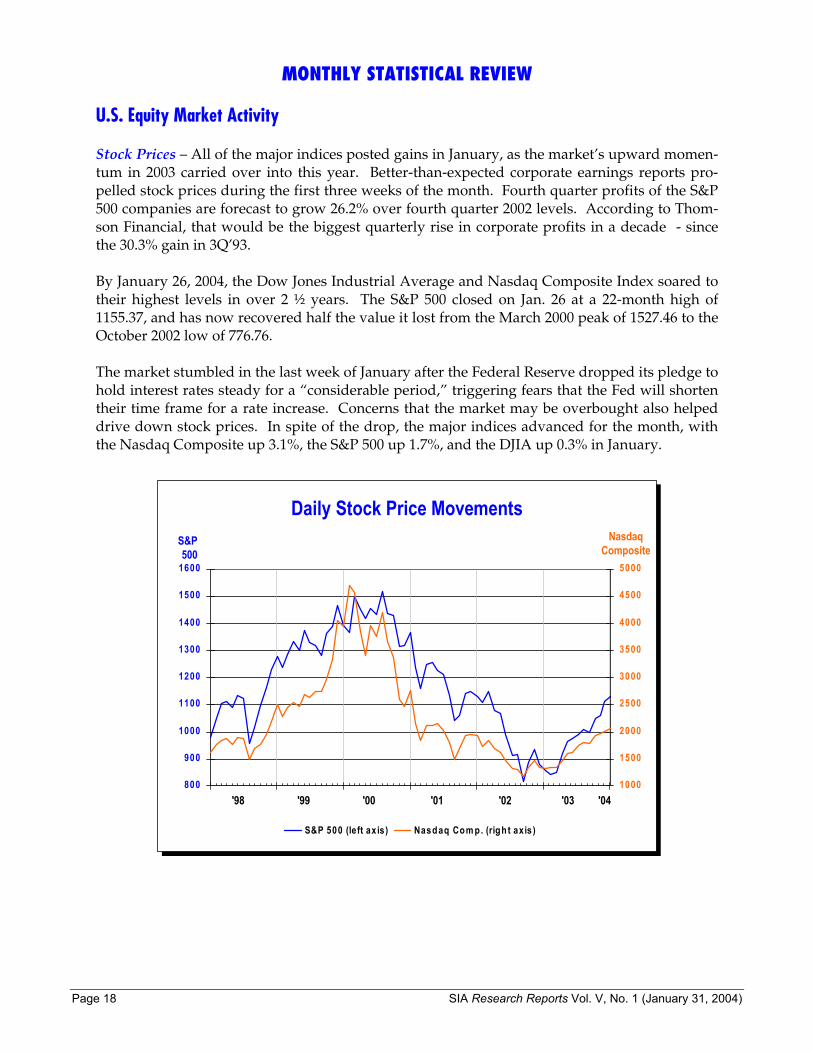
U.S. Equity Market Activity Stock Prices – All of the major indices posted gains in January, as the market’s upward momen-tum in 2003 carried over into this year. Better-than-expected corporate earnings reports pro-pelled stock prices during the first three weeks of the month. Fourth quarter profits of the S&P 500 companies are forecast to grow 26.2% over fourth quarter 2002 levels. According to Thom-son Financial, that would be the biggest quarterly rise in corporate profits in a decade - since the 30.3% gain in 3Q’93. By January 26, 2004, the Dow Jones Industrial Average and Nasdaq Composite Index soared to their highest levels in over 2 ½ years. The S&P 500 closed on Jan. 26 at a 22-month high of 1155.37, and has now recovered half the value it lost from the March 2000 peak of 1527.46 to the October 2002 low of 776.76. The market stumbled in the last week of January after the Federal Reserve dropped its pledge to hold interest rates steady for a “considerable period,” triggering fears that the Fed will shorten their time frame for a rate increase. Concerns that the market may be overbought also helped drive down stock prices. In spite of the drop, the major indices advanced for the month, with the Nasdaq Composite up 3.1%, the S&P 500 up 1.7%, and the DJIA up 0.3% in January.
800
900
1000
1100
1200
1300
1400
1500
1600
98 99 00 01 02 03 041000
1500
2000
2500
3000
3500
4000
4500
5000
S&P 500 (left ax is) Nasdaq Com p. (righ t axis)
S&P500
Daily Stock Price MovementsNasdaq
Composite
'98 '99 '00 '01 '02 '03 '04
SIA Research Reports, Vol. V, No. 1 (January 31, 2004) Page 19
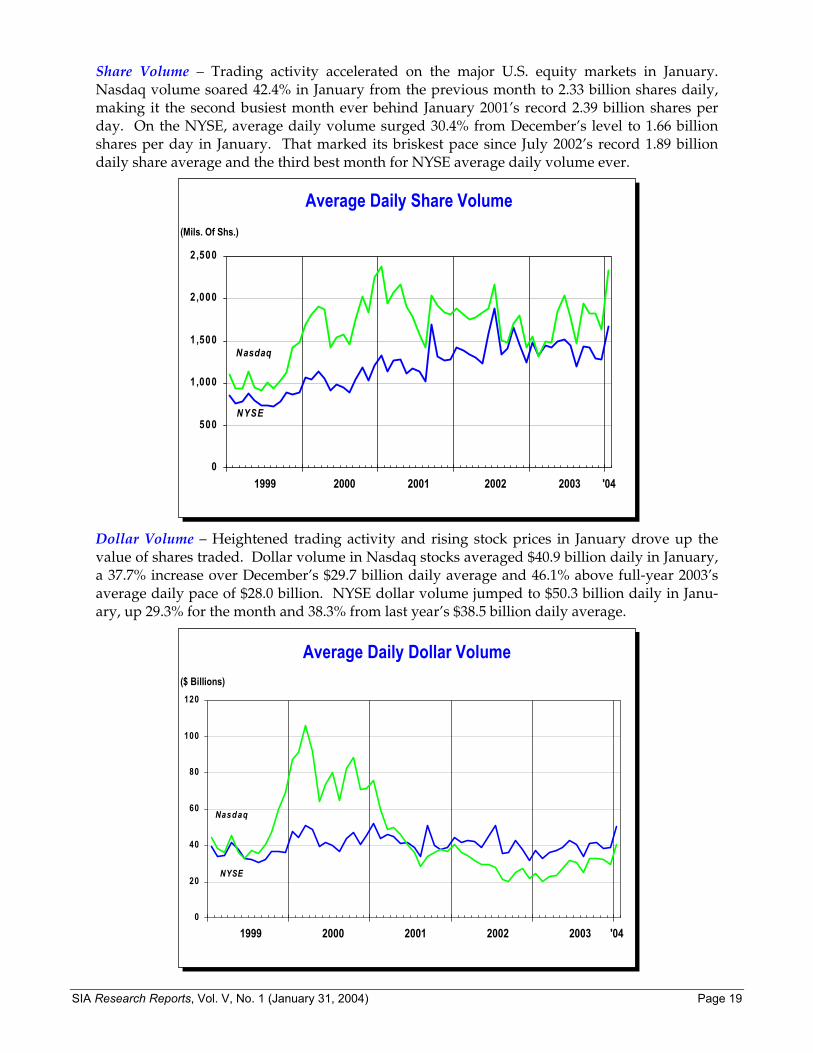
Share Volume – Trading activity accelerated on the major U.S. equity markets in January. Nasdaq volume soared 42.4% in January from the previous month to 2.33 billion shares daily, making it the second busiest month ever behind January 2001’s record 2.39 billion shares per day. On the NYSE, average daily volume surged 30.4% from December’s level to 1.66 billion shares per day in January. That marked its briskest pace since July 2002’s record 1.89 billion daily share average and the third best month for NYSE average daily volume ever.
(Mils. Of Shs.)
0
500
1,000
1,500
2,000
2,500
99 00 01 02 03 04
Nasdaq
NYSE
Average Daily Share Volume
1999 2000 2001 2002 2003 '04
Dollar Volume – Heightened trading activity and rising stock prices in January drove up the value of shares traded. Dollar volume in Nasdaq stocks averaged $40.9 billion daily in January, a 37.7% increase over December’s $29.7 billion daily average and 46.1% above full-year 2003’s average daily pace of $28.0 billion. NYSE dollar volume jumped to $50.3 billion daily in Janu-ary, up 29.3% for the month and 38.3% from last year’s $38.5 billion daily average.
($ Billions)
Average Daily Dollar Volume
0
20
40
60
80
100
120
99 00 01 02 03 04
Nasdaq
NYSE
1999 2000 2001 2002 2003 '04
Page 20 SIA Research Reports Vol. V, No. 1 (January 31, 2004)
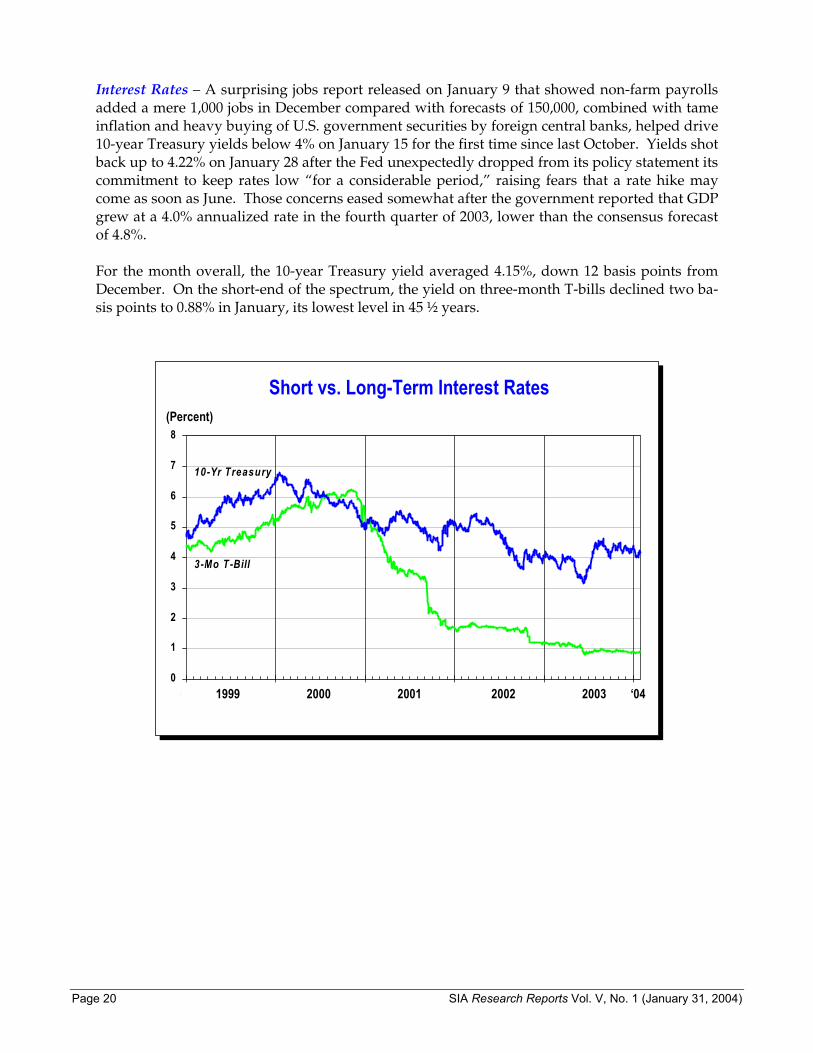
Interest Rates – A surprising jobs report released on January 9 that showed non-farm payrolls added a mere 1,000 jobs in December compared with forecasts of 150,000, combined with tame inflation and heavy buying of U.S. government securities by foreign central banks, helped drive 10-year Treasury yields below 4% on January 15 for the first time since last October. Yields shot back up to 4.22% on January 28 after the Fed unexpectedly dropped from its policy statement its commitment to keep rates low “for a considerable period,” raising fears that a rate hike may come as soon as June. Those concerns eased somewhat after the government reported that GDP grew at a 4.0% annualized rate in the fourth quarter of 2003, lower than the consensus forecast of 4.8%. For the month overall, the 10-year Treasury yield averaged 4.15%, down 12 basis points from December. On the short-end of the spectrum, the yield on three-month T-bills declined two ba-sis points to 0.88% in January, its lowest level in 45 ½ years.
Short vs. Long-Term Interest Rates
0
1
2
3
4
5
6
7
8
99 00 01 02 03 04
3-Mo T-Bill
10-Yr Treasury
(Percent)
1999 2000 2001 2002 2003 ‘04
SIA Research Reports, Vol. V, No. 1 (January 31, 2004) Page 21
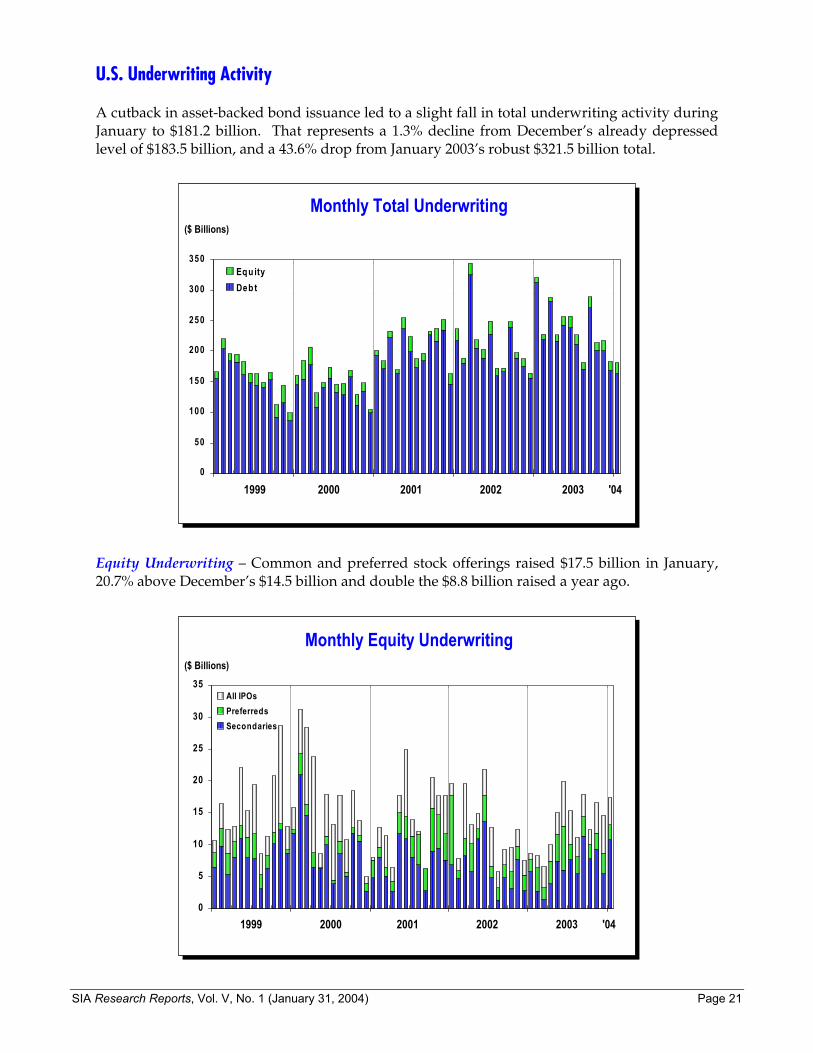
U.S. Underwriting Activity A cutback in asset-backed bond issuance led to a slight fall in total underwriting activity during January to $181.2 billion. That represents a 1.3% decline from December’s already depressed level of $183.5 billion, and a 43.6% drop from January 2003’s robust $321.5 billion total.
($ Billions)
Monthly Total Underwriting
0
50
100
150
200
250
300
350
99 00 01 02 03 04
Equ ityDebt
1999 2000 2001 2002 2003 '04
Equity Underwriting – Common and preferred stock offerings raised $17.5 billion in January, 20.7% above December’s $14.5 billion and double the $8.8 billion raised a year ago.
($ Billions)
Monthly Equity Underwriting
0
5
10
15
20
25
30
35
99 00 01 02 03 04
All IPOsPreferredsSecondaries
1999 2000 2001 2002 2003 '04
Page 22 SIA Research Reports Vol. V, No. 1 (January 31, 2004)
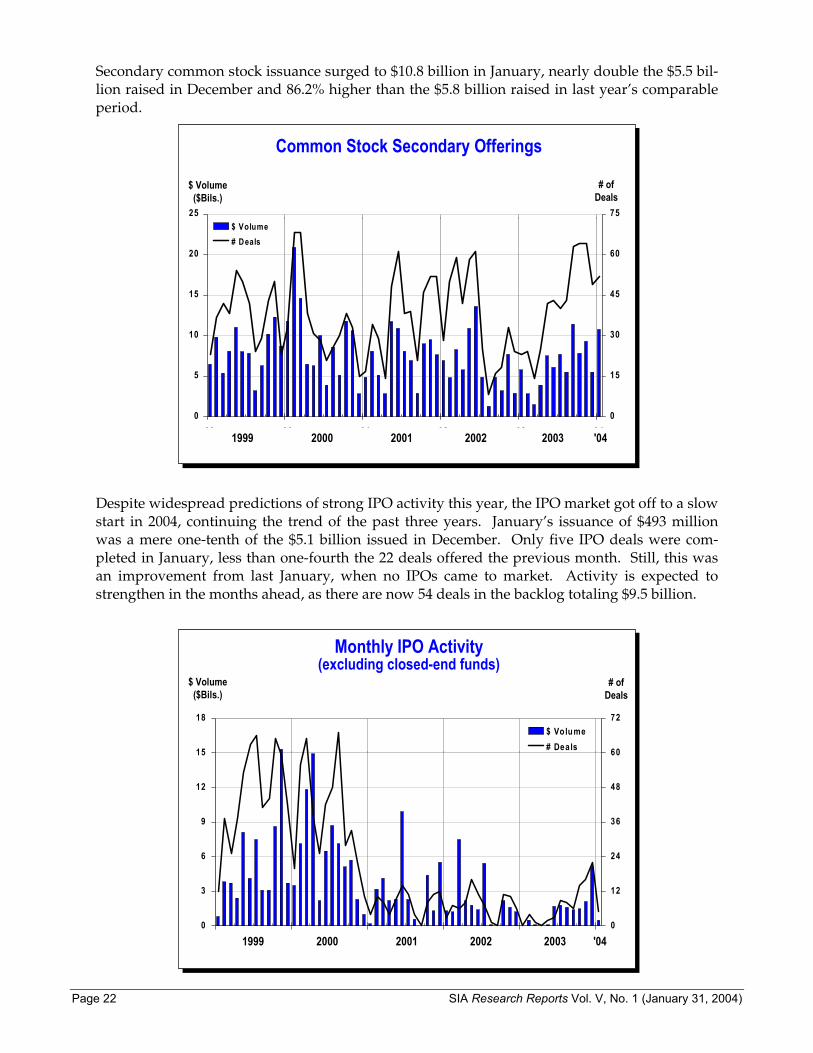
Secondary common stock issuance surged to $10.8 billion in January, nearly double the $5.5 bil-lion raised in December and 86.2% higher than the $5.8 billion raised in last year’s comparable period.
Common Stock Secondary Offerings
0
5
10
15
20
25
99 00 01 02 03 040
15
30
45
60
75$ Volume# Deals
$ Volume ($Bils.)
# of Deals
1999 2000 2001 2002 2003 '04
Despite widespread predictions of strong IPO activity this year, the IPO market got off to a slow start in 2004, continuing the trend of the past three years. January’s issuance of $493 million was a mere one-tenth of the $5.1 billion issued in December. Only five IPO deals were com-pleted in January, less than one-fourth the 22 deals offered the previous month. Still, this was an improvement from last January, when no IPOs came to market. Activity is expected to strengthen in the months ahead, as there are now 54 deals in the backlog totaling $9.5 billion.
Monthly IPO Activity(excluding closed-end funds)
0
3
6
9
12
15
18
99 00 01 02 03 040
12
24
36
48
60
72$ Volume# Deals
$ Volume ($Bils.)
# of Deals
1999 2000 2001 2002 2003 '04

SIA Research Reports, Vol. V, No. 1 (January 31, 2004) Page 23
Corporate Bond Underwriting – New issuance of corporate bonds sank to a 13-month low of $163.7 billion in January, down 3.1% from December and 47.6% below the $312.7 billion offered a year ago.
Monthly Corporate Debt Underwriting
0
50
100
150
200
250
300
350
99 00 01 02 03 04
Asset-Backed
Co n verts
Stra igh t Deb t
($ Billions)
1999 2000 2001 2002 2003 '04
Anemic asset-backed bond volume accounted for the drop-off in overall bond underwriting during January. Asset-backed securities issuance tumbled 21.9% from December’s paltry level to $46.3 billion in January, its slowest pace since April 2001. This contrasts sharply with last January, when a record $162.5 billion was issued during the boom in mortgage refinancing ac-tivity. Grace Toto Vice President and Director, Statistics
Page 24 SIA Research Reports Vol. V, No. 1 (January 31, 2004)
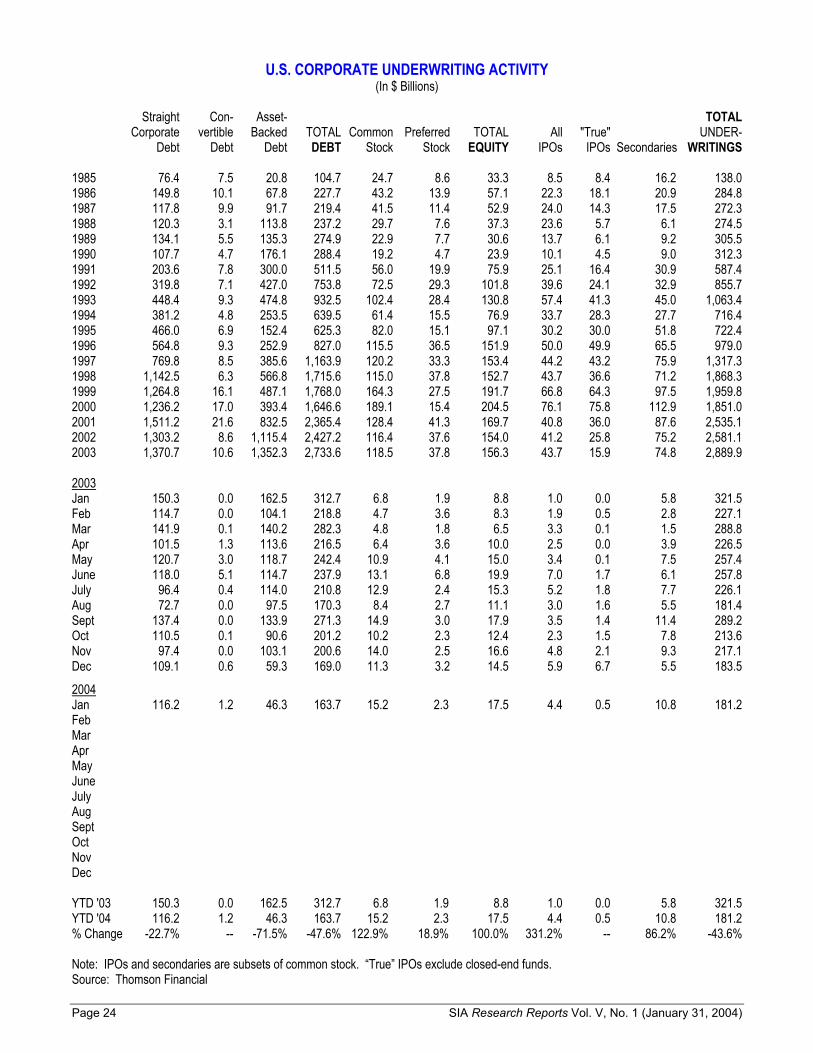
U.S. CORPORATE UNDERWRITING ACTIVITY (In $ Billions)
Straight Con- Asset- TOTAL Corporate vertible Backed TOTAL Common Preferred TOTAL All "True" UNDER- Debt Debt Debt DEBT Stock Stock EQUITY IPOs IPOs Secondaries WRITINGS 1985 76.4 7.5 20.8 104.7 24.7 8.6 33.3 8.5 8.4 16.2 138.0 1986 149.8 10.1 67.8 227.7 43.2 13.9 57.1 22.3 18.1 20.9 284.8 1987 117.8 9.9 91.7 219.4 41.5 11.4 52.9 24.0 14.3 17.5 272.3 1988 120.3 3.1 113.8 237.2 29.7 7.6 37.3 23.6 5.7 6.1 274.5 1989 134.1 5.5 135.3 274.9 22.9 7.7 30.6 13.7 6.1 9.2 305.5 1990 107.7 4.7 176.1 288.4 19.2 4.7 23.9 10.1 4.5 9.0 312.3 1991 203.6 7.8 300.0 511.5 56.0 19.9 75.9 25.1 16.4 30.9 587.4 1992 319.8 7.1 427.0 753.8 72.5 29.3 101.8 39.6 24.1 32.9 855.7 1993 448.4 9.3 474.8 932.5 102.4 28.4 130.8 57.4 41.3 45.0 1,063.4 1994 381.2 4.8 253.5 639.5 61.4 15.5 76.9 33.7 28.3 27.7 716.4 1995 466.0 6.9 152.4 625.3 82.0 15.1 97.1 30.2 30.0 51.8 722.4 1996 564.8 9.3 252.9 827.0 115.5 36.5 151.9 50.0 49.9 65.5 979.0 1997 769.8 8.5 385.6 1,163.9 120.2 33.3 153.4 44.2 43.2 75.9 1,317.3 1998 1,142.5 6.3 566.8 1,715.6 115.0 37.8 152.7 43.7 36.6 71.2 1,868.3 1999 1,264.8 16.1 487.1 1,768.0 164.3 27.5 191.7 66.8 64.3 97.5 1,959.8 2000 1,236.2 17.0 393.4 1,646.6 189.1 15.4 204.5 76.1 75.8 112.9 1,851.0 2001 1,511.2 21.6 832.5 2,365.4 128.4 41.3 169.7 40.8 36.0 87.6 2,535.1 2002 1,303.2 8.6 1,115.4 2,427.2 116.4 37.6 154.0 41.2 25.8 75.2 2,581.1 2003 1,370.7 10.6 1,352.3 2,733.6 118.5 37.8 156.3 43.7 15.9 74.8 2,889.9 2003 Jan 150.3 0.0 162.5 312.7 6.8 1.9 8.8 1.0 0.0 5.8 321.5 Feb 114.7 0.0 104.1 218.8 4.7 3.6 8.3 1.9 0.5 2.8 227.1 Mar 141.9 0.1 140.2 282.3 4.8 1.8 6.5 3.3 0.1 1.5 288.8 Apr 101.5 1.3 113.6 216.5 6.4 3.6 10.0 2.5 0.0 3.9 226.5 May 120.7 3.0 118.7 242.4 10.9 4.1 15.0 3.4 0.1 7.5 257.4 June 118.0 5.1 114.7 237.9 13.1 6.8 19.9 7.0 1.7 6.1 257.8 July 96.4 0.4 114.0 210.8 12.9 2.4 15.3 5.2 1.8 7.7 226.1 Aug 72.7 0.0 97.5 170.3 8.4 2.7 11.1 3.0 1.6 5.5 181.4 Sept 137.4 0.0 133.9 271.3 14.9 3.0 17.9 3.5 1.4 11.4 289.2 Oct 110.5 0.1 90.6 201.2 10.2 2.3 12.4 2.3 1.5 7.8 213.6 Nov 97.4 0.0 103.1 200.6 14.0 2.5 16.6 4.8 2.1 9.3 217.1 Dec 109.1 0.6 59.3 169.0 11.3 3.2 14.5 5.9 6.7 5.5 183.5
2004 Jan 116.2 1.2 46.3 163.7 15.2 2.3 17.5 4.4 0.5 10.8 181.2 Feb Mar Apr May June July Aug Sept Oct Nov Dec YTD '03 150.3 0.0 162.5 312.7 6.8 1.9 8.8 1.0 0.0 5.8 321.5 YTD '04 116.2 1.2 46.3 163.7 15.2 2.3 17.5 4.4 0.5 10.8 181.2 % Change -22.7% -- -71.5% -47.6% 122.9% 18.9% 100.0% 331.2% -- 86.2% -43.6% Note: IPOs and secondaries are subsets of common stock. “True” IPOs exclude closed-end funds. Source: Thomson Financial
SIA Research Reports, Vol. V, No. 1 (January 31, 2004) Page 25
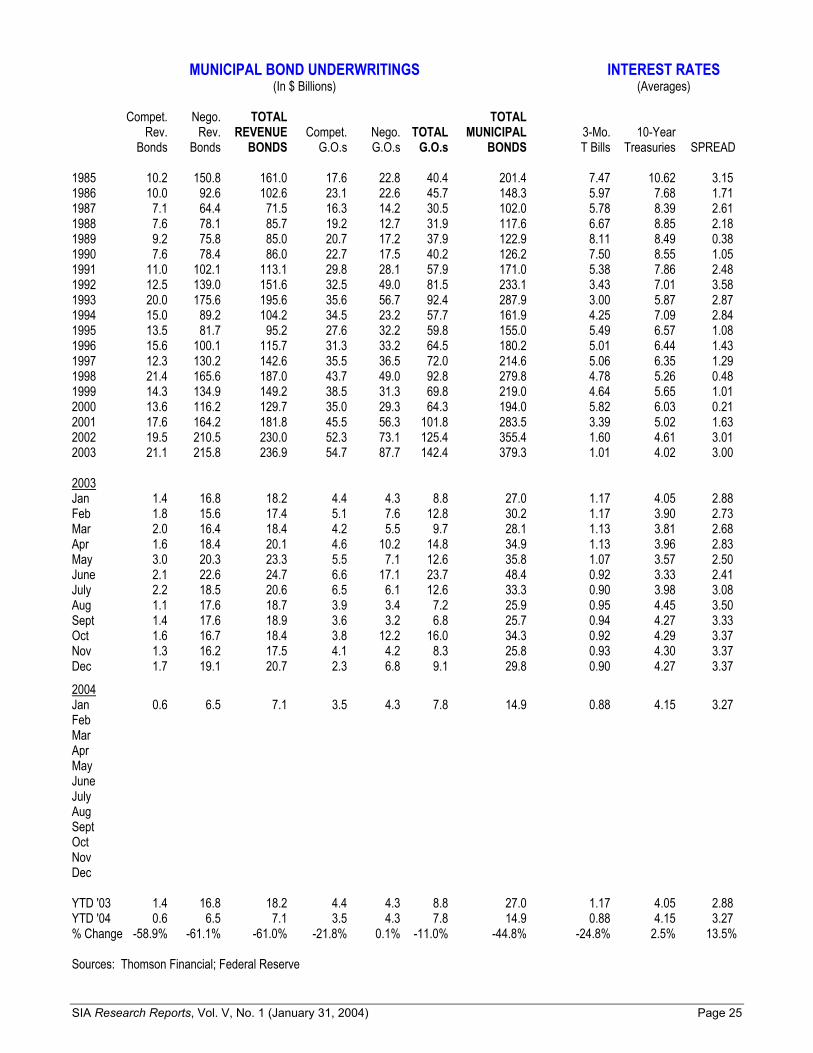
MUNICIPAL BOND UNDERWRITINGS INTEREST RATES (In $ Billions) (Averages) Compet. Nego. TOTAL TOTAL Rev. Rev. REVENUE Compet. Nego. TOTAL MUNICIPAL 3-Mo. 10-Year Bonds Bonds BONDS G.O.s G.O.s G.O.s BONDS T Bills Treasuries SPREAD 1985 10.2 150.8 161.0 17.6 22.8 40.4 201.4 7.47 10.62 3.15 1986 10.0 92.6 102.6 23.1 22.6 45.7 148.3 5.97 7.68 1.71 1987 7.1 64.4 71.5 16.3 14.2 30.5 102.0 5.78 8.39 2.61 1988 7.6 78.1 85.7 19.2 12.7 31.9 117.6 6.67 8.85 2.18 1989 9.2 75.8 85.0 20.7 17.2 37.9 122.9 8.11 8.49 0.38 1990 7.6 78.4 86.0 22.7 17.5 40.2 126.2 7.50 8.55 1.05 1991 11.0 102.1 113.1 29.8 28.1 57.9 171.0 5.38 7.86 2.48 1992 12.5 139.0 151.6 32.5 49.0 81.5 233.1 3.43 7.01 3.58 1993 20.0 175.6 195.6 35.6 56.7 92.4 287.9 3.00 5.87 2.87 1994 15.0 89.2 104.2 34.5 23.2 57.7 161.9 4.25 7.09 2.84 1995 13.5 81.7 95.2 27.6 32.2 59.8 155.0 5.49 6.57 1.08 1996 15.6 100.1 115.7 31.3 33.2 64.5 180.2 5.01 6.44 1.43 1997 12.3 130.2 142.6 35.5 36.5 72.0 214.6 5.06 6.35 1.29 1998 21.4 165.6 187.0 43.7 49.0 92.8 279.8 4.78 5.26 0.48 1999 14.3 134.9 149.2 38.5 31.3 69.8 219.0 4.64 5.65 1.01 2000 13.6 116.2 129.7 35.0 29.3 64.3 194.0 5.82 6.03 0.21 2001 17.6 164.2 181.8 45.5 56.3 101.8 283.5 3.39 5.02 1.63 2002 19.5 210.5 230.0 52.3 73.1 125.4 355.4 1.60 4.61 3.01 2003 21.1 215.8 236.9 54.7 87.7 142.4 379.3 1.01 4.02 3.00 2003 Jan 1.4 16.8 18.2 4.4 4.3 8.8 27.0 1.17 4.05 2.88 Feb 1.8 15.6 17.4 5.1 7.6 12.8 30.2 1.17 3.90 2.73 Mar 2.0 16.4 18.4 4.2 5.5 9.7 28.1 1.13 3.81 2.68 Apr 1.6 18.4 20.1 4.6 10.2 14.8 34.9 1.13 3.96 2.83 May 3.0 20.3 23.3 5.5 7.1 12.6 35.8 1.07 3.57 2.50 June 2.1 22.6 24.7 6.6 17.1 23.7 48.4 0.92 3.33 2.41 July 2.2 18.5 20.6 6.5 6.1 12.6 33.3 0.90 3.98 3.08 Aug 1.1 17.6 18.7 3.9 3.4 7.2 25.9 0.95 4.45 3.50 Sept 1.4 17.6 18.9 3.6 3.2 6.8 25.7 0.94 4.27 3.33 Oct 1.6 16.7 18.4 3.8 12.2 16.0 34.3 0.92 4.29 3.37 Nov 1.3 16.2 17.5 4.1 4.2 8.3 25.8 0.93 4.30 3.37 Dec 1.7 19.1 20.7 2.3 6.8 9.1 29.8 0.90 4.27 3.37
2004 Jan 0.6 6.5 7.1 3.5 4.3 7.8 14.9 0.88 4.15 3.27 Feb Mar Apr May June July Aug Sept Oct Nov Dec YTD '03 1.4 16.8 18.2 4.4 4.3 8.8 27.0 1.17 4.05 2.88 YTD '04 0.6 6.5 7.1 3.5 4.3 7.8 14.9 0.88 4.15 3.27 % Change -58.9% -61.1% -61.0% -21.8% 0.1% -11.0% -44.8% -24.8% 2.5% 13.5% Sources: Thomson Financial; Federal Reserve

Page 26 SIA Research Reports Vol. V, No. 1 (January 31, 2004)
STOCK MARKET PERFORMANCE INDICES STOCK MARKET VOLUME VALUE TRADED (End of Period) (Daily Avg., Mils. of Shs.) (Daily Avg., $ Bils.) Dow Jones Industrial S&P NYSE Nasdaq Average 500 Composite Composite NYSE AMEX Nasdaq NYSE Nasdaq 1985 1,546.67 211.28 1,285.66 324.93 109.2 8.3 82.1 3.9 0.9 1986 1,895.95 242.17 1,465.31 348.83 141.0 11.8 113.6 5.4 1.5 1987 1,938.83 247.08 1,461.61 330.47 188.9 13.9 149.8 7.4 2.0 1988 2,168.57 277.72 1,652.25 381.38 161.5 9.9 122.8 5.4 1.4 1989 2,753.20 353.40 2,062.30 454.82 165.5 12.4 133.1 6.1 1.7 1990 2,633.66 330.22 1,908.45 373.84 156.8 13.2 131.9 5.2 1.8 1991 3,168.83 417.09 2,426.04 586.34 178.9 13.3 163.3 6.0 2.7 1992 3,301.11 435.71 2,539.92 676.95 202.3 14.2 190.8 6.9 3.5 1993 3,754.09 466.45 2,739.44 776.80 264.5 18.1 263.0 9.0 5.3 1994 3,834.44 459.27 2,653.37 751.96 291.4 17.9 295.1 9.7 5.8 1995 5,117.12 615.93 3,484.15 1,052.13 346.1 20.1 401.4 12.2 9.5 1996 6,448.27 740.74 4,148.07 1,291.03 412.0 22.1 543.7 16.0 13.0 1997 7,908.25 970.43 5,405.19 1,570.35 526.9 24.4 647.8 22.8 17.7 1998 9,181.43 1,229.23 6,299.93 2,192.69 673.6 28.9 801.7 29.0 22.9 1999 11,497.12 1,469.25 6,876.10 4,069.31 808.9 32.7 1,081.8 35.5 43.7 2000 10,786.85 1,320.28 6,945.57 2,470.52 1,041.6 52.9 1,757.0 43.9 80.9 2001 10,021.50 1,148.08 6,236.39 1,950.40 1,240.0 65.8 1,900.1 42.3 44.1 2002 8,341.63 879.82 5,000.00 1,335.51 1,441.0 63.7 1,752.8 40.9 28.8 2003 10,453.92 1,111.92 6,464.00 2,003.37 1,398.4 67.1 1,685.5 38.5 28.0 2003 Jan 8,053.81 855.70 4,868.68 1,320.91 1,474.7 62.9 1,547.6 37.5 24.7 Feb 7,891.08 841.15 4,716.07 1,337.52 1,336.4 53.6 1,311.4 32.8 20.4 Mar 7,992.13 848.18 4,730.21 1,341.17 1,439.3 64.7 1,499.9 36.3 23.0 Apr 8,480.09 916.92 5,131.56 1,464.31 1,422.7 54.7 1,478.2 37.1 23.5 May 8,850.26 963.59 5,435.37 1,595.91 1,488.6 69.6 1,847.9 39.2 27.4 June 8,985.44 974.50 5505.17 1,622.80 1,516.3 79.5 2,032.2 42.7 32.0 July 9,233.80 990.31 5,558.99 1,735.02 1,451.1 67.4 1,771.7 40.7 30.5 Aug 9,415.82 1,008.01 5,660.16 1,810.45 1,200.3 57.7 1,470.8 34.1 25.3 Sept 9,275.06 995.97 5,644.03 1,786.94 1,436.7 83.9 1,943.2 41.1 33.0 Oct 9,801.12 1,050.71 5,959.01 1,932.21 1,430.0 68.6 1,827.1 41.7 33.1 Nov 9,782.46 1,058.20 6,073.02 1,960.26 1,293.3 71.7 1,821.0 38.5 32.4 Dec 10,453.92 1,111.92 6,464.00 2,003.37 1,275.7 70.4 1,637.0 38.9 29.7
2004 Jan 10,488.07 1,131.13 6,551.63 2,066.15 1,663.1 82.5 2,331.7 50.3 40.9 Feb Mar Apr May June July Aug Sept Oct Nov Dec YTD '03 8,053.81 855.70 4,868.68 1,320.91 1,474.7 62.9 1,547.6 37.5 24.7 YTD '04 10,488.07 1,131.13 6,551.63 2,066.15 1,663.1 82.5 2,331.7 50.3 40.9 % Change 30.2% 32.2% 34.6% 56.4% 12.8% 31.2% 50.7% 34.3% 65.1%
SIA Research Reports, Vol. V, No. 1 (January 31, 2004) Page 27
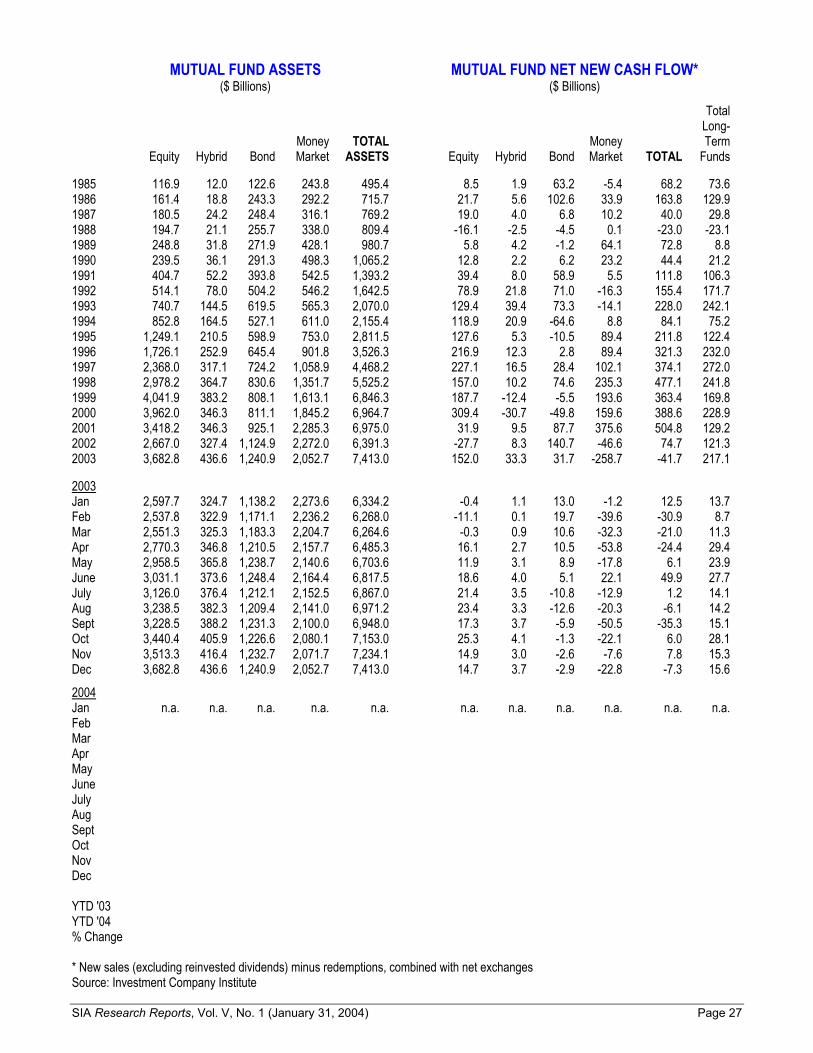
MUTUAL FUND ASSETS MUTUAL FUND NET NEW CASH FLOW* ($ Billions) ($ Billions)
Total Long- Money TOTAL Money Term Equity Hybrid Bond Market ASSETS Equity Hybrid Bond Market TOTAL Funds 1985 116.9 12.0 122.6 243.8 495.4 8.5 1.9 63.2 -5.4 68.2 73.6 1986 161.4 18.8 243.3 292.2 715.7 21.7 5.6 102.6 33.9 163.8 129.9 1987 180.5 24.2 248.4 316.1 769.2 19.0 4.0 6.8 10.2 40.0 29.8 1988 194.7 21.1 255.7 338.0 809.4 -16.1 -2.5 -4.5 0.1 -23.0 -23.1 1989 248.8 31.8 271.9 428.1 980.7 5.8 4.2 -1.2 64.1 72.8 8.8 1990 239.5 36.1 291.3 498.3 1,065.2 12.8 2.2 6.2 23.2 44.4 21.2 1991 404.7 52.2 393.8 542.5 1,393.2 39.4 8.0 58.9 5.5 111.8 106.3 1992 514.1 78.0 504.2 546.2 1,642.5 78.9 21.8 71.0 -16.3 155.4 171.7 1993 740.7 144.5 619.5 565.3 2,070.0 129.4 39.4 73.3 -14.1 228.0 242.1 1994 852.8 164.5 527.1 611.0 2,155.4 118.9 20.9 -64.6 8.8 84.1 75.2 1995 1,249.1 210.5 598.9 753.0 2,811.5 127.6 5.3 -10.5 89.4 211.8 122.4 1996 1,726.1 252.9 645.4 901.8 3,526.3 216.9 12.3 2.8 89.4 321.3 232.0 1997 2,368.0 317.1 724.2 1,058.9 4,468.2 227.1 16.5 28.4 102.1 374.1 272.0 1998 2,978.2 364.7 830.6 1,351.7 5,525.2 157.0 10.2 74.6 235.3 477.1 241.8 1999 4,041.9 383.2 808.1 1,613.1 6,846.3 187.7 -12.4 -5.5 193.6 363.4 169.8 2000 3,962.0 346.3 811.1 1,845.2 6,964.7 309.4 -30.7 -49.8 159.6 388.6 228.9 2001 3,418.2 346.3 925.1 2,285.3 6,975.0 31.9 9.5 87.7 375.6 504.8 129.2 2002 2,667.0 327.4 1,124.9 2,272.0 6,391.3 -27.7 8.3 140.7 -46.6 74.7 121.3 2003 3,682.8 436.6 1,240.9 2,052.7 7,413.0 152.0 33.3 31.7 -258.7 -41.7 217.1 2003 Jan 2,597.7 324.7 1,138.2 2,273.6 6,334.2 -0.4 1.1 13.0 -1.2 12.5 13.7 Feb 2,537.8 322.9 1,171.1 2,236.2 6,268.0 -11.1 0.1 19.7 -39.6 -30.9 8.7 Mar 2,551.3 325.3 1,183.3 2,204.7 6,264.6 -0.3 0.9 10.6 -32.3 -21.0 11.3 Apr 2,770.3 346.8 1,210.5 2,157.7 6,485.3 16.1 2.7 10.5 -53.8 -24.4 29.4 May 2,958.5 365.8 1,238.7 2,140.6 6,703.6 11.9 3.1 8.9 -17.8 6.1 23.9 June 3,031.1 373.6 1,248.4 2,164.4 6,817.5 18.6 4.0 5.1 22.1 49.9 27.7 July 3,126.0 376.4 1,212.1 2,152.5 6,867.0 21.4 3.5 -10.8 -12.9 1.2 14.1 Aug 3,238.5 382.3 1,209.4 2,141.0 6,971.2 23.4 3.3 -12.6 -20.3 -6.1 14.2 Sept 3,228.5 388.2 1,231.3 2,100.0 6,948.0 17.3 3.7 -5.9 -50.5 -35.3 15.1 Oct 3,440.4 405.9 1,226.6 2,080.1 7,153.0 25.3 4.1 -1.3 -22.1 6.0 28.1 Nov 3,513.3 416.4 1,232.7 2,071.7 7,234.1 14.9 3.0 -2.6 -7.6 7.8 15.3 Dec 3,682.8 436.6 1,240.9 2,052.7 7,413.0 14.7 3.7 -2.9 -22.8 -7.3 15.6
2004 Jan n.a. n.a. n.a. n.a. n.a. n.a. n.a. n.a. n.a. n.a. n.a. Feb Mar Apr May June July Aug Sept Oct Nov Dec YTD '03 YTD '04 % Change * New sales (excluding reinvested dividends) minus redemptions, combined with net exchanges Source: Investment Company Institute
Page 28 SIA Research Reports Vol. V, No. 1 (January 31, 2004)
SECURITIES INDUSTRY EMPLOYMENT Nationwide Job Market
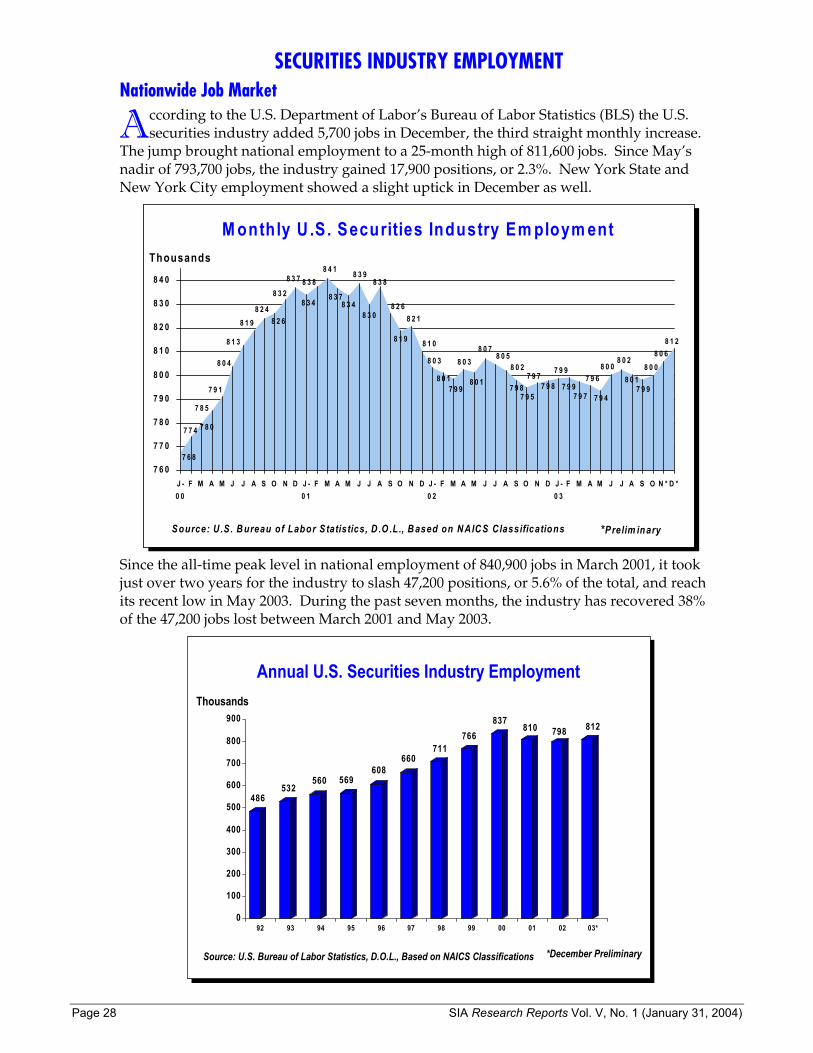
ccording to the U.S. Department of Labor’s Bureau of Labor Statistics (BLS) the U.S. securities industry added 5,700 jobs in December, the third straight monthly increase.
The jump brought national employment to a 25-month high of 811,600 jobs. Since May’s nadir of 793,700 jobs, the industry gained 17,900 positions, or 2.3%. New York State and New York City employment showed a slight uptick in December as well.
Thousands
M onthly U .S . Securities Industry Em ploym ent
8 1 2
7 6 8
7 7 4 7 8 0
7 9 1
8 0 4
8 1 3
8 1 98 2 4
8 2 6
8 3 2
7 9 9
8 0 08 0 1
8 0 08 0 2
7 9 47 9 7
7 9 67 9 97 9 8
7 9 97 9 7
7 9 57 9 8
8 0 28 0 5
8 0 7
8 0 1
8 0 3
7 9 98 0 1
8 0 3
8 1 0
8 2 1
8 1 9
8 2 68 3 0
8 3 8
8 3 78 3 4
8 3 98 4 18 3 8
8 3 4
8 3 7
7 8 5
8 0 6
7 6 0
7 7 0
7 8 0
7 9 0
8 0 0
8 1 0
8 2 0
8 3 0
8 4 0
J -0 0
F M A M J J A S O N D J -0 1
F M A M J J A S O N D J -0 2
F M A M J J A S O N D J -0 3
F M A M J J A S O N * D *
*Prelim inarySource: U .S. B ureau of Labor S tatistics, D .O .L., B ased on N AIC S Classifications
Since the all-time peak level in national employment of 840,900 jobs in March 2001, it took just over two years for the industry to slash 47,200 positions, or 5.6% of the total, and reach its recent low in May 2003. During the past seven months, the industry has recovered 38% of the 47,200 jobs lost between March 2001 and May 2003.
Thousands
Annual U.S. Securities Industry Employment
486532
560 569608
660711
766837
810 798 812
0
100
200
300
400
500
600
700
800
900
92 93 94 95 96 97 98 99 00 01 02 03*
*December PreliminarySource: U.S. Bureau of Labor Statistics, D.O.L., Based on NAICS Classifications
A
SIA Research Reports, Vol. V, No. 1 (January 31, 2004) Page 29
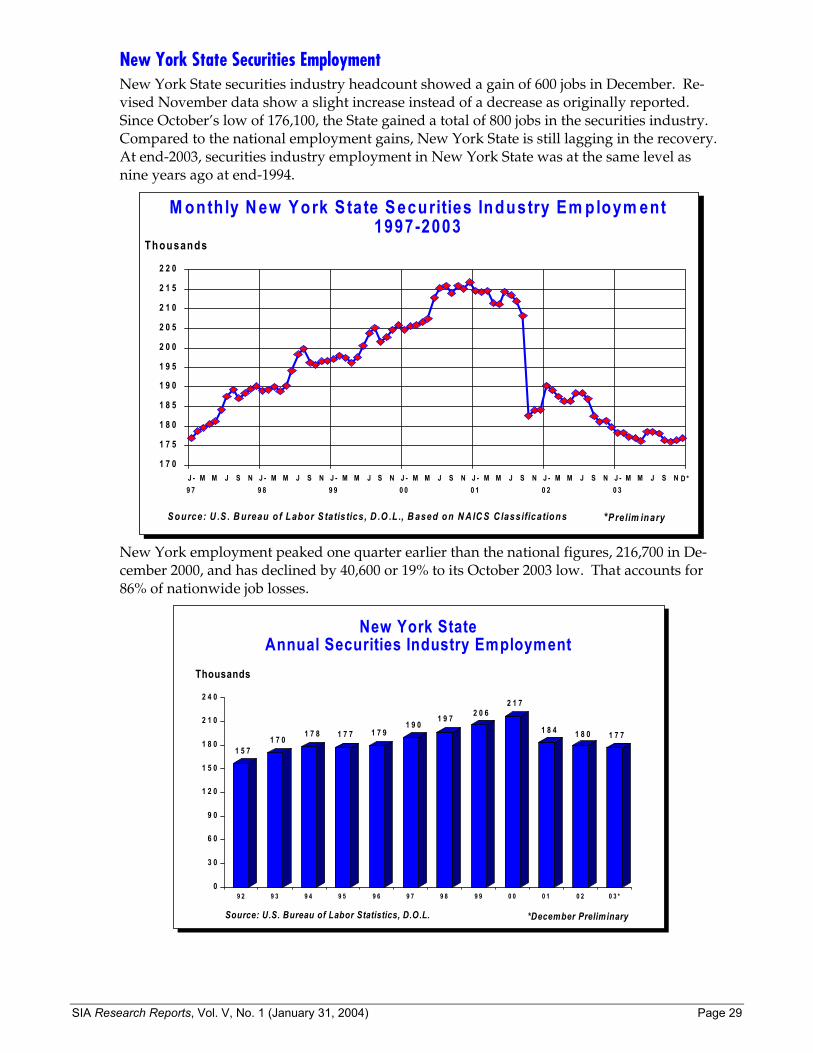
New York State Securities Employment New York State securities industry headcount showed a gain of 600 jobs in December. Re-vised November data show a slight increase instead of a decrease as originally reported. Since October’s low of 176,100, the State gained a total of 800 jobs in the securities industry. Compared to the national employment gains, New York State is still lagging in the recovery. At end-2003, securities industry employment in New York State was at the same level as nine years ago at end-1994.
Thousands
M onth ly N ew Y ork S tate S ecurities Industry Em ploym ent1997-2003
1 7 0
1 7 5
1 8 0
1 8 5
1 9 0
1 9 5
2 0 0
2 0 5
2 1 0
2 1 5
2 2 0
J -9 7
M M J S N J -9 8
M M J S N J -9 9
M M J S N J -0 0
M M J S N J -0 1
M M J S N J -0 2
M M J S N J -0 3
M M J S N
*P relim inaryS ource: U .S . B ureau o f Labor S tatis tics, D .O .L ., B ased on N AIC S C lassifications
D *
New York employment peaked one quarter earlier than the national figures, 216,700 in De-cember 2000, and has declined by 40,600 or 19% to its October 2003 low. That accounts for 86% of nationwide job losses.
Thousands
New York StateAnnual Securities Industry Employment
1 5 71 7 0
1 7 8 1 7 7 1 7 91 9 0
1 9 7 2 0 62 1 7
1 8 4 1 8 0 1 7 7
0
3 0
6 0
9 0
1 2 0
1 5 0
1 8 0
2 1 0
2 4 0
9 2 9 3 9 4 9 5 9 6 9 7 9 8 9 9 0 0 0 1 0 2 0 3 *
*December PreliminarySource: U.S. Bureau of Labor Statistics, D.O.L.
Page 30 SIA Research Reports Vol. V, No. 1 (January 31, 2004)
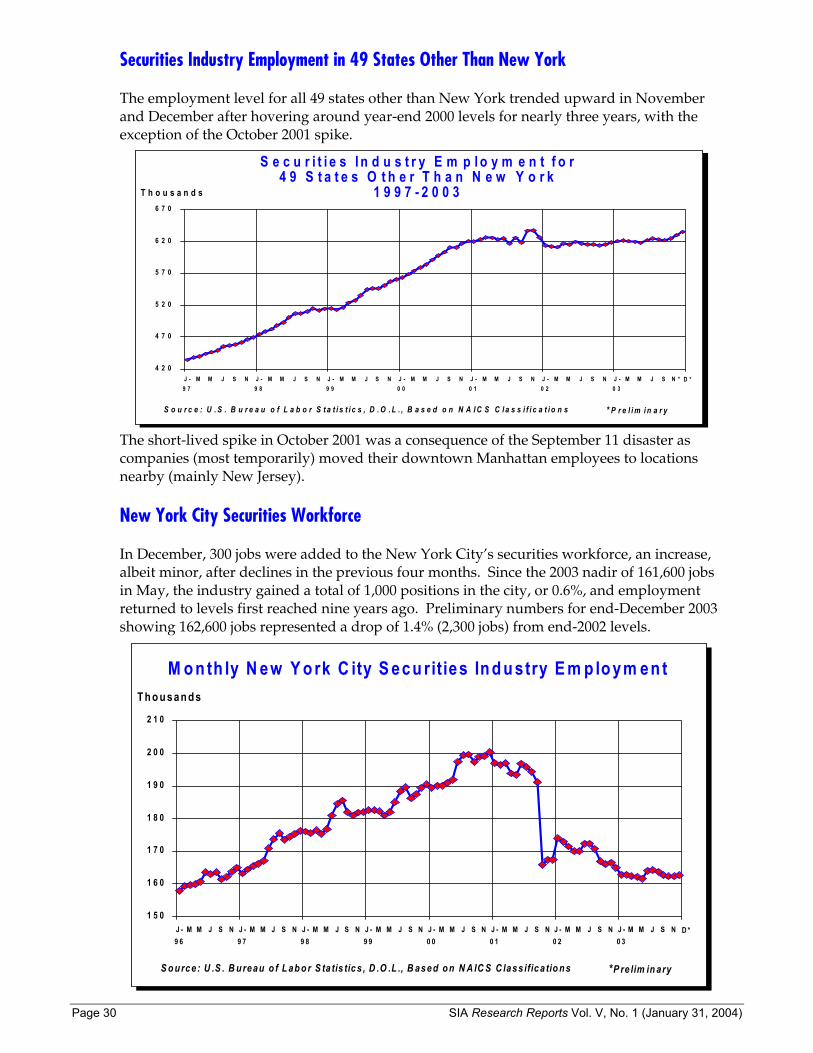
Securities Industry Employment in 49 States Other Than New York The employment level for all 49 states other than New York trended upward in November and December after hovering around year-end 2000 levels for nearly three years, with the exception of the October 2001 spike.
T h o u s a n d s
S e c u r i t i e s I n d u s t r y E m p l o y m e n t f o r 4 9 S t a t e s O t h e r T h a n N e w Y o r k
1 9 9 7 - 2 0 0 3
4 2 0
4 7 0
5 2 0
5 7 0
6 2 0
6 7 0
J -9 7
M M J S N J -9 8
M M J S N J -9 9
M M J S N J -0 0
M M J S N J -0 1
M M J S N J -0 2
M M J S N J -0 3
M M J S N *
* P r e l i m i n a r yS o u r c e : U . S . B u r e a u o f L a b o r S t a t i s t i c s , D . O . L . , B a s e d o n N A I C S C l a s s i f i c a t i o n s
D *
The short-lived spike in October 2001 was a consequence of the September 11 disaster as companies (most temporarily) moved their downtown Manhattan employees to locations nearby (mainly New Jersey).
New York City Securities Workforce In December, 300 jobs were added to the New York City’s securities workforce, an increase, albeit minor, after declines in the previous four months. Since the 2003 nadir of 161,600 jobs in May, the industry gained a total of 1,000 positions in the city, or 0.6%, and employment returned to levels first reached nine years ago. Preliminary numbers for end-December 2003 showing 162,600 jobs represented a drop of 1.4% (2,300 jobs) from end-2002 levels.
T h o u sa n d s
M o n th ly N ew Y o rk C ity S ecu rities In d u stry E m p lo ym en t
1 5 0
1 6 0
1 7 0
1 8 0
1 9 0
2 0 0
2 1 0
J -9 6
M M J S N J -9 7
M M J S N J -9 8
M M J S N J -9 9
M M J S N J -0 0
M M J S N J -0 1
M M J S N J -0 2
M M J S N J -0 3
M M J S N
*P re lim in aryS o u rce : U .S . B u reau o f L ab o r S ta tis tic s , D .O .L ., B ased o n N A IC S C lass ifica tio n s
D *
SIA Research Reports, Vol. V, No. 1 (January 31, 2004) Page 31
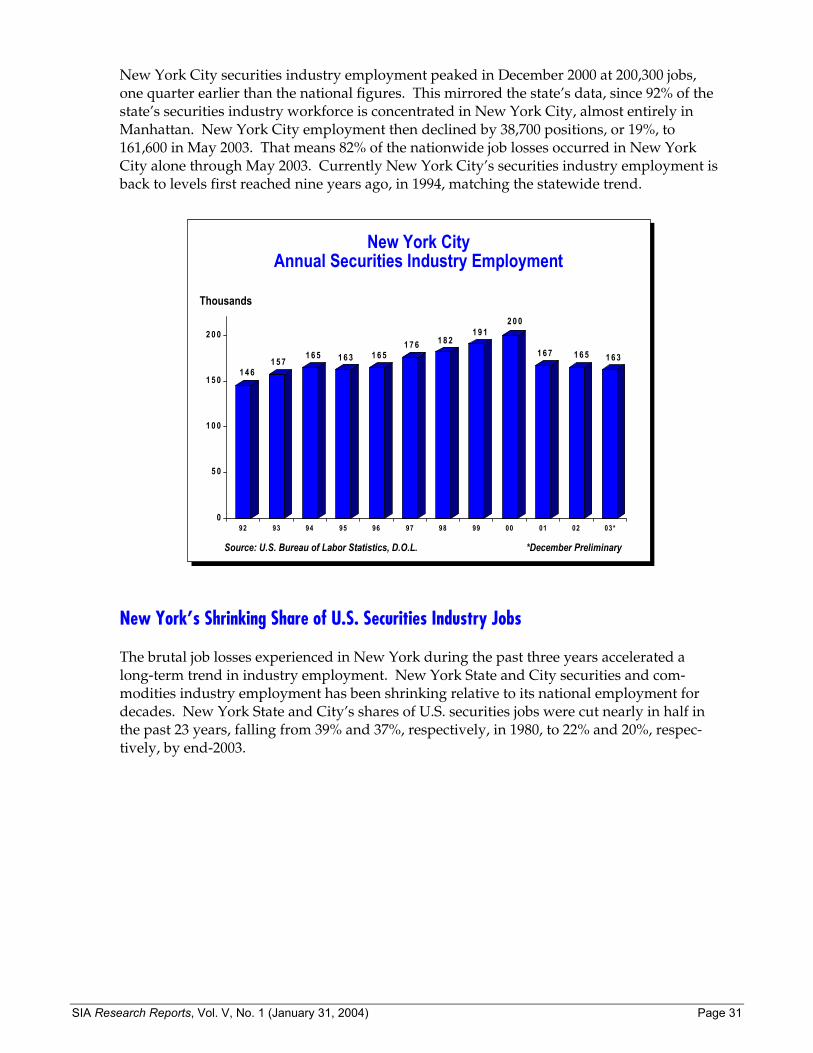
New York City securities industry employment peaked in December 2000 at 200,300 jobs, one quarter earlier than the national figures. This mirrored the state’s data, since 92% of the state’s securities industry workforce is concentrated in New York City, almost entirely in Manhattan. New York City employment then declined by 38,700 positions, or 19%, to 161,600 in May 2003. That means 82% of the nationwide job losses occurred in New York City alone through May 2003. Currently New York City’s securities industry employment is back to levels first reached nine years ago, in 1994, matching the statewide trend.
Thousands
New York City Annual Securities Industry Employment
1 4 61 5 7
1 6 5 1 6 3 1 6 51 7 6 1 8 2
1 9 12 0 0
1 6 7 1 6 5 1 6 3
0
5 0
1 0 0
1 5 0
2 0 0
92 93 94 95 96 97 98 99 00 01 02 03*
*December PreliminarySource: U.S. Bureau of Labor Statistics, D.O.L.
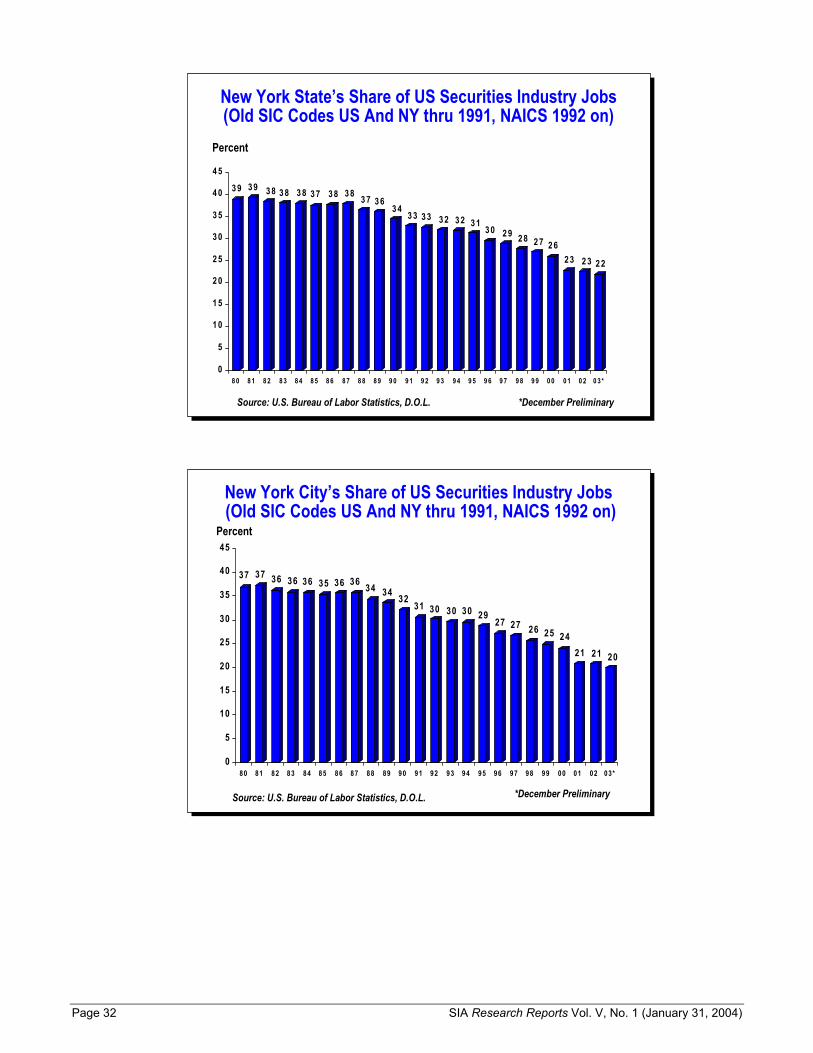
New York’s Shrinking Share of U.S. Securities Industry Jobs The brutal job losses experienced in New York during the past three years accelerated a long-term trend in industry employment. New York State and City securities and com-modities industry employment has been shrinking relative to its national employment for decades. New York State and City’s shares of U.S. securities jobs were cut nearly in half in the past 23 years, falling from 39% and 37%, respectively, in 1980, to 22% and 20%, respec-tively, by end-2003.
Page 32 SIA Research Reports Vol. V, No. 1 (January 31, 2004)
Percent
New York State’s Share of US Securities Industry Jobs(Old SIC Codes US And NY thru 1991, NAICS 1992 on)
3 9 3 9 3 8 3 8 3 8 3 7 3 8 3 8 3 7 3 63 4
3 3 3 3 3 2 3 2 3 13 0 2 9 2 8 2 7 2 6
2 3 2 3 2 2
0
5
1 0
1 5
2 0
2 5
3 0
3 5
4 0
4 5
8 0 8 1 8 2 8 3 8 4 8 5 8 6 8 7 8 8 8 9 9 0 9 1 9 2 9 3 9 4 9 5 9 6 9 7 9 8 9 9 0 0 0 1 0 2 0 3*
*December Preliminary Source: U.S. Bureau of Labor Statistics, D.O.L.
New York City’s Share of US Securities Industry Jobs(Old SIC Codes US And NY thru 1991, NAICS 1992 on)
37 37 36 36 36 35 36 36 34 34 3231 30 30 30 29
27 27 26 25 2421 21 20
0
5
10
15
20
25
30
35
40
45
80 81 82 83 84 85 86 87 88 89 90 91 92 93 94 95 96 97 98 99 00 01 02 03*
Source: U.S. Bureau of Labor Statistics, D.O.L.
Percent
*December Preliminary
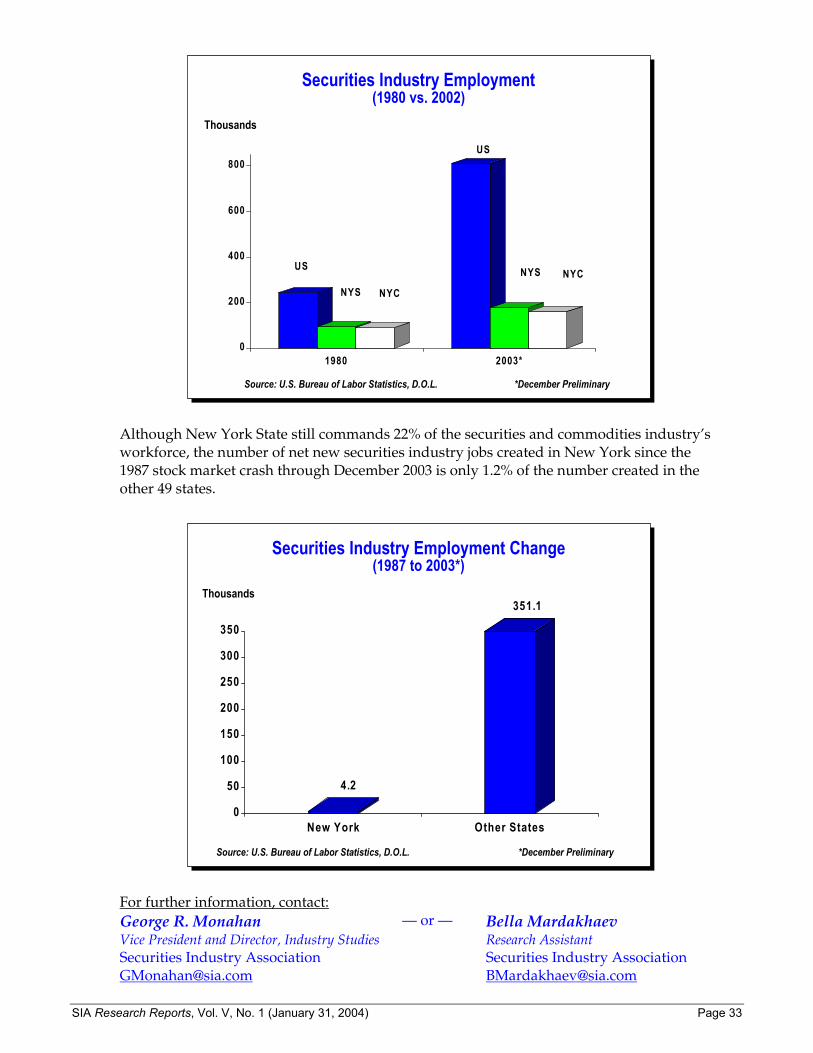
SIA Research Reports, Vol. V, No. 1 (January 31, 2004) Page 33
Thousands
Securities Industry Employment(1980 vs. 2002)
0
200
400
600
800
1980 2003*
US
NYS NYC
US
NYS NYC
*December Preliminary Source: U.S. Bureau of Labor Statistics, D.O.L.
Although New York State still commands 22% of the securities and commodities industry’s workforce, the number of net new securities industry jobs created in New York since the 1987 stock market crash through December 2003 is only 1.2% of the number created in the other 49 states.
Thousands
Securities Industry Employment Change(1987 to 2003*)
4.2
351.1
0
50
100
150
200
250
300
350
New York Other States
Source: U.S. Bureau of Labor Statistics, D.O.L. *December Preliminary
For further information, contact: George R. Monahan Vice President and Director, Industry Studies Securities Industry Association [email protected]
— or — Bella Mardakhaev Research Assistant Securities Industry Association [email protected]
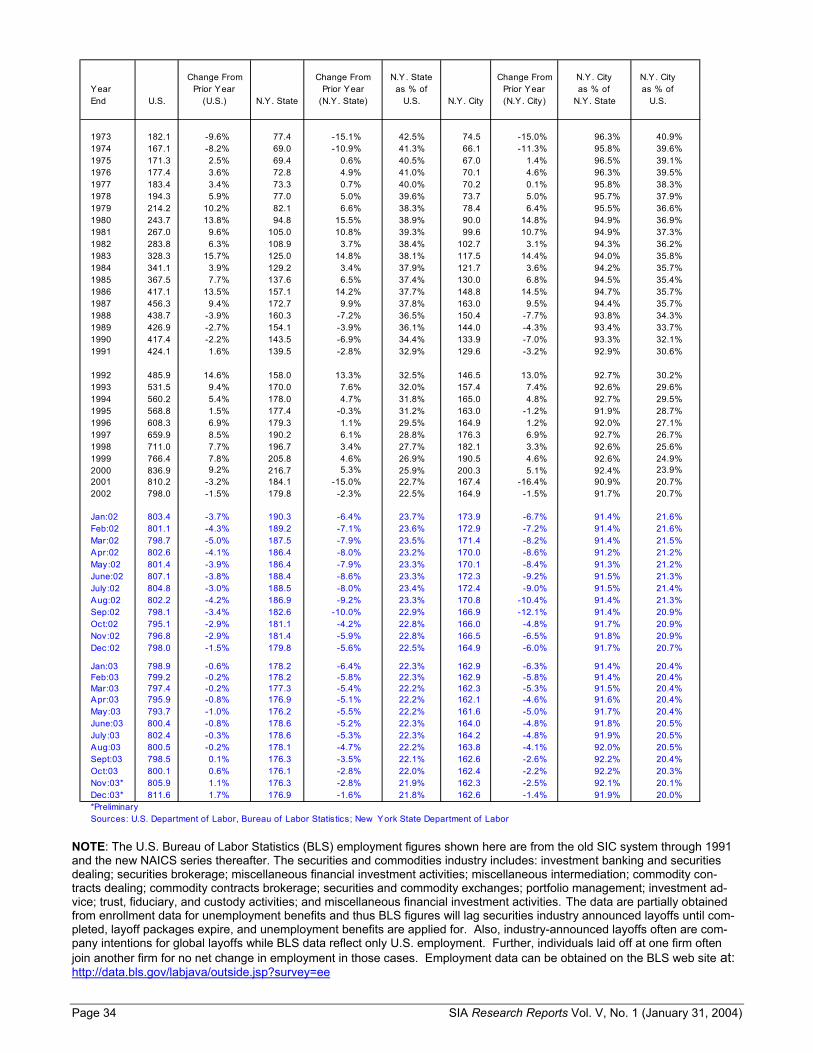
Page 34 SIA Research Reports Vol. V, No. 1 (January 31, 2004)
Change From Change From N.Y. State Change From N.Y. City N.Y. CityYear Prior Year Prior Year as % of Prior Year as % of as % ofEnd U.S. (U.S.) N.Y. State (N.Y. State) U.S. N.Y. City (N.Y. City) N.Y. State U.S.
1973 182.1 -9.6% 77.4 -15.1% 42.5% 74.5 -15.0% 96.3% 40.9%1974 167.1 -8.2% 69.0 -10.9% 41.3% 66.1 -11.3% 95.8% 39.6%1975 171.3 2.5% 69.4 0.6% 40.5% 67.0 1.4% 96.5% 39.1%1976 177.4 3.6% 72.8 4.9% 41.0% 70.1 4.6% 96.3% 39.5%1977 183.4 3.4% 73.3 0.7% 40.0% 70.2 0.1% 95.8% 38.3%1978 194.3 5.9% 77.0 5.0% 39.6% 73.7 5.0% 95.7% 37.9%1979 214.2 10.2% 82.1 6.6% 38.3% 78.4 6.4% 95.5% 36.6%1980 243.7 13.8% 94.8 15.5% 38.9% 90.0 14.8% 94.9% 36.9%1981 267.0 9.6% 105.0 10.8% 39.3% 99.6 10.7% 94.9% 37.3%1982 283.8 6.3% 108.9 3.7% 38.4% 102.7 3.1% 94.3% 36.2%1983 328.3 15.7% 125.0 14.8% 38.1% 117.5 14.4% 94.0% 35.8%1984 341.1 3.9% 129.2 3.4% 37.9% 121.7 3.6% 94.2% 35.7%1985 367.5 7.7% 137.6 6.5% 37.4% 130.0 6.8% 94.5% 35.4%1986 417.1 13.5% 157.1 14.2% 37.7% 148.8 14.5% 94.7% 35.7%1987 456.3 9.4% 172.7 9.9% 37.8% 163.0 9.5% 94.4% 35.7%1988 438.7 -3.9% 160.3 -7.2% 36.5% 150.4 -7.7% 93.8% 34.3%1989 426.9 -2.7% 154.1 -3.9% 36.1% 144.0 -4.3% 93.4% 33.7%1990 417.4 -2.2% 143.5 -6.9% 34.4% 133.9 -7.0% 93.3% 32.1%1991 424.1 1.6% 139.5 -2.8% 32.9% 129.6 -3.2% 92.9% 30.6%
1992 485.9 14.6% 158.0 13.3% 32.5% 146.5 13.0% 92.7% 30.2%1993 531.5 9.4% 170.0 7.6% 32.0% 157.4 7.4% 92.6% 29.6%1994 560.2 5.4% 178.0 4.7% 31.8% 165.0 4.8% 92.7% 29.5%1995 568.8 1.5% 177.4 -0.3% 31.2% 163.0 -1.2% 91.9% 28.7%1996 608.3 6.9% 179.3 1.1% 29.5% 164.9 1.2% 92.0% 27.1%1997 659.9 8.5% 190.2 6.1% 28.8% 176.3 6.9% 92.7% 26.7%1998 711.0 7.7% 196.7 3.4% 27.7% 182.1 3.3% 92.6% 25.6%1999 766.4 7.8% 205.8 4.6% 26.9% 190.5 4.6% 92.6% 24.9%2000 836.9 9.2% 216.7 5.3% 25.9% 200.3 5.1% 92.4% 23.9%2001 810.2 -3.2% 184.1 -15.0% 22.7% 167.4 -16.4% 90.9% 20.7%2002 798.0 -1.5% 179.8 -2.3% 22.5% 164.9 -1.5% 91.7% 20.7%
Jan:02 803.4 -3.7% 190.3 -6.4% 23.7% 173.9 -6.7% 91.4% 21.6%Feb:02 801.1 -4.3% 189.2 -7.1% 23.6% 172.9 -7.2% 91.4% 21.6%Mar:02 798.7 -5.0% 187.5 -7.9% 23.5% 171.4 -8.2% 91.4% 21.5%Apr:02 802.6 -4.1% 186.4 -8.0% 23.2% 170.0 -8.6% 91.2% 21.2%May:02 801.4 -3.9% 186.4 -7.9% 23.3% 170.1 -8.4% 91.3% 21.2%June:02 807.1 -3.8% 188.4 -8.6% 23.3% 172.3 -9.2% 91.5% 21.3%July:02 804.8 -3.0% 188.5 -8.0% 23.4% 172.4 -9.0% 91.5% 21.4%Aug:02 802.2 -4.2% 186.9 -9.2% 23.3% 170.8 -10.4% 91.4% 21.3%Sep:02 798.1 -3.4% 182.6 -10.0% 22.9% 166.9 -12.1% 91.4% 20.9%Oct:02 795.1 -2.9% 181.1 -4.2% 22.8% 166.0 -4.8% 91.7% 20.9%Nov:02 796.8 -2.9% 181.4 -5.9% 22.8% 166.5 -6.5% 91.8% 20.9%Dec:02 798.0 -1.5% 179.8 -5.6% 22.5% 164.9 -6.0% 91.7% 20.7%
Jan:03 798.9 -0.6% 178.2 -6.4% 22.3% 162.9 -6.3% 91.4% 20.4%Feb:03 799.2 -0.2% 178.2 -5.8% 22.3% 162.9 -5.8% 91.4% 20.4%Mar:03 797.4 -0.2% 177.3 -5.4% 22.2% 162.3 -5.3% 91.5% 20.4%Apr:03 795.9 -0.8% 176.9 -5.1% 22.2% 162.1 -4.6% 91.6% 20.4%May:03 793.7 -1.0% 176.2 -5.5% 22.2% 161.6 -5.0% 91.7% 20.4%June:03 800.4 -0.8% 178.6 -5.2% 22.3% 164.0 -4.8% 91.8% 20.5%July:03 802.4 -0.3% 178.6 -5.3% 22.3% 164.2 -4.8% 91.9% 20.5%Aug:03 800.5 -0.2% 178.1 -4.7% 22.2% 163.8 -4.1% 92.0% 20.5%Sept:03 798.5 0.1% 176.3 -3.5% 22.1% 162.6 -2.6% 92.2% 20.4%Oct:03 800.1 0.6% 176.1 -2.8% 22.0% 162.4 -2.2% 92.2% 20.3%Nov:03* 805.9 1.1% 176.3 -2.8% 21.9% 162.3 -2.5% 92.1% 20.1%Dec:03* 811.6 1.7% 176.9 -1.6% 21.8% 162.6 -1.4% 91.9% 20.0%*PreliminarySources: U.S. Department of Labor, Bureau of Labor Statistics; New York State Department of Labor
NOTE: The U.S. Bureau of Labor Statistics (BLS) employment figures shown here are from the old SIC system through 1991 and the new NAICS series thereafter. The securities and commodities industry includes: investment banking and securities dealing; securities brokerage; miscellaneous financial investment activities; miscellaneous intermediation; commodity con-tracts dealing; commodity contracts brokerage; securities and commodity exchanges; portfolio management; investment ad-vice; trust, fiduciary, and custody activities; and miscellaneous financial investment activities. The data are partially obtained from enrollment data for unemployment benefits and thus BLS figures will lag securities industry announced layoffs until com-pleted, layoff packages expire, and unemployment benefits are applied for. Also, industry-announced layoffs often are com-pany intentions for global layoffs while BLS data reflect only U.S. employment. Further, individuals laid off at one firm often join another firm for no net change in employment in those cases. Employment data can be obtained on the BLS web site at: http://data.bls.gov/labjava/outside.jsp?survey=ee