Term-structure analysis of hidden order in the limit order ... · Hidden order is currently...
34
Introduction Related Literature HFT Data Methodology Analysis References Term-structure analysis of hidden order in the limit order book: evidence from the E-Mini S&P 500 Pongsutti Phuensane QRFE, Durham University Business School & Khon Kaen Business School [email protected] Julian Williams Durham University Business School [email protected] February 2, 2017 PP & JW ES-Hidden Order February 2, 2017 1 / 34
Transcript of Term-structure analysis of hidden order in the limit order ... · Hidden order is currently...
Introduction Related Literature HFT Data Methodology Analysis References
Term-structure analysis of hidden order in the limit orderbook: evidence from the E-Mini S&P 500
Pongsutti PhuensaneQRFE, Durham University Business School
&
Khon Kaen Business School
Julian WilliamsDurham University Business School
February 2, 2017
PP & JW ES-Hidden Order February 2, 2017 1 / 34

Introduction Related Literature HFT Data Methodology Analysis References
Outline
Background & Motivation
Related Literature
Methodology
Results and analysis
Conclusions
PP & JW ES-Hidden Order February 2, 2017 2 / 34
Introduction Related Literature HFT Data Methodology Analysis References
Background & Motivation
Hidden Order
Hidden order is currently increasingly popular as a standard featureof electronic limit order book markets.
Iceberg Order, Invisible Order, Invisible Liquidity, Hidden Order.
Max Show on CME’s Globex Electronic Platform.
Hidden order allows traders to hide all or partially hide their orders,they can divide their large orders into smaller parts so that the publicsees only a small portion of the order at a time.
By hiding its large size,the hidden order reduces the pricemovements caused by substantial changes in a stock’s supply anddemand to avoid exposure to risk.
PP & JW ES-Hidden Order February 2, 2017 3 / 34
Introduction Related Literature HFT Data Methodology Analysis References
Background & Motivation
Although market participants who use hidden orders commonly losetime priority to traders who submit displayed orders, this timedisadvantage is offset by the secrecy afforded by the hiddenorders strategy.
However, the more serious cost is that because of the time lag, somehidden orders are not possible to execute.
The advantage of entirely or partially hidden orders is that it reducesthe risk of being undercut by aggressive or high-speed traders andthis potential loss is always greater than the cost of losses thoughtime priority, especially for agents who want to submit a large order.
Clearly, hidden orders have both costs and benefits compared tovisible orders.
PP & JW ES-Hidden Order February 2, 2017 4 / 34
Introduction Related Literature HFT Data Methodology Analysis References
Objective of this talk
For this presentation we will look specifically at VWAPTD-Hiddenorder detection algorithm and we will apply this to trading in theE-Mini S&P 500 futures contract.
We estimate the daily fraction of hidden order for completetransaction for the E-Mini between 2008 and 2015.
We will then set up a series of experiments to see the associationbetween hidden order and our observed market environment proxies.
PP & JW ES-Hidden Order February 2, 2017 5 / 34
Introduction Related Literature HFT Data Methodology Analysis References
Executive Summary
Our algorithm show 43% all of trade volume in the E-Mini S&P 500is involved with invisible liquidity.
We also find that price impact is decreased and market quality isimproved with the presence of hidden order both during high and lowfrequency trading periods.
We use this measure to study the association between hidden orderand other observed market environments. Our analysis findsaggressive hidden order activity when trading volume isincreased.
PP & JW ES-Hidden Order February 2, 2017 6 / 34
Introduction Related Literature HFT Data Methodology Analysis References
Contribution
First, this is the only research study to provide a comprehensive innovation ofsigned-hidden order detection algorithm for E-min S&P500 for limit order bookdata.
Second, to implement the detection algorithm, this analysis applies theVolume-Weighted Average Price (VWAP) approach with the signed-trade directionindicator to introduce the Volume Weighted Average Price-Trade Direction(VWAPTD) indicator.
Third, the empirical application of a term-structure analysis is a new contributionto the literature in the field, and my algorithms are available for other researchersto implement in such studies in a different market setting.
Lastly, the advantage of the algorithm is that it can be constructed from publiclyavailable data, therefore, it does not rely on special data.
PP & JW ES-Hidden Order February 2, 2017 7 / 34
Introduction Related Literature HFT Data Methodology Analysis References
Related Literature
Instances of hidden liquidity in financial markets are increasingly popular, and we providesome evidence in the following section.
Impact of hidden order to the market; Aitken et al. (2001, JFM) and De Winneand D’hondt (2007, RF).
Trading costs and trade time; Bessembinder et al. (2009, JFE).
Order size and price impact; Frey and Sand̊as (2009, AFA Meeting).
However, Pardo and Pascual (2012, JF) show that there is no significantrelationship between hidden order and price impact.
To understand the behavior of traders who submit hidden liquidity; Gozluklu et al.(2009, EFA Meeting) and Bloomfield et al. (2015, JF)
PP & JW ES-Hidden Order February 2, 2017 8 / 34
Introduction Related Literature HFT Data Methodology Analysis References
High Frequency Trading & Big Data Analysis
For the last decade, the financial markets environment has been differentin fundamental ways. Speed is one of the most important factors due toinformation gathering and the actions prompted by this information havecreated high volatility in the market (Hasbrouck and Saar (2013)).
In comparison, High-frequency trading evolution respond at a pace100 times faster than it would take for a human trader to blink.
The fastest trade updated for Eurodollar futures is 500 microsecondsand fastest trade updated for E-Mini S&P 500 futures is 60microseconds.
The average trade updated is 45 and 2.5 seconds for Eurodollar andE-Mini S&P 500 respectively.
At these speeds, only the microstructure matters (O’Hara (2015)).
PP & JW ES-Hidden Order February 2, 2017 9 / 34
Introduction Related Literature HFT Data Methodology Analysis References
HFT Data-(LOB&Trades)
The data is recorded in millisecond time stamp
The raw data (uncompressed CSV files) comprises 642 GB of the limitorder book and trade data for 32 E-Mini S&P 500 futures contracts.
The raw tapes were streamed into a new format ‘hdf5’ which provideda high-integrity medium for this amount of data.
The E-Mini S&P 500 data was reduced to 143 GB of compressedhdf5 data stored in separate files by maturity date, and then stored ona solid state drive.
In total, the data prepared for each data set was around four months,from downloading the raw data from TRTH to data cleaningprocedures.
PP & JW ES-Hidden Order February 2, 2017 10 / 34
Introduction Related Literature HFT Data Methodology Analysis References
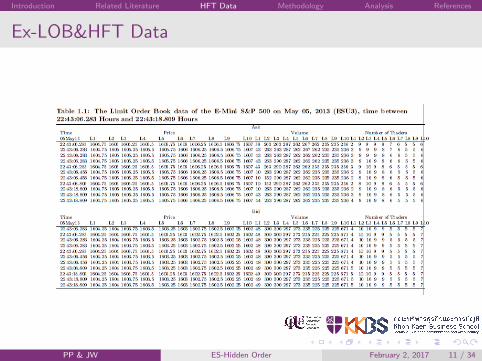
Ex-LOB&HFT Data
PP & JW ES-Hidden Order February 2, 2017 11 / 34
Introduction Related Literature HFT Data Methodology Analysis References
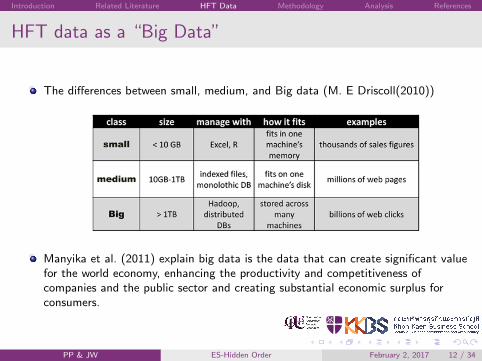
HFT data as a “Big Data”
The differences between small, medium, and Big data (M. E Driscoll(2010))
Manyika et al. (2011) explain big data is the data that can create significant valuefor the world economy, enhancing the productivity and competitiveness ofcompanies and the public sector and creating substantial economic surplus forconsumers.
PP & JW ES-Hidden Order February 2, 2017 12 / 34
Introduction Related Literature HFT Data Methodology Analysis References
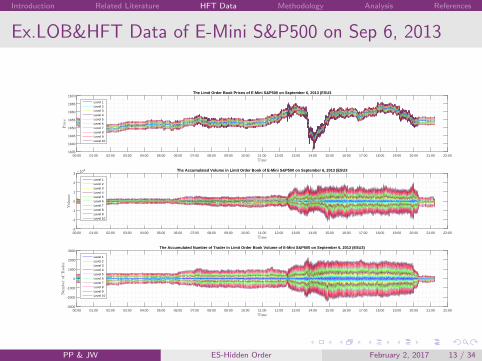
Ex.LOB&HFT Data of E-Mini S&P500 on Sep 6, 2013
Time
00:00 01:00 02:00 03:00 04:00 05:00 06:00 07:00 08:00 09:00 10:00 11:00 12:00 13:00 14:00 15:00 16:00 17:00 18:00 19:00 20:00 21:00 22:00
Price
1635
1640
1645
1650
1655
1660
1665
1670The Limit Order Book Prices of E-Mini S&P500 on September 6, 2013 (ESU3
Level 1Level 2Level 3Level 4Level 5Level 6Level 7Level 8Level 9Level 10
Time
00:00 01:00 02:00 03:00 04:00 05:00 06:00 07:00 08:00 09:00 10:00 11:00 12:00 13:00 14:00 15:00 16:00 17:00 18:00 19:00 20:00 21:00 22:00
Volume
×104
-3
-2
-1
0
1
2
3The Accumulated Volume in Limit Order Book of E-Mini S&P500 on September 6, 2013 (ESU3
Level 1Level 2Level 3Level 4Level 5Level 6Level 7Level 8Level 9Level 10
Time
00:00 01:00 02:00 03:00 04:00 05:00 06:00 07:00 08:00 09:00 10:00 11:00 12:00 13:00 14:00 15:00 16:00 17:00 18:00 19:00 20:00 21:00 22:00
NumberofTrader
-3000
-2000
-1000
0
1000
2000
3000The Accumulated Number of Trader in Limit Order Book Volume of E-Mini S&P500 on September 6, 2013 (ESU3)
Level 1Level 2Level 3Level 4Level 5Level 6Level 7Level 8Level 9Level 10
PP & JW ES-Hidden Order February 2, 2017 13 / 34
Introduction Related Literature HFT Data Methodology Analysis References
The Sample: E-Mini S&P 500 Futures Contract
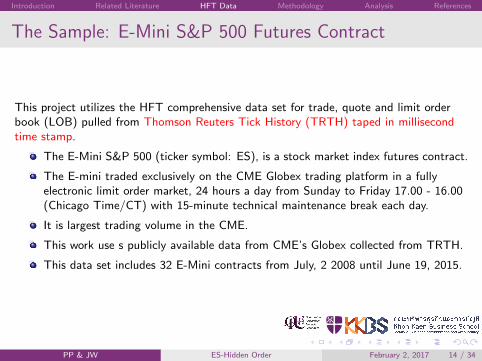
This project utilizes the HFT comprehensive data set for trade, quote and limit orderbook (LOB) pulled from Thomson Reuters Tick History (TRTH) taped in millisecondtime stamp.
The E-Mini S&P 500 (ticker symbol: ES), is a stock market index futures contract.
The E-mini traded exclusively on the CME Globex trading platform in a fullyelectronic limit order market, 24 hours a day from Sunday to Friday 17.00 - 16.00(Chicago Time/CT) with 15-minute technical maintenance break each day.
It is largest trading volume in the CME.
This work use s publicly available data from CME’s Globex collected from TRTH.
This data set includes 32 E-Mini contracts from July, 2 2008 until June 19, 2015.
PP & JW ES-Hidden Order February 2, 2017 14 / 34

Introduction Related Literature HFT Data Methodology Analysis References
ES-Data Cleaning Procedures
The cleaning procedure of this data is carried out following steps S1-S5. This step isapplied to all trades and limit order book data.
S 1: Delete entries quotes with bids(offers) that are greater(smaller) than offers(bids)or mis-priced from trades and quotes data.
S 2: Delete entries a bid, ask or trade volume equal to zero and NaN value. Thistechnique is to eliminate nonessential values in this time series data.
S 3: Delete duplicate data from both trades and quotes data. This organization andsorting technique helps to reduce costs and time, and improve efficiency in theanalysis process.
S 4: Retain entries missing values and match with equivalent time vector for eachvariable.
S 5: Finally, trades and standing quotes is matched at the time of the trade time stamp.
PP & JW ES-Hidden Order February 2, 2017 15 / 34
Introduction Related Literature HFT Data Methodology Analysis References
Detecting Hidden Orders
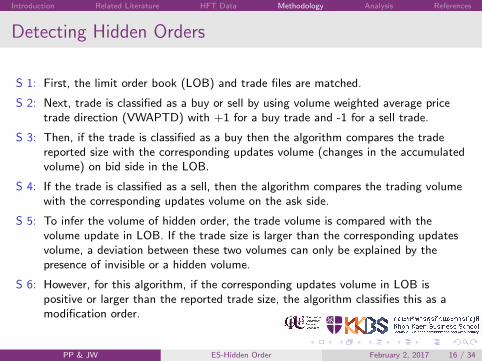
S 1: First, the limit order book (LOB) and trade files are matched.
S 2: Next, trade is classified as a buy or sell by using volume weighted average pricetrade direction (VWAPTD) with +1 for a buy trade and -1 for a sell trade.
S 3: Then, if the trade is classified as a buy then the algorithm compares the tradereported size with the corresponding updates volume (changes in the accumulatedvolume) on bid side in the LOB.
S 4: If the trade is classified as a sell, then the algorithm compares the trading volumewith the corresponding updates volume on the ask side.
S 5: To infer the volume of hidden order, the trade volume is compared with thevolume update in LOB. If the trade size is larger than the corresponding updatesvolume, a deviation between these two volumes can only be explained by thepresence of invisible or a hidden volume.
S 6: However, for this algorithm, if the corresponding updates volume in LOB ispositive or larger than the reported trade size, the algorithm classifies this as amodification order.
PP & JW ES-Hidden Order February 2, 2017 16 / 34
Introduction Related Literature HFT Data Methodology Analysis References
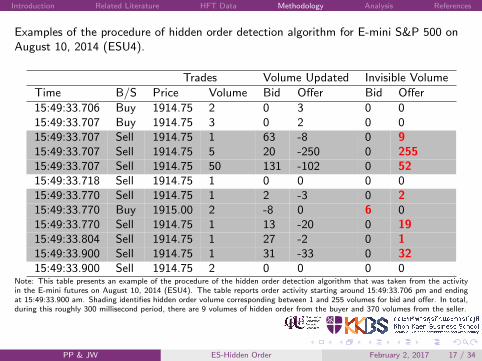
Examples of the procedure of hidden order detection algorithm for E-mini S&P 500 onAugust 10, 2014 (ESU4).
Trades Volume Updated Invisible Volume
Time B/S Price Volume Bid Offer Bid Offer
15:49:33.706 Buy 1914.75 2 0 3 0 015:49:33.707 Buy 1914.75 3 0 2 0 015:49:33.707 Sell 1914.75 1 63 -8 0 915:49:33.707 Sell 1914.75 5 20 -250 0 25515:49:33.707 Sell 1914.75 50 131 -102 0 5215:49:33.718 Sell 1914.75 1 0 0 0 015:49:33.770 Sell 1914.75 1 2 -3 0 215:49:33.770 Buy 1915.00 2 -8 0 6 015:49:33.770 Sell 1914.75 1 13 -20 0 1915:49:33.804 Sell 1914.75 1 27 -2 0 115:49:33.900 Sell 1914.75 1 31 -33 0 3215:49:33.900 Sell 1914.75 2 0 0 0 0
Note: This table presents an example of the procedure of the hidden order detection algorithm that was taken from the activityin the E-mini futures on August 10, 2014 (ESU4). The table reports order activity starting around 15:49:33.706 pm and endingat 15:49:33.900 am. Shading identifies hidden order volume corresponding between 1 and 255 volumes for bid and offer. In total,during this roughly 300 millisecond period, there are 9 volumes of hidden order from the buyer and 370 volumes from the seller.
PP & JW ES-Hidden Order February 2, 2017 17 / 34
Introduction Related Literature HFT Data Methodology Analysis References
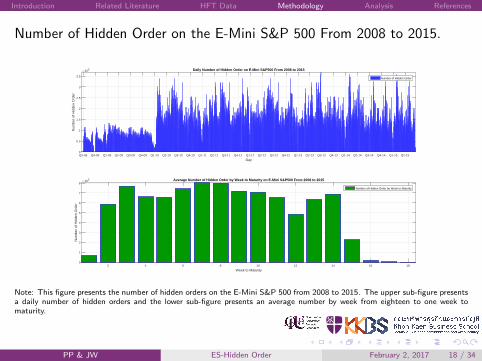
Number of Hidden Order on the E-Mini S&P 500 From 2008 to 2015.
DayQ3-08 Q4-08 Q1-09 Q2-09 Q3-09 Q4-09 Q1-10 Q2-10 Q3-10 Q4-10 Q1-11 Q2-11 Q3-11 Q4-11 Q1-12 Q2-12 Q3-12 Q4-12 Q1-13 Q2-13 Q3-13 Q4-13 Q1-14 Q2-14 Q3-14 Q4-14 Q1-15 Q2-15
Num
ber
of H
idde
n O
rder
×105
0
0.5
1
1.5
2
2.5
3
3.5
Daily Number of Hidden Order on E-Mini S&P500 From 2008 to 2015
Number of Hidden Order
Week to Maturity2 4 6 8 10 12 14 16 18
Num
ber
of H
idde
n O
rder
×105
0
1
2
3
4
5
6
7
8Average Number of Hidden Order by Week to Maturity on E-Mini S&P500 From 2008 to 2015
Number of Hidden Order by Week to Maturity
Note: This figure presents the number of hidden orders on the E-Mini S&P 500 from 2008 to 2015. The upper sub-figure presentsa daily number of hidden orders and the lower sub-figure presents an average number by week from eighteen to one week tomaturity.
PP & JW ES-Hidden Order February 2, 2017 18 / 34
Introduction Related Literature HFT Data Methodology Analysis References
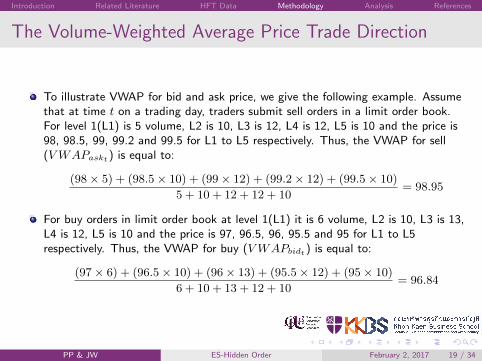
The Volume-Weighted Average Price Trade Direction
To illustrate VWAP for bid and ask price, we give the following example. Assumethat at time t on a trading day, traders submit sell orders in a limit order book.For level 1(L1) is 5 volume, L2 is 10, L3 is 12, L4 is 12, L5 is 10 and the price is98, 98.5, 99, 99.2 and 99.5 for L1 to L5 respectively. Thus, the VWAP for sell(VWAPaskt) is equal to:
(98× 5) + (98.5× 10) + (99× 12) + (99.2× 12) + (99.5× 10)
5 + 10 + 12 + 12 + 10= 98.95
For buy orders in limit order book at level 1(L1) it is 6 volume, L2 is 10, L3 is 13,L4 is 12, L5 is 10 and the price is 97, 96.5, 96, 95.5 and 95 for L1 to L5respectively. Thus, the VWAP for buy (VWAPbidt) is equal to:
(97× 6) + (96.5× 10) + (96× 13) + (95.5× 12) + (95× 10)
6 + 10 + 13 + 12 + 10= 96.84
PP & JW ES-Hidden Order February 2, 2017 19 / 34
Introduction Related Literature HFT Data Methodology Analysis References
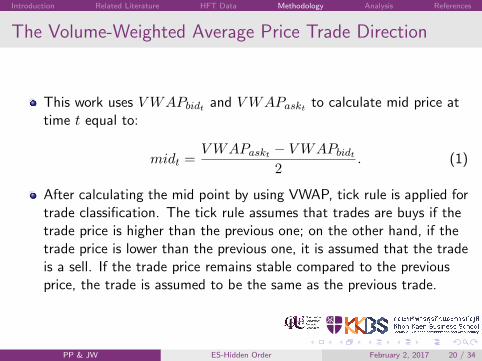
The Volume-Weighted Average Price Trade Direction
This work uses VWAPbidt and VWAPaskt to calculate mid price attime t equal to:
midt =VWAPaskt − VWAPbidt
2. (1)
After calculating the mid point by using VWAP, tick rule is applied fortrade classification. The tick rule assumes that trades are buys if thetrade price is higher than the previous one; on the other hand, if thetrade price is lower than the previous one, it is assumed that the tradeis a sell. If the trade price remains stable compared to the previousprice, the trade is assumed to be the same as the previous trade.
PP & JW ES-Hidden Order February 2, 2017 20 / 34
Introduction Related Literature HFT Data Methodology Analysis References
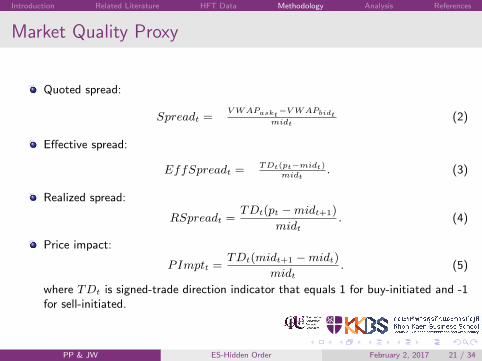
Market Quality Proxy
Quoted spread:
Spreadt =VWAPaskt
−VWAPbidtmidt
(2)
Effective spread:
EffSpreadt =TDt(pt−midt)
midt. (3)
Realized spread:
RSpreadt =TDt(pt −midt+1)
midt. (4)
Price impact:
PImptt =TDt(midt+1 −midt)
midt. (5)
where TDt is signed-trade direction indicator that equals 1 for buy-initiated and -1for sell-initiated.
PP & JW ES-Hidden Order February 2, 2017 21 / 34
Introduction Related Literature HFT Data Methodology Analysis References
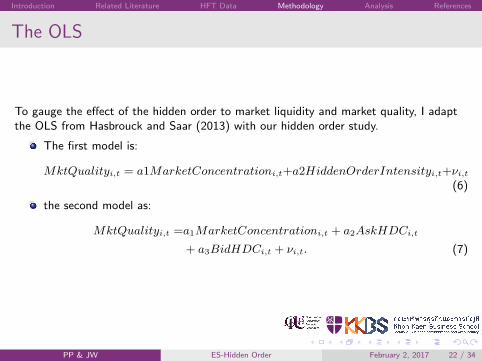
The OLS
To gauge the effect of the hidden order to market liquidity and market quality, I adaptthe OLS from Hasbrouck and Saar (2013) with our hidden order study.
The first model is:
MktQualityi,t = a1MarketConcentrationi,t+a2HiddenOrderIntensityi,t+νi,t(6)
the second model as:
MktQualityi,t =a1MarketConcentrationi,t + a2AskHDCi,t
+ a3BidHDCi,t + νi,t. (7)
PP & JW ES-Hidden Order February 2, 2017 22 / 34
Introduction Related Literature HFT Data Methodology Analysis References
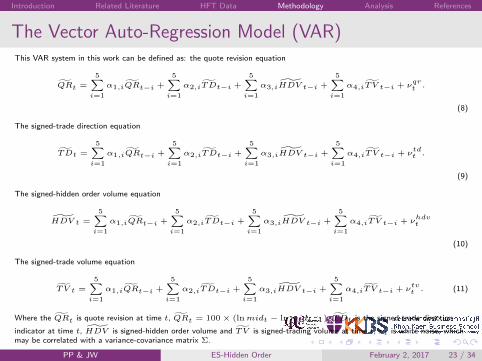
The Vector Auto-Regression Model (VAR)This VAR system in this work can be defined as: the quote revision equation
Q̃Rt =5∑
i=1
α1,iQ̃Rt−i +5∑
i=1
α2,iT̃Dt−i +5∑
i=1
α3,iH̃DV t−i +5∑
i=1
α4,iT̃V t−i + νqrt .
(8)
The signed-trade direction equation
T̃Dt =5∑
i=1
α1,iQ̃Rt−i +5∑
i=1
α2,iT̃Dt−i +5∑
i=1
α3,iH̃DV t−i +5∑
i=1
α4,iT̃V t−i + νtdt .
(9)
The signed-hidden order volume equation
H̃DV t =
5∑i=1
α1,iQ̃Rt−i +5∑
i=1
α2,iT̃Dt−i +5∑
i=1
α3,iH̃DV t−i +5∑
i=1
α4,iT̃V t−i + νhdvt
(10)
The signed-trade volume equation
T̃V t =
5∑i=1
α1,iQ̃Rt−i +5∑
i=1
α2,iT̃Dt−i +5∑
i=1
α3,iH̃DV t−i +5∑
i=1
α4,iT̃V t−i + νtvt . (11)
Where the Q̃Rt is quote revision at time t, Q̃Rt = 100 × (lnmidt − lnmidt−1), T̃Dt is the signed-trade direction
indicator at time t, H̃DV is signed-hidden order volume and T̃V is signed-trading volume at time t, νt is white noise, whichmay be correlated with a variance-covariance matrix Σ.
PP & JW ES-Hidden Order February 2, 2017 23 / 34
Introduction Related Literature HFT Data Methodology Analysis References
Experimental Protocal
The empirical study begins by systematizing E-mini S&P500 time seriesdata in the form of the term-structure. After this,
The E-mini data is separated into 18 sets of data, which is fromeighteen to one week to expiration.
I find the E-mini trading becomes highly active from fourteen weeksuntil two weeks to maturity.
From fifteen to fourteen weeks, the trade updated jumps from 0.64 to2.16 million updated, results for a period longer than fifteen weeks tomaturity, showing that trade updated declines continuously.
The sixteen, seventeen and eighteen weeks to maturity, the averagetrade updated per week is 0.019, 0.008, and 0.005 million updatedrespectively.
PP & JW ES-Hidden Order February 2, 2017 24 / 34
Introduction Related Literature HFT Data Methodology Analysis References
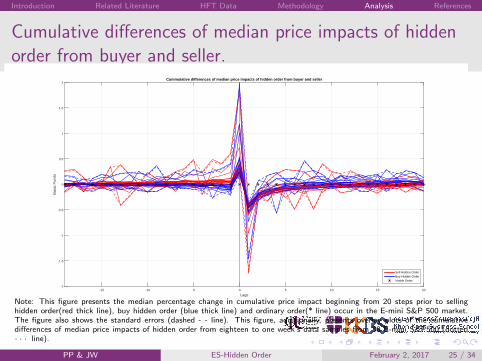
Cumulative differences of median price impacts of hiddenorder from buyer and seller.
Lags-15 -10 -5 0 5 10 15 20
Bas
ic P
oint
s
-2
-1.5
-1
-0.5
0
0.5
1
1.5
2Cummulative differences of median price impacts of hidden order from buyer and seller
Sell Hidden OrderBuy Hidden OrderVisible Order
Note: This figure presents the median percentage change in cumulative price impact beginning from 20 steps prior to sellinghidden order(red thick line), buy hidden order (blue thick line) and ordinary order(* line) occur in the E-mini S&P 500 market.The figure also shows the standard errors (dashed - - line). This figure, additionally, presents overlay plots of the cumulativedifferences of median price impacts of hidden order from eighteen to one week’s data samples from 30 E-mini S&P500 (dotted· · · line).
PP & JW ES-Hidden Order February 2, 2017 25 / 34
Introduction Related Literature HFT Data Methodology Analysis References
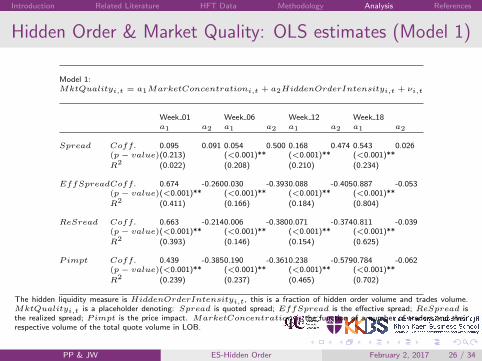
Hidden Order & Market Quality: OLS estimates (Model 1)
Model 1:MktQualityi,t = a1MarketConcentrationi,t + a2HiddenOrderIntensityi,t + νi,t
Week 01 Week 06 Week 12 Week 18a1 a2 a1 a2 a1 a2 a1 a2
Spread Coff. 0.095 0.091 0.054 0.500 0.168 0.474 0.543 0.026(p− value)(0.213) (<0.001)** (<0.001)** (<0.001)**
R2 (0.022) (0.208) (0.210) (0.234)
EffSpreadCoff. 0.674 -0.2600.030 -0.3930.088 -0.4050.887 -0.053(p− value)(<0.001)** (<0.001)** (<0.001)** (<0.001)**
R2 (0.411) (0.166) (0.184) (0.804)
ReSread Coff. 0.663 -0.2140.006 -0.3800.071 -0.3740.811 -0.039(p− value)(<0.001)** (<0.001)** (<0.001)** (<0.001)**
R2 (0.393) (0.146) (0.154) (0.625)
Pimpt Coff. 0.439 -0.3850.190 -0.3610.238 -0.5790.784 -0.062(p− value)(<0.001)** (<0.001)** (<0.001)** (<0.001)**
R2 (0.239) (0.237) (0.465) (0.702)
The hidden liquidity measure is HiddenOrderIntensityi,t, this is a fraction of hidden order volume and trades volume.MktQualityi,t is a placeholder denoting: Spread is quoted spread; EffSpread is the effective spread; ReSpread isthe realized spread; Pimpt is the price impact. MarketConcentration is the function of a number of traders and theirrespective volume of the total quote volume in LOB.
PP & JW ES-Hidden Order February 2, 2017 26 / 34
Introduction Related Literature HFT Data Methodology Analysis References
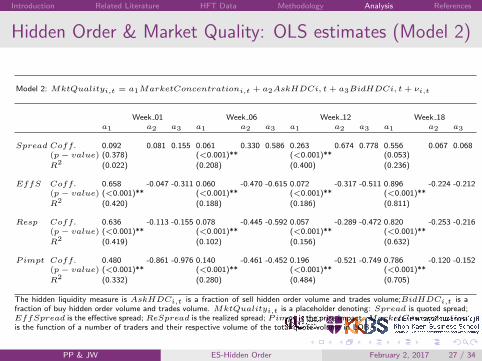
Hidden Order & Market Quality: OLS estimates (Model 2)
Model 2: MktQualityi,t = a1MarketConcentrationi,t + a2AskHDCi, t + a3BidHDCi, t + νi,t
Week 01 Week 06 Week 12 Week 18a1 a2 a3 a1 a2 a3 a1 a2 a3 a1 a2 a3
Spread Coff. 0.092 0.081 0.155 0.061 0.330 0.586 0.263 0.674 0.778 0.556 0.067 0.068(p− value) (0.378) (<0.001)** (<0.001)** (0.053)
R2 (0.022) (0.208) (0.400) (0.236)
EffS Coff. 0.658 -0.047 -0.311 0.060 -0.470 -0.615 0.072 -0.317 -0.511 0.896 -0.224 -0.212(p− value) (<0.001)** (<0.001)** (<0.001)** (<0.001)**
R2 (0.420) (0.188) (0.186) (0.811)
Resp Coff. 0.636 -0.113 -0.155 0.078 -0.445 -0.592 0.057 -0.289 -0.472 0.820 -0.253 -0.216(p− value) (<0.001)** (<0.001)** (<0.001)** (<0.001)**
R2 (0.419) (0.102) (0.156) (0.632)
Pimpt Coff. 0.480 -0.861 -0.976 0.140 -0.461 -0.452 0.196 -0.521 -0.749 0.786 -0.120 -0.152(p− value) (<0.001)** (<0.001)** (<0.001)** (<0.001)**
R2 (0.332) (0.280) (0.484) (0.705)
The hidden liquidity measure is AskHDCi,t is a fraction of sell hidden order volume and trades volume;BidHDCi,t is afraction of buy hidden order volume and trades volume. MktQualityi,t is a placeholder denoting: Spread is quoted spread;EffSpread is the effective spread; ReSpread is the realized spread; Pimpt is the price impact. MarketConcentrationis the function of a number of traders and their respective volume of the total quote volume in LOB.
PP & JW ES-Hidden Order February 2, 2017 27 / 34
Introduction Related Literature HFT Data Methodology Analysis References
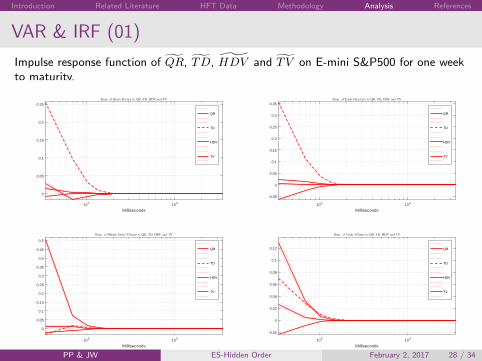
VAR & IRF (01)
Impulse response function of Q̃R, T̃D, H̃DV and T̃ V on E-mini S&P500 for one weekto maturity.
Milliseconds102 103
0
0.05
0.1
0.15
0.2
0.25
Resp. of Quote Return to QR, TD, HDV and TV
QR
TD
HDV
TV
Milliseconds102 103
-0.05
0
0.05
0.1
0.15
0.2
0.25
0.3
0.35Resp. of Trade Direction to QR, TD, HDV and TV
QR
TD
HDV
TV
Milliseconds102 103
0
0.05
0.1
0.15
0.2
0.25
0.3
0.35
0.4
0.45
0.5
Resp. of Hidden Order Volume to QR, TD, HDV and TV
QR
TD
HDV
TV
Milliseconds102 103
-0.02
0
0.02
0.04
0.06
0.08
0.1
0.12
Resp. of Trade Volume to QR, TD, HDV and TV
QR
TD
HDV
TV
PP & JW ES-Hidden Order February 2, 2017 28 / 34
Introduction Related Literature HFT Data Methodology Analysis References
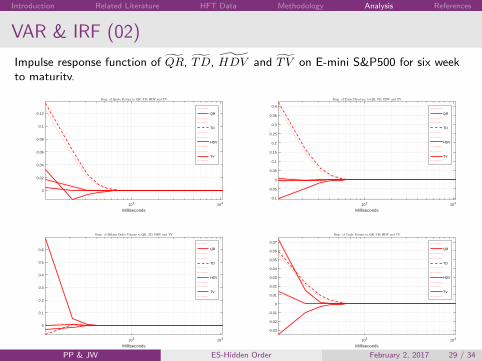
VAR & IRF (02)
Impulse response function of Q̃R, T̃D, H̃DV and T̃ V on E-mini S&P500 for six weekto maturity.
Milliseconds102 103
0
0.02
0.04
0.06
0.08
0.1
0.12
Resp. of Quote Return to QR, TD, HDV and TV
QR
TD
HDV
TV
Milliseconds102 103
-0.1
-0.05
0
0.05
0.1
0.15
0.2
0.25
0.3
0.35
0.4
Resp. of Trade Direction to QR, TD, HDV and TV
QR
TD
HDV
TV
Milliseconds102 103
0
0.1
0.2
0.3
0.4
0.5
0.6
Resp. of Hidden Order Volume to QR, TD, HDV and TV
QR
TD
HDV
TV
Milliseconds102 103
-0.03
-0.02
-0.01
0
0.01
0.02
0.03
0.04
0.05
0.06
0.07
Resp. of Trade Volume to QR, TD, HDV and TV
QR
TD
HDV
TV
PP & JW ES-Hidden Order February 2, 2017 29 / 34
Introduction Related Literature HFT Data Methodology Analysis References
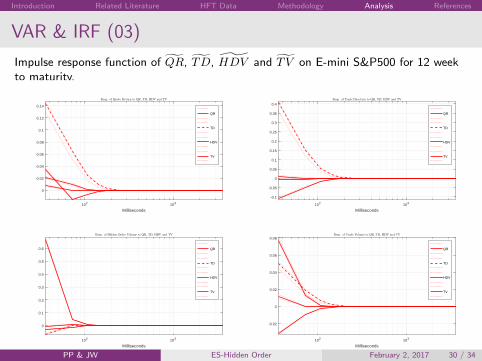
VAR & IRF (03)
Impulse response function of Q̃R, T̃D, H̃DV and T̃ V on E-mini S&P500 for 12 weekto maturity.
Milliseconds102 103
0
0.02
0.04
0.06
0.08
0.1
0.12
0.14
Resp. of Quote Return to QR, TD, HDV and TV
QR
TD
HDV
TV
Milliseconds102 103
-0.1
-0.05
0
0.05
0.1
0.15
0.2
0.25
0.3
0.35
0.4Resp. of Trade Direction to QR, TD, HDV and TV
QR
TD
HDV
TV
Milliseconds102 103
0
0.1
0.2
0.3
0.4
0.5
0.6
Resp. of Hidden Order Volume to QR, TD, HDV and TV
QR
TD
HDV
TV
Milliseconds102 103
-0.02
0
0.02
0.04
0.06
0.08Resp. of Trade Volume to QR, TD, HDV and TV
QR
TD
HDV
TV
PP & JW ES-Hidden Order February 2, 2017 30 / 34
Introduction Related Literature HFT Data Methodology Analysis References
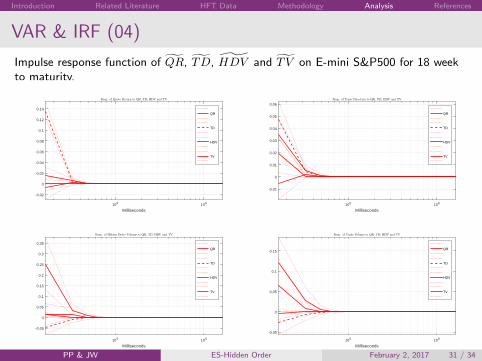
VAR & IRF (04)
Impulse response function of Q̃R, T̃D, H̃DV and T̃ V on E-mini S&P500 for 18 weekto maturity.
Milliseconds105 106
-0.02
0
0.02
0.04
0.06
0.08
0.1
0.12
0.14
Resp. of Quote Return to QR, TD, HDV and TV
QR
TD
HDV
TV
Milliseconds105 106
-0.01
0
0.01
0.02
0.03
0.04
0.05
0.06
Resp. of Trade Direction to QR, TD, HDV and TV
QR
TD
HDV
TV
Milliseconds105 106
-0.05
0
0.05
0.1
0.15
0.2
0.25
0.3
0.35
Resp. of Hidden Order Volume to QR, TD, HDV and TV
QR
TD
HDV
TV
Milliseconds105 106
-0.05
0
0.05
0.1
0.15
Resp. of Trade Volume to QR, TD, HDV and TV
QR
TD
HDV
TV
PP & JW ES-Hidden Order February 2, 2017 31 / 34
Introduction Related Literature HFT Data Methodology Analysis References
Conclusion
We develop a detection algorithm to detect hidden order in limit order book usingpublicly available data
The result of price impact shows that traders who using invisible order strategy area strategies trader who trades based on their privileged information which theyknow when to submit their hidden orders.
The empirical results show that hidden liquidity positively improves the traditionalyardsticks of market quality except inside quote spread.
Our evidence is more favorable to the notion that hidden order activity improvesmarket quality whether high or low-frequency trading condition for E-mini S&P500index future market. The hidden order activity favor to trading volume as theHDV is increased when the TV increase.
PP & JW ES-Hidden Order February 2, 2017 32 / 34

Introduction Related Literature HFT Data Methodology Analysis References
Thanks!
PP & JW ES-Hidden Order February 2, 2017 33 / 34
Introduction Related Literature HFT Data Methodology Analysis References
References
Aitken, M. J., H. Berkman, and D. Mak (2001). The use of undisclosed limit orders on the australian stock exchange. Journalof Banking & Finance 25(8), 1589–1603.
Bessembinder, H., M. Panayides, and K. Venkataraman (2009). Hidden liquidity: an analysis of order exposure strategies inelectronic stock markets. Journal of Financial Economics 94(3), 361–383.
Bloomfield, R., M. O’Hara, and G. Saar (2015). Hidden liquidity: Some new light on dark trading. The Journal ofFinance 70(5), 2227–2274.
De Winne, R. and C. D’hondt (2007). Hide-and-seek in the market: placing and detecting hidden orders. Review ofFinance 11(4), 663–692.
Frey, S. and P. Sand̊as (2009). The impact of iceberg orders in limit order books. In AFA 2009 San Francisco Meetings Paper.
Gozluklu, A. E. et al. (2009). Pre-trade transparency and informed trading: An experimental approach to hidden liquidity. InESA European Meeting. Citeseer.
Hasbrouck, J. and G. Saar (2013). Low-latency trading. Journal of Financial Markets 16(4), 646–679.
Manyika, J., M. Chui, B. Brown, J. Bughin, R. Dobbs, C. Roxburgh, and A. H. Byers (2011). Big data: The next frontier forinnovation, competition, and productivity.
O’Hara, M. (2015). High frequency market microstructure. Journal of Financial Economics 116(2), 257–270.
Pardo, A. and R. Pascual (2012). On the hidden side of liquidity. The European Journal of Finance 18(10), 949–967.
PP & JW ES-Hidden Order February 2, 2017 34 / 34