TERAHERTZ GENERATION AND ITS APPLICATIONS
113
The Pennsylvania State University The Graduate School Department of Electrical Engineering TERAHERTZ GENERATION AND ITS APPLICATIONS A Dissertation in Electrical Engineering by Meng-Ku Chen Submitted in Partial Fulfillment of the Requirements for the Degree of Doctor of Philosophy December 2010
Transcript of TERAHERTZ GENERATION AND ITS APPLICATIONS

The Pennsylvania State University
The Graduate School
Department of Electrical Engineering
TERAHERTZ GENERATION AND ITS APPLICATIONS
A Dissertation in
Electrical Engineering
by
Meng-Ku Chen
Submitted in Partial Fulfillment
of the Requirements
for the Degree of
Doctor of Philosophy
December 2010

ii
The dissertation of Meng-Ku Chen was reviewed and approved* by the following:
Stuart (Shizhuo) Yin
Professor of Electrical Engineering
Dissertation Advisor
Chair of Committee
Zhiwen Liu
Associate Professor of Electrical Engineering
James Breakall
Professor of Electrical Engineering
Long-Qing Chen
Professor of Materials Science and Engineering
Kenneth Jenkins
Professor of Electrical Engineering
Head of the Department of Electrical Engineering
*Signatures are on file in the Graduate School

iii
ABSTRACT
In this dissertation, Terahertz (THz) generation and its applications are investigated.
Several ways to generate THz radiation are theoretically and experimentally demonstrated,
including THz generation from nonlinear crystals via optical rectification, photoconductive
antennas via time-varying current, and air plasmas based on ponderomotive force and
plasma current driven by an asymmetric laser field. However, these THz generation
approaches have low conversion efficiency from optical excitation power to THz radiation
power. Therefore, we demonstrate a new way to recycle the residual femtosecond laser
input beam, which increases the overall conversion efficiency from femsecond laser input
to THz output and consequently enhances the intensity of THz radiation. Then, terahertz
plasmonic lenses based on semiconductor micro-slit are demonstrated. Terahertz plasmonic
lenses have not only higher terahertz transmission compared to conventional terahertz
lenses but also the focal length tuning ability. One of the most important terahertz
applications, terahertz spectroscopy, is also presented. Finally, several future works
including nonlinear terahertz, two-dimensional terahertz plasmonic lenses, and terahertz
generation from laser-induced plasma in solid targets are discussed.

iv
TABLE OF CONTENTS
LIST OF FIGURES .……………………………………….………………………….….vi
LIST OF TABLES …………………………………………………………………….…ix
ACKNOWLEDGEMENTS ………………………………………………………….…x
Chapter 1 Introduction …………...……………………………...……………………….…1
2.1 - Introduction to terahertz technology ……………………………………….......2 2.2 - Organization ………………….………………………………………………..…7
Chapter 2 Generation of Terahertz pulses via optical rectification in nonlinear optical crystals and carrier acceleration in photoconductive antennas ……….……………….…..10
2.1 - Femtosecond Laser System …………………………………………….…….…10 2.2 - Electro-optic sampling technique ………………..…………………………..…14 2.3 - Terahertz generation in ZnTe crystal ………………………………………...…17 2.4 - Terahertz generation based on photoconductive antennas …………………...…23
Chapter 3 Generation of Terahertz pulses in laser-induced air plasma ………….…...……30
3.1 - THz generation in laser-induced air plasma based on ponderomotive force ………………………………………………………………………………………31 3.2 - THz generation in laser-induced air plasma using laser pulses composed of both fundamental and second-harmonic waves ……………...…………….………………34 3.3 - Experiment results of THz Generation in Laser-induced Air Plasma …………………………………………...……………...…………….………………38
Chapter 4 Generation of Terahertz pulses in laser-induced multiple air plasmas ……...….41
4.1 - Introduction ………...………………………………………………………...…41 4.2 - Experiment …………………………………………………………………...…44 4.3 - Results and discussion ……………………………….………………………....46 4.4 - Conclusion …………………………………………………………………...…53
Chapter 5 Tunable terahertz plasmonic lenses based on semiconductor micro-slits ………………………………………………………………………………….……55

v
5.1 - Introduction ……………………………………………………………………..57 5.2 - Principle ………………………………………………………………………...59 5.3 - Lens design …………….……………………………………………………….66 5.4 - Focal length tuning …………………………..…………………………………69 5.5 - Conclusion ……………………………………………………….……………..71
Chapter 6 Terahertz spectroscopy …………………………………….………………...…73
6.1 - Introduction …………….……………………………….………………………73 6.2 - THz Time-domain Spectroscopy ……………………….………………………74 6.3 - Energy Level Calculation …………………………..………..…………………76 6.4 - Experiment and Simulation Results from THz Time-domain Spectroscopy and Energy Level Calculation ……………………………..……………….……………..81
Chapter 7 Future works ……………………………………………………………..……87
7.1 - The development of high THz radiation power …………………………….…..87 7.2 - Nonlinear THz …………………………………………………..…………...…88 7.3 - Two-dimensional terahertz plasmonic lenses ………….………..…………...…92 7.4 - Terahertz generation from laser-induced plasma in solid targets using laser pulses composed of both fundamental and second-harmonic waves …………………......…93
Chapter 8 Conclusions …………………………………………………………………….95
REFERENCES ..………………………………………..………………………………….97
APPENDIX: PUBLICATIONS …………………..…...…………………………………101

vi
LIST OF FIGURES
Fig. 1.1. THz band in the electromagnetic spectrum (Hz) .….…………………………...2
Fig. 2.1. Schematic diagram of a pulse stretcher ………………………...…….………….12
Fig. 2.2. Schematic diagram of a regenerative amplifier ………………………………….13
Fig. 2.3. Schematic diagram of a multipass amplifier ……………………..………………14
Fig. 2.4. The basic working principle of the differential detector …………………………15
Fig. 2.5 The direction of the polarization of THz and probe beams ………………………16
Fig. 2.6. Experimental setup of THz generation in 1mm <110> oriented ZnTe crystal …..21
Fig. 2.7. (a). Terahertz waveforms obtained by scanning probe beam delay line. (b). the corresponding spectrum obtained from the Fourier transform of the THz waveforms ……22
Fig. 2.8. THz pulse emission from a PC antenna: image obtained from [1] ……..………24
Fig. 2.9. Schematic of a large-aperture PC antenna excited at normal incidence. Eb is the bias electric field and Js(t) is an idealized surface current density. Ein(t) and Hin(t) are the THz electric and magnetic fields directly radiated into the substrate; Eout(t) and Hout(t) are the fields radiated into free space: image and figure caption obtained from [1] ……....…24
Fig. 2.10. (a). Terahertz waveforms obtained by scanning probe beam delay line. (b). the corresponding spectrum obtained from the Fourier transform of the THz waveforms ……29
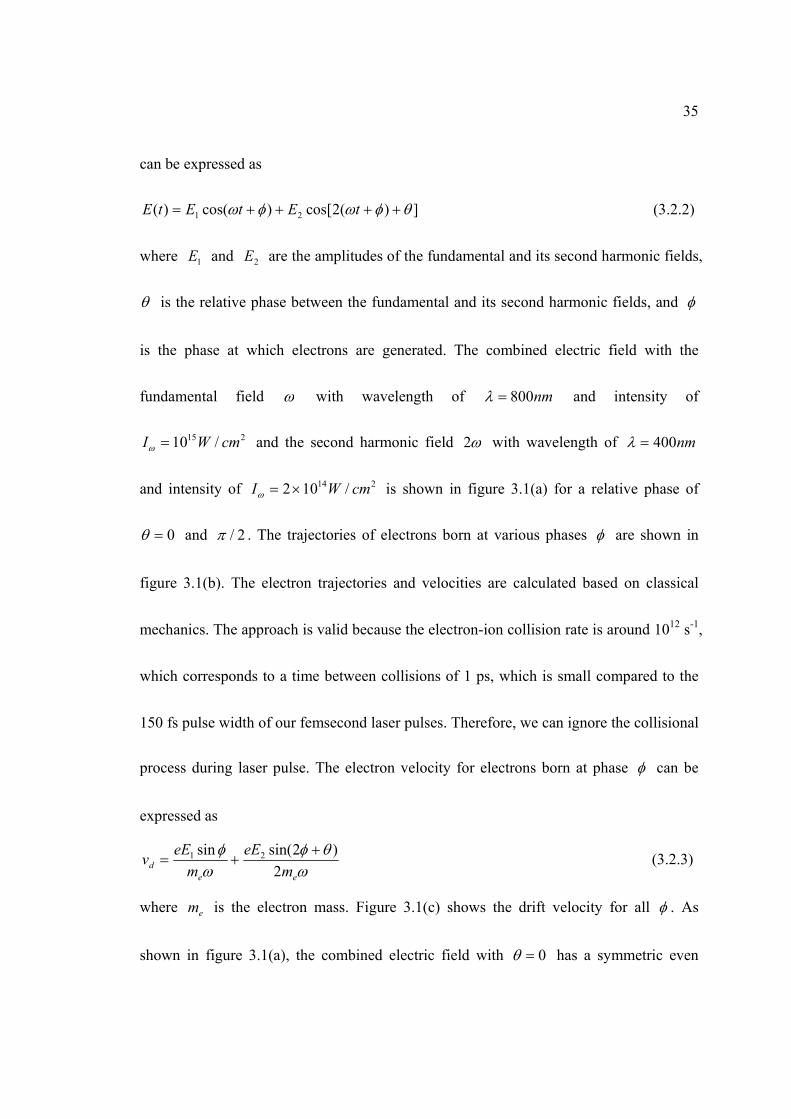
Fig. 3.1. (a). Laser fields with the fundamental and second harmonic with a relative phase θ = 0 and π/2. (b) Electron trajectories born at various phases of φ = −9π/10, −π/10, π/10, and 9π/10. (c) Drift electron velocity versus φ (solid line), overlaid with the laser field (dashed line). Image obtained from [2] …………………………………………………………37
Fig. 3.2. Experimental setup of THz generation in air plasma ………………………….…39
Fig. 3.3. (a). Terahertz waveforms obtained by scanning probe beam delay line. (b). The corresponding spectrum obtained from the Fourier transform of the THz waveforms ……40
Fig. 4.1. Experimental setup of THz generation in laser-induced multiple air plasmas. BS, beam splitter; L1 and L2, lenses with focal lengths of 10cm; λ/4, quarter-wave plate; WP, Wollaston prism; BBO, 100-μm-thick β-barium borate crystal plate; Si, Si wafer ……….45

vii
Fig. 4.2. (a) THz waveforms from one, two, and three air plasmas obtained by scanning probe beam delay line. (b) the corresponding spectra obtained from the Fourier transform of the THz waveforms ……………………………………………………………………..47
Fig. 4.3. THz waveforms from one and two air plasmas obtained by scanning probe beam delay line with different incident angle on cover glass ……………………………………50
Fig 4.4. The peak THz amplitude from two air plasmas as a function of incident angle on cover glass …………………………………………………………………………………43
Fig. 5.1. THz transmission spectrum of silicon: image obtained from [3] ………………56
Fig. 5.2. THz absorption spectrum of Teflon: image obtained from [3] …………………57
Fig. 5.3. An planar interface consisting of two semi-infinite nonmagnetic media with dielectric functions 1 and 2 ………………………………………………………………60
Fig. 5.4. The dispersion relations of surface plasmons, light in vacuum, and ATR coupler ………………………………………………………………………………….....……..…62
Fig 5.5. ATR coupler with a metal film with a thickness of several tenth nm contacting a prism …………………………………………………………………………………….…63
Fig. 5.6. The real and imaginary parts of propagation constant of the SPPs in the InSb slit as a function of slit width at different temperatures ……………………………….………65
Fig. 5.7 (a) The scheme of InSb micro-slits with slit widths A = 80m, B = 54m, C = 44m, D = 38m, E = 34m, and F = 32m and the thickness of InSb film d = 300m. (b) The phase distribution (square dots) and the curve (line) which represents Eq. (3) with f = 10mm. (c) THz transmission as function of the fraction of slit area. (d) The FDTD simulated result of intensity distribution ………………………………………………..…68
Fig. 5.8. The FDTD simulated results of intensity distribution with four different temperatures with the same design shown in Fig. 2. The black lines in the figures indicate the focus points. The focal lengths for (a) 325K, (b) 295K, (c) 270K, and (d) 255K are 3.77mm, 3.74mm, 3.5mm, and 3.05mm, respectively ……………………………….……70
Fig. 5.9. The phase distributions according to the slit location and width with four different temperatures ……………………….………………………………………………………71
Fig. 6.1. The setup of THz time-domain spectroscopy …………………………………....75
Fig. 6.2. The optimized (a) RDX and (c) urea molecular structure ……………..……...…82

viii
Fig. 6.3. The vibrational and rotational energy levels of (a) RDX and (b) urea molecules ……………………………………………………………………………………………83
Fig. 6.4. The experiment setup for THz-TDS ……………………………………………85
Fig. 6.5. THz absorption spectrum from TNT 0.1mg/ml in MeOH:AcCN(1:1) ………..…86
Fig. 7.1. Experimental setup of THz second harmonic generation through BBO crystal. BS, beam splitter; L1 and L2, lenses with focal lengths of 10cm; λ/4, quarter-wave plate; WP, Wollaston prism …………………………………………………………………………..90
Fig. 7.2. THz radiation spectra from ZnTe with different conditions ……………………91

ix
LIST OF TABLES
Table 5.1. The temperature dependent plasma frequency and collision rate of InSb: image obtained from [4] ………………………………………….……………………………64
Table 6.1. THz transmissive properties of common materials encountered during security screenings. N, the number of layers, indicates the number of layers that result in a signal-to-noise ratio of 1: image obtained from [5] ………………………………………………74
x
ACKNOWLEDGEMENTS
First of all, I would like to express my sincere appreciation to my advisor, Dr. Stuart Yin,
for his advice, support, and guidance throughout the duration of my doctoral research. His
encouragement and help made the completion of this work possible. I would also like to
thank Dr. Zhiwen Liu for many advices on my researches and being my dissertation
committee. I would also like to thank Dr. Rongqing Hui for his valuable input on my
researches. I would also like to show my gratitude to Dr. James Breakall and Dr. Long-Qing
Chen for valuable advice and suggestions as members of my dissertation committee.
I would like to thank Jae Hun Kim for his help on our femtosecond laser systems and in my
early doctoral research. I am very thankful to Yaohui, Hao, Chia-En, Yun-Ching, Peng,
Jimmy, Chao, Jon, Shaoying, Qin, and Chun for their assistances in many experiments. I
would also like to thank Dr. Ping Lin for his help on simulations.
Finally, I would like to thank my parents and my brother for their love and support. Without
them, I wouldn’t be able to make this far.

1
Chapter 1
Introduction
Terahertz (THz) radiation, which is used to refer to the frequency band
typically from 0.1 THz to 10 THz, has attracted a great deal of interest due to its many
applications such as THz imaging and THz spectroscopy [6-8]. Today, THz technology is
finding use in many sectors such as semiconductor, medical sciences, homeland security,
and information technology. Fig. 1.1 shows that the THz region of the electromagnetic
spectrum lies between infrared and microwave regions. The THz frequency band not long
ago was called “THz gap”. However, this gap has been filled up for the last two decades.
Photonics technologies have made much progress from the high frequency end and
electronics technologies also have made their way from low frequency end. High
atmospheric absorption limited the early development of THz science. Nevertheless, this
situation has been changed in the past 20 years because many new and high power THz
sources provided by advanced material research have become more accessible, which
also benefits the physics research and commercial applications in THz area. THz
technology is now a very active research field. In this dissertation, we focus on several
important areas in THz research field such as THz generation, THz detection, THz optics
components, and THz spectroscopy. In every aspect, this dissertation provides not only

2
the theoretical description but also the experimental demonstrations.
1012 1014 1016 10181010108106
THz gapIR UV X-rayMicrowaveRadio
1012 1014 1016 10181010108106
THz gapIR UV X-rayMicrowaveRadio
Fig. 1.1. THz band in the electromagnetic spectrum (Hz).
1.1 – Introduction to terahertz technology
The first part of this chapter gives a brief review on the THz technology,
including THz generation and detection, THz components, and THz applications. In the
second part, the organization of this dissertation and the brief introductions of every
chapter are addressed.
There are three major approaches to generate THz radiation, which are optical
THz generation [9], THz quantum cascade laser [10], and THz generation from solid-
state electronic devices [11]. THz quantum cascade lasers emit THz radiation through the
electron relaxation between subbands of quantum wells. Several solid-state electronic
devices can also produce THz radiation near or below 1 THz such as resonant tunneling
diodes which use the slot antenna to couple the third harmonic of the fundamental 342

3
GHz oscillation to produce THz wave around 1 THz. Because this dissertation focuses on
the optical THz generation approach, in this section, optical THz generation will be
briefly introduced. The Optical THz generation can be divided into two categories, which
are THz generation in nonlinear media and THz radiation generated from accelerating
electrons. In nonlinear media, the incident electromagnetic waves undergo nonlinear
frequency conversion, which is based on the second order nonlinear properties of the
materials. Many nonlinear media have been proved to have the ability to generate THz
radiation through optical excitation, such as GaAs, GaSe, GaP, ZnTe, CdTe, DAST, and
LiNbO3. Two types of second order nonlinear processes are involved in the THz
generation in the nonlinear media. One is the optical rectification, which is limited to
femtosecond laser excitation. Femtosecond laser pulses have a broad spectrum, which via
optical rectification in nonlinear media can generate THz pulses with the shape of the
optical pulse envelope. The other second order process is difference frequency generation.
Two CW optical beams with frequency difference in THz range can generate CW THz
radiation via difference frequency generation in nonlinear media.
THz radiation can also be generated from accelerating electrons. The time-
varying currents produced by the accelerating electrons radiate electromagnetic waves.
The most popular THz radiation device based on the accelerating electrons is

4
photoconductive antennas excited by laser beams. A laser beam illuminates the gap
between two electrodes on the photoconductive antenna surface and generates
photocarriers. The photocarriers can be accelerated by the DC bias field between two
electrodes and produce the photocurrent. This photocurrent varying in time is
proportional to the laser beam intensity. Therefore, THz pulses can be generated by
femtosecond laser pulses, and CW THz radiation can be produced by mixing two laser
beams with different frequencies to form an optical beat. Another important medium used
to generate THz radiation from accelerating electrons is air plasmas. There are two
mechanisms for THz generation in air plasma. One is the ponderomotively induced space
charge field created by the laser field gradient. The other one is the asymmetric laser field
by mixing a fundamental beam and its second harmonic beam. In both cases, electric
fields can accelerate the free electrons generated by the photo-ionization via femtosecond
laser pulse excitation. Consequently, the current surge from the accelerating electrons
generates THz pulses.
The most important THz detection method is the electro-optic sampling
technique which is based on the Pockels effect in electro-optic crystals. The electro-optic
sampling technique is a time domain THz detection method. Due to its time domain
detection characteristic, it offers ultrawideband spectrum detection ability. Many

5
materials have been used for electro-optic sampling, such as ZnTe and BBO crystals. The
electro-optic sampling measures the electric field induced birefringence in a nonlinear
crystal proportional to the applied field amplitude. The photoconductive antennas can
also be used for time domain THz detection. The THz electric field induces the
photocurrent in the electrode gap by driving the free carriers generated by optical probe
pulse. Another type of THz detection method is based on the thermal absorption. Helium-
cooled silicon, germanium, and InSb bolometers are the most common systems based on
the thermal absorption. Although they provide high sensitivity for THz detection,
compared to the time domain THz detection method, bolometers lack for the frequency
spectrum detection ability. Interferometer is often used to extract the spectral information
for bolometer detection. Several thermal detectors such as Golay cells which are based on
induced thermal expansion of gas and pyroelectric devices which are based on
spontaneous polarization change are also commonly used.
THz optics is also a very important area. Many optical components such as
glasses used in the optical frequency are useless in the THz frequency range because the
losses are too high. Some polymer and semiconductor materials have high THz
transmission, such as Teflon and silicon. Therefore, THz optical components such as
lenses and windows are often made of those transmissive THz materials. Metal wire grids

6
are commonly used as THz polarizers. Thin metallic meshes are used as THz bandpass
filters. Recently, metamaterials have drawn a lot of attention because their unusual
electromagnetic properties which give an opportunity to manipulate electromagnetic
wave in different ways. Therefore, metamaterials have an important role in the future
THz optical components development.
THz radiation has high transmission in many dielectric materials such as paper,
clothes, and wood. Also, THz radiation is harmless for human body because its relatively
low photo energy will not cause ionization in human body. These properties make THz
radiation an excellent candidate for concealed objects detection and imaging. For
concealed objects, optical detection is useless because optical wave can not even
penetrate the first layer, which is usually clothes or paper, around the concealed objects.
For better penetration, X-ray detection method might be used. However, the high photo
energy of X-ray will induce photo ionization in human body, which gives the health issue.
THz radiation overcomes those difficulties. Consequently, THz imaging and spectroscopy
have become active research areas for the last decade.

7
1.2 – Organization
In this dissertation, several important THz research areas are discussed,
including THz generation, THz optical component, and THz applications. The
organization of this dissertation and the content of every chapter are briefly introduced as
follows. Although all the experiment results in this thesis were obtained in our
lab, the theories and experiments in chapter 2, 3, and 6 had been done by other
people.
Chapter 2 describes the femtosecond laser system which is the key source of
the optical excitation for the optical THz generation. The time domain THz detection
based on electro-optic sampling technique is also discussed. Then, the theory and
experiment results of THz generation through optical rectification from nonlinear crystal
ZnTe are addressed. Finally, the theory and experiment results of THz generation from
photoconductive antennas are presented.
Chapter 3 focuses on the THz generation in laser-induced air plasma. The
theories of THz generation in laser-induced air plasma based on the ponderomotive field
and asymmetric field are introduced. The experiment results of THz generation in laser-
induced air plasma using one fundamental laser beam and two laser beams including one
fundamental beam and its second harmonic beam are also included.

8
Chapter 4 investigates the THz generation in multiple laser-induced air plasmas.
Further theoretical discusses on THz generation in laser-induced air plasma is presented.
The systematic experiment results of THz generation in multiple air plasmas are also
included. The experiment results show that, compared to the intensity of THz radiation
from single air plasma, higher THz radiation intensity from multiple air plasmas can be
achieved. The higher intensity of THz radiation is helpful for THz remote sensing and
imaging.
Chapter 5 investigates the tunable terahertz plasmonic lenses based on InSb
semiconductor micro-slits. The theory of surface plasmon propagation on metal and
semiconductor surfaces is discussed. The simulation results show that the focus length
tuning can be realized by temperature control. The simulation results also show that,
compared to conventional THz lenses, higher THz transmission of this THz plasmonic
lens can be achieved.
Chapter 6 describes one of the THz applications, which is THz spectroscopy.
The theories of THz time-domain spectroscopy and energy levels calculation are
presented. The calculation results of vibrational states of explosives show that several
spectroscopic signatures lie in the THz frequency range, which is also consistent with
experiment results. The experiment results of THz time-domain spectroscopy are also

9
included.
Chapter 7 discusses several potential future works including nonlinear THz,
two-dimensional THz plasmonic lenses, and Terahertz generation from laser-induced
plasma in solid targets using laser pulses composed of both fundamental and second-
harmonic waves.
Chapter 8 gives a conclusion of this dissertation.

10
Chapter 2
Generation of Terahertz pulses via optical rectification in nonlinear optical crystals
and carrier acceleration in photoconductive antennas
In this chapter, the femtosecond laser system which is used as the optical
excitation source for the THz generation is introduced. The femtosecond laser plays a
very important role in THz pulses generation. The time domain THz detection based on
electro-optic sampling technique is also discussed. Then, the theory and experiment
results of THz generation through optical rectification from nonlinear crystal ZnTe are
addressed. Finally, the theory and experiment results of THz generation from
photoconductive antennas are presented.
2.1 – Femtosecond Laser System
Femtosecond laser system is a very important component for THz pulse
generation from nonlinear crystals and air plasma through optical excitation. The output
THz intensity from nonlinear crystals and air plasma increases with the increase of the
optical intensity of femtosecond laser. The output THz bandwidth also increases with the
increase of the bandwidth of femtosecond laser. Therefore, high intensity and ultrashort
11
laser pulses are needed for the THz pulse generation from nonlinear crystals and air
plasma through optical excitation. In this section, a femtosecond laser system which
provides high intensity and ultrashort laser pulses is described.
Our femtosecond laser system (TITAN Femtosecond Pulse system, Quantronix)
is composed of a pump laser, a seed laser, and a Ti:Sapphire amplifier system. The pump
laser (Falcon-527 High-Power Second Harmonic Nd:YLF Laser, Quantronix) employs
Nd:YLF crystal as laser gain medium, which has longer fluorescence lifetime and
consequently higher energy storage capability compared to Nd:YAG [12]. The 1053nm
emission from Nd:YLF is acousto-optic Q-switched and then frequency-doubled through
LBO crystal, which provides 527 nm output pulses. At normal operation, the output pulse
has the pulse energy ~ 17 mJ and pulse width ~ 120 ns at a repetition rate of 1 KHz. The
seed laser (Femtolite, IMRA) is an ultrafast mode locked fiber laser, which provides 780
nm pulses with the pulse energy ~ 0.4 nJ and pulse width ~ 100 fs at a repetition rate of
48 MHz. With the intensity of the seed laser, it is very difficult to use the seed laser
output to generate THz radiation from nonlinear crystals and air plasma through optical
excitation. Therefore, an amplifier system is needed to amplify the seed laser pulses to
obtain high intensity laser pulses.
The seed laser pulses are amplified by pump laser through a Ti:Sapphire
12
amplifier system which consists of multiple amplification stages. The technique of the
amplification process is called chirped-pulse amplification (CPA). The CPA process is
described as follows. First, the seed laser pulses are stretched through a stretcher. The
principle schematic of a stretcher is shown in Fig. 2.1. The short pulses from seed laser
are stretched to picosecond level because of the different traveling distances of the
different frequency components. The reason to lengthen the pulses in time is to obtain
higher pulse energy and avoid very high peak power in the laser amplification process.
GratingGrating
LensLens
To RGAFrom Seed laser
Mirror
GratingGrating
LensLens
To RGAFrom Seed laser
Mirror
Fig. 2.1. Schematic diagram of a pulse stretcher [13].
The stretched seed laser pulses from the stretcher are then sent into a regenerative
amplifier (RGA). The schematic of a RGA is shown in Fig. 2.2. The polarization of the
seed beam from stretcher is vertical, which can be reflected by polariaer #1 and #2. Due
to the static quarter-wave operation of Pockels cell, the polarization of the seed beam is

13
changed to horizontal after passing trough the Pockels cell twice, and the horizontal
polarized seed beam would pass through polarization #2. The seed beam is then trapped
and amplified in the RGA cavity after applying a quarter-wave step voltage on the
Pockels cell. After about 15 round trips, the polarization of the seed beam is changed to
vertical by applying the second quarter-wave step voltage, and the seed beam is reflected
by polarizer #2. Then, the polarization of the seed beam is rotated to horizontal after
passing though the isolator. The polarization #1 transmits the horizontal polarized seed
beam to the multipass amplifier (MPA).
Isolator Polarizer #1
Polarizer #2
Pockels cellTi:Sapphire crystal
Pump beam
Seed beam from stretcher
To MPAIsolator Polarizer #1
Polarizer #2
Pockels cellTi:Sapphire crystal
Pump beam
Seed beam from stretcher
To MPA
Fig. 2.2. Schematic diagram of a regenerative amplifier.
From Fig. 2.3, it can be seen that the MPA employs a double pass amplification through
the Ti:Sapphire crystal. The amplified seed beam is then sent to a compressor, which is

14
the reverse operation of the stretcher. After compressor, compressed amplified pulses can
be obtained. Since its complicated two-stage amplifier system, day-to-day maintenance
and special optical alignment skill are required for operation of femtosecond laser system
to maintain the desired output power.
Pump beam
Sead beam from RGA
Ti:Sapphirecrystal
To compressorPump beam
Sead beam from RGA
Ti:Sapphirecrystal
To compressor
Fig. 2.3. Schematic diagram of a multipass amplifier.
2.2 – Electro-optic sampling technique
Electro-optic sampling technique, which is based on the electro-optic effect, is
used for time-domain terahertz detection. This detection method plays a very important
role in the THz time-domain spectroscopy. In this section, the mechanism of THz
detection using electro-optic effect of ZnTe is discussed. The basic idea of THz detection
using electro-optic effect is that the THz beam and the probe beam both are focused on

15
ZnTe crystal and the THz beam can change the refractive index of ZnTe. Therefore,
different polarization components of the probe beam experience different refractive index,
which results in a change in the polarization direction of the probe beam. Then, this
polarization direction change of probe beam can be detected by a differential detector.
Figure 2.4 shows the basic working principle of the differential detector. After passing
through the Wallaston prism, the probe beam is split into two beams with polarization
directions along x axis and y axis respectively. Then, the differential detector detects the
intensity difference between two beams.
Fig. 2.4. The basic working principle of the differential detector.
The intensity difference between two beams is proportional to the THz electric
field. The detail derivation is provided as follows. Figure 2.5 shows the polarization
directions of THz and probe beams.
Wallaston Prism
Differential Detector
ZnTe λ/4 plate

16
Fig. 2.5 The direction of the polarization of THz and probe beams [14].
Due to the cubic structure of ZnTe with point group m34 , the refractive-index ellipsoid is
described by
1222 413,412,411,2
2
2
2
2
2
xyrExzrEyzrEn
z
n
y
n
xTHzTHzTHz (2.2.1)
Here, x, y, and z are defined as crystal axes (100), (010), and (001), respectively. ETHz,1,
ETHz,2, and ETHz,3 are the components of THz field along x, y, and z directions,
respectively. After several coordinate transformations, we can obtain
1)]}2cos(cos[cos1
{
)]}2cos(sin[cos1
{)cos1
(
2412
2
2412
2412
2
rEn
z
rEn
yrEn
x
THz
THzTHz
(2.2.2)
where n )tan2arctan(2 . Now y’ and z’ are on the <110> plane of ZnTe crystal.
For small ETHz field, the refractive indices along y’ and z’ axes are
)]2cos(cos[cos2
)(
)]2cos(sin[cos2
)(
241
3
241
3
'
rEn
nn
rEn
nn
THzz
THzy
(2.2.3)
17
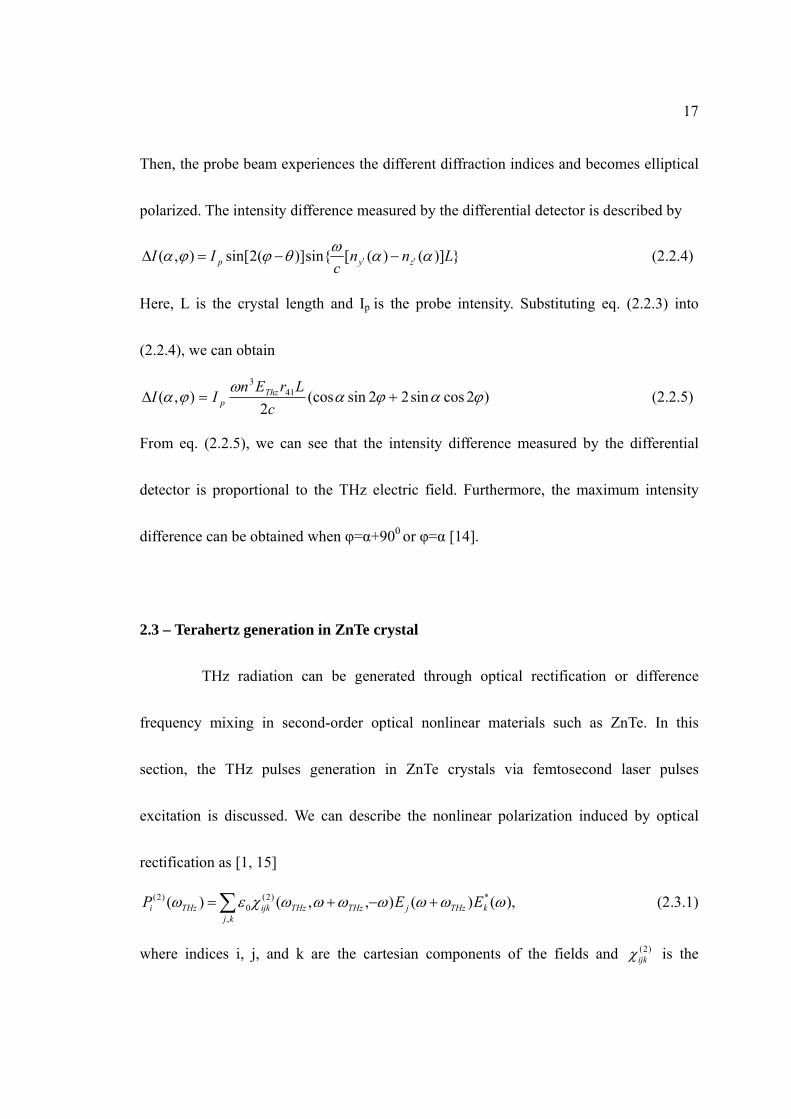
Then, the probe beam experiences the different diffraction indices and becomes elliptical
polarized. The intensity difference measured by the differential detector is described by
})]()([sin{)](2sin[),( Lnnc
II zyp (2.2.4)
Here, L is the crystal length and Ip is the probe intensity. Substituting eq. (2.2.3) into
(2.2.4), we can obtain
)2cossin22sin(cos2
),( 413
c
LrEnII Thz
p (2.2.5)
From eq. (2.2.5), we can see that the intensity difference measured by the differential
detector is proportional to the THz electric field. Furthermore, the maximum intensity
difference can be obtained when φ=α+900 or φ=α [14].
2.3 – Terahertz generation in ZnTe crystal
THz radiation can be generated through optical rectification or difference
frequency mixing in second-order optical nonlinear materials such as ZnTe. In this
section, the THz pulses generation in ZnTe crystals via femtosecond laser pulses
excitation is discussed. We can describe the nonlinear polarization induced by optical
rectification as [1, 15]
,)()(),,()(,
*)2(0
)2( kj
kTHzjTHzTHzijkTHzi EEP (2.3.1)
where indices i, j, and k are the cartesian components of the fields and )2(ijk is the

18
second-order nonlinear susceptibility tensor element. When the indices are permutable,
the second-order nonlinear susceptibility tensor element can be simplified as
,2
1 )2(ijkild (2.3.2)
where
21,1213,3132,23332211
654321
jk
l (2.3.3)
We can rewrite the equation (2.3.1) as the matrix equation
yx
xz
zy
z
y
x
z
y
x
EE
EE
EE
E
E
E
dddddd
dddddd
dddddd
P
P
P
2
2
22
2
2
2
363534333231
262524232221
161514131211
0 (2.3.4)
Because ZnTe crystals are cubic crystals with point group m34 , the nonvanishing tensor
elements would be xyz = xzy = yzx = yxz = zxy = zyx. The nonlinear susceptibility
tensor can be simplified as
36
25
14
00000
00000
00000
d
d
d
d il (2.3.5)
where d14 = d25 = d36. The arbitrary electrical field of femtosecond laser beam can be
written as
19
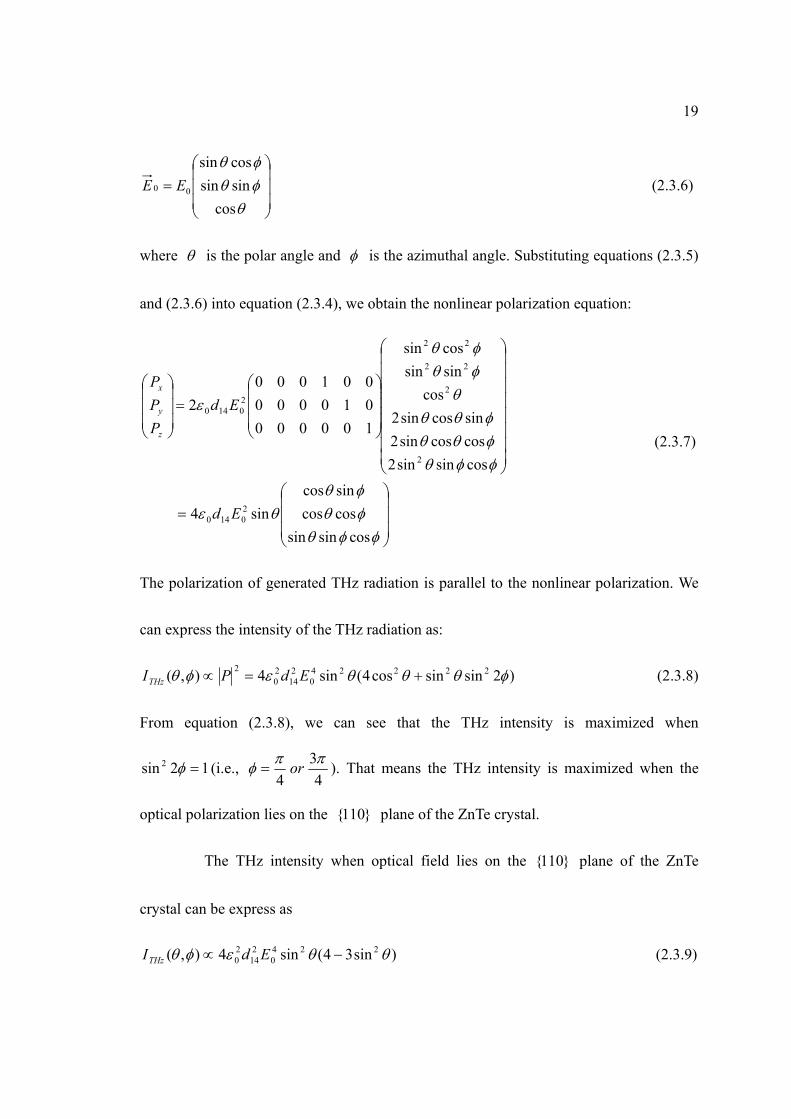
cos
sinsin
cossin
00 EE (2.3.6)
where is the polar angle and is the azimuthal angle. Substituting equations (2.3.5)
and (2.3.6) into equation (2.3.4), we obtain the nonlinear polarization equation:
cossinsin
coscos
sincos
sin4
cossinsin2
coscossin2
sincossin2
cos
sinsin
cossin
100000
010000
001000
2
20140
2
2
22
22
20140
Ed
Ed
P
P
P
z
y
x
(2.3.7)
The polarization of generated THz radiation is parallel to the nonlinear polarization. We
can express the intensity of the THz radiation as:
)2sinsincos4(sin4),( 222240
214
20
2 EdPITHz (2.3.8)
From equation (2.3.8), we can see that the THz intensity is maximized when
12sin 2 (i.e., 4
3
4
or ). That means the THz intensity is maximized when the
optical polarization lies on the }110{ plane of the ZnTe crystal.
The THz intensity when optical field lies on the }110{ plane of the ZnTe
crystal can be express as
)sin34(sin4),( 2240
214
20 EdITHz (2.3.9)
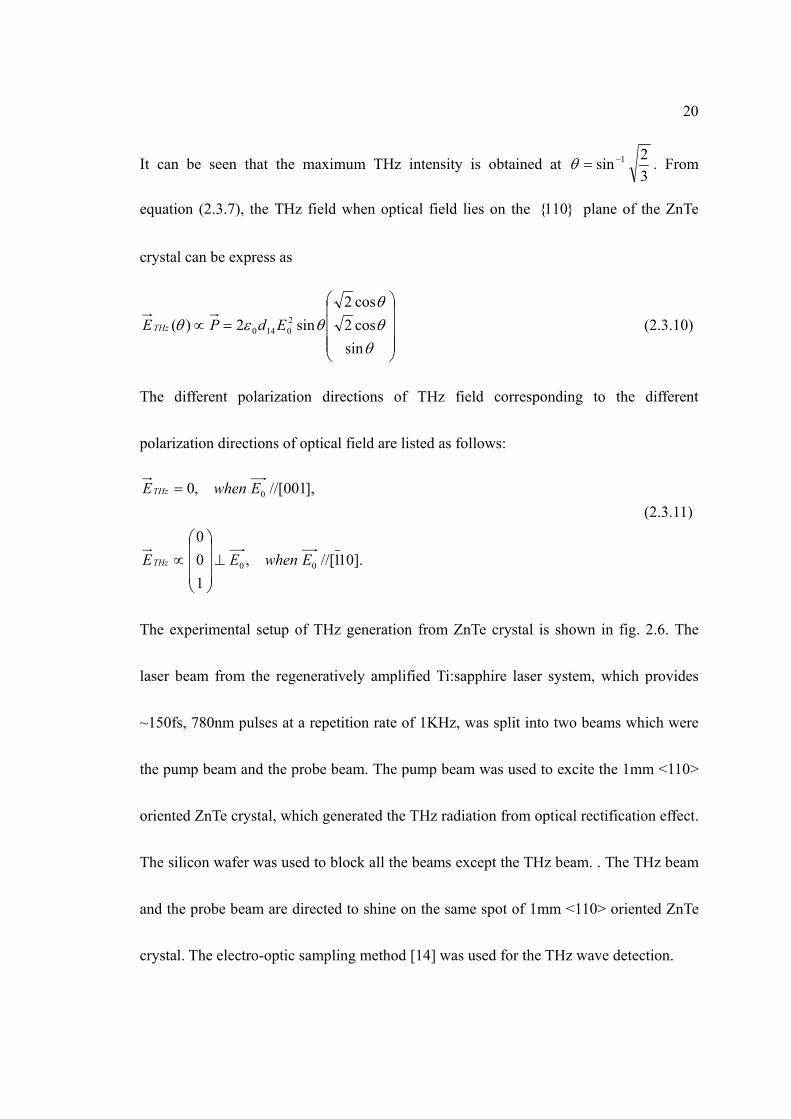
20
It can be seen that the maximum THz intensity is obtained at 3
2sin 1 . From
equation (2.3.7), the THz field when optical field lies on the }110{ plane of the ZnTe
crystal can be express as
sin
cos2
cos2
sin2)( 20140 EdPETHz (2.3.10)
The different polarization directions of THz field corresponding to the different
polarization directions of optical field are listed as follows:
].101//[,
1
0
0
],001//[,0
00
0
EwhenEE
EwhenE
THz
THz
(2.3.11)
The experimental setup of THz generation from ZnTe crystal is shown in fig. 2.6. The
laser beam from the regeneratively amplified Ti:sapphire laser system, which provides
~150fs, 780nm pulses at a repetition rate of 1KHz, was split into two beams which were
the pump beam and the probe beam. The pump beam was used to excite the 1mm <110>
oriented ZnTe crystal, which generated the THz radiation from optical rectification effect.
The silicon wafer was used to block all the beams except the THz beam. . The THz beam
and the probe beam are directed to shine on the same spot of 1mm <110> oriented ZnTe
crystal. The electro-optic sampling method [14] was used for the THz wave detection.

21
Lock-In Amplifier
/4
WF
Balanced Detector
ZnTe
Chopper
Parabolic Mirror #1 Parabolic Mirror #2
Si
Delay Line
Ti:Sapphire Laser System
LensZnTe
Fig. 2.6. Experimental setup of THz generation in 1mm <110> oriented ZnTe crystal.
Figure 2.7(a) shows the Terahertz waveforms obtained by scanning the probe
beam delay line and figure 2.7(b) shows the corresponding spectrum obtained from the
Fourier transform of the THz waveforms.

22
0 2 4 6 8 10 12 14-1.5
-1.0
-0.5
0.0
0.5
1.0
Nor
ma
lize
d a
mp
litu
de
(a
.u.)
Time delay (ps)
2 4 6 8 10
0.01
0.1
1
No
rma
lizd
am
plit
ud
e (
a.u
.)
Frequency (THz)
Fig. 2.7. (a). Terahertz waveforms obtained by scanning probe beam delay line. (b). the
corresponding spectrum obtained from the Fourier transform of the THz waveforms.
(a
)
(b)

23
2.4 – Terahertz generation based on photoconductive antennas
THz pulses can be generated from a photoconductive (PC) antenna with a DC
bias and femtosecond laser excitation pulses. The photoconductivity of PC antennas
made of semiconductors is increased when they are exposed to light, which results from
an increase of the number of free carriers generated by photons. The photon energy must
be large enough to overcome the bandgap of the material. One of the most common used
materials for THz emitters is low-temperature grown gallium arsenide (LT-GaAs). The
carrier lifetime of LT-GaAs is in the subpicosecond range, which results from a high
concentration of defects. This ultrashort carrier lifetime which determines the switch-off
time of the PC antennas is essential for THz pulse generation. The switch-on time of PC
antennas is determined by the function of the laser pulse duration. Figure 2.8 illustrates
the THz pulse emission from a PC antenna. The femtosecond laser pulses with photon
energy larger than the bandgap of the material generate free electrons and holes in the gap
between two electrodes. Then, those free carriers can be accelerated by the DC bias. The
charge density decreases on the time scale of carrier lifetime because of the trapping of
carriers in the defects. The time-varying current arising from the acceleration and decay
of free carriers generates subpicosecond pulses of electromagnetic radiation.
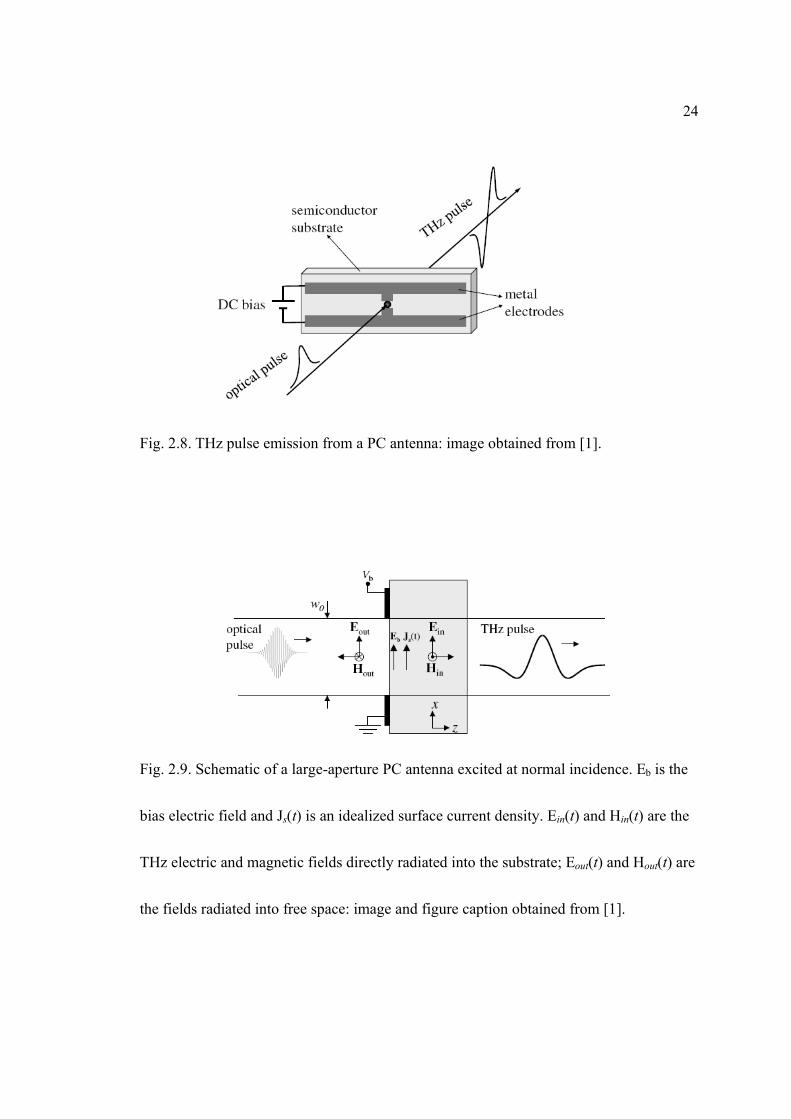
24
Fig. 2.8. THz pulse emission from a PC antenna: image obtained from [1].
Fig. 2.9. Schematic of a large-aperture PC antenna excited at normal incidence. Eb is the
bias electric field and Js(t) is an idealized surface current density. Ein(t) and Hin(t) are the
THz electric and magnetic fields directly radiated into the substrate; Eout(t) and Hout(t) are
the fields radiated into free space: image and figure caption obtained from [1].
25
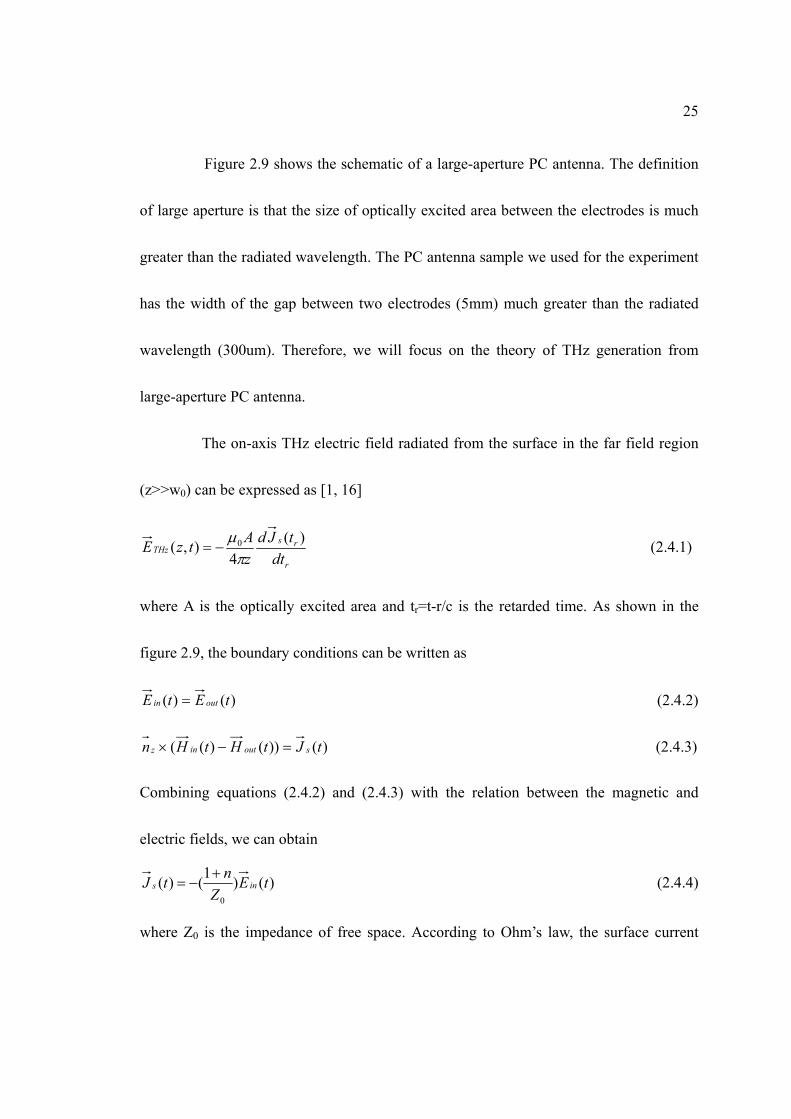
Figure 2.9 shows the schematic of a large-aperture PC antenna. The definition
of large aperture is that the size of optically excited area between the electrodes is much
greater than the radiated wavelength. The PC antenna sample we used for the experiment
has the width of the gap between two electrodes (5mm) much greater than the radiated
wavelength (300um). Therefore, we will focus on the theory of THz generation from
large-aperture PC antenna.
The on-axis THz electric field radiated from the surface in the far field region
(z>>w0) can be expressed as [1, 16]
r
rsTHz
dt
tJd
z
AtzE
)(
4),( 0
(2.4.1)
where A is the optically excited area and tr=t-r/c is the retarded time. As shown in the
figure 2.9, the boundary conditions can be written as
)()( tEtE outin (2.4.2)
)())()(( tJtHtHn soutinz (2.4.3)
Combining equations (2.4.2) and (2.4.3) with the relation between the magnetic and
electric fields, we can obtain
)()1
()(0
tEZ
ntJ ins
(2.4.4)
where Z0 is the impedance of free space. According to Ohm’s law, the surface current

26
density can be expressed as
)]()[()( tEEttJ inbss (2.4.5)
where s(t) is the surface conductivity. From equations (2.4.4) and (2.4.5), we can obtain
b
s
ss E
n
Ztt
tJ]1
1
)([
)()(
0
(2.4.6)
Substitute (2.4.6) into (2.4.1), THz electric field radiated in the far field region can be
expressed as
20
0
]11
)([
)(
4),(
nZt
dttd
z
EAtzE
rs
r
rs
bTHz
(2.4.7)
The surface conductivity is defined as
t
optopt
s dtttntttIRe
t '''' ),(),()()1(
)(
(2.4.8)
where Ropt is the optical reflectivity of the photoconductor, μ is the mobility, n is the
population of electrons. The electron population undergoes an exponential decay with
carrier lifetime τc. Assuming Gaussian optical pulse 22 /
0)( ptopt eItI and a constant
mobility μe, equation (2.4.7) can be written as
x xx
x x
c
px
bTHz
dxeSe
dxeeS
ECxEc
p
'
'
2'
2'2
][
)(
(2.4.9)

27
where
zZ
AnC
p
0
0
4
)1( ,
2
2
400
)1(
)1(c
p
en
IZReS peopt
,
and c
p
p
tx
2 .
From equation (2.4.9), we can see that the amplitude of the THz radiation field
increases linearly with the optical pump power at low excitation condition and the
amplitude of the bias field. The THz radiation power saturates when the optical pump
power or the amplitude of the bias field is too high, which results from the breakdown
voltage of the substrate material and the screening effect of the bias field by photocarriers.
The experimental setup of THz generation from PC antenna is similar with fig.
2.6. The ZnTe crystal is replaced by a PC antenna. The laser beam from the
regeneratively amplified Ti:sapphire laser system, which provides ~150fs, 780nm pulses
at a repetition rate of 1KHz, was split into two beams which were the pump beam and the
probe beam. The pump beam after attenuation was used to excite the low-temperature
MBE grown GaAs. The pump beam power after attenuation is around 10mW. The width
of the gap between two electrodes is 5mm. A 4000V DC bias is applied between the
electrodes. The silicon wafer was used to block all the beams except the THz beam. . The
28
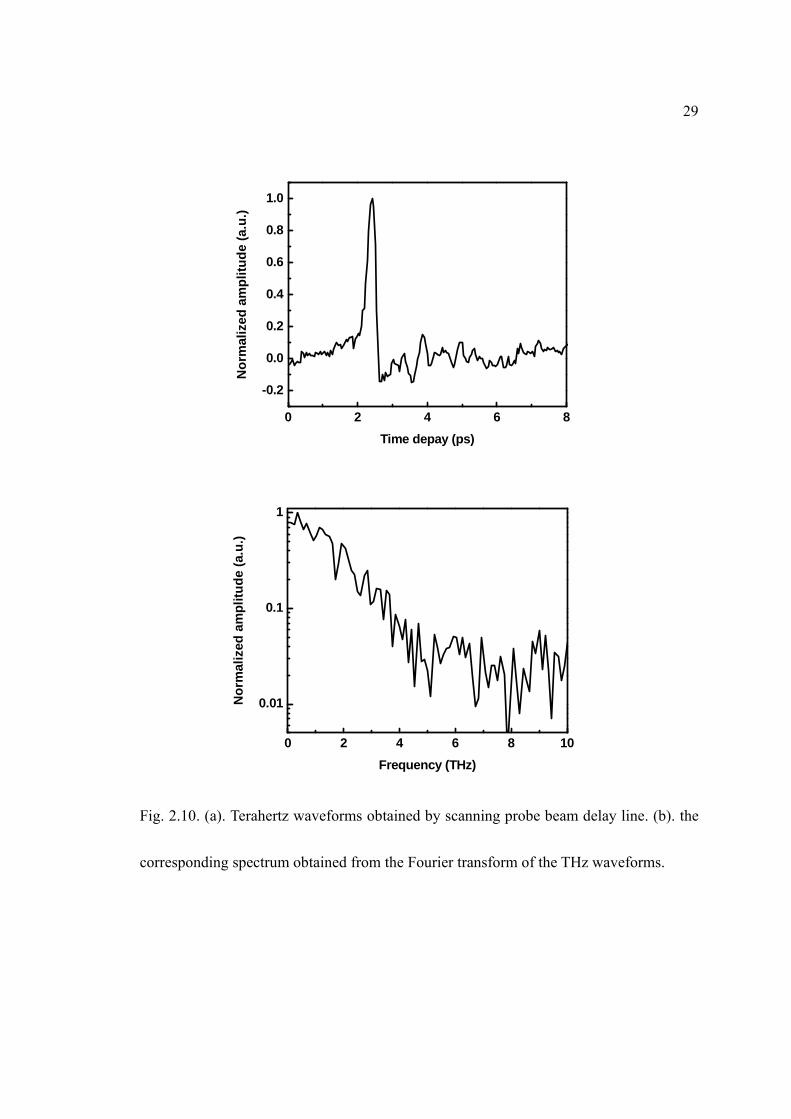
THz beam and the probe beam are directed to shine on the same spot of 1mm <110>
oriented ZnTe crystal. The electro-optic sampling method [14] was used for the THz
wave detection. Figure 2.10(a) shows the Terahertz waveforms obtained by scanning the
probe beam delay line and figure 2.10(b) shows the corresponding spectrum obtained
from the Fourier transform of the THz waveforms.
29
0 2 4 6 8
-0.2
0.0
0.2
0.4
0.6
0.8
1.0
No
rmal
ized
am
pli
tud
e (a
.u.)
Time depay (ps)
0 2 4 6 8 10
0.01
0.1
1
No
rmal
ized
am
pli
tud
e (a
.u.)
Frequency (THz)
Fig. 2.10. (a). Terahertz waveforms obtained by scanning probe beam delay line. (b). the
corresponding spectrum obtained from the Fourier transform of the THz waveforms.

30
Chapter 3
Generation of Terahertz pulses in laser-induced air plasma
THz radiation can be generated by focusing and mixing the fundamental beam
and its second harmonic beam into air. It is believed that the four-wave mixing effect [17]
or plasma current surge [18] is responsible for this THz generation method.
Compared to the THz generation method by using only one beam, which mechanism is
based on ponderomotively induced space charge fields [19], the intensity of the THz
radiation based on the mixing of the fundamental beam and its second harmonic beam is
much stronger. The underlying mechanism of the THz radiation from laser-induce air
plasma can be explained by the accelerating electrons by the applied electric field. The
time-varying currents produced by the accelerating electrons radiate electromagnetic
waves in the far field. In this chapter, THz generation in laser-induced air plasma is
introduced. First, the theory of the THz generation in laser-induced air plasma based on
ponderomotively induced space charge field is presented. Then, the mechanism of THz
radiation generated by focusing and mixing the fundamental beam and its second
harmonic beam into air is discussed. Finally, the experiment setup and results of the THz
generation in laser-induced air plasma from one color laser field and two color laser

31
fields are shown. The experiment results show that the THz amplitude generated from
two color laser fields is much stronger than that from one color laser field.
3.1 – THz generation in laser-induced air plasma based on ponderomotive force
Plasma is a highly nonlinear optical medium. Various nonlinear optical effects
in the laser induced plasma has been demonstrated experimentally, such as second
harmonic generation [20], third harmonic generation [21], and optical rectification [22].
In this section, the theory of THz pulses generation based on the ponderomotive force in
the laser-induced plasma via femtosecond laser pulses excitation is discussed.
Air plasma can be created through photoionization by focusing a laser pulse
into the air. The laser intensity to reach the ionization threshold of air is around 1.5 x 10¹⁴
W/cm2 [23]. In order to obtain such a high intensity, ultrashort laser pulses and focusing
setup are needed. Assuming the spot size after focusing is 10um and, the peak power we
need for reaching the intensity of 1.5 x 10¹⁴ W/cm2 is around 10MW, which is easily
achievable by using our femtosecond laser system. After the plasma is created, the same
laser pulse also induces the nonlinear optical effects in the air plasma. A simple but
realistic model to describe the nonlinear optical effect in the air plasma is the free
electron gas model. The free electron gas model is valid because the electron-ion

32
collision rate is around 1012 s-1, which corresponds to a time between collisions of 1 ps,
which is small compared to the 150 fs pulse width of our femsecond laser pulses.
Therefore, we can ignore the collisional process during laser pulse. The free electron gas
model starts with the equation of the motion of electrons, which can be expressed as [24]
)1
(2
2
Bvc
Em
e
dt
rd (3.1.1)
If we take into account the spatial variations of the electron density and velocity, we need
to incorporate continuity equation with equation (3.1.1) and expend equation (3.1.1) as
0)(
)1
()(
vt
Bvc
Em
e
m
pvv
dt
v
(3.1.2)
where , v , and m are electron density, velocity, and mass, respectively, and p is
the pressure. Here, for simplicity, we assume that 0p . The Maxwell’s equations
which are listed as below are coupled with equations (3.1.2).
0
4
441
1
B
E
c
v
c
J
t
E
cB
t
B
cE
(3.1.3)
Successive approximation can be used to find J as function of E from (3.1.2) and
(3.1.3). The process is straightforward but tedious. The nonlinear current NL
J for
second harmonic generation in plasma has been calculated in [24]. In a similar fashion,
33
ref. [22] derived the nonlinear current for optical rectification as
EE
cm
eJ
pe
NL
223
3
)/(1
4),,(
(3.1.4)
where E is the exciting electromagnetic field, em is the electron mass, and p is the
plasma resonance frequency. The nonlinear current ),,( NL
J for optical
rectification is not vanished only when 0 , which means that the plasma is
inhomogeneous. This inhomogeneous plasma distribution is created by the
ponderomotive force. The ponderomotive force is defined as [20]
2
2
2
4E
m
efe
(3.1.5)
where is gradient perpendicular to the beam propagating direction. Since the laser
beam used to induce air plasma has Gaussian mode profile, the gradient results a force
which is directed out of the center of the laser beam, which creates inhomogeneous
distribution of electrons. The nonlinear current ),,( NL
J can produce the far-
field radiation through dtJdNL
/),,( . Therefore, THz radiation can be generated
through this optical rectification effect by using femtosecond laser pulse to induce
inhomogeneous plasma based on ponderomotive force. The same theory can also used to
explain the THz generation from laser-induced plasma on solid target through laser
ablation [22].

34
3.2 – THz generation in laser-induced air plasma using laser pulses composed of
both fundamental and second-harmonic waves
In the last section, the THz radiation generated in laser-induced air plasma
based on ponderomotive force only utilizes the fundamental laser field. Recently, intense
THz generation was demonstrated in laser-induced air plasma by mixing the fundamental
and its second harmonic waves in air [25]. The mechanism was initially described as a
four-wave difference frequency mixing in the laser-induced plasma [26]. The THz
radiation via four-wave difference frequency mixing in the laser-induced plasma can be
described as
)()()2(),,2,()( **)3(0 EEEPE THzTHzTHzTHzTHz
(3.2.1)
A broadband THz pulse can be obtained through four-wave difference frequency
mixing in the laser-induced plasma by mixing the fundamental and its second harmonic
laser pulse. However, the third order nonlinearity )3( in the air plasma is too small to
explain the reported THz field strength [27]. Recently, a new model based on plasma
current driven by an asymmetric laser field has been proposed [2, 18]. In this section, the
plasma current model is discussed.
The laser field composed of the fundamental and its second harmonic fields
35
can be expressed as
])(2cos[)cos()( 21 tEtEtE (3.2.2)
where 1E and 2E are the amplitudes of the fundamental and its second harmonic fields,
is the relative phase between the fundamental and its second harmonic fields, and
is the phase at which electrons are generated. The combined electric field with the
fundamental field with wavelength of nm800 and intensity of
215 /10 cmWI and the second harmonic field 2 with wavelength of nm400
and intensity of 214 /102 cmWI is shown in figure 3.1(a) for a relative phase of
0 and 2/ . The trajectories of electrons born at various phases are shown in
figure 3.1(b). The electron trajectories and velocities are calculated based on classical
mechanics. The approach is valid because the electron-ion collision rate is around 1012 s-1,
which corresponds to a time between collisions of 1 ps, which is small compared to the
150 fs pulse width of our femsecond laser pulses. Therefore, we can ignore the collisional
process during laser pulse. The electron velocity for electrons born at phase can be
expressed as
eed m
eE
m
eEv
2
)2sin(sin 21 (3.2.3)
where em is the electron mass. Figure 3.1(c) shows the drift velocity for all . As
shown in figure 3.1(a), the combined electric field with 0 has a symmetric even
36
function. As for 2/ , the combined electric field has an asymmetric function. As
shown in figure 3.1(b), under the symmetric electric field, the electron velocity cancels
for the electrons born at opposite laser field slopes. However, under asymmetric electric
field, there is a non-vanishing drift velocity in the positive direction. As shown in figure
3.1(c), if we consider the situation that the ionization occurs near the peak of the laser
field, only the shadowed area of the electron drift velocity produces the electron current.
In the case of 0 , the shadowed area of the electron velocity cancels each other,
which means that there is no net current. However, with 2/ , there is a net electron
current because of the asymmetric shadowed area of the electron velocity. Combining the
electron velocity discussed above with the electron density obtained from the ionization
rate [18], the electron current can be expressed as
i
ie tvteNtJ )()()( (3.2.4)
where )(tNe is the electron density and )(tv is the electron density under the
combined electric field. The time-varying electron current over the entire laser field
envelope can generate THz field in the far field, which can be expressed as [18]
sin)(/ 2EEfdtdJETHz (3.2.5)
where is the relative phase between the fundamental and its second harmonic fields.
37
Fig. 3.1. (a). Laser fields with the fundamental and second harmonic with a relative phase
θ = 0 and π/2. (b) Electron trajectories born at various phases of φ = −9π/10, −π/10, π/10,
and 9π/10. (c) Drift electron velocity versus φ (solid line), overlaid with the laser field
(dashed line). Image obtained from [2].

38
3.3 – Experiment results of THz Generation in Laser-induced Air Plasma
In this section, the experiment results of THz generation in laser-induced air
plasma are presented. The experimental setup is shown in fig. 3.2. The laser beam from
the regeneratively amplified Ti:sapphire laser system, which provides ~150fs, 780nm
pulses at a repetition rate of 1KHz, was split into two beams which were the pump beam
and the probe beam. The pump beam was focus by a lens with focal length f = 10mm to
induce air plasma, which generated THz radiation based on ponderomotive force or
photocurrent in the air plasma. The silicon wafer was used to block all the beams except
the THz beam. The THz beam and the probe beam are focused at the same spot of 1mm
<110> oriented ZnTe crystal. The electro-optic sampling method [14] was used for the
THz wave detection. Both the THz beam and the probe beam were focused on a <110>
oriented ZnTe crystal with a spot size around 1mm. For the two color fields, the pump
beam was first focused by a lens with focal length f = 10mm and passed through a 100-
μm-thick β-barium borate (BBO) crystal plate.

39
Lock-In Amplifier
/4
WF
Balanced Detector
ZnTe
Chopper
Parabolic Mirror #1 Parabolic Mirror #2
Si
Delay Line
Ti:Sapphire Laser System
LensLens
BBO
Air plasma
Fig. 3.2. Experimental setup of THz generation in air plasma.
Figure 3.3(a) shows the Terahertz waveforms obtained by scanning probe beam delay
line and figure 3.3(b) shows the corresponding spectrum obtained from the Fourier
transform of the THz waveforms. From the figures, we can see that the THz amplitude
generated from two color laser pulses is much stronger than that from one color laser
pulses.

40
0 2 4 6 8 10 12 14
-0.8
-0.6
-0.4
-0.2
0.0
0.2
0.4
0.6
0.8
1.0
Nor
ma
lize
d a
mp
litu
de
(a
.u.)
Time delay (ps)
780nm+390nm 780nm
2 4 6 8 10
0.01
0.1
1
Nor
ma
lize
d a
mp
litu
de
(a
.u.)
Frequency (THz)
780nm+390nm 780nm
Fig. 3.3. (a). Terahertz waveforms obtained by scanning probe beam delay line. (b).
the corresponding spectrum obtained from the Fourier transform of the THz waveforms.
(a)
(b)

41
Chapter 4
Generation of Terahertz pulses in laser-induced multiple air plasmas
In the previous chapter, the THz generation from laser-induced air plasma was
presented. Although the higher intensity of THz radiation generated from air plasma,
compared to that using single color laser field, can be achieved by using two color laser
fields, the conversion efficiency is still very low. The conversion efficiency of 2 x 10⁻⁴
has been reported [18]. Also, for many terahertz applications such as sensing and imaging,
higher THz intensity is always needed. Therefore, in this chapter, we demonstrate a new
way to recycle the residual femtosecond laser input beam, which increases the overall
conversion efficiency from femsecond laser input to THz output and consequently
enhances the intensity of THz radiation.
4.1 – Introduction
An investigation of the terahertz (THz) wave generation in multiple laser-
induced air plasmas is presented. First, it is demonstrated that the intensity of the THz
wave increases as the number of air plasmas increases. Second, the physical mechanism
of this enhancement effect of the THz generation is studied by quantitatively measuring

42
the intensity of the generated THz wave as a function of phase difference between
adjacent air plasmas. It is found out that the superposition is the main mechanism to
cause this enhancement. Thus, the results obtained in this paper not only provide a
technique to generate stronger THz wave but also enable a better understanding of the
mechanism of the THz generation in air plasma.
Terahertz (THz) generation in air plasma has drawn a great deal of interest
because it can produce a broadband THz signal [18] and has remotely controlled sensing
capability, which greatly avoids the propagation loss because THz wave can be
remotely (i.e., near the target location) generated and detected. THz generation in laser
induced air plasma was first observed by focusing high intensity single wavelength
femtosecond laser pulses in air [19]. Later, it was found that higher THz generation
efficiency could be achieved by focusing and mixing the fundamental beam and its
second harmonic beam together into air [17]. Several physical mechanisms of THz
generation by laser induce air plasma was also proposed, including (1) four-wave
mixing [17], (2) ponderomotively induced space charge fields [19], and (3) the plasma
current driven by an asymmetric laser field [2].
Although the intensity of the THz wave has been substantially enhanced by
employing the double wavelength technology (i.e., using both the fundamental and the

43
second harmonic wave), the overall conversion efficiency is still very low (2 x 10⁻⁴).
Most of the incoming laser light energy is not converted into the THz wave. Thus, there is
a critical need to increase the conversion efficiency. Recent efforts of increasing THz
generation efficiency included using preformed air plasma [28] and T H z wave
amplification through four-wave-mixing parametric process [29]. However, no more than
two air plasmas have been used. Furthermore, there is also a lack of systematic study on
the physical mechanism of the enhancement effect of the THz wave generation by using
multiple air plasmas.
To further enhance THz wave generation efficiency and to have a better
understanding of the physical mechanism of the enhancement effect of the THz wave
generation by multiple air plasmas, in this chapter, we report the enhanced THz wave
generation by using more than two (three) air plasmas. Furthermore, the physical
mechanism of the enhancement effect of the THz wave generation by harnessing multiple
air plasmas is also quantitatively studied by adjusting the phase difference between
adjacent air plasmas. It confirms that superposition is the main mechanism for such kind
of enhancement. Thus, the method reported in this chapter not only provides a technique
to enhance the THz wave generation efficiency but also offers a better understanding on
the physical mechanism of THz wave generation when multiple air plasmas are involved.

44
In the following sections, experiment results and discuss are presented and followed by a
conclusion at last.
4.2 - Experiment
The experimental setup is shown in Fig. 4.1. The laser beam from the
regeneratively amplified Ti:sapphire laser system, which provides ~150fs, 780nm pulses
at a repetition rate of 1KHz, was split into two beams which were the pump beam and the
probe beam. The pump beam was first focused by the parabolic mirror #1 and then
passed through a 100-μm-thick β-barium borate (BBO) crystal plate. The first air plasma
was induced by the combination of the fundamental beam and its second harmonic beam,
which enabled THz signal generation in the first air plasma. Then, all the beams were
focused by a second parabolic mirror #2, which induced the second air plasma and
generated second THz signal. Finally, a third air plasma, which was induced by the
beams focused by parabolic #3, generated the third THz signal. Note that, in the
experimental, all parabolic mirrors #1-#3 are protected aluminum coating mirrors, which
have good reflections at wavelength 390nm, 780nm, and THz range. The other two
parabolic mirrors after third air plasma are protected gold coating mirrors. The silicon
wafer was used to block all the beams except the THz beam. The THz beam and the

45
probe beam are focused at the same spot of 1mm <110> oriented ZnTe crystal. The
electro-optic sampling method [14] was used for the THz wave detection. Both the THz
beam and the probe beam were focused on a <110> oriented ZnTe crystal with a spot size
around 1mm.
Delay line
Parabolic mirror #1
Parabolic mirror #2
Parabolic mirror #3
BBO
ZnTe
Plasma
Plasma
Plasma Fs laser input
Chopper
λ/4 WP
Differential detector
L1
L2
BS
BS
Si Delay line
Parabolic mirror #1
Parabolic mirror #2
Parabolic mirror #3
BBO
ZnTe
Plasma
Plasma
Plasma Fs laser input
Chopper
λ/4 WP
Differential detector
L1
L2
BS
BS
Si Delay line
Parabolic mirror #1
Parabolic mirror #2
Parabolic mirror #3
BBO
ZnTe
Plasma
Plasma
Plasma Fs laser input
Chopper
λ/4 WP
Differential detector
L1
L2
BS
BS
Si Delay line
Parabolic mirror #1
Parabolic mirror #2
Parabolic mirror #3
BBO
ZnTe
Plasma
Plasma
Plasma Fs laser input
Chopper
λ/4 WP
Differential detector
L1
L2
BS
BS
Si
Fig. 4.1. Experimental setup of THz generation in laser-induced multiple air plasmas. BS,
beam splitter; L1 and L2, lenses with focal lengths of 10cm; λ/4, quarter-wave plate; WP,
Wollaston prism; BBO, 100-μm-thick β-barium borate crystal plate; Si, Si wafer.
46
4.3 - Results and discussion
Figure 4.2(a) shows the experimentally measured THz waveforms in the time
domain obtained by the scanning probe beam delay line approach, and figure 4.2(b)
shows the corresponding spectra obtained from the Fourier transform of the THz
waveforms, generated from one air plasma, two air plasmas, and three air plasmas,
respectively. To investigate the relationship between the intensity of the generated THz
signal and the number of the air plasmas, THz signal generated by one air plasma and two
air plasmas were obtained by placing silicon wafer right after parabolic mirror #2 and
#3, respectively. In Fig. 4.2(a), we can observe that the peak THz amplitude obtained
from two air plasmas is about 37% higher than that obtained from one air plasma and
the peak THz amplitude obtained from three air plasmas is about 20% higher than that
obtained from two air plasmas. That means that the peak THz amplitude obtained from
three air plasmas is about 65% higher than that obtained from one air plasmas. Similarly,
the intensities of THz signal in spectral domain also increases as the number of
the air plasma increases, as depicted in Fig. 4.2(b). Thus, one can conclude that
the THz signal can indeed be enhanced by harnessing multiple air plasmas. One
can also anticipate that further higher THz amplitude is possible to obtain if the
intensity of the residual femtosecond laser is strong enough to create more air

47
plasmas. Also, we believe that the THz signal is not doubled when using two air
plasmas to replace one air plasma is mainly due to the partial absorption of the
parabolic reflection mirrors and the slight phase mismatch between THz signals
generated from different air plasmas, to be discussed in detail below.
Fig. 4.2. (a) THz waveforms from one, two, and three air plasmas obtained by
scanning probe beam delay line. (b) the corresponding spectra obtained from the
Fourier transform of the THz waveforms.
48
One of the advantages of using parabolic mirrors is that we only need to
consider the dispersion effect in air for the 780nm and 390nm beams. The refractive
index of air at 780nm and 390nm is 1.000275 and 1.000283, respectively [30]. The
distance d between the first and the third air plasmas is about 40cm. Therefore, the
overall walk-off between 780 nm and 390 nm pulses can be calculated by d(n390-n780) =
40 cm x (1.000283-1.000275) = 3.2 μm. Because the pulse length of the laser is about
45 μm, the two pulses still overlap relatively well even with a 3.2 μm walk-off
distance.
To investigate the physical mechanism of the THz enhancement by employing
multiple air plasmas, following experiments were conducted. First, we extended
investigations on the influence of the THz signals by the relative phase difference
between the fundamental and the second harmonic exciting laser beams from one air
plasma case [27] to the case of multiple air plasmas. In the experiment, this relative phase
delay was realized by adjusting the distance between the BBO crystal and the first air
plasma. We observed that the THz amplitude obtained from the first air plasma was
changed, which was due to the phase shift between the fundamental and its second
harmonic waves, as mentioned in Ref. [27]. The phase shift produced by adjusting
the distance between the BBO crystal and the first air plasma can be express as
49
22nndc
(4.3.1)
where nω and n2ω are the refractive indices of air at the fundamental and the second
harmonic frequencies, d is the distance between the BBO crystal and the first air plasma.
The new discoveries were that the enhancement ratios of THz wave generated for
the cases of two air plasmas and three air plasmas were also changed, which
suggested that THz amplitude generated in the second and the third air plasmas was also
sensitive to the phase shift between the fundamental and second harmonic waves. To
further verify this point, in the second experiment, we put a 110 μm thick cover glass
between the first and the second air plasmas. The THz waveform obtained from two air
plasmas was changed when the cover glass was tilted, as shown in Fig. 4.3. With an
incident angle of 50 degrees, the upper curve as depicted in Fig. 4.3, the peak THz
amplitude obtained from two air plasmas is about 60% higher than that obtained from one
air plasma, which could be contributed to the constructive interference between the THz
waves generated in the first air plasma and the second one. However, as for the case of
the incident angle of 60 degrees, the lower curve as depicted in Fig. 4.3, the
deconstructive interference between the THz waves generated in the first air plasma and
the second one may be responsible for the lower peak THz amplitude, which is even
about 56% lower than that obtained from one air plasma. For the purpose of illustration,

50
Fig. 4.4 shows the peak THz amplitude obtained from two air plasmas as a function of
incident angle on cover glass. It clearly shows a periodic interference nature.
Fig. 4.3. THz waveforms from one and two air plasmas obtained by scanning probe beam
delay line with different incident angle on cover glass.

51
Fig 4.4. The peak THz amplitude from two air plasmas as a function of incident angle on
cover glass.
The above qualitatively description is also consistent with the
mathematical models based on the four-wave mixing theory and the plasma
current theory. The mathematical equations for the four-wave mixing theory [27]
and plasma current model [18] are given by
)sin(2
2*)3( EEETHz , (4.3.2)
)sin()(/ 2 EEfdtdJETHz , (4.3.3)
where Eω and E2ω are the amplitudes of the fundamental wave and second harmonic
wave respectively, J is the plasma current, and φ is the relative phase between ω
and 2ω waves. To adjust the phase difference between the fundamental and the
second harmonic beams, a rotatable cover glass is used to introduce the

52
adjustable phase change. Based on equations (4.3.2) and (4.3.3), the cover glass in
duced adjustable phase change, , to the THz wave generation which can be
modeled by multiplying the phase terms of 2*
E and 2E , as given by
,coscos
2
2
2
nn
dc
(4.3.4)
where nω and n2ω are the refractive indices of glass at the fundamental and the second
harmonic frequencies, d is the thickness of the cover glass, and αω,2ω = sin-1(sinβ/nω,2ω),
where β is incident angle on cover glass. This adjustable phase change, , is
continuously tuned by rotating the angle of cover glass so that a periodic change
in the THz signal is observed, as illustrated in Fig. 4.4. Also, the experimental
results obtained in this chapter confirmed that the enhancement of total THz
signals by using multiple air plasmas was due to the coherent superposition of
individual THz signal from each air plasma because it was sensitive to the
relative phase among different THz signals. Finally, we estimate the phase
slippage between the fundamental and second harmonic waves in the air plasma,
which can be expressed as Δθ = (3π/2)(L/λ)(Ne/Nc) [2], where L ~ 5mm is the
length of air plasma, λ = 780nm is the fundamental wavelength, Nc = meω2/(4πe2)
= 1.8 1021 cm-3 is the critical density at λ = 780nm, and Ne = 1.2 1016 cm-3

53
is the critical density obtained at 1 THz. The estimated phase slippage Δθ is
about 0.2 rad, which means that the phase-matching condition is still maintained
well in the laser-induced air plasmas.
4.4 - Conclusion
In summary, we demonstrated that the enhancement of THz wave generation by
employing multiple (more than two) laser-induced air plasmas. We also confirmed that
the physical mechanism of this enhancement was due to the coherent superposition of
the THz waves generated by each individual air plasma. The results, reported in
this chapter, will not only teach a technique on how to increase the efficiency of
THz generation by harnessing multiple air plasmas but also provide a better under
standing on the physical mechanism of the enhancement effect. This THz wave
enhancement method provides an approach for the development of intense THz sources,
which can benefit many THz applications such as sensing and imaging. Furthermore, One
can also anticipate that further improvement on THz amplitude is possible to
obtain if the intensity of the residual femtosecond laser is strong enough to create
more air plasmas. THz generation in multiple air plasmas in cavity structure, which can
induce many air plasmas by reflecting laser pulses back and forth inside the cavity, may

54
be a possible way to further improve the enhancement of THz wave.

55
Chapter 5
Tunable terahertz plasmonic lenses based on semiconductor micro-slits
With THz generation and detection becoming more feasible as mentioned in
the previous chapters, the way to manipulate THz waves becomes more important.
Recently, research activities on THz elements such as mirrors [31], modulators [32], and
waveguides [33] have been increased. In this chapter, we focus on THz lenses.
Conventional THz lenses are made of materials which have relatively high transmission
in THz range, such as silicon and Teflon. The conventional THz lenses have several
drawbacks. First, some materials of conventional THz lens have relatively low THz
transmission, although manufacturers claim that they have high THz transmission. For
example, the THz transmission spectrum of silicon is shown in figure 5.1. It can be seen
that with 0.05mm thickness, silicon has transmission less than 55% in the range between
0.3 - 20 THz. Second, some materials of conventional THz lens have increased
absorption with increased frequency, which limits their use at higher THz frequency end.
For instance, the THz absorption spectrum of Teflon is shown is figure 5.2. It can be seen
that the absorption increases with increased frequency. These two drawbacks can be
solved using terahertz plasmonic lenses proposed in this chapter. The extraordinary
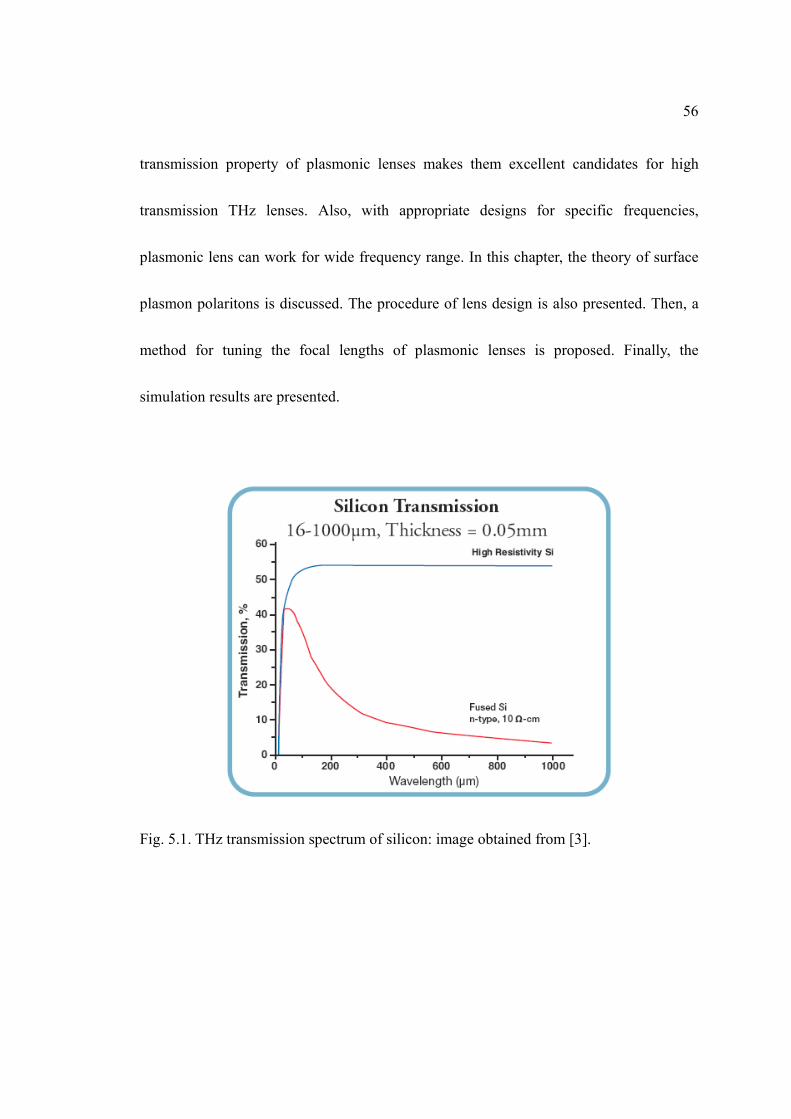
56
transmission property of plasmonic lenses makes them excellent candidates for high
transmission THz lenses. Also, with appropriate designs for specific frequencies,
plasmonic lens can work for wide frequency range. In this chapter, the theory of surface
plasmon polaritons is discussed. The procedure of lens design is also presented. Then, a
method for tuning the focal lengths of plasmonic lenses is proposed. Finally, the
simulation results are presented.
Fig. 5.1. THz transmission spectrum of silicon: image obtained from [3].

57
Fig. 5.2. THz absorption spectrum of Teflon: image obtained from [3].
5.1 - Introduction
A theoretical investigation of tunable terahertz (THz) plasmonic lenses based on
InSb micro-slits is presented. First, it is demonstrated that the surface plasmon polaritons
propagating in an InSb micro-slit array with variant slit widths would face different phase
retardations, which, by design, can produce a focusing wavefront. The extraordinary
transmission of THz radiation through the InSb subwavelength slit array is also observed.
Second, a method for tuning the focal lengths of InSb plasmonic lenses is proposed. The
results in this paper provide a potential way to realize a tunable terahertz plasmonic lens
with high transmission, which can be applied to the application of rapid 3D z-scanning
based THz imaging and sensing.
Surface plasmon polaritons (SPPs), which are longitudinal electron oscillations

58
propagating along the interface between a metallic and a dielectric material, have recently
drawn a great deal of interest. By utilizing SPPs, the extraordinary transmission of
radiation through the subwavelength structure becomes possible [4]. One of the ways to
realize SPP subwavelength devices is by using plasmonic lenses. A focusing lens based
on metallic nano-slits was theoretically proposed [34], which later was experimentally
demonstrated [35]. Other methods of demonstrating plasmonic lenses, such as use of a
single metal slit surrounded by chirped dielectric surface gratings [36], and double metal
slits surrounded by dielectric surface gratings [37], were also proposed. However, most of
the plasmonic lenses mentioned above are operated in the optical wavelength regime, and
not at a longer wavelength range such as the terahertz (THz) range. Only one report, to
the best of knowledge of the authors, has discussed the plasmonic THz lens [38].
To extend the usage of the THz wave, in this chapter, a tunable terahertz
plasmonic lens based on InSb micro-slits is proposed. Numerical simulation, performed
using the finite-difference time-domain (FDTD) method, shows that the focusing effect
can be realized through an InSb slit array with variant slit widths. We observed not only
the extraordinary transmission of THz radiation through an InSb subwavelength slit array,
but also the transmission improvement with the decrease of the space between two slits.
Furthermore, by controlling the temperature, the focal length tuning effect of the InSb
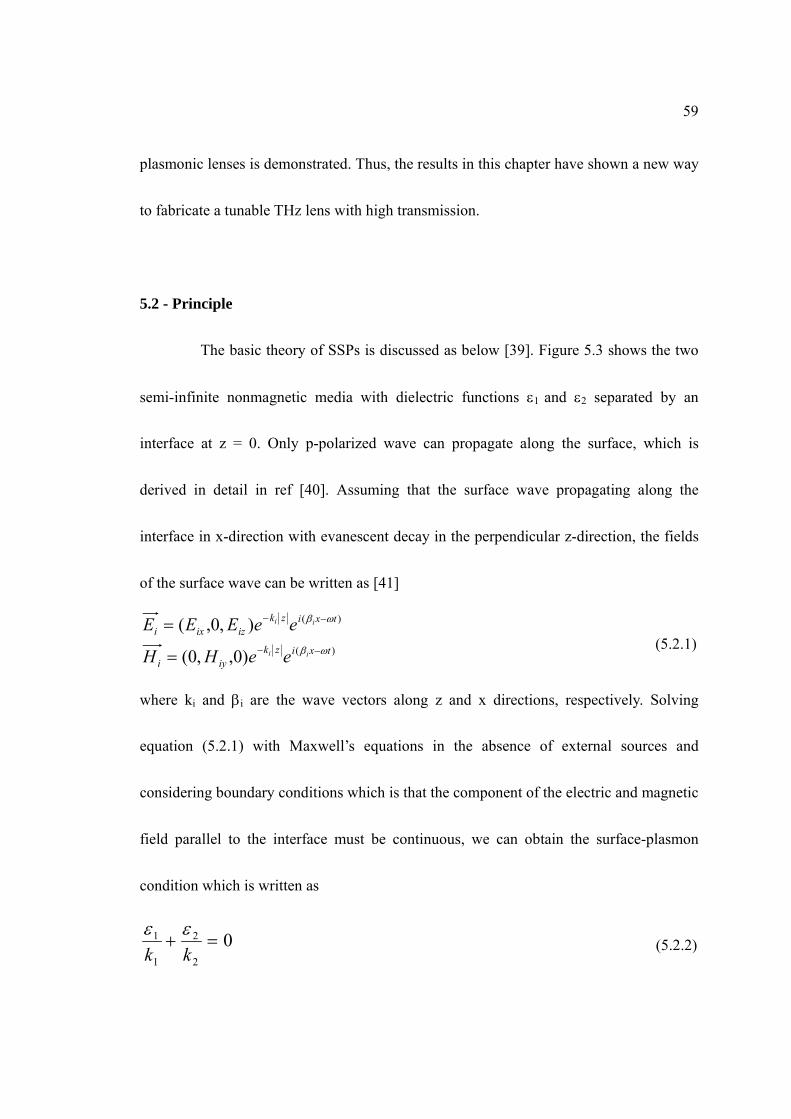
59
plasmonic lenses is demonstrated. Thus, the results in this chapter have shown a new way
to fabricate a tunable THz lens with high transmission.
5.2 - Principle
The basic theory of SSPs is discussed as below [39]. Figure 5.3 shows the two
semi-infinite nonmagnetic media with dielectric functions 1 and 2 separated by an
interface at z = 0. Only p-polarized wave can propagate along the surface, which is
derived in detail in ref [40]. Assuming that the surface wave propagating along the
interface in x-direction with evanescent decay in the perpendicular z-direction, the fields
of the surface wave can be written as [41]
)(
)(
)0,,0(
),0,(txizk
iyi
txizkizixi
ii
ii
eeHH
eeEEE
(5.2.1)
where ki and i are the wave vectors along z and x directions, respectively. Solving
equation (5.2.1) with Maxwell’s equations in the absence of external sources and
considering boundary conditions which is that the component of the electric and magnetic
field parallel to the interface must be continuous, we can obtain the surface-plasmon
condition which is written as
02
2
1
1 kk
(5.2.2)

60
From the boundary conditions, we can also know that = 1 = 2. If we substitute
22)/( ck ii into equation (5.2.2), the surface-plasmon condition, also the
dispersion relation, can be written as
21
21
c
(5.2.3)
Z= 0
1 2
Z= 0
1 2
Fig. 5.3. An planar interface consisting of two semi-infinite nonmagnetic media with
dielectric functions 1 and 2.
If we assume and 2 are real and 1 = 1’ + i1
” is a complex number with
condition 1” << |1
’|, we can obtain a complex
2'1
"1
3
2'1
2'1
2'1
2'1
)(2)Im(
)Re(
c
c (5.2.4)
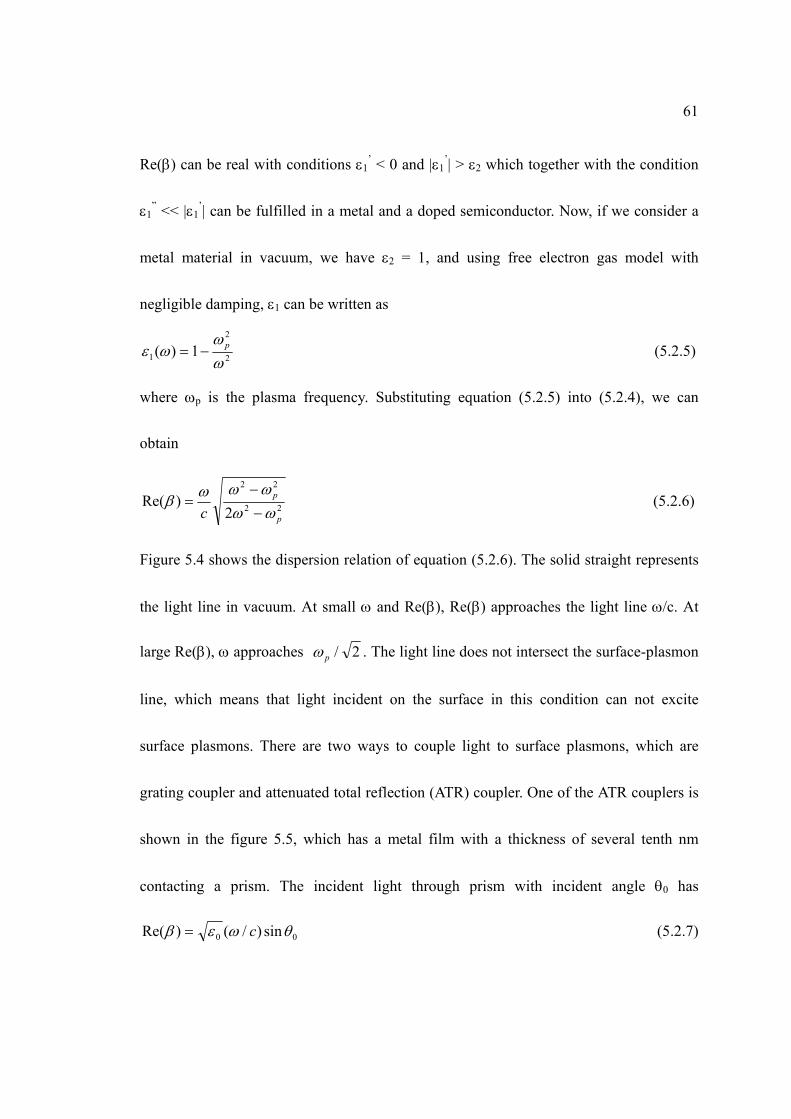
61
Re() can be real with conditions 1’ < 0 and |1
’| > 2 which together with the condition
1” << |1
’| can be fulfilled in a metal and a doped semiconductor. Now, if we consider a
metal material in vacuum, we have 2 = 1, and using free electron gas model with
negligible damping, 1 can be written as
2
2
1 1)(
p (5.2.5)
where p is the plasma frequency. Substituting equation (5.2.5) into (5.2.4), we can
obtain
22
22
2)Re(
p
p
c
(5.2.6)
Figure 5.4 shows the dispersion relation of equation (5.2.6). The solid straight represents
the light line in vacuum. At small and Re(), Re() approaches the light line /c. At
large Re(), approaches 2/p . The light line does not intersect the surface-plasmon
line, which means that light incident on the surface in this condition can not excite
surface plasmons. There are two ways to couple light to surface plasmons, which are
grating coupler and attenuated total reflection (ATR) coupler. One of the ATR couplers is
shown in the figure 5.5, which has a metal film with a thickness of several tenth nm
contacting a prism. The incident light through prism with incident angle 0 has
00 sin)/()Re( c (5.2.7)

62
along the interface between 0 and 1. Since the prism has dielectric constant 0 > 1, it can
be designed so that the dispersion relations (5.2.6) and (5.2.7) have an intersection point
as shown in figure 5.4. Then, the light field decreases exponentially in the metal film and
excites the surface plasmons on the interface between metal and air.
Re()
c00 sin/ c
2/p
Re()
c00 sin/ c
2/p
Fig. 5.4. The dispersion relations of surface plasmons, light in vacuum, and ATR coupler.
63
0 0
1
2
00 0
1
2
Fig 5.5. ATR coupler with a metal film with a thickness of several tenth nm contacting a
prism.
The permittivity of semiconductor can be described by Drude model [42]
,)]([
)(),(
2
Ti
TT p
(5.2.8)
where is the high frequency permittivity, which is 15.75 for InSb, is the frequency of
incident radiation, and p(T) and (T), which depend on temperature, are the plasma
frequency and collision rate, respectively. The temperature dependent plasma frequency
and collision rate of InSb can be found in Table 5.1 [4]. At 295K, the permittivity of InSb
at 1 THz is -44.2 + 15.6i, which is close to that of metals at optical frequencies. For
instance, the permittivity of gold is -11.04+0.78i [35].

64
Table 5.1. The temperature dependent plasma frequency and collision rate of InSb: image
obtained from [4].
SPPs can be coupled and propagate in a slit composed of two closely placed parallel InSb
plates with TM polarized incident radiation [43]. The propagation constant of the SPP
mode in a slit can be written as [34]
,)2/tanh(20
2
20
220
2
ds
sdd
k
kwk
(5.2.9)
where k0 is the free space propagation constant, s and d are the permittivities for the
semiconductor and the material in the slit, and w is the slit width. Figure 5.6 shows the
real and imaginary parts of the propagation constant of the SPPs in the InSb slit as a
function of slit width at different temperatures. The materials used here are InSb with
incident radiation at 1 THz and air with d = 1. It can be seen that the real and imaginary

65
parts of the propagation constant become large with decreased slit width and decreased
temperature. When incident radiation passes through a slit in a film with thickness d, a
phase delay will be introduced, which is dominated by the term Re()d [34]. Hence, by
varying the width of the slit, the phase delay can be changed, which offers the possibility
of beam manipulation. The imaginary part of represents the attenuation constant.
Fig. 5.6. The real and imaginary parts of propagation constant of the SPPs in the InSb
slit as a function of slit width at different temperatures.
66
5.3 - Lens design
To make a lens based on above idea, we need to use a slit array with different
slit widths at different distances from the center of the lens and to produce a phase
distribution satisfying the equal optical length principle [34]
22222)(
xffnx
(5.3.1)
where f is the focal distance of the lens, is the incident wavelength, and (x) is the
required phase at the distance x from the center of the lens. Figure 5.7(a) shows a lens
design based on InSb micro-slits with incident frequency 1 THz and temperature 295K.
The thickness of the InSb film is 300m. The slit width varies from 32m to 80m. The
space between slits is designed to be larger than the skin depth (6.75m at 1 THz and
295K) to prevent light interaction. In Fig. 5.7(b), square dots show the phase distribution
according to the slit location and width, which fits into the curve representing Eq. (5.3.1)
with f = 10mm. Figure 5.7(d) shows the FDTD simulation intensity distribution result. A
focal point can be seen at the distance of 3.77mm from the lens surface. A full-width half-
maximum (FWHM) of 504m occurs along the x direction at the focal point. The focal
length obtained from the simulation result is different from the one given in Eq. (5.3); this
can be explained by the relationship between the lens size and the focal length [44]. A
similar difference is also observed in Ref. [35]. The extraordinary transmission is

67
observed in this plasmonic lens. By following the definition of the transmission
efficiency given by Ref. [45] (i.e., the transmitted intensity normalized to the fraction of
the slit area), the transmission efficiency is calculated to be 114% with a total THz
transmission of 41.3% and the fraction of the slit area of 36.2%. To further increase THz
transmission, the fraction of slit area can be increased; this is shown in Fig. 5.7(c). With
the fraction of slit area at 58.7%, transmission of 70% can be achieved, which is better
than a conventional silicon lens with THz transmission around 50% in the wavelength
range from 50m to 1000m.
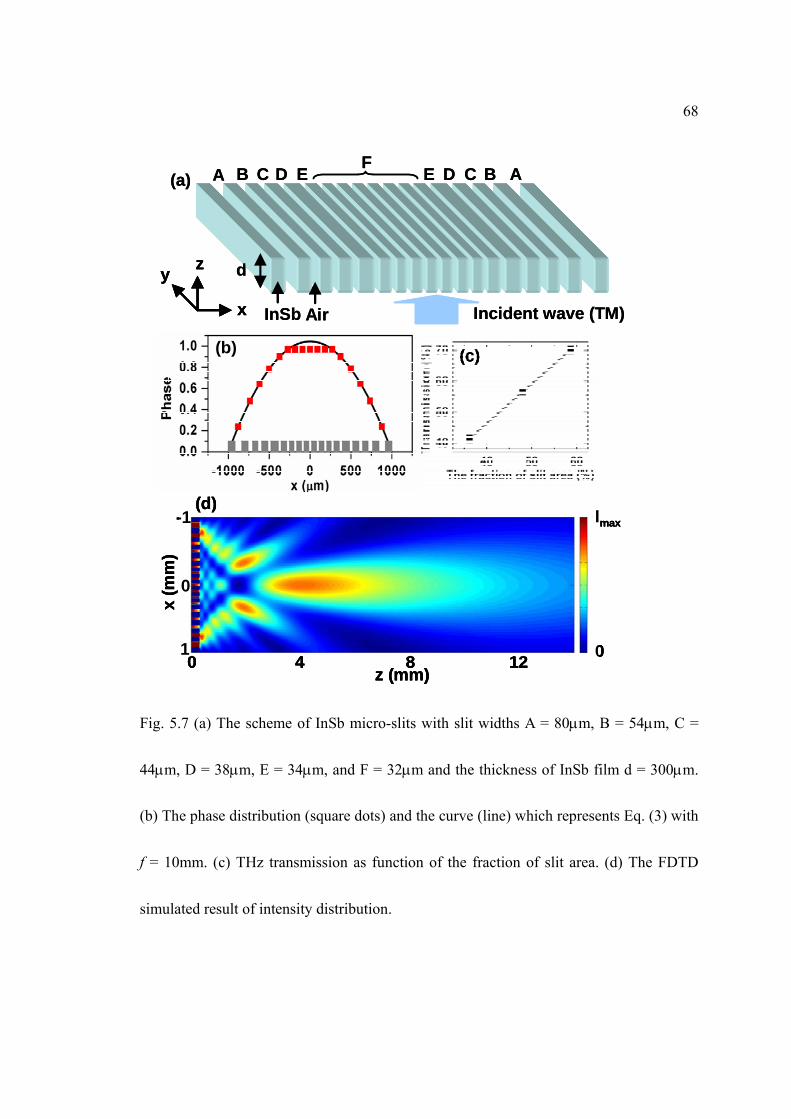
68
x
zy
A B C D E
Incident wave (TM)InSb Air
(a) E D C B A
z (mm)
(c)(b)
Imax
00 4 8 12
0
-1
1
x (m
m)
(d)
F
d
x
zy
x
zy
A B C D E
Incident wave (TM)InSb Air
(a) E D C B A
z (mm)
(c)(b)
Imax
00 4 8 12
0
-1
1
x (m
m)
(d)
z (mm)
(c)(b)
Imax
00 4 8 12
0
-1
1
x (m
m)
(d)
F
d
Fig. 5.7 (a) The scheme of InSb micro-slits with slit widths A = 80m, B = 54m, C =
44m, D = 38m, E = 34m, and F = 32m and the thickness of InSb film d = 300m.
(b) The phase distribution (square dots) and the curve (line) which represents Eq. (3) with
f = 10mm. (c) THz transmission as function of the fraction of slit area. (d) The FDTD
simulated result of intensity distribution.
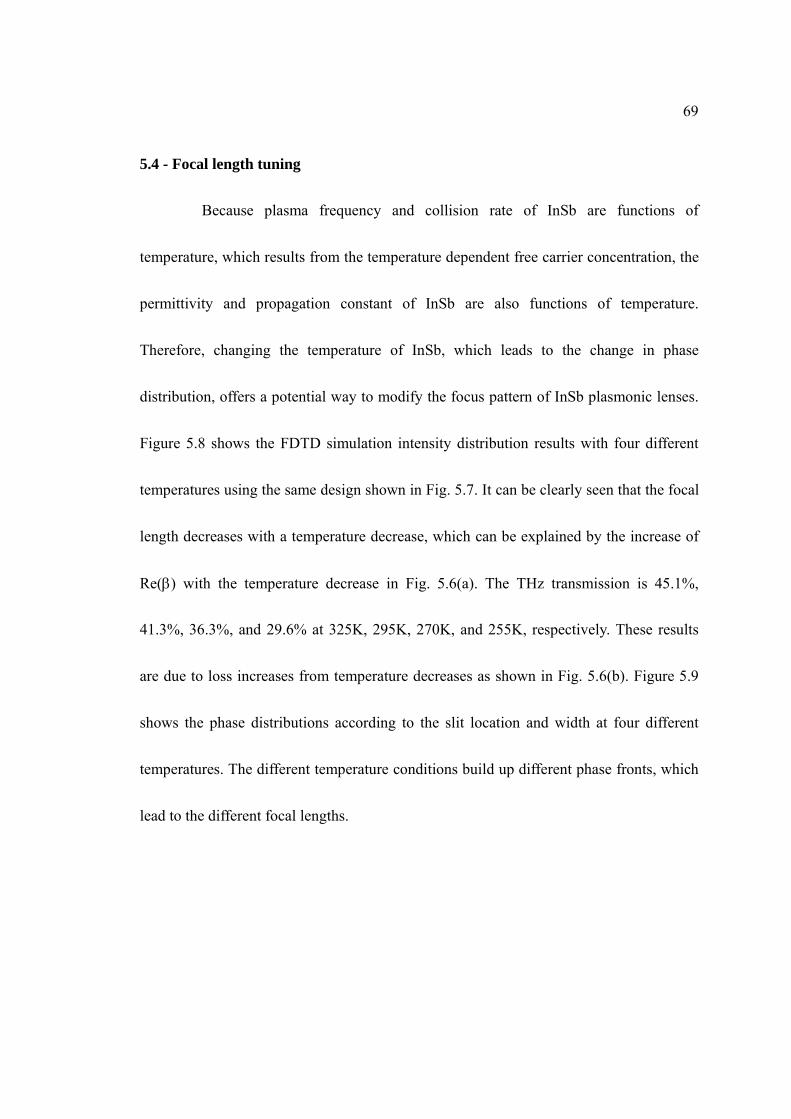
69
5.4 - Focal length tuning
Because plasma frequency and collision rate of InSb are functions of
temperature, which results from the temperature dependent free carrier concentration, the
permittivity and propagation constant of InSb are also functions of temperature.
Therefore, changing the temperature of InSb, which leads to the change in phase
distribution, offers a potential way to modify the focus pattern of InSb plasmonic lenses.
Figure 5.8 shows the FDTD simulation intensity distribution results with four different
temperatures using the same design shown in Fig. 5.7. It can be clearly seen that the focal
length decreases with a temperature decrease, which can be explained by the increase of
Re() with the temperature decrease in Fig. 5.6(a). The THz transmission is 45.1%,
41.3%, 36.3%, and 29.6% at 325K, 295K, 270K, and 255K, respectively. These results
are due to loss increases from temperature decreases as shown in Fig. 5.6(b). Figure 5.9
shows the phase distributions according to the slit location and width at four different
temperatures. The different temperature conditions build up different phase fronts, which
lead to the different focal lengths.

70
0
(b)
(c)
(d)
(a)
5 10z (mm)
0
Imax
0
Imax
0
Imax
0
Imax
01
-1
01
-1
01
-1
01
-1
X (
mm
)
0
(b)
(c)
(d)
(a)
5 10z (mm)
0
Imax
0
Imax
0
Imax
0
Imax
0
Imax
0
Imax
0
Imax
0
Imax
01
-101
-1
01
-101
-1
01
-101
-1
01
-101
-1
X (
mm
)
Fig. 5.8. The FDTD simulated results of intensity distribution with four different
temperatures with the same design shown in Fig. 2. The black lines in the figures indicate
the focus points. The focal lengths for (a) 325K, (b) 295K, (c) 270K, and (d) 255K are
3.77mm, 3.74mm, 3.5mm, and 3.05mm, respectively.
71
Fig. 5.9. The phase distributions according to the slit location and width with four
different temperatures.
5.5 - Conclusion
In summary, we have theoretically demonstrated the focusing effect of
plasmonic lenses based on InSb micro-slits. We also observed the extraordinary
transmission of THz radiation through an InSb subwavelength slit array. THz
transmission of more than 70%, using InSb plasmonic lenses, may be possible.
Furthermore, we have presented a method for tuning the focal length of the InSb
plasmonic lenses. The results of this paper offer a possible way to realize a tunable THz

72
plasmonic lens with high transmission, which can be used in many applications that
require tunable focal lengths, such as in 3D terahertz imaging and sensing.
73
Chapter 6
Terahertz spectroscopy
6.1 - Introduction
One of the most important applications of THz radiation is THz sensing and
imaging. The research on the THz spectroscopy has benefited the THz sensing and
imaging. THz radiation has several characterizations which make it a good candidate for
sensing and imaging. First, many dielectric materials such as plastics, ceramics, clothing,
and paper have high transmission in THz frequency range. Table 6.1 lists the THz
transmission of common materials encountered during security screenings. Second,
unlike x-ray imaging, THz radiation is nonionizing, which means that THz radiation is
safe for both operators and targets. Third, the characteristic signatures of many materials
can be detected using THz spectroscopy. In THz range, many materials have
characteristic absorption due to vibrational transition, which gives the fingerprint
information for THz sensing and imaging. The characteristics mentioned above make
THz radiation an excellent candidate for concealed materials detection. In this chapter,
THz spectroscopy is discussed. First, the theory of THz time-domain spectroscopy (THz-
TDS) is addressed. Then, the method of molecular vibrational mode calculation is

74
discussed. Finally, the experiment and simulation result of THz spectroscopy is presented.
Table 6.1. THz transmissive properties of common materials encountered during
security screenings. N, the number of layers, indicates the number of layers that
result in a signal-to-noise ratio of 1: image obtained from [5].
6.2 - THz Time-domain Spectroscopy
THz time-domain spectroscopy (THz-TDS) uses coherent pulsed THz sources
to interact with samples. The information obtained from THz-TDS includes the amplitude
and phase of the transmitted field. Therefore, THz-TDS can provide more information
compared to the Fourier transform spectroscopy (FTS) which only provides the
information of amplitude. The setup of THz-TDS is shown in figure 6.1. The basic setup

75
of THz-TDS is similar with the setups of THz generation in ZnTe and air plasma which
were mentioned in previous chapters. The laser beam from femtosecond laser system is
split into two beams which are the pump beam and the probe beam. The pump beam is
used to excite the THz emitter, which can be nonlinear crystals, photoconductive
antennas, or air plasmas, to generate pulsed THz radiation. The silicon wafer is used to
block all the beams except the THz beam. The sample is placed at the path of THz beam.
The transmitted THz beam and the probe beam are directed to shine on the same spot of
1mm <110> oriented ZnTe crystal. The electro-optic sampling method [14] is used for the
THz wave detection.
Delay line
ZnTe
Fs laser inputChopper
λ/4 WP
Differential detector
L1
L2BS
sample
Si THz emitter
Delay line
ZnTe
Fs laser inputChopper
λ/4 WP
Differential detector
L1
L2BS
sample
Si THz emitter
Fig. 6.1. The setup of THz time-domain spectroscopy.
76
The transmitted THz time-domain data can be transform into frequency
spectrum and phase shift using Fourier transform. Then, absorption coefficients and
refractive indices can be calculated using the following equations [46]
212
110
1]
)(
)([log2)(
ddvE
vEv
(6.2.1)
)(2
)]()([1)(
21
21
ddv
vvcvn
(6.2.2)
where )(v and )(vn are absorption coefficient and refractive index of the sample at
the frequency v , )(vE and )(v are the amplitude and phase of the THz field at the
frequency v , d is the sample thickness.
6.3 - Energy Level Calculation
In THz range, many materials have characteristic absorption due to vibrational
transition, which gives the fingerprint information for THz sensing and imaging. In order
to verify the experiment results from THz-TDS, it is necessary to theoretically calculate
the vibrational energy levels of materials. Here, we adopt the electronic structure methods
used in Gaussian 03 program to calculate the vibrational enenry levels of materials. In
this section, the theoretical background of electronic structure methods used in Gaussian
03 program is introduced. Then, the calculation procedures and theories for vibrational
energy levels are presented.

77
1. Theoretical background
A. The Born-Oppenheimer Approximation
The Hamiltonian for a molecular system can be written as [47]:
)()(),()()( RVrVrRVRTrTH nuclelecelecnuclnuclelec (6.3.1)
where the first and second terms correspond to the kinetic energy for electrons and
nuclei, respectively, the third, fourth, and fifth to potential energy for electron-nuclear
attraction, electron-electron repulsion, and nuclear-nuclear repulsion, respectively,
and r and R are the positions of the electrons and nuclei. The Born-Oppenheimer
Approximation assumes that the nuclei look fixed to the electrons in a molecular
system, which is reasonable since the mass of a typical nucleus is thousands times
greater than that of an electron. Under the Born-Oppenheimer Approximation, the
Schrödinger equation describing the electronic motion can be written as:
),()(),( RrRERrH eleceffelecelec (6.3.2)
where the electronic Hamiltonian Helec includes all the terms except second one in Eq.
(6.3.1). The electronic wavefunction and effective nuclear potential function Eeff can
be solved in Eq. (6.3.2). The nuclear Hamiltonian can be written as:
)()( RERTH effnuclnucl (6.3.3)
The nuclear motion can be solved using the nuclear Hamiltonian in Schrödinger

78
equation. The nuclear motion describes the vibrational, rotational, translational states
of the nuclei.
B. Hartree-Fork Theory
Even for the most trivial molecular, it is impossible to obtain an exact solution for
the Schrödinger equation. Hartree-Fork (HF) theory is one of the simplifying
assumptions which make an approximate solution possible. The approximation in HF
theory is molecular orbitals, which assumes electrons do not interact together. Under
this approximation and in order to satisfy antisymmetry requirement, the
generalization of the wavefunction of N electrons can be written as:
)()()(
)()()(
)()()(
!
1
21
22221
11211
NNNN
N
N
xxx
xxx
xxx
N
(6.3.4)
where χ(x) = (r)α. (r) is the molecular orbital and α is the spin function.
C. Density Functional Theory
The Density Functional Theory (DFT) uses general functionals of the electron
density to model electron correlation. The electronic energy can be represented in
several functionals:
XCJVT EEEEE (6.3.5)
where the first term correspond to the kinetic energy, the second to the potential

79
energy of the nuclear-electron attraction and of the repulsion between pairs of nuclei,
the third to the electron-electron repulsion, and the fourth is the exchange-correlation
term and includes the remaining part of the electron-electron interactions.
For a given density function, the first three terms in Eq. (6.3.1) can be obtained.
However, the exact functional for fourth term is not known. One of the
approximations to the exchange-correlation term is the B3LYP (Beche, three-
parameter, Lee-Yang-Parr) exchange-correlation functional:
)()( 338803CVWN
CLYPC
CVWN
XBX
XLDA
XHF
XLDA
XCLYPB EEcEEcEEcEE (6.3.6)
D. Basis Sets
This approximation states that the molecular orbitals can be expressed as linear
combinations of a pre-defined set of one-electron functions known as basis functions.
The molecular orbital can be written as:
N
ii c1
(6.3.7)
where ci corresponds to the molecular orbital expansion coefficients, and χ is the
basis function.

80
2. Calculation procedures and theories
A. Geometry optimizations
First, GaussView, a graphical user interface, is used to sketch a molecule. Then, the
geometric structure of the molecule provided by GaussView is optimized by
Gaussian 03 program. There are two steps to do the optimization. At first, Hartree-
Fock (HF), a low level of theory, is used with medium-sized basis set 6-31G(d) for
the optimization. Then, B3LYP Density Functional Theory, a higher level of theory,
is used with the same basis set for a more accurate optimization.
B. Vibrational energy levels
Vibrational frequencies of the molecule are calculated at the optimized structure
through Gaussian 03 program with the same level of theory and basis, B3LYP and 6-
31G(d). Under harmonic oscillation assumption, the total vibrational energy of the
system can be written as [48]
3 6
1
1( ), 0, 1, 2...
2
N
v i i ii
E hv
(6.3.8)
where vi is the vibrational frequencies i multiplied by the speed of light c, i is the
vibrational quantum number, N is the number of molecules.
C. Rotational energy levels
To calculate rotational energy levels, we need the rotational constants, which can be

81
calculated by Gaussian 03. The rotational energy for asymmetric top molecules can
be represented by [48]
1 1{ ( ) ( 1) [ ( )] },
2 2rE hc B C J J A B C W (6.3.9)
where A, B, and C are rotational constants, J is the rotational quantum number, W
can be written as follows:
.
.
.
0124
04
031
031:2
0)1(2
0:1
0:0
22
22
0
bWW
W
bW
bWJ
bWW
WJ
WJ
(6.3.10)
where .)](
2
1[2 VBA
BCb
6.4 - Experiment and Simulation Results from THz Time-domain Spectroscopy and
Energy Level Calculation
In this section, the simulation results of RDX and urea molecules from energy
level calculation and the experiment results of TNT from THz time-domain spectroscopy
are presented. The RDX and urea molecular structure which is optimized by Gaussian 03

82
with procedure described in section 6.3 is shown in figure 6.2.
o
H
c
N
o
c
N
H
(a) C3H6N6O6 (b) (NH2)2CO
Fig. 6.2. The optimized (a) RDX and (c) urea molecular structure.
The vibrational frequencies and rotational constants of RDX and urea
molecules, which are listed as below, were calculated by Gaussian 03 with B3LYP
Density Functional Theory and medium-sized basis set 6-31G(d). Figure 6.3 shows the
vibrational and rotational energy levels of RDX and urea molecules calculated by using
equations (6.3.8) - (6.3.10).
RDX
Vibrational frequencies: v1=33.8168, v2=50.1466, and v3=61.1577 cm-1…
Rotational constants: A=0.7970530, B=0.5802107, and C=0.3899048 GHz

83
Urea
Vibrational frequencies: v1=396.27, v2=458.52, v3=472.24, v4=557.35 ,v5=589.37,
v6=633.61, v7=789.70, v8=955.17, v9=1065.28 v10=1197.79, v11=1427.61 v12=1660.33,
v13=1662.73, v14=1839.08, v15=3555.91 cm-1
Rotational constants: 11.0764416, 10.3059031, and 5.3935534 GHz
Vibrationalground state
v1
v2
v3
∆E/h
0
1.01THz
1.5THz
1.8THz
J=00
J=10.97GHz
1.19GHz1.38GHz
Vibrational states Rotational states
2.83GHz2.94GHz3.51GHz4.16GHz4.24GHz
J=2
…
…
Vibrationalground state
v1
v2
v3
∆E/h
0
1.01THz
1.5THz
1.8THz
J=00
J=10.97GHz
1.19GHz1.38GHz
Vibrational states Rotational states
2.83GHz2.94GHz3.51GHz4.16GHz4.24GHz
J=2
…
…
(a)
Vibrationalground state
v1
v2
v3
∆E/h
0
11.89THz
13.75THz
14.17THz
J=00
J=115.7GHz
16.47GHz21.38GHz
Vibrational states Rotational states
42.87GHz42.96GHz57.69GHz60.00GHz64.23GHz
J=2
…
…
Vibrationalground state
v1
v2
v3
∆E/h
0
11.89THz
13.75THz
14.17THz
J=00
J=115.7GHz
16.47GHz21.38GHz
Vibrational states Rotational states
42.87GHz42.96GHz57.69GHz60.00GHz64.23GHz
J=2
…
…
(b)
Figure 6.3. The vibrational and rotational energy levels of (a) RDX and (b) urea
molecules.

84
The calculated energy levels of RDX relatively agrees well with the experimentally
measured absorption peaks of RDX (0.82 THz, 1.5 THz, 1.96 THz) [49]. For urea
molecules, we can see that, from the infrared spectrum [50], there are several deeps,
which are at 3500, 1700, 1450, 1150, 790 cm-1. They are close to the vibrational
frequencies v15(3555 cm-1), v13(1662 cm-1), v11(1427 cm-1), v10(1197 cm-1), and v7(789
cm-1). The similar procedure was also used to calculate the vibrational frequencies of
TNT. The calculated vibrational frequencies are 1.4, 1.73, 2.8, 3.57, 4.42 THz, etc, which
are relatively agrees well with the experimentally measured absorption peaks of TNT (1.2,
1.7, 2.2, 3.7, and 4.45 THz ) [49]. The more accurate calculation results can be obtained
by adding the corrections from the coupling between the vibrational and rotational modes
as well as the intermolecular interactions.
Table 6.2. THz absorption peaks of TNT and RDX: image obtained from [49].

85
The experiment setup for THz-TDS is shown in figure 6.4. The setup is exactly
the same with the setup of THz generation from two color fields in air plasma, which
were mentioned in chapter 3. The sample was place at the THz beam path between two
parabolic mirrors. The measured samples are TNT 0.1mg/ml in MeOH:AcCN(1:1). The
measured aborption spectrum is shown in figure 6.5. The absorption peaks near 1 THz
and 2.2 THz agree well with the calculation results from Gaussian 03 and the previously
experiment results.
Delay line
ZnTe
Plasma Fs laser inputChopper
λ/4 WP
Differential detector
L1
L2BS
BBO
sample
LensSi
Delay line
ZnTe
Plasma Fs laser inputChopper
λ/4 WP
Differential detector
L1
L2BS
BBO
sample
LensSi
Figure 6.4. The experiment setup for THz-TDS.

86
0.5 1.0 1.5 2.0 2.5 3.00.0
0.5
1.0
Ab
sorp
tio
n (
a.u
.)
Frequency (THz)
Fig. 6.5. THz absorption spectrum from TNT 0.1mg/ml in MeOH:AcCN(1:1).

87
Chapter 7
Future Works
In this chapter, several future works are discussed. In the first section, the
development of high THz radiation power is discussed. Then, the research possibility of
nonlinear THz is presented. The two-dimensional terahertz plasmonic lenses are also
addressed. Finally, THz generation from laser-induced plasma in solid targets using laser
pulses composed of both fundamental and second-harmonic waves is discussed.
7.1 - The development of high THz radiation power
For many THz applications such as THz spectroscopy, THz imaging, and
nonlinear THz effect, it is always desirable to have THz radiation power as high as
possible. Several optical THz generation methods were discussed previously. One of the
ways to increase the THz radiation power from optical THz generation approach is to
improve the conversion efficiency from optical excitation power to THz radiation power.
Terahertz generation from ZnTe crystals and air plasma, which were discussed previously,
have the conversion efficiency 3x10⁻⁵ [9] and 2x10⁻⁴ [18], respectively. Recently, THz
generation from MgO doped stoichiometric LiNbO3 by tilting the intensity front of a

88
femtosencond laser pulse has been developed, which has the conversion efficiency 5x10⁻⁴
[51]. Although the conversion efficiency has been improved constantly, its low value is
still the issue for the development of high THz radiation power. Also, with that kind of
conversion efficiency, most of the optical excitation power is not converted to THz
radiation power. Therefore, the future works on this issue can be divided into two
directions. One is to improve the conversion efficiency from optical excitation power to
THz radiation power. The other one is to recycle the residual optical excitation power to
generate THz radiation again, which is similar to the concept of multiple air plasmas
presented previously. The overall conversion efficiency can be increased through this
approach.
7.2 - Nonlinear THz
With the relatively high THz radiation power becoming more accessible, a very
important research, nonlinear THz, is emerging. Very few reports have been published on
the topic of nonlinear THz. Recently, THz kerr effect has been reported [52]. The optical
birefringence in liquids induced by terahertz pulses was observed. Here, one of the
nonlinear THz effects, second harmonic generation, is proposed. We propose THz second
harmonic generation (SHG) through beta barium borate (BBO). BBO is an excellent

89
candidate for THz SHG for two reasons. One is that BBO has strong birefringence in
THz range [53]. The other one is that BBO exhibits high transparency in THz range [54].
Ref. [53] shows that the ordinary refractive indices no at 0.6 THz and 1.2 THz are around
2.85 and 2.95 and that the extraordinary refractive index ne at 1.2 THz is around 2.65. In
order to meet the phase-matching condition, the equation below must be satisfied [15]
22
2
2
2
)(
1
)2(
cos
)2(
sin
ooe nnn (7.1)
where θ is the angle between the optic axis and the propagation vector k. Substituting
ne(2) = 2.65, no(2) = 2.95, and no() = 2.85 into equation (7.1), we can obtain θ = 33
degrees, which is close to the angle θ = 31 degrees of the BBO used for SHG in 720 -
800nm range. Several preliminary experiments have been done for the THz SHG from
BBO crystals. The experimental setup of THz SHG from BBO is shown in fig. 7.1. The
laser beam from the regeneratively amplified Ti:sapphire laser system, which provides
~150fs, 780nm pulses at a repetition rate of 1KHz, was split into two beams which were
the pump beam and the probe beam. The pump beam was used to excite the 1mm <110>
oriented ZnTe crystal, which generated the THz radiation from optical rectification effect.
As shown in the section 2.3, the S-polarized pump beam with the polarization direction
parallel with [-110] axis of ZnTe crystal can generate P-polarized THz beam which is
parallel with the surface of the optical table. A 100μm thick BBO crystal was placed at

90
the focal point between two parabolic mirrors. The silicon wafer was used to block all the
beams except the THz beam. . The THz beam and the probe beam are directed to shine on
the same spot of 1mm <110> oriented ZnTe crystal. The electro-optic sampling method
[14] was used for the THz wave detection.
Delay line
BBO
ZnTe
fs laser inputChopper
λ/4 WP
Differential detector
L1 L2
BSSi
BS
ZnTe
THz signal
Delay line
BBO
ZnTe
fs laser inputChopper
λ/4 WP
Differential detector
L1 L2
BSSi
BS
ZnTe
THz signal
Fig. 7.1. Experimental setup of THz second harmonic generation through BBO crystal.
BS, beam splitter; L1 and L2, lenses with focal lengths of 10cm; λ/4, quarter-wave plate;
WP, Wollaston prism.
Figure 7.2 shows the THz radiation spectra from ZnTe with different conditions. The
black curve shows the THz radiation spectrum generated from ZnTe without BBO. The
blue curve shows the THz radiation spectrum from ZnTe with BBO in phase mismatching
condition. It can be seen that the blue curve has similar spectrum distribution with black

91
one only with reduced amplitude, which can be contributed to THz absorption in BBO.
They both have peak at 0.65 THz and no frequency doubling effect is observed. We can
clearly see that in red curve the spectrum distribution is changed and the peak is shifted to
1.31 THz if BBO is in phase matching condition. This result shows that THz frequency
doubling in BBO can be realized with proper geometric considerations.
0.65THz
0.65THz
1.31THz0.65THz
0.65THz
1.31THz
Fig. 7.2. THz radiation spectra from ZnTe with different conditions.

92
However, we found that the THz SHG effect was not always consistent and
repeatable, which may be contributed to lower THz radiation power and inaccurate phase
matching angle. Therefore, higher THz radiation power which mentioned in the last
section needs to be developed. Also, more works on the proper geometric considerations
need to be done.
7.3 - Two-dimensional terahertz plasmonic lenses
In chapter 5, the tunable terahertz plasmonic lenses based on semiconductor
micro-slits have been discussed. The lenses based on one-dimensional slit array only have
focusing effect in one direction, which is similar with cylindrical lenses. Recently, two-
dimensional optical plasmonic lenses formed by two-dimensional aperture arrays have
been demonstrated theoretically [55] and experimentally [56]. Here, the two-dimensional
terahertz plasmonic lenses based on two-dimensional semiconductor square holes are
proposed. When incident radiation passed through a square hole with thickness d, a phase
delay will be introduced [57]. The phase delay can be adjusted by the size of the square
hole. To make a two-dimension lens, we need to use a square hole array with different
hole sizes at different distances from the center of the lens and to produce a phase

93
distribution satisfying the equal optical length principle [55]
222222),(
yxffnyx
(7.2)
where f is the focal distance of the lens, is the incident wavelength, and (x,y) is the
required phase at the distance (x2+y2)1/2 from the center of the lens.
7.4 - Terahertz generation from laser-induced plasma in solid targets using laser
pulses composed of both fundamental and second-harmonic waves
Laser-induced plasma in solid targets needs several steps to occur [58]. At first,
the leading portion of a laser pulse is absorbed by the solid target. The absorbed energy is
then converted into heat, which induces the sample vaporization. The vaporized matter
forms a vapor near the surface of the solid target. The vapor then condenses as droplets of
submicrometer size as the irradiance increases. The strong heating and photoionization of
those droplets induced by the high electric field of the laser pulse lead to the plasma
formation. Terahertz generation from laser-induced plasma in solid targets using laser
pulses is recently experimentally demonstrated [59]. The underlying mechanism is based
on the ponderomotive acceleration of charges within the laser driven plasma, which is the
same with the mechanism of THz generation from laser-induced air plasma. Here, we
propose THz generation from laser-induced plasma in solid targets using laser pulses

94
composed of both fundamental and second-harmonic waves. As shown in chapter 3, the
THz amplitude generated from two color laser fields is much stronger than that from one
color laser field. We expect that the model based on the plasma current driven by an
asymmetric laser field can also apply to the laser-induced plasma in solid targets.
Therefore, the higher THz radiation power from laser-induced plasma in solid targets
using laser pulses composed of both fundamental and second-harmonic waves is
anticipated.

95
Chapter 8
Conclusions
In this thesis, several important THz research areas have been covered
including THz generation and detection, THz elements, and THz spectroscopy. First, the
THz detection based on electro-optic sampling was discussed. This time-domain THz
detection method is the major detection method throughout this thesis. Then, several THz
generation approaches were demonstrated including (1) THz radiation generated through
optical rectification in second-order optical nonlinear material ZnTe via femtosecond
laser pulses excitation, (2) THz generation from photoconductive antennas via time-
varying current, (3) THz pulses generation based on the ponderomotive force in the laser-
induced air plasma via femtosecond laser pulses excitation, (4) THz generation in laser-
induced air plasma using laser pulses composed of both fundamental and second-
harmonic waves, (5) generation of THz pulses in laser-induced multiple air plasmas using
laser pulses composed of both fundamental and second-harmonic waves. A systematic
research has been conducted on THz generation in laser-induced air plasmas. From THz
generation in one air plasma using one color laser field, THz generation in one air plasma
using two color laser fields, to THz generation in multiple air plasmas using two color
96
laser fields, the constantly improvement on the intensity of THz radiation has been
achieved. As for THz elements, the tunable THz plasmonic lenses based on InSb micro-
slits have been demonstrate. The extraordinary transmission property makes the THz
plasmonic lens an excellent candidate for high THz Transmission lenses. The active focal
length tuning effect can also find applications in THz 3D imaging. Based on the THz
generation and detection system we developed, the time-domain THz spectroscopy has
also demonstrated. The method of energy level calculation has been presented. Several
future works were also discussed, including nonlinear terahertz, two-dimensional
terahertz plasmonic lenses, and terahertz generation from laser-induced plasma in solid
targets.

97
REFERENCES
1. Yun-Shik Lee, Principles of Terahertz Science and Technology (Springer
Publishing Company, Incorporated, 2009).
2. K. Y. Kim, J. H. Glownia, A. J. Taylor, and G. Rodriguez, "Terahertz emission
from ultrafast ionizing air in symmetry-broke laser fields," Opt. Express 15, 4577-4584
(2007).
3. http://www.thorlabs.com/catalogPages/706.pdf.
4. J. G. Rivas, C. Janke, P. H. Bolivar, and H. Kurz, "Transmission of THz radiation
through InSb gratings of subwavelength apertures," Opt. Express 13, 847-859 (2005).
5. J. Z. Xu, H. B. Liu, T. Yuan, R. Kersting, and X.-C. Zhang, "Advancing terahertz
time-domain spectroscopy for remote detection and tracing," Proc. SPIE 5070, 17-28
(2003).
6. M. Tonouchi, "Cutting-edge terahertz technology," Nature Photonics 1, 97-105
(2007).
7. C. A. Schmuttenmaer, "Exploring dynamics in the far-infrared with terahertz
spectroscopy," Chem. Rev. 104, 1759-1779 (2004).
8. B. Ferguson and X.-C. Zhang, "Materials for terahertz science and technology,"
Nature Materials 1, 26-33 (2002).
9. F. Blanchard, L. Razzari, H.-C. Bandulet, G. Sharma, R. Morandotti, J.-C. Kieffer,
T. Ozaki, M. Reid, H. F. Tiedje, H. K. Haugen, and F. A. Hegmann, "Generation of 1.5 uJ
single-cycle terahertz pulses by optical rectification from a large aperture ZnTe crystal,"
Opt. Express 15, 13212-13220 (2007).
10. G. Scalari, C. Walther, J. Faist, H. Beere, and Ritchie D., "Electrically swithable
two-color quantum cascade laser emitting at 1.39 and 2.3 THz " Appl. Phys. Lett. 88,
141102 (2006).
11. H. Ito, F. Nakajima, T. Furuta, and T. Ishibashi, "Continuous THz-wave
generation using antenna-integrated uni-travelling-carrier photodiodes," Semicond. Sci.
Technol. 20, S191-S198 (2005).
12. W. Koechner, Solid-state laser engineering 5th Ed (Springer-Verlag, Berlin
Heidelberg New York, 1999).
13. S. Backus, C. G. Durfee III, M. M. Murnane, and H. C. Kapteyn, "High power
ultrafast lasers," Rev. Scientific instruments 69, 1207-1223 (1998).
14. P. Planken, H.-K. Nienhuys, H. J. Bakker, and T. Wenckebach, "Measurement
and calculation of the orientation dependence of terahertz pulse detection in ZnTe," J. Opt.

98
Soc. Am. B 18, 313-317 (2001).
15. Robert W. Boyd, Nonlinear Optics (Academic Press, Inc., San Diego, 2006).
16. J. T. Darrow, X.-C. Zhang, and D. H. Auston, "Saturation properties of large-
aperture photoconducting antennas," IEEE J. Quantum Electron. 28, 1607-1616 (1992).
17. X. Xie, J. Dai, and X.-C. Zhang, "Coherent control of THz wave generation in
ambient air," Phys. Rev. Lett. 96, 075005 (2006).
18. K. Y. Kim, A. J. Taylor, J. H. Glownia, and G. Rodriguez, "Coherent control of
terahertz supercontinuum generation in ultrafast laser-gas interactions," Nature Photonics
2, 605-609 (2008).
19. H. Hamster, A. Sullivan, S. Gordon, and R. Falcone, "Short-pulse terahertz
radiation from high-intensity-laser-induced plasmas," Phys. Rev. E 49, 671-677 (1994).
20. M. Beresna, P. G. Kazansky, Y. Svirko, M. Barkauskas, and R. Danielius, "High
average powe second harmonic generation in air," Appl. Phys. Lett. 95, 121502 (2009).
21. R. A. Ganeev, M. Suzuki, M. Baba, H. Kuroda, and I. A. Kulagin, "Third-
harmonic generation in air by use of femtosecond radiation in tight-focusing conditions,"
Appl. Opt. 45, 748-756 (2006).
22. H. Hamster, A. Sullivan, S. Gordon, and R. Falcone, "Subpicosecond,
electromagnetic pulses from intense laser-plasma interaction," Phys. Rev. Lett. 71, 2725-
2728 (1993).
23. S. Augst, D. D. Meyerhofer, D. Strickland, and S. L. Chin, "Laser ionization of
noble gases by coulomb-barrier suppression," J. Opt. Soc. Am. B 8, 858-867 (1991).
24. Y. R. Shen, The principles of nonlinear optics (Wiley, New York, 1984).
25. D. J. Cook and R. M. Hochstrasser, "Intense terahertz pulses by four-wave
rectification in air," Opt. Lett. 25, 1210-1212 (2000).
26. T. Bartel, P. Gael, K. Reimann, M. Woerner, and T. Elsaesser, "Generation of
single-cycle THz transients with high electric-field amplitudes," Opt. Lett. 30, 2805-2808
(2005).
27. M. Kress, T. Löffler, S. Eden, M. Thomson, and H. Roskos, "Terahertz-pulse
generation by photonization of air with laser pulses composed of both fundamental and
second-harmonic waves," Opt. Lett. 29, 1120-1122 (2004).
28. X. Xie, J. Xu, J. Dai, and X.-C. Zhang, "Enhancement of terahertz wave
generation from laser induced plasma," Appl. Phys. Lett. 90, 141104 (2007).
29. J. Dai, X. Xie, and X.-C. Zhang, "Terahertz wave amplification in gases with the
excitation of femtosecond laser pulses," Appl. Phys. Lett. 91, 211102 (2007).
30. P. Ciddor, "Refractive index of air: new equations for the visible and near
infrared," Appl. Opt. 35, 1566-1573 (1996).

99
31. N. Krumbholz, K. Gerlach, F. Rutz, M. Koch, R. Piesiewicz, T. Kurner, and D.
Mittleman, "Omnidirectional terahertz mirrors: A key element for futhre terahertz
communication systems," Appl. Phys. Lett. 88, 202905 (2006).
32. T. Kleine-Ostmann, P. Dawson, K. Pierz, G. Hein, and M. Koch, "Room
temperature operation of an electrically driven terahertz modulator " Appl. Phys. Lett. 84,
3555 (2004).
33. K. Wang and D. Mittleman, "Metal wires for terahertz wave guiding " Nature
432, 376-379 (2004).
34. H. Shi, C. Wang, C. Du, X. Luo, X. Dong, and H. Gao, "Beam manipulating by
metallic nano-slits with variant widths," Opt. Express 13, 6815-6820 (2005).
35. L. Verslegers, P. B. Catrysse, Z. Yu, J. S. White, E. S. Barnard, M. L. Brongersma,
and S. Fan, "Planar lenses based on nanoscale slit arrays in a metallic film," Nano Lett. 9,
235-238 (2009).
36. S. Kim, Y. Lim, H. Kim, J. Park, and B. Lee, "Optical beam focusing by a single
subwavelength metal slit surrounded by chirped dielectric surface gratings," Appl. Phys.
Lett. 92, 013103 (2008).
37. G.-G. Zheng and X.-Y. Li, "Optical beam manipulation through two metal
subwavelength slits surrounded by dielectric surface gratings," J. Opt. A: Pure Appl. Opt.
11, 075002 (2009).
38. C. A. Baron and A. Y. Elezzabi, "Active plasmonic devices via electron spin,"
Opt. Express 17, 7117-7129 (2009).
39. J. M. Pitarke, V. M. Silkin, E. V. Chulkov, and P. M. Echenique, "Theory of
surface plasmons and surface-plasmon polaritons," Rep. Prog. Phys. 70, 1-87 (2007).
40. S. A. Maier, Plasmonics: fundamentals and applications (Springer, 2007).
41. H. Raether, Surface plasmons on smooth and rough surfaces and on gratings
(Springer, Heidelberg, 1988).
42. J. A. Sanchez-Gil and J. G. Rivas, "Thermal switching of the scattering
coefficients of terahertz surface plasmon polaritons impinging on a finite array of
subwavelength grooves on semiconductor surfaces," Phys. Rev. B 73, 205410 (2006).
43. X.-Y. He, "Comparison of the waveguide properties of gap surface plasmon in
the terahertz region and visible spectra," J. Opt. A: Pure Appl. Opt. 11, 045708 (2009).
44. P. Ruffieux, Y. Scharf, H. P. Herzig, R. Völkel, and K. J. Weible, "On the
chromatic aberration of microlenses," Opt. Express 14, 4687-4694 (2006).
45. T. Thio, H. F. Ghaemi, H. J. Lezec, P. A. Wolff, and T. W. Ebbesen, "Surface-
plasmon-enhanced transmission through hole arrays in Cr films," J. Opt. Soc. Am. B 16,
1743-1748 (1999).
100
46. M. Naftaly and R. E. Miles, "Terahertz time-domain spectroscopy: A new tool for
the study of glasses in the far infrared," J. Non-Cryst. Solids 351, 3341-3347 (2005).
47. J. B. Foresman and A. Frisch, Exploring Chemistry with Electronic Structure
Methods (Gaussian Inc., Pittsburgh, 1993).
48. G. Herzberg, Molecular Spectra and Molecular Structure (D. Van Nostrand
company, INC.,, Canada, 1945).
49. R. E. Miles, X.-C. Zhang, H. Eisele, and A. Krotkus, Terahertz Frequency
Detection and Identification of Materials and Objects (Springer, Netherlands, 2007).
50. J. E. Stewart, "Infrared absorption spectra of urea, thiourea, and some thiourea-
alkali halide complexs," J. Chem. Phys. 26, 248-254 (1957).
51. K.-L. Yeh, M. C. Hoffmann, J. Hebling, and Keith A. Nelson, "Generation of 10
uJ ultrashort terahertz pulses by optical rectification," Appl. Phys. Lett. 90, 17121 (2007).
52. M. C. Hoffmann, N. C. Brandt, H. Y. Hwang, K.-L. Yeh, and K. A. Nelson,
"Terahertz kerr effect," Appl. Phys. Lett. 95, 231105 (2009).
53. J. Liu, X. Guo, J. Dai, and X.-C. Zhang "Optical property of beta barium borate
in terahertz region," Appl. Phys. Lett. 93, 171102 (2008).
54. E. Estacio, S. Saito, T. Nakazato, Y. Furukawa, N. Sarukura, M. Cadatal, M. H.
Pham, C. Ponseca, Jr., H. Mizuseki, and Y. Kawazoe, "Birefringence of B-BaB2O4
crystal in the terahertz region for parametric device design," Appl. Phys. Lett. 92, 091116
(2008).
55. Y. Chen, C. Zhou, X. Luo, and C. Du, "Structured lens formed by a 2D square
hole array in a metallic film," Opt. Lett. 33, 753-755 (2008).
56. L. Lin, X. M. Goh, L. P. McGuinness, and A. Roberts, "Plasmonic Lenses
Formed by Two-Dimensional Nanometric Cross-Shaped Aperture Arrays for Fresnel-
Region Focusing," Nano Lett. 10, 1936-1940 (2010).
57. F. J. Garcı´a-Vidal, E. Moreno, J. A. Porto, and L. Martı´n-Moreno,
"Transmission of Light through a Single Rectangular Hole," Phys. Rev. Lett. 95, 103901
(2005).
58. J. M. Vadillo and J. J. Laserna, "Laser-induced plasma spectrometry: truly a
surface analytical tool," Spectrochim. Acta Part B 59, 147-161 (2004).
59. Y. Gao, T. Drake, Z. Chen, and M. F. DeCamp, "Half-cycle-pulse terahertz
emission from an ultrafast laser plasma in a solid target," Opt. Lett. 33, 2776-2778 (2008).

101
APPENDIX
PUBLICATIONS
The Published Journals:
[1] M.-K. Chen, Y.-C. Chang, C.-E. Yang, Y. Guo, J. Mazurowski, S. Yin, P. Ruffin, C.
Brantley, E. Edwards, and C. Luo, "Tunable terahertz plasmonic lenses based on
semiconductor micro-slits," Micro. Opt. Tech. Lett. 52, 979-981 (2010).
[2] Y. Gao, M.-K. Chen, C.-E. Yang, Y.-C. Chang, S. Yin, R. Hui, P. Ruffin, C. Brantley,
E. Edwards, and C. Luo, "Analysis of terahertz generation via nanostructure enhanced
plasmonic excitations," J. Appl. Phys. 106, 074302 (2009).
[3] M.-K. Chen, J. H. Kim, C.-E. Yang, S. Yin, R. Hui, and P. Ruffin, “Terahertz generation in multiple laser-induced air plasmas,” Appl. Phys. Lett. 93, 231102 (2008).
[4] J. H. Kim, M.-K. Chen, C.-E. Yang, J. Lee, K. Shi, Z. Liu, S. Yin, K. Reichard, P. Ruffin, E. Edwards, C. Brantley, and C. Luo, “Broadband supercontinuum generation covering UV to mid-IR region by using three pumping sources in single crystal sapphire fiber,” Opt. Express 16, 14792-14800 (2008).
[5] J. H. Kim, M.-K. Chen, C.-E. Yang, J. Lee, S. Yin, P. Ruffin, E. Edwards, C. Brantley, and C. Luo, “Broadband IR supercontinuum generation using single crystal sapphire fibers,” Opt. Express 16, 4085-4093 (2008).
Conference Proceedings:
[1] Y. Gao, M.-K. Chen, Y.-C. Chang, C.-E. Yang, and S. Yin, “Analysis of terahertz
generation and control by nanostructured surfaces,” Proc. SPIE 7420, 74200U (2009).
[2] M.-K. Chen, J. H. Kim, C.-E. Yang, S. Yin, Z. Liu, and R. Hui, “THz generation in
multiple air plasmas,” Proc. SPIE 7056, 70561A (2008).
[3] C.-E. Yang, M.-K. Chen, J. Yao, and S. Yin, “Light-activated ultrafast magneto-optic
modulator,” Proc. SPIE 7056, 70560S (2008).

102
[5] J. H. Kim, M.-K. Chen, C.-E. Yang, J. Lee, S. Yin, K. Reichard, P. Ruffin, E.
Edwards, C. Brantley, and C. Luo, “Mid-IR supercontinuum generations and
applications,” Proc. SPIE 7056, 70560V (2008).
[6] S. Kang, C.-E. Yang, M.-K. Chen, and S. Yin, “Optical and magnetooptical
properties of Bi1.8Y1.2Fe4Ga1O12 nanoparticles,” Proc. SPIE 6698, 66981H (2007).
1
VITA
Meng-Ku Chen
Meng-Ku Chen was born in Taipei, Taiwan. He received his B. S. degree from National
Cheng Kung University, Tainan, Taiwan and M. S. degree from National Taiwan
University, Taipei, Taiwan. His study area was on optoelectronic devices. After obtaining
his M. S. degree, he had worked as a second lieutenant in Coast Guard Administration,
Hualien, Taiwan for a year and an epitaxy engineer in Highlink Technology Corporation
(Now Epistar Corporation) for another year. He was admitted to the Ph. D. program of
Electrical Engineering, The Pennsylvania State University, University Park, PA, on Fall
2006. He joined Dr. Yin’s research lab, and has been a research assistant for 4 years.