TENNESSEE VALLEY AUTHORITY - InfoHouseinfohouse.p2ric.org/ref/19/18581.pdf · The Tennessee Valley...
34
TENNESSEE VALLEY AUTHORITY Office of Natural Resources and Economic Development DESIGN AND PERFORHANCE OF THE ARTIFICIAL WETLANDS WASTEWATER TREATHENT PLANT AT ISELIN, PENNSYLVANIA BY James T. Watson, Foster D. Diodato, and Hilt Lauch Prepared for Presentation at the Aquatic Plants for Water Treatment and Resource Recovery Orlando, Florida, July 20-24, 1986 Conference on Research and Applications of: Chattanooga, Tennessee July 1986 (revised December 1986) This article is a Government publication and is not subject to copyright.
-
Upload
truongdung -
Category
Documents
-
view
219 -
download
4
Transcript of TENNESSEE VALLEY AUTHORITY - InfoHouseinfohouse.p2ric.org/ref/19/18581.pdf · The Tennessee Valley...
0067
TENNESSEE VALLEY AUTHORITY
Office of Natural Resources and Economic Development
DESIGN AND PERFORHANCE OF THE ARTIFICIAL WETLANDS
WASTEWATER TREATHENT PLANT AT ISELIN, PENNSYLVANIA
BY
James T. Watson, Foster D. Diodato, and Hilt Lauch
Prepared for Presentation at the
Aquatic Plants for Water Treatment and Resource Recovery Orlando, Florida, July 20-24, 1986
Conference on Research and Applications of:
Chattanooga, Tennessee
July 1986 (revised December 1986)
This article is a Government publication and is not subject to copyright.

DESIGN AND PERFORMANCE OF THE ARTIFICIAL WETLANDS WASTEWATER TREATMENT PLANT AT ISELIN, PENNSYLVANIA
J. T. Watson1, F. D. Diodato2, and M. Lauch3
ABSTRACT
The Tennessee Valley Authority (TVA) is demonstrating the use of a
marsh/pond/meadow system for treatment of municipal wastewat.ar as a low
cost system for meeting stringent National Pollutant Discharge
Elimination System (NPDES) discharge limitations. The system is modeled
after a small system at Iselin, Pennsylvania. The Iselin system was
designed and constructed by the Pennsylvania Department of Environmental
Resources, which has provided the design information and monitoring
results to TVA.
The Iselin wetlands system has a design capacity of 12,000 gpd and
consists of four key components: an aerated pond, a cattail (Typha)
marsh, a stabilization pond, and a reed canary grass (Phalaris) meadow.
Data are available on each component for each month since Harch 1983.
Average effluent concentrations for key parameters for the first 31
months of operation are: biochemical oxygen demand, 7.4 mg/l; total
suspended solids, 19 mg/l; ammonia nitrogen, 3.3 mg/l; total phosphorus,
2.6 mg/l; and fecal coliforms, 150/100 ml.
KEY WORDS
Warsh/pond/meadow treatment system; cattails (Typha) , duckweed (Lema) and reed canary grass (Phalaris); low cost system for NPDES permit compliance.
1 Program Manager, Tennessee Valley Authority, Water Quality Branch, 248 401 Building, Chattanooga, TN 37401
2 Chief, Sewage Facilities Planning Section, Pennsylvania Bureau of Water Quality Hanagement, P.O. Box 2063, Harrisburg, PA 17120
Chief, Facility Plan Development Unit, Pennsylvania Bureau of Water Quality Hanagement, P.O. Box 2063, Harrisburg, PA 17120

-2 -
INTRODUCTION
Small communities nationwide are having extreme difficulties in
providing affordable wastewater disposal that will meet state and federal
water quality regulations. Conventional and "hi-tech" methods are
generally too expensive to construct and operate.
the Kentucky Division of Water, the Tennessee Valley Authority has
initiated a project in Benton, Hardin, and Pembroke, Kentucky, to
demonstrate how small communities can provide low cost, high quality
sewage treatment with artificial wetlands. Three types of artificial
wetlands systems will be demonstrated--a marsh/pond/meadow (HPH) system,
a root zone system, and a gravel marsh system. The focus of this paper
is on the marsh/pond/meadow system.
In cooperation with
One of the difficulties TVA encountered during the planning and
design of the demonstration is the scarcity of design criteria and
performance data in the literature for artificial Wetlands. The
information that is available when viewed from a design engineer's
perspective is sketchy, at times contradictory, and generally inadequate
for determining details needed in a wetlands system to achieve various
NPDES permit limits. TVA is addressing this problem with a technology
transfer objective. A design manual identifying key criteria and their
bases will be prepared and widely distributed.
During TVA's search for information, the Pennsylvania Bureau of
Water Quality Management (BWQM) informed TVA of the data they were
collecting on a marsh/pond/meadow system at Iselin, PA.
was provided to TVA, computerized and returned to the BWQM along with an
analysis and interpretation of the system's performance. This report
summarizes the data analyses.
The data base

-3 -
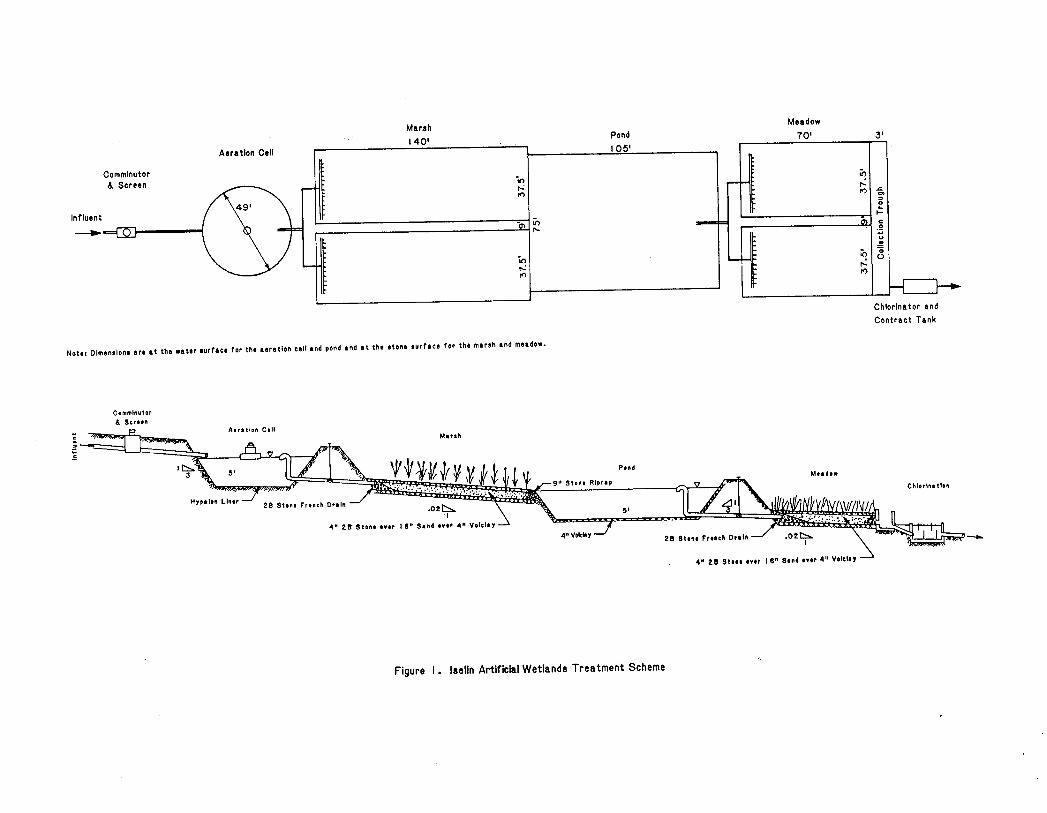
TREATMENT CONCEPT AND SYSTEM DESIGN
The treatment facility serves 158 of the 300 residents of Iselin.
It consists of six components in series: pretreatment (comminution and
bar screens), an aeration cell, a cattail marsh, a stabilization pond, a
reed canary grass meadow, and a chlorination unit.
system is summarized in Table 1 and Figure 1.
The design of the
The comunitor and bypass screen removes large solids.
cell provides primary treatment through bacterial metabolism and
minimizes odors from any stale sewage entering the system.
serves as the heart of the system, providing treatment primarily through
bacterial metabolism with sedimentation, filtration, and adsorption of
solids also being important.
of the wastewater. The sand, gravel, and plants provide substrate and
conditions conducive to establishing and maintaining extremely high
concentrations of bacteria and other microorganisms. The two primary
benefits of the vegetation are believed to be to provide oxygen to the
bacteria within the root zone of the plants and to maintain longterm
permeability of the substrate.
The aeration
The marsh
The system is designed for subsurface flow
The pond is contiguous with the marsh. Riprap is used to minimize
sand and gravel losses to the pond.
pond include bacterial metabolism, plant (algae and duckweed) uptake of
nutrients, and volatilization of ammonia nitrogen during summer.
Important treatment processes in the
The meadow serves as a polishing unit. Algae from the pond are
filtered out and additional removal of organics and nutrients are
achieved through the same processes occurring in the marsh. A
chlorinator assures that permit limits for fecal coliforms are met.
-4-
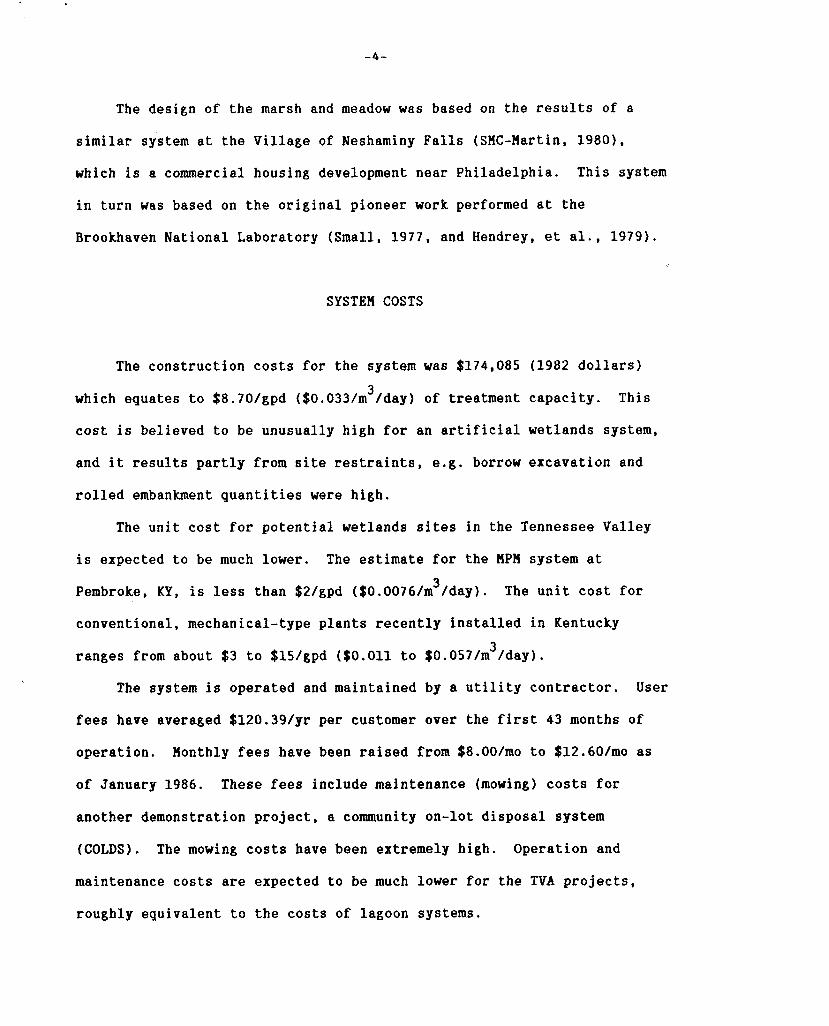
The design of the marsh and meadow was based on the results of a
similar system at the Village of Neshaminy Falls (SMC-Martin, 19801,
which is a commercial housing development near Philadelphia. This system
in turn was based on the original pioneer work performed at the
Brookhaven National Laboratory (Small, 1977, and Hendrey, et al., 1979).
SYSTEM COSTS
The construction costs for the system was $174,085 (1982 dollars) 3 which equates to $8.70/gpd ($0.033/m /day) of treatment capacity. This
cost is believed to be unusually high for an artificial wetlands system,
and it results partly from site restraints, e.g. borrow excavation and
rolled embankment quantities were high.
The unit cost for potential wetlands sites in the Tennessee Valley
is expected to be much lower. The estimate for the HPH system at
Pembroke, KP, is less than $2/gpd ($0.0076/m /day). The unit cost for
conventional, mechanical-type plants recently installed in Kentucky
ranges from about $3 to $15/gpd ($0.011 to $0.057/m /day).
3
3
The system is operated and maintained by a utility contractor.
fees have averaged $120.39/yr per customer over the first 43 months of
operation.
of January 1986. These fees include maintenance (mowing) costs for
another demonstration project, a comunity on-lot disposal system
(COLDS). The mowing costs have been extremely high. Operation and
maintenance costs are expected to be much lower for the TVA projects,
roughly equivalent to the costs of lagoon systems.
User
Monthly fees have been raised from $8.00/mo to $12.60/mo as
-5 -
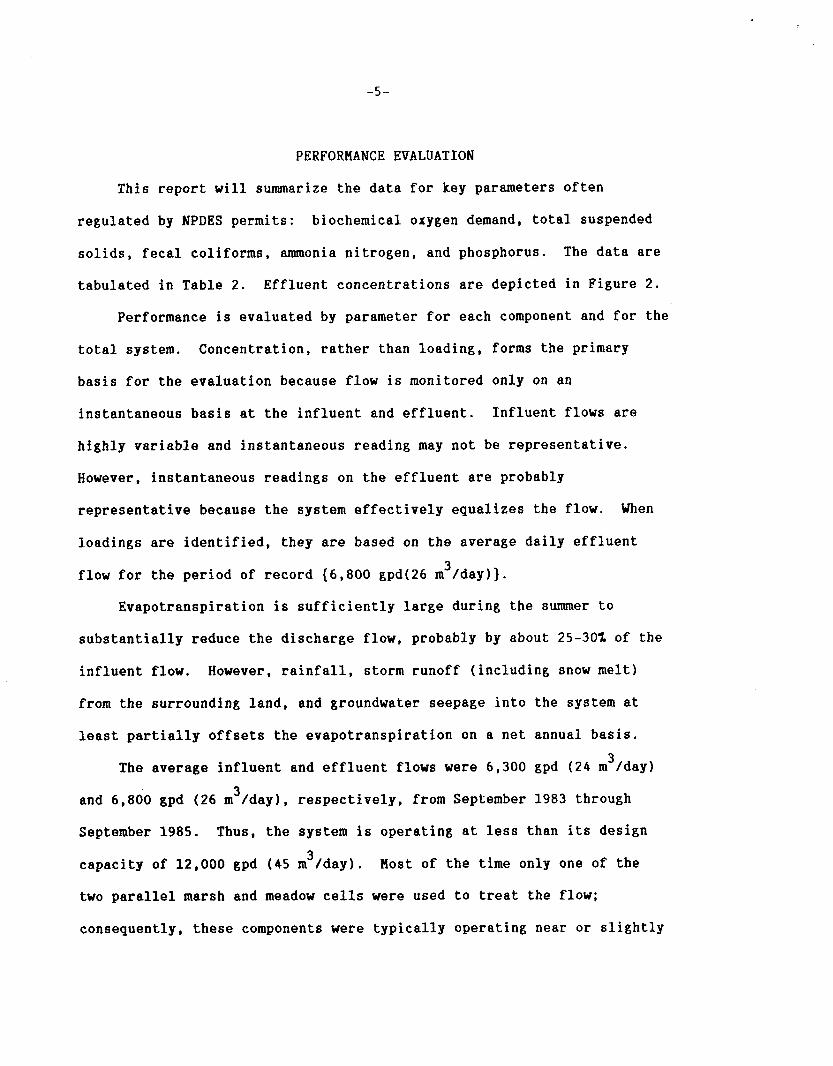
PERFORMANCE EVALUATION
This report will summarize the data for key parameters often
regulated by NPDES permits: biochemical oxygen demand, total suspended
solids, fecal coliforms, ammonia nitrogen, and phosphorus. The data are
tabulated in Table 2. Effluent concentrations are depicted in Figure 2.
Performance is evaluated by parameter for each component and for the
total system. Concentration, rather than loading, forms the primary
basis for the evaluation because flow is monitored only on an
instantaneous basis at the influent and effluent. Influent flows are
highly variable and instantaneous reading may not be representative.
However, instantaneous readings on the effluent are probably
representative because the system effectively equalizes the flow.
loadings are identified, they are based on the average daily effluent
flow for the period of record (6,800 gpd(26 m /day)}.
When
3
Evapotranspiration is sufficiently large during the summer to
substantially reduce the discharge flow, probably by about 25-30% of the
influent flow. However, rainfall, storm runoff (including snow melt)
from the surrounding land, and groundwater seepage into the system at
least partially offsets the evapotranspiration on a net annual basis. 3 The average influent and effluent flows were 6,300 gpd (24 m /day)
and 6,800 gpd (26 mJ/day), respectively, from September 1983 through
September 1985. Thus, the system is operating at less than its design 3 capacity of 12,000 gpd (45 m /day).
two parallel marsh and meadow cells were used to treat the flow;
consequently, these components were typically operating near or slightly
Host of the time only one of the
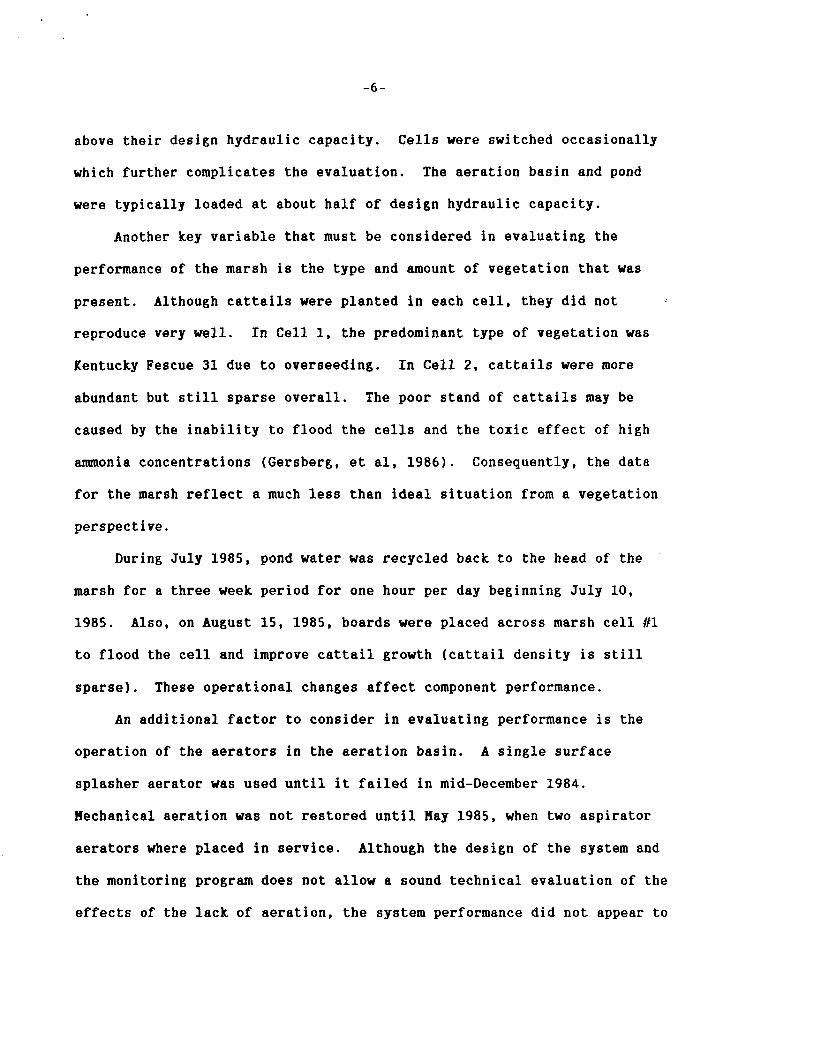
-6 -
above their design hydraulic capacity. Cells were switched occasionally
which further complicates the evaluation. The aeration basin and pond
were typically loaded at about half of design hydraulic capacity.
Another key variable that must be considered in evaluating the
performance of the marsh is the type and amount of vegetation that was
present.
reproduce very well.
Kentucky Fescue 31 due to overseeding. In Cell 2, cattails were more
abundant but still sparse overall. The poor stand of cattails may be
caused by the inability to flood the cells and the toxic effect of high
ammonia concentrations (Gersberg, et al, 1986). Consequently, the data
for the marsh reflect a much less than ideal situation from a vegetation
perspective.
Although cattails were planted in each cell, they did not
In Cell 1, the predominant type of vegetation was
During July 1985, pond water was recycled back to the head of the
marsh for a three week period for one hour per day beginning July 10,
1985. Also, on August 15, 1985, boards were placed across marsh cell #I
to flood the cell and improve cattail growth (cattail density is still
sparse). These operational changes affect component performance.
An additional factor to consider in evaluating performance is the
operation of the aerators in the aeration basin. A single surface
splasher aerator was used until it failed in mid-December 1984.
Hechanical aeration was not restored until Hay 1985, when two aspirator
aerators where placed in service. Although the design of the system and
the monitoring program does not allow a sound technical evaluation of the
effects of the lack of aeration, the system performance did not appear to
I
- I -
decrease during this period. This raises the question of the need for
the aerators, but the Iselin data are not sufficient to answer the
question.
The data are separated into two groups, "winter" data and "summer"
data, to evaluate seasonal differences. The winter season is defined as
November through April and summer is defined as Hay through October.
This parallels the seasons used by the Kentucky Division of Water for
setting effluent limitations for ammonia nitrogen.
normally less stringent during winter than summer.
Limitations are
Biochemical Oxygen Demand
The system reduces the BOD by an average of 97% (from 260 mg/l t o
7.4 mg/l). Reduction rates are similar for winter (96%) and summer
(98%). Only one month showed an average BOD above 30 mg/l (Feb. 1984,
32 mg/l), and this probably resulted from unrepresentative data because
the concomitant BOD at the point of discharge to the receiving stream was
very low. Consequently, the data indicate that the system is capable of
meeting EPA's secondary treatment standard (30 mg/l) essentially 100% of
the time. The average effluent quality exceeds secondary quality.
Each component of the system except for the pond significantly
reduces.BOD. The aeration basin and the marsh reduce BOD by about the
same quantity (around 6.7 lbs/day(3000 g/day) and 7.0 lbs/day (3200
g/day), respectively, assuming an average flow of 6,800 gpd} but the
marsh has the highest reduction percentage (88% versus 46%). The meadow
has the second highest reduction percentage (64%). The pond typically
increases BOD due to algal production.

-8 -
Differences between winter and summer reductions were relatively
small within a component except for the aeration basin which ranged from
15% during winter to 67% during summer.
factors: the difference in bacterial metabolism between winter and
summer, and the sampling methods used.
at all locations. The influent sample represents instantaneous
conditions and is not as representative of average concentrations as the
effluent sample because the basin effectively mixes and equalizes the
This is attributed to two
Single grab samples are collected
sewage.
Differences are large during each season both within a component and
from one component to another. For example, BOD reductions in the marsh
varied from 19 to 96% during summer.
reductions between the marsh and pond was 79% versus -22%. respectively.
However, the meadow typically acts as a safety net for the system so that
the wastewater discharged to the receiving stream consistently meets
permit limits.
The variation between summer
Total Suspended Solids
The system removes an average of 89% of the suspended solids (from
180 mg/l to 19 m g / l ) . The reductions are similar for winter (88%) and
summer (90%).
months of available data exceeded 30 mg/l; however, data at the final
monitoring point prior to discharge to the receiving stream revealed that
only one month exceeded 30 mg/l (August 1984, 36 mg/l). The high values
for the meadow effluent probably result from the sampling procedure.
The average effluent concentration for six of the 28

-9-
Samples are obtained from weep holes, and solids may be scraped from the
sides or resuspended within the rock media due to the sampling personnel
walking over the cell. Consequently, the data indicate that the system
meets EPA's secondary treatment standard (30 mg/l) more than 90% of the
time (including the start-up period). The average effluent quality is
much better than secondary quality. The remaining solids probably
consist of algae and plant fragments rather than sewage particles.
Concentrations are generally highest during spring and fall when the
system's vegetative growth dynamics are in the greatest state of flux.
The marsh and the meadow are the two components that effectively
reduce solids concentrations. The marsh removes an average of about
18 lbslday (8,200 g/day) or 86% of the solids. The meadow removes about
2 . 4 lbs/day (1,100 g/day) or 69% of the remaining solids.
The largest variations occurred in the aeration basin and the pond,
ranging from increases of greater than 1,000% to reductions of 90%. This
reflects the bacterial and algal growth dynamics occurring within these
components. Very few increases in suspended solids occurred in the marsh
and meadow, reflecting the effectiveness of the rock and sand media for
filtering and settling the solids. The solids are believed to be
biologically stabilized into a permeable compost within the system.
Fecal Coliforms
Reductions in fecal coliforms approach 100% (from 1,800,000/100ml to
150/100ml). The system is highly effective during both winter and
summer. Only one spike in excess of 1,000/100ml occurred in the monthly
-10-
geometric means for the meadow effluent.
200/100ml, which is a typical, average permit limit, during only 5 of the
29 months that were monitored. All of these occurrences were during fall
and winter months and may be related to small mammals wintering within
the system. Nests occasionally had to be removed from the meadow weep
holes.
Geometric means exceeded
All components except the aeration basin effectively reduce fecal
coliforms during each season. Host of the organisms are reduced in the
marsh with the pond and meadow serving as polishing components for the
remaining organisms. The reductions are attributed to natural die-off in
an unfavorable environment and the toxic effect of root excretions on
enteric organisms.
These results are of special significance since they indicate
artificial wetlands systems can be designed to either eliminate the need
for chlorination or minimize the chlorine dosages needed to meet permit
limits. This will provide cost and operational benefits to communities
using the technology and also benefit the receiving stream by avoiding or
minimizing the toxic by-products of chlorination. The need for
dechlorination will also be eliminated or reduced.
Ammonia Nitrogen
The system removes an average of 77% of the ammonia (from 14 mg/l to
3.3 mg/l) contained in the raw sewage. Removal is better during the
summer (93%) than winter ( 5 4 % ) . However, these removal rates have little
meaning because of the conversion of organic nitrogen to ammonia in the
aeration basin and marsh. The effectiveness of the system for ammonia
-11-
removal is based primarily on the effluent concentrations. The average
effluent concentration is 3.3 mg/l. The concentrations vary seasonally.
During the summer the average is 1.2 mg/l and during winter the average
is 5.8 mg/l.
6.0 mg/l). Only two months exceeded 10 mg/l (January 1984, 15 mg/l, and
February 1984, 13 mg/l).
During summer only one month exceeded 4 mg/l (October 1984,
The components that effectively reduce ammonia concentrations are
the marsh, pond, and meadow. Ammonia in the marsh is converted to
nitrites and nitrates (nitrification). Reductions amount to about 56% by
concentration and 0.96 lb/day (4,400 g/day) by mass. In the pond
nitrification and volatilization (loss of ammonia as a gas) both appear
to be important. The average reduction in concentration is the highest
in the pond (60%), but on a mass basis the reduction is only about half of
that occurring in the marsh (0.44 lb/day(200 g/day)}. Nitrification
continues in the meadow with a 36% reduction in ammonia.
Differences between winter and summer reductions were relatively
small except for the pond.
winter to 86% during summer.
attributed primarily to volatilization (algal production during the
summer results in pH values as high as 11.2; the summer average was
9.2). During each season, the variation was large within all
components. For example, during winter, the reductions in the pond
ranged from -650% to 86%.
These reductions varied from 27% during
The higher reductions during summer are

-12-
Total Phosphorus
Phosphorus is reduced by an average of 82% (from 15 mg/l to
2.6 mg/l). Reductions can be attributed to a combination of three
mechanisms: absorption onto bed substrate, compost, and liner (volclay);
plant uptake; and chemical precipitation. Reductions are higher during
summer (90%) than winter (68%). Reduced effectiveness during winter has
been reported in the literature and is caused in part by plant dormancy
and decay and a net release of precipitated phosphorus (Black, et al.,
1981, and Gearheart, et.al., 1984).
The effluent average was always under 6 mg/l except for one month,
February 1985, when the average was 16 mg/l. However, the data indicate
an increasing trend in effluent concentrations. The average effluent
concentration for the last twelve months of record (October 1984 through
September 1985) is 4.3 mg/l while for the preceding twelve months
(October 1983 through September 1984) the average was 2.1 mg/l. This may
indicate the root zone is reaching its absorption limit. It may also
reflect only normal variability due to an immature ecosystem since the
trend parallels that of ammonia nitrogen (see Figure 2).
Average concentrations were reduced in each component with the marsh
being the most effective (69%) and the aeration basin the least effective
(7%). Variability was largest within the aeration basin and the pond.
Conclusions
The marsh/pond/meadow system is capable of consistently meeting
EPA's secondary treatment standards and even more stringent standards at
-13-
costs less than that required using conventional, mechanical-type systems
(for small communities). The system is very simple to operate and
maintain.
High quality effluent was achieved without benefit of a thick stand
of cattails, suggesting that the treatment mechanism for organic
pollutants is primarily bacterial metabolism. The marsh component
normally provides most of the treatment for the key parameters often
regulated by NPDES permit.
as a safety net for meeting permit limits. Either component could be
added as an upgrade to existing treatment facilities.
The meadow polishes the wastewater and serves
The aeration basin is effective primarily for BOD reduction. Of the
key parameters that are often regulated by NPDES permits, the pond is
effective in reducing ammonia nitrogen and fecal coliforms.
There are several potential changes that should be considered in
design of future HPH systems based on the Iselin data and data available
from other types of artificial wetlands. These include:
(1) Installation of control structures for varying the water depth
within each cell. This will improve growth and reproduction of
the marsh vegetation, may improve treatment efficiencies during
high flows, and can be used to control icing.
(2) Reduction of bottom slope, depending on the site's natural
slope. Flat slopes have been used in other gravel-based marsh
systems with good success (Gersberg, et al, 1986, and Wolverton
and HcDonald, 1982). The construction cost savings for using
slopes similar to those existing on-site may be substantial.
-14-
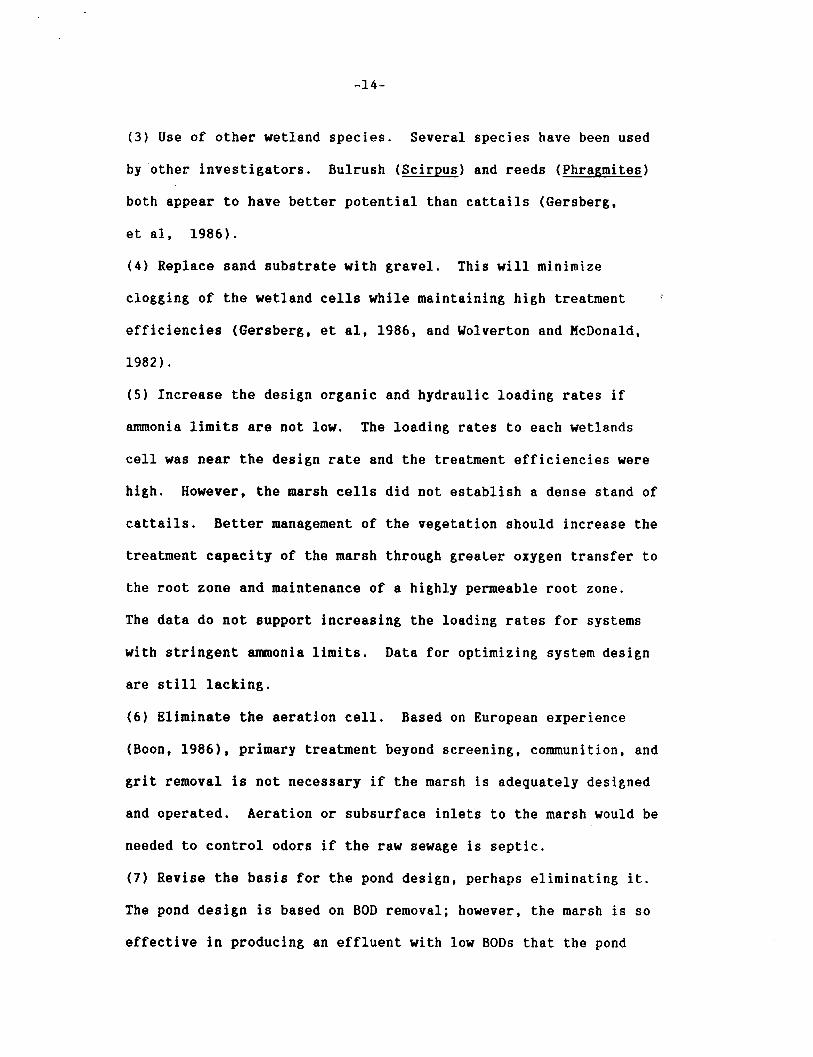
(3) Use of other wetland species. Several species have been used
by other investigators. Bulrush (Scirpus) and reeds (Phragmites)
both appear to have better potential than cattails (Gersberg,
et al, 1986).
( 4 ) Replace sand substrate with gravel.
clogging of the wetland cells while maintaining high treatment
efficiencies (Gersberg, et al, 1986, and Wolverton and HcDonald,
1982).
(5) Increase the design organic and hydraulic loading rates if
ammonia limits are not low. The loading rates to each wetlands
cell was near the design rate and the treatment efficiencies were
high. However, the marsh cells did not establish a dense stand of
cattails. Better management of the vegetation should increase the
treatment capacity of the marsh through greater oxygen transfer to
the root zone and maintenance of a highly permeable root zone.
The data do not support increasing the loading rates for systems
with stringent ammonia limits.
are still lacking.
(6) Eliminate the aeration cell. Based on European experience
(Boon, 19861, primary treatment beyond screening, communition, and
grit removal is not necessary if the marsh is adequately designed
and operated.
needed to control odors if the raw sewage is septic.
(7) Revise the basis for the pond design, perhaps eliminating it.
The pond design is based on BOD removal; however, the marsh is so
effective in producing an effluent with low BODS that the pond
This will minimize
r'
Data for optimizing system design
Aeration or subsurface inlets to the marsh would be

-15-
actually causes slight increases due to algal production.
Therefore, based on the loading rates and performance at Iselin,
the need for the pond depends on nitrogen control.
dentrification (nitrates are reduced by 82%), and volatilization
are important processes occurring within the pond. Since nitrogen
control can be effectively achieved with either a marsh or a
marsh/pond combination, an important issue is to determine the
appropriate design for each type system for optimizing nitrogen
removal and which is most cost effective.
Nitrification,
There are additional potential modifications that would increase the
operational flexibility of the system and may help optimize treatment
efficiencies, especially during stress periods resulting from such
factors as variable waste loading (low or high flows or concentrations)
or seasonal changes (fall/spring turnovers or winter icing). However,
these modifications increase the cost and complexity of the system and
should not generally be considered for the typical small community.
include: (1) recirculation of the pond or meadow effluent back to the
aeration basin or marsh, (2) piping to allow bypassing the pond or
meadow, and ( 3 ) aeration o r recirculation of the pond water to control
icing.
They

-16-
REFERENCES
Black, S.A., Wile, I., and Hiller, G., 1981. Sewage Effluent Treatment in an Artificial Harshland, Paper presented at the 1981 WPCF Conference, Detroit, Hichigan.
Boon, A.G., 1986. Report of a Visit by Hembers and Staff of WRc to Germany (GFR) to Investigate the Root Zone Hethod for Treatment of Waste Waters, Water Research Center, Processes, Stevenage, Herts, England.
Gearheart, R.A., Finney, B.A., Wilbur, S., Williams, J., and Hull, D., 1984. The Use of Wetland Treatment Processes in Water Reuse. Future of Water Reuse, Volume 2. AWWA Research Foundation, Denver, Colorado.
Gersberg, R.H., Elkins, B.V., Lyon, S.R., and Goldman, C.R., 1986. Role of Aquatic Plants in Wastewater Treatment by Artificial Wetlands. Water Research, Vol. 20, pp. 363-368
Hendrey, G.R., Clinton, J., Blumer, K., and Lewin, K., 1979. Lowland Recharge Project. Operations, Physical, Chemical and Biological Changes, 1975-1978. Final Report to the Town of Brookhaven. BNL 27054. Brookhaven National Laboratory, Associated Universities, Inc., Upton, New York.
Small, H.H., 1977. Natural Sewage Recycling Systems. BNL 50630. Brookhaven National Laboratory, Associated Universities, Inc., Upton, New York.
SHC-Hartin, Inc., 1980. Harsh-Pond-Headow Sewage Treatment Facility, Village of Neshaminy Fall, Hontgomery Township, Hontgomery County, PA., SHC-Hartin, Valley Forge, PA.
Wolverton, B.C., and HcDonald, R.C., 1982. Basic Engineering Criteria and Cost Estimations for Hybrid Hicrobial Filter-Reed (Phragmites communis) Wastewater Treatment Concept. NASA TH-84669. National Aeronautics and Space Administration, National Space Technology Laboratories, NSTL Station, HS.
ONRED WQB 0137J

Table 1 . DESIGN OF THE ISELIN ARTIFICIAL WETLANDS SYSTEM
Cminu to r and S c r e e ?
Standard design based on manufacturers data fo r raw sewage flow Cminu to r : C l o w Model A - 8 Bypass bar screen: 2" x 1/4" (5.1 cm x 0.64 cm) w i th I" (2.5 cm) openings, manually cleaned
Aeration Cel I
Standard c i rcular design based on 50% BOD removal and complete mixing V o l m : 34,500 gallons (I30 m3) (winter conditions control the size) Depth: 5' (1.52 m) Detention time: 2.86 days Horsepower for canplete mixing: 2.3 hp (1700 W) Freeboard: 2' (0.61 m) Sidewall slope: lv:3h Liner: Hypalon
Wet I ands Marsh
AppI icat ion rate Nunber o f ce l l s Cel I lengthluidth r a t i o Media 1 i ner Freeboard Maximum Sidewater depth Slope Vegetation In le t
Outlet
50,000 gal/acre/day (470 m3/ha/day) 2 3.6811 4" ( I O cm) 2B Stone over 16" (41 cm) sand 4" (IO cm) Volclay 0.5' (I5 cm) 2.0' (61 cm) 2% Cattai Is 4" (IO cm) WC perforated header across cel I
width buried i n 28 stone French drain 9" (23 cm) stone r i p rap
Berm Slopes lv:3h Cell Divider 3' (91 cm) top width, compacted so i l
Standard design based on 50% BOD removal Detention t ime: 22 days (winter conditions control) V o l m : 264,000 gal Ions (I ,OOO m3) Depth: 5' (1.5 m) Length/width rat io: 211 Freeboard: 2' (0.61 m) Sidewall slope: Iv:Jh l iner : 4" ( I O cm) Volclay
Ch lor i nation
Meadow
100,000 ga I/acre/day (940 mJ/ha/day) 2 I .84/1 4" (IO cm) 28 Stone over 16" (41 cm) sand 4" ( I O cm) Volclay 0.5' (I5 cm) 2.0' (61 cm) 22 Reed canary grass 4"(10 cm) WC perforated header across c e l l
width, buried i n 28 stone French drain 8" (20 cm) reinforced concrete wal I with 6" (15 cm) diameter weep holes, spaced a t 4' (122 cm) intervals
I v: 3h 3' (91 cm) top width, compacted so i l
Chlorinator: Sanuri I Model 1001 Contact Tank: 1250 gal (4.7 m3) Contact Time: 120 min Required Chlorine Residual: 2.0 q/ l
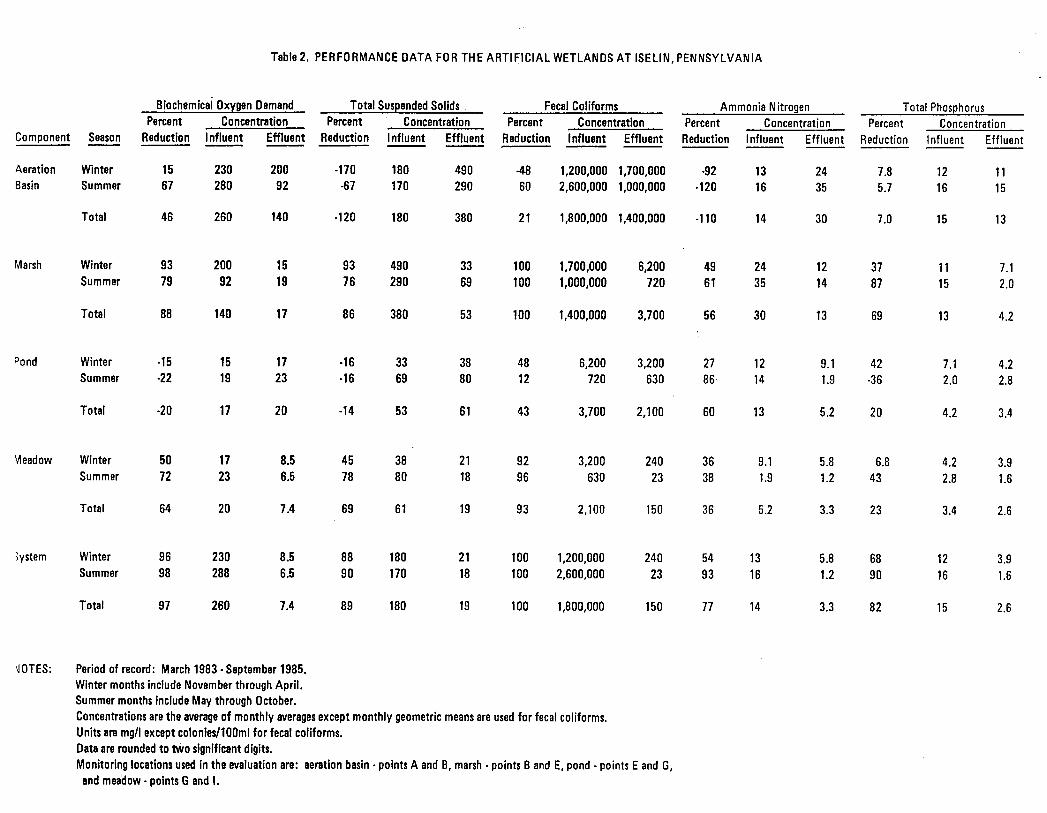
Tabla 2. PERFORMANCE DATA FOR THE ARTIFICIAL WETLANDS AT ISELIN, PENNSYLVANIA
Biochemical Oxygen Demand Total Suspended Solids Percent Concentration Percent Concentration
Reduction Influent Effluent Reduction Influent Effluent - - -- Fecal Coliforms Ammonia Nitrogen Total Phosphorus
Reduction Influent Effluent Reduction Influent Effluent Reduction Influent Effluent Concentration Percent Concentration Percent Concentration Percent
- - ----- Component Season
Aeration Winter Basin Summer
15 230 200 -170 180 490 67 280 92 -67 170 290
-48 1,200,000 1,700,000 -92 13 24 7.8 12 11 60 2,600,000 1,000,000 -120 16 35 5.7 16 15
Total 46 260 140 -120 180 380 2 1 1,800,000 1,400,000 -1 10 14 30 7.0 15 13
Marsh Winter Summer
93 200 15 93 490 33 79 92 19 76 290 69
100 1,700,000 6,200 49 24 12 37 11 7.1 100 1,000,000 720 61 35 14 87 15 2.0
Total 88 140 17 86 380 53 100 1,400,000 3,700 56 30 13 69 13 4.2
Pond Winter Summer
-15 15 17 -1 6 33 38 -22 19 23 -16 69 80
48 6,200 3,200 27 12 9.1 42 7.1 4.2 12 720 630 86 14 1.9 -3 6 2.0 2.8
Total -2 0 17 20 -14 53 61 43 3,700 2,100 60 13 5.2 20 4.2 3.4
Veadow Winter Summer
50 17 8.5 45 38 21 72 23 6.5 78 80 18
92 3,200 240 36 9.1 5.8 6.8 4.2 3.9 96 630 23 38 1.9 1.2 43 2.8 1.6
Total 64 20 7.4 69 61 19 93 2,100 150 36 5.2 3.3 23 3.4 2.6
;ystem Winter Summer
96 230 8.5 88 180 21 98 288 6.5 90 170 18
100 1,200,000 240 54 13 5.8 68 12 3.9 100 2,600,000 23 93 16 1.2 90 16 1.6
Total 97 260 7.4 89 180 19 100 1,800,000 150 77 14 3.3 82 15 2.6
IOTES: Period of record: March 1983 -September 1985. Winter months include November through April. Summer months include May through October. Concentrations are the average of monthly averages except monthly geometric means are used for fecal coliforms. Units are mgll except colonies1100ml for fecal coliforms. Data are rounded to two significant digits. Monitoring locations used in the evaluation are: aemtion basin - points A and B, marsh - points B and E, pond - points E and G,
and meadow - points G and I.
105' 140'
Aerat ion Cel l
Commlnutor a 6. Screen r-'
-- IC -0
n r , rr) 0 -: Influent
in? C
Notel Dimenoions are a t the water wr face for the aeration coil and pond and a t the atone t u r f l e a for the marah and meadow.
b r-' rr)
Commlnutoi h Screen
-=j ;,iL ~
Figure I . lselln Artificial Wetlands Treatment Scheme

Figure 2. Effluent Concentrations For the lselin Artificial Wetlands
P -7 I O 0
2000
....................................................................................................................................... , 800 _ _ .................... FECAL COLIFORMS , ...............................................................................................................................................................
o T O T A L SUSPENOED SOLlOS 0 BIOCHEMICAL OXYGEN DEMAND
80 I\ 7 0
k 60 -
i 9 50 l- a E 30 z w
40 0 0
20
I O
0 M 8 3 M J S N
16 1
............................................................................................................................................ I *400 t 1 - 0
...................................................................................................... 2- 8oo 0 a a 600 _ _
z 4oo
................................................. I-
I- z W 0
0 0
....................................................
................................................
..........................................................
0 M 8 3 M J S N J 8 4 M M J S N J 8 5 M M J S
MONTH


CONSTRUCTED WETLANDS DESIGN EXAMPLE SUBSURFACE FLOW MUNICIPAL SYSTEM
TREATMENT OF PRIMARY EFFLUENT TO SECONDARY LEVELS OR SECONDARY EFFLUENT TO ADVANCED LEVELS
The design will be based on hydraulic loading rates (HLR) rather than first order kinetics because of limited information on appropriate reaction rates and constants. The references cited in the example are: (1) Steiner, G. R. and R. J. Freeman, Jr. "Configuration and Substrate Design Considerations for Constructed Wetlands Wastewater Treatment", (2) Watson, J. T., S. C. Reed, R. Kadlec, R. L. Knight, and A. E. Whitehouse. Wetlands'*, and (3) Watson, J. T. and J. Hobson. "Hydraulic Design Considerations and Control Structures for Constructed Wetlands for :
Wastewater Treatment" in Constructed Wetlands for Wastewater Treatment, D. A. Hammer, Ed. (Chelsea, MI: Lewis Publishers Inc., 1989). Washed river gravel with a nomimal size of about 3/4 aggregate) and either reeds (PhraRmites australis) or softstem bulrush (Scripus validus) will be used (see reference 1). The design flow will be 100,000 gpd (13,370 ft3/day). significant site constraints.
**Performance Expectations and Loading Rates for Constructed
** (such as /I467 AHD
It is assumed that there are no
Select an appropriate HLR: 20 acres/MGD (reference 2, table 7)
Calculate the surface area (A,) needed:
As = 20 acres/MGD * 0.1 MGD = 2 acres = 87,120 ft2
Calculate the cross-sectional area (Ac):
A, = Q/(ks*S) (Darcy's law: reference 2, equation 9)
Use a long term permeability of 260 m/day or 853 ft/day (reference 2, p. 23) and a hydraulic gradient (bed slope) of 1%.
A, = 13,370 ft3/day / (853 ft/day * 0.01) = 1,567 ft2
Calculate the system width (Us):
Use an inlet depth of 1.5 ft.
Us = 1,567 ft2 / 1.5 ft = 1,045 ft
Calculate the system length (Ls):
Ls = 87,120 ft2 / 1,045 ft = 83.4 ft (say 84 ft)
Calculate the outlet depth Do:
Do = 1.5 ft + (84 ft * 0.01) = 2.34 ft
Note: The maximum depth should not exceed 2.5 ft (the maximum effective root depth of reeds or bulrushes, reference 2, p. 22). If adjustments are needed to meet this criterion, reduce the hydraulic gradient to obtain a greater cross-sectional area and a reduced system length.


Use parallel cells to provide operational flexibility and better hydraulic control. Four cells should be adequate for this design. After rounding, the dimensions would be 261 ft. wide and 84 ft. long (each cell). Information on inlet and outlet structures is provided in reference 3 . Liners, recirculation, alternate configurations, etc. are addressed in reference 1.
04 6 OH

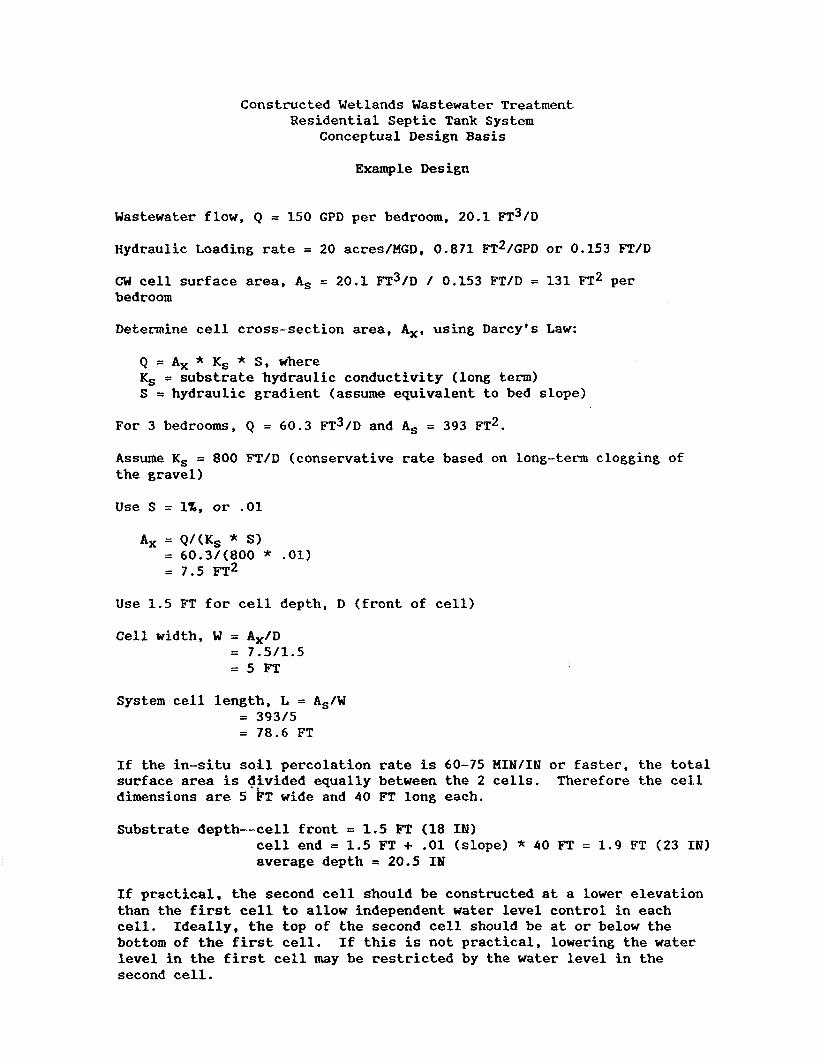
Constructed Wetlands Wastewater Treatment Residential Septic Tank System
Conceptual Design Basis
Example Design
Wastewater flow, Q = 150 GPD per bedroom, 20.1 FT3/D
Hydraulic Loading rate = 20 acres/MGD, 0.871 M12/GPD or 0.153 F T / D
CW cell surface area, As = 20.1 FT3/D / 0.153 FT/D = 131 ET2 per bedroom
Determine cell cross-section area, A,, using Darcy's Law:
Q = A, * Ks * S , where K, = substrate hydraulic conductivity (long term) S = hydraulic gradient (assume equivalent to bed slope)
For 3 bedrooms, Q = 60.3 FT3/D and As = 393 ET2.
Assume K, = 800 FT/D (conservative rate based on long-term clogging of the gravel)
Use S = 1%, or .01
Use 1.5 FT for cell depth, D (front of cell)
Cell width, W = A,/D = 7.5/1.5 = 5 F T
System cell length, L = As/W = 393/5 = 78.6 FT
If the in-situ soil percolation rate is 60-75 MIN/IN or faster, the total surface area is divided equally between the 2 cells. dimensions are 5 kT wide and 4 0 FT long each.
Therefore the cell
Substrate depth--cell front = 1.5 FT (18 IN) cell end = 1.5 FT + .01 (slope) * 40 FT = 1.9 FT (23 IN) average depth = 20.5 IN
If practical, the second cell should be constructed at a lower elevation than the first cell to allow independent water level control in each cell. Ideally, the top of the second cell should be at or below the bottom of the first cell. If this is not practical, lowering the water level in the first cell may be restricted by the water level in the second cell.


-2-
If the above dimensions do not f i t t he desired s i te , the dimensions can be adjusted by using d i f f e ren t hydraulic gradients , or cell bed slopes. Reducing the s lope w i l l increase t h e bed width and decrease i t s length, and increasing the slope w i l l decrease t h e bed width and increase i t s length. For example, a slope of 0.5% i n the above example r e s u l t s in:
U s e S = 0.5%, or .005
For D = 1.5 FT ( in l e t ) , W = 15.111.5 = 10 FT L = 393/10 = 39.3 FT
U s e two cells, 10 FT wide and 20 FT long each. Outlet depth f o r each cell is 1.5 ET + 0.005 * 20 FT = 1.6 FT.
WRC 0476H


CONSTRUCTED WETLANDS DESIGN EXAMPLE SURFACE FLOW SYSTEM
TREATMENT OF PRIMARY EFFLUENT TO SECONDARY LEVELS OR SECONDARY EFFLUENT TO ADVANCED LEVELS
The design is based on a flow of 100,000 gpd and a selection hydraulic loading rate (HLR).
Select appropriate HLR: 50 acres/MGD
Calculate required surface area (As):
As = 0.1 MGD * 50 acres/MGD = 5 acres = 217,800 ft2
Select length to width ratio (L/W): 20
Calculate system dimensions:
width = x ft, length = 20x ft
x * 2 0 ~ = 217,800 ft2 x = 104.4 ft, use 100 ft width
length = 217,800 ft2 i 100 = 2178 ft; use 2200 ft
Effective L/W = 22
One cell 2200 ft long by 100 ft wide
Option
Use a 4-cell serpentine system, or 4 parallel cells.
As each cell = 217,800 ft2 P 4 = 54,450 ft2
Use L/W = 10
Dimensions: lox2 = 54,450 x = 74 ft width
Length = 54,450 ft2 - 74 ft = 736 ft, use 740 ft.
Overall system size, (excluding divider dikes) is 740 feet long by 296 ft. wide (4 x 74 ft.)
Parallel cells provides better 0624 flexibility.
Use slight bed slope (0.1%), which provides a 9" difference between inlet and outlet for the 740 foot long beds.
Use dike height of three feet above bed.
Elevate inlet distributor(s1 two feet above bed on large stone.
WRC 05460


!1
1
Plan Mew of Outlet Structure wlth SwIveling Standpipe
Rotatfon !
Rotate Standplpe and Elbow to the Desired Water Level
Source: Modifled from Cooper 1
and Hobson [Ill
I Control Structure with Collapslble Tubing
Length of Pipe Sedon Correspond8 to the n DeaIred Water Wet
Control Structure wlth Swiveling Standpipe Control Structure wlth Interchangeable Sections of PIP wIth Joints Containing Elastomeric aske eta
Figure. Outlet water level control structures