TENNESSEE EDUCATION LOTTERY CORPORATION
39
STATE OF TENNESSEE COMPTROLLER OF THE TREASURY TENNESSEE EDUCATION LOTTERY CORPORATION Financial and Compliance Audit Report For the Year Ended June 30, 2018 Justin P. Wilson, Comptroller Division of State Audit
Transcript of TENNESSEE EDUCATION LOTTERY CORPORATION

STATE OF TENNESSEE COMPTROLLER OF THE TREASURY
TENNESSEE EDUCATION LOTTERY
CORPORATION
Financial and Compliance Audit Report
For the Year Ended June 30, 2018
Justin P. Wilson, Comptroller
Division of State Audit

Deborah V. Loveless, CPA, CGFM, CGMA Director Edward Burr, CPA, CGFM Assistant Director Aaron Jewell, CPA, CFE, CGFM Audit Manager Mark White, CPA In-Charge Auditor Hellens Cruz-Sanchez, CPA, CGMA, CFE Staff Auditor Gerry C. Boaz, CPA, CGFM, CGMA Technical Manager Amy Brack Editor Amanda Adams Assistant Editor
Comptroller of the Treasury, Division of State Audit
Cordell Hull Building 425 Fifth Avenue North
Nashville, TN 37243 (615) 401-7897
Reports are available at
www.comptroller.tn.gov/sa/AuditReportCategories.asp
Mission Statement The mission of the Comptroller’s Office is to
make government work better.
Comptroller Website www.comptroller.tn.gov

December 6, 2018 The Honorable Bill Haslam, Governor Members of the General Assembly Board of Directors, Tennessee Education Lottery Corporation Ladies and Gentlemen: Transmitted herewith is the financial and compliance audit of the Tennessee Education Lottery Corporation for the year ended June 30, 2018. You will note from the independent auditor’s report that an unmodified opinion was given on the fairness of the presentation of the financial statements. Consideration of internal control over financial reporting and tests of compliance resulted in no audit findings. Sincerely,
Deborah V. Loveless, CPA, Director Division of State Audit 19/008

Audit Report Tennessee Education Lottery Corporation
For the Year Ended June 30, 2018
TABLE OF CONTENTS
Page
Audit Highlights 1 Financial Section
Independent Auditor’s Report 2
Management’s Discussion and Analysis 4
Basic Financial Statements
Statements of Net Position 15
Statements of Revenues, Expenses, and Changes in Net Position 16
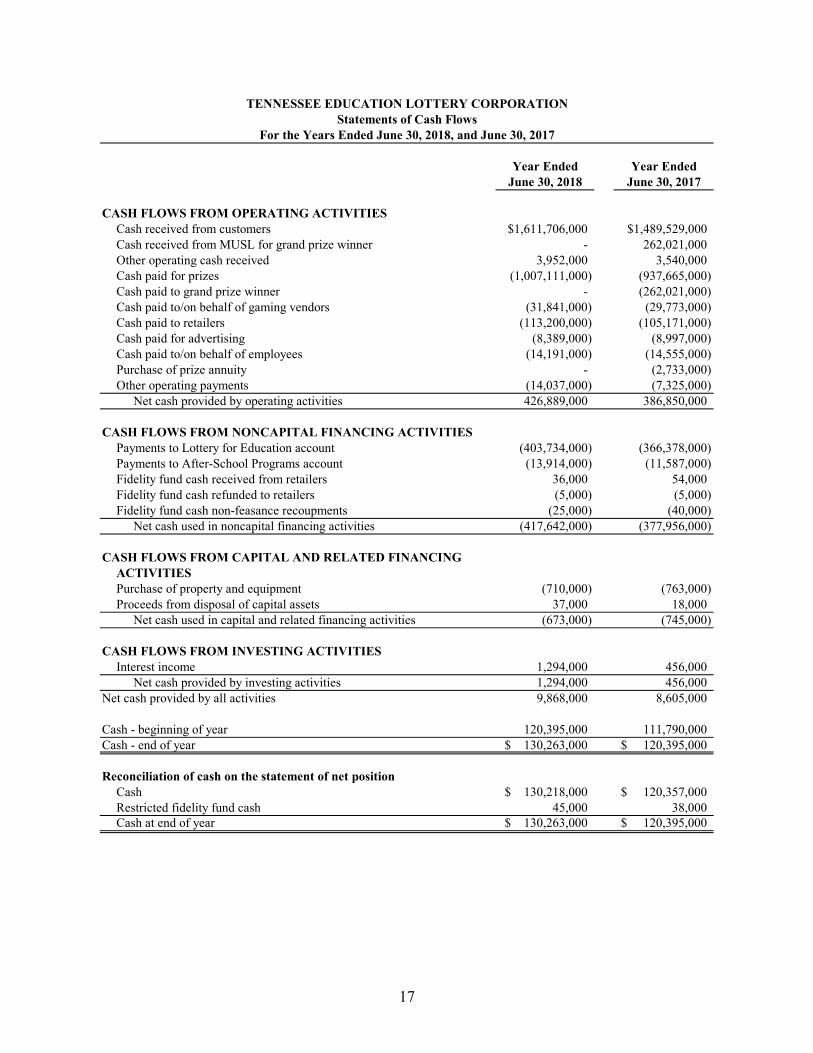
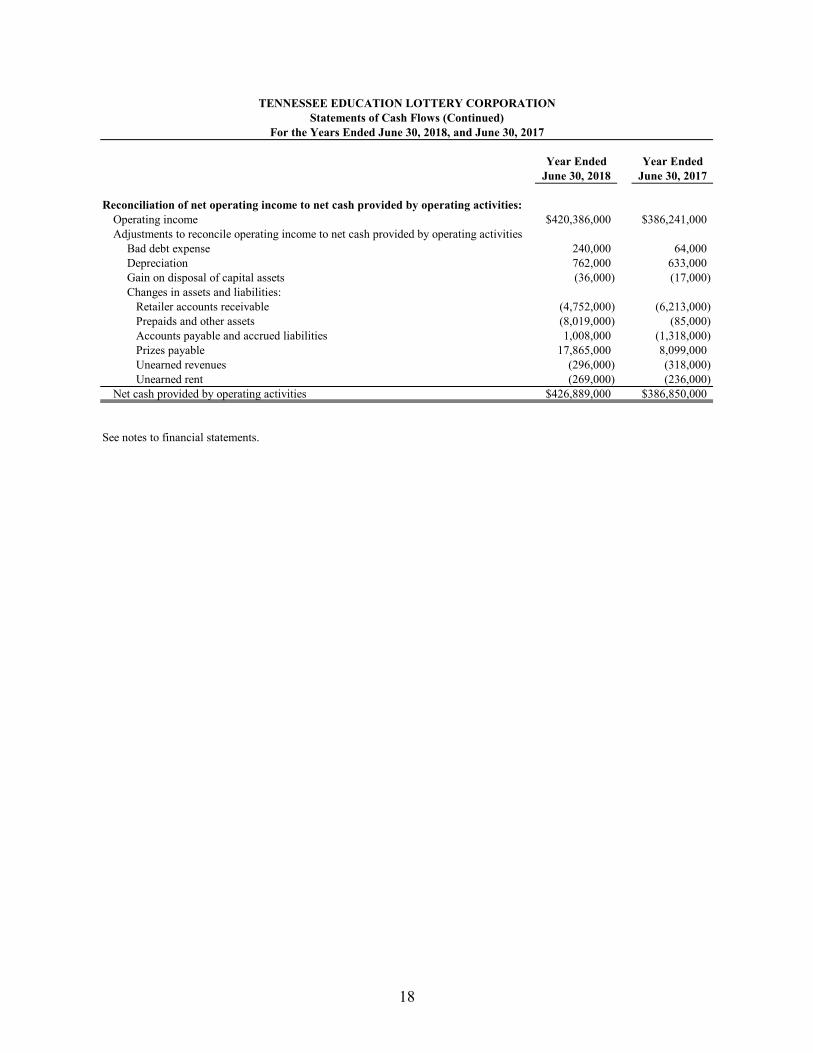
Statements of Cash Flows 17
Notes to the Financial Statements 19
Internal Control, Compliance, and Other Matters
Independent Auditor’s Report on Internal Control Over Financial Reporting and on Compliance and Other Matters Based on an Audit of Financial Statements Performed in Accordance With Government Auditing Standards 34
1
State of Tennessee
A u d i t H i g h l i g h t s
Comptroller of the Treasury Division of State Audit
Financial and Compliance Audit
Tennessee Education Lottery Corporation For the Year Ended June 30, 2018
Opinion on the Financial Statements
The opinion on the financial statements is unmodified.
Audit Findings The audit report contains no findings.
2
Independent Auditor’s Report
The Honorable Bill Haslam, Governor Members of the General Assembly Board of Directors, Tennessee Education Lottery Corporation
Report on the Financial Statements
We have audited the accompanying financial statements of the Tennessee Education Lottery Corporation, a component unit of the State of Tennessee, as of and for the years ended June 30, 2018, and June 30, 2017, and the related notes to the financial statements, which collectively comprise the Tennessee Education Lottery Corporation’s basic financial statements as listed in the table of contents.
Management’s Responsibility for the Financial Statements
Management is responsible for the preparation and fair presentation of these financial statements in accordance with accounting principles generally accepted in the United States of America; this includes the design, implementation, and maintenance of internal control relevant to the preparation and fair presentation of financial statements that are free from material misstatement, whether due to fraud or error.
Auditor’s Responsibility
Our responsibility is to express an opinion on these financial statements based on our audits. We conducted our audits in accordance with auditing standards generally accepted in the United States of America and the standards applicable to financial audits contained in Government Auditing Standards issued by the Comptroller General of the United States. Those standards require that we plan and perform the audit to obtain reasonable assurance about whether the financial statements are free from material misstatement.
An audit involves performing procedures to obtain audit evidence about the amounts and disclosures in the financial statements. The procedures selected depend on the auditor’s judgment, including the assessment of the risks of material misstatement of the financial statements, whether due to fraud or error. In making those risk assessments, the auditor considers internal control relevant to the entity’s preparation and fair presentation of the financial statements in order to design audit procedures that are appropriate in the circumstances, but not for the purpose of expressing an opinion on the effectiveness of the entity’s internal control. Accordingly, we express no such opinion. An audit also includes evaluating the appropriateness of accounting policies used and reasonableness of significant accounting estimates made by management, as well as evaluating the overall presentation of the financial statements.

3
We believe that the audit evidence we have obtained is sufficient and appropriate to provide a basis for our audit opinion.
Opinion
In our opinion, the financial statements referred to above present fairly, in all material respects, the financial position of the Tennessee Education Lottery Corporation as of June 30, 2018, and June 30, 2017, and the changes in financial position and cash flows thereof for the years then ended in accordance with accounting principles generally accepted in the United States of America.
Other Matters
Required Supplementary Information
Accounting principles generally accepted in the United States of America require that the management’s discussion and analysis on pages 4 through 14 be presented to supplement the basic financial statements. Such information, although not a part of the basic financial statements, is required by the Governmental Accounting Standards Board, which considers it to be an essential part of financial reporting for placing the basic financial statements in an appropriate operational, economic, or historical context. We have applied certain limited procedures to the required supplementary information in accordance with auditing standards generally accepted in the United States of America, which consisted of inquiries of management about the methods of preparing the information and comparing the information for consistency with management’s responses to our inquiries, the basic financial statements, and other knowledge we obtained during our audit of the basic financial statements. We do not express an opinion or provide any assurance on the information because the limited procedures do not provide us with sufficient evidence to express an opinion or provide any assurance.
Other Reporting Required by Government Auditing Standards
In accordance with Government Auditing Standards, we have also issued our report dated November 1, 2018, on our consideration of the Tennessee Education Lottery Corporation’s internal control over financial reporting and on our tests of its compliance with certain provisions of laws, regulations, contracts, and grant agreements and other matters. The purpose of that report is to describe the scope of our testing of internal control over financial reporting and compliance and the results of that testing, and not to provide an opinion on internal control over financial reporting or on compliance. That report is an integral part of an audit performed in accordance with Government Auditing Standards in considering the Tennessee Education Lottery Corporation’s internal control over financial reporting and compliance.
Deborah V. Loveless, CPA, Director Division of State Audit November 1, 2018

4
TENNESSEE EDUCATION LOTTERY CORPORATION Management’s Discussion and Analysis
The Tennessee Education Lottery Corporation (TEL) offers the following discussion and analysis to the readers of the financial statements. This narrative overview provides an objective analysis of TEL’s financial activity for the fiscal years ended June 30, 2018, and June 30, 2017, with comparative information presented for the fiscal year ended June 30, 2016. The overview should be considered in conjunction with the independent auditor’s report, the accompanying audited financial statements, and the notes to the financial statements. The financial statements, notes, and this discussion are the responsibility of management.
Understanding TEL’s Financial Statements
TEL, a quasi-public instrumentality, is a component unit of the State of Tennessee. TEL’s activities are accounted for as a business-type activity using the full accrual basis of accounting, similar to a private business entity. In accordance with accounting principles generally accepted in the United States of America, this report consists of a series of comparative financial statements, along with notes to the financial statements designed to highlight TEL’s net position and changes therein resulting from business operations.
The financial statements are comprised of three components:
the statements of net position – reflect TEL’s financial position at June 30, 2018, and June 30, 2017;
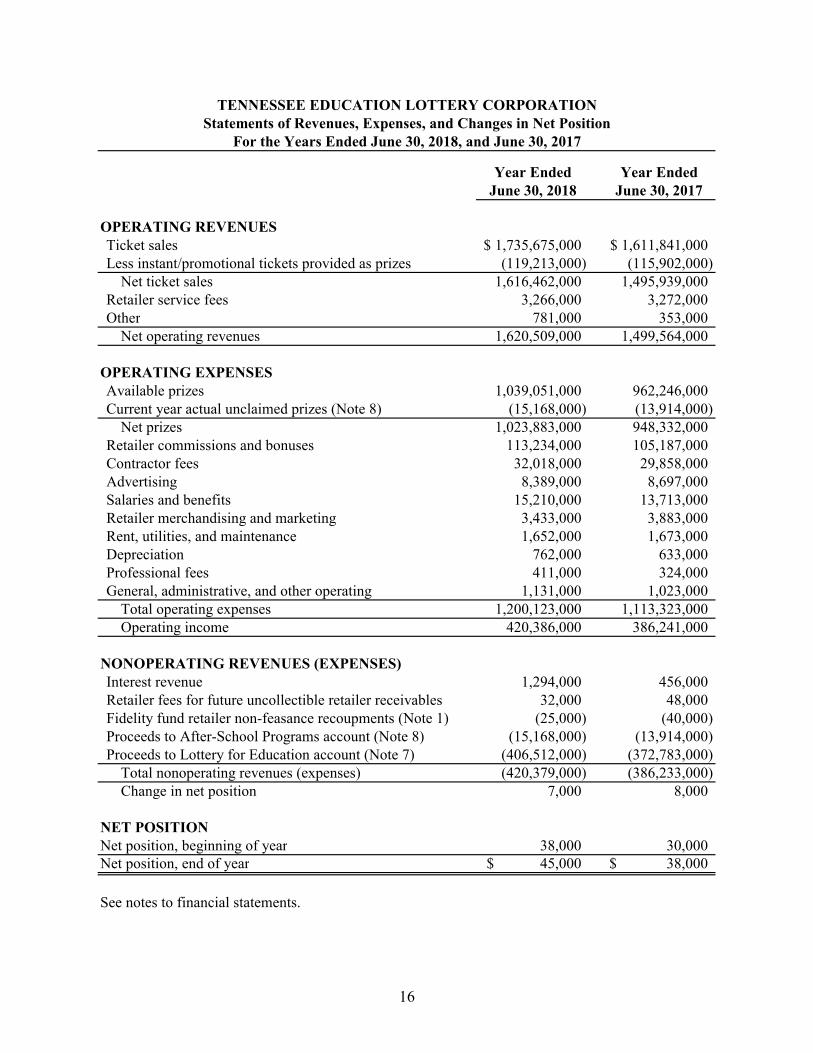
the statements of revenues, expenses, and changes in net position – report revenues and expenses incurred in relation to the sale of lottery products, as well as other non-gaming related activity for the fiscal years ended June 30, 2018, and June 30, 2017; and
the statements of cash flows – outline the cash inflows and outflows related to the activity of selling lottery products and other business-related activities for the fiscal years ended June 30, 2018, and June 30, 2017.
The notes to the financial statements document additional information that is essential for readers to gain a comprehensive understanding of the data provided in TEL’s financial statements.
TEL’s primary business purpose is to generate revenues to fund college scholarships and grants for residential Tennessee students attending higher educational institutions within the state. Accordingly, the main focus of the financial statements is determining funds available for payment to the State of Tennessee’s Lottery for Education Account. Furthermore, in addition to funding this account, TEL’s unclaimed prize funds are deposited to the After-School Programs special account, which benefits after-school programs throughout the State of Tennessee.

5
Fiscal Year 2018 Financial Highlights
TEL closed its fiscal year 2018 with a contribution of $421.7 million for all Lottery-funded education programs, bringing the total to over $4.6 billion since sales began January 20, 2004. Sales of popular instant games were up 5.7% over the previous year, while the Lottery’s drawing-style games collectively were up 17.1% over last year.
Gross ticket sales for the fiscal year 2018 were $1.735 billion, bringing the total since inception to more than $18.3 billion. During the period, there were 25 winners of $1 million or more, including the two Cash 4 Life winners of $1,000 a day and $1,000 a week for life, respectively, along with high Powerball and Mega Millions jackpots during the fiscal year. Total prizes won since inception total more than $12.6 billion, with 239 winning tickets sold worth $1 million or more.
Management attributes the success to staying focused on the corporation’s mission to serve Tennessee students and their families by responsibly maximizing proceeds for all education programs. TEL works continually to refine our business model; introduce innovative and entertaining games for our players; promote efficiencies and best business practices across the organization; and provide quality support for the retailers selling the Lottery’s products.
In fiscal year 2018, sales of the instant ticket games reached a record-setting high of $1.407 billion, topping last year’s record of $1.331 billion by $76 million, or 5.7%.
Fifty-five new instant ticket games were introduced during the year. These new games contributed to the instant product’s success by providing players with new and exciting ways to play the popular games. In addition, TEL’s “Jumbo Bucks” family of games continued to be a top choice of players during fiscal year 2018. The $30 price point of Mighty Jumbo Bucks, launched in April 2017, continues to be a popular choice, along with the $5 price point Giant Jumbo Bucks and $10
16
1616
17
17 17
18
18 18
$0
$300
$600
$900
$1,200
$1,500
Instant Sales Tennessee Only Draw-Style Sales
Multi-JurisdictionalDraw-Style Sales
Mil
lion
s
Tennessee Education Lottery Gross Ticket RevenuesFiscal Year 2018 Comparison to 2017 and 2016
6
price point Jumbo Jumbo Bucks. At the $3 price point, Jumbo Bucks Seasons had a stellar year with the launch of additional games such as Eclipse and Cinco de Mayo, along with the consistent performers for Valentine’s Day, Mother’s Day, and Father’s Day.
The Tennessee only drawing-style games consist of drawing-style games played within the state of Tennessee:
Cash 3 sales in fiscal year 2018 decreased by 0.5% compared to fiscal year 2017.
Cash 4 sales increased by 3.1% over fiscal year 2017.
Sales for Tennessee Cash increased $2.44 million during fiscal year 2018. Tennessee Cash is a cash jackpot drawing-style game. The sales for this game are driven by the size of the jackpot. During fiscal year 2018, TEL had a near record jackpot cycle during May 2018, which aided in the increase of this product.
In August 2017, TEL launched Keno to Go! This is a Tennessee only drawing-style game that can be played every five minutes for an opportunity to win up to $100,000. Players can view drawings on a mobile device, tablet, or computer. Sales for fiscal year 2018 were $14.7 million.
Tennessee participates in the following multi-jurisdictional drawing-style games:
Powerball sales increased $15.6 million in fiscal year 2018. The year-over-year increase is due to three significant jackpot cycles, which included a $759 million jackpot cycle in August 2017, a $559.7 million jackpot cycle in January 2018, and a $456.7 million jackpot cycle in March 2018.
Sales for Mega Millions in fiscal year 2018 were $51.7 million, compared to $37 million the prior year. The year-over-year increase can be attributed to two factors: in October 2017 the ticket price went to $2, and there were three jackpot cycles near or exceeding $400 million through June 30, 2018.
The Cash 4 Life drawing-style game operates in nine states, providing a chance to win $1,000 a day for life or $1,000 a week for life. Total sales were $8.8 million in fiscal year 2018, a decrease of $2.2 million from 2017. TEL had two winners during the fiscal year 2018, one of $1,000 a week for life and one of $1,000 a day for life.
In November of fiscal year 2018 Lotto America launched, with sales of $7.9 million for the year. This is a jackpot game with a purchase price of $1 is available to play in 13 jurisdictions: Delaware, Idaho, Iowa, Kansas, Maine, Montana, Minnesota, New Mexico, North Dakota, Oklahoma, South Dakota, Tennessee, and West Virginia.
In October of fiscal year 2018 the Hot Lotto game was ended. Before it was ended, it contributed $5.5 million in sales in fiscal year 2018.
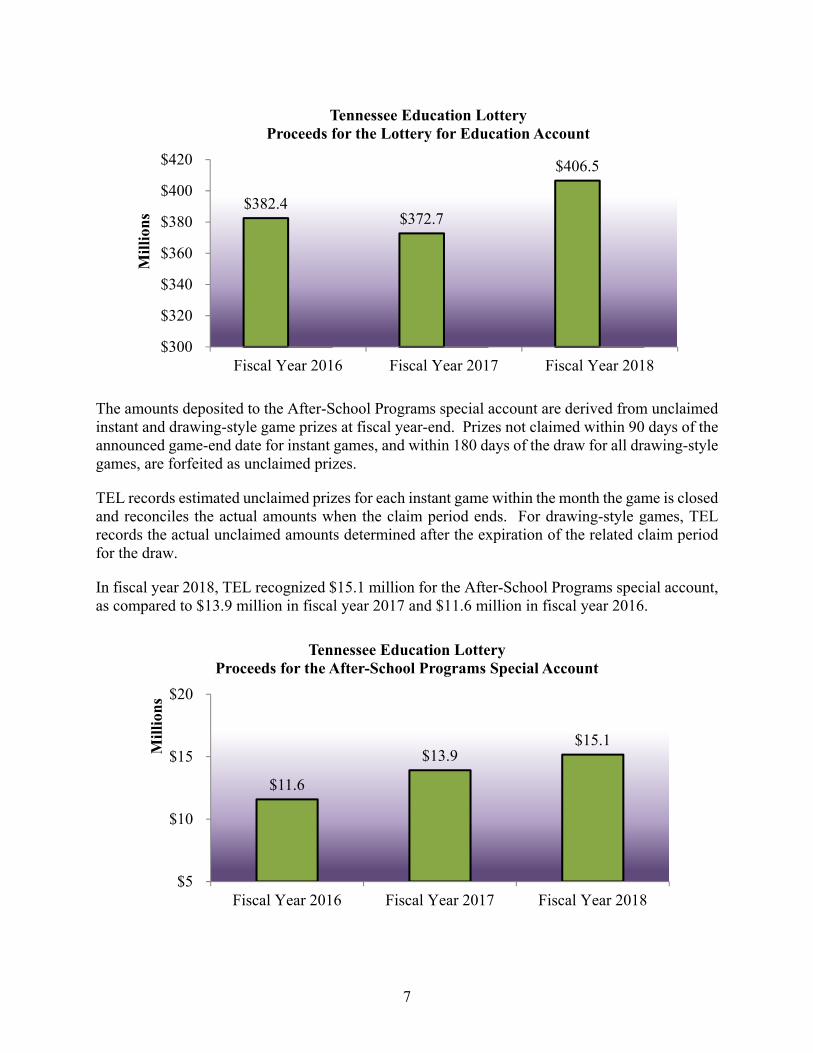
TEL generated $406.5 million for the Lottery for Education Account in fiscal year 2018, compared to $372.7 million in fiscal year 2017 and $382.4 million in fiscal year 2016.
7
The amounts deposited to the After-School Programs special account are derived from unclaimed instant and drawing-style game prizes at fiscal year-end. Prizes not claimed within 90 days of the announced game-end date for instant games, and within 180 days of the draw for all drawing-style games, are forfeited as unclaimed prizes.
TEL records estimated unclaimed prizes for each instant game within the month the game is closed and reconciles the actual amounts when the claim period ends. For drawing-style games, TEL records the actual unclaimed amounts determined after the expiration of the related claim period for the draw.
In fiscal year 2018, TEL recognized $15.1 million for the After-School Programs special account, as compared to $13.9 million in fiscal year 2017 and $11.6 million in fiscal year 2016.
$382.4$372.7
$406.5
$300
$320
$340
$360
$380
$400
$420
Fiscal Year 2016 Fiscal Year 2017 Fiscal Year 2018
Mil
lion
s
Tennessee Education LotteryProceeds for the Lottery for Education Account
$11.6
$13.9$15.1
$5
$10
$15
$20
Fiscal Year 2016 Fiscal Year 2017 Fiscal Year 2018
Mil
lion
s
Tennessee Education LotteryProceeds for the After-School Programs Special Account

8
Overview of Financial Position
Condensed Statement of Net Position
June 30, 2018
Increase/ (Decrease) June 30, 2017
Increase/ (Decrease) June 30, 2016
Assets: Current assets
Cash $ 130,263,000 $ 9,868,000 $ 120,395,000 $ 8,605,000 $ 111,790,000 Retailer accounts receivable, net 79,331,000 4,512,000 74,819,000 6,149,000 68,670,000 Other 15,067,000 8,019,000 7,048,000 84,000 6,964,000
Total current assets 224,661,000 22,399,000 202,262,000 14,838,000 187,424,000 Non-current assets
Capital assets, net 3,176,000 (52,000) 3,228,000 129,000 3,099,000 Total non-current assets 3,176,000 (52,000) 3,228,000 129,000 3,099,000
Total assets 227,837,000 22,347,000 205,490,000 14,967,000 190,523,000 Liabilities: Current liabilities
Due to Lottery for Education account 98,430,000 2,778,000 95,652,000 6,406,000 89,246,000 Due to After-School Programs account 15,168,000 1,254,000 13,914,000 2,328,000 11,586,000 Prizes payable 105,189,000 17,866,000 87,323,000 8,099,000 79,224,000 Accounts payable and accrued liabilities 5,467,000 1,008,000 4,459,000 (1,318,000) 5,777,000 Unearned revenue 749,000 (296,000) 1,045,000 (319,000) 1,364,000 Unearned rent 134,000 - 134,000 (31,000) 165,000
Total current liabilities 225,137,000 22,610,000 202,527,000 15,165,000 187,362,000 Non-current liabilities
Unearned rent 2,655,000 (270,000) 2,925,000 (206,000) 3,131,000 Total non-current liabilities 2,655,000 (270,000) 2,925,000 (206,000) 3,131,000
Total liabilities 227,792,000 22,340,000 205,452,000 14,959,000 190,493,000 Net Position:
Investment in capital assets 3,176,000 (52,000) 3,228,000 129,000 3,099,000 Unrestricted (3,176,000) 52,000 (3,228,000) (129,000) (3,099,000)Restricted for uncollectible retailer
receivables 45,000 7,000 38,000 8,000 30,000 Total net position $ 45,000 $ 7,000 $ 38,000 $ 8,000 $ 30,000
Assets
The $22 million increase in total assets at June 30, 2018, and the $15 million increase in total assets at June 30, 2017, were primarily due to an increase in lottery ticket sales during the last quarter of the fiscal year, resulting in increased cash; accounts receivable at the fiscal year-end; and a receivable from the Cash 4 Life settlement fund related to the June 21, 2018, win of $1,000 a day for life.
Liabilities
The $22 million increase in total liabilities at June 30, 2018, and the $15 million increase in total liabilities at June 30, 2017, relate primarily to increased ticket sales during the last quarter of the fiscal year, resulting in higher net proceeds payable to the Lottery for Education Account; the prize payable for the Cash 4 Life winner on June 21, 2018; and more prizes payable to players.

9
Condensed Statement of Revenues and Expenses
June 30, 2018
Increase/ (Decrease) June 30, 2017
Increase/ (Decrease) June 30, 2016
Revenues: Instant games $ 1,407,863,000 $ 76,005,000 $ 1,331,858,000 $ 27,379,000 $ 1,304,479,000 Drawing-style games 328,052,000 48,005,000 280,047,000 (42,424,000) 322,471,000 Less instant/promotional
tickets provided as prizes (119,213,000) (3,311,000) (115,902,000) (810,000) (115,092,000) Games revenue, net 1,616,702,000 120,699,000 1,496,003,000 (15,855,000) 1,511,858,000
Bad debt recoveries/(expense),
net (240,000) (176,000) (64,000) 103,000 (167,000) Retailer service fees 3,266,000 (6,000) 3,272,000 49,000 3,223,000 Interest income 1,294,000 838,000 456,000 248,000 208,000 Other revenue 813,000 412,000 401,000 102,000 299,000
Total revenues 1,621,835,000 121,767,000 1,500,068,000 (15,353,000) 1,515,421,000 Expenses
Cost of sales 1,180,957,000 85,000,000 1,095,957,000 (7,354,000) 1,103,311,000 General, administrative, and
other operating expenses 19,166,000 1,800,000 17,366,000 (659,000) 18,025,000 Other expenses 25,000 (15,000) 40,000 (6,000) 46,000 Proceeds to After-School
Program account 15,168,000 1,254,000 13,914,000 2,328,000 11,586,000 Proceeds to Lottery for
Education account 406,512,000 33,729,000 372,783,000 (9,679,000) 382,462,000 Total expenses 1,621,828,000 121,768,000 1,500,060,000 (15,370,000) 1,515,430,000 Change in net position 7,000 (1,000) 8,000 17,000 (9,000) Total net position, beginning of
year 38,000 8,000 30,000 (9,000) 39,000 Total net position, end of year $ 45,000 $ 7,000 $ 38,000 $ 8,000 $ 30,000
Revenues
Gross lottery ticket sales for fiscal years 2018, 2017, and 2016 were $1.735 billion, $1.611 billion, and $1.626 billion, respectively. The following chart depicts the distribution of sales by product for the three fiscal years ended June 30:

10
Gross instant ticket sales for fiscal year 2018 were $1.407 billion. This represents a 5.7% increase from fiscal year 2017’s instant ticket sales of $1.331 billion, which represented a 2.1% increase from fiscal year 2016 instant ticket sales of $1.304 billion. Instant tickets represent approximately 81% of total gross sales in fiscal years 2018, 2017, and 2016. The year-over-year increase in gross instant ticket sales is attributed to the instant-ticket marketing strategy, which involves the ongoing introduction of multiple games, including special theme games, families of games, and higher price-point games with higher prize payouts. The games most popular with the players in 2018 continue to be the “Jumbo Bucks” family.
For the Tennessee only drawing-style games:
Cash 3 sales for fiscal years 2018, 2017, and 2016 were $63.3 million, $63.6 million, and $61.5 million, respectively.
Cash 4 sales were $38.9 million, $37.6 million, and $35 million in the years 2018, 2017, and 2016, respectively.
$1.3
04 B
$1.6
11 B
Gross Sales by Major Product
Fiscal Year 2016
Fiscal Year 2017
Fiscal Year 2018$1.6
26B
$1.7
35 B
$1.3
31B
$162
.1 M
$1.4
07 B
$192
.1 M
$208
.4M
$136
.0 M
$117
.9 M
$114
.0 M

11
Tennessee Cash sales for fiscal years 2018, 2017, and 2016 were $18.9 million, $16.5 million, and $17.3 million, respectively.
Keno to Go! sales began in August 2017. Sales for fiscal year 2018 were $14.7 million.
Multi-jurisdictional drawing-style games:
Powerball is a drawing-style lottery game operated in the following jurisdictions in addition to Tennessee: Arizona, Arkansas, Colorado, Connecticut, Delaware, the District of Columbia, Florida, Idaho, Iowa, Indiana, Kansas, Kentucky, Louisiana, Maine, Minnesota, Missouri, Montana, Nebraska, New Hampshire, New Mexico, North Carolina, North Dakota, Oklahoma, Oregon, Pennsylvania, Puerto Rico, Rhode Island, South Carolina, South Dakota, U.S. Virgin Islands, Vermont, Wisconsin, West Virginia, and Wyoming. Starting on January 31, 2010, 10 states in the Mega Millions lottery consortium group began selling Powerball tickets as part of a cross-selling agreement with members of the Multi-State Lottery Association (MUSL) including Georgia, Illinois, Maryland, Massachusetts, Michigan, New Jersey, New York, Texas, Virginia, and Washington. Ohio and California, both members of the Mega Millions consortium, started cross-selling Powerball on April 16, 2010, and April 8, 2013, respectively.
Powerball sales for fiscal years 2018, 2017, and 2016 were $117.9 million, $102.3 million, and $147.3 million, respectively. These amounts represent approximately 7%, 6%, and 9% of gross ticket sales, respectively, for each fiscal year. The increase in Powerball was directly related to three jackpot cycles of significance in fiscal year 2018, which included a $759 million jackpot cycle in August 2017, a $559.7 million jackpot cycle in January 2018, and a $456.7 million jackpot cycle in March 2018.
Mega Millions is a drawing-style lottery game administered by a lottery consortium group. The group includes the following state lotteries: California, Georgia, Illinois, Maryland, Massachusetts, Michigan, New Jersey, New York, Ohio, Texas, Virginia, and Washington. Tennessee and certain other MUSL lottery members are authorized to sell the consortium’s Mega Millions game as part of a cross-selling agreement that began in January 2010. Sales for fiscal years 2018, 2017, and 2016 were $51.7 million, $37.0 million, and $37.3 million, respectively. Two factors played into the increase for Mega Millions: first, the price increase in October 2017, and secondly, three jackpots of significance with two $450 million plus jackpot cycles occurring after the price point change.
Cash 4 Life, a drawing-style game, was introduced in Tennessee on November 1, 2015, and has nine member lotteries: Florida, Georgia, Indiana, Maryland, New Jersey, New York, Pennsylvania, Tennessee, and Virginia. The game provides for two opportunities to win either $1,000 a week for life or $1,000 a day for life, respectively. TEL had one winner of each during fiscal year 2018. Sales were $8.8 million for 2018, $11 million for 2017, and $12.4 million for 2016.
Lotto America, a drawing-style game, was launched in Tennessee on November 15, 2017, and has 13 members: Delaware, Iowa, Indiana, Kansas, Maine, Minnesota, Montana, North
12
Dakota, New Mexico, Oklahoma, South Dakota, Tennessee, and West Virginia. Sales were $7.9 million for 2018.
Hot Lotto was a drawing-style lottery game operated in the following jurisdictions in addition to Tennessee: Delaware, the District of Columbia, Idaho, Iowa, Kansas, Maine, Minnesota, Montana, New Hampshire, New Mexico, North Dakota, Oklahoma, South Dakota, and West Virginia. Tennessee began sales for the game in May 2013. Sales were $5.5 million in 2018, $11.7 million in 2017, and $11.2 million in fiscal year 2016. The game ended in October of fiscal year 2018.
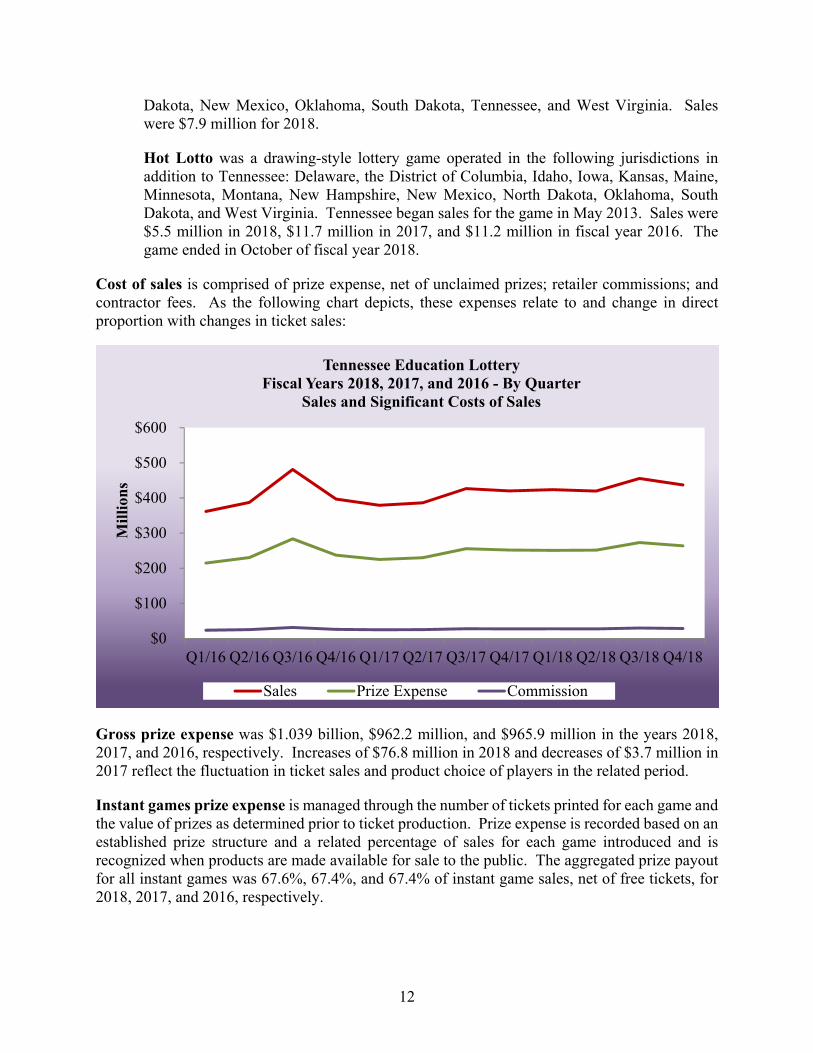
Cost of sales is comprised of prize expense, net of unclaimed prizes; retailer commissions; and contractor fees. As the following chart depicts, these expenses relate to and change in direct proportion with changes in ticket sales:
Gross prize expense was $1.039 billion, $962.2 million, and $965.9 million in the years 2018, 2017, and 2016, respectively. Increases of $76.8 million in 2018 and decreases of $3.7 million in 2017 reflect the fluctuation in ticket sales and product choice of players in the related period.
Instant games prize expense is managed through the number of tickets printed for each game and the value of prizes as determined prior to ticket production. Prize expense is recorded based on an established prize structure and a related percentage of sales for each game introduced and is recognized when products are made available for sale to the public. The aggregated prize payout for all instant games was 67.6%, 67.4%, and 67.4% of instant game sales, net of free tickets, for 2018, 2017, and 2016, respectively.
$0
$100
$200
$300
$400
$500
$600
Q1/16 Q2/16 Q3/16 Q4/16 Q1/17 Q2/17 Q3/17 Q4/17 Q1/18 Q2/18 Q3/18 Q4/18
Mil
lion
s
Tennessee Education LotteryFiscal Years 2018, 2017, and 2016 - By Quarter
Sales and Significant Costs of Sales
Sales Prize Expense Commission

13
Gross prize expense for drawing-style games generally increases or decreases in direct proportion to ticket sales of the related game and is recorded at the time of the related draw. The aggregated prize payout for all drawing-style games was 51.1%, 50.5%, and 50.9% for 2018, 2017, and 2016, respectively.
Retailer commissions were $113 million, $105 million, and $106.1 million for fiscal years 2018, 2017, and 2016, respectively. Consistent with the cost driver relationship of ticket sales to retailer commissions, the increase of $8 million in 2018 and decrease of $1.1 million in 2017 reflect the fluctuation of ticket sales realized in the related period.
Retailers are compensated a set commission percentage of 6.5% on all instant tickets settled and drawing-style tickets sold. They also receive an additional 1% bonus for cashing Cash 3 and Cash 4 ticket prizes. Additionally, TEL will pay a bonus of $25,000 to a retailer who sells a single jackpot-winning ticket for Powerball or Mega Millions; however, if there are multiple winning Powerball or Mega Millions jackpot winning tickets sold in Tennessee in a single drawing, the $25,000 selling bonus will be proportionately divided among the respective retailers based on the number of winning tickets sold by the retailer. Three Powerball jackpot ticket selling bonuses were paid during the last three fiscal years. TEL will also pay a $5,000 bonus to retailers selling any drawing-style game ticket where the prize won is equal to or greater than $1 million.
Drawing-style game ticket selling bonuses equaling $45,000, $55,000, and $75,000 were awarded for fiscal years 2018, 2017, and 2016, respectively.
Gaming contractor fees for fiscal years 2018, 2017, and 2016 were $32 million, $29.8 million, and $29.8 million, respectively. TEL has retained two major gaming contractors, one for the operation of its gaming systems and network and one for the manufacturing, warehousing, and distribution of its instant ticket games. During fiscal year 2015, lower negotiated vendor fees were implemented. The instant ticket vendor receives 0.8998% of the selling price of all instant ticket activations, whereas the gaming systems and network vendor receives 1.1999% of the selling price of drawing-style tickets sold and of the selling price of instant ticket activations, net of free instant tickets available as prizes.
Advertising costs incurred by TEL were $8.3 million, $8.6 million, and $9.3 million for the fiscal years 2018, 2017, and 2016, respectively. These costs are significantly influenced by budget directives and constraints. Management continually strives to achieve an optimal balance between advertising costs and obtained benefits, while keeping the costs relatively consistent with prior-year amounts.
General, administrative, and other operating expenses were $19.2 million, $17.4 million, and $18.0 million for the fiscal years 2018, 2017, and 2016, respectively. For each of these years, the five major expense components were depreciation, personnel, professional fees, property, and telecommunications expenses. These expenses do not change in direct proportion with revenues but are instead significantly influenced by budget directives and constraints, as well as current business and economic conditions. In view of these factors, moderate variances in these expenses are expected to occur over fiscal periods. Nevertheless, to the most reasonable extent possible,

14
TEL’s management team works diligently to make these expenses relatively consistent year-over-year.
Potential Factors Impacting Future Results
TEL’s mission is to maximize revenues for the purpose of maximizing payments to the Lottery for Education Account. A continuous assessment of Tennessee’s economic environment and TEL’s own product lines and operations is essential to accomplish this mission. The following considerations have been presented to inform those interested in TEL’s operations about factors that could potentially affect future results:
TEL will continue to introduce new and/or enhanced instant and drawing-style game product offerings.
TEL will continually review the prize payout percentages for its instant-game products to ensure we are receiving the highest actual net proceeds for each game and/or price point category.
TEL will continue to enhance its promotional offerings and VIP (Very Important Player) program to improve brand awareness and increase player participation in our games.
Tennessee’s legalization of Daily Fantasy Sports Games and Operations and the level of adoption by eligible Tennesseans.
Any potential change to TEL’s enabling legislation.
Contacting TEL’s Financial Management
This financial report is designed to provide the State of Tennessee, the public, and other interested parties with an overview of the financial results of TEL’s activities and to show TEL’s accountability for conducting business in a fiscally responsible manner. If you have questions about this report or require additional financial information, contact TEL’s Finance Department at the following address:
Tennessee Education Lottery Corporation One Century Place 26 Century Boulevard Suite 200 Nashville, Tennessee 37214


TENNESSEE EDUCATION LOTTERY CORPORATION Notes to the Financial Statements June 30, 2018, and June 30, 2017
19
Note 1. Summary of Significant Accounting Policies
Organization and Description of Reporting Entity
Effective June 11, 2003, the Tennessee Education Lottery Implementation Law (the “Act”), Sections 4-51-101 et seq., Tennessee Code Annotated, was signed into law, creating the Tennessee Education Lottery Corporation (TEL). Pursuant with the Act, TEL was incorporated in the State of Tennessee as a body, politic and corporate, and a quasi-public instrumentality.
TEL is considered a component unit of the State of Tennessee as the state has financial accountability for fiscal matters as follows:
1. the board of directors is appointed by the Governor;
2. upon dissolution of TEL, title to all TEL property shall vest in the State of Tennessee; and
3. TEL provides financial benefits to the state in the form of deposit payments to the state treasury.
The accompanying financial statements present information only as to the transactions of TEL’s programs. TEL is reported as a discretely presented component unit within the State of Tennessee’s Comprehensive Annual Financial Report, which may be viewed at https://www.tn.gov/finance/fa/fa-accounting-financial/fa-accfin-cafr.html.
TEL is responsible for the provision of lotteries on behalf of the State of Tennessee in accordance with the Act and is deemed to be acting, in all respects, for the benefit of the people of the State of Tennessee.
On January 20, 2004, TEL began lottery ticket sales. During the years ended June 30, 2018, and June 30, 2017, TEL’s lottery sales included a variety of instant ticket games and drawing-style games: Cash 3, Cash 4, Tennessee Cash, Keno to Go!, Powerball, Mega Millions, Cash 4 Life, Lotto America, and Hot Lotto.
Basis of Presentation
The accompanying financial statements have been prepared in accordance with the accounting principles generally accepted in the United States of America as prescribed by the Governmental Accounting Standards Board.
Basis of Accounting and Measurement Focus
Basis of accounting refers to the timing of recognition of revenues and expenses in the accounts and reporting in the financial statements, and the measurement focus refers to what transactions and events should be recorded. The financial statements are reported using the accrual basis of

Notes to the Financial Statements (Continued)
20
accounting and the economic resources measurement focus in accordance with accounting principles generally accepted in the United States of America. Under this method, revenues are recognized when they are earned and expenses are recognized when a liability is incurred, regardless of the timing of related cash flows.
Revenue Recognition
Lottery games are sold to the public by contracted retailers. Revenue is recognized for instant games when retailers make them available for sale to the public, as indicated by the retailers’ activation of tickets.
Revenue for drawing-style games is recognized based on the game characteristics. For drawing-style games where the prize expense is determinable only upon occurrence of the related draw, revenues for sold tickets are recognized when the related drawing occurs. Also, amounts collected from retailers in advance of the draw are recorded as unearned revenue and recognized once the drawing occurs.
Revenues for drawing-style games where both prize expense and the draw date are known prior to ticket sales occurring are recognized at the time of the sale.
Certain instant and drawing-style games include free ticket prizes that entitle the holder to exchange a winning ticket for another of equal value. The selling price of the game ticket awarded as a prize reduces ticket revenue when the related winning ticket is validated.
Revenues are presented net of bad debt expense.
Net Position
Net position represents cumulative revenues less expenses and required beneficiary program payments in accordance with the Act (see Notes 7 and 8). Net position includes funds invested in capital assets, restricted net position, and unrestricted net position.
Cash
Cash includes cash in banks, petty cash, and deposits on account in the State of Tennessee Local Government Investment Pool (LGIP) (see Note 2).
Retailer Accounts Receivable
Retailer accounts receivable represents lottery proceeds due from retailers for ticket sales, net of commissions due to and prizes paid by the retailers, and allowance for bad debt.
Lottery proceeds are collected weekly from retailer bank accounts established in trust for TEL. Amounts not collected upon the established collection date are deemed delinquent. Delinquent accounts are reviewed periodically by TEL management. Accounts outstanding more than 180 days from the most recent date of delinquency or date of last payment are considered doubtful. At
Notes to the Financial Statements (Continued)
21
June 30, 2018, and June 30, 2017, the Allowance for Doubtful Accounts was $441 thousand and $435 thousand, respectively.
Capital Assets
Capital assets are stated at cost less accumulated depreciation. Depreciation on capital assets is computed using the straight-line method over the estimated useful lives of the assets, which is three to seven years for most assets. Leasehold improvements are amortized over their expected useful lives or the lease term, whichever is shorter. When assets are retired or otherwise disposed of, the cost and related accumulated depreciation is removed from the accounts, and any resulting gain or loss is reflected in the results from operations in the period of disposal. TEL’s general threshold for capitalization is assets valued at $500 or greater.
Unearned Revenue
Funds collected from retailers for drawing-style game tickets sold in advance of the drawings are recorded as unearned revenue and recognized as revenue once the related drawing occurs.
Fidelity Fund
In accordance with Section 4-51-118(a), Tennessee Code Annotated, TEL retailers are assessed a one-time fidelity fund fee of $50. Fidelity fund proceeds are held in a demand deposit account at Citizens Bank and are classified as restricted fidelity fund cash on the statement of net position. These funds may be used to cover losses incurred as a result of the nonfeasance, malfeasance, or misfeasance of TEL retailers. During the years ended June 30, 2018, and June 30, 2017, $25 thousand and $40 thousand were, respectively, used to cover losses incurred as a result of uncollected accounts of TEL retailers.
At the end of each fiscal year, fidelity funds exceeding $500,000 may be treated as net proceeds from the TEL subject to deposit to the Lottery for Education account. As of the years ended June 30, 2018, and June 30, 2017, there were no fidelity funds available for deposit as net proceeds.
Retailer Commissions and Incentives
Retailers receive a commission of 6.5% on all instant tickets settled and drawing-style tickets sold. In addition, retailers cashing Cash 3 and Cash 4 tickets receive an additional 1% for amounts cashed. Where commission has been paid to retailers for unearned revenue ticket sales, this fee is recorded as a prepaid expense until the related revenue is recognized.
TEL will pay an incentive of $25,000 to a retailer who sells a single jackpot-winning ticket for Powerball or Mega Millions; however, if there are multiple winning Powerball or Mega Millions jackpot-winning tickets sold in Tennessee in a single drawing, the $25,000 selling incentive will be divided proportionately (based on the number of winning tickets sold by each retailer) between or among the respective retailers.
TEL will pay a selling incentive of $5,000 to a retailer who sells a winning drawing-style game whereby the prize is equal to or greater than $1,000,000. However, if there are multiple winning

Notes to the Financial Statements (Continued)
22
drawing-style game jackpot-winning tickets sold in Tennessee in a single drawing, the $5,000 selling incentive will be divided proportionately (based on the number of winning tickets sold by each retailer) between or among the respective retailers.
Selling incentives were earned as follows during the years ended June 30:
Drawing-Style Game 2018 2017
Powerball $ 15,000 $ 30,000 Mega Millions 10,000 10,000 Cash 4 Life 10,000 5,000 Tennessee Cash 10,000 5,000 Hot Lotto - 5,000 Total Retailer Incentives $ 45,000 $ 55,000
Contractor Fees
TEL has contracted with two vendors, IGT Corporation and Scientific Games Inc. (SGI), for the majority of the gaming systems and supplies.
IGT operates the gaming network that consists of approximately 5,000 instant and drawing-style retailer ticket terminals and associated software. On July 18, 2014, TEL signed a new contract with IGT through June 30, 2022. Terms of this contract include a new contractor service fee rate of 1.1999% on the selling price of drawing-style tickets sold and on instant ticket activations, net of free tickets available as prizes.
SGI prints, warehouses, and distributes the instant ticket games to retailers. On October 28, 2014, TEL signed a new contract with SGI through June 30, 2022. In accordance with this contract, SGI receives the negotiated fee of 0.8998% on the selling price of all instant ticket activations, beginning January 4, 2015.
Prizes
In accordance with the Act, as nearly as practical, at least 50% of ticket proceeds must be made available as prize money. Gross prize expense for instant ticket sales is recognized based on a predetermined prize structure for each game in accordance with the approved game working papers when tickets are activated for sale. Gross prize expense for Cash 3, Cash 4, and Tennessee Cash is recognized based on historical payout experience when the related drawings occur.
Powerball and Mega Millions prizes are shared based on contributions made to the prize pool by all member lotteries of the Powerball Group and the Mega Millions Group of the Multi-State Lottery Association (MUSL). All Powerball and Mega Millions grand prizes won by players who purchase tickets in Tennessee are funded from pooled contributions by all participating lottery states. For Powerball and Mega Millions, the contributions are held by MUSL in trust for TEL and are paid, at the option of the prize winner, in either a lump sum or 30 annual payments. Lump-sum payments are discounted to present value, as calculated by MUSL for the Powerball game,
Notes to the Financial Statements (Continued)
23
and the Mega Millions Consortium Group for the Mega Millions game. There were no Powerball or Mega Millions jackpot winners in Tennessee for fiscal year 2018. TEL had one Powerball jackpot winner in fiscal year 2017 on November 26, 2016, for $420.9 million.
In November 2015, TEL began selling Cash 4 Life. Cash 4 Life prizes are based on a portion of gross sales set aside for payment of prizes. The prize fund for any drawing is expected to be 55% of sales, but may be higher or lower based upon the number of winners at each prize level, as well as the funding required to contribute to the jackpot and second-level prize. The contributions are made to the prize pool by Maryland, New Jersey, New York, Pennsylvania, Virginia, Georgia, Indiana, Florida, and Tennessee lotteries. Grand prizes won by Tennessee players are funded from pooled contributions by all participating lottery states. As of June 30, 2018, we had a first-level prize winner on June 21, 2018, of $1,000 a day for life, payable at $365,000 annually and a second-level prize winner on November 20, 2017, of $1,000 a week for life, payable at $52,000 annually. As of June 30, 2017, we had a second-level prize winner on April 17, 2017, of $1,000 a week for life, payable at $52,000 annually.
In August 2017, TEL began selling Keno to Go! Keno to Go! prizes are based on a portion of gross sales set aside for payment of prizes. The prize fund for any drawing is expected to be 60% of sales, but may be higher or lower based upon the number of winners at each prize level.
Lotto America, a drawing style game, was launched in Tennessee in November 2017. The prize fund for any drawing is expected to be 50% of sales, but may be higher or lower based upon the number of winners at each prize level.
Hot Lotto prizes are shared based on contributions made to the prize pool by all member lotteries of the Hot Lotto Group of MUSL. Grand prizes won by Tennessee players are funded from pooled contributions by all participating lottery states. The contributions are held by MUSL in trust for TEL and are paid in cash as a lump sum with withholding taxes paid by the party lottery. In fiscal year 2017, the TEL had a grand prize winner of $4.9 million on August 10, 2016. Hot Lotto was ended in October 2017.
Unclaimed Prizes
Prizes not claimed within 90 days of the game-end date for instant games, and within 180 days of a game draw date for drawing-style games, are forfeited as unclaimed prizes.
Budget
Pursuant with the Act, annually by June 30, TEL is required to submit a board-approved operating budget for the next fiscal year to the Tennessee Department of Finance and Administration, the Office of Legislative Budget Analysis, and the Comptroller of the Treasury. Additionally, by September 1, TEL is required to submit a preliminary operating budget for the succeeding fiscal year to the Tennessee Department of Finance and Administration for informational purposes.
Notes to the Financial Statements (Continued)
24
Use of Estimates
The preparation of financial statements in accordance with accounting principles generally accepted in the United States of America requires management to make certain estimates and assumptions that affect the reported amounts of assets and liabilities and disclosures of contingent assets and liabilities at the date of the financial statements and the reported amounts of revenues and expenses during the reporting period. Actual results could differ from those estimates. Estimates and assumptions are reviewed periodically, and the effects of revisions are reflected in the financial statements in the period they are determined.
Advertising
Advertising costs are expensed when the related advertising takes place or, if the contract is non-cancellable, when entered.
Nonoperating Revenues and Expenses
Revenues and expenses resulting from activities not directly associated with the sale of lottery tickets are reflected as nonoperating revenues and expenses.
Compensated Absences
Effective November 29, 2004, TEL implemented an attendance and leave policy allowing employees to earn vacation and sick leave during their employment. The corporation recognizes expense for accrued but unused vacation leave for all employees who have completed one year of service. No such expense exists for accrued but unused sick leave (Note 9).
Employment Separation
On February 17, 2016, the board of directors approved a change in separation pay policy. The revised policy allows for corporate officers hired prior to January 1, 2006, to continue accruing 40 hours of separation pay for each year of employment with TEL. Corporate officers hired January 1, 2006, and thereafter shall be granted 240 hours of leave in the event they are terminated without cause or upon retirement. After 6 years of employment in a corporate officer position, he/she shall accrue an additional 40 hours of severance pay for every year of employment. Such expense is accrued in the period it is earned (Note 9).
Note 2. Cash
A significant portion of TEL’s deposits are in a financial institution that participates in the bank collateral pool administered by the State Treasurer. The securities pledged to protect these accounts are pledged in the aggregate rather than against each individual account. The members of the pool may be required by agreement to pay an assessment to cover any deficiency. Under this additional assessment agreement, public fund accounts covered by the pool are considered to be insured for purposes of credit risk disclosure. At June 30, 2018, and June 30, 2017, bank balances of approximately $2.158 million and $2.297 million, respectively, were insured by the bank collateral pool.

Notes to the Financial Statements (Continued)
25
For the years ended June 30, 2018, and June 30, 2017, the bank balance for the fidelity fund account was approximately $45 thousand and $38 thousand, respectively, and was maintained in a demand deposit account that was insured by the Federal Deposit Insurance Corporation for up to a maximum of $250,000.
TEL also has deposits in the Local Government Investment Pool (LGIP) administered by the State Treasurer. TEL’s deposits with the LGIP were approximately $129 million and $119 million at June 30, 2018, and June 30, 2017, respectively. The LGIP is part of the State Pooled Investment Fund. The LGIP is measured at amortized costs. The fund is not rated by a nationally recognized statistical rating organization.
The fund’s investment policy and required risk disclosures are presented in the State of Tennessee Treasurer’s Report. That report is available on the state’s website at http://www.treasury.state.tn.us or by calling (615) 741-2956.
Note 3. Prize Annuity Obligations
The TEL offers games where the prize structure allows for specific prizes to be paid in a cash value or annuity option. In accordance with policy, TEL may enter into insurance annuity contracts in order to fund annuity prizes. All life insurance annuity contracts must be issued by companies which are financially rated “A” or better by a nationally recognized rating agency duly licensed, admitted, and authorized to transact business in the State of Tennessee.
Because the TEL cannot unilaterally change the beneficiary for the annuities that are purchased in order to satisfy the liability to the prize winner, and because it is the intent of the TEL that the insurance companies make future installment payments directly to each prize winner named as the beneficiary of the annuity, neither the value of the annuities nor the value of the related future payments are reflected in the accompanying financial statements. The TEL would assume liability for future payments if the insurance companies were to default on their payments; however, this possibility is remote and therefore no liability is recorded. The present value of future payments to be made to grand-prize winners by these insurance companies totaled approximately $11,504,000 and $9,653,000 at June 30, 2018, and June 30, 2017, respectively.
Notes to the Financial Statements (Continued)
26
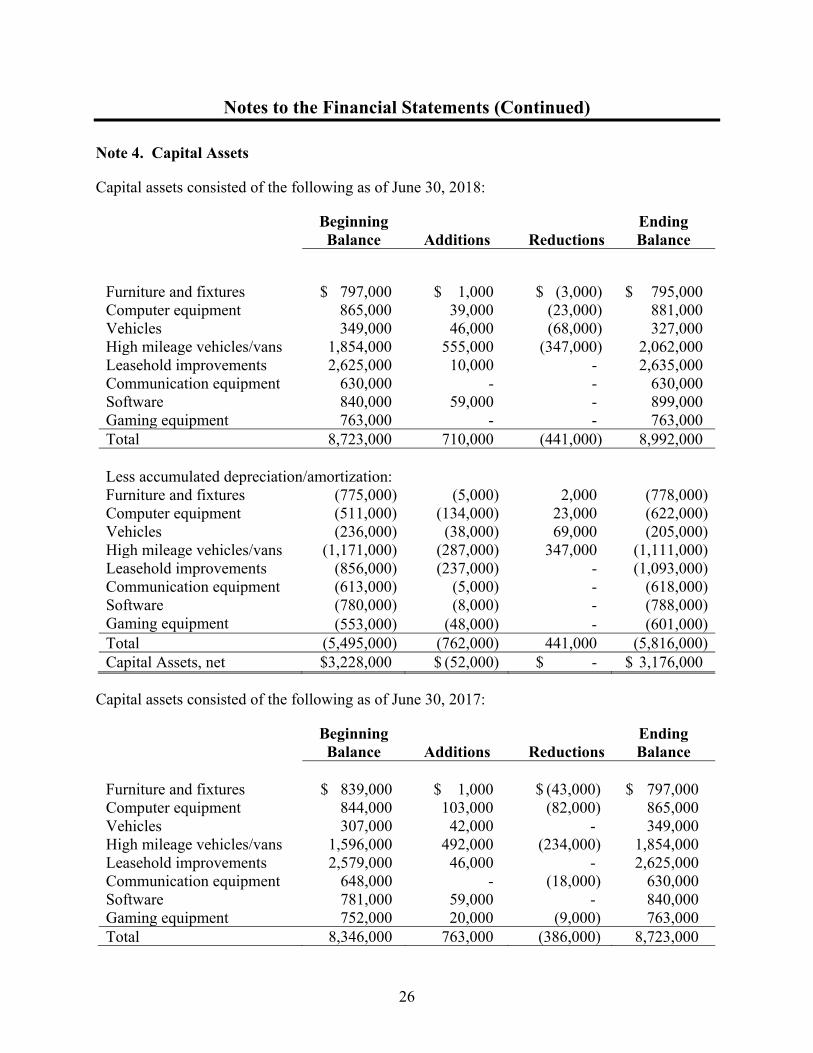
Note 4. Capital Assets
Capital assets consisted of the following as of June 30, 2018:
Beginning Balance
Additions
Reductions
Ending Balance
Furniture and fixtures $ 797,000 $ 1,000 $ (3,000) $ 795,000 Computer equipment 865,000 39,000 (23,000) 881,000 Vehicles 349,000 46,000 (68,000) 327,000 High mileage vehicles/vans 1,854,000 555,000 (347,000) 2,062,000 Leasehold improvements 2,625,000 10,000 - 2,635,000 Communication equipment 630,000 - - 630,000 Software 840,000 59,000 - 899,000 Gaming equipment 763,000 - - 763,000 Total 8,723,000 710,000 (441,000) 8,992,000 Less accumulated depreciation/amortization: Furniture and fixtures (775,000) (5,000) 2,000 (778,000) Computer equipment (511,000) (134,000) 23,000 (622,000) Vehicles (236,000) (38,000) 69,000 (205,000) High mileage vehicles/vans (1,171,000) (287,000) 347,000 (1,111,000) Leasehold improvements (856,000) (237,000) - (1,093,000) Communication equipment (613,000) (5,000) - (618,000) Software (780,000) (8,000) - (788,000) Gaming equipment (553,000) (48,000) - (601,000) Total (5,495,000) (762,000) 441,000 (5,816,000) Capital Assets, net $3,228,000 $ (52,000) $ - $ 3,176,000
Capital assets consisted of the following as of June 30, 2017:
Beginning Balance
Additions
Reductions
Ending Balance
Furniture and fixtures $ 839,000 $ 1,000 $ (43,000) $ 797,000 Computer equipment 844,000 103,000 (82,000) 865,000 Vehicles 307,000 42,000 - 349,000 High mileage vehicles/vans 1,596,000 492,000 (234,000) 1,854,000 Leasehold improvements 2,579,000 46,000 - 2,625,000 Communication equipment 648,000 - (18,000) 630,000 Software 781,000 59,000 - 840,000 Gaming equipment 752,000 20,000 (9,000) 763,000 Total 8,346,000 763,000 (386,000) 8,723,000

Notes to the Financial Statements (Continued)
27
Less accumulated depreciation/amortization: Furniture and fixtures (813,000) (5,000) 43,000 (775,000) Computer equipment (454,000) (138,000) 81,000 (511,000) Vehicles (201,000) (35,000) - (236,000)High mileage vehicles/vans (1,221,000) (184,000) 234,000 (1,171,000)Leasehold improvements (627,000) (229,000) - (856,000)Communication equipment (625,000) (6,000) 18,000 (613,000)Software (772,000) (8,000) - (780,000)Gaming equipment (534,000) (28,000) 9,000 (553,000)Total (5,247,000) (633,000) 385,000 (5,495,000) Capital Assets, net $3,099,000 $130,000 $ (1,000) $ 3,228,000
Note 5. Leasing Arrangements
TEL’s leasing arrangements consist of non-cancelable operating leases for office space, outdoor advertising billboards, and related equipment that expire at various dates through 2025. Certain of these leases contain provisions for scheduled rental increases and are renewable at the option of TEL. During the year ended June 30, 2018, no options were exercised.
The following is a schedule by years of future minimum rental payments required of TEL under all non-cancelable operating leases with original terms of one year or more:
Year Ending June 30: 2018
2019 $ 2,807,000 2020 2,215,000 2021 1,714,000 2022 1,642,000 2023 1,615,000
2024 – 2025 2,957,000 Total minimum rental payments $ 12,950,000
TEL also subleases office space under operating leases expiring through 2025 to its major gaming vendors. Minimum rental payments at June 30, 2018, have not been reduced by minimum sublease rentals of $793,000 over the remaining sublease rental period.
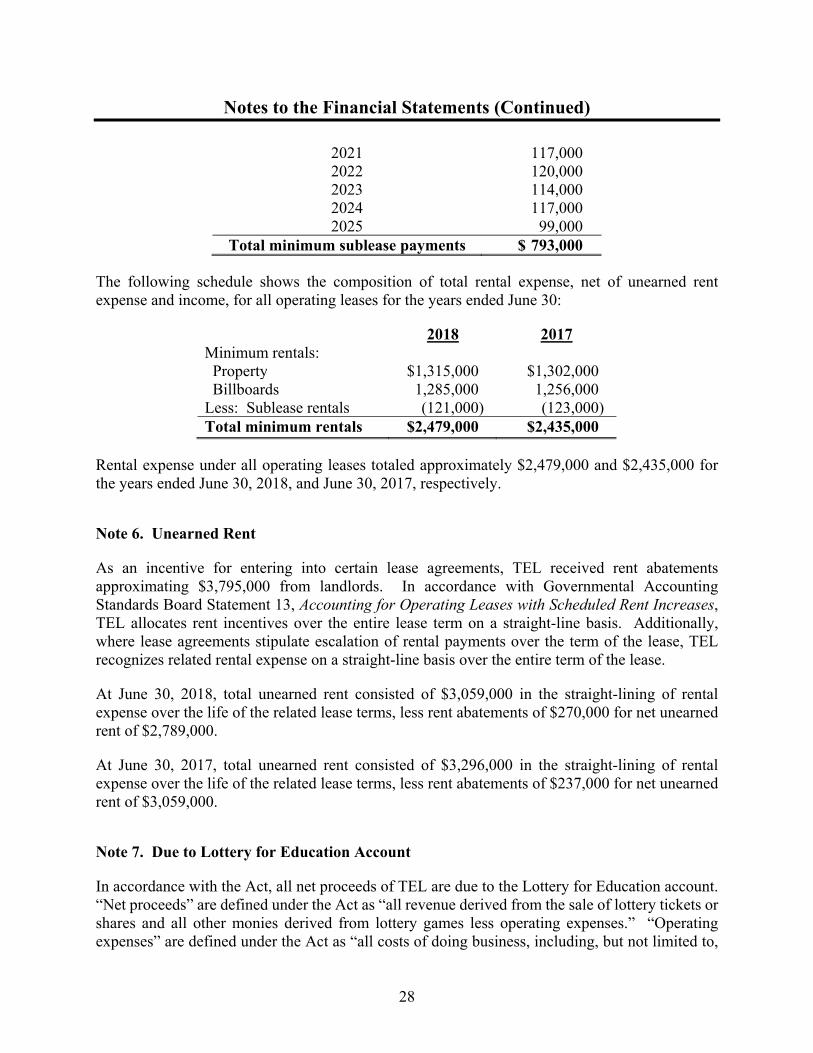
The following is a schedule by years of future minimum sublease rental payments due to TEL under all non-cancelable operating leases with original terms of one year or more as of June 30:
Year Ending June 30: 2018 2019 $ 112,000 2020 114,000
Notes to the Financial Statements (Continued)
28
2021 117,000 2022 120,000 2023 114,000 2024 117,000 2025 99,000
Total minimum sublease payments $ 793,000
The following schedule shows the composition of total rental expense, net of unearned rent expense and income, for all operating leases for the years ended June 30:
2018 2017 Minimum rentals: Property $1,315,000 $1,302,000 Billboards 1,285,000 1,256,000 Less: Sublease rentals (121,000) (123,000) Total minimum rentals $2,479,000 $2,435,000
Rental expense under all operating leases totaled approximately $2,479,000 and $2,435,000 for the years ended June 30, 2018, and June 30, 2017, respectively.
Note 6. Unearned Rent
As an incentive for entering into certain lease agreements, TEL received rent abatements approximating $3,795,000 from landlords. In accordance with Governmental Accounting Standards Board Statement 13, Accounting for Operating Leases with Scheduled Rent Increases, TEL allocates rent incentives over the entire lease term on a straight-line basis. Additionally, where lease agreements stipulate escalation of rental payments over the term of the lease, TEL recognizes related rental expense on a straight-line basis over the entire term of the lease.
At June 30, 2018, total unearned rent consisted of $3,059,000 in the straight-lining of rental expense over the life of the related lease terms, less rent abatements of $270,000 for net unearned rent of $2,789,000.
At June 30, 2017, total unearned rent consisted of $3,296,000 in the straight-lining of rental expense over the life of the related lease terms, less rent abatements of $237,000 for net unearned rent of $3,059,000.
Note 7. Due to Lottery for Education Account
In accordance with the Act, all net proceeds of TEL are due to the Lottery for Education account. “Net proceeds” are defined under the Act as “all revenue derived from the sale of lottery tickets or shares and all other monies derived from lottery games less operating expenses.” “Operating expenses” are defined under the Act as “all costs of doing business, including, but not limited to,

Notes to the Financial Statements (Continued)
29
prizes, commissions, and other compensation paid to lottery retailers, advertising and marketing costs, rental fees, personnel costs, capital costs, depreciation of property and equipment, amounts held in or paid from a fidelity fund, and all other operating costs.” All other expenses are considered nonoperating.
Net proceeds and operating expenses for the years ended June 30, 2018, and June 30, 2017, are summarized as follows:
2018 2017 Operating revenues: Ticket sales (net) $ 1,735,675,000 $ 1,611,841,000 Less tickets provided as prizes (119,213,000) (115,902,000) Net ticket sales 1,616,462,000 1,495,939,000 Fees and other revenue 4,047,000 3,625,000 Total lottery proceeds 1,620,509,000 1,499,564,000 Operating expenses, as defined: Gaming 1,196,125,000 1,109,870,000 Operating 19,166,000 17,367,000 Total operating expenses, as defined 1,215,291,000 1,127,237,000 Net proceeds before distribution of
unrestricted net position 405,218,000 372,327,000 Nonoperating revenue and expenses Interest income 1,294,000 456,000 Total nonoperating revenue and expenses 1,294,000 456,000 Net proceeds $ 406,512,000 $ 372,783,000 Amount due to Lottery for Education account for year $ 406,512,000 $ 372,783,000 Amount paid during year (308,082,000) (277,131,000) Amount due to Lottery for Education account, end of year $ 98,430,000 $ 95,652,000
All amounts due at the end of each fiscal year were deposited to the Lottery for Education account in July of the subsequent fiscal year.
Note 8. Due to After-School Programs Special Account
In accordance with the Act, at the end of each fiscal year, one hundred percent of any unclaimed prize money shall be deposited in the After-School Programs special account.
Notes to the Financial Statements (Continued)
30
The amounts due to the After-School Programs special account are derived from unclaimed prizes for instant games that have been officially closed and drawing-style games that have exceeded the 180-day claim period.
Unclaimed prizes for instant games are estimated based upon historical percentages of actual unclaimed dollars at the time of game close and reconciliation at the end of the 90-day redemption period.
For drawing-style games, the actual unclaimed amounts are determined after the expiration of the related claim period for the draw.
For instant games, prizes not claimed within 90 days of the announced game-end date are forfeited as unclaimed prizes. For drawing-style games, prizes not claimed within 180 days of a game draw date are forfeited as unclaimed prizes.
For fiscal year 2018, unclaimed prizes were $15,168,000, which was current and payable to the After-School Programs special account at June 30, 2018.
For fiscal year 2017, unclaimed prizes were $13,914,000, which was current and payable to the After-School Programs special account at June 30, 2017.
All amounts due at the end of each fiscal year were deposited to the After-School Programs special account before August 1 of the subsequent fiscal year.
Note 9. Employee Benefits
A. Deferred Compensation
Effective September 22, 2003, TEL provided its employees with a deferred compensation plan created in accordance with Internal Revenue Code Section 457 (the 457 Plan). The 457 Plan is available to all eligible employees at their option and permits participants to defer a portion of their salary until future years. The deferred compensation is not available to participants until termination, retirement, death, or unforeseeable emergency. During the years ended June 30, 2018, and June 30, 2017, employees contributed approximately $553,000 and $544,000, respectively, to the 457 Plan.
The aggregate fair value of the plan’s assets was approximately $7,694,000 and $6,302,000, net of administrative fees, as of June 30, 2018, and June 30, 2017, respectively.
B. Defined Contribution Plan
Effective September 22, 2003, the TEL Board of Directors established a defined contribution plan in accordance with Internal Revenue Code Section 401(a) (the 401(a) Plan). Under the 401(a) Plan, all eligible employees receive compensation from TEL in the form of non-voluntary deferrals to their individual 401(a) accounts as follows:

Notes to the Financial Statements (Continued)
31
1. contribution of 5% of employee’s compensation;
2. matching contribution of 75% of the participant’s contributions to the 457 Plan, up to the first 5% of the participant’s compensation; and
3. changes to the plan must be approved by TEL’s Board of Directors.
These contributions vest over a four-year period at a rate of 25% per year and are not available to participants until termination, retirement, death, or unforeseeable emergency. TEL expensed approximately $774,000 and $754,000 to the 401(a) Plan on behalf of its employees for the years ended June 30, 2018, and June 30, 2017, respectively.
In accordance with the 401(a) Plan, forfeitures of employer contributions may be used to offset plan administrative expenses and/or reduce future contribution costs. As of the years ended June 30, 2018, and June 30, 2017, forfeited amounts of approximately $42,000 and $18,000, respectively, were used to offset employer contributions and plan administrative expenses.
Section 1448 of the Small Business Job Protection Act of 1996 added Subsection (g) to Section 457 of the Internal Revenue Code to provide that all assets and income under a Section 457(b) Plan that are maintained by a state or local government employer must be held in trust for the exclusive benefit of plan participants and their beneficiaries. On January 1, 2018, the TEL changed the plan’s custodian for both the 457 plan and the 401(a) plan from John Hancock Financial to Mass Mutual.
The aggregate fair value of the plans’ assets was approximately $9,703,000 and $8,547,000, net of forfeitures and administrative fees, as of June 30, 2018, and June 30, 2017, respectively.
As of June 30, 2018, and June 30, 2017, TEL’s employer liability outstanding was $33,000 and $32,000, respectively.
C. Compensated Absences
Vacation leave can be earned at various rates depending on the employee’s position and years of service. Carryover of vacation leave is limited to the number of hours earned in the prior year. Employees must complete 12 months of service from the date of hire before they receive termination payment for any unused vacation hours. The current portion of the compensated absence liability, expected to be due within one year of the statement date, June 30, 2018, is estimated using historical trends. At June 30, 2018, and June 30, 2017, the estimated current portion of the compensated absences liability was $604 thousand and $597 thousand, respectively.
Sick leave is earned at the end of each pay period at the rate of four hours per pay period for all employees. Sick leave may be carried over from year to year, but all such accrued sick leave is forfeited upon separation of employment.
Notes to the Financial Statements (Continued)
32
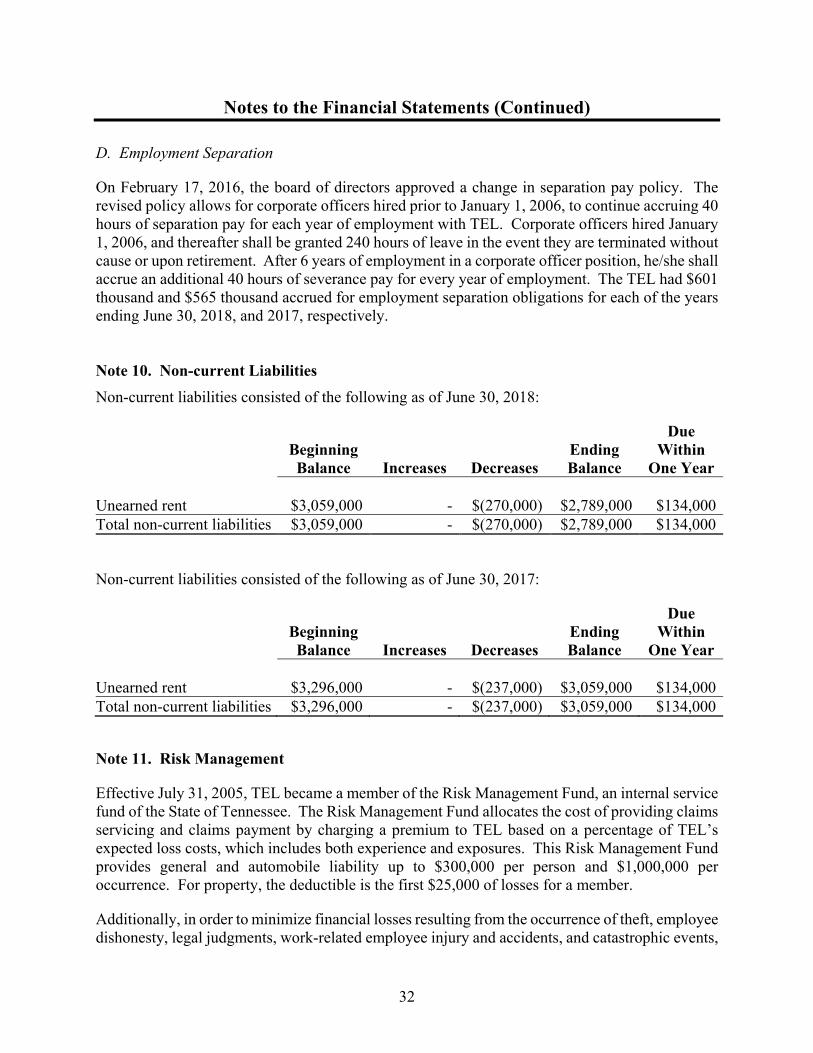
D. Employment Separation
On February 17, 2016, the board of directors approved a change in separation pay policy. The revised policy allows for corporate officers hired prior to January 1, 2006, to continue accruing 40 hours of separation pay for each year of employment with TEL. Corporate officers hired January 1, 2006, and thereafter shall be granted 240 hours of leave in the event they are terminated without cause or upon retirement. After 6 years of employment in a corporate officer position, he/she shall accrue an additional 40 hours of severance pay for every year of employment. The TEL had $601 thousand and $565 thousand accrued for employment separation obligations for each of the years ending June 30, 2018, and 2017, respectively. Note 10. Non-current Liabilities
Non-current liabilities consisted of the following as of June 30, 2018:
Beginning Balance
Increases
Decreases
Ending Balance
Due Within
One Year Unearned rent $3,059,000 - $(270,000) $2,789,000 $134,000 Total non-current liabilities $3,059,000 - $(270,000) $2,789,000 $134,000
Non-current liabilities consisted of the following as of June 30, 2017:
Beginning Balance
Increases
Decreases
Ending Balance
Due Within
One Year Unearned rent $3,296,000 - $(237,000) $3,059,000 $134,000 Total non-current liabilities $3,296,000 - $(237,000) $3,059,000 $134,000
Note 11. Risk Management
Effective July 31, 2005, TEL became a member of the Risk Management Fund, an internal service fund of the State of Tennessee. The Risk Management Fund allocates the cost of providing claims servicing and claims payment by charging a premium to TEL based on a percentage of TEL’s expected loss costs, which includes both experience and exposures. This Risk Management Fund provides general and automobile liability up to $300,000 per person and $1,000,000 per occurrence. For property, the deductible is the first $25,000 of losses for a member.
Additionally, in order to minimize financial losses resulting from the occurrence of theft, employee dishonesty, legal judgments, work-related employee injury and accidents, and catastrophic events,

Notes to the Financial Statements (Continued)
33
TEL maintains insurance from various other providers. At June 30, 2018, additional insurance coverage was provided at the following maximum amounts:
Coverage 2018 Employee Fidelity $ 500,000 Automobile/Property 1,000,000 Workers’ Compensation 1,000,000 Employment Practices 1,000,000 General Liability/Umbrella 5,000,000
Over the past three fiscal years, in the ordinary course of business, TEL has filed insurance claims with both the risk pool and the commercial insurers. None of the related settlements exceeded the provided insurance coverage.
Note 12. Commitments and Contingencies
Legal - TEL is subject to litigation in the ordinary course of its business. Liabilities related to contingencies are recognized when a loss is probable and can be reasonably estimated. In the opinion of management and legal counsel, the outcome of such litigation will not have a material impact on the financial position or cash flows of TEL. Furthermore, as of the year ended June 30, 2018, management is not aware of any related liabilities.

34
Independent Auditor’s Report on Internal Control Over Financial Reporting and on Compliance and Other Matters
Based on an Audit of Financial Statements Performed in Accordance With Government Auditing Standards
The Honorable Bill Haslam, Governor Members of the General Assembly Board of Directors, Tennessee Education Lottery Corporation
We have audited the financial statements of the Tennessee Education Lottery Corporation, a component unit of the State of Tennessee, as of and for the year ended June 30, 2018, and the related notes to the financial statements, which collectively comprise the Tennessee Education Lottery Corporation’s basic financial statements, and have issued our report thereon dated November 1, 2018. We conducted our audit in accordance with auditing standards generally accepted in the United States of America and the standards applicable to financial audits contained in Government Auditing Standards issued by the Comptroller General of the United States.
Internal Control Over Financial Reporting
In planning and performing our audit of the financial statements, we considered the Tennessee Education Lottery Corporation’s internal control over financial reporting (internal control) to determine the audit procedures that are appropriate in the circumstances for the purpose of expressing our opinion on the financial statements, but not for the purpose of expressing an opinion on the effectiveness of the Tennessee Education Lottery Corporation’s internal control. Accordingly, we do not express an opinion on the effectiveness of the Tennessee Education Lottery Corporation’s internal control.
A deficiency in internal control exists when the design or operation of a control does not allow management or employees, in the normal course of performing their assigned functions, to prevent, or detect and correct, misstatements on a timely basis. A material weakness is a deficiency, or a combination of deficiencies, in internal control, such that there is a reasonable possibility that a material misstatement of the entity’s financial statements will not be prevented, or detected and corrected on a timely basis. A significant deficiency is a deficiency, or a combination of deficiencies, in internal control that is less severe than a material weakness, yet important enough to merit attention by those charged with governance.
Our consideration of internal control was for the limited purpose described in the first paragraph of this section and was not designed to identify all deficiencies in internal control that might be

35
material weaknesses or significant deficiencies. Given these limitations, during our audit we did not identify any deficiencies in internal control that we consider to be material weaknesses. However, material weaknesses may exist that have not been identified.
Compliance and Other Matters
As part of obtaining reasonable assurance about whether the Tennessee Education Lottery Corporation’s financial statements are free from material misstatement, we performed tests of its compliance with certain provisions of laws, regulations, and contracts, noncompliance with which could have a direct and material effect on the determination of financial statement amounts. However, providing an opinion on compliance with those provisions was not an objective of our audit, and accordingly, we do not express such an opinion. The results of our tests disclosed no instances of noncompliance or other matters that are required to be reported under Government Auditing Standards.
Purpose of This Report
The purpose of this report is solely to describe the scope of our testing of internal control and compliance and the results of that testing, and not to provide an opinion on the effectiveness of the entity’s internal control or on compliance. This report is an integral part of an audit performed in accordance with Government Auditing Standards in considering the entity’s internal control and compliance. Accordingly, this communication is not suitable for any other purpose.
Deborah V. Loveless, CPA, Director Division of State Audit November 1, 2018