TennCare II No. 11-W-00151/4 - tn.gov · July 1, 2017, through June 30, 2018. Events and activities...
374
Draft Annual Report TennCare II No. 11-W-00151/4 Demonstration Year (DY) 16 (7/1/2017 – 6/30/2018)
Transcript of TennCare II No. 11-W-00151/4 - tn.gov · July 1, 2017, through June 30, 2018. Events and activities...

Draft Annual Report
TennCare II
No. 11-W-00151/4
Demonstration Year (DY) 16
(7/1/2017 – 6/30/2018)

Executive Summary
During Demonstration Year (DY) 16, the Division of TennCare continued to pursue its mission of improving lives through high-quality, cost-effective care. Major events for the TennCare program in DY 16 included:
• Launch of a comprehensive strategy to address opioid misuse and abuse. • Approval and implementation of a new medication therapy management pilot project designed
to optimize drug therapy and improve therapeutic outcomes for patients. • Ongoing successes in the domain of payment reform through Tennessee’s Health Care
Innovation Initiative. • Significant progress on the “systems integration services” portion of the Tennessee Eligibility
Determination System (TEDS) project in collaboration with Deloitte Consulting, LLP. Enrollees’ satisfaction with care received from TennCare continued to be strong during the reporting period. Data gathered in the annual Beneficiary Survey, which is conducted by the Boyd Center for Business and Economic Research at the University of Tennessee, revealed that the level of beneficiary satisfaction had reached 95 percent, which marked the ninth straight year in which enrollee satisfaction exceeded 90 percent. The performance of TennCare’s MCOs remained strong. The 2017 HEDIS/CAHPS report identified several areas of health care effectiveness in which the MCOs outperformed both their own results from the previous year as well as the average results achieved by Medicaid programs nationwide. Improvement was evident in such notable categories as controlling high blood pressure, breast cancer screening, prenatal and postpartum care, and follow-up after hospitalization for mental illness.
2
A Note to the Reader
Special Term and Condition (STC) 45 of the TennCare Demonstration requires that the State submit a Draft Annual Report documenting accomplishments, project status, quantitative and case study findings, utilization data, evaluation findings from the demonstration period to date, and policy and administrative difficulties and solutions in the operation of the demonstration. This report is organized accordingly: Section I: Accomplishments Section II: Project Status
Section III: Quantitative and Case Study Findings Section IV: Utilization Data Section V: Evaluation Findings from the Demonstration Period to Date Section VI: Policy and Administrative Issues and Solutions Several other STCs mention items that are to be addressed in the Annual Report. These items and others have been included in the Attachments that follow the narrative section. The Attachments are as follows:
• Attachment A (“Operational Procedures Regarding Reserve Slots in CHOICES 2”) is required by STC 31.d.iv.(A).
• Attachment B (“Operational Procedures Regarding Reserve Slots in ECF CHOICES”) is required by STC 32.d.iv.(A).
• Attachment C (“Compliance Measures for HCBS Regulations”) is required by STC 42.b. • Attachment D (“Special Terms and Conditions Report”) is an annualized version of a report that
TennCare prepares quarterly. • Attachment E (“The Impact of TennCare: A Survey of Recipients 2017”) is a report resulting from
the annual Beneficiary Survey conducted since 1993. • Attachment F presents the annual HEDIS/CAHPS report. • Attachment G (“Quality Improvement Strategy”) is required by STC 42.c.
STC numbers in this report refer to those in effect at the conclusion of DY 16. The period covered by the report is the Demonstration Year, which, in this case, was the period from July 1, 2017, through June 30, 2018. Events and activities that occurred after June 30, 2018, are not included in this report but will be included in next year’s Draft Annual Report.
3

I. Accomplishments
Selected Statistical Successes. TennCare’s accomplishments during DY 16 were reflected in a variety of statistics from the year:
• Enrollment. The size of the TennCare population at the conclusion of DY 16 was 1,475,906.
• Enrollee Satisfaction. According to an annual survey conducted by the University of Tennessee’s Boyd Center for Business and Economic Research, the percentage of respondents expressing satisfaction with services received from TennCare during 2017 was 95 percent, which ties the highest reported satisfaction level in the 25-year history of the survey. DY 16 was the ninth straight year that enrollee satisfaction exceeded 90 percent. (See “Beneficiary Survey” in Section III for additional details.)
• Financial Performance. During this demonstration year, TennCare continued to succeed in
demonstrating budget neutrality. TennCare’s medical inflation trend has remained well below trends for other Medicaid programs and commercial plans for years. According to data obtained in 2017, TennCare’s medical inflation rate was 1.8 percent, as compared with a national Medicaid rate of 4.5 percent, and a commercial rate of 6.0 percent. More information is available at https://www.tn.gov/content/dam/tn/tenncare/documents/TennCareBudgetFY19.pdf.
• CHOICES Rebalancing. CHOICES is TennCare’s program of managed long-term services and
supports (LTSS) for individuals who are elderly or who have physical disabilities. According to TennCare’s most recent submission of CHOICES data to CMS, the number of individuals receiving Home and Community-Based Services (HCBS) on the last day of DY 16 was 12,385, which represents a 155 percent increase over the number of individuals receiving HCBS the day before CHOICES was implemented.
• Employment and Community First (ECF) CHOICES Enrollment. ECF CHOICES is TennCare’s program of managed long-term services and supports (MLTSS) for individuals with intellectual and other types of developmental disabilities. By the conclusion of DY 16 (i.e., the second year of program implementation), 2,532 individuals had been enrolled in the program and were receiving services.
• Early and Periodic Screening, Diagnosis and Treatment (EPSDT) Outreach. TennCare’s contract
with the Tennessee Department of Health (TDH) to educate families on EPSDT benefits produced significant results during DY 16. TDH made contact with 437,194 people, distributed 321,727 sets of educational materials, and completed 4,383 home visits.
• Accuracy of Encounter Data. TennCare’s use of the Edifecs software system for encounter data
allows non-compliant encounter claims to be rejected individually instead of as part of a batch. As a result, of more than 69 million encounter claims received by TennCare during DY 16, 99.54 percent were compliant with State standards (including HIPAA) upon initial submission.
4

Opioid Strategy. During DY 16, the Division of TennCare significantly expanded its approach to combatting opioid misuse and abuse. Among the strategies used by TennCare to address the issue are the following:
• Reducing the risk of TennCare members becoming newly dependent or addicted to opioids by implementing new policies around opioid prescribing for acute, non-chronic users;
• Increasing patient engagement, early detection of dependence, and evidence-based pain treatment for TennCare members chronically using opioids;
• Increasing outreach to women of childbearing age chronically using opioids to provide education and treatment options;
• Further removing barriers to access for Voluntary Reversible Long-Acting Contraceptives (IUDs and implants) for women; and
• Supporting high-quality addiction and recovery treatment services for TennCare members who are dependent, misusing, or abusing opioids and other substances.
The State submitted a demonstration amendment to CMS on May 25, 2018, to expand its continuum of services for combatting opioid misuse and abuse. Amendment 35 (addressed at greater length in Section II of this report) would amend the TennCare benefits package to cover residential substance use disorder (SUD) treatment services in facilities with more than 16 beds. Additional information about TennCare’s expanded opioid strategy is available at https://www.tn.gov/tenncare/tenncare-s-opioid-strategy.html. Medication Therapy Management Pilot Project. In September 2017, the Division of TennCare submitted Demonstration Amendment 32 to CMS to establish a two-year pilot program in which certain TennCare enrollees would receive medication therapy management (MTM) services. MTM is a clinical service provided by licensed pharmacists, the aim of which is to optimize drug therapy and improve therapeutic outcomes for patients. Amendment 32 proposed to make MTM available to TennCare members enrolled in TennCare’s health home program (Tennessee Health Link), and to members whose primary care providers participate in TennCare’s patient-centered medical home (PCMH) program. On February 1, 2018, the State received CMS approval of Amendment 32. TennCare proceeded with implementation of the MTM program by enrolling pharmacists to provide MTM services. These pharmacy providers have worked as part of the extended care teams within the Tennessee Health Link and PCMH initiatives, engaging members to actively manage their drug therapy by identifying, preventing, and resolving medication-related problems. Throughout the lifetime of the pilot program, pharmacists providing MTM services to TennCare enrollees will be particularly focused on providing their expertise to patients with the highest levels of clinical risk. Payment Reform. In February 2013, Tennessee Governor Bill Haslam launched Tennessee's Health Care Innovation Initiative to change the way that health care is paid for in Tennessee. The State is moving from paying for volume to paying for value by rewarding health care providers for furnishing high-quality and efficient treatment of medical conditions and for helping maintain people's health over time. The Tennessee Health Care Innovation Initiative is led by the Division of TennCare’s Strategic Planning and Innovation Group. Although the initiative’s goals transcend Medicaid, there is much emphasis on Medicaid leading by example. The initiative consists of strategies to reform Tennessee’s health care
5

payment and delivery system in three main domains: Primary Care Transformation, Episodes of Care, and Long-Term Services and Supports (LTSS). Tennessee's Primary Care Transformation strategy supports primary care providers in promoting the delivery of preventive services and managing chronic illnesses over time. One element of this strategy that achieved considerable success during DY 16 involved collaboration between TennCare and Tennessee hospitals to coordinate the sharing of admission, discharge, and transfer (ADT) data. These data allow providers participating in TennCare’s care coordination initiatives to know when their patients go to an emergency room or are admitted to or discharged from a hospital. ADT data are the most actionable, real-time electronic information in health care. While many states are working to improve the sharing and use of ADT data, Tennessee has become a leader in this area. As of the end of DY 16, 74 percent of Tennessee hospitals were sharing ADT data with TennCare, with more hospitals set to begin sharing these data in DY 17. The ADT data are delivered to primary care and behavioral health providers via TennCare’s Care Coordination Tool in a usable format that—combined with other medical and pharmacy data—gives providers a workflow for prioritizing high-risk patients and highlights members’ unmet medical needs. Providers have reported that this new information enables them to reach out to patients who are over-utilizing the emergency room, and to find hard-to-reach patients who may need follow-up care. The second strategy of Tennessee’s payment reform initiative is Episodes of Care. This strategy focuses on acute or specialist-driven health care delivered during a specified time period to treat physical or behavioral conditions such as an acute diabetes exacerbation or total joint replacement. Each episode has a principal accountable provider (sometimes referred to as the “quarterback”) who is in the best position to influence the cost and quality of the episode. Episodes of care are implemented in groups or—in the terminology of the program—“waves.” Each episode is designed with significant input from stakeholders, including Tennessee providers, payers, administrators, and employers. The program organizes Technical Advisory Groups (TAGs) composed of experts in the field to provide clinical feedback on each episode’s design. Episode TAG meetings are held in the spring and fall. The fall 2017 TAG meetings addressed Wave 8, which includes episodes for Acute Gastroenteritis, Acute Seizure, Appendectomy, Bronchiolitis, Colposcopy, Gastrointestinal Obstruction, Hernia Repair, Hysterectomy, Pediatric Pneumonia, and Syncope. The spring 2018 TAG meetings addressed Wave 9, comprising episodes on Cystourethroscopy and Acute Kidney and Ureter Stones. TennCare continues to seek provider feedback once an episode is implemented and makes adjustments to the design of episodes based on provider feedback. New evidence of the effectiveness of the episodes of care program arrived during DY 16. In 2018, TennCare providers are receiving reports on 46 episodes of care. Of those episodes, 27 are in a performance period, and 19 are in a “preview” period (a one-year period of data collection and reporting that precedes the formal implementation of the episode). Estimates indicate that the Episodes of Care program saved Tennessee over $25 million in health care costs in calendar years 2015 (when three episodes were in a performance period) and 2016 (when eight episodes were in a performance period), while maintaining or in some cases improving quality of care. Tennessee’s payment reform strategy for Long-Term Services and Supports comprises quality- and acuity-based payment and delivery system reform for Nursing Facility (NF) services and Home and Community-Based Services (HCBS). During DY 16, TennCare continued its work toward designing a new reimbursement methodology for NFs participating in the TennCare program to be implemented in DY
6

17. The new payment approach was designed to transition away from a cost-based system to a system that would take into consideration the acuity of residents served in facilities, as well as facilities’ performance relative to specified quality measures. As part of an ongoing commitment to transparency, TennCare sought broad stakeholder input throughout the development process for the new payment system, hearing directly from residents receiving NF services and their family members, as well as from staff of NFs participating in TennCare’s Quality Improvement in Long-Term Services and Supports (QuILTSS) initiative. Each of the Medicaid NFs in the State and their Resident/Family Councils were invited to complete surveys to provide feedback regarding quality-related components of the new reimbursement rule. Facility representatives also had the opportunity to discuss their experience with the QuILTSS initiative and ways in which the program could be improved, not only to aid the initiative’s goal of improving quality of care and quality of life for NF residents, but also to minimize administrative burden on facilities. As of the end of DY 16, implementation of the new reimbursement methodology was expected to take place in DY 17.
II. Project Status Demonstration Amendment 33: Supplemental Payment Pools for Tennessee Hospitals. On February 7, 2018, TennCare submitted Demonstration Amendment 33 to CMS. Amendment 33 concerned the supplemental payments that TennCare makes to Tennessee hospitals to help offset the costs these facilities incur in providing uncompensated care. With Amendment 33, TennCare asked that CMS revisit certain changes imposed on the supplemental payment structure during the most recent renewal of the TennCare Demonstration in 2016. The proposal contained in Amendment 33 consisted of three components:
• Restoration of approximately $90 million to the maximum amount TennCare is authorized to pay to hospitals each year for uncompensated care costs;
• Continuation of a special funding pool—which was scheduled to end on June 30, 2018—that supports clinics operated by Meharry Medical College; and
• Extending the implementation period of a new hospital payment structure that was scheduled to take effect on July 1, 2018.
By the end of the DY 16, TennCare and CMS were working on a path to address the issues raised by the State without the need for a formal demonstration amendment. The State expected to formally withdraw Amendment 33 from further consideration once the details of the new arrangement had been finalized. Demonstration Amendment 34: Program Modifications. Amendment 34 was a contingency plan—based on amendments from prior years—to address the budgetary challenges that would have arisen if the Tennessee General Assembly did not renew a non-recurring hospital assessment. Amendment 34 outlined several significant benefit limits to be imposed on non-exempt adults, including—
• A combined annual limit of eight days per person for inpatient hospital and inpatient psychiatric hospital services;
• An annual limit on non-emergency outpatient hospital visits of eight occasions per person; • A combined annual limit on health care practitioners’ office visits of eight occasions per person;
7
• An annual limit on lab and X-ray services of eight occasions per person; and • Elimination of coverage for occupational therapy, speech therapy, and physical therapy.
TennCare held a public notice and comment period on Amendment 34 from March 6 through April 5, 2018. As was the case in previous years, however, the General Assembly renewed the hospital assessment by the conclusion of the legislative session, thereby eliminating any funding gap and, as a result, the need for Amendment 34 to be submitted to CMS. Demonstration Amendment 35: Substance Use Disorder Services. On May 25, 2018, the State submitted Amendment 35 to CMS. Amendment 35 would amend the TennCare benefits package to cover residential substance use disorder (SUD) treatment services in facilities with more than 16 beds. The federal government classifies facilities with more than 16 beds as “institutions for mental diseases” (IMDs), and federal law prohibits the expenditure of federal Medicaid dollars for services delivered to adults in these facilities. Until the 2016 managed care rule, TennCare’s MCOs were able to cover residential treatment services in IMDs in lieu of providing these services in facilities that were not IMDs, if the MCO determined that such care was medically appropriate and cost-effective as compared to services in Tennessee’s Medicaid State Plan. However, the 2016 managed care rule limits this option to treatment stays of no more than 15 days per calendar month, in effect creating a gap in the State’s benefit package for SUD treatment. In light of this new federal restriction, TennCare sought authority through Amendment 35 to cover residential SUD treatment services in facilities that meet the definition of an IMD when medically necessary and appropriate. TennCare’s proposal would allow enrollees to receive short-term services in IMDs beyond the 15-day limit in federal regulation, up to 30 days per admission. As of the conclusion of DY 16, CMS’s review of Amendment 35 was ongoing. Demonstration Amendment 36: Family Planning Providers. In the final month of DY 16, TennCare initiated a public notice and comment period for a demonstration amendment growing out of Tennessee’s 2018 legislative session. Specifically, the Tennessee General Assembly passed legislation establishing that it is the policy of the state of Tennessee to favor childbirth and family planning services that do not include elective abortions within the continuum of care or services, and to avoid the direct or indirect use of state funds to promote or support elective abortions. Accordingly, Amendment 36 is designed to establish state-specific criteria for providers of family planning services, and to exclude any providers that do not meet these criteria from participation in the TennCare program. As specified in the legislation passed by the General Assembly, Amendment 36 would exclude any entity that performed, or operated or maintained a facility that performed, more than 50 abortions in the previous year, including any affiliate of such an entity. The designated public notice and comment period for Amendment 36 was scheduled to run from June 13 through July 13, 2018. As of the end of DY 16, TennCare planned to submit Amendment 36 to CMS at the conclusion of the public notice period and after all public comments had been reviewed. Technical Change to the TennCare Demonstration. On July 6, 2017, TennCare submitted to CMS a proposed modification to the State’s 1115 demonstration project. Attachment C of the TennCare Demonstration specifies limitations for private duty nursing services. The State sought to modify these
8

limitations by making private duty nursing services available to adults aged 21 and older who are ventilator-dependent with a progressive neuromuscular disorder or spinal cord injury, and who are ventilated using noninvasive positive pressure ventilation by mask or mouthpiece for at least 12 hours each day in order to avoid or delay tracheostomy. CMS approved the technical change on February 1, 2018. Incentives for Providers to Use Electronic Health Records. The Electronic Health Record (EHR) Incentive Program is a partnership between federal and state governments that grew out of the Health Information Technology for Economic and Clinical Health (HITECH) Act of 2009. The purpose of the program is to provide financial incentives to Medicaid providers1 to replace outdated, often paper-based approaches to medical record-keeping with Certified Electronic Health Record Technology (as defined by CMS) that meets rigorous criteria and that can improve health care delivery and quality. The federal government provides 100 percent of the funding for the incentive payments and 90 percent of the funding for administrative costs. Tennessee’s EHR program has issued payments for six program years to Medicaid providers meeting relevant eligibility requirements. Tennessee’s EHR program remained robust during DY 16 by continuing to distribute payments to some providers while educating others on the advantages of participation. Highlights from the year included the following:
• Total first-year payments to providers who had adopted, implemented, or upgraded to certified EHR technology capable of meeting CMS’ “meaningful use” standards or who had achieved meaningful use of certified EHR technology for a period of 90 consecutive days exceeded $180 million by June 30, 2018. (Since enrollment of new providers concluded on April 30, 2017, first year payments were made only in the first two quarters of DY 16.)
• Total second-year payments to providers who had received first-year payments and who subsequently achieved meaningful use for a subsequent period of 90 consecutive days surpassed $58 million by the conclusion of DY 16.
• Total third-year, fourth-year, fifth-year, and sixth-year payments to providers who had demonstrated ongoing meaningful use of EHR technology increased by almost 23 percent during the year, growing from approximately $37,600,000 as of June 30, 2017, to more than $46,150,000 as of June 30, 2018.
• Nearly 1,100 Tennessee providers received incentive payments during DY 16. These achievements would not have been possible without TennCare’s multilayered approach to proactive outreach and communication to providers throughout the state. Various facets of this outreach effort included meetings, technical assistance calls, webinars, onsite visits, a dedicated section of the TennCare website, and newsletters. Population Health. Population Health (PH) is a healthcare management approach implemented by TennCare to promote improved health outcomes for the TennCare member population. Key benefits of Population Health include—
1 CMS allows two types of providers to participate in the Medicaid EHR Incentive Program: medical professionals (medical and osteopathic physicians, nurse practitioners, certified nurse midwives, dentists, and physician assistants who meet certain criteria) and hospitals (acute care hospitals, critical access hospitals, and children’s hospitals).
9

• Emphasis on preventative care; • Identification of risky behaviors likely to lead to disease in the future (such as poor eating habits,
physical inactivity, and drug use); • Assistance to enrollees in discontinuing such activities; and • Interventions to assist enrollees who already have a complex chronic condition.
The PH program replaced the much more limited “Disease Management” model, which had typically served about 250,000 individuals. By contrast, the conclusion of DY 16 saw 1,327,005 TennCare enrollees—90 percent of the enrollee population—receiving PH services.
Special Terms and Conditions. A summary of activities that occurred with respect to the Special Terms and Conditions is presented in Attachment D.
Enrollment information. STC 46.b. requires that the State include enrollment reporting by Eligibility Group and by Type for the TennCare population. Table 1 summarizes that information.
Table 1 Enrollment Counts for DY 16
State Plan and Demonstration Populations
Total No. of TennCare Enrollees Jul - Sep
2017 Oct - Dec
2017 Jan - Mar
2018 Apr - Jun
2018 EG1 Disabled, Type 1 State Plan eligible
145,778 143,789 142,906 142,555
EG9 H-Disabled, Type 2 Demonstration Population
240 252 261 278
EG2 Over 65, Type 1 State Plan eligible
245 350 414 446
EG10 H-Over 65, Type 2 Demonstration Population
44 57 54 66
EG3 Children, Type 1 State Plan eligible
762,486 778,248 788,561 765,641
EG4 Adults, Type 1 State Plan eligible
399,788 418,520 428,261 410,901
EG5 Duals, Type 1 State Plan eligibles and EG11 H-Duals 65, Type 2 Demonstration Population
148,941 149,247 149,080 148,475
EG6E Expan Adult, Type 3 Demonstration Population
302 269 209 131
EG7E Expan Child, Type 3 Demonstration Population
810 897 865 1,042
EG8, Med Exp Child, Type 2 Demonstration Population, Optional Targeted Low Income Children funded by Title XIX
0 0 0 0
Med Exp Child, Title XXI Demonstration Population
4,394 4,529 4,236 4,827
10

State Plan and
Demonstration Populations
Total No. of TennCare Enrollees Jul - Sep
2017 Oct - Dec
2017 Jan - Mar
2018 Apr - Jun
2018 EG12E Carryover, Type 3, Demonstration Population
1,839 1,731 1,666 1,544
TOTAL 1,464,867 1,497,889 1,516,513 1,475,906
III. Quantitative and Case Study Findings
Beneficiary Survey. Every year since 1993, the Boyd Center for Business and Economic Research (BCBER) at the University of Tennessee in Knoxville has conducted a survey of Tennessee citizens—TennCare enrollees, individuals with private insurance, and uninsured individuals alike—to assess their opinions about health care. Respondents provide feedback on a range of topics, including demographics (age, household income, family size, etc.), perceptions of quality of care received, and behavior relevant to health care (the type of provider from whom an individual is most likely to seek initial care, the frequency with which care is sought, etc.). During DY 16, BCBER published a summary of the results of the most recent survey titled “The Impact of TennCare: A Survey of Recipients, 2017”. Although the findings of a single survey must be viewed in context of long-term trends, several results from the report are noteworthy:
• Satisfaction with TennCare remained high. Ninety-five percent of respondents covered by TennCare expressed satisfaction with the quality of care they had received. This level of satisfaction tied for the highest in the program’s history and was the fourth time in seven years that this peak had been attained. In addition, 2017 was the ninth straight year in which survey respondents had reported satisfaction levels exceeding ninety percent.
• The uninsured rate in Tennessee remained relatively low. Although the percentage of respondents classifying themselves as uninsured rose from 5.5 percent in 2016 to 6.0 percent in 2017, the 2017 mark was nonetheless the fourth lowest level in the 25-year history of the survey. Furthermore, the percentage of individuals classifying their children as uninsured fell from 1.8 percent in 2016 to 1.5 percent in 2017, tying the all-time lowest level established in 2015.
• TennCare families sought care from physicians more frequently than the Tennessee population as a whole. Thirty-three percent of heads of households with TennCare reported seeing a doctor weekly or monthly, and seventeen percent reported doing so for their children. By contrast, only fourteen percent of all heads of households reported seeing a doctor weekly or monthly, and only eight percent reported doing so for their children.
In summary, the report notes, “TennCare continues to receive positive feedback from its recipients, with 95 percent reporting satisfaction with the program. This positive feedback is a strong indication that TennCare is providing satisfactory medical care and meeting the expectations of those it serves.” BCBER’s report may be viewed in its entirety online at http://cber.haslam.utk.edu/tncare/tncare17.pdf. HEDIS/CAHPS Report. The annual report of HEDIS/CAHPS data—titled “Comparative Analysis of Audited Results from TennCare MCOs”—was released in August 2017. The full name for HEDIS is “Healthcare Effectiveness Data Information Set,” and the full name for CAHPS is “Consumer Assessment
11

of Health Plans Surveys.” This report, which is presented in Attachment F and posted on the TennCare website at https://www.tn.gov/content/dam/tn/tenncare/documents/hedis17.pdf, provides data that enables the State to compare the performance of its MCOs against national norms and benchmarks and to compare performance among MCOs. Improved statewide performance was noted for an array of child health measures, with many also exceeding the HEDIS 2016 Medicaid National Average. Higher success rates were achieved in all of the following categories:
• Weight Assessment and Counseling for Nutrition and Physical Activity for Children and Adolescents (including “BMI Percentile”, “Counseling for Nutrition”, and “Counseling for Physical Activity”)
• Immunizations for Adolescents (“Meningococcal”, “Tdap/Td”, and “Combination 1”) • Lead Screening in Children • Appropriate Testing for Children with Pharyngitis • Asthma Medical Ratio (all child sub-categories) • Appropriate Treatment for Children with Upper Respiratory Infection • Prenatal and Postpartum Care • Frequency of Ongoing Prenatal Care • Well-Child Visits in the First 15 Months of Life • Well-Child Visits in the Third, Fourth, Fifth, and Sixth Years of Life • Adolescent Well-Care Visits
Improvement was also evident in a variety of health categories applicable to adults, including Adult BMI Assessment, Use of Spirometry Testing in the Assessment and Diagnosis of COPD, Avoidance of Antibiotic Treatment in Adults with Acute Bronchitis, Controlling High Blood Pressure, Persistence of Beta-Blocker Treatment After a Heart Attack, Statin Therapy for Patients with Diabetes, Disease-Modifying Anti-Rheumatic Drug Therapy for Rheumatoid Arthritis, and Adults’ Access to Preventive/Ambulatory Health Services. Categories related to women’s health showed higher outcomes as well, with improved results in the areas of Breast Cancer Screening, Cervical Cancer Screening, Chlamydia Screening in Women (both “16-20 years” and “21-24 years”), and Non-Recommended Cervical Cancer Screening in Adolescent Females. HEDIS 2017 was the eighth year of statewide reporting of behavioral health measures following the integration of medical and behavioral health services among TennCare’s health plans. Results superior to those in 2016 were achieved in the behavioral health categories of Follow-Up After Hospitalization for Mental Illness, Diabetes Screening for People With Schizophrenia or Bipolar Disorder Who Are Using Antipsychotic Medications, Diabetes Monitoring for People With Diabetes and Schizophrenia, and Adherence to Antipsychotic Medications for Individuals with Schizophrenia. In some categories in which improvement was not seen relative to 2016 (Follow-Up Care for Children Prescribed ADHD Medication; Cardiovascular Monitoring for People With Cardiovascular Disease and Schizophrenia; Metabolic Monitoring for Children and Adolescents on Antipsychotics, 6-11 years), performance nonetheless exceeded the 2016 Medicaid National Average.
12

IV. Utilization Data Utilization information is taken from encounter data submitted by the Managed Care Organizations. It is maintained on a rolling basis reflecting a one-quarter lag. Key indicators tracked by TennCare and the measures for each indicator for FYs 2016-2018 are presented in Table 2.
Table 2
Key Indicators Tracked by TennCare, FYs 2016-2018
METRIC FY 2016 FY 2017 FY 2018 Member Months (FTE) 1,499,252 1,506,504 1,442,280
COST INDICATORS PMPM – Physician $86 $89 $96 PMPM – Facilities $122 $123 $129 PMPM – Rx (before rebate)
$69 $69 $70
UTILIZATION MEASURES
Hospital Days/1000 584 573 582 Hospital Admissions (excluding mental health events)/1000
110 108 107
ER Visits/1000 951 916 872 Prescriptions/1000 10,460 10,421 10,437 Source: TennCare’s Office of Healthcare Informatics All utilization measures are calculated per 1,000 Full Time Equivalent (FTE) members.
V. Evaluation Findings from the Demonstration Period to Date
On December 16, 2016, CMS approved the State’s application to extend the TennCare Demonstration through June 30, 2021. The Special Terms and Conditions accompanying the approval outlined the manner in which the TennCare Demonstration would be evaluated, namely by focusing on TennCare’s CHOICES and Employment and Community First CHOICES programs, as well as “the state plan and demonstration populations enrolled in those programs.” One of the requirements applied to TennCare’s evaluation efforts was that a draft evaluation design be submitted by the State to CMS within 120 days following the date on which the extension application had been approved. Accordingly, on April 17, 2017, the State submitted its draft design, which included five program objectives related to the CHOICES program, five program objectives related to the Employment and Community First CHOICES program, and appropriate data elements for each of the ten objectives. The central issue addressed by the design and its accompanying objectives is how the CHOICES and Employment and Community First CHOICES managed LTSS programs compare with various fee-for-service LTSS programs operated by the State in the past and present.
13

The five objectives related to the CHOICES program as described in the State’s draft evaluation design are as follows:
1. Expand access to HCBS for older adults and adults with physical disabilities. 2. Rebalance TennCare spending on long-term services and supports to increase the proportion
that goes to HCBS. 3. Provide cost-effective care in the community for persons who would otherwise require nursing
facility care. 4. Provide HCBS that will enable persons who would otherwise be required to enter nursing
facilities to be diverted to the community. 5. Provide HCBS that will enable persons receiving services in nursing facilities to be able to
transition back to the community. The five objectives related to the Employment and Community First CHOICES program as described in the State’s draft evaluation design are as follows:
1. Expand access to HCBS for individuals with intellectual and developmental disabilities. 2. Provide more cost-effective services and supports in the community for persons with
intellectual and developmental disabilities. 3. Continue balancing TennCare spending on long-term services and supports for individuals with
intellectual and developmental disabilities to increase the proportion spent on HCBS. 4. Increase the number and percentage of persons with intellectual and developmental disabilities
enrolled in HCBS programs who are employed in an integrated setting earning at or above the minimum wage.
5. Improve the quality of life of individuals with intellectual and developmental disabilities enrolled in HCBS programs.
When DY 16 concluded, the State and CMS were working to finalize the evaluation design. In the meantime, data related to the ten objectives above has been furnished by the State to CMS in the quarterly progress reports required by STC 44 and in the CHOICES and Employment and Community First CHOICES data reports required by STC 42.d.iv.
VI. Policy and Administrative Issues and Solutions
Community Engagement for TennCare Beneficiaries. In 2018, the Tennessee General Assembly enacted Public Chapter No. 869. This state law directs TennCare to submit a demonstration amendment to authorize the creation of reasonable work and community engagement requirements for non-pregnant, non-elderly, non-disabled adults enrolled in the TennCare program who do not have dependent children under the age of six. During DY 16, TennCare began the process of planning and designing a community engagement initiative in accordance with this state law, including discussions with multiple stakeholders to inform the design process. The formal public notice process for this demonstration amendment and its actual submission to CMS are anticipated to occur during DY 17.
14

Tennessee Eligibility Determination System. The Tennessee Eligibility Determination System (or “TEDS”) is the name of the system that will be used by the State to process applications and identify persons who are eligible for TennCare and CoverKids (the State’s separate CHIP program). TennCare initiated the TEDS project in 2012. After partnering initially with the Northrop Grumman Corporation, the State ultimately adopted a new approach to the undertaking. Three separate contracts were procured to address the functions of technical advisory services (awarded to KPMG, LLP), strategic program management office services (awarded to Public Consulting Group, Inc.), and systems integration services (awarded to Deloitte Consulting, LLP). Deloitte is responsible for the project’s central tasks of designing, developing, implementing, maintaining, and operating a rules-based Medicaid eligibility determination system that will make eligibility determinations and redeterminations, potentially in real time; receive application data; interface with federal data sources (such as the Federally Facilitated Marketplace and the Internal Revenue Service); and mail notices to enrollees. Significant progress on the TEDS project was achieved during DY 16. During the first half of the demonstration year, Deloitte and TennCare collaborated first on formal design documents for the system, and then on systems integration test scripts (used to verify that TEDS performs according to expectations). In the second half of the demonstration year, preparations moved on to systems integration testing, which ensures that various TEDS components perform effectively and appropriately in conjunction with one another, and user acceptance testing, in which TennCare staff members tried out various functions of the system in a simulated environment to determine whether the system was functioning as needed. As of the end of DY 16, the first pilot phase of TEDS implementation was planned for late 2018. Wilson v. Gordon Suit. Wilson v. Gordon is a class action lawsuit filed against TennCare by the Tennessee Justice Center, the Southern Poverty Law Center, and the National Health Law Program. The suit, which is being heard by the U.S. District Court for the Middle District of Tennessee, alleges federal noncompliance in the Medicaid application and appeals process TennCare has been using since implementation of the Affordable Care Act. In the fall of 2016, the State filed a Motion to Decertify the Class and Dismiss the Case. The basis of the motion was that processes used by TennCare and CMS for Medicaid applications and application appeals in Tennessee had evolved substantially. The State argued that there were no remaining members in the Plaintiff class originally certified by the District Court, and that any eligibility issues arising in 2016 and thereafter were completely different from the issues that originally prompted the Wilson suit. Oral argument and supplemental briefing on the State’s Motion took place during the first half of Calendar Year 2017. On November 9, 2017, Plaintiffs and Defendants jointly requested that a pretrial conference scheduled for late November 2017 and a trial scheduled for December 2017 be postponed until the District Court had ruled on the Motion to Decertify the Class and Dismiss the Case. This request was granted on November 14, 2017.
15

In the final month of DY 16, Judge William L. Campbell, Jr. denied the State’s Motion to Decertify the Class and Dismiss the Case on the grounds that there were still members in the Plaintiff class. As a result of this decision, the case was scheduled to proceed to trial on October 9, 2018. Throughout DY 16, the State continued to comply with all orders issued by the District Court in the Wilson suit. Roan and Shackelford v. Long Suit. This lawsuit was filed against TennCare in December 2017 by the Tennessee Justice Center and the Legal Aid Society of Middle Tennessee and the Cumberlands. The litigation, which is being heard by the U.S. District Court for the Middle District of Tennessee, concerns limitations placed by TennCare on private duty nursing services for individuals aged 21 and older. The purpose of the limitations—approved by CMS in 2008—is to ensure that private duty nursing expenditures are managed in a medically appropriate yet financially sustainable manner. When a child enrolled in TennCare receives private duty nursing services in excess of the limits applicable to adult enrollees, the enrollee’s MCO works with the child and his family prior to the child’s 21st birthday to help transition the individual to a different level of benefits that best meets his needs (and that can include long-term services and supports). In Roan and Shackelford v. Long, two plaintiffs with disabilities who received private duty nursing services as children challenged TennCare’s ability to implement limits on the services they received as adults. Plaintiffs Alison Roan and Tristen Shackelford alleged that TennCare’s limits violated the Americans with Disabilities Act (ADA) and sought an injunction prohibiting TennCare from reducing the services they were receiving. The State timely filed a response to the Motion for Preliminary Injunction, as well as a Motion to Dismiss and a Notice of Constitutional Question. By the conclusion of DY 16, the plaintiffs’ Motion for Preliminary Injunction had been scheduled to be heard on November 20-21, 2018. The sole issue to be addressed at the hearing is whether TennCare must continue to provide private duty nursing services 24 hours a day for the plaintiffs while the case is pending. In addition, on June 21, 2018, plaintiff Alison Roan filed a Notice of Voluntary Dismissal in the case, effectively ending her participation in the litigation. The basis for the dismissal was that Ms. Roan’s health condition had declined and, as a result, she could not safely be cared for at home, even with 24-hour-per-day private duty nursing services. The Court signed an Order dismissing Ms. Roan from the case. Nonetheless, the claims filed by plaintiff Tristen Shackelford remain pending, meaning that the lawsuit will proceed. Quality Improvement Strategy. As required by federal law2 and the State's Demonstration agreement with CMS,3 TennCare has developed a strategy for evaluating and improving the quality and accessibility of care offered to enrollees through the managed care network. TennCare submitted its annual update of the strategy—titled 2017 Update to the Quality Assessment and Performance Improvement Strategy—to CMS on December 20, 2017. In addition to laying out the measures of quality assurance already in place, the report outlines TennCare's goals and objectives relative to quality and access for the year to follow. Furthermore, a variety of best practices (such as the Population Health program and collaborative work groups among TennCare and the MCOs) and challenges (like lack of member engagement) are detailed in the
2 42 U.S.C. § 1396u-2(c)(1)(A) 3 STC 42.c. of the TennCare Demonstration
16

concluding section of the report, as is the positive impact of the State Innovation Model (SIM) grant awarded to Tennessee by the Centers for Medicare and Medicaid Innovation. The document is included as Attachment G of this report. Public Forum on the TennCare Demonstration. In compliance with the federal regulation at 42 CFR § 431.420(c) and the Special Terms and Conditions of the TennCare Demonstration, the State hosted a public forum in Nashville on December 14, 2017. The purpose of the forum was to provide members of the public an opportunity to comment on the progress of the TennCare Demonstration project, which has delivered Medicaid services to eligible Tennesseans under a managed care model since 1994. The December 14 open meeting was not the only avenue through which feedback could be offered. Notice of the forum, which appeared on the TennCare website, included an email address and a physical address at which comments would be accepted. In this forum, TennCare received one set of comments, concerning Employment and Community First CHOICES, the State’s managed long-term services and supports program for individuals with intellectual and other types of developmental disabilities. Specifically, the comments acknowledged improvements that had been made to the program by the State, while also identifying areas of additional opportunity. These comments will be used to inform future program planning.
17

ATTACHMENT A
OPERATIONAL PROCEDURES REGARDING RESERVE SLOTS IN CHOICES GROUP 2
Required by STC #31.d.iv.(A)

Operational Procedures for CHOICES Group 2 Reserve Capacity
Pursuant to STC #31.d.iv. (A), (“Reserve Capacity”) of the Special Terms and Conditions set forth in the current TennCare Section 1115 Demonstration Waiver, the State will reserve a specified number of slots in CHOICES Group 2 for:
• Individuals being discharged from a Nursing Facility (NF); and • Individuals being discharged from an acute care setting who are in imminent risk of being
placed in a NF setting absent the provision of Home and Community-Based Services (HCBS). Once all other available (i.e., unreserved) slots have been filled, individuals who meet specified criteria (including new applicants seeking to establish Medicaid eligibility in an institutional category as well as current SSI-eligible individuals seeking enrollment into CHOICES Group 2) may be enrolled into reserved slots in accordance with the following procedures:
• The Area Agency on Aging and Disability (AAAD) or the Managed Care Organization (MCO), as applicable, must complete and submit a Reserve Capacity Enrollment Justification form to the TennCare Division of Long-Term Services and Supports (LTSS), along with supporting documentation.
• The Reserve Capacity Enrollment Justification form will require confirmation of the NF or
hospital, as applicable, from which the person is being discharged, and in the case of a hospital discharge, a written explanation of the applicant's circumstances that warrant the immediate provision of NF services unless HCBS are immediately available. This explanation will include such factors as:
o The reason for the acute care stay o The current medical status of the individual o Specific types of assistance needed by the individual upon discharge (medical as well
as functional) o A description of the applicant's natural support system as it relates to discharge needs.
• The TennCare Division of LTSS will review the form and supporting documentation in order to
determine whether the person meets specified criteria for enrollment into a reserved slot.
• If documentation is sufficient to demonstrate that the individual meets specified criteria for a reserved slot, TennCare will notify the submitting entity and proceed with the enrollment process, including determination of categorical/financial eligibility (for new Medicaid applicants) and application of federal post-eligibility provisions.
• If documentation is not sufficient to demonstrate that the individual meets specified criteria
for a Reserve Capacity slot, TennCare will notify the submitting entity and place the person on a waiting list for Group 2 once unreserved capacity is available. TennCare shall provide notice of the determination to the applicant, which will include the right to request a fair hearing regarding any valid factual dispute pertaining to the State's decision.

ATTACHMENT B
OPERATIONAL PROCEDURES REGARDING RESERVE SLOTS IN ECF CHOICES
Required by STC #32.d.iv.(A)
Operational Procedures for Employment and Community First CHOICES
Reserve Capacity Pursuant to STC #32.d.iv.(A) (“Reserve Capacity”) of the Special Terms and Conditions set forth in the current TennCare Section 1115 Demonstration Waiver, the State will reserve a specified number of slots in Employment and Community First (ECF) CHOICES for:
• Individuals with an intellectual disability who have an aging caregiver, as defined in State law; • Individuals in emergent circumstances as defined in TennCare rule; • Individuals with multiple complex health conditions as defined in TennCare rule; • Individuals with significant medical or behavioral needs who require services available in ECF
CHOICES to sustain current family living arrangements; and • Individuals requiring planned transition to community living due to the caregiver’s poor and
declining health. These groups were identified in partnership with stakeholders including:
• The Arc of Tennessee; • The Tennessee Council on Developmental Disabilities; • The Tennessee Disability Coalition; • Disability Rights Tennessee (Protection and Advocacy); and • The Statewide Independent Living Council of Tennessee.
For DY 16, TennCare shall reserve 350 slots within the ECF CHOICES Groups 4, 5, and 6 Enrollment Targets. These slots are available only as specified below. Due to the limited availability of new state appropriations for DY 17 and in order to further develop the capacity of community providers to deliver home and community-based services and supports, any increases in the Enrollment Targets for ECF CHOICES Groups 4, 5, and 6 during DY 17 will be Reserve Capacity slots. Reserve capacity groups established at the program’s outset include: Individuals with an intellectual disability who have an aging caregiver, as defined in State law Pursuant to State law (TCA § 33-5-112), individuals who have an intellectual disability and have aging caregivers (currently defined by Tennessee statute as caregivers age 75 or older) will be eligible for enrollment into ECF CHOICES, subject to Medicaid and program eligibility criteria. Individuals in emergent circumstances as defined in TennCare rule An emergent situation will be defined as one that meets one or more of the criteria below and for which enrollment into ECF CHOICES is the most appropriate course, as determined through an interagency committee review process, including both TennCare and the Department of Intellectual and Developmental Disabilities (DIDD). The review will include consideration of other options, including the relative costs of such options. Discharge from another service system (DCS, DMHSAS, etc.) shall not be deemed an emergent situation unless other emergent criteria are met and unless diligent and timely efforts to plan and prepare for discharge and to facilitate transition to community living without long-term services and supports available in ECF CHOICES have been made, and it is determined through the

interagency committee review process that enrollment in ECF CHOICES is the most appropriate way to provide needed supports. Emergent criteria shall be as follows:
• The person’s primary caregiver is recently deceased, and there is no other caregiver available to provide needed long-term supports.
• The person’s primary caregiver is permanently incapacitated, and there is no other caregiver available to provide needed long-term supports.
• Services/supports in ECF CHOICES are urgently needed because of the recent loss of the person’s living arrangement, including (as applicable) caregiver supports provided in that living arrangement that will not be available to the person going forward.
• There is clear evidence of serious abuse, neglect, or exploitation in the current living arrangement; the person must move from the living arrangement to prevent further abuse, neglect or exploitation; and there is no alternative living arrangement available.
• Enrollment into ECF CHOICES is necessary in order to facilitate transition out of a long-term care institution, i.e., a NF or a private or public ICF/IID into a more integrated community-based setting.
• The person is being discharged from an acute care setting and is at imminent risk of being placed in a NF setting absent the provision of HCBS or has applied for admission to a NF and been determined via the PASRR process to be inappropriate for NF placement. TennCare may require confirmation of the NF or hospital discharge and, in the case of hospital discharge, written explanation of the applicant’s circumstances that warrant the immediate provision of NF services unless HCBS are immediately available.
• An adult’s transition upon aging out of state custody, discharge from an inpatient psychiatric hospital (including regional mental health institute), or release from incarceration is contingent on the availability of services and supports in ECF CHOICES because other appropriate services/supports are not available, and the services available in ECF CHOICES (including covered physical and behavioral health services) will be sufficient to safely meet the person’s needs in the community.
• The person is an adult age 21 or older enrolled in ECF CHOICES Group 4 (Essential Family Supports), ECF CHOICES Group 5 (Essential Supports for Employment and Independent Living), or the Section 1915(c) Self-Determination Waiver and has recently experienced a significant change in needs or circumstances. TennCare has determined via a Safety Determination that the person can no longer be safely served within the array of benefits available in ECF CHOICES Group 4 (Essential Family Supports) or 5 (Essential Supports for Employment and Independent Living) or the Self-Determination Waiver, as applicable, the person meets NF Level of Care, and must be transitioned to ECF CHOICES Group 6 (Comprehensive Supports for Employment and Community Living) in order to sustain community living in the most integrated setting.
• The health, safety, or welfare of the person or others is in immediate and ongoing risk of serious harm or danger; other interventions including Behavioral Health Crisis Prevention, Intervention and Stabilization services, where applicable, have been tried but were not successful in minimizing the risk of serious harm to the person or others without additional services available in ECF CHOICES; and the situation cannot be resolved absent the provision of such services available in ECF CHOICES.

Individuals with multiple complex health conditions as defined in TennCare rule Reserve capacity will be established for a limited number of individuals who have multiple complex chronic or acquired health conditions that present significant barriers or challenges to employment and community integration, and who are in urgent need of supports in order to maintain the current living arrangement and delay or prevent the need for more expensive services, and for which enrollment into ECF CHOICES is the most appropriate way to provide needed supports, as determined through an interagency committee review process, including both TennCare and DIDD. The review will include consideration of other options, including the relative costs of such options. Additional reserve capacity groups identified in partnership with stakeholders since the program’s implementation include: Individuals with significant medical or behavioral needs who require such supports to sustain current family living arrangements Reserve capacity will be established for a limited number of individuals living at home with family who have significant medical or behavioral support needs that family caregivers are struggling to meet, and the sustainability of the current living arrangement is at significant risk. Services available through ECF CHOICES would help to support and sustain the current living arrangement and the continuation of natural caregiving supports, delaying the need for more expensive services. Individuals requiring planned transition to community living due to the caregiver’s poor and declining health Reserve capacity will be established for a limited number of adults age 21 and older living at home with family whose primary caregiver is in poor and declining health, placing the long-term sustainability of the current living arrangement at significant risk. Planned transition to community living in the most independent and integrated setting appropriate is needed in order to avoid a potential crisis situation in the near future. Individuals with a developmental disability who have an aging caregiver, as defined in State law Pursuant to State law (TCA § 33-5-112), individuals who have a developmental disability and have aging caregivers (currently defined by Tennessee statute as caregivers age 80 or older) will be eligible for enrollment into ECF CHOICES, subject to Medicaid and program eligibility criteria. Operational Procedures: Unlike reserve capacity slots established for CHOICES Group 2 participants, reserve capacity slots in ECF CHOICES will be used as persons meeting specified criteria are identified and determined eligible to enroll. Reserve capacity slots may be set aside for certain groups as defined herein, e.g., individuals with an intellectual or developmental disability who have an aging caregiver, as defined and required under State law, children aging out of State custody, etc. Except for individuals with an intellectual or developmental disability who have an aging caregiver, as defined in State law, review and selection of persons who meet criteria for reserve capacity slots will be determined by an interagency review committee, including both TennCare and DIDD. A Potential Applicant for ECF CHOICES may apply for enrollment into a reserve capacity slot only if determined through the interagency committee review process that applicable reserve capacity criteria are met, and

that enrollment into ECF CHOICES is the most appropriate way to provide needed supports. Such review shall include consideration of other options, including the relative costs of such options. TennCare will require confirmation that an Applicant meets applicable reserve capacity criteria. Except for individuals with an intellectual or developmental disability who have an aging caregiver, as defined in State law, documentation shall be provided via a form developed by TennCare, along with medical evidence that is submitted by the MCO or DIDD, as applicable, to the interagency review committee. Only Applicants determined by the interagency review committee to meet specified reserve capacity criteria (including new Applicants seeking to establish eligibility in the ECF CHOICES 217-Like Group or the Interim ECF CHOICES At-Risk Group as well as current SSI-eligible individuals seeking enrollment into ECF CHOICES) may be enrolled into reserve capacity slots. Once all reserve capacity slots set aside for a particular purpose have been filled, persons who meet such criteria shall not proceed with the enrollment process, but shall remain on the Referral List for ECF CHOICES, unless they qualify to enroll in an open priority group. If a Potential Applicant does not meet criteria for a reserve capacity slot, the Potential Applicant shall not proceed with the enrollment process, but shall remain on the referral list for ECF CHOICES. For purposes of transparency, reserve capacity criteria, including the operational procedures pertaining thereto, are set forth in TennCare Rule 1200-13-01 through the rulemaking process.

ATTACHMENT C
COMPLIANCE MEASURES FOR HCBS REGULATIONS
Required by STC #42.b.

COMPLIANCE WITH HCBS REGULATIONS
Regulation Topic Actions 42 CFR 440.180(a)
Description and requirements for HCBS
1. Attachments D and G of the approved TennCare Demonstration and the State Rules for TennCare Long-Term Care Programs (1200-13-01) define the HCBS benefits that are available through the CHOICES and ECF CHOICES programs and delineate when services may be provided to a CHOICES or ECF CHOICES member. Where appropriate, service definitions identify “services not included” as specified in (c)(3) of the regulation. TennCare Rules are available for review at https://publications.tnsosfiles.com/rules/1200/1200-13/1200-13-01.20180730.pdf
2. Contractor Risk Agreement between the Division of TennCare and each Managed Care Organization delineates HCBS available to CHOICES and ECF CHOICES enrollees, the scope of such services, and contractor requirements for the authorization and initiation of such services. The Contractor Risk Agreement also sets forth reporting requirements by which TennCare monitors the Managed Care Organizations’ compliance and penalties to remediate non-compliance. A sample contract is available for review at https://www.tn.gov/content/dam/tn/tenncare/documents/MCOStatewideContract.pdf.
3. Provider Agreements between the Managed Care Organizations and network providers delineate the type and scope of services that each provider may provide and requirements for qualified staff.
42 CFR 441.301(c); (1) (2) (3) (4) (5) (6)
Contents of request for a waiver: (1) Person-centered planning process (2) Person-centered service plan (3) Review of the person-centered service plan (4) Home and community-based settings (5) Settings that are not home and community-based (6) Home and community-based settings: compliance
1. Contractor Risk Agreement between the Division of TennCare and each Managed Care Organization delineates requirements for the person-centered planning process. A sample contract is available for review at the link provided above.
2. Contractor Risk Agreement between the Division of TennCare and each Managed Care Organization delineates requirements for the person-centered support plan. MCOs use a person-centered support plan template prescribed by TennCare. The Contractor Risk Agreement also sets forth reporting requirements by which TennCare monitors the Managed Care Organizations’ compliance and penalties to remediate non-compliance.
3. The Division of TennCare conducts routine audits of

Regulation Topic Actions and transition enrollee records to ensure compliance with the
person-centered planning requirements. Penalties to remediate non-compliance are delineated in the Contractor Risk Agreement. Additional quality monitoring and improvement strategies for person-centered planning are set forth in the integrated Quality Improvement Strategy, a copy of which is Attachment G to this report.
4. [Applicable to (4)-(6) of the Regulation] Tennessee’s required Statewide Transition Plan (STP) received final approval from CMS on April 13, 2016. The STP delineates the State’s process for assuring compliance with the HCBS settings rule, including the method for assuring Medicaid-reimbursed HCBS are provided in compliant settings; the process for determining settings that are not home and community-based in nature; and the transition process, which encompasses transition to compliance, as well as transition of individuals from a non-compliant setting to a compliant setting of their choice, when applicable. The plan was updated as of July 31, 2018, to reflect completion of the heightened scrutiny review process, including public comments regarding the posting of settings for which evidence has been submitted to CMS. This updated plan is available for review at https://www.tn.gov/content/dam/tn/tenncare/documents/StatewideTransitionPlanUpdated73118.pdf The State’s progress in implementing the STP and achieving full compliance is detailed in the document entitled Statewide Transition Plan and Heightened Scrutiny Milestone Tracking Quarterly Report, which reflects transition status as of June 30, 2018, and which was previously submitted to CMS.
42 CFR 441.302; (a) (c) (d) (g) (j)
State assurances: (a) Health and Welfare (c) Evaluation of need (d) Alternatives (g) Institutionalization absent waiver (j) Day treatment or partial hospitalization
1. The State Rules for TennCare Long-Term Care Programs (1200-13-01) define the standards for HCBS providers. These Rules are available for review at https://publications.tnsosfiles.com/rules/1200/1200-13/1200-13-01.20180730.pdf
2. Contractor Risk Agreement between the Division of TennCare and each Managed Care Organization includes
a. Critical Incident reporting requirements; b. Mandatory elements for all provider

Regulation Topic Actions agreements;
c. Credentialing requirements to ensure a network of qualified providers;
d. Requirements pertaining to initial and annual Level of Care assessments;
e. Mandatory elements of a CHOICES or ECF CHOICES assessment and person-centered support plan, including risk assessment/planning, as applicable; and
f. Maximum timelines for the assessment, development of the person-centered support plan, and service initiation for potential and new CHOICES or ECF CHOICES members.
3. Provider Agreements between the Managed Care Organizations and network providers include critical incident reporting requirements.
4. Cost neutrality calculations ensure that an individual’s needs can be met safely and effectively at a cost that is less than or equal to care provided in a NF. If the individual’s needs cannot safely and effectively be met with HCBS at a cost that is less than or equal to the same Level of Care in a NF, the individual is eligible for—and may elect to receive services in—a NF.
5. Level of Care is confirmed for each CHOICES and ECF CHOICES member through standard PAE processes, requirements for supporting medical documentation, and annual recertification to assure no changes in the Level of Care.
6. Freedom of Choice education appears in materials used by the single point of entry, and in the Freedom of Choice election form (applicable for CHOICES), member handbook, and TennCare website.
7. Please refer to the integrated Quality Improvement Strategy in Attachment G of this report for a list of measures used to verify the State Assurances.
42 CFR 441.303; (a) (c) (d) (e)
Supporting documentation required: (a) Description of safeguards (c) Description of agency plan for evaluation (d) Description of plan to inform enrollees (e) Description of post-
1. The Single Point of Entry or the Managed Care Organization facilitates CHOICES or ECF CHOICES Level of Care assessments through the completion of a PAE (PreAdmission Evaluation or Level of Care application). TennCare determines Level of Care. On an annual basis, each PAE in use by a Medicaid participant must be reviewed by the Managed Care Organization to verify that the individual still meets Level of Care.

Regulation Topic Actions eligibility treatment of income
2. Please refer to the integrated Quality Improvement Strategy in Attachment G of this report for a list of measures used to verify the State Assurances. These data are reported to CMS annually.
3. The State Rules for the Department of Health, Division of Healthcare Facilities delineate specific licensure requirements for nursing facilities, assisted care living facilities, and Adult Care Homes-Level 2. https://publications.tnsosfiles.com/rules/1200/1200-08/1200-08.htm The State Rules for the Department of Mental Health and Substance Abuse Services delineate specific licensure requirements for Community Living Supports, as defined in the three-page document following this table.
4. Post-eligibility treatment of income is delineated in State Rules for TennCare Technical and Financial Eligibility (1200-13-20). These Rules are available for review at https://publications.tnsosfiles.com/rules/1200/1200-13/1200-13-20.20180513.pdf.
42 CFR 441.310
Limits on Federal financial participation
1. The Contractor Risk Agreement between the Division of TennCare and the Managed Care Organizations allows the Managed Care Organizations to contract only with licensed facilities that are eligible to participate in Medicaid.
2. Managed Care Organizations may not provide reimbursement for Room and Board, as is delineated in State Rules for TennCare Long-Term Care Programs (1200-13-01-.02).
3. CHOICES services do not include prevocational, educational, or supported employment services. Where appropriate, ECF CHOICES service definitions specify that services may not be provided under the ECF CHOICES program if such benefits would be available either under special education and related services as defined in section 602 of the Education of the Handicapped Act (20 U.S.C. 1401) or under vocational rehabilitation services available to the individual through a program funded under section 110 of the Rehabilitation Act of 1973 (29 U.S.C. 730).

Licensure and Quality Oversight of Community Living Supports and Community Living Supports-Family Model Providers
Providers of Community Living Supports (CLS) and Community Living Supports-Family Model (CLS-FM) are licensed by the Department of Intellectual and Developmental Disabilities (DIDD) pursuant to statutory requirements set forth in Tennessee Code Annotated, Title 33, and in Chapter 0940-05 of the Rules of the Department of Mental Health and Substance Abuse Services, including:
0940-05-24 MINIMUM PROGRAM REQUIREMENTS FOR MENTAL RETARDATION RESIDENTIAL HABILITATION FACILITIES 0940-05-26 MINIMUM PROGRAM REQUIREMENTS FOR MENTAL RETARDATION PLACEMENT SERVICES FACILITIES 0940-05-28 MINIMUM PROGRAM REQUIREMENTS FOR MENTAL RETARDATION SEMI-INDEPENDENT LIVING FACILITIES 0940-05-32 MINIMUM PROGRAM REQUIREMENTS FOR MENTAL RETARDATION SUPPORTED LIVING SERVICES FACILITIES
The specific type of licensure will depend on the level of services/reimbursement for individuals supported in the home, as well as certain factors that are explicit in the statutory and regulatory requirements. For example:
• CLS1 is provided to CHOICES members who are primarily independent or who have family members and other (i.e., non-CHOICES) paid or unpaid supports, but need limited intermittent CLS supports to live safely in a community housing situation—generally less than 21 hours per week—and do not need overnight staff or direct support staff to live on-site for supervision purposes. A primary staff member or other support staff must be on-call on a twenty four (24) hour per day basis when assistance is needed.
o The CLS1 provider is licensed by the Department of Intellectual and Developmental
Disabilities (DIDD) as Mental Retardation Semi-Independent Living Services Facility in accordance with licensure regulations.
• CLS2 is provided to CHOICES members who require minimal to moderate support on an ongoing
basis, but can be left alone for several hours at a time and do not need overnight staff or direct support staff to live on-site for supervision purposes. A primary staff member or other support staff must be on-call on a twenty four (24) hour per day basis.
o The CLS2 provider is also licensed by the Department of Intellectual and Developmental
Disabilities (DIDD) as Mental Retardation Semi-Independent Living Services Facility in accordance with licensure regulations.
This is the licensure type for Semi-Independent Living services currently provided under the State’s Section 1915(c) waiver authority for individuals with intellectual and developmental disabilities. CLS 1 and CLS 2 benefits are comparable to the Semi-Independent Living benefit

currently provided under the State’s Section 1915(c) waiver authority to individuals with intellectual and developmental disabilities.
• CLS3 is provided to CHOICES members with higher acuity of need who are likely to require
supports and or supervision twenty four (24) hours per day due to the following reasons: advanced dementia or significant cognitive disability that impacts the member’s ability to make decisions, perform activities of daily living or instrumental activities of daily living, including behaviors which place the member or others at risk; significant physical disabilities that require frequent intermittent hands-on assistance with activities of daily living including toileting, transfers, and mobility; complex health conditions and compromised health status requiring medication assistance and daily nurse oversight and monitoring and/or daily skilled nursing services as needed for routine, ongoing health care tasks, such as blood sugar monitoring and management, oral suctioning, tube feeding, bowel care, etc. Individuals authorized to receive CLS3 must have the appropriate level of professional and support staffing based on their needs, including up to 24/7 when appropriate.
o The CLS3 provider is licensed as a Mental Retardation Supported Living or Residential
Habilitation Facilities provider by the Department of Intellectual and Developmental Disabilities (DIDD) in accordance with licensure requirements.
This is the licensure type for Supported Living and Residential Habilitation services, including Medical Residential services, currently provided under the State’s Section 1915(c) waiver authority for individuals with intellectual and developmental disabilities.
• The levels of support for Community Living Supports-Family Model are the same, but all are
delivered in an adult foster home setting where the person lives in the home of a family who is the paid caregiver.
o The CLS-FM provider is licensed by the Department of Intellectual and Developmental
Disabilities (DIDD) as Mental Retardation Placement Services Facility.
This is the licensure type for providers of Family Model Residential Services currently provided under the State’s Section 1915(c) waiver authority for individuals with intellectual and developmental disabilities.
CLS and CLS-FM benefits in the Employment and Community First CHOICES program use the same licensure types. It is important to understand that licensure standards establish the minimum standards that facilities must meet in order to be licensed. These include background checks of all staff. Additional program and quality requirements are set forth in TennCare rules, MCO contracts, and provider agreements. In addition to annual licensure surveys, TennCare contracts with the Department of Intellectual and Developmental Disabilities (DIDD), the operating agency for the state’s three Section 1915(c) waivers for individuals with intellectual disabilities, to conduct quality monitoring surveys of providers of CLS and CLS-FM services. TennCare has built on a well-developed quality strategy that has been hailed by the

Centers for Medicare and Medicaid Services in recent evidentiary reviews of the 1915(c) waivers as a “model of best practices” to establish performance measures and processes for discovery, remediation, and ongoing data analysis and quality improvement regarding CLS services. In addition to providing data specific to the quality of these services offered in the CHOICES and ECF CHOICES programs, this ensures that TennCare has a comprehensive perspective of quality performance and strategies for quality improvement across the LTSS system as a whole. In addition to annual licensure surveys and annual quality monitoring surveys, MCO Care or Support Coordinators are required to conduct periodic onsite visits of each person receiving CLS or CLS-FM services, including specific monitoring specified by TennCare, to ensure that services are being provided appropriately and that the members’ needs are met. TennCare contracts with Area Agencies on Agency and Disability to ensure the availability of Ombudsman services for individuals receiving CLS and CLS-FM services. This includes periodic in-person assessment of the quality of services being received, as well as the member’s satisfaction with the services and with quality of life, using a standardized assessment tool. Finally, TennCare participates in National Core Indicators to assess quality of life, community integration, and person-centered services for CHOICES and, beginning in 2019, ECF CHOICES members. NCI also uses a standardized assessment tool to monitor quality of services and quality outcomes for seniors and adults with disabilities and individuals with I/DD receiving HCBS, including those in CLS and CLS-FM settings.

ATTACHMENT D
SPECIAL TERMS AND CONDITIONS REPORT

STC Activity Report—DY 16
TennCare maintained compliance with all Special Terms and Conditions during Demonstration Year 16. Specific actions and deliverables are detailed below. STCs #6 and #7: The State submitted three demonstration amendments to CMS:
• Amendment 32 proposed to establish a two-year pilot project in which certain TennCare enrollees would receive a medication therapy management benefit in addition to the traditional TennCare benefits package. The State submitted Amendment 32 on September 6, 2017, and CMS issued written approval on February 1, 2018.
• Amendment 33 was a request for modifications to the STCs governing the supplemental payment structure used to offset costs that Tennessee hospitals incur by providing uncompensated care. The State submitted Amendment 33 on February 7, 2018, and CMS was still reviewing the proposal as DY 16 concluded.
• Amendment 35 would allow the State to pay for short-term substance use disorder services in facilities classified as institutions for mental diseases for up to 30 days per admission. The State submitted Amendment 35 to CMS on May 25, 2018, and CMS was still reviewing the proposal as DY 16 concluded.
STC #10: On November 14, 2017, the State notified the public of its intention to host a public forum in which comments on the progress of the TennCare Demonstration would be accepted. The State held the forum on December 14, 2017, and included a summary of comments received there in the Quarterly Report submitted to CMS on March 1, 2018. STC #15: Public notice concerning demonstration amendments was provided to Tennessee newspapers and posted on TennCare’s website as follows:
• Demonstration Amendment 32: July 28, 2017 • Demonstration Amendment 33: December 1, 2017 • Demonstration Amendment 34: March 6, 2018 • Demonstration Amendment 35: April 20, 2018 • Demonstration Amendment 36: June 13, 2018
Amendments 34 and 36 were not submitted to CMS during DY 16. Amendment 34 identified program reductions that would be necessary if the Tennessee General Assembly did not renew the annual hospital assessment. The fee was ultimately renewed, however, thereby eliminating the need to submit Amendment 34 to CMS. Amendment 36 would allow the State to establish reasonable standards for providers of family planning services in the TennCare Demonstration. The State’s public notice and comment period regarding Amendment 36 had not concluded by the end of DY 16, meaning that submission to CMS would occur during DY 17. STC #29: TennCare’s “Cost-Effective Alternatives” policy—BEN 08-001—outlines services TennCare MCOs may provide as cost-effective alternatives to covered Medicaid services. The document is available on the TennCare website at https://www.tn.gov/content/dam/tn/tenncare/documents2/ben08001.pdf.
STC 29 requires the State to demonstrate annually that the use of CEAs is cost-effective and reimbursed in accordance with federal managed care regulations. With respect to this requirement, the State offers the following assurance:

With the exception of TennCare Select, all TennCare MCOs have entered a full risk agreement and are paid on a capitated basis. Incentives for risk MCOs are aligned in such a way that there is no logical reason an at-risk MCO would pay for a non-covered service unless it is determined to be a cost-effective alternative to a covered service.
All TennCare MCO Contracts require compliance with applicable policies and regulations—including the Special Terms and Conditions of the TennCare Demonstration—regarding utilization and payment of cost-effective alternative services. Further, in accordance with terms of the TennCare Select contract, the State is in receipt of a report demonstrating the use of TennCare-approved alternative services and their cost-effectiveness.
The MCO Contracts require and contain capitation payment rates that have been reviewed and certified by actuaries and have been determined to be actuarially sound. STC #31.d.ii: On May 1, 2018, the State submitted to CMS an enrollment target range for CHOICES Group 2 for Demonstration Year 17. The range was 9,400 – 10,500. STC #31.d.iv.(A): Each Quarterly Progress Report submitted during DY 16 provided data on enrollment in all three CHOICES groups, enrollment targets for CHOICES 2 and 3, and the number of reserve capacity slots being held for CHOICES Group 2. The operational procedures for determining individuals for whom CHOICES Group 2 reserve capacity slots are to be held are included as Attachment A. The State originally submitted these procedures to CMS on February 2, 2010, and has subsequently included the procedures as an attachment to each Draft Annual Report. STC #32.d.ii: On May 1, 2018, the State submitted to CMS enrollment target ranges for all three ECF CHOICES benefit groups for Demonstration Year 17. The range identified for Essential Family Supports (ECF CHOICES Group 4) was 875 – 900; the range identified for Essential Supports for Employment and Independent Living (ECF CHOICES Group 5) was 1,465 – 1,575; and the range identified for Comprehensive Supports for Employment and Community Living (ECF CHOICES Group 6) was 360 – 525. STC #32.d.iv.(A): Each Quarterly Progress Report submitted during DY 16 provided enrollment totals, enrollment targets, and the number of reserve capacity slots being held for all three ECF CHOICES groups. The operational procedures for determining individuals for whom ECF CHOICES reserve capacity slots are to be held are included as Attachment B. The State originally submitted these procedures to CMS on October 28, 2016, and has subsequently included the procedures as an attachment to each Draft Annual Report. STC #39: The State requested approval by CMS of Statewide MCO Contract Amendment 7 and TennCare Select Contract Amendment 42 on December 1, 2017. In addition, the State requested approval by CMS of Statewide MCO Contract Amendment 8 and TennCare Select Contract Amendment 43 on May 30, 2018. STC #42.b: A description of the steps taken to ensure compliance with the HCBS regulations identified in this STC is included as Attachment C. The State reviews—and, as needed, updates—this description each year and includes a copy with each Draft Annual Report. In accordance with the 2014 HCBS settings rule, the State submitted a statewide transition plan to CMS on February 1, 2016, and—based on CMS feedback—an amended version of the document on March 23, 2016. CMS approved the State’s transition plan on April 13, 2016.

STC #42.c.iv: The State submitted the document titled 2017 Update to the Quality Assessment and Performance Improvement Strategy to CMS on December 20, 2017. STC #42.d.iv: The State addressed data and trends of the designated CHOICES and ECF CHOICES data elements in each of the Quarterly Progress Reports and the Draft Annual Report. Electronic copies of the CHOICES point-in-time data and annual aggregate data were submitted to CMS on September 29, 2017, and June 29, 2018. Electronic copies of the ECF CHOICES point-in-time and annual aggregate data were submitted to CMS on June 29, 2018. STC #43: The State participated in formal Monthly Calls with CMS on October 26, 2017; January 25, 2018; March 22, 2018; April 26, 2018; May 31, 2018; and June 28, 2018. All other Monthly Calls were cancelled by joint agreement of CMS and the State. STC #44: The State submitted Quarterly Progress Reports to CMS on August 29, 2017; November 29, 2017; March 1, 2018; and May 30, 2018. STC #45: The State submitted a Draft Annual Report to CMS on October 27, 2017. In addition, the State submitted the annual report concerning Title XXI Medicaid Expansion Children to CMS on December 28, 2017. STC #46.b: Enrollment information was reported to CMS by Eligibility Group and Type in the Quarterly Progress Reports and the Draft Annual Report. STC #49: Member months were reported to CMS by Eligibility Group and Type in each Quarterly Progress Report. STC #54.c: On March 30, 2018, the State submitted to CMS a new distribution methodology for the uncompensated care payments that were scheduled to go into effect on July 1, 2018.

ATTACHMENT E
THE IMPACT OF TENNCARE: A SURVEY OF RECIPIENTS, 2017

Prepared by
LeAnn LunaProfessor, BCBER
Emily PrattResearch Associate, BCBER
September 2017
The Impact of TennCare
A Survey of Recipients, 2017

i
CONTENTS
METHOD ................................................................................................................................................................ 1
TABLE 1: Head of Household Age and Household Income ....................................................................................... 2
ESTIMATES FOR INSURANCE STATUS ..................................................................................................................... 2
TABLE 2: Statewide Estimates of Uninsured Populations (1997–2017) ................................................................... 3 TABLE 2a: Uninsured Tennesseans by Age (2004–2017) ......................................................................................... 3 FIGURE 1: Rate of Uninsured Populations (2004-2017) ........................................................................................... 4
REASONS FOR FAILURE TO OBTAIN MEDICAL INSURANCE ..................................................................................... 4
TABLE 3: Reasons for Not Having Insurance (1999–2017) (Percent) ....................................................................... 5 TABLE 4: “Cannot Afford” Major Reason for No Insurance: By Income (2007–2017) (Percent) ............................. 5
EVALUATIONS OF MEDICAL CARE AND INSURANCE COVERAGE............................................................................. 6
TABLE 5: Quality of Medical Care Received by Heads of Households (2007–2017) (Percent) ................................. 6 TABLE 6: Quality of Medical Care Received by Children of Heads of Households (2007–2017) (Percent) .............. 7
SATISFACTION WITH QUALITY OF CARE RECEIVED FROM TENNCARE .................................................................... 7
TABLE 7: Percent Indicating Satisfaction with TennCare (2003–2017) (Percent) .................................................... 7
BEHAVIOR RELEVANT TO MEDICAL CARE ............................................................................................................... 8
TABLE 8: Head of Household: Medical Facilities Used When Medical Care Initially Sought (2007-2017) (Percent) ............................................................................................................................... 8 TABLE 9: Children: Medical Facilities Used When Medical Care Initially Sought (2007-2017) (Percent) ................ 9 TABLE 10: Frequency of Visits to Doctor for Head of Household (2007–2017) (Percent)...................................... 10 TABLE 11: Frequency of Visits to Doctor for Children (2007–2017) (Percent) ....................................................... 10
APPOINTMENTS ................................................................................................................................................... 11
TABLE 12: Time between Attempt to Make Appointment and First Availability of Appointment: TennCare Heads of Household (2008–2017) (Percent) ......................................................................................... 11 TABLE 13: Wait for Appointments: TennCare Heads of Household (2007–2017) (Minutes) ................................. 12
TENNCARE PLANS ................................................................................................................................................ 12
TABLE 14: Reported TennCare Plan (2012–2017) (Percent) .................................................................................. 12 FIGURE 2: Reported TennCare Plan (2017) ............................................................................................................ 13 TABLE 15: Households Receiving TennCare Information from Plans (2008–2017) (Percent) ................................ 14 TABLE 16: Best Way to Get Information about TennCare (2008–2017) (Percent) ................................................. 14 FIGURE 3: Number of Times Sought Non-Emergency Care at a Non-Participating Provider in Past 12 Months (Percent) ................................................................................................................................................. 15 TABLE 17: Type of Non-Emergency Care Sought from a Non-TennCare Provider (2017) (Percent) ....................... 15 FIGURE 4: Type of Non-Emergency Care Sought from a Non-TennCare Provider (2017) ....................................... 16 TABLE 18: Reasons Sought Non-Emergency Care from a Non-TennCare Provider (2017) (Percent) ...................... 16
CONCLUSION ....................................................................................................................................................... 17

The Impact of TennCare: A Survey of Recipients, 2017
Method The Boyd Center for Business and Economic Research at the University of Tennessee, under contract with the Department of Finance and Administration of the State of Tennessee, conducted a survey of Tennessee residents to ascertain their insurance status and use of medical facilities and their level of satisfaction with the TennCare program. A target sample size of 5,000 households allows us to obtain accurate estimates for subpopulations. The Boyd Center prepared the survey instrument in cooperation with personnel from the Division of TennCare.
The University of Tennessee Social Work Office of Research and Public Service (SWORPS) conducted the survey by randomly selecting potential respondents from a land line and cell phone set of numbers and contacting those families between May and July 2017. 1 Up to five calls were made to each residence, at staggered times, to minimize non-response bias. The design chosen was a “Household Sample,” and the interview was conducted with the head of the household. When Hispanic households without an English speaker were reached, a person fluent in Spanish would call the household at a later time to conduct the survey.
Approximately 44.9 percent of both those who answered their land line phone or cell phone were willing to participate in the survey but only 33.3 percent qualified to participate.2 The large sample size allowed for the weighting of responses by income and age to provide unbiased estimates for the entire population. For all statewide estimates, a correction factor was used to adjust for the degree to which the sample over- or under-represented Tennesseans grouped by household income and head of household age.3 (Table 1)
This is a follow-up to previous surveys of 5,000 Tennessee households conducted annually since 1993, the last year of Medicaid before Tennessee adopted TennCare. Throughout this report, we make comparisons to findings from earlier surveys.
1 Beginning this year, SWORPS supplemented random dialing with calls to a web panel of respondents. These respondents previously provided some basic information such as age and income and were contacted to balance the distribution of responses across age and income combinations.2In the land line phone sample, there were 4,067 completed surveys, 6,456 refusals, and 1,196 who did not qualify. In the cell phone sample, there were 410 completed surveys, 921 refusals, and 340 who did not qualify. An individual will not qualify to participate if he/she is not a head of household or a Tennessee resident. 3 Starting with the 2016 report, the 5-year American Community Survey (ACS) conducted by the U.S. Census is used to adjust the sample by household income and head of household age. The ACS is a nationwide survey designed to provide reliable and timely estimates of the demographic, social, economic and housing characteristics of the US population.
1

TABLE 1: Head of Household Age and Household Income
Age-Householders Proportion in 2017
Survey (Percent) Proportion in ACS*
(Percent) Deviation (Percent)
Under 25 5.2 4.4 -0.8
25-44 31.8 33.1 1.3 45-64 44.6 39.4 -5.2 65+ 18.4 23.1 4.7
Household Income Level Proportion in 2017
Survey (Percent)4 Proportion in ACS*
(Percent) Deviation (Percent)
Less than $10,000 8.5 8.6 0.1
$10,000 to $14,999 7.2 6.3 -0.9 $15,000 to $19,999 6.1 6.3 0.2 $20,000 to $29,999 10.8 12.3 1.5 $30,000 to $39,999 8.2 11.2 3.0
$40,000 to $49,999 7.8 9.5 1.7 $50,000 to $59,999 7.8 8.2 0.4 $60,000 to $99,999 18.0 20.9 2.9 $100,000 to $149,999 10.1 10.2 0.1 $150,000 and over 7.1 6.5 -0.6
*Census Bureau, 2011-2015 American Community Survey 5-year Estimates.
Estimates for Insurance Status Estimates for the number of Tennesseans who are uninsured are presented below (Table 2 and Figure 1). These statewide estimates are extrapolated from the weighted sample. The estimated population of uninsured represents 6.0 percent of the 6,651,194 Tennessee residents.5 The percent of uninsured adults increased from 6.6 percent in 2016 to 7.4 percent in 2017. The level of uninsured adults increased by approximately 41,200 since 2016. The uninsured rate for children in 2017 is 1.5 percent, which is lower than last year’s rate of 1.8 percent (Table 2a). The estimate of the number of uninsured children in 2017 is 22,009, similar to 2015 levels.
4 Amounts do not total 100 percent because 8.4 percent either did not know or declined to answer. 5 Population estimates are found using United States Census Bureau Population Estimates. In prior years (1993 to 2008), population figures were gathered from the “Interim State Population Projections,” also prepared by the United States Census Bureau.
2

TABLE 2: Statewide Estimates of Uninsured Populations (1997–2017)
1997 1998 1999 2000 2001 2002 2003
State Total 319,079 335,612 387,584 372,776 353,736 348,753 371,724
Percent 6.1 6.2 7.2 6.5 6.2 6.1 6.4
2004 2005 2006 2007 2008 2009 2010
State Total 387,975 482,353 649,479 608,234 566,633 616,967 618,445
Percent 6.6 8.1 10.7 10 9.3 10 9.9
2011 2012 2013 2014 2015 2016 2017
State Total 604,222 577,813 611,368 472,008 426,301 364,732 400,691
Percent 9.5 9.2 9.6 7.2 6.6 5.5 6.0
TABLE 2a: Uninsured Tennesseans by Age (2004–2017)
2004 2005 2006 2007 2008 2009 2010
Under 18 Total
67,772 72,387 82,484 70,096 72,258 54,759 57,912
Under 18 Percent
4.9 5 5.7 4.8 4.9 3.7 3.9
18+ Total 320,203 409,965 566,955 538,138 494,375 562,208 560,532
18+ Percent 7.2 9.1 12.1 11.7 10.6 11.9 12
2011 2012 2013 2014 2015 2016 2017
Under 18 Total
35,743 40,700 55,319 36,104 21,959 27,226 22,009
Under 18 Percent
2.4 2.7 3.7 2.4 1.5 1.8 1.5
18+ Total 568,479 537,113 556,049 435,904 404,342 337,506 378,682
18+ Percent 12 11.2 11.4 8.7 8.2 6.6 7.4
3

FIGURE 1: Rate of Uninsured Populations (2004-2017)
Reasons for Failure to Obtain Medical Insurance Affordability is the primary reason the surveyed uninsured failed to obtain insurance, with more than three-quarters of all respondents citing “cannot afford” as a major reason and 9 percent citing affordability as a minor reason. Those saying unaffordability was not a reason for failing to obtain insurance fell from 16 percent in 2016 to 13 percent in 2017 (Table 3) and the percentage citing affordability has been declining since 2008. Respondents in the less than $20,000 income bracket are most likely to cite affordability as a major reason for their uninsured status, but this percentage dropped from 86 percent in 2016 to 80 percent in 2017 but the percentage has been falling across all income brackets (Table 4).
6.6
8.1
10.7
10
9.3
10 9.99.5
9.29.6
7.26.6
5.56.0
0
2
4
6
8
10
12
2004 2005 2006 2007 2008 2009 2010 2011 2012 2013 2014 2015 2016 2017
Rate
(Per
cent
)
4

TABLE 3: Reasons for Not Having Insurance (1999–2017) (Percent)6
Reason Cannot Afford Did Not Get to It Do Not Need
Year Major Reason
Minor Reason
Not a Reason
Major Reason
Minor Reason
Not a Reason
Major Reason
Minor Reason
Not a Reason
1999 71 10 19 15 22 63 10 16 74
2000 76 8 16 6 21 73 7 12 81
2001 78 9 13 11 20 69 12 16 72
2002 74 10 17 11 16 74 8 14 78
2003 82 8 10 10 20 70 8 15 77
2004 82 7 11 8 19 73 8 16 76
2005 82 7 10 9 16 75 8 15 77
2006 87 4 9 12 14 74 12 14 74
2007 89 6 4 9 11 79 5 13 82
2008 93 4 4 7 11 82 5 8 87
2009 92 3 4 3 15 81 5 10 85
2010 91 5 4 5 13 82 6 15 80
2011 88 5 7 11 12 77 8 12 79
2012 88 5 7 9 13 78 7 13 80
2013 83 6 11 9 17 74 5 16 79
2014 86 6 8 11 15 75 12 14 74
2015 83 7 10 9 13 77 9 10 80
2016 80 5 16 16 10 73 17 13 70
2017 78 9 13 11 15 74 13 13 74
TABLE 4: “Cannot Afford” Major Reasons for No Insurance: By Income (2012–2017) (Percent)
Household Income 2012 2013 2014 2015 2016 2017 Less than $20,000 90 87 90 89 86 80 $20,000 - $39,999 89 82 82 78 69 75 $40,000 and above 81 74 82 66 79 42
6 A number of people in this table did not report income. Results in Table 4 omit those respondents.
5

Evaluations of Medical Care and Insurance Coverage Tennessee residents’ perception about the quality of care received remains consistent with their perceptions during the last decade. Overall, 78 percent of all heads of households and 73 percent of TennCare heads of households rated the quality of care as “good” or “excellent,” (Table 5). Over the past 10 years, the percentage of families on TennCare reporting “good” or “excellent” care has ranged from a low of 65 percent in 2010 to a high of 76 percent in 2009. Satisfaction levels in 2016 and 2017 were near the 2009 level. Importantly, the rating by all heads of households has been consistent, reflecting strong stability in their perceptions about their quality of care.
Heads of households rate the quality of care received by children consistently high. In 2017, 88 percent of all heads of households and 87 percent of TennCare households rated their children’s quality of care as “excellent” or “good” (Table 6). Three percent of TennCare families with children rate the quality of care as “poor,” up from 1 percent in 2016, but very consistent with findings during the past decade.
TABLE 5: Quality of Medical Care Received by Heads of Households (2007–2017) (Percent)
All Heads of Households 2007 2008 2009 2010 2011 2012 2013 2014 2015 2016 2017
Excellent 28 28 32 32 31 30 32 31 32 33 33
Good 47 46 46 46 46 46 46 47 46 45 45
Fair 18 18 16 16 15 17 16 16 17 17 17
Poor 7 8 6 6 7 7 6 6 5 5 5 Heads of Households w/ TennCare 2007 2008 2009 2010 2011 2012 2013 2014 2015 2016 2017
Excellent 23 24 29 24 30 24 24 25 28 31 27
Good 44 43 47 41 41 45 44 45 42 43 46
Fair 27 25 18 29 19 22 24 22 24 23 22
Poor 6 8 6 6 10 9 8 8 6 3 5
6

TABLE 6: Quality of Medical Care Received by Children of Heads of Households (2007–2017) (Percent)
All Heads of Households 2007 2008 2009 2010 2011 2012 2013 2014 2015 2016 2017 Excellent 35 34 39 46 44 42 43 41 45 46 43
Good 48 51 49 43 45 45 43 48 44 42 45
Fair 12 11 9 9 9 10 10 9 8 10 10
Poor 4 4 3 3 2 3 4 2 3 2 2 Heads of Households w/ TennCare7 2007 2008 2009 2010 2011 2012 2013 2014 2015 2016 2017 Excellent 30 32 41 43 48 38 35 38 41 43 39
Good 49 49 48 45 39 42 45 49 46 44 48
Fair 19 14 8 6 11 14 14 10 9 12 10
Poor 2 6 3 6 2 6 6 3 4 1 3
Satisfaction with Quality of Care Received from TennCare TennCare recipients continue to show high levels of satisfaction with the TennCare program as a whole. (Table 7) The percentage of respondents who indicated they were “very satisfied” or “somewhat satisfied,” increased from 92 percent in 2016 to 95 percent in 2017. 8 The satisfaction level has stayed within a narrow range since 2009, fluctuating only between 92 percent and 95 percent.
TABLE 7: Percent Indicating Satisfaction with TennCare (2003–2017) (Percent)
2003 2004 2005 2006 2007 2008 2009 2010 2011 2012 2013 2014 2015 2016 2017 83 90 93 87 90 89 92 94 95 93 95 93 95 92 95
7 This subgroup includes all households in which at least one child is enrolled in TennCare, even if the head of the household is not enrolled. 8 A three-point scale was used, and respondents could indicate “very satisfied,” “somewhat satisfied,” or “not satisfied.”
7

Behavior Relevant to Medical Care Each respondent was asked a series of questions regarding his or her behavior when initially seeking medical care (Table 8). There was no substantial change in the behavior among all heads of households from last year. Ninety-five percent of all heads of households sought care first at a doctor’s office or clinic while 91 percent of TennCare heads of household reported the same behavior, down from 96 percent in 2016. The TennCare decrease is entirely due to a smaller percent first seeking care at a clinic. Approximately 7 percent of TennCare households initially sought care at a hospital, similar to pre-2016 levels (Table 8). Consistent with prior years, 97 percent of all households and 96 percent of TennCare households sought initial care for children at a doctor’s office or a clinic (Table 9).
TABLE 8: Head of Household: Medical Facilities Used When Medical Care Initially Sought
(2007-2017) (Percent)
All Heads of Households 2007 2008 2009 2010 2011 2012 2013 2014 2015 2016 2017 Doctor's Office 83 83 83 82 83 82 81 81 81 80 80
Clinic 11 11 12 12 12 13 13 14 15 16 15
Hospital 4 4 4 4 4 4 4 3 3 3 3
Other 2 2 2 2 2 1 2 2 1 1 2
Heads of Households w/ TennCare 2007 2008 2009 2010 2011 2012 2013 2014 2015 2016 2017 Doctor's Office 79 80 83 77 80 75 80 72 76 78 79
Clinic 15 13 12 15 11 14 14 18 18 18 12
Hospital 4 6 4 7 8 10 6 8 6 3 7
Other 2 <1 1 <1 2 1 <1 2 0 1 2
8

TABLE 9: Children: Medical Facilities Used When Medical Care Initially Sought (2007-2017) (Percent)
All Heads of Households 2007 2008 2009 2010 2011 2012 2013 2014 2015 2016 2017
Doctor's Office 88 88 86 87 88 88 86 87 86 85 84
Clinic 9 10 10 11 9 10 12 12 12 13 13
Hospital 2 2 3 2 2 2 1 1 1 1 2
Other 1 <1 <1 <1 <1 <1 1 <1 <1 <1 <1
Heads of Households w/ TennCare9 2007 2008 2009 2010 2011 2012 2013 2014 2015 2016 2017
Doctor's Office 83 83 85 82 84 86 84 84 83 86 85
Clinic 14 14 15 15 7 11 12 14 14 12 11
Hospital 3 3 0 3 9 3 3 1 3 2 4
Other 0 <1 0 0 0 0 <1 1 0 <1 0
TennCare recipients continue to report seeing physicians on a more frequent basis than the average Tennessee household (Table 10). Approximately 14 percent of all households report seeing a doctor at least weekly or monthly compared to 33 percent of TennCare heads of households.
Similar trends are observed among children, with 8 percent of all households taking their children to visit a doctor at least weekly or monthly compared to 17 percent of all TennCare households (Table 11).
9 This subgroup includes the children of heads of households enrolled in TennCare.
9

TABLE 10: Frequency of Visits to Doctor for Head of Household (2007–2017) (Percent)
All Heads of Households 2007 2008 2009 2010 2011 2012 2013 2014 2015 2016 2017
Weekly 2 3 2 2 2 1 2 2 2 2 2
Monthly 13 12 12 11 11 11 11 11 11 12 12
Every Few Months 46 46 49 45 44 46 46 47 46 44 46
Yearly 23 22 22 24 25 25 24 25 25 26 26
Rarely 16 17 15 18 17 17 17 15 16 16 14
Heads of Households w/ TennCare 2007 2008 2009 2010 2011 2012 2013 2014 2015 2016 2017
Weekly 8 7 6 6 6 4 5 6 3 5 5
Monthly 33 33 30 29 26 31 34 31 26 31 28
Every Few Months 45 47 51 47 46 43 43 45 49 42 42
Yearly 6 8 7 7 10 8 8 11 9 10 14
Rarely 8 4 6 12 11 14 10 8 13 12 11
TABLE 11: Frequency of Visits to Doctor for Children (2007–2017) (Percent)
All Heads of Households 2007 2008 2009 2010 2011 2012 2013 2014 2015 2016 2017 Weekly 2 2 1 2 1 1 1 1 1 1 1
Monthly 11 9 9 9 10 8 9 9 7 8 7 Every Few Months 50 50 51 51 50 50 52 47 47 44 48
Yearly 27 29 31 29 31 35 30 35 36 38 36
Rarely 10 10 8 9 8 6 8 8 8 9 8 Heads of Households w/ TennCare10 2007 2008 2009 2010 2011 2012 2013 2014 2015 2016 2017 Weekly 4 1 1 3 1 0 1 2 1 3 3
Monthly 14 16 18 13 15 15 19 17 13 12 14 Every Few Months 54 55 50 51 55 58 53 53 51 53 48
Yearly 16 21 27 24 25 22 25 25 28 29 31
Rarely 11 7 4 10 4 5 2 2 5 3 4
10 This subgroup includes the children of heads of households enrolled in TennCare.
10

Appointments The reported time required to obtain an appointment is comparable to previous years’ findings. Approximately 71 percent of TennCare recipients obtained a doctor’s appointment within a week, and 42 percent obtained an appointment within one day (Table 12). The average wait time once TennCare patients arrived at their appointments was 42 minutes, the shortest during the past decade. The average travel time to a physician’s office was 22 minutes. The travel time is similar to times reported in prior years (Table 13).
TABLE 12: Time between Attempt to Make Appointment and First Availability of Appointment: TennCare Heads of Household (2008–2017) (Percent)
When you last made an appointment to see a primary care physician for an illness, in the last 12 months, how soon was the first appointment available? 2008 2009 2010 2011 2012 2013 2014 2015 2016 2017
Same day 21 18 20 21 20 18 18 24 19 21
Next day 17 23 19 19 21 25 21 18 22 21
1 week 27 25 29 30 25 23 29 26 28 29
2 weeks 10 9 11 10 14 10 8 8 9 9
3 weeks 4 4 4 4 2 4 6 3 4 5
Over 3 weeks 22 20 17 16 18 20 19 21 18 15
11

TABLE 13: Wait for Appointments: TennCare Heads of Household (2007–2017) (Minutes)
2007 2008 2009 2010 2011 2012 2013 2014 2015 2016 2017
Number of minutes wait past scheduled appointment time?
57 50 52 65 58 58 51 53 63 52 42
Number of minutes to travel to physician's office?
21 25 24 31 23 22 22 22 27 24 22
TennCare Plans The largest number of TennCare survey household members (36 percent) report being signed up with Volunteer State Health Plan (VSHP). UnitedHealthcare accounts for 31 percent, followed by Amerigroup with 21 percent and TennCare Select with 9 percent. Although there are no other active TennCare plans, 3 percent indicate they are represented by some plan other than these four listed. VSHP saw the greatest shift (8 percent decrease), the majority of which represented changes to Amerigroup (2 percent increase) and TennCare Select (6 percent increase).
TABLE 14: Reported TennCare Plan (2012–2017) (Percent)
What company manages your TennCare plan? 2012 2013 2014 2015 2016 2017 Amerigroup 20 17 19 20 19 21
TennCare Select 6 5 4 4 3 9 UnitedHealthcare Community Plan (formerly AmeriChoice) 37 41 42 33 30 31
VSHP – BlueCare 33 30 30 36 44 36
Other 4 7 5 7 4 3
12

FIGURE 2: Reported TennCare Plan (2017)
About four out of five TennCare heads of households’ report knowing the name of the managed care organization (MCO) they are assigned to and 71 percent of them report receiving an enrollment card – an increase from 67 percent in 2016 (Table 15). The proportion of households receiving information about filing appeals and a list of patients’ rights and responsibilities was 76 percent and 82 percent, respectively. These results are consistent with recent trends.
The ways that TennCare households report receiving information about the program are very similar to those reported in 2016. Postal mail remains the preferred method for receiving information about TennCare, with 72 percent reporting it was the best way (Table 16). Approximately 10 percent prefer to receive communication electronically by email or through online resources.
Amerigroup21%
TennCar Select9%
UnitedHealthcareCommunity Plan
31%
VSHP-BlueCare36%
Other3%
13

TABLE 15: Households Receiving TennCare Information from Plans (2008–2017) (Percent)
Please indicate whether or not you or anyone in your household has received each of the following regarding TennCare 2008 2009 2010 2011 2012 2013 2014 2015 2016 2017 An enrollment card 78 77 74 61 62 69 63 69 67 71
Information on filing grievances 41 41 43 29
Information on filing appeals11 73 76 70 82 76 76
A list of rights and responsibilities 73 75 74 68 80 82 78 85 81 82
Name of MCO to whom assigned 79 79 79 76 79 76 76 84 81 81
TABLE 16: Best Way to Get Information about TennCare (2008–2017) (Percent)
2008 2009 2010 2011 2012 2013 2014 2015 2016 2017 Mail 73 71 72 78 80 74 75 78 78 72
Doctor 5 6 5 5 6 9 5 4 5 6
Phone 11 10 11 5 4 6 6 8 4 5
Handbook 6 7 5 6 5 4 4 3 2 4 Drug Store 1 1 <1 <1 <1 <1 <1 <1 <1 <1
Friends <1 1 1 2 <1 <1 <1 <1 <1 <1
TV 1 <1 <1 <1 <1 <1 <1 <1 <1 <1
Paper <1 1 <1 0 <1 <1 <1 0 <1 <1
Email 5 6
Website 4 4
Other 4 3 3 4 4 4 6 8 <1 <1
Six percent of respondents indicated that either they or someone else in their family had changed plans within the preceding 12 months. Of that total, 72 percent requested the change. The most commonly cited reason for changing plans was “limited choice of doctors and hospitals.”
In the past 12 months, 10 percent of TennCare families used a non-emergency care provider that did not participate in their plan, with nearly six out of 10 of this population only using non-participating providers one to two times (Figure 3). Of the 10 percent of TennCare households using non-participating providers, the most common type of care sought was from a general medical care/family doctor (47 11Before 2012, survey respondents were asked whether they had received “information on filing grievances.” The term “appeals” is much more widely used in the TennCare program than the term “grievances.” Therefore, the question was changed in 2012 to ask whether respondents had received “information on filing appeals.”
14

percent) followed by dental care (37 percent) (Table 17 and Figure 4). Approximately 36 percent of survey responders who sought care from a non-TennCare provider stated that they did so because the service was not covered under TennCare, while only 5 percent stated that they were dissatisfied with the quality of service from the TennCare provider (Table 18). Over half of the respondents (53 percent) reported that TennCare helped them find a provider that participated in the TennCare plan.
FIGURE 3: Number of Times Sought Non-Emergency Care at a Non-Participating Provider in Past 12 Months (Percent)
TABLE 17: Type of Non-Emergency Care Sought from a Non-TennCare Provider (2017) (Percent)
2017
Eye Care 27
Dental Care 37
General Medical Care Specialist 47
Non-Surgical Specialist 26
Surgical Specialist 18
Not Sure 3 Respondents could choose more than one type of non-emergency care.
Did not Seek Non-Emergency Care at a Non-Participating
Provider90%
1-2 Times57%
3-4 Times31%
5+ Times12%Sought Non-Emergency Care at a Non-
Participating Provider10%
15
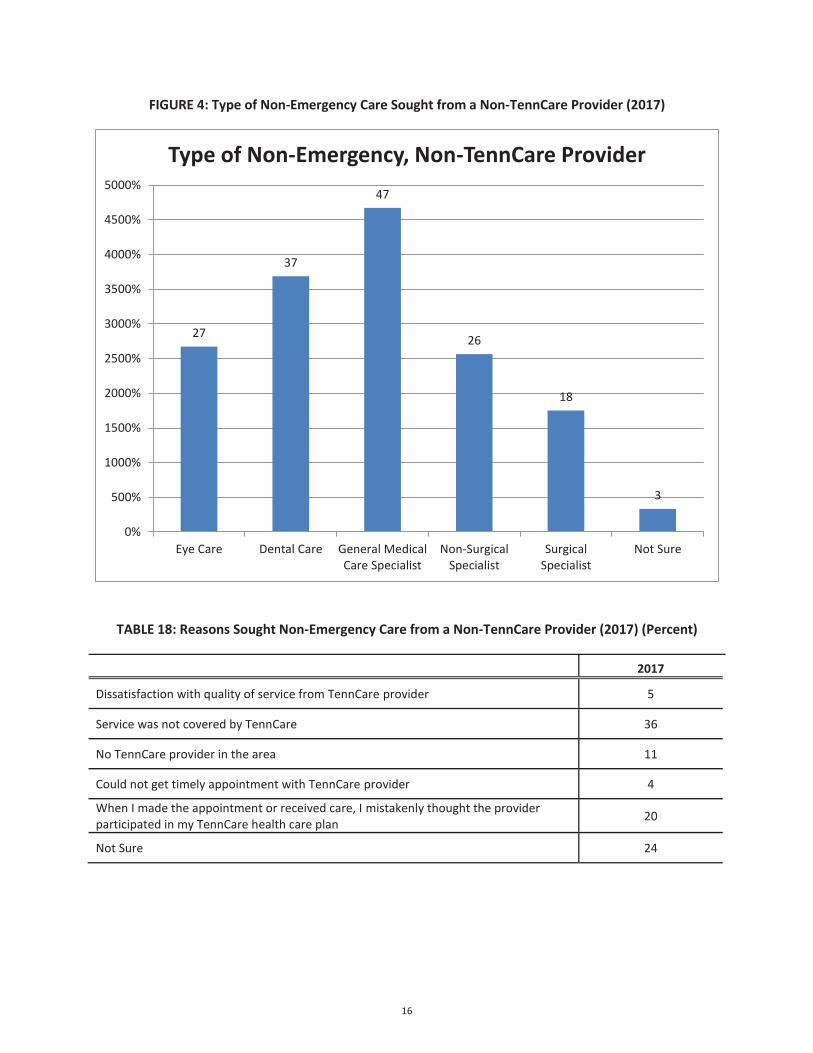
FIGURE 4: Type of Non-Emergency Care Sought from a Non-TennCare Provider (2017)
TABLE 18: Reasons Sought Non-Emergency Care from a Non-TennCare Provider (2017) (Percent)
2017
Dissatisfaction with quality of service from TennCare provider 5
Service was not covered by TennCare 36
No TennCare provider in the area 11
Could not get timely appointment with TennCare provider 4
When I made the appointment or received care, I mistakenly thought the provider participated in my TennCare health care plan 20
Not Sure 24
27
37
47
26
18
3
0%
500%
1000%
1500%
2000%
2500%
3000%
3500%
4000%
4500%
5000%
Eye Care Dental Care General MedicalCare Specialist
Non-SurgicalSpecialist
SurgicalSpecialist
Not Sure
Type of Non-Emergency, Non-TennCare Provider
16

Conclusion The positive trends in recent years regarding the rate of uninsured and the overall satisfaction in TennCare recipients continued with this survey, Tennessee’s overall uninsured rate in 2017 is 6.0 percent. The rate is an increase from the 2016 rate of 5.5 percent, but it is still one of the lowest rates in two decades. In 2017, the proportion of uninsured children decreased from 1.8 percent in 2016 to 1.5 percent, while the proportion of uninsured adults increased from 6.6 percent in 2016 to 7.4 percent. The increase in uninsured adults represents more than 40,000 Tennesseans.
Affordability continues to be the major reason cited for not having insurance. The percentage of people citing affordability has steadily fallen over time and across all income brackets. TennCare enrollees (91 percent) are somewhat less likely than all households (95 percent) to seek initial care at a doctor’s office or clinic. There continues to be a trend in both TennCare heads of households and their children to have more doctor visits than the general population.
Overall, TennCare continues to receive positive feedback from its recipients, with 95 percent reporting satisfaction with the program. This positive feedback is a strong indication that TennCare is providing satisfactory medical care and meeting the expectations of those it serves.
17

ATTACHMENT F
2017 ANNUAL HEDIS/CAHPS REPORT: COMPARATIVE ANALYSIS OF AUDITED RESULTS FROM TENNCARE MANAGED CARE ORGANIZATIONS

2017 Annual
HEDIS/CAHPS ReportComparative Analysis of Audited Results from TennCare MCOs
August 2017

2017 HEDIS/CAHPS REPORT
page 2TennCare 17.EQRO.06.017
Table of ContentsList of Tables..............................................................4 List of Figures ............................................................6 Acknowledgements, Acronyms and Initialisms ........10 Executive Summary..................................................13 Background..............................................................14
HEDIS Measures—Domains of Care .......................14 Effectiveness of Care Measures .............................14 Prevention and Screening......................................... 15 Respiratory Conditions............................................. 17 Cardiovascular Conditions ........................................ 18 Diabetes ................................................................ 18 Musculoskeletal Conditions ....................................... 19 Behavioral Health.................................................... 19 Medication Management........................................... 21 Overuse/Appropriateness ......................................... 21 Measures Collected Through CAHPS Health Plan Survey 22 Access/Availability of Care Measures....................22 Utilization and Risk-Adjusted Utilization ..................24 Experience of Care ................................................25 CAHPS Health Plan Survey 5.0H Adult Version (CPA) and 5.0H Child Version (CPC) ......................................... 25 Children With Chronic Conditions (CCC) ..................... 26 Health Plan Descriptive Information Measures .....27 Measures Collected Using Electronic Clinical Data
Systems (ECDS) .................................................27
Medicaid Results ......................................................28 Statewide Performance.........................................28 Individual Plan Performance—HEDIS Measures ....37 Individual Plan Performance—CAHPS....................47
Medicaid HEDIS Trending—Statewide Weighted Rates.....................................................................51 Effectiveness of Care Measures..................................52
Prevention and Screening ..................................52 Respiratory Conditions ......................................62 Cardiovascular Conditions ..................................67 Diabetes..........................................................69 Musculoskeletal Conditions.................................71 Behavioral Health .............................................72 Medication Management ....................................76 Overuse/Appropriateness...................................77
Access/Availability of Care Measures ..........................79 Utilization Measures .................................................84
CHIP HEDIS/CAHPS Results.....................................85 APPENDIX A | Utilization Measure Medicaid Results and
Benchmarks ........................................................ A-1 Utilization Additional Measure Descriptions ........ A-1 Utilization Measures: Medicaid Plan-Specific
Rates/National Benchmarks............................. A-3 APPENDIX B | HEDIS 2016 National Medicaid Means
and Percentiles ................................................... B-1 APPENDIX C | MCO Medicaid Population in Member
Months ................................................................ C-1 APPENDIX D | Measure Reporting Options................D-1

2017 HEDIS/CAHPS REPORT
Table of Contents
page 3TennCare 17.EQRO.06.017
APPENDIX E | Additional CHIP Measures, Frequencies, and Population by Member Months ..................... E-1 Additional Utilization Measures: CHIP Plan-Specific
Rates................................................................ E-1 Utilization Measures: CHIP—Antibiotic Utilization:
Total (ABX) ...................................................... E-5 Health Plan Descriptive Information ................. E-10 HPA Population in CHIP Member Months........... E-10

2017 HEDIS/CAHPS REPORT
page 4TennCare 17.EQRO.06.017
List of TablesTable CIS. Combination Vaccinations for Childhood Immunization Status (CIS) .................................................................16
Table 1a. HEDIS 2017 State to National Medicaid Rates: Effectiveness of Care Measures....................................................29
Table 1b. HEDIS 2017 State to National Medicaid Rates: Measures Where Lower Rates Indicate Better Performance .................34
Table 2. HEDIS 2017 State to National Medicaid Rates: Access/Availability of Care Measures ..............................................35
Table 3. HEDIS 2017 State to National Medicaid Rates: Utilization Measures.....................................................................36
Table 4. HEDIS 2017 Rating Color and Measure Designations .........................................................................................37
Table 5a. HEDIS 2017 Plan-Specific Medicaid Rates: Effectiveness of Care Measures .........................................................38
Table 5b. HEDIS 2017 Plan-Specific Medicaid Rates: Effectiveness of Care Measures Where Lower Rates Indicate Better Performance......................................................................................................................................................45
Table 6. HEDIS 2017 Plan-Specific Medicaid Rates: Access/Availability of Care Measures....................................................45
Table 7. HEDIS 2017 Plan-Specific Medicaid Rates: Utilization Measures ..........................................................................47
Table 8. 2017 CAHPS Rating Color and Measure Designations.........................................................................................47
Table 9. 2017 CAHPS 5.0H Adult Medicaid Survey Results..............................................................................................48
Table 10. 2017 CAHPS 5.0H Child Medicaid Survey Results (General Population)...............................................................49
Table 11. 2017 CAHPS 5.0H Child Medicaid Survey Results (Children with Chronic Conditions) ............................................50
Table 12. HEDIS 2017 CHIP Rates..............................................................................................................................85
Table 13. HEDIS 2017 CHIP Rates Where Lower Rates Indicate Better Performance...........................................................88
Table 14. 2017 CAHPS 5.0H Child CHIP Survey Results (General Population) ....................................................................89
Table 15. 2017 CAHPS 5.0H Child CHIP Survey Results (Children with Chronic Conditions) .................................................89
Table A. HEDIS 2017 Medicaid Plan-Specific Rates with HEDIS 2016 National Benchmarks: Utilization Measures.................. A-3
Table B. HEDIS 2016 National Medicaid Means and Percentiles ..................................................................................... B-1
Table C1. HEDIS 2017 MCO Medicaid Population Reported in Member Months by Age and Sex—AG.................................... C-1
Table C2. HEDIS 2017 MCO Medicaid Population Reported in Member Months by Age and Sex—BC and TCS ....................... C-2
Table C3. HEDIS 2017 MCO Medicaid Population Reported in Member Months by Age and Sex—UHC.................................. C-4
Table D. 2017 Measure reporting options: Administrative/Hybrid .................................................................................. D-1

2017 HEDIS/CAHPS REPORT
List of Tables
page 5TennCare 17.EQRO.06.017
Table E1. HEDIS 2017 Utilization Measures: CHIP—FPC and W15.................................................................................. E-1
Table E2. HEDIS 2017 Utilization Measures: CHIP—Frequency of Selected Procedures (FSP) ............................................. E-1
Table E3. HEDIS 2017 Utilization Measures: CHIP—Ambulatory Care: Total (AMB) .......................................................... E-2
Table E4a. HEDIS 2017 Utilization Measures: CHIP—Inpatient Utilization General Hospital/Acute Care: Total (IPU) .............. E-2
Table E4b. HEDIS 2017 Utilization Measures: CHIP—Inpatient Utilization General Hospital/Acute Care: Total (IPU) ................. E-3
Table E5. HEDIS 2017 Utilization Measures: CHIP—Total IAD and Total MPT Rates .......................................................... E-3
Table E6. HEDIS 2017 Utilization Measures: CHIP—Antibiotic Utilization......................................................................... E-5
Table E7. HEDIS 2017 Utilization Measures: CHIP—Antibiotics of Concern Utilization........................................................ E-7
Table E8. HEDIS 2017 Utilization Measures: CHIP—All Other Antibiotics Utilization .......................................................... E-8
Table E8. HEDIS 2017 Utilization Measures: CHIP—Standardize Healthcare-Associated Infection Ratio (HAI)....................... E-9
Table E9. Board Certification (BCR) .........................................................................................................................E-10
Table E10. HPA CHIP Population in Member Months ...................................................................................................E-10

2017 HEDIS/CAHPS REPORT
page 6TennCare 17.EQRO.06.017
List of FiguresFig. 1. Adult BMI Assessment (ABA) .................. 52
Fig. 2. Weight Assessment and Counseling for Nutrition and Physical Activity for Children/Adolescents (WCC)— BMI Percentile: 3–11 years ........................... 52
Fig. 3. WCC—BMI Percentile: 12–17 years.......... 52
Fig. 4. WCC—BMI Percentile: Total .................... 52
Fig. 5. WCC—Counseling for Nutrition: 3–11 years................................................... 53
Fig. 6. WCC—Counseling for Nutrition: 12–17 years................................................... 53
Fig. 7. WCC—Counseling for Nutrition: Total ....... 53
Fig. 8. WCC—Counseling for Physical Activity: 3–11 years................................................... 53
Fig. 9. WCC—Counseling for Physical Activity: 12–17 years .............................................. 54
Fig. 10. WCC—Counseling for Physical Activity: Total ................................................... 54
Fig. 11. Childhood Immunization Status (CIS): DTap ................................................... 54
Fig. 12. CIS: IPV .............................................. 54
Fig. 13. CIS: MMR............................................. 55
Fig. 14. CIS: HiB .............................................. 55
Fig. 15. CIS: HepB............................................ 55
Fig. 16. CIS: VZV ............................................. 55
Fig. 17. CIS: PCV.............................................. 56
Fig. 18. CIS: HepA............................................ 56
Fig. 19. CIS: RV ............................................... 56
Fig. 20. CIS: Flu ............................................... 56
Fig. 21. CIS: Combination 2 ............................... 57
Fig. 22. CIS: Combination 3 ............................... 57
Fig. 23. CIS: Combination 4 ............................... 57
Fig. 24. CIS: Combination 5 ............................... 57
Fig. 25. CIS: Combination 6 ............................... 58
Fig. 26. CIS: Combination 7 ............................... 58
Fig. 27. CIS: Combination 8 ............................... 58
Fig. 28. CIS: Combination 9 ............................... 58
Fig. 29. CIS: Combination 10 ............................. 59
Fig. 30. Immunizations for Adolescents (IMA): Meningococcal ...................................... 59
Fig. 31. IMA: Tdap/Td ....................................... 59
Fig. 32. HPV: Adolescents .................................. 59
Fig. 33. IMA: Combination 1............................... 60
Fig. 34. Lead Screening in Children (LSC) ............ 60
Fig. 35. Breast Cancer Screening (BCS) ............... 60
Fig. 36. Cervical Cancer Screening (CCS) ............. 60
Fig. 37. Chlamydia Screening in Women (CHL): 16–20 years .............................................. 61
2017 HEDIS/CAHPS REPORT
List of Figures
page 7TennCare 17.EQRO.06.017
Fig. 38. CHL: 21–24 years ................................. 61
Fig. 39. CHL: Total............................................ 61
Fig. 40. Appropriate Testing for Children With Pharyngitis (CWP) ................................. 62
Fig. 41. Use of Spirometry Testing in the Assessment and Diagnosis of COPD (SPR).................. 62
Fig. 42. Pharmacotherapy Management of COPD Exacerbation (PCE): Systemic Corticosteroid ....................................... 62
Fig. 43. PCE: Bronchodilator............................... 62
Fig. 44. Medication Management for People With Asthma (MMA)—Medication Compliance 50%: 5–11 years .................................. 63
Fig. 45. MMA—Medication Compliance 50%: 12–18 years................................................... 63
Fig. 46. MMA—Medication Compliance 50%: 19-50 years................................................... 63
Fig. 47. MMA—Medication Compliance 50%: 51–64 years................................................... 63
Fig. 48. MMA—Medication Compliance 50%: Total . 64
Fig. 49. MMA—Medication Compliance 75%: 5–11 years................................................... 64
Fig. 50. MMA—Medication Compliance 75%: 12–18 years................................................... 64
Fig. 51. MMA—Medication Compliance 75%: 19–50 years................................................... 64
Fig. 52. MMA—Medication Compliance 75%: 51–64 years................................................... 65
Fig. 53. MMA—Medication Compliance 75%: Total . 65
Fig. 54. Asthma Medical Ratio (AMR): 5–11 years . 65
Fig. 55. AMR: 12–18 years................................. 65
Fig. 56. AMR: 19–50 years................................. 66
Fig. 57. AMR: 51–64 years................................. 66
Fig. 58. AMR: Total ........................................... 66
Fig. 59. Controlling High Blood Pressure (CBP)...... 67
Fig. 60. Persistence of Beta-Blocker Treatment After a Heart Attack (PBH) ............................. 67
Fig. 61. SPC—Received Statin Therapy: Males 21-75 years................................................... 67
Fig. 62. SPC—Received Statin Therapy: Females 40 -75 years .............................................. 67
Fig. 63. SPC—Received Statin Therapy: Total ....... 68
Fig. 64. SPC—Statin Adherence 80%: Males 21-75 years................................................... 68
Fig. 65. SPC—Statin Adherence 80%: Females 40 -75 years .............................................. 68
Fig. 66. SPC—Statin Adherence 80%: Total .......... 68
Fig. 67. Comprehensive Diabetes Care (CDC): HbA1c Testing ................................................ 69
Fig. 68. CDC: HbA1c Control (<7.0%) ................. 69
Fig. 69. CDC: HbA1c Control (<8.0%) ................. 69
Fig. 70. CDC: Retinal Eye Exam Performed........... 69
Fig. 71. CDC: Medical Attention for Nephropathy... 70

2017 HEDIS/CAHPS REPORT
List of Figures
page 8TennCare 17.EQRO.06.017
Fig. 72. CDC: Blood Pressure Control (<140/90 mm Hg) ..................................................... 70
Fig. 73. CDC: HbA1c Poor Control (>9.0%)* ........ 70
Fig. 74. SPD—Received Statin Therapy: 40-75 years................................................... 70
Fig. 75. SPD—Statin Adherence 80%: 40-75 years 71
Fig. 76. Disease-Modifying Anti-Rheumatic Drug Therapy for Rheumatoid Arthritis (ART) .... 71
Fig. 77. Antidepressant Medication Management (AMM): Effective Acute Phase Treatment .. 72
Fig. 78. AMM: Effective Continuation Phase Treatment............................................ 72
Fig. 79. Follow-Up Care for Children Prescribed ADHD Medication (ADD): Initiation Phase .......... 72
Fig. 80. ADD: Continuation and Maintenance Phase72
Fig. 81. Follow-Up After Hospitalization for Mental Illness (FUH): 7-Day Follow-Up ............... 73
Fig. 82. FUH: 30-Day Follow-Up.......................... 73
Fig. 83. Diabetes Screening for People With Schizophrenia or Bipolar Disorder Who Are Using Antipsychotic Medication (SSD) ........ 73
Fig. 84. Diabetes Monitoring for People With Diabetes and Schizophrenia (SMD) ....................... 73
Fig. 85. Cardiovascular Monitoring for People With Cardiovascular Disease and Schizophrenia (SMC).................................................. 74
Fig. 86. Adherence to Antipsychotic Medications for Individuals With Schizophrenia (SAA)....... 74
Fig. 87. Metabolic Monitoring for Children and Adolescents on Antipsychotics (APM): 1-5Years................................................... 74
Fig. 88. APM: 6-11 Years ................................... 74
Fig. 89. APM: 12-17 Years ................................. 75
Fig. 90. APM: Total ........................................... 75
Fig. 91. Annual Monitoring for Patients on Persistent Medications (MPM): ACE Inhibitors or ARBs ................................................... 76
Fig. 92. MPM: Digoxin ....................................... 76
Fig. 93. MPM: Diuretics...................................... 76
Fig. 94. MPM: Total........................................... 76
Fig. 95. Non-Recommended Cervical Cancer Screening in Adolescent Females (NCS)*.. 77
Fig. 96. Appropriate Treatment for Children With Upper Respiratory Infection (URI)............ 77
Fig. 97. Avoidance of Antibiotic Treatment in Adults With Acute Bronchitis (AAB) ................... 77
Fig. 98. Use of Imaging Studies for Low Back Pain (LBP)................................................... 77
Fig. 99. Use of Multiple Concurrent Antipsychotics in Children and Adolescents (APC): 1-5Years*................................................. 78
Fig. 100. APC: 6-11 Years*.................................. 78
Fig. 101. APC: 12-17 Years* ................................ 78
Fig. 102. APC: Total* .......................................... 78

2017 HEDIS/CAHPS REPORT
List of Figures
page 9TennCare 17.EQRO.06.017
Fig. 103. Adults’ Access to Preventive/Ambulatory Health Services (AAP): 20–44 years......... 79
Fig. 104. AAP: 45–64 years ................................. 79
Fig. 105. Children and Adolescents’ Access to Primary Care Practitioners (CAP): 12–24 months... 79
Fig. 106. CAP: 25 months–6 years ........................ 79
Fig. 107. CAP: 7–11 years ................................... 80
Fig. 108. CAP: 12–19 years ................................. 80
Fig. 109. Initiation and Engagement of Alcohol and Other Drug (AOD) Dependence Treatment (IET)—Initiation of AOD Treatment: 13–17 years................................................... 80
Fig. 110. IET—Initiation of years................................................... 80
Fig. 111. IET—Initiation of AOD Treatment: Total.... 81
Fig. 112. IET—Engagement of AOD Treatment: 13–17 years................................................... 81
Fig. 113. IET—years................................................... 81
Fig. 114. IET—Engagement of AOD Treatment: Total ................................................... 81
Fig. 115. Prenatal and Postpartum Care (PPC): Timeliness of Prenatal Care .................... 82
Fig. 116. PPC: Postpartum Care............................ 82
Fig. 117. Use of First-Line Psychosocial Care for Children and Adolescents on Antipsychotics (APP): 1-5 Years ................................... 82
Fig. 118. APP: 6-11 Years.................................... 82
Fig. 119. APP: 12-17 Years .................................. 83
Fig. 120. APP: Total ............................................ 83
Fig. 121. Frequency of Ongoing Prenatal Care (FPC): ................................................ 84
Fig. 122. Well-Child Visits in the First 15 Months of Life (W15): 6 or More Visits .................... 84
Fig. 123. Well-Child Visits in the Third, Fourth, Fifth and Sixth Years of Life (W34) ................. 84
Fig. 124. Adolescent Well-Care Visits (AWC)........... 84

2017 HEDIS/CAHPS REPORT
page 10TennCare 17.EQRO.06.017
Acknowledgements, Acronyms and Initialisms1,2
AAB ...........................Avoidance of Antibiotic Treatment inAdults With Acute Bronchitis
AAP ..................................... Adults’ Access to Preventive/Ambulatory Health Services
ABA .............................................. Adult BMI Assessment
ABX ................................................. Antibiotic Utilization
ACE ................................. Angiotensin Converting Enzyme
ADD.......................................Follow-Up Care for ChildrenPrescribed ADHD Medication
ADHD.................... Attention-Deficit/Hyperactivity Disorder
AHRQ.............. Agency for Healthcare Research and Quality
AG......... Amerigroup Community Care, Inc., as Amerigroup
AGE/AGM/AGW..........................AG in the Tennessee East,Middle and West Grand Regions
AMB......................................................Ambulatory Care
AMI........................................ Acute Myocardial Infarction
AMM ..................... Antidepressant Medication Management
AMR...........................................Asthma Medication Ratio
AOD...............................................Alcohol or Other Drug
APC ....................Use of Multiple Concurrent Antipsychoticsin Children and Adolescents
1 The source for data contained in this publication is Quality Compass® 2016 and is used with the permission of the National Committee for Quality Assurance (NCQA).Quality Compass 2016 includes certain CAHPS data. Any data display, analysis, interpretation, or conclusion based on these data is solely that of the authors, and NCQA specifically disclaims responsibility for any such display, analysis, interpretation, or conclusion. Quality Compass is a registered trademark of NCQA. CAHPS® is a registered trademark of the Agency for Healthcare Research and Quality (AHRQ). 2 Other company and product names may be trademarks of the respective companies with which they are associated. The mention of such companies and product names is with due recognition and without intent to misappropriate such names or marks.
APM................................Metabolic Monitoring for Childrenand Adolescents on Antipsychotics
APP .........................Use of First-Line Psychosocial Care forChildren and Adolescents on Antipsychotics
ARB..................................... Angiotensin Receptor Blocker
ART .............................. Disease-Modifying Anti-RheumaticDrug Therapy for Rheumatoid Arthritis
AWC.......................................Adolescent Well-Care Visits
BC................................... Volunteer State Health Plan, Inc,as BlueCare Tennessee
BCE/BCM/BCW.......................... BC in the Tennessee East,Middle and West Grand Regions
BCS........................................... Breast Cancer Screening
BlueCare®; BlueCare TennesseeSM........ registered or servicemarks of The BlueCross BlueShield Association
BlueCross BlueShield of Tennessee; BlueCare ........ licenseesof The BlueCross BlueShield Association
BMI ......................................................Body Mass Index
BP...........................................................Blood Pressure
BR............................................................... Biased Rate
CAHPS® .................. refers to the Consumer Assessment ofHealthcare Providers and Systems
2017 HEDIS/CAHPS REPORT
Acknowledgements, Acronyms and Initialisms
page 11TennCare 17.EQRO.06.017
CAP ............................Children and Adolescents’ Access toPrimary Care Practitioners
CBP ................................. Controlling High Blood Pressure
CCC ................................Children With Chronic Conditions
CCS .........................................Cervical Cancer Screening
CDC................................... Comprehensive Diabetes Care
CHL ................................. Chlamydia Screening in Women
CIS...................................Childhood Immunization Status
CPA ..............CAHPS Health Plan Survey 5.0H Adult Version
CPC ..............CAHPS Health Plan Survey 5.0H Child Version
COPD .....................Chronic Obstructive Pulmonary Disease
CVD............................................. Cardiovascular Disease
CWP......... Appropriate Testing for Children With Pharyngitis
CY ............................................................Calendar Year
DMARD..................Disease-Modifying Anti-Rheumatic Drug
DTaP...........................................Diphtheria, Tetanus andAcellular Pertussis Vaccination
ECDS ...............................Electronic Clinical Data Systems
ED .............................................. Emergency Department
ENP ........................................Enrollment by Product Line
Flu.................................................................. Influenza
FPC............................ Frequency of Ongoing Prenatal Care
FSP.................................Frequency of Selected Procedure
FUH ..........Follow-Up After Hospitalization for Mental Illness
FUM................... Follow-Up After ED Visit for Mental Illness
FUA ...................... Follow-Up After ED Visit for Alcohol andOther Drug Dependence
FVA ..................... Flu vaccinations for adults ages 18 to 64
HbA1c....................................Hemoglobin A1c, also calledGlycosylated Hemoglobin, Glycohemoglobin
HEDIS®....... refers to the Healthcare Effectiveness Data andInformation Set and is a registered trademark of NCQA
HCFA ............................................. Tennessee Division ofHealth Care Finance and Administration
HepA ............................................Hepatitis A Vaccination
HepB ............................................Hepatitis B Vaccination
HiB.............. H (Haemophilus) Influenza Type B Vaccination
HPV................................... Human Papillomavirus Vaccine
HTN........................................................... Hypertension
IAD .......... Identification of Alcohol and Other Drug Services
IET...................................... Initiation and Engagement ofAOD Dependence Treatment
IMA ................................... Immunizations for Adolescents
IP; IPU............................................................Inpatient;IP Utilization – General Hospital/Acute Care
IPV....................................................... Polio Vaccination
LBP ....................Use of Imaging Studies for Low Back Pain
LDL-C .........................Low-Density Lipoprotein Cholesterol
LSC ........................................ Lead Screening in Children
MCO ...................................... Managed Care Organization
MMA..........Medication Management for People With Asthma
MMR....................Measles, Mumps and Rubella Vaccination
MPM ...................................Annual Monitoring for Patientson Persistent Medications
MPT............................................Mental Health Utilization

2017 HEDIS/CAHPS REPORT
Acknowledgements, Acronyms and Initialisms
page 12TennCare 17.EQRO.06.017
MSC......................... Medical Assistance With Smoking andTobacco Use Cessation
MY..................................................... Measurement Year
NA........................................................... Not Applicable
NB................................................................ No Benefit
NCQA................. National Committee for Quality Assurance
NCQA HEDIS Compliance Audit™ .......... trademark of NCQA
NCS ............................Non-Recommended Cervical CancerScreening in Adolescent Females
NR.............................................................Not Reported
NQ.............................................................Not Required
OB-GYN.................................... Obstetrician-Gynecologist
PBH ........................ Persistence of Beta-Blocker TreatmentAfter a Heart Attack
PCE..... Pharmacotherapy Management of COPD Exacerbation
PCP........................................... Primary Care Practitioner
PCV ..........................Pneumococcal Conjugate Vaccination
PMPY...............................................Per Member Per Year
PPC.................................... Prenatal and Postpartum Care
Qsource®...................................... a registered trademark
Quality Compass® .............a registered trademark of NCQA,the comprehensive national database ofhealth plans’ HEDIS and CAHPS results
R ..................................................................Reportable
RA .................................................. Rheumatoid Arthritis
RV ................................................. Rotavirus Vaccination
SAA ...................... Adherence to Antipsychotic Medicationsfor Individuals With Schizophrenia
SMC ..........................Cardiovascular Monitoring for PeopleWith Cardiovascular Disease and Schizophrenia
SMD .................................. Diabetes Monitoring for PeopleWith Diabetes and Schizophrenia
SPC .......................... Statin Therapy for Patients With CVD
SPD.................... Statin Therapy for Patients With Diabetes
SPR .................................Use of Spirometry Testing in theAssessment and Diagnosis of COPD
SSD.................................... Diabetes Screening for PeopleWith Schizophrenia or Bipolar Disorder
Who Are Using Antipsychotic Medications
Strep ........................................................ Streptococcus
TennCare ................. HCFA Medicaid program in Tennessee
Td; Tdap ................... Tetanus, Diphtheria Toxoids Vaccine;Td and Acellular Pertussis Vaccine
TCS....................... Volunteer State Health Plan, Inc. d.b.a.TennCareSelect statewide
UHC .....................................UnitedHealthcare Plan of theRiver Valley, Inc. d.b.a. UnitedHealthcare
UHCE/UHCM/UHCW ................. UHC in the Tennessee East,Middle and West Grand Regions
UN ...............................................................Un-Audited
URI .............Upper Respiratory Infection, and the measure:Appropriate Treatment for Children With URI
VZV..................... Chicken Pox/Varicella Zoster Vaccination
W15 ..............Well-Child Visits in the First 15 Months of Life
W34 ................. Well-Child Visits in the Third, Fourth, Fifth,and Sixth Years of Life
WCC..........Weight Assessment and Counseling for Nutritionand Physical Activity for Children/Adolescents

2017 HEDIS/CAHPS REPORT
page 13TennCare 17.EQRO.06.017
Executive SummaryMedicaid managed care organizations (MCOs) are required to report a full Healthcare Effectiveness Data and Information Set (HEDIS) as a part of the accreditation mandates in Tennessee. The HEDIS requirement is an integral part of the accreditation process of the National Committee for Quality Assurance (NCQA). In 2006, Tennessee became the first state in the nation requiring all MCOs to become accredited by NCQA, an independent, not-for-profit organization that assesses and scores MCO performance on important dimensions of care and service in a broad range of health issues.
More than 90% of health plans in America use the HEDIS tool because its standardized measures of MCO performance allow comparisons to national averages and benchmarks as well as between a state’s MCOs, and over time. The Consumer Assessment of Healthcare Providers and Systems (CAHPS) set of standardized surveys is included in HEDIS to measure members’ satisfaction with their care. This 2017 HEDIS/CAHPS Report summarizes the results for the MCOs contracting with TennCare, the Medicaid program of the Tennessee Division of Health Care Finance and Administration (HCFA).
For an overview of the performance of TennCare’s MCOs, a calculated weighted average of the scores of all those reporting is provided alongside national averages in the Statewide
Performance section. MCO-specific measures are presented in the Individual Plan Performance section for cross-comparison with color-coding for national and state benchmark comparison where available/applicable. Weighted average performances of Tennessee’s MCOs since 2006 on certain measures are presented in the HEDIS Trending section. The HEDIS and CAHPS results for CoverKids, Tennessee’s Children’s Health Insurance Plan (CHIP) are reported separately in CHIP HEDIS/CAHPS Results.
Appendix A contains a comprehensive table of plan-specific results for HEDIS 2017 Utilization Measures and HEDIS 2016 national benchmarks. The table in Appendix B contains the HEDIS 2016 National Medicaid Means and Percentiles for reference to these benchmarks, and the table in Appendix C reveals populations reported by MCOs in member months by age and sex for HEDIS 2017. Appendix D presents the reporting options for each measure, whether administrative, hybrid or both. Appendix E offers additional utilization measures, frequencies and population by member months for the CHIP.
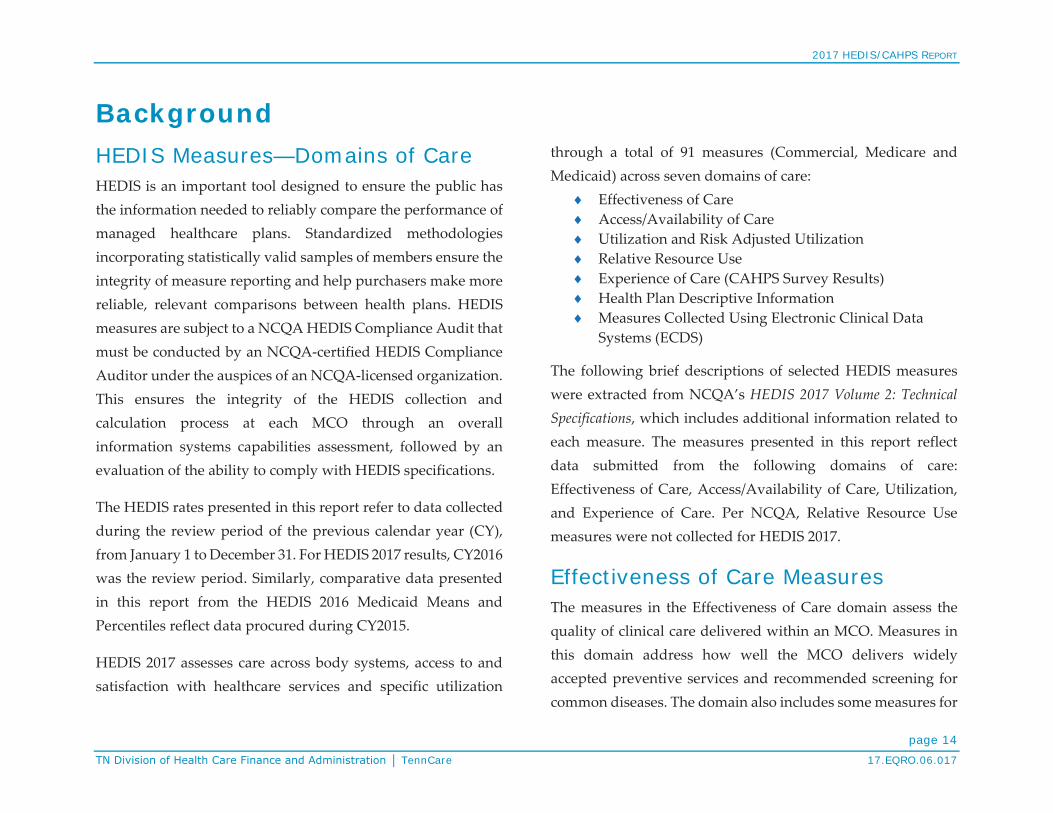
2017 HEDIS/CAHPS REPORT
page 14TennCare 17.EQRO.06.017
BackgroundHEDIS Measures—Domains of CareHEDIS is an important tool designed to ensure the public has the information needed to reliably compare the performance of managed healthcare plans. Standardized methodologies incorporating statistically valid samples of members ensure the integrity of measure reporting and help purchasers make more reliable, relevant comparisons between health plans. HEDIS measures are subject to a NCQA HEDIS Compliance Audit that must be conducted by an NCQA-certified HEDIS Compliance Auditor under the auspices of an NCQA-licensed organization. This ensures the integrity of the HEDIS collection and calculation process at each MCO through an overall information systems capabilities assessment, followed by an evaluation of the ability to comply with HEDIS specifications.
The HEDIS rates presented in this report refer to data collected during the review period of the previous calendar year (CY), from January 1 to December 31. For HEDIS 2017 results, CY2016 was the review period. Similarly, comparative data presented in this report from the HEDIS 2016 Medicaid Means and Percentiles reflect data procured during CY2015.
HEDIS 2017 assesses care across body systems, access to and satisfaction with healthcare services and specific utilization
through a total of 91 measures (Commercial, Medicare and Medicaid) across seven domains of care:
Effectiveness of Care Access/Availability of Care Utilization and Risk Adjusted Utilization Relative Resource Use Experience of Care (CAHPS Survey Results) Health Plan Descriptive Information Measures Collected Using Electronic Clinical Data Systems (ECDS)
The following brief descriptions of selected HEDIS measures were extracted from NCQA’s HEDIS 2017 Volume 2: Technical Specifications, which includes additional information related to each measure. The measures presented in this report reflect data submitted from the following domains of care: Effectiveness of Care, Access/Availability of Care, Utilization, and Experience of Care. Per NCQA, Relative Resource Use measures were not collected for HEDIS 2017.
Effectiveness of Care MeasuresThe measures in the Effectiveness of Care domain assess the quality of clinical care delivered within an MCO. Measures in this domain address how well the MCO delivers widely accepted preventive services and recommended screening for common diseases. The domain also includes some measures for

2017 HEDIS/CAHPS REPORT
Background
page 15TennCare 17.EQRO.06.017
overuse and patient safety and addresses four major aspects of clinical care:
1. How well the MCO delivers preventive services and keeps members healthy
2. Whether members are offered the most up-to-date treatments for acute episodes of illness and get better
3. How well the MCO delivers care and assistance with coping to members with chronic diseases
4. Whether members can get appropriate tests
Starting with HEDIS 2008 reporting, Effectiveness of Care measures were grouped into more specific clinical categories, which have slightly changed:
Prevention and Screening Respiratory Conditions Cardiovascular Conditions Diabetes Musculoskeletal Conditions Behavioral Health Medication Management Overuse/Appropriateness Measures collected by the CAHPS Health Plan Survey
Only certain measures from these categories are presented in this report, which does not include the additional category in this domain specific to Medicare. For some measures, eligible members cannot have more than one gap in continuous enrollment of up to 45 days during the measurement year (MY).
Prevention and ScreeningImmunization measures follow guidelines for immunizations from the Centers for Disease Control and Prevention and the Advisory Committee on Immunization Practices. HEDIS implements changes (e.g., new recommendations) after three years, to account for the measures’ look-back period and to allow the industry time to adapt to new guidelines.
Adult BMI Assessment (ABA)ABA measures the percentage of members 18 to 74 years of age who had an outpatient visit and whose body mass index (BMI) was documented during the MY or the year prior to the MY.
Weight Assessment and Counseling for Nutrition and Physical Activity for Children/ Adolescents (WCC)WCC measures the percentage of members 3 to 17 years of age who had an outpatient visit with a primary care practitioner (PCP) or obstetrician-gynecologist (OB-GYN) and who had evidence of BMI percentile documentation, counseling for nutrition and counseling for physical activity during the MY. Note: Because BMI norms for youth vary with age and gender, this measure evaluates whether BMI percentile is assessed not an absolute BMI value.
Childhood Immunization Status (CIS)CIS assesses the percentage of children who became two years of age and who, on or before two years of age, had four diphtheria, tetanus, acellular pertussis (DTaP); three polio (IPV); one measles, mumps, and rubella (MMR); three Haemophilus influenza type B (HiB); three hepatitis B (HepB);

2017 HEDIS/CAHPS REPORT
Background
page 16TennCare 17.EQRO.06.017
one chicken pox/varicella zoster (VZV); four pneumococcal conjugate (PCV); one hepatitis A (HepA); two or three rotavirus (RV); and two influenza (Flu) vaccines. The measure calculates a rate for each vaccine and nine separate combination rates numbered 2 to 10 as shown in Table CIS.
Table CIS. Combination Vaccinations for Childhood Immunization Status (CIS)# DTaP IPV MMR HiB HepB VZV PCV HepA RV Flu2345678910
Immunizations for Adolescents (IMA)IMA measures the percentage of adolescents 13 years of age who had one dose of meningococcal vaccine and one dose of tetanus, diphtheria toxoids and acellular pertussis vaccine (Tdap), and three doses of the human papillomavirus vaccine (HPV) by the 13th birthday, calculating the rate for each vaccine and two combinations: meningococcal and Tdap/Td; and meningococcal, Tdap/Td and HPV.
IMA criteria was revised for HEDIS 2017 to remove polysaccharide vaccines. The HPV measure for female adolescents was retired for HEDIS 2017 and
incorporated into IMA. Revised to indicate that prior year rates may not be used to reduce the sample for IMA hybrid methodology.
Lead Screening in Children (LSC)LSC assesses the percentage of children two years of age who had one or more capillary or venous lead blood tests for lead poisoning on or before the second birthday.
Breast Cancer Screening (BCS)BCS measures the percentage of female members 50 to 74 years of age who had a mammogram to screen for breast cancer between October 1 two years prior to the MY, and through December 31 of the MY.
Note: This measure does not include biopsies, breast ultrasounds, MRIs or diagnostic screenings because they are not appropriate methods for primary breast cancer screening. HEDIS 2016 added new value sets to identify bilateral mastectomy.
Cervical Cancer Screening (CCS)CCS measures the percentage of women 21 to 64 years of age who were appropriately screened for cervical cancer using either of the following criteria:
Women age 21–64 who had cervical cytology performed every three years Women age 30–64 who had cervical cytology/HPV co-testing performed every five years
Note: For HEDIS 2017, medical record requirements clarified that reflex testing would not meet criteria for hybrid specification.

2017 HEDIS/CAHPS REPORT
Background
page 17TennCare 17.EQRO.06.017
Chlamydia Screening in Women (CHL)CHL assesses the percentage of women 16 to 24 years of age who were identified as sexually active and who had at least one test for chlamydia during the MY. This measure calculates a total rate as well as two age stratifications:
Women age 16–20 Women age 21–24
Respiratory Conditions
Appropriate Testing for Children With Pharyngitis (CWP)CWP measures the percentage of children 3 to 18 years of age who were diagnosed with pharyngitis, dispensed an antibiotic prescription on or during the three days after the episode date, and received a group A streptococcus (strep) test for the episode. A higher rate represents better performance (i.e., appropriate testing).
Use of Spirometry Testing in the Assessment and Diagnosis of COPD (SPR)SPR reports the percentage of members 40 years of age and older with a new diagnosis or newly active chronic obstructive pulmonary disease (COPD) who received appropriate spirometry testing to confirm the diagnosis.
Pharmacotherapy Management of COPD Exacerbation (PCE)PCE assesses the percentage of COPD exacerbation for members 40 years of age and older who had an acute inpatient (IP) discharge or emergency department (ED) visit on or
between January 1 and November 30 of the MY and who were dispensed appropriate medications. Two rates are reported:
Dispensed a systemic corticosteroid (or there was evidence of an active prescription) within 14 days of the event Dispensed a bronchodilator (or there was evidence of an active prescription) within 30 days of the event
Note: The eligible population for this measure is based on acute IP discharges and ED visits, not on members. The denominator may include multiple events for the same individual. For HEDIS 2017, the exclusion was deleted for Episode Dates when there was a readmission or an ED visit within 14 days.
Medication Management for People With Asthma (MMA)MMA records the percentage of members 5 to 64 years of age during the MY who were identified as having persistent asthma and were dispensed appropriate medications that they remained on during the treatment period.
Two rates are reported for the percentage of members who remained on an asthma controller medication:
For at least 50% of their treatment period For at least 75% of their treatment period
For MMA, a total rate and four age stratifications are reported: 5–11 years 19–50 years 12–18 years 51–64 years
Asthma Medication Ratio (AMR)AMR assesses the percentage of members 5 to 64 years of age who were identified as having persistent asthma and had a ratio

2017 HEDIS/CAHPS REPORT
Background
page 18TennCare 17.EQRO.06.017
of controller medications to total asthma medications of 0.50 or greater during the MY. This measure calculates a total rate as well as four age stratifications:
5–11 years 19–50 years 12–18 years 51–64 years
Cardiovascular Conditions
Controlling High Blood Pressure (CBP)CBP reports the percentage of members 18 to 85 years of age who had a diagnosis of hypertension (HTN) and whose blood pressure (BP) was adequately controlled during the MY, a single rate based on a sum of the following criteria groups by age:
Members 18–59 years whose BP was <140/90 mm Hg Members 60–85 years with a diagnosis of diabetes whose BP was <140/90 mm Hg Members 60–85 years without a diagnosis of diabetes whose BP was <150/90 mm Hg
Persistence of Beta-Blocker Treatment After a Heart Attack(PBH)PBH measures the percentage of members 18 years of age and older during the measurement year who were hospitalized and discharged from July 1 of the year prior to the measurement year to June 30 of the measurement year with a diagnosis of acute myocardial infarction (AMI) and who received persistent beta-blocker treatment for six months after discharge.
Statin Therapy for Patients With Cardiovascular Disease (SPC)SPC reports the percentage of members identified as having clinical atherosclerotic cardiovascular disease (CVD) and who met the following criteria:
Received Statin Therapy—Members who were dispensed at least one high or moderate-intensity statin medication during the MY Statin Adherence 80%—Members who remained on a high or moderate-intensity statin medication for at least 80% of the treatment period
For SPC, a total rate and two stratifications of gender and age (as of December 31 of the MY) are reported:
Males 21–75 years Females 40–75 years
Diabetes
Comprehensive Diabetes Care (CDC)The CDC composite of seven rates measures an MCO’s performance on clinical management in aspects of diabetic care through the percentage of a single sample of diabetic members (type 1 and type 2) 18 to 75 years of age who met the criteria by having the following during the MY:
Hemoglobin A1c (HbA1c) blood test Poorly controlled diabetes (HbA1c >9.0%) Note: a lower rate indicates better performance (i.e., low rates of poor control indicate better care) Controlled diabetes (most recent HbA1c <8.0%)

2017 HEDIS/CAHPS REPORT
Background
page 19TennCare 17.EQRO.06.017
Controlled diabetes (most recent HbA1c <7.0%) for a selected population Eye exam (retinal) Medical attention for nephropathy Controlled blood pressure (<140/90 mm Hg)
Note: HEDIS 2017 added glycohemoglobin, glycated hemoglobin and glycosylated hemoglobin as acceptable HbA1c tests.
Statin Therapy for Patients With Diabetes (SPD)SPD reports the percentage of members 40 to 75 years of age who do not have atherosclerotic CVD and met the following criteria reported as two rates:
Received Statin Therapy—Members who were dispensed at least one statin medication of any intensity during the MY Statin Adherence 80%—Members who remained on a statin medication of any intensity for at least 80% of the treatment period
Musculoskeletal Conditions
Disease-Modifying Anti-Rheumatic Drug Therapy for Rheumatoid Arthritis (ART)ART assesses whether members who were diagnosed with rheumatoid arthritis (RA) were prescribed a disease-modifying anti-rheumatic drug (DMARD) to attenuate the damaging progression, reduce inflammation and improve functional status. The rate is the percentage of members diagnosed with RA, and not HIV or pregnancy, who were dispensed at least one ambulatory prescription for a DMARD during the MY.
Behavioral Health
Antidepressant Medication Management (AMM)AMM measures the percentage of members 18 years of age and older who were treated with antidepressant medication, had a diagnosis of major depression and who remained on an antidepressant medication treatment. Two rates are reported:
Effective Acute Phase Treatment—The percentage who remained on medication for a at least 84 days (12 weeks) Effective Continuation Phase Treatment—The percentage who remained on medication for at least 180 days (6 months)
Follow-Up Care for Children Prescribed ADHD Medication (ADD)ADD assesses the percentage of children newly prescribed attention-deficit/hyperactivity disorder (ADHD) medication who had at least three follow-up care visits within a 10-month period, one of these visits must have been within 30 days of the earliest ambulatory prescription dispensed for ADHD medication, at which time the member must have been 6 to 12 years of age. Two rates are reported:
Initiation Phase—The percentage who had one follow-up visit with a practitioner with prescribing authority during the 30-day Initiation Phase Continuation and Maintenance Phase—The percentage who remained on the medication for at least 210 days and who, in addition to the Initiation Phase follow-up, had at

2017 HEDIS/CAHPS REPORT
Background
page 20TennCare 17.EQRO.06.017
least two follow-up visits with a practitioner within 270 days (nine months) of the end of the Initiation Phase
Follow-Up After Hospitalization for Mental Illness (FUH)FUH examines continuity of care for mental illness through the percentage of discharges for members six years of age and older who were hospitalized for selected mental illness diagnoses and who had a follow-up visit with a mental health practitioner. Two rates are reported as the percentage of discharges for which the member received follow-up within the following:
7 days of discharge 30 days of discharge
Follow-Up After Emergency Department Visit for Mental Illness (FUM)FUM is the percentage of members 6 years of age and older with a principal diagnosis of mental illness, who had a follow-up visit for mental illness. Two rates are reported as the percentage of ED visits for which the member received follow-up within the following:
7 days of discharge 30 days of discharge
Follow-Up After Emergency Department Visit for Alcohol and Other Drug Dependence (FUA)FUA is the percentage of members 6 years of age and older with a principal diagnosis of mental illness, who had a follow-up visit for mental illness. Two rates are reported as the percentage of ED visits for which the member received follow-up within the following:
7 days of discharge 30 days of discharge
For FUA, a total rate and two age stratifications are reported: 13–17 years 18 years and older
Diabetes Screening for People With Schizophrenia or Bipolar Disorder Who Are Using Antipsychotic Medications (SSD)SSD measures the percentage of members 18 to 64 years of age with schizophrenia or bipolar disorder who were dispensed an antipsychotic medication and had a diabetes screening test during the MY.
Diabetes Monitoring for People With Diabetes and Schizophrenia (SMD)SMD is the percentage of members 18 to 64 years of age with schizophrenia and diabetes who had both a low-density lipoprotein cholesterol (LDL-C) test and an HbA1c test during the MY.
Cardiovascular Monitoring for People With Cardiovascular Disease and Schizophrenia (SMC)SMC reports the percentage of members 18 to 64 years of age with schizophrenia and CVD who had an LDL-C test during the MY.
Adherence to Antipsychotic Medications for Individuals With Schizophrenia (SAA)SAA assesses the percentage of members with schizophrenia who were 19 to 64 years of age during the MY who were dispensed and remained on an antipsychotic medication for at least 80% of their treatment period.

2017 HEDIS/CAHPS REPORT
Background
page 21TennCare 17.EQRO.06.017
Metabolic Monitoring for Children and Adolescents on Antipsychotics (APM)APM measures the percentage of children and adolescents 1 to 17 years of age who had two or more antipsychotic prescriptions and had metabolic testing. It calculates a total rate as well as three age stratifications:
1–5 years 12–17 years 6–11 years
Medication Management
Annual Monitoring for Patients on Persistent Medications (MPM)MPM reports the percentage of members 18 years of age and older who received at least 180 treatment days of ambulatory medication therapy for a select therapeutic agent during the MY and at least one therapeutic monitoring event for the therapeutic agent in the MY. Three rates are reported separately and as a sum total rate:
Annual monitoring for members on angiotensin converting enzyme (ACE) inhibitors or angiotensin receptor blocker (ARB) Annual monitoring for members on digoxin Annual monitoring for members on diuretics
Overuse/Appropriateness
Non-Recommended Cervical Cancer Screening in Adolescent Females (NCS)NCS records the percentage of adolescent females 16 to 20 years of age who were screened unnecessarily for cervical cancer.
Note: A lower rate indicates better performance.
Appropriate Treatment for Children With Upper Respiratory Infection (URI)This measures the percentage of children 3 months to 18 years of age who were given a diagnosis of upper respiratory infection (URI) and were not dispensed an antibiotic prescription. This measure is reported as an inverted rate [1 - (numerator/eligible population)], with a higher rate indicating appropriate treatment of children with URI (i.e., the proportion for whom antibiotics were not prescribed).
Avoidance of Antibiotic Treatment in Adults With Acute Bronchitis (AAB)AAB reports the percentage of adults 18 to 64 years of age with a diagnosis of acute bronchitis who were not dispensed an antibiotic prescription. This measure is reported as an inverted rate [1 - (numerator/eligible population)], with a higher rate indicating appropriate treatment of adults with acute bronchitis (i.e., the proportion for whom antibiotics were not prescribed).

2017 HEDIS/CAHPS REPORT
Background
page 22TennCare 17.EQRO.06.017
Use of Imaging Studies for Low Back Pain (LBP)LBP assesses the percentage of members with a primary diagnosis of low back pain who did not have an imaging study (plain X-ray, MRI, CT scan) within 28 days of the diagnosis. This measure is reported as an inverted rate [1 - (numerator/eligible population)], with a higher rate indicating an appropriate treatment of low back pain (i.e., the proportion for whom imaging studies did not occur).
Use of Multiple Concurrent Antipsychotics in Children and Adolescents (APC)APC measures the percentage of children and adolescents 1 to 17 years of age who were on two or more concurrent antipsychotic medications. This measure calculates a total rate as well as three age stratifications:
1–5 years 12–17 years 6–11 years
Note: For this measure, a lower rate indicates better performance (i.e., low rates of concurrent antipsychotics indicate better care).
Measures Collected Through CAHPS Health Plan Survey
Flu vaccinations for adults ages 18 to 64 (FVA)FVA reports the percentage of members 18 to 64 years of age who received a flu vaccination between July 1 of the MY and the date when the CAHPS Health Plan Survey 5.0H Adult Version (CPA) was completed.
Medical Assistance With Smoking and Tobacco Use Cessation (MSC)This measure is collected using the survey methodology to arrive at a rolling average that represents the percentage of members 18 years of age and older who were current smokers or tobacco users seen during the MY.
MSC assesses the following facets of providing medical assistance with smoking and tobacco use cessation:
Advising Smokers and Tobacco Users to Quit—Those who received advice to quit Discussing Cessation Medications—Those for whom cessation medications were recommended or discussed Discussing Cessation Strategies—Those for whom cessation methods or strategies were provided or discussed
Percentage of Current Smokers is not a HEDIS performance measure, but provides additional information to support analysis of other MSC data. The MCOs started reporting this data in 2015 in CAHPS results; subsequently, the rates have been added to this report.
Access/Availability of Care MeasuresThe measures in the Access/Availability of Care domain evaluate how members access important and basic services of their MCO. Included are measures of overall access, how many

2017 HEDIS/CAHPS REPORT
Background
page 23TennCare 17.EQRO.06.017
members are actually using basic MCO services, and the use and availability of specific services.
Adults’ Access to Preventive/Ambulatory Health Services (AAP)This measures the percentage of members 20 years and older who had an ambulatory or preventive care visit during the MY to assess whether adult members have access to/receive such services. MCOs report a total rate and three age stratifications:
20–44 years 45–64 years
65 years
Note: Rates for adults 65 years of age and older are not included in this report as those services would be provided by Medicare. Because the total rate would include this age group, it has been excluded from this report as well.
Children and Adolescents’ Access to Primary Care Practitioners (CAP)CAP assesses general access to care for children and adolescents through the percentage of members 12 months to 6 years of age who had a visit with a PCP (e.g., pediatrician, family physician) during the MY, and members 7 to 19 years of age who had a visit with a PCP during the MY or the year prior. MCOs report four separate percentages:
12–24 months 25 months – 6 years
7–11 years 12–19 years
Initiation and Engagement of Alcohol and Other Drug Dependence Treatment (IET)IET assesses adolescent and adult members 13 years of age and older who demonstrated a new episode of alcohol or other drug (AOD) dependence and received the following:
Initiation of AOD Treatment—Initial treatment through an inpatient AOD admission, outpatient visit, intensive outpatient encounter or patient hospitalization within 14 days of diagnosis Engagement of AOD Treatment—Two or more services with an AOD diagnosis within 30 days of the initiation visit in addition to initiating treatment
MCOs report a total rate and two age stratifications for each: 13–17 years 18 years
Prenatal and Postpartum Care (PPC)PPC measures the percentage of live birth deliveries between November 6 of the year prior to the MY and November 5 of the MY. For these women, the composite assesses the percentage of deliveries where members received the following PPC facets:
Timeliness of Prenatal Care—Received a prenatal care visit as a member of the MCO in the first trimester or within 42 days of MCO enrollment Postpartum Care—Had a postpartum visit on or between 21 and 56 days after delivery
Use of First-Line Psychosocial Care for Children and Adolescents on Antipsychotics (APP)APP measures the percentage of children and adolescents 1 to 17 years of age who had a new prescription for an antipsychotic medication and had documentation of psychosocial care as

2017 HEDIS/CAHPS REPORT
Background
page 24TennCare 17.EQRO.06.017
first-line treatment. MCOs report a total rate and three age stratifications:
1–5 years 6–11 years
12–17 years
Utilization and Risk-Adjusted UtilizationThis domain name was adjusted for HEDIS 2017, but still consists of utilization measures designed to capture the frequency of certain services provided for MCOs’ internal evaluation only; NCQA does not view higher or lower service counts as indicating better or worse performance. Risk-Adjusted Utilization measures are for commercial or Medicare lines, and so are not included in this report. Two kinds of measures are included in Utilization:
Measures that express rates of service in per 1,000 member years/months (defined/reported in Appendix A) Measures as percentages of members receiving specified services (similar to Effectiveness of Care Domain, defined in this section with data in the Results tables)
The two Medicaid categories (Disabled and Low-Income) for Utilization Measures are reported separately and as a total rate. However, the total rate includes the category of Medicaid and Medicare dual eligibles, and those members are part of dual-eligible special needs plans (D-SNPs) reported separately to HCFA via Qsource’s Annual HEDIS D-SNPs Report.
Frequency of Ongoing Prenatal Care (FPC)FPC is the percentage of members who delivered a child between November 6 of the year prior to the MY and November 5 of the MY, and received the expected number of prenatal care visits. This measure uses the same denominator, structure and calculation guidelines as PPC. Rates are reported by the percentage of expected visits:
< 21% 21– 40% 41– 60%
61– 80% 81%
Well-Child Visits in the First 15 Months of Life (W15)W15 assesses the percentage of members who turned 15 months old during the MY and who had the following number of well-child visits with a PCP during their first 15 months of life: zero, one, two, three, four, five, or six or more. This measure uses the same structure and calculation guidelines as those in the Effectiveness of Care domain.
Well-Child Visits in the Third, Fourth, Fifth and Sixth Years of Life (W34)W34 reports the percentage of members who were 3 to 6 years of age who had one or more well-child visits with a PCP during the MY. This measure uses the same structure and calculation guidelines as those in the Effectiveness of Care domain.
Adolescent Well-Care Visits (AWC)AWC assesses the percentage of enrolled members 12 to 21 years of age who had at least one comprehensive well-care visit

2017 HEDIS/CAHPS REPORT
Background
page 25TennCare 17.EQRO.06.017
with a PCP or an OB-GYN practitioner during the MY. This measure uses the same structure and calculation guidelines as those in the Effectiveness of Care domain.
Experience of CareFor a plan’s results in this domain to be considered reliable, the Medicaid MCO must follow one of the standard CAHPS protocols or an enhanced protocol approved by NCQA. Details regarding this calculation methodology and the questions used in each composite are included in HEDIS 2016, Volume 3: Specifications for Survey Measures.
CAHPS Health Plan Survey 5.0H Adult Version (CPA) and 5.0H Child Version (CPC)The CPA and CPC are tools for measuring consumer healthcare satisfaction with the quality of care and customer service provided by their MCOs.
These survey tools include five composites asked of members (CPA) or parents of child members (CPC):
Getting Needed Care Getting Care Quickly How Well Doctors Communicate Customer Service Shared Decision Making
Each composite category represents an overall aspect of plan quality, how well the MCO meets members’ expectations.
There are four global rating questions that use a 0–10 scale to assess overall experience:
Rating of All Health Care Rating of Personal Doctor Rating of Specialist Seen Most Often Rating of Health Plan
For these scaled responses, a 0 represents the ‘worst possible’ and 10 represents the ‘best possible’ healthcare received in the last six months. Summary rates represent the percentage of members who responded with a 9 or 10. Additional Health Promotion and Education as well as Coordination of Care questions use the same calculations.
For any given CPA and CPC question used in a composite, the percentage of respondents answering in a certain way is calculated for each MCO. Summary rates represent the percentage of members who responded in the most positive way, as defined by NCQA. The following descriptions provide a brief explanation of the five composite categories.
Getting Needed CareThe Getting Needed Care Composite measures the ease with which members were able to access care, tests, or treatments needed in the last 6 months. The summary rate represents the percentage of members who responded ‘Always’ or ‘Usually’ to specified questions.

2017 HEDIS/CAHPS REPORT
Background
page 26TennCare 17.EQRO.06.017
Getting Care QuicklyThe Getting Care Quickly Composite measures the ease with which members were able to access care quickly, including getting appointments as soon as needed, in the last 6 months. The summary rate represents the percentage of members who responded ‘Always’ or ‘Usually’ to specified questions.
How Well Doctors CommunicateThe How Well Doctors Communicate Composite evaluates provider-patient communications for the last 6 months by asking members how often their personal doctor listens carefully, explains things in a way to easily understand, shows respect for what they have to say and spends enough time with them. The summary rate represents the percentage of members who responded ‘Always’ or ‘Usually’ to specified questions.
Customer ServiceThe Customer Service Composite measures how often members were able to get information and help from an MCO and how well they were treated by the MCO’s customer service in the last 6 months. The summary rate represents the percentage of members who responded ‘Always’ or ‘Usually’ to specified questions.
Shared Decision MakingThe Shared Decision Making Composite measures how often doctors offered choices regarding healthcare, mentioned the good and bad things associated with each treatment option, the
extent to which doctors requested input regarding healthcare preferences, and how often doctors involved members in the decision-making process, according to their preference. The summary rate represents the percentage of members who responded ‘Yes’ to specified questions. Means and variances are not calculated for this composite.
Children With Chronic Conditions (CCC)The CAHPS Consortium decided in 2002 to integrate a new set of items in the 3.0H version of the CAHPS Health Plan Survey child questionnaires (now 5.0H) to better address the needs of children with chronic conditions, commonly referred to as children with special healthcare needs. CCC is designed for children with a chronic physical, developmental, behavioral or emotional condition and who also require health and related services of a type or amount beyond that generally required by children. Three composites summarize parents’ satisfaction with basic components of care essential for successful treatment, management and support of children with chronic conditions:
Access to Specialized Services Family Centered Care: Personal Doctor Who Knows Child Coordination of Care for CCC
Summary rates are reported for each composite and are reported individually for two concepts:
Access to Prescription Medicines Family Centered Care: Getting Needed Information

2017 HEDIS/CAHPS REPORT
Background
page 27TennCare 17.EQRO.06.017
Health Plan Descriptive Information MeasuresThese measures help describe an MCO’s structure, staffing and enrollment—factors that contribute to its ability to provide effective healthcare to Medicaid members.
Enrollment by Product Line (ENP)ENP reports the total number of members enrolled in the product line, stratified by age and gender (for the MCOs, reported as ENPA: Total Medicaid). These results are included in Appendix D as population in member months by MCO and Tennessee Grand Region served.
Measures Collected Using Electronic Clinical Data Systems (ECDS)This domain requires automated and accessible data by the healthcare team at the point of care, data shared between clinicians and health plans to promote quality improvement across the care continuum. To qualify for HEDIS ECDS reporting, the data must use standard layouts, meet the measure specification requirements and the information must be accessible by the care team responsible for the member’s healthcare needs.
This domain is not required to be reported by the MCOs, hence, not included in this report.

2017 HEDIS/CAHPS REPORT
page 28TennCare 17.EQRO.06.017
Medicaid ResultsStatewide PerformanceIn conjunction with NCQA accreditation, TennCare MCOs are required to submit a full set of audited HEDIS measures to NCQA and TennCare each year. For HEDIS 2017, this included the statewide MCO Volunteer State Health Plan, Inc., doing business as TennCareSelect (TCS), and three statewide MCOs doing business in each respective Grand Region (East, Middle and West): Amerigroup Community Care, Inc., as Amerigroup (AG—AGE, AGM and AGW); Volunteer State Health Plan, Inc., as BlueCare Tennessee (BC—BCE, BCM and BCW); and UnitedHealthcare Plan of the River Valley, Inc., as UnitedHealthcare (UHC—UHCE, UHCM and UHCW).
Tables 1 (a and b), 2 and 3 summarize the weighted average TennCare score for each of the selected HEDIS 2016 and HEDIS 2017 measures as well as the HEDIS 2016 Medicaid National Average. The Medicaid National Average represents the sum of the reported rates divided by the total number of health plans
reporting the rate. Weighted state rates are determined by applying the size of the eligible population within each plan to their overall results. Using this methodology, plan-specific findings contribute to the TennCare statewide estimate, proportionate to eligible population size.
Where possible in Tables 1 (a and b), 2 and 3, the statewide changes for each measure reported during both HEDIS 2016 and HEDIS 2017 are presented. The column titled ‘Change 2016 to 2017’ indicates whether there was an improvement ( ) or a decline ( ) in statewide performance for the measure from HEDIS 2016 to HEDIS 2017. Cells are shaded gray for those measures that were not calculated or for which data were not reported. Each year some measures’ technical specifications change. Based on whether the changes are significant or minor, the measures may need to be trended with caution or may not be able to be trended. At the time this report was finalized, NCQA did not determine the ability for 2017 measures to be trended.

2017 HEDIS/CAHPS REPORT
Medicaid Results
page 29TennCare 17.EQRO.06.017
Table 1a. HEDIS 2017 State to National Medicaid Rates: Effectiveness of Care Measures
MeasureWeighted State Rate HEDIS 2016
Medicaid National Avg.
Change 2016 to
20172016 2017
Prevention and Screening
Adult BMI Assessment (ABA) 82.46% 86.96% 80.77%
Weight Assessment and Counseling for Nutrition and Physical Activity for Children/Adolescents (WCC):
BMI Percentile: 3–11 years 71.33% 75.08% 64.83%
12–17 years 65.74% 71.33% 63.19%
Total 69.55% 73.88% 64.37%
Counseling for Nutrition: 3–11 years 62.76% 66.25% 61.62%
12–17 years 54.98% 61.33% 57.30%
Total 60.29% 64.66% 60.22%
Counseling for Physical Activity: 3–11 years 53.08% 55.64% 52.40%
12–17 years 54.47% 59.45% 55.24%
Total 53.59% 56.89% 53.44%
Childhood Immunization Status (CIS):
DTaP/DT 76.91% 73.60% 76.33%
IPV 91.23% 89.47% 87.70%
MMR 88.46% 86.49% 89.21%
HiB 88.77% 86.28% 87.62%
HepB 92.14% 90.60% 87.70%
VZV 88.52% 86.55% 88.79%
PCV 79.20% 75.52% 76.53%
HepA 87.18% 85.67% 83.70%
RV 69.62% 68.68% 67.94%
Influenza 42.86% 37.56% 45.74%
Combination 2 74.27% 70.82% 72.46%
Combination 3 71.08% 68.02% 68.99%
Combination 4 70.27% 67.66% 65.91%

2017 HEDIS/CAHPS REPORT
Medicaid Results
page 30TennCare 17.EQRO.06.017
Table 1a. HEDIS 2017 State to National Medicaid Rates: Effectiveness of Care Measures
MeasureWeighted State Rate HEDIS 2016
Medicaid National Avg.
Change 2016 to
20172016 2017
Combination 5 57.87% 56.44% 57.21%
Combination 6 37.28% 32.31% 39.01%
Combination 7 57.32% 56.20% 55.17%
Combination 8 37.02% 32.19% 38.01%
Combination 9 31.78% 28.06% 33.86%
Combination 10 31.64% 27.94% 33.24%
Immunizations for Adolescents (IMA):
Meningococcal 67.84% 69.74% 74.79%
Tdap/Td 81.80% 82.75% 83.36%
HPV* 15.89% 13.23% 22.71%
Combination 1 67.13% 68.87% 72.66%
Combination 2** 12.55%
Lead Screening in Children (LSC) 70.29% 70.64% 66.50%
Breast Cancer Screening (BCS) 54.47% 54.90% 58.50%
Cervical Cancer Screening (CCS) 55.60% 59.21% 55.85%
Chlamydia Screening in Women (CHL):
16–20 years 48.17% 49.57% 51.49%
21–24 years 54.61% 57.38% 60.65%
Total 51.19% 52.76% 55.27%
Respiratory Conditions
Appropriate Testing for Children With Pharyngitis (CWP) 79.45% 82.67% 71.12%
Use of Spirometry Testing in the Assessment and Diagnosis of COPD (SPR) 31.36% 31.72% 30.96%
Pharmacotherapy Management of COPD Exacerbation (PCE):
Systemic corticosteroid 52.23% 47.75% 67.10%
Bronchodilator 75.41% 72.71% 79.92%
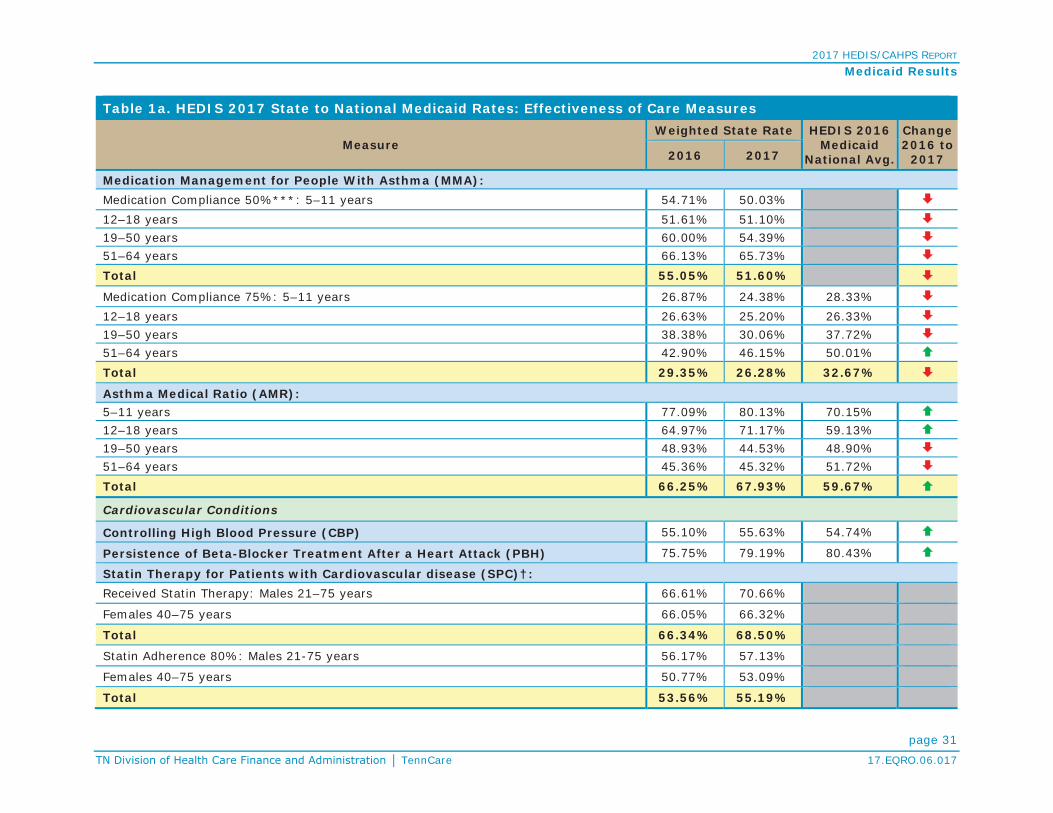
2017 HEDIS/CAHPS REPORT
Medicaid Results
page 31TennCare 17.EQRO.06.017
Table 1a. HEDIS 2017 State to National Medicaid Rates: Effectiveness of Care Measures
MeasureWeighted State Rate HEDIS 2016
Medicaid National Avg.
Change 2016 to
20172016 2017
Medication Management for People With Asthma (MMA):Medication Compliance 50%***: 5–11 years 54.71% 50.03%12–18 years 51.61% 51.10%19–50 years 60.00% 54.39%51–64 years 66.13% 65.73%Total 55.05% 51.60%
Medication Compliance 75%: 5–11 years 26.87% 24.38% 28.33%12–18 years 26.63% 25.20% 26.33%19–50 years 38.38% 30.06% 37.72%51–64 years 42.90% 46.15% 50.01%Total 29.35% 26.28% 32.67%
Asthma Medical Ratio (AMR):5–11 years 77.09% 80.13% 70.15%12–18 years 64.97% 71.17% 59.13%19–50 years 48.93% 44.53% 48.90%51–64 years 45.36% 45.32% 51.72%Total 66.25% 67.93% 59.67%
Cardiovascular Conditions
Controlling High Blood Pressure (CBP) 55.10% 55.63% 54.74%
Persistence of Beta-Blocker Treatment After a Heart Attack (PBH) 75.75% 79.19% 80.43%
Statin Therapy for Patients with Cardiovascular disease (SPC)†:Received Statin Therapy: Males 21–75 years 66.61% 70.66%
Females 40–75 years 66.05% 66.32%
Total 66.34% 68.50%
Statin Adherence 80%: Males 21-75 years 56.17% 57.13%
Females 40–75 years 50.77% 53.09%
Total 53.56% 55.19%

2017 HEDIS/CAHPS REPORT
Medicaid Results
page 32TennCare 17.EQRO.06.017
Table 1a. HEDIS 2017 State to National Medicaid Rates: Effectiveness of Care Measures
MeasureWeighted State Rate HEDIS 2016
Medicaid National Avg.
Change 2016 to
20172016 2017
Diabetes
Comprehensive Diabetes Care (CDC):
HbA1c Testing 82.59% 82.51% 85.94%
HbA1c Control (<7.0%) 34.64% 37.43% 32.36%
HbA1c Control (<8.0%) 47.62% 49.07% 45.54%
Retinal Eye Exam Performed 42.87% 44.87% 52.68%
Medical Attention for Nephropathy 90.89% 89.06% 90.01%
Blood Pressure Control (<140/90 mm Hg) 58.22% 58.35% 59.04%
Statin Therapy for Patients with Diabetes (SPD)†
Received Statin Therapy: 40–75 years 53.06% 54.06%
Statin Adherence 80%: 40–75 years 48.03% 50.57%
Musculoskeletal Conditions
Disease-Modifying Anti-Rheumatic Drug Therapy for Rheumatoid Arthritis (ART) 62.66% 63.65% 71.69%
Behavioral Health
Antidepressant Medication Management (AMM):
Effective Acute Phase Treatment 47.75% 46.52% 54.45%
Effective Continuation Phase Treatment 32.19% 30.56% 39.44%
Follow-Up Care for Children Prescribed ADHD Medication (ADD):
Initiation Phase 49.26% 44.95% 42.20%
Continuation and Maintenance Phase 63.14% 59.45% 50.93%
Follow-Up After Hospitalization for Mental Illness (FUH):
7-Day Follow-Up 55.95% 58.82% 43.71%
30-Day Follow-Up 70.63% 71.29% 61.29%

2017 HEDIS/CAHPS REPORT
Medicaid Results
page 33TennCare 17.EQRO.06.017
Table 1a. HEDIS 2017 State to National Medicaid Rates: Effectiveness of Care Measures
MeasureWeighted State Rate HEDIS 2016
Medicaid National Avg.
Change 2016 to
20172016 2017
Follow-Up After Emergency Department Visit for Mental Illness (FUM)**:7-Day Follow-Up 36.45%
30-Day Follow-Up 56.59%
Follow-Up After Emergency Department Visit for Alcohol and Other Drug Dependence (FUA)**:
7-Day Follow-Up: 13–17 years 11.96%
18 years and older 8.37%
Total 8.66%
30-Day Follow-Up: 13–17 years 17.28%
18 years and older 10.64%
Total 11.19%
Diabetes Screening for People With Schizophrenia or Bipolar Disorder Who Are Using Antipsychotic Medications (SSD) 81.20% 82.51% 80.37%
Diabetes Monitoring for People With Diabetes and Schizophrenia (SMD) 69.70% 70.29% 68.20%
Cardiovascular Monitoring for People With Cardiovascular Disease and Schizophrenia (SMC) 82.89% 80.49% 78.47%
Adherence to Antipsychotic Medications for Individuals With Schizophrenia (SAA) 58.62% 58.68% 57.88%
Metabolic Monitoring for Children and Adolescents on Antipsychotics (APM):
1–5 Years 13.59% 13.33% 16.70%
6–11 Years 28.71% 27.92% 26.16%
12–17 Years 37.69% 37.93% 32.05%
Total 34.10% 34.12% 29.84%
Medication Management
Annual Monitoring for Patients on Persistent Medications (MPM):
ACE Inhibitors or ARBs 90.46% 90.30% 87.51%
Digoxin 54.95% 58.22% 54.01%
Diuretics 90.92% 90.70% 87.49%

2017 HEDIS/CAHPS REPORT
Medicaid Results
page 34TennCare 17.EQRO.06.017
Table 1a. HEDIS 2017 State to National Medicaid Rates: Effectiveness of Care Measures
MeasureWeighted State Rate HEDIS 2016
Medicaid National Avg.
Change 2016 to
20172016 2017
Total 90.31% 90.22% 87.28%
Overuse/Appropriateness
Appropriate Treatment for Children With Upper Respiratory Infection (URI) 79.25% 81.85% 87.76%
Avoidance of Antibiotic Treatment in Adults With Acute Bronchitis (AAB) 30.49% 32.61% 28.09%
Use of Imaging Studies for Low Back Pain (LBP) 65.56% 61.94% 73.57%
Measures Collected Though CAHPS
Flu vaccinations for adults ages 18 to 64 (FVA) 36.92% 40.31% 38.46%
Medical Assistance With Smoking and Tobacco Use Cessation (MSC):
Advising Smokers and Tobacco Users to Quit 77.05% 77.12% 75.89%
Discussing Cessation Medications 43.01% 44.72% 48.12%
Discussing Cessation Strategies 38.28% 38.55% 43.28%
Supplemental Data - % Current Smokers†† 37.28% 36.94% 31.02%
*For HEDIS 2017, the HPV measure was integrated into the IMA measure for reporting purposes and expanded to both genders.**First-year measure.***Benchmarks are currently not reported by Quality Compass for this rate.†Benchmarks are not reported by Quality Compass for 2016 first-year measures.†† For this measure, rate is not intended to indicate good or poor performance, but for informative purposes to monitor population of current smokers.
For the Effectiveness of Care Measures presented in Table 1b, a lower rate (particularly one below the national average) is an indication of better performance ( ). A decrease in rates from the prior year also indicates improvement.
Table 1b. HEDIS 2017 State to National Medicaid Rates: Measures Where Lower Rates Indicate Better Performance
MeasureWeighted State Rate HEDIS 2016
Medicaid National Avg.
Change 2016 to
20172016 2017
Diabetes
Comprehensive Diabetes Care (CDC):
HbA1c Poor Control (>9.0%) 43.23% 41.92% 45.35%

2017 HEDIS/CAHPS REPORT
Medicaid Results
page 35TennCare 17.EQRO.06.017
Table 1b. HEDIS 2017 State to National Medicaid Rates: Measures Where Lower Rates Indicate Better Performance
MeasureWeighted State Rate HEDIS 2016
Medicaid National Avg.
Change 2016 to
20172016 2017
Overuse/Appropriateness
Non-Recommended Cervical Cancer Screening in Adolescent Females (NCS) 5.25% 3.83% 2.71%
Use of Multiple Concurrent Antipsychotics in Children and Adolescents (APC):
1–5 Years 1.49% 2.94% 0.66%
6–11 Years 1.71% 1.77% 1.82%
12–17 Years 3.41% 3.22% 3.00%
Total 2.78% 2.72% 2.49%
Table 2 summarizes results for the Access/Availability Domain of Care.
Table 2. HEDIS 2017 State to National Medicaid Rates: Access/Availability of Care Measures
MeasureWeighted State Rate HEDIS 2016
Medicaid National Avg.
Change 2016 to
20172016 2017
Adults’ Access to Preventive/Ambulatory Health Services (AAP):20–44 years 73.00% 74.37% 77.27%
45–64 years 84.97% 85.11% 85.52%
Children and Adolescents’ Access to Primary Care Practitioners (CAP):12–24 months 91.77% 93.70% 94.69%
25 months–6 years 85.15% 84.48% 87.24%
7–11 years 91.15% 89.55% 90.23%
12–19 years 87.78% 86.19% 88.60%
Initiation and Engagement of Alcohol and Other Drug (AOD) Dependence Treatment (IET):
Initiation of AOD Treatment: 13–17 years 49.11% 48.29% 42.25%
33.36% 35.62% 37.94%
Total 34.22% 36.30% 38.23%

2017 HEDIS/CAHPS REPORT
Medicaid Results
page 36TennCare 17.EQRO.06.017
Table 2. HEDIS 2017 State to National Medicaid Rates: Access/Availability of Care Measures
MeasureWeighted State Rate HEDIS 2016
Medicaid National Avg.
Change 2016 to
20172016 2017
Engagement of AOD Treatment: 13–17 years 25.96% 25.65% 15.44%
8.70% 10.34% 9.69%
Total 9.64% 11.16% 10.23%
Prenatal and Postpartum Care (PPC):
Timeliness of Prenatal Care 76.34% 76.94% 80.03%
Postpartum Care 55.57% 59.35% 60.93%
Use of First-Line Psychosocial Care for Children and Adolescents on Antipsychotics (APP):
1–5 Years 30.51% 39.18% 49.04%
6–11 Years 53.91% 53.69% 58.83%
12–17 Years 53.50% 58.23% 59.12%
Total 52.80% 56.04% 57.44%
Table 3 summarizes results for the Utilization measures included in the Utilization and Risk-Adjusted Utilization Domain of Care.
Table 3. HEDIS 2017 State to National Medicaid Rates: Utilization Measures
MeasureWeighted State Rate HEDIS 2016
Medicaid National Avg.
Change 2016 to
20172016 2017
Frequency of Ongoing Prenatal Care (FPC):
55.51% 57.09% 56.61%
Well-Child Visits in the First 15 Months of Life (W15):
6 or More Visits 57.63% 60.94% 59.35%
Well-Child Visits in the Third, Fourth, Fifth and Sixth Years of Life (W34) 68.01% 69.18% 71.27%
Adolescent Well-Care Visits (AWC) 42.34% 46.61% 48.89%

2017 HEDIS/CAHPS REPORT
Medicaid Results
page 37TennCare 17.EQRO.06.017
Individual Plan Performance—HEDIS MeasuresThis section is intended to provide an overview of individual plan performance using appropriate and available comparison data. The results highlight those areas where each MCO is performing in relation to the HEDIS 2016 National Medicaid Means and Percentiles for select MCO-reported HEDIS measures. Qsource uses these data to determine overall TennCare plan performance in a distribution of statistical values that represent the lowest to highest percentiles achieved. For example, the 50th percentile represents the point at which half of the reported rates are below and half of the reported rates are above that value.
Tables 5 (a and b), 6 and 7 display the plan-specific performance rates for each measure selected from the Effectiveness of Care, Access/Availability of Care, and Utilization and Risk-Adjusted Utilization domains. Table 4 details the potential color-coding and measure designations used in Tables 5a through 7 to indicate the rating of the MCO percentile achieved, and provides additional related comments. While Medical Assistance With Smoking and Tobacco Use Cessation is an Effectiveness of Care measure, results are reported through the CPA as noted in Tables 1a and 5a.
Table 4. HEDIS 2017 Rating Color and Measure DesignationsColor Designation Percentile MCO Achieved Additional Comments
Greater than 75th No additional comments
25th to 75th No additional comments
Less than 25th No additional comments
No Rating Available Benchmarking data not available
Measure Designation DefinitionR Reportable, a reportable rate was submitted for the measure.
NA Not Applicable, there was a small denominator, i.e., the MCO followed the specifications, but the denominator was too small (<30) to report a valid rate, hence results are not presented.
NB No Benefit, the MCO did not offer the health benefit required by the measure (e.g., mental health, chemical dependency).
NR Not Reported, the MCO chose not to report the measure.
NQ Not Required, the MCO was not required to report the measure.

2017 HEDIS/CAHPS REPORT
Medicaid Results
page 38TennCare 17.EQRO.06.017
Table 4. HEDIS 2017 Rating Color and Measure DesignationsBR Biased Rate, the calculated rate was materially biased.
UN Un-Audited, the MCO chose to report a measure that is not required to be audited. This result applies to only a limited set of measures.
Table 5a. HEDIS 2017 Plan-Specific Medicaid Rates: Effectiveness of Care Measures
Measure AGE AGM AGW BCE BCM BCW TCS UHCE UHCM UHCW
HEDIS 2016 National
Medicaid 50th Percentile
Prevention and Screening
Adult BMI Assessment (ABA) 81.21% 90.02% 89.33% 81.48% 82.77% 90.00% 65.57% 93.48% 88.08% 87.77% 84.54%
Weight Assessment and Counseling for Nutrition and Physical Activity for Children/Adolescents (WCC):
BMI Percentile: 3–11 years 74.91% 84.56% 79.04% 67.83% 69.45% 75.27% 70.00% 72.30% 79.06% 77.36% 68.22%
12–17 years 67.32% 72.39% 78.01% 70.40% 71.85% 77.21% 66.30% 64.00% 66.67% 80.71% 65.74%
Total 72.22% 80.79% 78.70% 68.61% 70.24% 75.91% 68.37% 69.73% 75.52% 78.52% 67.54%
Counseling for Nutrition: 3–11 years 63.08% 77.52% 69.07% 61.19% 60.36% 69.09% 51.30% 66.91% 70.40% 64.91% 63.33%
12–17 years 58.82% 56.72% 68.79% 62.40% 61.48% 64.71% 54.14% 56.80% 62.16% 67.86% 57.35%
Total 61.57% 71.06% 68.98% 61.56% 60.73% 67.64% 52.55% 63.77% 68.04% 65.93% 62.65%
Counseling for Physical Activity: 3–11 years 53.05% 69.80% 57.39% 47.55% 50.55% 61.45% 41.74% 56.12% 60.29% 50.19% 53.99%
12–17 years 58.17% 54.48% 63.12% 60.00% 61.48% 66.18% 50.28% 56.00% 59.46% 64.29% 55.75%
Total 54.86% 65.05% 59.26% 51.34% 54.15% 63.02% 45.50% 56.08% 60.05% 55.06% 55.38%
Childhood Immunization Status (CIS):
DTaP/DT 67.13% 75.23% 68.52% 77.62% 72.75% 72.51% 64.23% 78.35% 77.37% 69.83% 77.97%
IPV 86.34% 90.05% 87.27% 92.21% 90.75% 87.59% 80.05% 92.21% 91.48% 87.10% 89.78%
MMR 82.41% 88.19% 86.57% 89.29% 87.10% 84.91% 76.40% 90.02% 86.13% 84.18% 90.47%

2017 HEDIS/CAHPS REPORT
Medicaid Results
page 39TennCare 17.EQRO.06.017
Table 5a. HEDIS 2017 Plan-Specific Medicaid Rates: Effectiveness of Care Measures
Measure AGE AGM AGW BCE BCM BCW TCS UHCE UHCM UHCW
HEDIS 2016 National
Medicaid 50th Percentile
HiB 81.25% 87.27% 83.56% 89.78% 86.13% 86.37% 76.16% 89.29% 87.35% 84.43% 89.37%
HepB 88.43% 90.51% 90.51% 94.16% 89.78% 88.81% 80.05% 93.92% 91.48% 89.05% 90.05%
VZV 81.48% 88.89% 85.65% 88.81% 88.56% 84.43% 75.18% 90.02% 88.56% 82.24% 89.97%
PCV 68.75% 78.01% 68.06% 79.56% 75.91% 72.26% 68.37% 79.56% 81.75% 70.56% 78.59%
HepA 80.56% 87.96% 86.34% 88.08% 87.35% 83.45% 75.18% 89.54% 85.89% 82.00% 84.91%
RV 55.56% 74.77% 58.56% 72.02% 68.13% 68.86% 45.74% 72.99% 76.89% 65.45% 69.34%
Flu 31.25% 49.54% 21.76% 44.04% 43.31% 25.30% 41.85% 38.93% 45.99% 23.11% 45.99%
Combination 2 63.66% 73.15% 65.51% 76.16% 70.80% 69.34% 60.34% 75.18% 73.72% 66.18% 75.18%
Combination 3 59.49% 71.30% 61.81% 74.21% 68.13% 65.45% 57.91% 71.78% 71.78% 63.02% 71.06%
Combination 4 58.56% 71.06% 61.81% 73.48% 67.64% 65.45% 57.66% 71.29% 71.53% 62.77% 67.96%
Combination 5 41.20% 62.27% 47.69% 60.34% 55.47% 57.42% 35.04% 59.12% 65.69% 52.55% 58.98%
Combination 6 26.39% 43.52% 17.59% 38.69% 35.52% 19.95% 33.82% 34.79% 41.12% 19.95% 39.14%
Combination 7 40.97% 62.04% 47.69% 60.10% 54.99% 57.42% 35.04% 58.64% 65.45% 52.31% 56.85%
Combination 8 26.39% 43.29% 17.59% 38.44% 35.28% 19.95% 33.82% 34.55% 41.12% 19.95% 38.20%
Combination 9 21.30% 39.35% 14.81% 32.85% 31.39% 18.25% 21.17% 29.93% 37.47% 16.79% 33.10%
Combination 10 21.30% 39.12% 14.81% 32.60% 31.14% 18.25% 21.17% 29.68% 37.47% 16.79% 32.64%
Immunization for Adolescents (IMA):
Meningococcal 71.30% 70.83% 68.52% 71.53% 71.29% 71.05% 67.40% 65.45% 69.83% 68.13% 77.21%
Tdap/Td 83.10% 83.80% 81.25% 85.40% 84.67% 85.16% 77.62% 78.83% 83.70% 80.78% 86.14%
HPV* 12.73% 13.89% 10.19% 17.76% 13.38% 10.46% 11.19% 12.90% 16.30% 11.44% 22.30%
Combination 1 70.37% 69.91% 67.82% 71.05% 69.83% 70.80% 66.91% 64.72% 68.13% 67.40% 74.52%
Combination 2** 12.27% 13.19% 10.19% 16.55% 12.65% 10.46% 9.98% 11.92% 15.33% 10.95%
Lead Screening in Children (LSC) 62.27% 73.15% 65.51% 75.67% 69.34% 66.18% 62.77% 77.62% 75.91% 65.21% 71.05%
Breast Cancer Screening (BCS) 34.89% 48.58% 43.68% 60.65% 56.93% 60.18% 60.18% 57.73% 51.59% 49.93% 58.08%
Cervical Cancer Screening (CCS) 35.58% 58.60% 49.07% 67.23% 59.61% 67.65% 28.47% 60.93% 67.78% 61.56% 55.94%

2017 HEDIS/CAHPS REPORT
Medicaid Results
page 40TennCare 17.EQRO.06.017
Table 5a. HEDIS 2017 Plan-Specific Medicaid Rates: Effectiveness of Care Measures
Measure AGE AGM AGW BCE BCM BCW TCS UHCE UHCM UHCW
HEDIS 2016 National
Medicaid 50th Percentile
Chlamydia Screening in Women (CHL):
16–20 years 48.69% 48.69% 55.04% 44.31% 53.08% 51.30% 52.95% 45.94% 50.77% 49.83% 50.56%
21–24 years 55.77% 57.51% 63.42% 48.76% 56.76% 61.29% 38.65% 55.65% 59.02% 62.79% 61.37%
Total 52.12% 52.11% 59.25% 46.17% 54.85% 55.35% 52.12% 49.40% 53.93% 55.20% 55.16%
Respiratory Conditions
Appropriate Testing for Children with Pharyngitis (CWP) 72.20% 79.73% 74.65% 84.41% 91.16% 85.03% 85.06% 79.08% 88.26% 82.13% 71.62%
Use of Spirometry Testing in the Assessment and
Diagnosis of COPD (SPR) 26.42% 29.24% 46.67% 32.35% 33.72% 39.34% NA 30.10% 27.72% 36.33% 30.26%
Pharmacotherapy Management of COPD Exacerbation (PCE):
Systemic corticosteroid 51.53% 48.65% 59.00% 45.12% 42.52% 43.27% NA 49.66% 46.13% 49.84% 70.39%
Bronchodilator 71.85% 75.03% 76.60% 72.05% 66.51% 75.40% NA 74.00% 72.04% 73.46% 83.70%
Medication Management for People With Asthma (MMA):
Medication Compliance 50%*** :5–11 years 52.72% 50.78% 36.90% 58.47% 48.71% 46.83% 52.74% 48.53% 50.26% 45.41%
12–18 years 51.81% 54.30% 43.49% 56.53% 48.78% 44.94% 61.75% 46.65% 49.64% 44.15%
19–50 years 55.02% 55.65% 44.70% 58.04% 49.23% 53.24% 60.00% 61.36% 56.80% 48.09%
51–64 years NA 71.19% 51.11% 58.33% 85.71% 53.85% NA 67.11% 74.51% 59.52%
Total 53.39% 53.46% 40.88% 57.78% 49.61% 47.72% 57.27% 51.48% 52.28% 46.10%
Medication Compliance 75% : 5–11 years 25.68% 26.16% 14.62% 32.13% 20.74% 20.29% 31.75% 22.27% 24.29% 19.51% 25.88%
12–18 years 23.68% 27.04% 17.81% 31.56% 22.45% 20.60% 38.65% 15.94% 27.82% 16.08% 25.00%
19–50 years 32.75% 33.06% 21.59% 30.65% 24.15% 29.58% 38.89% 36.81% 34.02% 20.99% 36.25%
51–64 years 47.37% 47.46% 31.11% 37.50% 57.14% 40.38% 50.00% 48.68% 62.75% 42.86% 49.48%
Total 26.78% 28.57% 17.64% 31.80% 22.67% 22.76% 35.38% 24.67% 28.55% 19.67% 31.28%

2017 HEDIS/CAHPS REPORT
Medicaid Results
page 41TennCare 17.EQRO.06.017
Table 5a. HEDIS 2017 Plan-Specific Medicaid Rates: Effectiveness of Care Measures
Measure AGE AGM AGW BCE BCM BCW TCS UHCE UHCM UHCW
HEDIS 2016 National
Medicaid 50th Percentile
Asthma Medical Ratio (AMR):
5–11 years 77.63% 78.53% 65.68% 86.10% 80.48% 82.83% 83.45% 83.33% 79.68% 74.21% 71.74%
12–18 years 68.64% 66.67% 68.13% 79.21% 71.32% 72.18% 76.41% 68.82% 64.66% 64.66% 60.50%
19–50 years 41.16% 44.95% 39.48% 50.24% 33.93% 41.32% 65.74% 51.59% 46.91% 41.99% 49.00%
51–64 years 38.46% 43.01% 47.62% 36.36% 45.83% 47.22% NA 51.69% 52.63% 38.89% 52.03%
Total 65.01% 65.34% 58.08% 75.40% 64.94% 68.59% 78.70% 69.58% 66.05% 61.88% 61.26%
Cardiovascular Conditions
Controlling High Blood Pressure (CBP) 48.49% 51.51% 45.94% 63.54% 60.98% 60.10% 64.47% 59.18% 47.56% 52.55% 54.78%
Persistence of Beta-Blocker Treat-ment after a Heart Attack (PBH) 60.76% 79.79% 54.17% 88.89% 62.50% 80.39% NA 91.84% 88.73% 85.71% 83.06%
Statin Therapy for Patients with Cardiovascular disease (SPC)†:
Received Statin Therapy: Males 21–75 years 67.77% 72.46% 74.15% 67.91% 68.03% 69.10% NA 73.21% 69.02% 72.76%
Females 40–75 years 69.89% 65.44% 68.91% 64.86% 65.79% 61.59% NA 68.38% 65.41% 68.42%
Total 68.66% 69.33% 71.79% 66.31% 66.93% 64.94% NA 70.84% 67.13% 70.61%
Statin Adherence 80%: Males 21–75 years 50.00% 61.73% 44.00% 54.07% 45.11% 44.73% NA 65.99% 64.59% 56.28%
Females 40–75 years 39.02% 55.28% 39.10% 47.71% 42.00% 34.22% NA 66.57% 60.58% 55.92%
Total 45.30% 59.02% 41.88% 50.80% 43.60% 39.20% NA 66.26% 62.55% 56.11%
Diabetes
Comprehensive Diabetes Care (CDC):
HbA1c Testing 78.11% 86.11% 80.92% 82.57% 81.09% 82.38% 70.81% 85.67% 80.97% 82.00% 85.95%
HbA1c Control (<7.0%) 36.03% 38.32% 35.06% 39.90% 34.31% 35.77% 36.05% 42.02% 35.29% 35.04% 33.82%
HbA1c Control (<8.0%) 40.63% 48.83% 41.49% 50.59% 47.36% 44.80% 42.44% 58.22% 50.67% 48.78% 46.76%
Retinal Eye Exam Performed 28.69% 43.86% 34.98% 48.56% 36.97% 53.86% 54.24% 55.11% 40.61% 43.44% 53.28%

2017 HEDIS/CAHPS REPORT
Medicaid Results
page 42TennCare 17.EQRO.06.017
Table 5a. HEDIS 2017 Plan-Specific Medicaid Rates: Effectiveness of Care Measures
Measure AGE AGM AGW BCE BCM BCW TCS UHCE UHCM UHCW
HEDIS 2016 National
Medicaid 50th Percentile
Medical Attention for Nephropathy 89.55% 88.16% 90.94% 90.02% 88.93% 87.92% 73.29% 90.00% 87.52% 90.00% 90.51%
BP Control (<140/90 mm Hg) 54.39% 59.80% 50.08% 66.16% 59.45% 55.03% 62.73% 60.89% 57.45% 52.78% 59.73%Statin Therapy for Patients with Diabetes (SPD)†:Received Statin Therapy: 40–75 yrs 52.95% 54.89% 56.63% 53.35% 50.84% 53.80% 48.00% 56.31% 52.10% 54.71%
Statin Adherence 80%: 40–75 yrs. 45.31% 56.41% 38.99% 44.51% 41.29% 36.39% 83.33% 59.77% 60.34% 55.21%
Musculoskeletal Conditions
Disease-Modifying Anti-Rheumatic Drug Therapy for Rheumatoid Arthritis (ART) 65.41% 63.99% 57.42% 70.00% 53.21% 63.76% NA 69.58% 58.17% 55.87% 72.22%
Behavioral Health
Antidepressant Medication Management (AMM):Effective Acute Phase Treatment 52.15% 50.28% 44.99% 45.53% 42.74% 38.00% 38.58% 51.47% 47.48% 44.56% 53.38%
Effective Continuation Phase Treatment 36.80% 36.13% 29.55% 28.00% 27.23% 21.98% 19.69% 34.59% 31.83% 28.72% 38.06%
Follow-Up Care for Children Prescribed ADHD Medication (ADD):Initiation Phase 45.41% 48.51% 34.28% 47.25% 41.70% 38.79% 40.69% 55.09% 54.63% 41.34% 42.19%
Continuation and Maintenance Phase 60.81% 60.85% 48.84% 60.63% 57.87% 57.20% 50.00% 71.43% 64.48% 62.50% 52.47%Follow-Up After Hospitalization for Mental Illness (FUH):7-Day Follow-Up 55.19% 50.48% 57.55% 65.01% 46.51% 66.58% 62.48% 64.02% 55.38% 65.48% 44.05%
30-Day Follow-Up 69.26% 68.58% 64.81% 76.80% 59.31% 77.26% 74.28% 77.26% 69.88% 75.19% 63.94%Follow-Up After Emergency Department Visit for Mental Illness (FUM)**:7-Day Follow-Up 25.09% 36.86% 19.18% 38.89% 33.02% 32.74% 48.24% BR BR BR
30-Day Follow-Up 40.94% 49.38% 38.36% 61.73% 51.14% 58.11% 69.84% BR BR BRFollow-Up After Emergency Department Visit for Alcohol and Other Drug Dependence (FUA)**:7-Day Follow-Up: 13–17 years NA 2.22% NA 6.12% 17.07% NA 21.19% BR BR BR
18 years and older 2.83% 3.08% 5.90% 10.15% 11.81% 16.51% 9.86% BR BR BR
Total 2.71% 3.01% 5.74% 9.90% 12.07% 15.82% 16.93% BR BR BR

2017 HEDIS/CAHPS REPORT
Medicaid Results
page 43TennCare 17.EQRO.06.017
Table 5a. HEDIS 2017 Plan-Specific Medicaid Rates: Effectiveness of Care Measures
Measure AGE AGM AGW BCE BCM BCW TCS UHCE UHCM UHCW
HEDIS 2016 National
Medicaid 50th Percentile
30-Day Follow-Up: 13–17 years NA 6.67% NA 14.29% 21.95% NA 27.12% BR BR BR
18 years and older 4.16% 4.82% 6.94% 13.13% 14.82% 19.31% 11.27% BR BR BR
Total 4.15% 4.96% 6.76% 13.20% 15.17% 18.51% 21.16% BR BR BR
Diabetes Screening for People With Schizophrenia or Bipolar Disorder Who Are Using
Antipsychotic Medication (SSD) 82.44% 82.71% 78.20% 83.12% 80.79% 81.01% 82.39% 86.04% 86.51% 78.99% 80.72%
Diabetes Monitoring for People With Diabetes
and Schizophrenia (SMD) 62.22% 78.45% 62.43% 70.85% 72.41% 64.48% 71.43% 75.00% 71.15% 69.59% 68.93%
Cardiovascular Monitoring for People With
Schizophrenia (SMC) NA NA NA 78.33% NA 82.46% NA 81.67% 75.41% 80.39% 80.00%
Adherence to Antipsychotic Medications for Individuals
With Schizophrenia (SAA) 52.30% 62.85% 44.85% 66.08% 49.07% 56.08% 72.24% 59.33% 71.01% 56.67% 59.79%
Metabolic Monitoring for Children and Adolescents on Antipsychotics (APM):
1–5 Years NA NA NA 14.29% NA NA 11.11% NA NA NA 15.33%
6–11 Years 31.16% 31.46% 16.67% 33.56% 27.31% 17.22% 29.65% 27.53% 27.05% 21.26% 25.19% 12–17 Years 30.67% 35.20% 27.41% 36.11% 37.04% 29.38% 44.28% 38.81% 31.03% 22.61% 32.33% Total 30.65% 33.73% 22.83% 34.49% 32.91% 24.37% 39.60% 34.19% 29.00% 22.00% 29.63% Medication Management
Annual Monitoring for Patients on Persistent Medications (MPM):
ACE Inhibitors or ARBs 90.25% 89.21% 90.11% 89.49% 85.65% 89.51% 84.71% 93.06% 90.60% 92.72% 87.43%
Digoxin 60.61% 44.19% 55.10% 52.00% 43.90% 65.43% NA 59.12% 64.52% 67.26% 53.94%
Diuretics 90.42% 89.93% 89.28% 90.85% 86.63% 88.72% 88.89% 93.88% 91.85% 92.32% 87.52%
Total 90.13% 89.10% 89.43% 89.86% 85.87% 88.89% 86.00% 93.09% 90.88% 92.24% 87.23%
Overuse/Appropriateness
Appropriate Treatment for Children with Upper
Respiratory Infection (URI) 76.90% 87.18% 79.35% 79.16% 85.88% 74.06% 79.60% 77.22% 87.68% 81.53% 89.39%

2017 HEDIS/CAHPS REPORT
Medicaid Results
page 44TennCare 17.EQRO.06.017
Table 5a. HEDIS 2017 Plan-Specific Medicaid Rates: Effectiveness of Care Measures
Measure AGE AGM AGW BCE BCM BCW TCS UHCE UHCM UHCW
HEDIS 2016 National
Medicaid 50th Percentile
Avoidance of Antibiotic Treatment in Adults with Acute
Bronchitis (AAB) 27.91% 29.69% 32.78% 30.88% 37.21% 33.74% 36.57% 33.18% 33.02% 36.00% 26.17%
Use of Imaging Studies for Low Back Pain (LBP) 67.36% 68.40% 69.65% 58.29% 60.89% 62.57% 63.79% 57.42% 57.04% 58.29% 73.71%
Measures Collected Through CAHPS Health Plan Survey
Flu vaccinations for adults ages 18 to 64 (FVA) 35.62% 45.27% 31.29% 39.43% 40.00% 40.96% 36.13% 40.06% 44.69% 44.55% 38.03%
Medical Assistance with Smoking and Tobacco Use Cessation (MSC):
Advising Smokers and Tobacco Users to Quit 70.94% 77.36% 74.53% 81.39% 77.27% 79.44% NA 77.25% 81.14% 80.08% 76.59%
Discussing Cessation Medications 37.97% 45.21% 37.50% 51.47% 42.35% 48.90% NA 50.80% 45.07% 45.57% 48.31%
Discussing Cessation Strategies 30.70% 42.37% 31.58% 44.44% 39.90% 46.15% NA 38.34% 39.64% 38.79% 43.82%
Supplemental Data - % Current Smokers†† 50.49% 33.87% 36.30% 44.38% 42.45% 33.45% 18.54% 38.19% 35.20% 29.97% 31.68%
*For HEDIS 2017, the HPV measure was integrated into the IMA measure for reporting purposes and expanded to both genders.**First-year measure.***Benchmarks are currently not reported by Quality Compass for this rate.†Benchmarks are not reported by Quality Compass for 2016 first-year measures.†† A higher rate in Quality Compass is not intended to indicate good or poor performance, but rather indicate the percentages of plans who have higher rates of current smokers.

2017 HEDIS/CAHPS REPORT
Medicaid Results
page 45TennCare 17.EQRO.06.017
For the Effectiveness of Care Measures presented in Table 5b, a lower rate (particularly one below the national 50th percentile) is an indication of better performance. For example, a rate in the 10th percentile is better than a rate in the 90th percentile.
Table 5b. HEDIS 2017 Plan-Specific Medicaid Rates: Effectiveness of Care Measures Where Lower Rates Indicate Better Performance
Measure AGE AGM AGW BCE BCM BCW TCS UHCE UHCM UHCW
HEDIS 2016 National
Medicaid 50th Percentile
Diabetes
Comprehensive Diabetes Care (CDC):
HbA1c Poor Control (>9.0%) 49.09% 40.79% 50.56% 39.42% 44.63% 47.15% 53.21% 32.67% 40.85% 42.33% 43.80%
Overuse/Appropriateness
Non-Recommended Cervical Cancer Screening in
Adolescent Females (NCS) 2.75% 2.20% 4.25% 3.91% 3.99% 4.47% 3.36% 4.57% 3.89% 4.54% 2.42%
Use of Multiple Concurrent Antipsychotics in Children and Adolescents (APC):
1–5 Years NA NA NA NA NA NA 2.56% NA NA NA 0.00%
6–11 Years 0.97% 1.76% 0.00% 2.02% 1.18% 1.35% 2.54% 1.60% 0.63% 0.88% 1.56%
12–17 Years 2.27% 2.34% 2.31% 3.66% 2.57% 3.17% 3.71% 2.47% 2.45% 3.01% 2.53%
Total 1.82% 2.09% 1.33% 3.15% 2.02% 2.41% 3.36% 2.08% 1.76% 2.13% 1.99%
Table 6. HEDIS 2017 Plan-Specific Medicaid Rates: Access/Availability of Care Measures
Measure AGE AGM AGW BCE BCM BCW TCS UHCE UHCM UHCW
HEDIS 2016 National
Medicaid 50th Percentile
Adults’ Access to Preventive/Ambulatory Health Services (AAP):20–44 years 67.03% 75.26% 70.77% 79.23% 75.60% 77.92% 42.79% 75.58% 77.90% 73.56% 79.48%
45–64 years 78.63% 84.59% 81.03% 89.23% 85.85% 87.26% 44.57% 86.98% 87.21% 83.45% 86.83%

2017 HEDIS/CAHPS REPORT
Medicaid Results
page 46TennCare 17.EQRO.06.017
Table 6. HEDIS 2017 Plan-Specific Medicaid Rates: Access/Availability of Care Measures
Measure AGE AGM AGW BCE BCM BCW TCS UHCE UHCM UHCW
HEDIS 2016 National
Medicaid 50th Percentile
Children and Adolescents’ Access to Primary Care Practitioners (CAP):
12–24 months 92.17% 95.60% 87.45% 96.63% 96.15% 92.03% 86.53% 95.33% 96.33% 89.62% 95.74%
25 months–6 years 81.10% 85.68% 81.93% 88.50% 86.93% 83.89% 78.70% 83.82% 86.79% 80.67% 87.69%
7–11 years 84.34% 88.92% 88.26% 92.14% 91.58% 90.01% 91.39% 88.22% 91.44% 87.66% 91.00%
12–19 years 80.78% 85.35% 83.37% 89.49% 88.37% 86.48% 87.69% 85.42% 88.72% 83.20% 89.37%
Initiation and Engagement of Alcohol and Other Drug (AOD) Dependence Treatment (IET):Initiation of AOD Treatment: 13-17 years 50.00% 43.11% 52.76% 43.32% 44.09% 54.55% 48.47% 47.03% 52.02% 51.45% 42.75%
35.21% 35.11% 41.81% 28.86% 33.50% 28.70% 41.73% 38.08% 41.73% 42.97% 37.78%
Total 35.70% 35.56% 42.27% 29.39% 33.86% 30.11% 44.88% 38.40%42.28% 43.39% 38.07%Engagement of AOD Treatment: 13–17 years 28.77% 25.78% 18.90% 27.94% 24.19% 16.58% 27.61% 26.73%30.65% 21.01% 13.53%
10.39% 12.66% 12.05% 6.78% 10.46% 8.48% 13.67% 9.35% 13.71% 11.59% 9.29%
Total 10.99% 13.39% 12.34% 7.55% 10.92% 8.93% 20.19% 9.98% 14.61% 12.05% 9.63%Prenatal and Postpartum Care (PPC):
Timeliness of Prenatal Care 76.69% 80.93% 65.20% 88.51% 74.94% 74.21% 72.19% 79.75% 74.45% 68.13% 82.25%
Postpartum Care 53.61% 62.56% 51.28% 69.54% 53.53% 64.23% 51.69% 61.01% 59.61% 48.18% 60.98%
Use of First-Line Psychosocial Care for Children and Adolescents on Antipsychotics (APP):
1–5 Years NA NA NA NA NA NA NA NA NA NA 45.45%
6–11 Years 55.41% 70.31% 50.00% 48.37% 57.73% 53.04% 52.90% 48.89% 66.23% 47.12% 61.54%
12–17 Years 54.76% 64.12% 59.81% 56.60% 71.43% 63.80% 53.95% 60.14% 56.67% 53.17% 61.20%
Total 54.37% 65.67% 54.77% 51.71% 65.31% 58.66% 53.81% 55.69%59.66% 49.58% 60.43%

2017 HEDIS/CAHPS REPORT
Medicaid Results
page 47TennCare 17.EQRO.06.017
Table 7 results are for utilization measures that are included in the Utilization and Risk-Adjusted Utilization Domain of Care.
Table 7. HEDIS 2017 Plan-Specific Medicaid Rates: Utilization Measures
Measure AGE AGM AGW BCE BCM BCW TCS UHCE UHCM UHCW
HEDIS 2016 National
Medicaid 50th Percentile
Frequency of Ongoing Prenatal Care (FPC):
59.67% 57.21% 44.78% 81.03% 48.18% 52.07% 48.31% 68.86% 48.42% 37.96% 59.26%
Well-Child Visits in the First 15 Months of Life (W15):
6 or More Visits 59.95% 73.38% 40.05% 70.40% 63.50% 55.72% 41.36% 66.84% 62.09% 45.50% 59.57%
Well-Child Visits in the Third, Fourth, Fifth and Sixth Yearsof Life (W34) 62.50% 76.85% 69.21% 68.33% 70.06% 65.10% 62.84% 68.16% 74.71% 65.77% 71.42%
Adolescent Well-Care Visits (AWC) 50.00% 55.79% 53.01% 42.82% 46.47% 41.85% 45.74% 41.85% 48.66% 41.36% 48.41%
Individual Plan Performance—CAHPSTable 8 details the color-coding and the rating scale, as well as any additional comments, used in Tables 9 through 13 to indicate the rating achieved. Tables 9 through 13 display the plan-specific performance rates for the CAHPS survey results. CAHPS measure results with an ‘NA’ indicate that there were
fewer than 100 valid responses and, hence, results are not presented. For all CAHPS survey results, performance is measured against the calculated statewide average. The 2016 National Medicaid CAHPS Benchmarking data were obtained from Quality Compass.
Table 8. 2017 CAHPS Rating Color and Measure DesignationsColor Designation Rating Scale Additional Comments
Greater than one standard deviation above the statewide average No additional comments
Within one standard deviation above or below the statewide average No additional comments
Greater than one standard deviation below the statewide average No additional comments

2017 HEDIS/CAHPS REPORT
Medicaid Results
page 48TennCare 17.EQRO.06.017
Table 8. 2017 CAHPS Rating Color and Measure Designations
No Rating Available Benchmarking data were not available
Measure Designation Definition
NA Not Applicable, there were fewer than 100 valid responses, hence results are not presented.
Table 9. 2017 CAHPS 5.0H Adult Medicaid Survey Results
AGE AGM AGW BCE BCM BCW TCS UHCE UHCM UHCW Statewide Average
2016 National Medicaid CAHPS Benchmarking
1. Getting Needed Care (Always + Usually)
81.98% 86.52% 75.77% 86.59% 84.45% 85.30% NA 88.25% 87.41% 84.24% 84.50% 80.43%
2. Getting Care Quickly (Always + Usually)
79.99% 86.53% 79.39% 90.27% 82.60% 86.87% NA 88.20% 83.53% 83.46% 84.54% 80.06%
3. How Well Doctors Communicate (Always + Usually)88.53% 92.23% 92.21% 90.69% 89.23% 91.72% NA 93.35% 92.41% 92.38% 91.42% 90.73%
4. Customer Service (Always + Usually)NA 90.87% NA 90.04% NA 91.12% NA 91.55% 87.52% 91.23% 90.39% 87.54%
5. Shared Decision Making (Yes)82.70% 78.09% NA 79.49% NA 78.39% NA 80.55% 75.67% 81.27% 79.45% 79.20%
6. Rating of All Health Care (9+10)51.35% 57.62% 55.46% 56.79% 54.19% 57.87% 67.27% 57.52% 56.85% 59.03% 57.40% 53.64%
7. Rating of Personal Doctor (9+10 )
62.08% 71.06% 65.24% 67.50% 60.00% 75.53% 68.75% 67.76% 71.86% 70.53% 68.03% 65.41%
8. Rating of Specialist Seen Most Often (9+10)73.44% 70.39% NA 64.52% 64.71% 70.09% NA 67.70% 61.20% 66.01% 67.26% 65.97%
9. Rating of Health Plan (9+10)48.00% 62.20% 57.00% 62.97% 65.82% 68.40% 63.09% 66.00% 64.44% 65.98% 62.39% 57.69%

2017 HEDIS/CAHPS REPORT
Medicaid Results
page 49TennCare 17.EQRO.06.017
Table 10. 2017 CAHPS 5.0H Child Medicaid Survey Results (General Population)
AGE AGM AGW BCE BCM BCW TCS UHCE UHCM UHCW Statewide Average
2016 National Medicaid CAHPS Benchmarking
1. Getting Needed Care (Always + Usually)
89.51% 88.50% 80.23% 91.48% 87.81% 87.67% 91.87% 89.95% 90.36% 82.73% 88.01% 83.66%
2. Getting Care Quickly (Always + Usually)
92.61% 91.10% 89.40% 95.27% 93.59% 93.10% 93.69% 91.73% 92.85% 89.01% 92.24% 88.54%
3. How Well Doctors Communicate (Always + Usually)
93.29% 93.01% 89.74% 96.44% 93.93% 95.47% 94.51% 95.01% 95.62% 94.49% 94.15% 93.17%
4. Customer Service (Always + Usually)
89.23% 87.60% 85.90% 93.38% 88.22% 89.41% 93.95% 91.94% 87.16% 90.78% 89.76% 87.98%
5.Shared Decision Making (Yes)
79.23% 80.79% 78.44% 81.85% NA 80.72% 82.73% 79.31% 79.07% NA 80.27% 78.41%
6. Rating of All Health Care (9+10)
73.57% 72.32% 70.73% 77.28% 76.36% 76.49% 73.51% 73.21% 72.50% 71.20% 73.72% 67.67%
7. Rating of Personal Doctor (9+10)
76.79% 72.84% 75.49% 79.22% 79.69% 78.19% 76.53% 75.39% 79.69% 76.95% 77.08% 74.78%
8. Rating of Specialist Seen Most Often (9+10)
NA NA NA 78.95% NA NA 79.38% NA NA NA 79.17% 71.10%
9. Rating of Health Plan (9+10)
68.42% 74.38% 67.63% 80.95% 75.93% 78.90% 76.33% 77.29% 75.12% 76.99% 75.19% 69.00%

2017 HEDIS/CAHPS REPORT
Medicaid Results
page 50TennCare 17.EQRO.06.017
Table 11. 2017 CAHPS 5.0H Child Medicaid Survey Results (Children with Chronic Conditions)
AGE AGM AGW BCE BCM BCW TCS UHCE UHCM UHCW Statewide Average
2016 National Medicaid CAHPS Benchmarking
1. Getting Needed Care (Always + Usually)86.55% 86.87% 84.19% 92.31% 90.94% 87.88% 91.56% 91.49% 92.30% 86.59% 89.07% 86.14%
2. Getting Care Quickly (Always + Usually)94.80% 90.14% 92.04% 96.56% 95.25% 94.79% 93.66% 94.81% 95.74% 93.99% 94.18% 91.82%
3. How Well Doctors Communicate (Always + Usually)94.13% 93.05% 93.35% 96.33% 94.78% 96.43% 95.24% 95.70% 95.47% 95.77% 95.03% 93.92%
4. Customer Service (Always + Usually)93.75% NA NA 95.59% NA 90.87% 90.82% 93.10% 92.23% NA 92.73% 89.43%
5.Shared Decision Making (Yes)86.28% 83.39% 85.79% 88.63% 82.69% 82.39% 84.48% 85.99% 79.33% 83.76% 84.27% 84.95%
6. Rating of All Health Care (9+10)61.98% 72.87% 64.95% 75.21% 72.98% 74.40% 70.48% 71.82% 72.45% 69.71% 70.69% 65.98%7. Rating of Personal Doctor (9+10)73.26% 77.94% 72.12% 78.92% 75.48% 80.20% 75.68% 80.10% 77.74% 78.71% 77.02% 74.67%8.Rating of Specialist Seen Most Often (9+10)70.00% 72.41% NA 78.49% 78.90% 78.63% 75.00% 79.01% 73.43% 68.42% 74.92% 70.81%9. Rating of Health Plan (9+10)60.19% 74.36% 59.50% 81.72% 72.04% 77.40% 74.70% 76.20% 73.53% 73.43% 72.31% 65.80%10. Access to Specialized Services (Always + Usually)
NA NA NA NA NA NA 82.46% NA NA NA 82.46% 77.06%11. Family-Centered Care: Personal Doctor or Nurse Who Knows Child (Yes)90.99% 91.25% 90.36% 91.57% 91.31% 91.19% 91.14% 91.64% 90.91% 92.39% 91.28% 90.55%
12. Coordination of Care for Children With Chronic Conditions (Yes)NA NA NA 78.60% NA NA 81.05% 78.29% 82.00% NA 79.99% 77.11%
13. Family-Centered Care: Getting Needed Information (Always + Usually)91.67% 90.87% 90.23% 95.49% 93.93% 91.92% 92.75% 89.37% 92.15% 93.78% 92.22% 90.91%
14. Access to Prescription Medicines (Always + Usually)90.49% 93.92% 92.00% 94.33% 92.03% 93.26% 91.87% 93.65% 94.16% 92.83% 92.85% 90.68%

2017 HEDIS/CAHPS REPORT
page 51TennCare 17.EQRO.06.017
Medicaid HEDIS Trending—Statewide Weighted RatesEach year of HEDIS reporting, Qsource has calculated the Medicaid statewide weighted averages for each measure by applying the size of the eligible population for each measure within a health plan to its reported rate. Using this methodology, plan-specific findings can be estimated from an overall TennCare statewide level, with each reporting health plan contributing to the statewide estimate proportionate to its eligible population size.
Trending for first-time measures—those reported for the first time in this year’s HEDIS/CAHPS report—is not possible and, therefore, not presented in this section. Remaining measures are plotted to reflect the statewide performance of TennCare
MCOs since reporting began in 2006, except where measures were not reported for a particular year as stated in footnotes.
In 2008 new health plans were implemented in the Middle Grand Region that were not required to be NCQA accredited until December 2009. Similarly, new health plans were implemented in 2009 in the West Grand Region that were not required to be accredited until December 2010. The data would not have been reported by these MCOs for 2008 or 2009, respectively; hence, no 2008 or 2009 statewide weighted rates are presented. Beginning in January 2015, there were 400,000 TennCare enrollees transitioning to new MCOs. These factors should be considered while trending data.

2017 HEDIS/CAHPS REPORT
Medicaid HEDIS Trending
page 52TennCare 17.EQRO.06.017
Effectiveness of Care Measures: Prevention and ScreeningFig. 1. Adult BMI Assessment (ABA) Fig. 2. Weight Assessment and Counseling for Nutrition and
Physical Activity for Children/Adolescents (WCC)—BMI Percentile: 3–11 years
Fig. 3. WCC—BMI Percentile: 12–17 years Fig. 4. WCC—BMI Percentile: Total
26.93%18.95%
59.17%
70.95%78.50%
82.84% 82.46%86.96%
0%10%20%30%40%50%60%70%80%90%
100%
2010 2011 2012 2013 2014 2015 2016 2017
Sta
tew
ide
Wei
gh
ted
Rat
es
HEDIS Report Year
Footnote: Data reporting began in 2009 (2008 and 2009 data are not reported in these graphs). Measure specifications were revised in 2012 and for HEDIS 2016 the BMI and BMI percentile numerator age criteria was revised from 21 to 20 years; trending should be considered with caution.
18.39%9.00%
39.57%49.42%
56.08%65.98%
71.33% 75.08%
0%10%20%30%40%50%60%70%80%90%
100%
2010 2011 2012 2013 2014 2015 2016 2017
Sta
tew
ide
Wei
gh
ted
Rat
es
HEDIS Report Year
Footnote: Data reporting began in 2009 (2008 and 2009 data are not reported in these graphs). In 2012 measure specifications changed; trending between 2012 and prior years should be considered with caution.
19.03%10.99%
43.38%49.74%
58.27%67.14% 65.74%
71.33%
0%10%20%30%40%50%60%70%80%90%
100%
2010 2011 2012 2013 2014 2015 2016 2017
Sta
tew
ide
Wei
gh
ted
Rat
es
HEDIS Report Year
Footnote: Data reporting began in 2009 (2008 and 2009 data are not reported in these graphs). In 2012 measure specifications changed; trending between 2012 and prior years should be considered with caution.
18.64%9.65%
40.91%49.52%
56.80%66.30% 69.55%
73.88%
0%10%20%30%40%50%60%70%80%90%
100%
2010 2011 2012 2013 2014 2015 2016 2017
Sta
tew
ide
Wei
gh
ted
Rat
es
HEDIS Report YearFootnote: Data reporting began in 2009 (2008 and 2009 data are not reported in these graphs). In 2012 measure specifications changed; trending between 2012 and prior years should be considered with caution.

2017 HEDIS/CAHPS REPORT
Medicaid HEDIS Trending—Effectiveness of Care Measures: Prevention and Screening
page 53TennCare 17.EQRO.06.017
Fig. 5. WCC—Counseling for Nutrition: 3–11 years Fig. 6. WCC—Counseling for Nutrition: 12–17 years
Fig. 7. WCC—Counseling for Nutrition: Total Fig. 8. WCC—Counseling for Physical Activity: 3–11 years
45.21%
24.22%
58.43%59.90%63.76%64.42%62.76%66.25%
0%10%20%30%40%50%60%70%80%90%
100%
2010 2011 2012 2013 2014 2015 2016 2017
Sta
tew
ide
Wei
gh
ted
Rat
es
HEDIS Report Year
Footnote: Data reporting began in 2009 (2008 and 2009 data are not reported in these graphs). In 2012 measure specifications changed; trending between 2012 and prior years should be considered with caution.
39.52%
20.79%
51.03%55.01% 54.24%
56.91%54.98%
61.33%
0%10%20%30%40%50%60%70%80%90%
100%
2010 2011 2012 2013 2014 2015 2016 2017
Sta
tew
ide
Wei
gh
ted
Rat
es
HEDIS Report Year
Footnote: Data reporting began in 2009 (2008 and 2009 data are not reported in these graphs). In 2012 measure specifications changed; trending between 2012 and prior years should be considered with caution.
43.43%
23.15%
56.30% 58.28% 60.62% 62.03% 60.29%64.66%
0%10%20%30%40%50%60%70%80%90%
100%
2010 2011 2012 2013 2014 2015 2016 2017
Sta
tew
ide
Wei
gh
ted
Rat
es
HEDIS Report Year
Footnote: Data reporting began in 2009 (2008 and 2009 data are not reported in these graphs). In 2012 measure specifications changed; trending between 2012 and prior years should be considered with caution.
29.96%18.75%
39.13%45.54%
52.77%55.64%53.08%55.64%
0%10%20%30%40%50%60%70%80%90%
100%
2010 2011 2012 2013 2014 2015 2016 2017
Sta
tew
ide
Wei
gh
ted
Rat
es
HEDIS Report Year
Footnote: Data reporting began in 2009 (2008 and 2009 data are not reported in these graphs). In 2016, changes were made to numerator criteria; trending with prior years should be considered with caution.

2017 HEDIS/CAHPS REPORT
Medicaid HEDIS Trending—Effectiveness of Care Measures: Prevention and Screening
page 54TennCare 17.EQRO.06.017
Fig. 9. WCC—Counseling for Physical Activity: 12–17 years Fig. 10. WCC—Counseling for Physical Activity: Total
Fig. 11. Childhood Immunization Status (CIS): DTap Fig. 12. CIS: IPV
32.98%
18.13%
40.29%48.02%
52.67%56.09%54.47%59.45%
0%10%20%30%40%50%60%70%80%90%
100%
2010 2011 2012 2013 2014 2015 2016 2017
Sta
tew
ide
Wei
gh
ted
Rat
es
HEDIS Report Year
Footnote: Data reporting began in 2009 (2008 and 2009 data are not reported in these graphs). In 2016, changes were made to numerator criteria; trending with prior years should be considered with caution.
30.94%
18.58%
39.63%46.36%
52.70% 55.77% 53.59% 56.89%
0%10%20%30%40%50%60%70%80%90%
100%
2010 2011 2012 2013 2014 2015 2016 2017
Sta
tew
ide
Wei
gh
ted
Rat
es
HEDIS Report Year
Footnote: Data reporting began in 2009 (2008 and 2009 data are not reported in these graphs). In 2016, changes were made to numerator criteria; trending with prior years should be considered with caution.
79.20% 79.14%83.73%80.70%79.52%
80.17%79.00%78.23%76.91%73.60%
0%10%20%30%40%50%60%70%80%90%
100%
2006 2007 2010 2011 2012 2013 2014 2015 2016 2017
Sta
tew
ide
Wei
gh
ted
Rat
es
HEDIS Report Year
Footnote: In 2015, due to notable changes in the measure specification, trending between prior years’ should be considered with caution.
89.20%90.28%93.55%94.84%93.94%93.86%93.07%92.36%91.23%89.47%
0%10%20%30%40%50%60%70%80%90%
100%
2006 2007 2010 2011 2012 2013 2014 2015 2016 2017
Sta
tew
ide
Wei
gh
ted
Rat
es
HEDIS Report Year
Footnote: In 2015, due to notable changes in the measure specification, trending between prior years’ should be considered with caution.

2017 HEDIS/CAHPS REPORT
Medicaid HEDIS Trending—Effectiveness of Care Measures: Prevention and Screening
page 55TennCare 17.EQRO.06.017
Fig. 13. CIS: MMR Fig. 14. CIS: HiB
Fig. 15. CIS: HepB Fig. 16. CIS: VZV
90.20%89.42%92.11% 91.51%90.05%
91.44%91.10% 90.18%88.46%86.49%
0%10%20%30%40%50%60%70%80%90%
100%
2006 2007 2010 2011 2012 2013 2014 2015 2016 2017
Sta
tew
ide
Wei
gh
ted
Rat
es
HEDIS Report Year
Footnote: In 2015, due to notable changes in the measure specification, trending between prior years’ should be considered with caution.
89.70%90.45% 96.83%
91.40%93.90%93.73%92.62%91.04%88.77%86.28%
0%10%20%30%40%50%60%70%80%90%
100%
2006 2007 2010 2011 2012 2013 2014 2015 2016 2017
Sta
tew
ide
Wei
gh
ted
Rat
es
HEDIS Report Year
Footnote: In 2015, due to notable changes in the measure specification, trending between prior years’ should be considered with caution.
89.70%90.67%92.94%93.83%92.27%
93.33% 93.15%92.95%92.14%90.60%
0%10%20%30%40%50%60%70%80%90%
100%
2006 2007 2010 2011 2012 2013 2014 2015 2016 2017
Sta
tew
ide
Wei
gh
ted
Rat
es
HEDIS Report Year
Footnote: In 2015, due to notable changes in the measure specification, trending between prior years’ should be considered with caution.
89.40%88.76%92.51%91.74%90.88%90.72%91.47% 90.56%
88.52%86.55%
0%10%20%30%40%50%60%70%80%90%
100%
2006 2007 2010 2011 2012 2013 2014 2015 2016 2017
Sta
tew
ide
Wei
gh
ted
Rat
es
HEDIS Report Year
Footnote: In 2015, due to notable changes in the measure specification, trending between prior years’ should be considered with caution.

2017 HEDIS/CAHPS REPORT
Medicaid HEDIS Trending—Effectiveness of Care Measures: Prevention and Screening
page 56TennCare 17.EQRO.06.017
Fig. 17. CIS: PCV Fig. 18. CIS: HepA
Fig. 19. CIS: RV Fig. 20. CIS: Flu
49.20%
73.95%81.92%
82.08%81.69%
82.42%81.13%81.16%
79.20%75.52%
0%10%20%30%40%50%60%70%80%90%
100%
2006 2007 2010 2011 2012 2013 2014 2015 2016 2017
Sta
tew
ide
Wei
gh
ted
Rat
es
HEDIS Report Year
Footnote: In 2015, due to notable changes in the measure specification, trending between prior years’ should be considered with caution.
43.18% 40.57% 43.31%
89.55% 89.93% 89.52% 87.18% 85.67%
0%10%20%30%40%50%60%70%80%90%
100%
2010 2011 2012 2013 2014 2015 2016 2017
Sta
tew
ide
Wei
gh
ted
Rat
es
HEDIS Report Year
Footnote: Data reporting began in 2010. HepA dose requirements changed in 2013 from two doses to at least one dose; hence, trend with caution. In 2015, due to notable changes in the measure specification, trending between prior years’ should be considered with caution.
61.13% 65.68% 66.23% 68.43% 69.66% 68.74% 69.62% 68.68%
0%10%20%30%40%50%60%70%80%90%
100%
2010 2011 2012 2013 2014 2015 2016 2017
Sta
tew
ide
Wei
gh
ted
Rat
es
HEDIS Report Year
Footnote: Data reporting began in 2010. In 2015, due to notable changes in the measure specification, trending between prior years’ should be considered with caution.
38.80%38.14% 38.38%43.74% 43.73% 44.23% 42.86% 37.56%
0%10%20%30%40%50%60%70%80%90%
100%
2010 2011 2012 2013 2014 2015 2016 2017
Sta
tew
ide
Wei
gh
ted
Rat
es
HEDIS Report Year
Footnote: Data reporting began in 2010. In 2015, due to notable changes in the measure specification, trending between prior years’ should be considered with caution.

2017 HEDIS/CAHPS REPORT
Medicaid HEDIS Trending—Effectiveness of Care Measures: Prevention and Screening
page 57TennCare 17.EQRO.06.017
Fig. 21. CIS: Combination 2 Fig. 22. CIS: Combination 3
Fig. 23. CIS: Combination 4 Fig. 24. CIS: Combination 5
73.40%74.08%
78.17%74.21%
75.37%76.28%
75.24% 74.24%74.27%70.82%
0%10%20%30%40%50%60%70%80%90%
100%
2006 2007 2010 2011 2012 2013 2014 2015 2016 2017
Sta
tew
ide
Wei
gh
ted
Rat
es
HEDIS Report Year
Footnote: In 2015, due to notable changes in the measure specification, trending between prior years’ should be considered with caution.
44.30%
65.62%72.71%
70.28%72.01%73.02%
72.12%72.13%
71.08%68.02%
0%10%20%30%40%50%60%70%80%90%
100%
2006 2007 2010 2011 2012 2013 2014 2015 2016 2017
Sta
tew
ide
Wei
gh
ted
Rat
es
HEDIS Report Year
Footnote: In 2015, due to notable changes in the measure specification, trending between prior years’ should be considered with caution.
38.55% 36.24% 40.13%
71.63% 71.18% 71.28% 70.27%67.66%
0%10%20%30%40%50%60%70%80%90%
100%
2010 2011 2012 2013 2014 2015 2016 2017
Sta
tew
ide
Wei
gh
ted
Rat
es
HEDIS Report Year
Footnote: Data reporting began in 2010. HepA dose requirements changed in 2013 from two doses to at least one dose; hence, trend with caution. In 2015, due to notable changes in the measure specification, trending between prior years’ should be considered with caution.
50.67% 52.58% 54.64% 56.98% 57.66% 57.31% 57.87% 56.44%
0%10%20%30%40%50%60%70%80%90%
100%
2010 2011 2012 2013 2014 2015 2016 2017S
tate
wid
e W
eig
hte
d R
ates
HEDIS Report Year
Footnote: Data reporting began in 2010. In 2015, due to notable changes in the measure specification, trending between prior years’ should be considered with caution.

2017 HEDIS/CAHPS REPORT
Medicaid HEDIS Trending—Effectiveness of Care Measures: Prevention and Screening
page 58TennCare 17.EQRO.06.017
Fig. 25. CIS: Combination 6 Fig. 26. CIS: Combination 7
Fig. 27. CIS: Combination 8 Fig. 28. CIS: Combination 9
33.22% 32.11% 32.90%37.88% 38.24% 38.15% 37.28%
32.31%
0%10%20%30%40%50%60%70%80%90%
100%
2010 2011 2012 2013 2014 2015 2016 2017
Sta
tew
ide
Wei
gh
ted
Rat
es
HEDIS Report Year
Footnote: Data reporting began in 2010. In 2015, due to notable changes in the measure specification, trending between prior years’ should be considered with caution.
28.18% 28.34% 31.79%
56.13% 56.88% 56.69% 57.32% 56.20%
0%10%20%30%40%50%60%70%80%90%
100%
2010 2011 2012 2013 2014 2015 2016 2017
Sta
tew
ide
Wei
gh
ted
Rat
es
HEDIS Report Year
Footnote: Data reporting began in 2010. HepA dose requirements changed in 2013 from two doses to at least one dose; hence, trend with caution.In 2015, due to notable changes in the measure specification, trending between prior years’ should be considered with caution.
19.66% 18.45% 20.83%
37.24% 38.07% 37.92% 37.02%32.19%
0%10%20%30%40%50%60%70%80%90%
100%
2010 2011 2012 2013 2014 2015 2016 2017
Sta
tew
ide
Wei
gh
ted
Rat
es
HEDIS Report Year
Footnote: Data reporting began in 2010. HepA dose requirements changed in 2013 from two doses to at least one dose; hence, trend with caution. In 2015, due to notable changes in the measure specification, trending between prior years’ should be considered with caution.
25.14% 26.63% 26.98%31.99% 33.02% 32.56% 31.78% 28.06%
0%10%20%30%40%50%60%70%80%90%
100%
2010 2011 2012 2013 2014 2015 2016 2017
Sta
tew
ide
Wei
gh
ted
Rat
es
HEDIS Report Year
Footnote: Data reporting began in 2010. In 2015, due to notable changes in the measure specification, trending between prior years’ should be considered with caution.

2017 HEDIS/CAHPS REPORT
Medicaid HEDIS Trending—Effectiveness of Care Measures: Prevention and Screening
page 59TennCare 17.EQRO.06.017
Fig. 29. CIS: Combination 10 Fig. 30. Immunizations for Adolescents (IMA): Meningococcal
Fig. 31. IMA: Tdap/Td Fig. 32. HPV: Adolescents
15.29% 15.57% 17.54%
31.53% 32.89% 32.37% 31.64% 27.94%
0%10%20%30%40%50%60%70%80%90%
100%
2010 2011 2012 2013 2014 2015 2016 2017
Sta
tew
ide
Wei
gh
ted
Rat
es
HEDIS Report Year
Footnote: Data reporting began in 2010. HepA dose requirements changed in 2013 from two doses to at least one dose; hence, trend with caution. In 2015, due to notable changes in the measure specification, trending between prior years’ should be considered with caution.
39.91%47.58%
60.34%65.69% 66.27% 67.74% 67.84% 69.74%
0%10%20%30%40%50%60%70%80%90%
100%
2010 2011 2012 2013 2014 2015 2016 2017
Sta
tew
ide
Wei
gh
ted
Rat
es
HEDIS Report Year
Footnote: Data reporting began in 2010.
44.52%53.48%
76.12%83.31% 83.57% 84.27%
81.80% 82.75%
0%10%20%30%40%50%60%70%80%90%
100%
2010 2011 2012 2013 2014 2015 2016 2017
Sta
tew
ide
Wei
gh
ted
Rat
es
HEDIS Report Year
Footnote: Data reporting began in 2010.
15.07% 16.78% 17.47% 17.43% 15.89% 13.23%
0%10%20%30%40%50%60%70%80%90%
100%
2012 2013 2014 2015 2016 2017
Sta
tew
ide
Wei
gh
ted
Rat
es
HEDIS Report Year
Footnote: Data reporting began in 2012. In 2015, due to notable changes in the measure specification, trending between prior years’ should be considered with caution. Measure extended to males and females as of HEDIS 2017, was female only in prior years.

2017 HEDIS/CAHPS REPORT
Medicaid HEDIS Trending—Effectiveness of Care Measures: Prevention and Screening
page 60TennCare 17.EQRO.06.017
Fig. 33. IMA: Combination 1 Fig. 34. Lead Screening in Children (LSC)
Fig. 35. Breast Cancer Screening (BCS) Fig. 36. Cervical Cancer Screening (CCS)
35.02%43.16%
58.66%64.40%
65.48% 66.75% 67.13% 68.87%
0%10%20%30%40%50%60%70%80%90%
100%
2010 2011 2012 2013 2014 2015 2016 2017
Sta
tew
ide
Wei
gh
ted
Rat
es
HEDIS Report Year
Footnote: Data reporting began in 2010.
65.72%70.87% 71.65% 72.18% 73.44% 73.70% 70.29% 70.64%
0%10%20%30%40%50%60%70%80%90%
100%
2010 2011 2012 2013 2014 2015 2016 2017
Sta
tew
ide
Wei
gh
ted
Rat
es
HEDIS Report Year
Footnote: Data reporting began in 2008 (2008 and 2009 data are not reported in these graphs). Measure specifications changed in 2011; trending between 2011 and prior years should be considered with caution.
52.47% 54.08% 54.47% 54.90%
0%10%20%30%40%50%60%70%80%90%
100%
2014 2015 2016 2017
Sta
tew
ide
Wei
gh
ted
Rat
es
HEDIS Report Year
Footnote: Due to significant changes to the measure specification in 2014, results for this measure cannot be trended with previous years' results.
66.25% 64.83%55.60% 59.21%
0%10%20%30%40%50%60%70%80%90%
100%
2014 2015 2016 2017
Sta
tew
ide
Wei
gh
ted
Rat
es
HEDIS Report Year
Footnote: Due to significant changes to the measure specification in 2014 CCS was identifies as having first-year status, results for this measure cannot be trended with previous years' results.

2017 HEDIS/CAHPS REPORT
Medicaid HEDIS Trending—Effectiveness of Care Measures: Prevention and Screening
page 61TennCare 17.EQRO.06.017
Fig. 37. Chlamydia Screening in Women (CHL): 16–20 years Fig. 38. CHL: 21–24 years
Fig. 39. CHL: Total
48.90%50.00%53.77%53.93%
54.48%53.62%51.54%48.88%48.17%49.57%
0%10%20%30%40%50%60%70%80%90%
100%
2006 2007 2010 2011 2012 2013 2014 2015 2016 2017
Sta
tew
ide
Wei
gh
ted
Rat
es
HEDIS Report Year
60.86% 62.10% 62.52% 62.58% 62.56%55.93% 54.61% 57.38%
0%10%20%30%40%50%60%70%80%90%
100%
2010 2011 2012 2013 2014 2015 2016 2017
Sta
tew
ide
Wei
gh
ted
Rat
es
HEDIS Report Year
Footnote: Age stratification changed in 2009 (2008 and 2009 data are not reported in these graphs); as such, no comparative data are available from previous years.
56.59% 57.19% 57.75% 57.39% 56.03% 52.03% 51.19% 52.76%
0%10%20%30%40%50%60%70%80%90%
100%
2010 2011 2012 2013 2014 2015 2016 2017
Sta
tew
ide
Wei
gh
ted
Rat
es
HEDIS Report Year
Footnote: Age stratification changed in 2009 (2008 and 2009 data are not reported in these graphs); as such, no comparative data are available from previous years.

2017 HEDIS/CAHPS REPORT
Medicaid HEDIS Trending
page 62TennCare 17.EQRO.06.017
Effectiveness of Care Measures—Respiratory ConditionsFig. 40. Appropriate Testing for Children With Pharyngitis (CWP) Fig. 41. Use of Spirometry Testing in the Assessment and
Diagnosis of COPD (SPR)
Fig. 42. Pharmacotherapy Management of COPD Exacerbation
(PCE): Systemic CorticosteroidFig. 43. PCE: Bronchodilator
64.50%66.71%70.13%72.05%75.27%76.03%77.75%
79.06%79.45%82.67%
0%10%20%30%40%50%60%70%80%90%
100%
2006 2007 2010 2011 2012 2013 2014 2015 2016 2017Sta
tew
ide
Wei
gh
ted
Rat
es
HEDIS Report Year
Footnote: For HEDIS 2016, the description and ages were changed from “2–18 years of age” to “3–18 years of age”; trending with prior years should be done with caution.
28.56%27.52%26.17%30.68%
35.36%34.40%34.34%33.68%31.36%31.72%
0%10%20%30%40%50%60%70%80%90%
100%
2006 2007 2010 2011 2012 2013 2014 2015 2016 2017
Sta
tew
ide
Wei
gh
ted
Rat
es
HEDIS Report Year
Footnote: Measure specifications changed in 2011; trending between 2011 and prior years should be considered with caution.
38.59%42.54% 45.55% 47.81% 50.91% 51.32% 52.23%
47.75%
0%10%20%30%40%50%60%70%80%90%
100%
2010 2011 2012 2013 2014 2015 2016 2017
Sta
tew
ide
Wei
gh
ted
Rat
es
HEDIS Report Year
Footnote: Data reporting began in 2008 (2008 and 2009 data are not reported in these graphs). For HEDIS 2017, the exclusion was deleted for Episode Dates when there was a readmission or an ED visit within 14 days.
65.78%73.17% 72.13% 73.48% 76.34% 76.43% 75.41% 72.71%
0%10%20%30%40%50%60%70%80%90%
100%
2010 2011 2012 2013 2014 2015 2016 2017
Sta
tew
ide
Wei
gh
ted
Rat
es
HEDIS Report Year
Footnote: Data reporting began in 2008 (2008 and 2009 data are not reported in these graphs). For HEDIS 2017, the exclusion was deleted for Episode Dates when there was a readmission or an ED visit within 14 days.

2017 HEDIS/CAHPS REPORT
Medicaid HEDIS Trending—Effectiveness of Care Measures: Respiratory Conditions
page 63TennCare 17.EQRO.06.017
Fig. 44. Medication Management for People With Asthma (MMA)—Medication Compliance 50%: 5–11 years
Fig. 45. MMA—Medication Compliance 50%: 12–18 years
Fig. 46. MMA—Medication Compliance 50%: 19-50 years Fig. 47. MMA—Medication Compliance 50%: 51–64 years
54.78% 54.30% 53.87% 50.05% 54.71% 50.03%
0%10%20%30%40%50%60%70%80%90%
100%
2012 2013 2014 2015 2016 2017
Sta
tew
ide
Wei
gh
ted
Rat
es
HEDIS Report Year
Footnote: Data reporting began in 2012.
49.54% 51.55% 51.45% 46.80%51.61% 51.10%
0%10%20%30%40%50%60%70%80%90%
100%
2012 2013 2014 2015 2016 2017
Sta
tew
ide
Wei
gh
ted
Rat
es
HEDIS Report Year
Footnote: Data reporting began in 2012.
45.06% 48.18% 52.81% 49.68%60.00%
54.39%
0%10%20%30%40%50%60%70%80%90%
100%
2012 2013 2014 2015 2016 2017
Sta
tew
ide
Wei
gh
ted
Rat
es
HEDIS Report Year
Footnote: Data reporting began in 2012.
62.50% 59.02% 59.49%67.38% 66.13% 65.73%
0%10%20%30%40%50%60%70%80%90%
100%
2012 2013 2014 2015 2016 2017
Sta
tew
ide
Wei
gh
ted
Rat
es
HEDIS Report Year
Footnote: Data reporting began in 2012.

2017 HEDIS/CAHPS REPORT
Medicaid HEDIS Trending—Effectiveness of Care Measures: Respiratory Conditions
page 64TennCare 17.EQRO.06.017
Fig. 48. MMA—Medication Compliance 50%: Total Fig. 49. MMA—Medication Compliance 75%: 5–11 years
Fig. 50. MMA—Medication Compliance 75%: 12–18 years Fig. 51. MMA—Medication Compliance 75%: 19–50 years
52.22% 52.85% 53.06% 49.31%55.05% 51.60%
0%10%20%30%40%50%60%70%80%90%
100%
2012 2013 2014 2015 2016 2017
Sta
tew
ide
Wei
gh
ted
Rat
es
HEDIS Report Year
Footnote: Data reporting began in 2012.
29.90%23.64% 26.87% 24.38%
0%10%20%30%40%50%60%70%80%90%
100%
2014 2015 2016 2017
Sta
tew
ide
Wei
gh
ted
Rat
es
HEDIS Report Year
Footnote: Due to significant changes to the measure specification in 2014, results for this measure cannot be trended with previous years' results.
27.06% 23.57% 26.63% 25.20%
0%10%20%30%40%50%60%70%80%90%
100%
2014 2015 2016 2017
Sta
tew
ide
Wei
gh
ted
Rat
es
HEDIS Report Year
Footnote: Due to significant changes to the measure specification in 2014, results for this measure cannot be trended with previous years' results.
31.39% 28.01%38.38%
30.06%
0%10%20%30%40%50%60%70%80%90%
100%
2014 2015 2016 2017
Sta
tew
ide
Wei
gh
ted
Rat
es
HEDIS Report Year
Footnote: Due to significant changes to the measure specification in 2014, results for this measure cannot be trended with previous years' results.
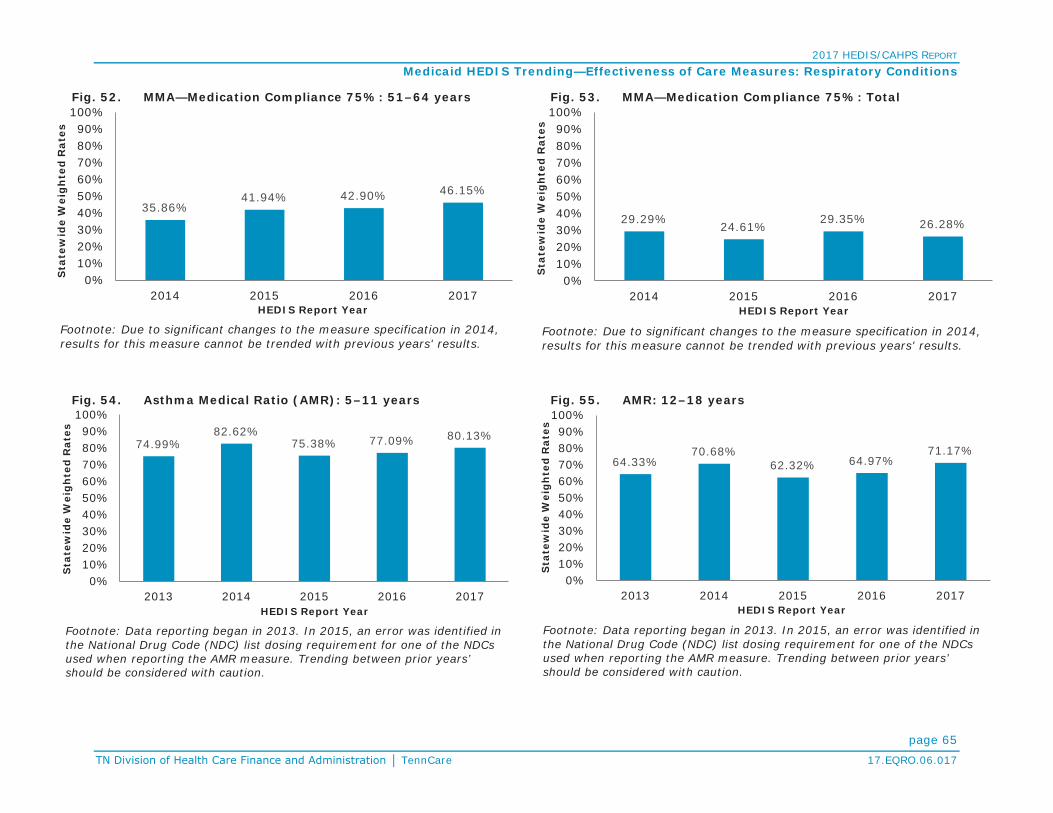
2017 HEDIS/CAHPS REPORT
Medicaid HEDIS Trending—Effectiveness of Care Measures: Respiratory Conditions
page 65TennCare 17.EQRO.06.017
Fig. 52. MMA—Medication Compliance 75%: 51–64 years Fig. 53. MMA—Medication Compliance 75%: Total
Fig. 54. Asthma Medical Ratio (AMR): 5–11 years Fig. 55. AMR: 12–18 years
35.86%41.94% 42.90% 46.15%
0%10%20%30%40%50%60%70%80%90%
100%
2014 2015 2016 2017
Sta
tew
ide
Wei
gh
ted
Rat
es
HEDIS Report Year
Footnote: Due to significant changes to the measure specification in 2014, results for this measure cannot be trended with previous years' results.
29.29%24.61%
29.35% 26.28%
0%10%20%30%40%50%60%70%80%90%
100%
2014 2015 2016 2017
Sta
tew
ide
Wei
gh
ted
Rat
es
HEDIS Report Year
Footnote: Due to significant changes to the measure specification in 2014, results for this measure cannot be trended with previous years' results.
74.99%82.62%
75.38% 77.09% 80.13%
0%10%20%30%40%50%60%70%80%90%
100%
2013 2014 2015 2016 2017
Sta
tew
ide
Wei
gh
ted
Rat
es
HEDIS Report Year
Footnote: Data reporting began in 2013. In 2015, an error was identified in the National Drug Code (NDC) list dosing requirement for one of the NDCs used when reporting the AMR measure. Trending between prior years’ should be considered with caution.
64.33%70.68%
62.32% 64.97%71.17%
0%10%20%30%40%50%60%70%80%90%
100%
2013 2014 2015 2016 2017
Sta
tew
ide
Wei
gh
ted
Rat
es
HEDIS Report Year
Footnote: Data reporting began in 2013. In 2015, an error was identified in the National Drug Code (NDC) list dosing requirement for one of the NDCs used when reporting the AMR measure. Trending between prior years’ should be considered with caution.

2017 HEDIS/CAHPS REPORT
Medicaid HEDIS Trending—Effectiveness of Care Measures: Respiratory Conditions
page 66TennCare 17.EQRO.06.017
Fig. 56. AMR: 19–50 years Fig. 57. AMR: 51–64 years
Fig. 58. AMR: Total
30.97%39.81% 40.18%
48.93% 44.53%
0%10%20%30%40%50%60%70%80%90%
100%
2013 2014 2015 2016 2017
Sta
tew
ide
Wei
gh
ted
Rat
es
HEDIS Report Year
Footnote: Data reporting began in 2013. In 2015, an error was identified in the National Drug Code (NDC) list dosing requirement for one of the NDCs used when reporting the AMR measure. Trending between prior years’ should be considered with caution.
32.81% 33.05%38.48%
45.36% 45.32%
0%10%20%30%40%50%60%70%80%90%
100%
2013 2014 2015 2016 2017
Sta
tew
ide
Wei
gh
ted
Rat
es
HEDIS Report Year
Footnote: Data reporting began in 2013. In 2015, an error was identified in the National Drug Code (NDC) list dosing requirement for one of the NDCs used when reporting the AMR measure. Trending between prior years’ should be considered with caution.
63.66%69.93%
63.70% 66.25% 67.93%
0%10%20%30%40%50%60%70%80%90%
100%
2013 2014 2015 2016 2017
Sta
tew
ide
Wei
gh
ted
Rat
es
HEDIS Report Year
Footnote: Data reporting began in 2013. In 2015, an error was identified in the National Drug Code (NDC) list dosing requirement for one of the NDCs used when reporting the AMR measure. Trending between prior years’ should be considered with caution.

2017 HEDIS/CAHPS REPORT
Medicaid HEDIS Trending
page 67TennCare 17.EQRO.06.017
Effectiveness of Care Measures—Cardiovascular ConditionsFig. 59. Controlling High Blood Pressure (CBP) Fig. 60. Persistence of Beta-Blocker Treatment After a Heart
Attack (PBH)
Fig. 61. SPC—Received Statin Therapy: Males 21-75 years Fig. 62. SPC—Received Statin Therapy: Females 40 -75 years
56.50%49.43%
53.67%52.96%55.99%55.82%56.98%
54.99%55.10%55.63%
0%10%20%30%40%50%60%70%80%90%
100%
2006 2007 2010 2011 2012 2013 2014 2015 2016 2017
Sta
tew
ide
Wei
gh
ted
Rat
es
HEDIS Report Year
Footnote: In 2015, due to notable changes to the measure specification, results should be considered with caution.
70.50%60.36%
66.67%72.01%75.06%74.54%
83.10%79.32% 75.75%
79.19%
0%10%20%30%40%50%60%70%80%90%
100%
2006 2007 2010 2011 2012 2013 2014 2015 2016 2017
Sta
tew
ide
Wei
gh
ted
Rat
es
HEDIS Report Year
66.61% 70.66%
0%10%20%30%40%50%60%70%80%90%
100%
2016 2017
Sta
tew
ide
Wei
gh
ted
Rat
es
HEDIS Report Year
Footnote: Data reporting began in 2015.
66.05% 66.32%
0%10%20%30%40%50%60%70%80%90%
100%
2016 2017
Sta
tew
ide
Wei
gh
ted
Rat
es
HEDIS Report Year
Footnote: Data reporting began in 2015.

2017 HEDIS/CAHPS REPORT
Medicaid HEDIS Trending—Effectiveness of Care Measures: Cardiovascular Conditions
page 68TennCare 17.EQRO.06.017
Fig. 63. SPC—Received Statin Therapy: Total Fig. 64. SPC—Statin Adherence 80%: Males 21-75 years
Fig. 65. SPC—Statin Adherence 80%: Females 40 -75 years Fig. 66. SPC—Statin Adherence 80%: Total
66.34% 68.50%
0%10%20%30%40%50%60%70%80%90%
100%
2016 2017
Sta
tew
ide
Wei
gh
ted
Rat
es
HEDIS Report Year
Footnote: Data reporting began in 2015.
56.17% 57.13%
0%10%20%30%40%50%60%70%80%90%
100%
2016 2017
Sta
tew
ide
Wei
gh
ted
Rat
es
HEDIS Report Year
Footnote: Data reporting began in 2015.
50.77% 53.09%
0%10%20%30%40%50%60%70%80%90%
100%
2016 2017
Sta
tew
ide
Wei
gh
ted
Rat
es
HEDIS Report Year
Footnote: Data reporting began in 2015.
53.56% 55.19%
0%10%20%30%40%50%60%70%80%90%
100%
2016 2017
Sta
tew
ide
Wei
gh
ted
Rat
es
HEDIS Report Year
Footnote: Data reporting began in 2015.

2017 HEDIS/CAHPS REPORT
Medicaid HEDIS Trending
page 69TennCare 17.EQRO.06.017
Effectiveness of Care Measures—DiabetesFig. 67. Comprehensive Diabetes Care (CDC): HbA1c Testing Fig. 68. CDC: HbA1c Control (<7.0%)
Fig. 69. CDC: HbA1c Control (<8.0%) Fig. 70. CDC: Retinal Eye Exam Performed
70.70%67.64%
77.93% 78.87%80.55%80.32%79.76%81.88%82.59%82.51%
0%10%20%30%40%50%60%70%80%90%
100%
2006 2007 2010 2011 2012 2013 2014 2015 2016 2017
Sta
tew
ide
Wei
gh
ted
Rat
es
HEDIS Report Year
Footnote: Trending between 2016 and prior years should be considered with caution due to conversion to ICD-10 codes. Also trending between 2015 and prior years’ should be considered with caution due to revision to General Guideline 41 and ED visit requirement.
21.22%
37.02% 34.64% 37.34% 38.54% 38.43% 37.05% 34.64% 37.43%
0%10%20%30%40%50%60%70%80%90%
100%
2007 2010 2011 2012 2013 2014 2015 2016 2017
Sta
tew
ide
Wei
gh
ted
Rat
es
HEDIS Report Year
Footnote: Trending between 2016 and prior years should be considered with caution due to conversion to ICD-10 codes. Also trending between 2015 and prior years’ should be considered with caution due to revision to General Guideline 41 and ED visit requirement.
46.05% 44.54% 48.08% 48.58% 49.22% 49.06% 47.62% 49.07%
0%10%20%30%40%50%60%70%80%90%
100%
2010 2011 2012 2013 2014 2015 2016 2017
Sta
tew
ide
Wei
gh
ted
Rat
es
HEDIS Report Year
Footnote: Trending between 2016 and prior years should be considered with caution due to conversion to ICD-10 codes. Also trending between 2015 and prior years’ should be considered with caution due to revision to General Guideline 41 and ED visit requirement.
33.00%33.15%35.12%37.02%37.64%37.66%38.69%41.45%42.87%44.87%
0%10%20%30%40%50%60%70%80%90%
100%
2006 2007 2010 2011 2012 2013 2014 2015 2016 2017
Sta
tew
ide
Wei
gh
ted
Rat
es
HEDIS Report Year
Footnote: Trending between 2016 and prior years should be considered with caution due to conversion to ICD-10 codes. Also trending between 2015 and prior years’ should be considered with caution due to revision to General Guideline 41 and ED visit requirement.

2017 HEDIS/CAHPS REPORT
Medicaid HEDIS Trending—Effectiveness of Care Measures: Diabetes
page 70TennCare 17.EQRO.06.017
Fig. 71. CDC: Medical Attention for Nephropathy Fig. 72. CDC: Blood Pressure Control (<140/90 mm Hg)
Fig. 73. CDC: HbA1c Poor Control (>9.0%)* Fig. 74. SPD—Received Statin Therapy: 40-75 years
32.40%
65.05%73.91%73.19%75.02%76.22%76.19%78.18%
90.89%89.06%
0%10%20%30%40%50%60%70%80%90%
100%
2006 2007 2010 2011 2012 2013 2014 2015 2016 2017
Sta
tew
ide
Wei
gh
ted
Rat
es
HEDIS Report Year
Footnote: Trending between 2016 and prior years should be considered with caution due to conversion to ICD-10 codes. Also trending between 2015 and prior years’ should be considered with caution due to revision to General Guideline 41 and ED visit requirement.
45.11%56.63% 55.03% 59.72% 59.03% 60.25% 59.91% 58.22% 58.35%
0%10%20%30%40%50%60%70%80%90%
100%
2007 2010 2011 2012 2013 2014 2015 2016 2017
Sta
tew
ide
Wei
gh
ted
Rat
es
HEDIS Report Year
Footnote: Trending between 2016 and prior years should be considered with caution due to conversion to ICD-10 codes. Also trending between 2015 and prior years’ should be considered with caution due to revision to General Guideline 41 and ED visit requirement.
58.90%62.57%
45.61%47.85%44.78%43.22%42.22%41.80%43.23%41.92%
0%10%20%30%40%50%60%70%80%90%
100%
2006 2007 2010 2011 2012 2013 2014 2015 2016 2017
Sta
tew
ide
Wei
gh
ted
Rat
es
HEDIS Report Year
*Lower rates for this measure indicate better performance.Footnote: Trending between 2016 and prior years should be considered with caution due to conversion to ICD-10 codes. Also trending between 2015 and prior years’ should be considered with caution due to revision to General Guideline 41 and ED visit requirement.
53.06% 54.06%
0%10%20%30%40%50%60%70%80%90%
100%
2016 2017
Sta
tew
ide
Wei
gh
ted
Rat
es
HEDIS Report Year
Footnote: Data reporting began in 2015.

2017 HEDIS/CAHPS REPORT
Medicaid HEDIS Trending—Effectiveness of Care Measures: Diabetes
page 71TennCare 17.EQRO.06.017
Fig. 75. SPD—Statin Adherence 80%: 40-75 years
Effectiveness of Care Measures—Musculoskeletal Conditions
Fig. 76. Disease-Modifying Anti-Rheumatic Drug Therapy for Rheumatoid Arthritis (ART)
48.03% 50.57%
0%10%20%30%40%50%60%70%80%90%
100%
2016 2017
Sta
tew
ide
Wei
gh
ted
Rat
es
HEDIS Report Year
Footnote: Data reporting began in 2015
63.84%59.39%57.11%57.88%58.66%58.91%
63.93% 63.31%62.66%63.65%
0%10%20%30%40%50%60%70%80%90%
100%
2006 2007 2010 2011 2012 2013 2014 2015 2016 2017
Sta
tew
ide
Wei
gh
ted
Rat
es
HEDIS Report Year

2017 HEDIS/CAHPS REPORT
Medicaid HEDIS Trending
page 72TennCare 17.EQRO.06.017
Effectiveness of Care Measures—Behavioral HealthFig. 77. Antidepressant Medication Management (AMM):
Effective Acute Phase TreatmentFig. 78. AMM: Effective Continuation Phase Treatment
Fig. 79. Follow-Up Care for Children Prescribed ADHD
Medication (ADD): Initiation PhaseFig. 80. ADD: Continuation and Maintenance Phase
46.48% 48.62% 47.75% 46.52%
0%10%20%30%40%50%60%70%80%90%
100%
2014 2015 2016 2017
Sta
tew
ide
Wei
gh
ted
Rat
es
HEDIS Report Year
Footnote: Due to significant changes to the measure specification in 2014, results for this measure cannot be trended with previous years' results.
30.31% 31.39% 32.19% 30.56%
0%10%20%30%40%50%60%70%80%90%
100%
2014 2015 2016 2017
Sta
tew
ide
Wei
gh
ted
Rat
es
HEDIS Report Year
Footnote: Due to significant changes to the measure specification in 2014, results for this measure cannot be trended with previous years' results.
34.29%39.11% 38.28%
46.02% 45.82% 47.78% 49.26% 44.95%
0%10%20%30%40%50%60%70%80%90%
100%
2010 2011 2012 2013 2014 2015 2016 2017
Sta
tew
ide
Wei
gh
ted
Rat
es
HEDIS Report Year
Footnote: Behavioral Health was carved out prior to HEDIS 2009; as such, no comparative data are available from previous years.
44.15% 47.00% 47.21%57.54% 54.98%
59.69% 63.14% 59.45%
0%10%20%30%40%50%60%70%80%90%
100%
2010 2011 2012 2013 2014 2015 2016 2017
Sta
tew
ide
Wei
gh
ted
Rat
es
HEDIS Report Year
Footnote: Behavioral Health was carved out prior to HEDIS 2009; as such, no comparative data are available from previous years.

2017 HEDIS/CAHPS REPORT
Medicaid HEDIS Trending—Effectiveness of Care Measures: Behavioral Health
page 73TennCare 17.EQRO.06.017
Fig. 81. Follow-Up After Hospitalization for Mental Illness (FUH):7-Day Follow-Up
Fig. 82. FUH: 30-Day Follow-Up
Fig. 83. Diabetes Screening for People With Schizophrenia or
Bipolar Disorder Who Are Using Antipsychotic Medication (SSD)Fig. 84. Diabetes Monitoring for People With Diabetes and
Schizophrenia (SMD)
37.93% 41.52% 45.73% 48.03%54.70%
61.94%55.95% 58.82%
0%10%20%30%40%50%60%70%80%90%
100%
2010 2011 2012 2013 2014 2015 2016 2017
Sta
tew
ide
Wei
gh
ted
Rat
es
HEDIS Report Year
Footnote: Behavioral Health was carved out prior to HEDIS 2009; as such, no comparative data are available from previous years.
61.24% 64.79% 66.83% 68.80% 71.85% 75.91%70.63% 71.29%
0%10%20%30%40%50%60%70%80%90%
100%
2010 2011 2012 2013 2014 2015 2016 2017
Sta
tew
ide
Wei
gh
ted
Rat
es
HEDIS Report Year
Footnote: Behavioral Health was carved out prior to HEDIS 2009; as such, no comparative data are available from previous years.
80.40% 79.85% 81.65% 81.20% 82.51%
0%10%20%30%40%50%60%70%80%90%
100%
2013 2014 2015 2016 2017
Sta
tew
ide
Wei
gh
ted
Rat
es
HEDIS Report Year
Footnote: Data reporting began in 2013.
67.69% 67.65% 71.20% 69.70% 70.29%
0%10%20%30%40%50%60%70%80%90%
100%
2013 2014 2015 2016 2017
Sta
tew
ide
Wei
gh
ted
Rat
es
HEDIS Report Year
Footnote: Data reporting began in 2013. In 2015, due to notable changes in the measure specification, trending between 2015 and prior years’ should be considered with caution.

2017 HEDIS/CAHPS REPORT
Medicaid HEDIS Trending—Effectiveness of Care Measures: Behavioral Health
page 74TennCare 17.EQRO.06.017
Fig. 85. Cardiovascular Monitoring for People With Cardiovascular Disease and Schizophrenia (SMC)
Fig. 86. Adherence to Antipsychotic Medications for Individuals With Schizophrenia (SAA)
Fig. 87. Metabolic Monitoring for Children and Adolescents on
Antipsychotics (APM): 1-5 YearsFig. 88. APM: 6-11 Years
80.00% 78.69%86.08% 82.89% 80.49%
0%10%20%30%40%50%60%70%80%90%
100%
2013 2014 2015 2016 2017
Sta
tew
ide
Wei
gh
ted
Rat
es
HEDIS Report Year
Footnote: Data reporting began in 2013.
61.91% 62.93% 59.70% 58.62% 58.68%
0%10%20%30%40%50%60%70%80%90%
100%
2013 2014 2015 2016 2017
Sta
tew
ide
Wei
gh
ted
Rat
es
HEDIS Report Year
Footnote: Data reporting began in 2013. In 2016, changes were made to the timeframe when identifying the Index Prescription State Date (IPSD). Trending between 2016 and prior years should be considered with caution.
19.55%13.59% 13.33%
0%10%20%30%40%50%60%70%80%90%
100%
2015 2016 2017
Sta
tew
ide
Wei
gh
ted
Rat
es
HEDIS Report Year
31.67% 28.71% 27.92%
0%10%20%30%40%50%60%70%80%90%
100%
2015 2016 2017
Sta
tew
ide
Wei
gh
ted
Rat
es
HEDIS Report Year
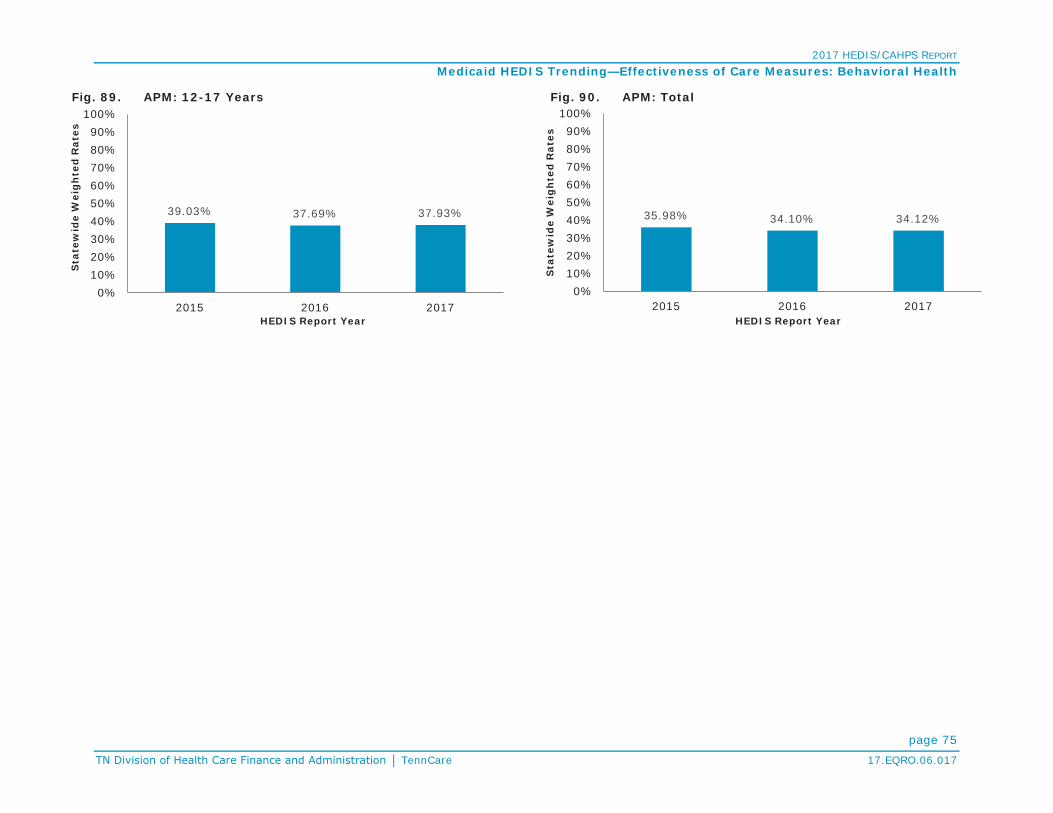
2017 HEDIS/CAHPS REPORT
Medicaid HEDIS Trending—Effectiveness of Care Measures: Behavioral Health
page 75TennCare 17.EQRO.06.017
Fig. 89. APM: 12-17 Years Fig. 90. APM: Total
39.03% 37.69% 37.93%
0%10%20%30%40%50%60%70%80%90%
100%
2015 2016 2017
Sta
tew
ide
Wei
gh
ted
Rat
es
HEDIS Report Year
35.98% 34.10% 34.12%
0%10%20%30%40%50%60%70%80%90%
100%
2015 2016 2017
Sta
tew
ide
Wei
gh
ted
Rat
es
HEDIS Report Year

2017 HEDIS/CAHPS REPORT
Medicaid HEDIS Trending
page 76TennCare 17.EQRO.06.017
Effectiveness of Care Measures—Medication ManagementFig. 91. Annual Monitoring for Patients on Persistent
Medications (MPM): ACE Inhibitors or ARBsFig. 92. MPM: Digoxin
Fig. 93. MPM: Diuretics Fig. 94. MPM: Total
90.61% 90.46% 90.30%
0%10%20%30%40%50%60%70%80%90%
100%
2015 2016 2017
Sta
tew
ide
Wei
gh
ted
Rat
es
HEDIS Report Year
Footnote: In 2015, due to significant changes to the measure specification, results for this measure cannot be trended to previous year's results.
57.14% 54.95% 58.22%
0%10%20%30%40%50%60%70%80%90%
100%
2015 2016 2017
Sta
tew
ide
Wei
gh
ted
Rat
es
HEDIS Report Year
Footnote: In 2015, due to significant changes to the measure specification, results for this measure cannot be trended to previous year's results.
90.88% 90.92% 90.70%
0%10%20%30%40%50%60%70%80%90%
100%
2015 2016 2017
Sta
tew
ide
Wei
gh
ted
Rat
es
HEDIS Report Year
Footnote: In 2015, due to significant changes to the measure specification, results for this measure cannot be trended to previous year's results.
90.33% 90.31% 90.22%
0%10%20%30%40%50%60%70%80%90%
100%
2015 2016 2017
Sta
tew
ide
Wei
gh
ted
Rat
e
HEDIS Report Year
Footnote: The anticonvulsants rate was retired in 2015 and is no longer part of the total rate. In 2015, due to significant changes to the measure specification, results for this measure cannot be trended to previous year's results.

2017 HEDIS/CAHPS REPORT
Medicaid HEDIS Trending
page 77TennCare 17.EQRO.06.017
Effectiveness of Care Measures—Overuse/AppropriatenessFig. 95. Non-Recommended Cervical Cancer Screening in
Adolescent Females (NCS)*Fig. 96. Appropriate Treatment for Children With Upper
Respiratory Infection (URI)
Fig. 97. Avoidance of Antibiotic Treatment in Adults With Acute Bronchitis (AAB)
Fig. 98. Use of Imaging Studies for Low Back Pain (LBP)
11.91% 8.75% 5.25% 3.83%0%
10%20%30%40%50%60%70%80%90%
100%
2014 2015 2016 2017
Sta
tew
ide
Wei
gh
ted
Rat
es
HEDIS Report Year
*Lower rates for this measure indicate better performance.Footnote: Data reporting began in 2014. In 2016, denied claims are no longer included when identifying the numerator of the measure. Trending between 2016 and prior years should be considered with caution.
72.40%
82.05%74.94% 74.95%74.21%74.84%75.05%77.02%79.25%81.85%
0%10%20%30%40%50%60%70%80%90%
100%
2006 2007 2010 2011 2012 2013 2014 2015 2016 2017
Sta
tew
ide
Wei
gh
ted
Rat
es
HEDIS Report Year
33.46%
21.51% 21.92% 24.39% 24.58% 27.89% 30.49% 32.61%
0%10%20%30%40%50%60%70%80%90%
100%
2010 2011 2012 2013 2014 2015 2016 2017
Sta
tew
ide
Wei
gh
ted
Rat
es
HEDIS Report Year
Footnote: The measure rate was inverted in 2008 (2008 and 2009 data are not reported in these graphs); as such, no comparative data are available from previous years.
75.26%73.85%
68.19%67.88%68.03%66.91%67.71%67.71%65.56%61.94%
0%10%20%30%40%50%60%70%80%90%
100%
2006 2007 2010 2011 2012 2013 2014 2015 2016 2017
Sta
tew
ide
Wei
gh
ted
Rat
es
HEDIS Report Year
Footnote: Because United American Healthcare Corporation did not report this measure in 2007, it was excluded from the statewide weighted average calculation for thatreport year. In 2016, the conversion to ICD-10 codes affected how low back pain, recent trauma and intravenous drug abuse are identified in the event/diagnosis. Trending between 2016 and prior years should be considered with caution.

2017 HEDIS/CAHPS REPORT
Medicaid HEDIS Trending—Effectiveness of Care Measures: Overuse/Appropriateness
page 78TennCare 17.EQRO.06.017
Fig. 99. Use of Multiple Concurrent Antipsychotics in Children and Adolescents (APC): 1-5 Years*
Fig. 100. APC: 6-11 Years*
Fig. 101. APC: 12-17 Years* Fig. 102. APC: Total*
1.44% 1.49% 2.94%0%
10%20%30%40%50%60%70%80%90%
100%
2015 2016 2017
Sta
tew
ide
Wei
gh
ted
Rat
es
HEDIS Report Year
*Lower rates for this measure indicate better performance.Footnote: Data reporting began in 2014.
1.29% 1.71% 1.77%0%
10%20%30%40%50%60%70%80%90%
100%
2015 2016 2017
Sta
tew
ide
Wei
gh
ted
Rat
es
HEDIS Report Year
*Lower rates for this measure indicate better performance.Footnote: Data reporting began in 2014.
1.25% 3.41% 3.22%0%
10%20%30%40%50%60%70%80%90%
100%
2015 2016 2017
Sta
tew
ide
Wei
gh
ted
Rat
es
HEDIS Report Year
*Lower rates for this measure indicate better performance.Footnote: Data reporting began in 2014.
1.27% 2.78% 2.72%0%
10%20%30%40%50%60%70%80%90%
100%
2015 2016 2017
Sta
tew
ide
Wei
gh
ted
Rat
es
HEDIS Report Year
*Lower rates for this measure indicate better performance.Footnote: Data reporting began in 2014.

2017 HEDIS/CAHPS REPORT
Medicaid HEDIS Trending
page 79TennCare 17.EQRO.06.017
Access/Availability of Care MeasuresFig. 103. Adults’ Access to Preventive/Ambulatory Health
Services (AAP): 20–44 yearsFig. 104. AAP: 45–64 years
Fig. 105. Children and Adolescents’ Access to Primary Care
Practitioners (CAP): 12–24 monthsFig. 106. CAP: 25 months–6 years
72.10%70.29%79.50%80.28%80.62%80.66%82.21%
77.03%73.00%74.37%
0%10%20%30%40%50%60%70%80%90%
100%
2006 2007 2010 2011 2012 2013 2014 2015 2016 2017
Sta
tew
ide
Wei
gh
ted
Rat
es
HEDIS Report Year
75.40%73.42%79.89%
85.69%86.34%87.27%89.28%87.95%84.97%85.11%
0%10%20%30%40%50%60%70%80%90%
100%
2006 2007 2010 2011 2012 2013 2014 2015 2016 2017
Sta
tew
ide
Wei
gh
ted
Rat
es
HEDIS Report Year
93.60%93.90%97.10%97.07%97.14%96.94%97.27%
94.22%91.77%93.70%
0%10%20%30%40%50%60%70%80%90%
100%
2006 2007 2010 2011 2012 2013 2014 2015 2016 2017
Sta
tew
ide
Wei
gh
ted
Rat
es
HEDIS Report Year
83.40%84.19%89.85%89.91%90.37%90.51%90.26%88.06%85.15%84.48%
0%10%20%30%40%50%60%70%80%90%
100%
2006 2007 2010 2011 2012 2013 2014 2015 2016 2017
Sta
tew
ide
Wei
gh
ted
Rat
es
HEDIS Report Year

2017 HEDIS/CAHPS REPORT
Medicaid HEDIS Trending—Access/Availability of Care Measures
page 80TennCare 17.EQRO.06.017
Fig. 107. CAP: 7–11 years Fig. 108. CAP: 12–19 years
Fig. 109. Initiation and Engagement of Alcohol and Other Drug
(AOD) Dependence Treatment (IET)—Initiation of AOD Treatment: 13–17 years
Fig. 110. IET—
85.10% 87.06%91.43%92.80% 93.14%93.47%93.96%93.55%91.15%89.55%
0%10%20%30%40%50%60%70%80%90%
100%
2006 2007 2010 2011 2012 2013 2014 2015 2016 2017
Sta
tew
ide
Wei
gh
ted
Rat
es
HEDIS Report Year
80.90%81.77%87.22%88.63%90.18%90.38%90.91%89.96%87.78%86.19%
0%10%20%30%40%50%60%70%80%90%
100%
2006 2007 2010 2011 2012 2013 2014 2015 2016 2017
Sta
tew
ide
Wei
gh
ted
Rat
es
HEDIS Report Year
59.32% 63.61%53.33% 48.57% 51.05% 48.96% 49.11% 48.29%
0%10%20%30%40%50%60%70%80%90%
100%
2010 2011 2012 2013 2014 2015 2016 2017
Sta
tew
ide
Wei
gh
ted
Rat
es
HEDIS Report Year
Footnote: Behavioral Health was carved out prior to HEDIS 2009; as such, no comparative data are available from previous years.
45.36%53.71%
42.54%36.78% 35.69% 37.22% 33.36% 35.62%
0%10%20%30%40%50%60%70%80%90%
100%
2010 2011 2012 2013 2014 2015 2016 2017
Sta
tew
ide
Wei
gh
ted
Rat
es
HEDIS Report Year
Footnote: Behavioral Health was carved out prior to HEDIS 2009; as such, no comparative data are available from previous years.

2017 HEDIS/CAHPS REPORT
Medicaid HEDIS Trending—Access/Availability of Care Measures
page 81TennCare 17.EQRO.06.017
Fig. 111. IET—Initiation of AOD Treatment: Total Fig. 112. IET—Engagement of AOD Treatment: 13–17 years
Fig. 113. IET— Fig. 114. IET—Engagement of AOD Treatment: Total
46.48%54.45%
43.38%37.62% 36.65% 37.90% 34.22% 36.30%
0%10%20%30%40%50%60%70%80%90%
100%
2010 2011 2012 2013 2014 2015 2016 2017
Sta
tew
ide
Wei
gh
ted
Rat
es
HEDIS Report Year
Footnote: Behavioral Health was carved out prior to HEDIS 2009; as such, no comparative data are available from previous years.
34.73% 37.37%31.07% 27.90% 29.92% 26.42% 25.96% 25.65%
0%10%20%30%40%50%60%70%80%90%
100%
2010 2011 2012 2013 2014 2015 2016 2017
Sta
tew
ide
Wei
gh
ted
Rat
es
HEDIS Report Year
Footnote: Behavioral Health was carved out prior to HEDIS 2009; as such, no comparative data are available from previous years.
14.36% 14.93% 12.34% 9.82% 9.62% 9.83% 8.70% 10.34%
0%10%20%30%40%50%60%70%80%90%
100%
2010 2011 2012 2013 2014 2015 2016 2017
Sta
tew
ide
Wei
gh
ted
Rat
es
HEDIS Report Year
Footnote: Behavioral Health was carved out prior to HEDIS 2009; as such, no comparative data are available from previous years.
15.99% 16.61% 13.80% 11.10% 10.88% 10.78% 9.64% 11.16%
0%10%20%30%40%50%60%70%80%90%
100%
2010 2011 2012 2013 2014 2015 2016 2017
Sta
tew
ide
Wei
gh
ted
Rat
es
HEDIS Report Year
Footnote: Behavioral Health was carved out prior to HEDIS 2009; as such, no comparative data are available from previous years.

2017 HEDIS/CAHPS REPORT
Medicaid HEDIS Trending—Access/Availability of Care Measures
page 82TennCare 17.EQRO.06.017
Fig. 115. Prenatal and Postpartum Care (PPC): Timeliness of Prenatal Care
Fig. 116. PPC: Postpartum Care
Fig. 117. Use of First-Line Psychosocial Care for Children and Adolescents on Antipsychotics (APP): 1-5 Years
Fig. 118. APP: 6-11 Years
75.60%77.91%81.06%83.12%
79.83%79.51%80.70%80.23%76.34%76.94%
0%10%20%30%40%50%60%70%80%90%
100%
2006 2007 2010 2011 2012 2013 2014 2015 2016 2017
Sta
tew
ide
Wei
gh
ted
Rat
es
HEDIS Report Year
58.20%57.28%64.11%62.50%61.06%59.90%58.77%58.74%55.57%
59.35%
0%10%20%30%40%50%60%70%80%90%
100%
2006 2007 2010 2011 2012 2013 2014 2015 2016 2017
Sta
tew
ide
Wei
gh
ted
Rat
es
HEDIS Report Year
38.38%30.51%
39.18%
0%10%20%30%40%50%60%70%80%90%
100%
2015 2016 2017
Sta
tew
ide
Wei
gh
ted
Rat
es
HEDIS Report Year
54.31% 53.91% 53.69%
0%10%20%30%40%50%60%70%80%90%
100%
2015 2016 2017
Sta
tew
ide
Wei
gh
ted
Rat
es
HEDIS Report Year

2017 HEDIS/CAHPS REPORT
Medicaid HEDIS Trending—Access/Availability of Care Measures
page 83TennCare 17.EQRO.06.017
Fig. 119. APP: 12-17 Years Fig. 120. APP: Total
55.10% 53.50%58.23%
0%10%20%30%40%50%60%70%80%90%
100%
2015 2016 2017
Sta
tew
ide
Wei
gh
ted
Rat
es
HEDIS Report Year
53.92% 52.80% 56.04%
0%10%20%30%40%50%60%70%80%90%
100%
2015 2016 2017
Sta
tew
ide
Wei
gh
ted
Rat
es
HEDIS Report Year

2017 HEDIS/CAHPS REPORT
Medicaid HEDIS Trending
page 84TennCare 17.EQRO.06.017
Utilization MeasuresFig. 121. Fig. 122. Well-Child Visits in the First 15 Months of Life (W15):
6 or More Visits
Fig. 123. Well-Child Visits in the Third, Fourth, Fifth and Sixth Years of Life (W34)
Fig. 124. Adolescent Well-Care Visits (AWC)
49.80%40.16%
51.82%61.07%58.29%61.60%63.08%
58.30%55.51%57.09%
0%10%20%30%40%50%60%70%80%90%
100%
2006 2007 2010 2011 2012 2013 2014 2015 2016 2017
Sta
tew
ide
Wei
gh
ted
Rat
es
HEDIS Report Year
34.80%35.76%
59.72%55.75%62.36%62.32%65.41%
60.69%57.63%60.94%
0%10%20%30%40%50%60%70%80%90%
100%
2006 2007 2010 2011 2012 2013 2014 2015 2016 2017
Sta
tew
ide
Wei
gh
ted
Rat
es
HEDIS Report Year
Footnote: In 2015, due to notable changes in the measure specification, trending between prior years’ should be considered with caution.
57.50%58.56%70.23% 71.80%72.69%71.68%70.80%69.70%68.01%69.18%
0%10%20%30%40%50%60%70%80%90%
100%
2006 2007 2010 2011 2012 2013 2014 2015 2016 2017
Sta
tew
ide
Wei
gh
ted
Rat
es
HEDIS Report Year
33.50%35.05%41.14%46.19%45.95%44.53%
50.27%47.18%
42.34%46.61%
0%10%20%30%40%50%60%70%80%90%
100%
2006 2007 2010 2011 2012 2013 2014 2015 2016 2017
Sta
tew
ide
Wei
gh
ted
Rat
es
HEDIS Report Year

2017 HEDIS/CAHPS REPORT
page 85TennCare 17.EQRO.06.017
CHIP HEDIS/CAHPS ResultsAt HCFA’s request, HEDIS measure and CAHPS results for CoverKids, Tennessee’s CHIP, were added to this annual HEDIS/CAHPS report in 2017. HEDIS definitions for measures apply to all lines of business. For CoverKids, BlueCare (CKBC) is the only health plan administrator (HPA) and the only plan reporting HEDIS/CAHPS measures, so no comparative statewide data are available.
Table 12. HEDIS 2017 CHIP RatesMeasure Rate
Effectiveness of Care Measures
Prevention and Screening
Adult BMI Assessment (ABA) NA
Weight Assessment and Counseling for Nutrition and Physical Activity for Children/Adolescents (WCC):
BMI Percentile 63.26%
Counseling for Nutrition 50.36%
Counseling for Physical Activity 47.93%
Childhood Immunization Status (CIS):
DTaP 81.51%
IPV 88.32%
MMR 88.08%
HiB 88.56%
Hepatitis B 84.67%
VZV 89.78%
Pneumococcal Conjugate 82.73%
Hepatitis A 86.62%
Rotavirus 75.91%
Influenza 54.26%
Combination #2 75.67%
Combination #3 74.21%
Combination #4 73.24%
Combination #5 65.45%
Table 12. HEDIS 2017 CHIP RatesMeasure Rate
Combination #6 49.15%
Combination #7 64.72%
Combination #8 48.66%
Combination #9 45.01%
Combination #10 44.53%
Immunizations for Adolescents (IMA):
Meningococcal 66.18%
Tdap 82.24%
HPV 10.95%
Combination #1 65.94%
Combination #2 9.73%
Lead Screening in Children (LSC) 64.48%
Breast Cancer Screening (BCS) NA
Cervical Cancer Screening (CCS) 75.32%
Chlamydia Screening in Women (CHL):
16-20 Years 30.80%
21-24 Years 80.56%
Total 31.46%
Respiratory Conditions
Appropriate Testing for Children with Pharyngitis (CWP) 88.68%
Use of Spirometry Testing in the Assessment and Diagnosis of COPD (SPR) NA

2017 HEDIS/CAHPS REPORT
CHIP Results
page 86TennCare 17.EQRO.06.017
Table 12. HEDIS 2017 CHIP RatesMeasure Rate
Pharmacotherapy Management of COPD Exacerbation (PCE):
Systemic Corticosteroid NA
Bronchodilator NA
Medication Management for People With Asthma (MMA):
Medication Compliance 50%: 5-11 Years 59.92%
12-18 Years 57.41%
19-50 Years NA
51-64 Years NA
Total 58.87%
Medication Compliance 75%: 5-11 Years 33.40%
12-18 Years 29.11%
19-50 Years NA
51-64 Years NA
Total 31.57%
Asthma Medication Ratio (AMR):
5-11 Years 79.48%
12-18 Years 78.77%
19-50 Years NA
51-64 Years NA
Total 79.23%
Cardiovascular Conditions
Controlling High Blood Pressure (CBP) NA
Persistence of Beta-Blocker Treatment After a HeartAttack (PBH) NA
Statin Therapy for Patients With Cardiovascular Disease (SPC):
Received Statin Therapy: 21-75 Years (Male) NA
40-75 Years (Female) NA
Total NA
Table 12. HEDIS 2017 CHIP RatesMeasure Rate
Statin Adherence 80%: 21-75 Years (Male) NA
40-75 Years (Female) NA
Total NA
Diabetes
Comprehensive Diabetes Care (CDC):
Hemoglobin A1c (HbA1c) Testing 84.85%
HbA1c Control (<8.0%) 33.33%
HbA1c Control (<7.0%) 24.24%
Eye Exam (Retinal) Performed 42.42%
Medical Attention for Nephropathy 69.70%
Blood Pressure Control (<140/90 mm Hg) 63.64%
Statin Therapy for Patients With Diabetes (SPD):
Received Statin Therapy NA
Statin Adherence 80% NA
Musculoskeletal Conditions
Disease-Modifying Anti-Rheumatic Drug Therapy in Rheumatoid Arthritis (ART) NA
Behavioral Health
Antidepressant Medication Management (AMM):
Effective Acute Phase Treatment 54.02%
Effective Continuation Phase Treatment 29.89%
Follow-Up Care for Children Prescribed ADHD Medication (ADD):
Initiation Phase 40.89%
Continuation and Maintenance (C&M) Phase 51.53%
Follow-Up After Hospitalization for Mental Illness (FUH):
7-Day Follow-Up 58.96%
30-Day Follow-Up 78.73%

2017 HEDIS/CAHPS REPORT
CHIP Results
page 87TennCare 17.EQRO.06.017
Table 12. HEDIS 2017 CHIP RatesMeasure Rate
Follow-Up After Emergency Department Visit for Mental Illness (FUM):
7-Day Follow-Up 35.88%
30-Day Follow-Up 61.07%
Follow-Up After Emergency Department Visit for Alcohol and Other Drug Dependence (FUA):
7-Day Follow-Up: 13-17 Years 11.43%
18+ Years NA
Total 11.11%
30-Day Follow-Up: 13-17 Years 17.14%
18+ Years NA
Total 15.56%
Diabetes Screening for People With Schizophrenia or Bipolar Disorder Who Are Using Antipsychotic Medication (SSD)
62.50%
Diabetes Monitoring for People With Diabetes and Schizophrenia (SMD) NA
Cardiovascular Monitoring for People With Cardiovascular Disease and Schizophrenia (SMC) NA
Adherence to Antipsychotic Medications for Individuals With Schizophrenia (SAA) NA
Metabolic Monitoring for Children and Adolescents on Antipsychotics (APM):
1-5 Years NA
6-11 Years 29.41%
12-17 Years 31.16%
Total 30.74%
Medication Management
Annual Monitoring for Patients on Persistent Medications (MPM):
ACE Inhibitors or ARBs NA
Table 12. HEDIS 2017 CHIP RatesMeasure Rate
Digoxin NA
Diuretics NA
Total NA
Overuse/Appropriateness
Appropriate Treatment for Children With URI (URI) 79.75%
Avoidance of Antibiotic Treatment in Adults with Acute Bronchitis (AAB) NA
Use of Imaging Studies for Low Back Pain (LBP) 60.32%
Access/Availability of CareAdults' Access to Preventive/Ambulatory Health Services (AAP):
20-44 Years 77.44%
45-64 Years NA
65+ Years NA
Total 77.04%
Children and Adolescents' Access to Primary CarePractitioners (CAP):
12-24 Months 94.89%
25 Months - 6 Years 85.97%
7-11 Years 89.56%
12-19 Years 85.75%
Initiation and Engagement of AOD Dependence Treatment (IET):
Initiation of AOD Treatment: 13-17 Years 43.95%
18+ Years 50.00%
Total 46.27%
Engagement of AOD Treatment: 13-17 Years 22.93%
18+ Years 19.39%
Total 21.57%

2017 HEDIS/CAHPS REPORT
CHIP Results
page 88TennCare 17.EQRO.06.017
Table 12. HEDIS 2017 CHIP RatesMeasure Rate
Prenatal and Postpartum Care (PPC):
Timeliness of Prenatal Care 69.27%
Postpartum Care 64.88%
Use of First-Line Psychosocial Care for Children andAdolescents on Antipsychotics (APP)
1-5 Years NA
6-11 Years NA
12-17 Years 57.50%
Total 55.14%
Utilization
Frequency of Ongoing Prenatal Care (FPC):
81+ Percent 59.76%
Well-Child Visits in the First 15 Months of Life (W15):
6+ Visits 75.22%
Well-Child Visits in the Third, Fourth, Fifth and SixthYears of Life (w34) 66.58%
Adolescent Well-Care Visits (AWC) 38.93%
Table 13. HEDIS 2017 CHIP Rates Where Lower Rates Indicate Better PerformanceMeasure Rate
Effectiveness of Care Measures
Diabetes
Comprehensive Diabetes Care (CDC):
HbA1c Poor Control (>9.0%) 60.61%
Overuse/Appropriateness
Non-Recommended Cervical Cancer Screening in Adolescent 1.43%
Use of Multiple Concurrent Antipsychotics in Children and Adolescents (APC):
1-5 Years NA
6-11 Years 1.64%
12-17 Years 0.00%
Total 0.44%

2017 HEDIS/CAHPS REPORT
page 89TennCare 17.EQRO.06.017
Table 14 and Table 15 show the CAHPS results for the CoverKids HPA. CAHPS definitions for measures apply to all lines of business.
Table 14. 2017 CAHPS 5.0H Child CHIP Survey Results (General Population)Question CKBC
1. Getting Needed Care (Always + Usually) 93.05%2. Getting Care Quickly (Always + Usually) 95.96%3. How Well Doctors Communicate (Always + Usually) 95.98%4. Customer Service (Always + Usually) 94.95%5.Shared Decision Making (Yes) 81.97%6. Rating of All Health Care (9+10) 75.75%7. Rating of Personal Doctor (9+10) 78.89%8. Rating of Specialist Seen Most Often (9+10) NA9. Rating of Health Plan (9+10) 80.77%
Table 15. 2017 CAHPS 5.0H Child CHIP Survey Results (Children with Chronic Conditions)Question CKBC
1. Getting Needed Care (Always + Usually) 91.05%2. Getting Care Quickly (Always + Usually) 96.67%3. How Well Doctors Communicate (Always + Usually) 96.83%4. Customer Service (Always + Usually) 94.36%5.Shared Decision Making (Yes) 83.05%6. Rating of All Health Care (9+10) 72.49%7. Rating of Personal Doctor (9+10) 77.30%8.Rating of Specialist Seen Most Often (9+10) 68.42%9. Rating of Health Plan (9+10) 77.33%10. Coordination of Care (Always + Usually) 81.82%11. Access to Specialized Services (Always + Usually) NA12. Family-Centered Care: Personal Doctor Who Knows Child (Yes) 93.00%13. Coordination of Care for Children With Chronic Conditions (Yes) 75.78%14. Family-Centered Care: Getting Needed Information (Always + Usually) 95.27%15. Access to Prescription Medicines (Always + Usually) 97.38%

2017 HEDIS/CAHPS REPORT
page A-1TennCare 17.EQRO.06.017
APPENDIX A | Utilization Measure Medicaid Results and BenchmarksUtilization Additional MeasureDescriptionsFrequency of Selected Procedure (FSP)FSP summarizes the utilization of frequently performed procedures that often show wide regional variation and have generated concern regarding potentially inappropriate utilization.
Ambulatory Care (AMB)AMB summarizes utilization of ambulatory care in the following categories:
Outpatient Visits ED Visits
Inpatient Utilization – General Hospital/Acute Care (IPU)IPU summarizes utilization of acute IP care and services in the following categories:
Total IP Surgery Medicine Maternity
Identification of Alcohol and Other Drug Services (IAD)IAD summarizes the number and percentage of members with an AOD claim who received the following chemical dependency services during the measurement year:
Any services Outpatient or ED IP Intensive outpatient or partial
hospitalization
Mental Health Utilization (MPT)MPT summarizes the number and percentage of members receiving the following mental health services during the measurement year:
Any services Outpatient or ED IP Intensive outpatient or partial
hospitalization
Antibiotic Utilization (ABX)ABX summarizes the following data on outpatient utilization of antibiotic prescriptions during the MY, stratified by age and gender:
Total number of and average (Avg.) number of antibiotic prescription per member per year (PMPY) Total and avg. days supplied for all antibiotic prescriptions

2017 HEDIS/CAHPS REPORT
APPENDIX A | Utilization Measure Medicaid Results and Benchmarks
page A-2TennCare 17.EQRO.06.017
Total number of prescriptions and avg. number of prescriptions PMPY for antibiotic of concern Percentage of antibiotic of concern for all antibiotic prescriptions Avg. number of antibiotics PMPY reported by drug class:
For selected ‘antibiotics of concern’ For all other antibiotics
Standardized Healthcare-Associated Infection Ratio (HAI)HAI reports the percentages of total discharges summarizes the hospital-reported standard infection ratios (SIR) for four different healthcare-associated infections (HAIs), adjusted for the proportion of members discharged from each MCO’s contracted acute care hospital. The measure reports the percentage of total discharges from hospitals with a high,
moderate, low or unavailable SIR, next to a total plan-weighted SIR for each of the following infections during the MY, stratified by age and gender:
Total number of and avg. number of antibiotic PMPY Total and avg. days supplied for all antibiotic prescriptions Total number of prescriptions and avg. number of prescriptions PMPY for antibiotic of concern Percentage of antibiotic of concern for all antibiotic prescriptions Avg. number of antibiotics PMPY reported by drug class:
For selected ‘antibiotics of concern’ For all other antibiotics

2017 HEDIS/CAHPS REPORT
APPENDIX A | Utilization Measure Medicaid Results and Benchmarks
page A-3TennCare 17.EQRO.06.017
Utilization Measures: Medicaid Plan-Specific Rates/National BenchmarksIn Table A, cells are shaded gray for those measures that were not calculated or for which data were not reported.
Table A. HEDIS 2017 Medicaid Plan-Specific Rates with HEDIS 2016 National Benchmarks: Utilization MeasuresMeasure by Age Sex AGE AGM AGW BCE BCM BCW TCS UHCE UHCM UHCW
2016 National Medicaid Means and PercentilesMean P10 P25 P50 P75 P90
Frequency of Ongoing Prenatal Care (FPC):<21% NA 8.39% 7.21% 11.83% 3.74% 11.19% 12.17% 9.55% 7.85% 13.14% 13.63% 11.96% 2.87% 4.87% 8.22% 14.69% 23.60%21–40% NA 7.46% 6.74% 14.39% 2.59% 13.14% 10.46% 10.96% 5.32% 9.73% 10.71% 7.26% 2.33% 3.95% 5.82% 9.02% 13.93%41–60% NA 8.39% 8.84% 11.83% 4.60% 12.41% 9.98% 13.48% 4.81% 13.14% 14.60% 8.59% 4.65% 6.03% 7.92% 10.46% 12.99%61–80% NA 16.08% 20.00% 17.17% 8.05% 15.09% 15.33% 17.70% 13.16% 15.57% 23.11% 15.23% 10.48% 12.58% 14.95% 17.95% 20.45%
81% NA 59.67% 57.21% 44.78% 81.03% 48.18% 52.07% 48.31% 68.86% 48.42% 37.96% 56.61% 32.79% 45.72% 59.26% 69.54% 75.77%Well-Child Visits in the First 15 Months of Life (W15):0 Visits NA 2.31% 2.31% 5.32% 1.44% 0.49% 2.92% 11.92% 3.16% 2.74% 4.14% 2.62% 0.44% 0.93% 1.71% 3.24% 5.77%1 Visits NA 3.24% 1.85% 4.86% 1.15% 2.19% 5.11% 4.14% 1.58% 2.24% 5.35% 2.30% 0.70% 1.26% 1.95% 2.92% 4.12%2 Visits NA 4.86% 2.78% 7.18% 1.15% 4.14% 5.60% 3.65% 3.16% 2.74% 6.08% 3.45% 1.23% 2.06% 3.19% 4.62% 5.84%3 Visits NA 6.48% 3.70% 12.96% 4.02% 4.38% 6.57% 7.79% 3.95% 3.49% 10.46% 5.54% 2.66% 3.72% 5.42% 6.98% 8.57%4 Visits NA 9.26% 6.71% 12.73% 6.32% 10.22% 9.98% 13.38% 9.74% 7.23% 11.19% 9.64% 6.01% 7.54% 9.16% 11.30% 13.40%5 Visits NA 13.89% 9.26% 16.90% 15.52% 15.09% 14.11% 17.76% 11.58% 19.45% 17.27% 17.11% 12.02% 14.29% 16.49% 19.23% 23.72%6 or More Visits NA 59.95% 73.38% 40.05% 70.40% 63.50% 55.72% 41.36% 66.84% 62.09% 45.50% 59.35% 45.38% 53.49% 59.57% 67.76% 73.88%
Frequency of Selected Procedures (FSP)Bariatric weight loss surgery: Procedures /1,000 Member Years0–19
M0.00 0.00 0.00 0.00 0.00 0.00 0.00 0.00 0.00 0.00 0.00 0.00 0.00 0.00 0.00 0.00
20–44 0.00 0.00 0.00 0.00 0.00 0.00 0.00 0.01 0.00 0.00 0.01 0.00 0.00 0.01 0.02 0.0345–64 0.00 0.04 0.00 0.01 0.02 0.00 0.00 0.01 0.03 0.00 0.01 0.00 0.00 0.01 0.02 0.040–19
F0.00 0.00 0.00 0.00 0.00 0.00 0.00 0.00 0.00 0.00 0.00 0.00 0.00 0.00 0.00 0.00
20–44 0.01 0.02 0.01 0.04 0.02 0.00 0.00 0.04 0.03 0.02 0.06 0.00 0.01 0.05 0.09 0.1345–64 0.01 0.04 0.03 0.03 0.06 0.01 0.00 0.05 0.05 0.01 0.08 0.00 0.01 0.05 0.10 0.16Tonsillectomy: Procedures /1,000 Member Years0–9
M&F0.95 0.80 0.49 1.19 0.78 0.58 0.96 1.22 0.81 0.56 0.62 0.24 0.45 0.62 0.80 0.95
10–19 0.47 0.32 0.29 0.51 0.37 0.28 0.31 0.51 0.40 0.27 0.28 0.07 0.19 0.27 0.36 0.45Hysterectomy—Abdominal (A) and Vaginal (V): Procedures /1,000 Member YearsA 15–44
F0.08 0.12 0.08 0.11 0.14 0.15 0.01 0.10 0.14 0.14 0.13 0.05 0.09 0.13 0.17 0.21
A 45–64 0.20 0.18 0.31 0.11 0.22 0.31 0.00 0.12 0.15 0.37 0.31 0.11 0.20 0.27 0.34 0.48

2017 HEDIS/CAHPS REPORT
APPENDIX A | Utilization Measure Medicaid Results and Benchmarks
page A-4TennCare 17.EQRO.06.017
Table A. HEDIS 2017 Medicaid Plan-Specific Rates with HEDIS 2016 National Benchmarks: Utilization MeasuresMeasure by Age Sex AGE AGM AGW BCE BCM BCW TCS UHCE UHCM UHCW
2016 National Medicaid Means and PercentilesMean P10 P25 P50 P75 P90
V 15–44F
0.21 0.19 0.07 0.25 0.20 0.08 0.04 0.28 0.17 0.07 0.14 0.03 0.06 0.12 0.20 0.30V 45–64 0.26 0.20 0.10 0.31 0.23 0.09 0.00 0.19 0.23 0.08 0.22 0.05 0.12 0.19 0.27 0.42Cholecystectomy—Open (O) and Closed (C)/Laparoscopic: Procedures /1,000 Member YearsO 30–64 M 0.02 0.02 0.07 0.03 0.00 0.04 0.03 0.05 0.00 0.05 0.03 0.00 0.01 0.02 0.04 0.05O 15–44
F0.00 0.01 0.02 0.00 0.01 0.01 0.01 0.02 0.01 0.01 0.01 0.00 0.00 0.01 0.01 0.02
O 45–64 0.06 0.01 0.08 0.01 0.03 0.08 0.00 0.02 0.02 0.05 0.03 0.00 0.00 0.03 0.05 0.07C 30–64 M 0.41 0.38 0.28 0.50 0.48 0.33 0.10 0.50 0.42 0.29 0.29 0.12 0.19 0.28 0.37 0.51C 15–44
F0.82 0.71 0.48 0.80 0.74 0.55 0.35 0.86 0.78 0.46 0.67 0.36 0.49 0.63 0.80 1.02
C 45–64 0.71 0.69 0.47 0.73 0.60 0.39 0.12 0.94 0.75 0.49 0.65 0.33 0.45 0.62 0.82 1.00Back Surgery: Procedures /1,000 Member Years
20–44M 0.24 0.26 0.17 0.36 0.22 0.21 0.01 0.24 0.23 0.23 0.27 0.04 0.12 0.24 0.34 0.49F 0.12 0.21 0.11 0.26 0.18 0.13 0.01 0.26 0.27 0.10 0.22 0.04 0.10 0.16 0.24 0.30
45–64M 0.47 0.76 0.63 0.71 0.70 0.35 0.00 0.82 0.82 0.27 0.62 0.19 0.38 0.57 0.80 0.94F 0.32 0.85 0.24 0.75 0.87 0.29 0.12 0.92 0.95 0.59 0.53 0.08 0.31 0.49 0.67 0.85
Mastectomy: Procedures /1,000 Member Years15–44
F0.01 0.02 0.01 0.05 0.04 0.02 0.01 0.05 0.02 0.01 0.03 0.00 0.01 0.02 0.03 0.05
45–64 0.11 0.24 0.06 0.38 0.18 0.30 0.00 0.35 0.33 0.14 0.19 0.00 0.10 0.14 0.21 0.38Lumpectomy: Procedures /1,000 Member Years15–44
F0.11 0.08 0.13 0.09 0.10 0.14 0.06 0.10 0.11 0.08 0.11 0.04 0.09 0.12 0.14 0.16
45–64 0.18 0.30 0.33 0.53 0.26 0.55 0.00 0.32 0.39 0.39 0.38 0.17 0.27 0.38 0.44 0.54Ambulatory Care: Total (AMB)
Outpatient Visits: Visits/1,000 Member Months<1 NA 765.43 743.34 579.83 848.64 759.45 682.04 889.58 764.61 745.96 610.341–9 NA 249.72 285.18 215.93 341.65 285.37 275.46 348.28 291.35 310.56 257.0210–19 NA 197.71 219.21 175.52 278.44 227.33 224.25 243.89 247.52 242.38 205.5420–44 NA 230.70 306.83 242.25 342.65 311.39 332.39 96.57 329.34 346.19 301.9845–64 NA 464.24 624.28 453.55 681.36 626.52 631.68 175.29 674.42 716.85 587.2965–74 NA 412.09 660.38 378.81 85.50 121.37 159.80 296.30 738.47 680.08 591.7475–84 NA 308.67 596.08 399.71 25.00 166.23 62.24 583.33 557.38 365.19 379.63
85 NA 266.67 504.95 359.79 21.98 139.72 71.43 260.05 179.54 139.23Total NA 267.77 327.48 249.53 382.57 325.11 325.38 259.20 366.15 363.78 305.87 357.17 258.19 303.40 350.23 389.30 450.33
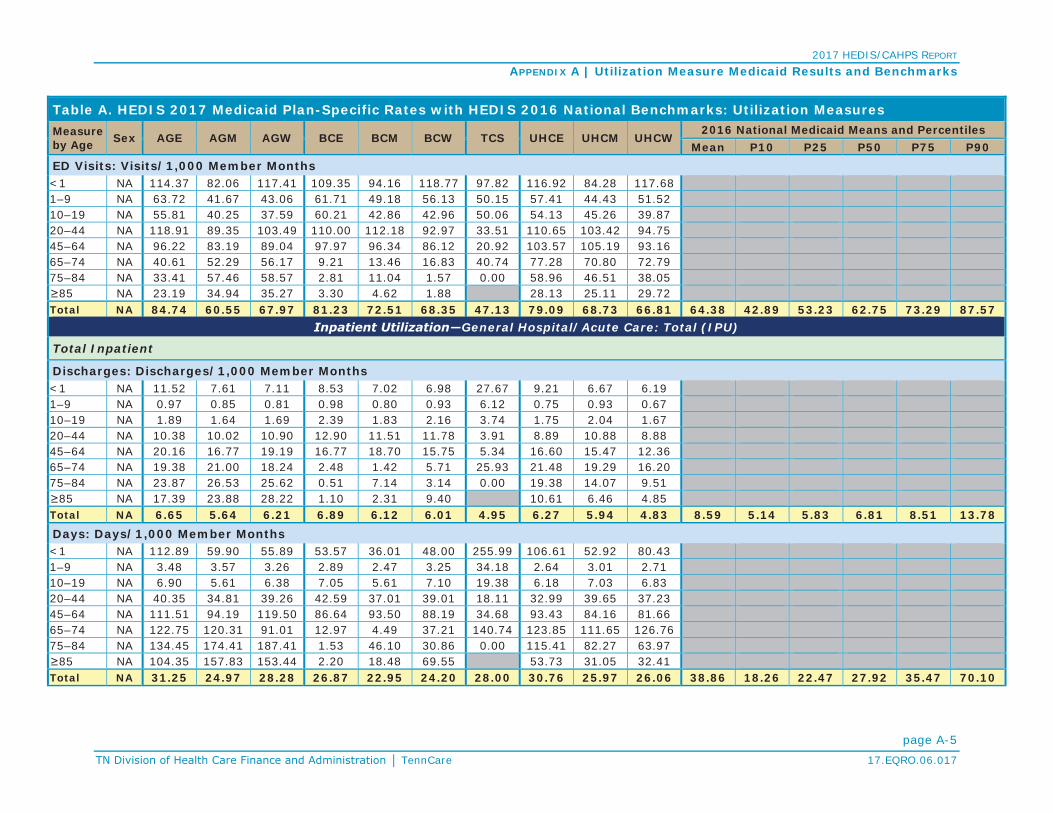
2017 HEDIS/CAHPS REPORT
APPENDIX A | Utilization Measure Medicaid Results and Benchmarks
page A-5TennCare 17.EQRO.06.017
Table A. HEDIS 2017 Medicaid Plan-Specific Rates with HEDIS 2016 National Benchmarks: Utilization MeasuresMeasure by Age Sex AGE AGM AGW BCE BCM BCW TCS UHCE UHCM UHCW
2016 National Medicaid Means and PercentilesMean P10 P25 P50 P75 P90
ED Visits: Visits/1,000 Member Months<1 NA 114.37 82.06 117.41 109.35 94.16 118.77 97.82 116.92 84.28 117.681–9 NA 63.72 41.67 43.06 61.71 49.18 56.13 50.15 57.41 44.43 51.5210–19 NA 55.81 40.25 37.59 60.21 42.86 42.96 50.06 54.13 45.26 39.8720–44 NA 118.91 89.35 103.49 110.00 112.18 92.97 33.51 110.65 103.42 94.7545–64 NA 96.22 83.19 89.04 97.97 96.34 86.12 20.92 103.57 105.19 93.1665–74 NA 40.61 52.29 56.17 9.21 13.46 16.83 40.74 77.28 70.80 72.7975–84 NA 33.41 57.46 58.57 2.81 11.04 1.57 0.00 58.96 46.51 38.05
85 NA 23.19 34.94 35.27 3.30 4.62 1.88 28.13 25.11 29.72Total NA 84.74 60.55 67.97 81.23 72.51 68.35 47.13 79.09 68.73 66.81 64.38 42.89 53.23 62.75 73.29 87.57
General Hospital/Acute Care: Total (IPU)
Total Inpatient
Discharges: Discharges/1,000 Member Months<1 NA 11.52 7.61 7.11 8.53 7.02 6.98 27.67 9.21 6.67 6.191–9 NA 0.97 0.85 0.81 0.98 0.80 0.93 6.12 0.75 0.93 0.6710–19 NA 1.89 1.64 1.69 2.39 1.83 2.16 3.74 1.75 2.04 1.6720–44 NA 10.38 10.02 10.90 12.90 11.51 11.78 3.91 8.89 10.88 8.8845–64 NA 20.16 16.77 19.19 16.77 18.70 15.75 5.34 16.60 15.47 12.3665–74 NA 19.38 21.00 18.24 2.48 1.42 5.71 25.93 21.48 19.29 16.2075–84 NA 23.87 26.53 25.62 0.51 7.14 3.14 0.00 19.38 14.07 9.51
85 NA 17.39 23.88 28.22 1.10 2.31 9.40 10.61 6.46 4.85Total NA 6.65 5.64 6.21 6.89 6.12 6.01 4.95 6.27 5.94 4.83 8.59 5.14 5.83 6.81 8.51 13.78Days: Days/1,000 Member Months<1 NA 112.89 59.90 55.89 53.57 36.01 48.00 255.99 106.61 52.92 80.431–9 NA 3.48 3.57 3.26 2.89 2.47 3.25 34.18 2.64 3.01 2.7110–19 NA 6.90 5.61 6.38 7.05 5.61 7.10 19.38 6.18 7.03 6.8320–44 NA 40.35 34.81 39.26 42.59 37.01 39.01 18.11 32.99 39.65 37.2345–64 NA 111.51 94.19 119.50 86.64 93.50 88.19 34.68 93.43 84.16 81.6665–74 NA 122.75 120.31 91.01 12.97 4.49 37.21 140.74 123.85 111.65 126.7675–84 NA 134.45 174.41 187.41 1.53 46.10 30.86 0.00 115.41 82.27 63.97
85 NA 104.35 157.83 153.44 2.20 18.48 69.55 53.73 31.05 32.41Total NA 31.25 24.97 28.28 26.87 22.95 24.20 28.00 30.76 25.97 26.06 38.86 18.26 22.47 27.92 35.47 70.10

2017 HEDIS/CAHPS REPORT
APPENDIX A | Utilization Measure Medicaid Results and Benchmarks
page A-6TennCare 17.EQRO.06.017
Table A. HEDIS 2017 Medicaid Plan-Specific Rates with HEDIS 2016 National Benchmarks: Utilization MeasuresMeasure by Age Sex AGE AGM AGW BCE BCM BCW TCS UHCE UHCM UHCW
2016 National Medicaid Means and PercentilesMean P10 P25 P50 P75 P90
Average Length of Stay: Average # of Days<1 NA 9.80 7.87 7.86 6.28 5.13 6.88 9.25 11.57 7.93 13.001–9 NA 3.59 4.21 4.03 2.95 3.07 3.50 5.59 3.53 3.25 4.0510–19 NA 3.66 3.42 3.78 2.94 3.07 3.29 5.18 3.54 3.45 4.0920–44 NA 3.89 3.47 3.60 3.30 3.22 3.31 4.63 3.71 3.65 4.1945–64 NA 5.53 5.62 6.23 5.17 5.00 5.60 6.49 5.63 5.44 6.6065–74 NA 6.33 5.73 4.99 5.23 3.17 6.51 5.43 5.77 5.79 7.8375–84 NA 5.63 6.57 7.31 3.00 6.45 9.83 5.96 5.85 6.72
85 NA 6.00 6.61 5.44 2.00 8.00 7.40 5.07 4.81 6.69Unknown NATotal NA 4.70 4.42 4.55 3.90 3.75 4.03 5.65 4.91 4.37 5.40 4.18 3.29 3.67 4.10 4.55 5.28
Medicine
Discharges: Discharges/1,000 Member Months<1 NA 9.95 6.29 5.54 7.66 6.11 5.79 22.07 8.12 5.78 4.951–9 NA 0.75 0.58 0.56 0.83 0.62 0.75 4.72 0.59 0.73 0.4910-19 NA 0.61 0.53 0.41 0.67 0.56 0.54 2.50 0.53 0.73 0.4620–44 NA 2.99 2.34 2.61 3.11 3.03 3.02 2.05 2.63 2.72 2.1045–64 NA 13.29 11.51 12.41 12.12 13.80 11.51 4.29 11.44 10.62 8.1765–74 NA 14.77 14.88 14.04 1.84 1.18 4.63 18.52 15.27 13.41 10.7075–84 NA 19.09 23.15 21.96 0.51 6.49 2.62 0.00 14.64 10.74 6.59
85 NA 14.49 22.13 26.46 1.10 1.15 7.52 8.46 5.31 3.12Total NA 3.05 2.47 2.48 2.97 2.68 2.53 3.48 3.29 2.67 2.04 4.45 1.66 2.27 3.05 4.26 8.62Days: Days/1,000 Member Months<1 NA 91.59 36.08 26.37 46.56 25.77 26.08 148.95 91.51 43.50 38.221–9 NA 2.09 1.49 1.72 2.21 1.65 2.29 20.70 1.86 2.35 1.8210–19 NA 2.11 1.69 1.32 2.27 1.79 2.05 12.88 2.13 2.52 2.0620–44 NA 11.07 8.80 9.82 13.33 11.96 12.62 9.45 11.63 11.27 11.3345–64 NA 55.91 52.04 51.77 57.54 62.23 56.65 21.20 59.11 53.73 48.2265–74 NA 70.60 79.72 58.73 8.89 3.54 27.79 103.70 77.93 69.89 69.5475–84 NA 97.85 126.75 153.73 1.53 40.91 27.72 0.00 72.41 57.32 38.88
85 NA 85.51 146.19 137.57 2.20 4.62 58.27 42.51 26.05 17.34Total NA 13.52 10.64 9.93 13.37 10.95 11.13 17.12 17.20 12.72 11.66 18.47 5.19 8.35 12.05 16.86 37.45

2017 HEDIS/CAHPS REPORT
APPENDIX A | Utilization Measure Medicaid Results and Benchmarks
page A-7 TennCare 17.EQRO.06.017
Table A. HEDIS 2017 Medicaid Plan-Specific Rates with HEDIS 2016 National Benchmarks: Utilization MeasuresMeasure by Age Sex AGE AGM AGW BCE BCM BCW TCS UHCE UHCM UHCW
2016 National Medicaid Means and PercentilesMean P10 P25 P50 P75 P90
Average Length of Stay: Average # of Days<1 NA 9.20 5.74 4.76 6.08 4.22 4.50 6.75 11.27 7.52 7.721–9 NA 2.78 2.58 3.07 2.67 2.64 3.05 4.39 3.15 3.24 3.7010–19 NA 3.44 3.20 3.24 3.37 3.17 3.82 5.16 3.99 3.46 4.5320–44 NA 3.70 3.75 3.77 4.29 3.95 4.18 4.62 4.42 4.15 5.3845–64 NA 4.21 4.52 4.17 4.75 4.51 4.92 4.94 5.17 5.06 5.9065–74 NA 4.78 5.36 4.18 4.83 3.00 6.00 5.60 5.10 5.21 6.5075–84 NA 5.13 5.47 7.00 3.00 6.30 10.60 4.95 5.34 5.90
85 NA 5.90 6.61 5.20 2.00 4.00 7.75 5.03 4.90 5.55Unknown NATotal NA 4.43 4.30 4.00 4.50 4.09 4.41 4.91 5.22 4.76 5.70 3.94 3.32 3.57 3.89 4.26 4.62
Surgery
Discharges: Discharges/1,000 Member Months<1 NA 1.56 1.33 1.57 0.86 0.83 1.17 5.60 1.05 0.86 1.241–9 NA 0.22 0.27 0.25 0.15 0.18 0.18 1.40 0.16 0.20 0.1810–19 NA 0.32 0.30 0.30 0.29 0.28 0.30 0.72 0.29 0.25 0.2320–44 NA 1.90 1.35 1.45 1.34 1.14 1.19 0.50 1.44 1.16 1.1645–64 NA 6.85 5.19 6.72 4.64 4.87 4.21 1.05 5.15 4.81 4.1665–74 NA 4.61 6.12 4.19 0.64 0.24 1.08 7.41 6.21 5.88 5.5075–84 NA 4.77 3.38 3.66 0.00 0.65 0.52 0.00 4.74 3.33 2.92
85 NA 2.90 1.75 1.76 0.00 1.15 1.88 2.15 1.15 1.72Total NA 1.52 1.13 1.28 1.05 0.92 0.91 0.99 1.42 1.04 1.00 1.86 0.77 1.08 1.43 1.90 3.02
Days: Days/1,000 Member Months<1 NA 21.30 23.82 29.52 6.87 10.11 21.88 107.04 14.95 9.36 42.201–9 NA 1.38 2.08 1.54 0.66 0.82 0.96 13.47 0.78 0.66 0.8910–19 NA 2.12 1.64 2.37 1.10 1.13 1.53 5.06 1.42 1.13 1.5820–44 NA 14.92 8.86 11.35 7.59 6.00 7.19 4.74 7.55 6.00 7.9445–64 NA 55.51 41.99 67.23 29.06 31.18 31.48 13.49 34.27 30.33 33.3365–74 NA 52.15 40.59 32.28 4.08 0.94 9.42 37.04 45.92 41.75 57.2275–84 NA 36.60 47.66 33.67 0.00 5.19 3.14 0.00 43.00 24.95 25.09
85 NA 18.84 11.65 15.87 0.00 13.86 11.28 11.22 5.00 15.07Total NA 12.24 8.78 11.84 6.13 5.43 6.50 9.51 9.11 6.14 8.68 14.21 4.72 6.65 9.30 13.07 25.02

2017 HEDIS/CAHPS REPORT
APPENDIX A | Utilization Measure Medicaid Results and Benchmarks
page A-8TennCare 17.EQRO.06.017
Table A. HEDIS 2017 Medicaid Plan-Specific Rates with HEDIS 2016 National Benchmarks: Utilization MeasuresMeasure by Age Sex AGE AGM AGW BCE BCM BCW TCS UHCE UHCM UHCW
2016 National Medicaid Means and PercentilesMean P10 P25 P50 P75 P90
Average Length of Stay: Average # of Days<1 NA 13.62 17.95 18.79 8.00 12.13 18.74 19.12 14.18 10.87 34.111–9 NA 6.43 7.74 6.18 4.45 4.57 5.41 9.65 4.94 3.30 5.0610–19 NA 6.69 5.38 7.83 3.86 4.08 5.11 7.02 4.94 4.56 6.7920–44 NA 7.85 6.57 7.83 5.65 5.28 6.03 9.40 5.25 5.19 6.8745–64 NA 8.10 8.08 10.00 6.27 6.40 7.47 12.89 6.65 6.30 8.0265–74 NA 11.30 6.63 7.70 6.38 4.00 8.71 5.00 7.39 7.10 10.4175–84 NA 7.67 14.10 9.20 8.00 6.00 9.07 7.50 8.59
85 NA 6.50 6.67 9.00 12.00 6.00 5.21 4.36 8.75Total NA 8.06 7.79 9.22 5.86 5.89 7.17 9.65 6.42 5.89 8.72 7.01 4.85 6.01 6.88 7.96 9.01
Maternity (calculated using member months for members 10-64 years)
Discharges: Discharges/1,000 Member Months10–19 NA 0.96 0.81 0.98 1.43 0.99 1.32 0.51 0.93 1.06 0.9820–44 NA 5.48 6.33 6.85 8.45 7.34 7.57 1.36 4.82 7.00 5.6245–64 NA 0.02 0.06 0.05 0.01 0.02 0.02 0.00 0.01 0.04 0.04Total NA 3.00 3.29 3.75 4.43 3.85 3.98 0.73 2.40 3.62 2.89 3.69 0.88 2.15 2.99 4.52 6.93Days: Days/1,000 Member Months10–19 NA 2.68 2.28 2.69 3.68 2.68 3.52 1.34 2.63 3.38 3.1820–44 NA 14.36 17.16 18.10 21.68 19.03 19.20 3.92 13.81 22.38 17.9745–64 NA 0.09 0.16 0.51 0.03 0.08 0.04 0.00 0.05 0.09 0.11Total NA 7.93 8.94 10.01 11.37 10.04 10.16 2.01 6.88 11.57 9.25 9.90 2.46 5.99 8.06 11.63 18.54Average Length of Stay: Average # of Days10–19 NA 2.79 2.82 2.76 2.57 2.72 2.67 2.63 2.84 3.18 3.2420–44 NA 2.62 2.71 2.64 2.57 2.59 2.54 2.89 2.86 3.19 3.2045–64 NA 4.33 2.55 9.43 2.67 4.33 2.00 5.50 2.43 2.83Unknown NATotal NA 2.64 2.72 2.67 2.57 2.61 2.55 2.76 2.86 3.19 3.20 2.73 2.34 2.52 2.67 2.83 3.07
Identification of Alcohol and Other Drug Services: Total (IAD)Any Services
0–12M 0.17% 0.01% 0.03% 0.18% 0.04% 0.06% 0.25% 0.14% 0.03% 0.02%F 0.15% 0.02% 0.04% 0.14% 0.03% 0.02% 0.23% 0.13% 0.04% 0.03%
M&F 0.16% 0.02% 0.04% 0.16% 0.04% 0.04% 0.24% 0.13% 0.03% 0.03%

2017 HEDIS/CAHPS REPORT
APPENDIX A | Utilization Measure Medicaid Results and Benchmarks
page A-9TennCare 17.EQRO.06.017
Table A. HEDIS 2017 Medicaid Plan-Specific Rates with HEDIS 2016 National Benchmarks: Utilization MeasuresMeasure by Age Sex AGE AGM AGW BCE BCM BCW TCS UHCE UHCM UHCW
2016 National Medicaid Means and PercentilesMean P10 P25 P50 P75 P90
13–17M 2.09% 2.50% 1.86% 2.13% 1.99% 1.85% 6.61% 2.35% 2.60% 1.96%F 1.65% 1.63% 1.08% 1.67% 1.31% 1.22% 6.75% 1.69% 1.79% 1.16%
M&F 1.87% 2.07% 1.47% 1.90% 1.65% 1.53% 6.66% 2.02% 2.20% 1.55%
18–24M 5.79% 4.27% 4.13% 4.24% 4.88% 2.77% 3.71% 3.98% 4.81% 3.62%F 7.32% 4.83% 3.92% 5.80% 5.57% 3.06% 3.37% 5.74% 4.87% 3.03%
M&F 6.68% 4.63% 4.00% 5.28% 5.32% 2.96% 3.58% 5.06% 4.85% 3.25%
25–34M 11.63% 9.41% 9.32% 9.83% 11.61% 8.20% 2.01% 9.97% 11.41% 8.98%F 11.11% 8.50% 5.32% 11.33% 10.83% 6.24% 2.48% 10.60% 9.37% 5.71%
M&F 11.25% 8.69% 5.94% 11.06% 10.99% 6.53% 2.32% 10.45% 9.76% 6.26%
35–64M 14.50% 12.77% 13.47% 14.58% 18.13% 13.82% 1.63% 15.79% 15.35% 11.98%F 10.29% 9.13% 6.42% 12.70% 13.70% 8.57% 1.55% 11.42% 12.39% 6.81%
M&F 11.99% 10.43% 8.88% 13.32% 15.19% 9.94% 1.58% 13.04% 13.42% 8.49%
65M 6.07% 8.75% 6.40% 1.13% 1.07% 0.96% 0.00% 7.32% 7.26% 4.94%F 2.76% 4.03% 1.93% 0.60% 0.27% 0.56% 0.00% 4.39% 3.76% 2.78%
M&F 4.01% 5.76% 3.40% 0.76% 0.54% 0.67% 0.00% 5.27% 4.79% 3.42%
UnknownMF
M&F
TotalM 4.73% 3.45% 3.22% 3.77% 4.08% 2.70% 2.69% 4.84% 4.06% 2.99%F 5.55% 4.18% 2.99% 5.92% 5.58% 3.54% 2.42% 5.55% 5.10% 2.96%
M&F 5.19% 3.87% 3.08% 5.04% 4.95% 3.21% 2.58% 5.25% 4.66% 2.97% 6.08% 1.41% 2.87% 5.05% 7.33% 12.91%Inpatient
0–12M 0.01% 0.00% 0.00% 0.00% 0.00% 0.01% 0.06% 0.01% 0.01% 0.00%F 0.01% 0.01% 0.00% 0.00% 0.01% 0.00% 0.02% 0.00% 0.01% 0.00%
M&F 0.01% 0.00% 0.00% 0.00% 0.00% 0.01% 0.05% 0.01% 0.01% 0.00%
13–17M 0.49% 0.42% 0.62% 0.45% 0.33% 0.60% 1.01% 0.42% 0.41% 0.31%F 0.55% 0.28% 0.45% 0.34% 0.30% 0.52% 0.99% 0.40% 0.45% 0.52%
M&F 0.52% 0.35% 0.54% 0.40% 0.32% 0.56% 1.00% 0.41% 0.43% 0.42%
18–24M 2.02% 1.30% 1.49% 1.03% 1.48% 0.89% 1.14% 1.40% 1.70% 1.17%F 3.32% 1.95% 1.19% 2.35% 1.91% 0.87% 1.04% 2.41% 1.84% 0.95%
M&F 2.78% 1.72% 1.31% 1.92% 1.75% 0.88% 1.10% 2.02% 1.79% 1.03%
25–34M 4.58% 2.76% 4.41% 3.09% 3.69% 2.94% 1.25% 3.17% 4.49% 3.36%F 5.08% 2.97% 1.91% 4.38% 3.80% 1.69% 1.14% 3.97% 3.21% 1.71%
M&F 4.95% 2.92% 2.30% 4.15% 3.78% 1.87% 1.18% 3.79% 3.46% 1.98%

2017 HEDIS/CAHPS REPORT
APPENDIX A | Utilization Measure Medicaid Results and Benchmarks
page A-10TennCare 17.EQRO.06.017
Table A. HEDIS 2017 Medicaid Plan-Specific Rates with HEDIS 2016 National Benchmarks: Utilization MeasuresMeasure by Age Sex AGE AGM AGW BCE BCM BCW TCS UHCE UHCM UHCW
2016 National Medicaid Means and PercentilesMean P10 P25 P50 P75 P90
35–64M 5.52% 4.32% 5.64% 3.92% 6.10% 4.01% 0.95% 4.82% 4.69% 4.08%F 3.21% 2.59% 2.00% 2.73% 3.26% 1.82% 0.84% 2.83% 2.91% 1.62%
M&F 4.14% 3.21% 3.27% 3.12% 4.21% 2.39% 0.89% 3.57% 3.53% 2.42%
65M 3.04% 2.73% 1.48% 0.68% 0.53% 0.00% 0.00% 2.54% 2.36% 1.91%F 0.61% 0.71% 0.48% 0.10% 0.00% 0.19% 0.00% 0.83% 0.77% 0.33%
M&F 1.53% 1.45% 0.81% 0.28% 0.18% 0.13% 0.00% 1.35% 1.24% 0.80%
UnknownMF
M&F
TotalM 1.73% 1.06% 1.32% 0.99% 1.29% 0.82% 0.60% 1.45% 1.26% 0.97%F 2.18% 1.33% 0.99% 1.75% 1.64% 0.87% 0.56% 1.65% 1.45% 0.80%
M&F 1.98% 1.21% 1.12% 1.44% 1.49% 0.85% 0.58% 1.57% 1.37% 0.87% 1.81% 0.37% 0.79% 1.25% 2.05% 3.82%Intensive Outpatient/Partial Hospitalization
0–12M 0.00% 0.00% 0.00% 0.00% 0.00% 0.00% 0.03% 0.00% 0.00% 0.00%F 0.00% 0.00% 0.00% 0.00% 0.00% 0.00% 0.01% 0.00% 0.00% 0.00%
M&F 0.00% 0.00% 0.00% 0.00% 0.00% 0.00% 0.02% 0.00% 0.00% 0.00%
13–17M 0.69% 0.68% 0.30% 0.86% 0.69% 0.51% 2.24% 0.79% 0.92% 0.40%F 0.15% 0.39% 0.06% 0.46% 0.33% 0.14% 2.78% 0.28% 0.39% 0.21%
M&F 0.42% 0.54% 0.18% 0.66% 0.51% 0.32% 2.44% 0.54% 0.66% 0.30%
18–24M 0.60% 0.68% 0.38% 0.75% 1.47% 0.58% 0.81% 0.56% 0.83% 0.43%F 1.09% 0.84% 0.56% 1.12% 1.67% 0.50% 0.52% 0.88% 0.63% 0.42%
M&F 0.89% 0.78% 0.49% 1.00% 1.60% 0.52% 0.70% 0.75% 0.70% 0.43%
25–34M 1.42% 0.98% 1.09% 1.81% 2.96% 1.05% 0.42% 1.03% 2.00% 1.24%F 2.05% 1.33% 0.86% 2.58% 2.98% 1.21% 0.28% 1.78% 1.61% 0.92%
M&F 1.88% 1.26% 0.89% 2.44% 2.97% 1.18% 0.33% 1.60% 1.69% 0.97%
35–64M 0.74% 0.93% 1.04% 1.34% 2.89% 1.28% 0.17% 0.64% 1.00% 0.76%F 0.83% 0.69% 0.52% 1.39% 2.04% 0.71% 0.23% 0.71% 0.80% 0.47%
M&F 0.79% 0.78% 0.70% 1.37% 2.33% 0.86% 0.20% 0.68% 0.87% 0.56%
65M 0.00% 0.00% 0.00% 0.00% 0.00% 0.00% 0.00% 0.10% 0.25% 0.26%F 0.00% 0.00% 0.00% 0.00% 0.00% 0.00% 0.00% 0.00% 0.00% 0.00%
M&F 0.00% 0.00% 0.00% 0.00% 0.00% 0.00% 0.00% 0.03% 0.07% 0.08%
UnknownMF
M&F

2017 HEDIS/CAHPS REPORT
APPENDIX A | Utilization Measure Medicaid Results and Benchmarks
page A-11TennCare 17.EQRO.06.017
Table A. HEDIS 2017 Medicaid Plan-Specific Rates with HEDIS 2016 National Benchmarks: Utilization MeasuresMeasure by Age Sex AGE AGM AGW BCE BCM BCW TCS UHCE UHCM UHCW
2016 National Medicaid Means and PercentilesMean P10 P25 P50 P75 P90
TotalM 0.43% 0.37% 0.30% 0.52% 0.85% 0.35% 0.77% 0.36% 0.49% 0.28%F 0.74% 0.52% 0.37% 0.97% 1.22% 0.44% 0.71% 0.56% 0.55% 0.32%
M&F 0.60% 0.45% 0.34% 0.79% 1.06% 0.41% 0.75% 0.48% 0.53% 0.30% 0.25% 0.00% 0.02% 0.11% 0.31% 0.68%Outpatient/ED*
0–12M 0.16% 0.01% 0.03% 0.18% 0.04% 0.05% 0.20% 0.13% 0.02% 0.02%F 0.13% 0.01% 0.04% 0.14% 0.03% 0.02% 0.22% 0.12% 0.03% 0.03%
M&F 0.14% 0.01% 0.04% 0.16% 0.03% 0.04% 0.21% 0.13% 0.03% 0.03%
13–17M 1.59% 2.01% 1.42% 1.80% 1.60% 1.50% 5.65% 1.97% 2.23% 1.74%F 1.38% 1.38% 0.90% 1.52% 1.08% 0.94% 6.10% 1.53% 1.46% 1.04%
M&F 1.48% 1.69% 1.16% 1.66% 1.35% 1.21% 5.82% 1.75% 1.85% 1.38%
18–24M 4.63% 3.35% 3.40% 3.53% 3.89% 2.31% 3.49% 3.18% 3.61% 3.07%F 5.39% 3.74% 3.19% 4.19% 4.47% 2.54% 2.76% 4.43% 4.03% 2.47%
M&F 5.08% 3.60% 3.27% 3.97% 4.25% 2.46% 3.20% 3.95% 3.88% 2.68%
25–34M 9.58% 7.95% 7.41% 8.17% 9.52% 6.81% 2.32% 8.51% 9.22% 7.43%F 8.70% 7.04% 4.26% 9.29% 9.14% 5.31% 2.12% 8.84% 7.96% 4.87%
M&F 8.93% 7.22% 4.75% 9.09% 9.22% 5.53% 2.17% 8.76% 8.21% 5.30%
35–64M 11.50% 10.70% 10.74% 12.89% 15.23% 11.88% 1.42% 13.68% 13.31% 10.34%F 8.66% 7.98% 5.53% 11.41% 12.19% 7.70% 0.94% 10.21% 11.19% 6.10%
M&F 9.81% 8.96% 7.35% 11.89% 13.21% 8.79% 1.11% 11.50% 11.93% 7.48%
65M 3.54% 7.11% 5.42% 0.45% 0.53% 0.96% 0.00% 5.71% 6.42% 3.73%F 2.46% 3.48% 1.69% 0.70% 0.27% 0.56% 0.00% 4.07% 3.41% 2.52%
M&F 2.87% 4.81% 2.91% 0.62% 0.36% 0.67% 0.00% 4.57% 4.30% 2.88%
UnknownMF
M&F
TotalM 3.79% 2.86% 2.58% 3.28% 3.38% 2.29% 2.37% 4.14% 3.43% 2.56%F 4.43% 3.52% 2.48% 5.03% 4.79% 3.08% 2.11% 4.81% 4.46% 2.59%
M&F 4.15% 3.24% 2.52% 4.32% 4.20% 2.77% 2.26% 4.52% 4.03% 2.57% 5.44% 1.18% 2.45% 4.40% 6.79% 11.11%Mental Health Utilization: Total (MPT)
Any Services
0–12M 9.55% 7.64% 4.11% 9.81% 8.05% 4.86% 26.37% 9.03% 7.99% 4.30%F 6.04% 4.90% 2.38% 6.18% 4.90% 3.10% 18.52% 5.16% 4.85% 2.55%
M&F 7.84% 6.29% 3.25% 8.02% 6.49% 3.99% 23.12% 7.13% 6.44% 3.44%

2017 HEDIS/CAHPS REPORT
APPENDIX A | Utilization Measure Medicaid Results and Benchmarks
page A-12TennCare 17.EQRO.06.017
Table A. HEDIS 2017 Medicaid Plan-Specific Rates with HEDIS 2016 National Benchmarks: Utilization MeasuresMeasure by Age Sex AGE AGM AGW BCE BCM BCW TCS UHCE UHCM UHCW
2016 National Medicaid Means and PercentilesMean P10 P25 P50 P75 P90
13–17M 13.58% 12.60% 7.11% 15.39% 11.25% 8.52% 37.72% 12.75% 12.27% 7.17%F 14.10% 14.67% 6.93% 16.68% 12.68% 8.74% 36.93% 14.63% 13.54% 6.87%
M&F 13.84% 13.63% 7.02% 16.03% 11.96% 8.63% 37.43% 13.70% 12.90% 7.01%
18–64M 9.95% 11.97% 6.72% 11.13% 8.36% 8.43% 11.60% 12.97% 11.77% 9.62%F 11.92% 14.64% 5.74% 14.43% 10.99% 8.58% 7.75% 15.78% 13.87% 8.84%
M&F 11.21% 13.81% 6.03% 13.48% 10.19% 8.54% 9.81% 14.83% 13.22% 9.07%
65M 9.11% 6.70% 3.45% 0.91% 2.13% 3.83% 16.22% 6.23% 7.94% 6.32%F 10.74% 9.25% 5.78% 2.20% 1.91% 3.74% 0.00% 9.85% 9.67% 5.89%
M&F 10.13% 8.31% 5.02% 1.80% 1.99% 3.77% 7.84% 8.76% 9.16% 6.02%
UnknownMF
M&F
TotalM 10.25% 9.71% 5.36% 11.01% 8.58% 6.45% 25.16% 10.91% 9.77% 6.36%F 10.08% 10.88% 4.63% 11.64% 8.81% 6.61% 18.70% 11.87% 10.37% 6.26%
M&F 10.15% 10.39% 4.93% 11.38% 8.71% 6.55% 22.45% 11.46% 10.12% 6.30% 12.84% 4.82% 7.21% 10.94% 15.74% 21.73%
Inpatient
0–12M 0.12% 0.08% 0.14% 0.10% 0.07% 0.11% 0.85% 0.07% 0.07% 0.10%F 0.09% 0.06% 0.09% 0.05% 0.05% 0.08% 0.47% 0.09% 0.05% 0.08%
M&F 0.11% 0.07% 0.12% 0.08% 0.06% 0.10% 0.69% 0.08% 0.06% 0.09%
13–17M 0.88% 0.74% 0.92% 0.88% 0.63% 1.06% 3.13% 0.73% 0.70% 0.83%F 1.61% 1.16% 1.37% 1.30% 1.05% 1.52% 4.53% 1.24% 1.40% 1.15%
M&F 1.24% 0.95% 1.14% 1.08% 0.84% 1.30% 3.64% 0.99% 1.05% 0.99%
18–64M 2.15% 1.85% 2.60% 1.44% 1.91% 1.70% 1.75% 2.04% 2.07% 2.51%F 1.65% 1.43% 1.28% 1.37% 1.49% 1.12% 1.35% 1.59% 1.67% 1.39%
M&F 1.83% 1.56% 1.67% 1.39% 1.62% 1.27% 1.56% 1.74% 1.79% 1.73%
65M 5.57% 1.50% 0.00% 0.45% 2.13% 1.44% 0.00% 2.34% 3.55% 3.47%F 7.98% 1.82% 2.41% 0.80% 1.37% 1.50% 0.00% 3.62% 3.83% 2.56%
M&F 7.07% 1.70% 1.62% 0.69% 1.63% 1.48% 0.00% 3.23% 3.75% 2.83%
UnknownMF
M&F
TotalM 1.04% 0.74% 1.05% 0.64% 0.73% 0.71% 1.68% 0.94% 0.83% 1.00%F 1.13% 0.89% 0.86% 0.89% 0.90% 0.80% 1.61% 1.16% 1.11% 0.94%
M&F 1.09% 0.83% 0.94% 0.79% 0.83% 0.76% 1.65% 1.07% 0.99% 0.96% 1.37% 0.39% 0.56% 0.88% 1.24% 2.82%
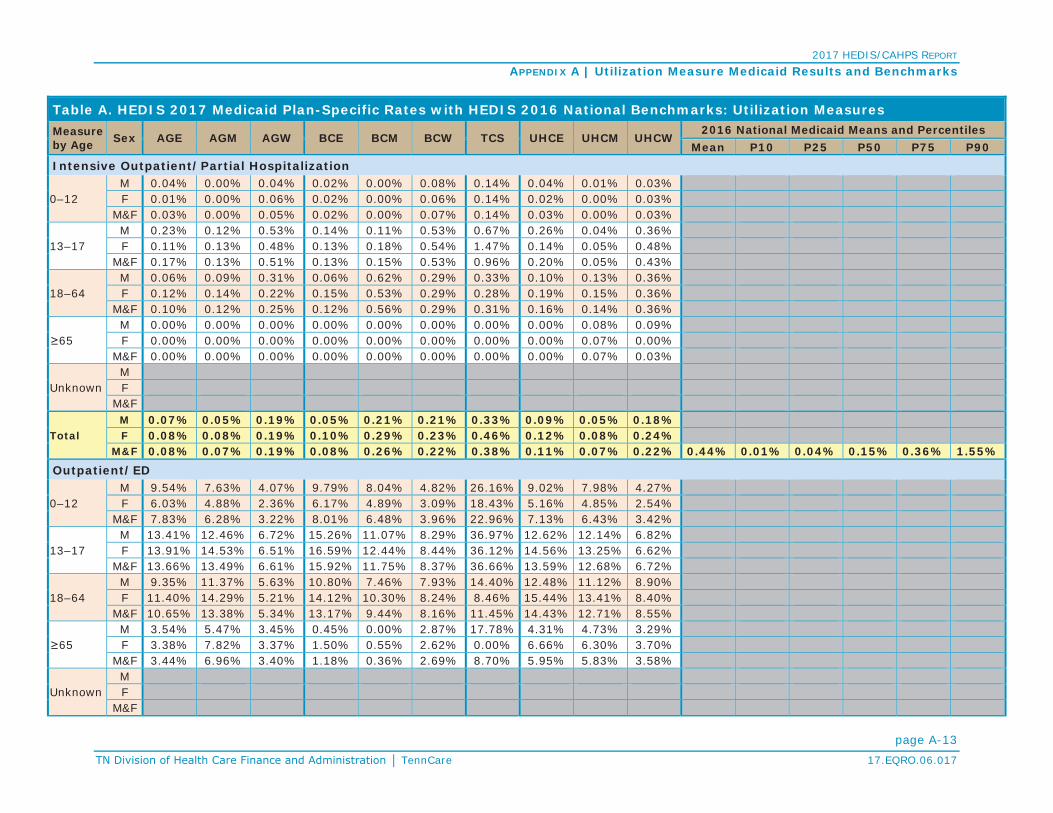
2017 HEDIS/CAHPS REPORT
APPENDIX A | Utilization Measure Medicaid Results and Benchmarks
page A-13TennCare 17.EQRO.06.017
Table A. HEDIS 2017 Medicaid Plan-Specific Rates with HEDIS 2016 National Benchmarks: Utilization MeasuresMeasure by Age Sex AGE AGM AGW BCE BCM BCW TCS UHCE UHCM UHCW
2016 National Medicaid Means and PercentilesMean P10 P25 P50 P75 P90
Intensive Outpatient/Partial Hospitalization
0–12M 0.04% 0.00% 0.04% 0.02% 0.00% 0.08% 0.14% 0.04% 0.01% 0.03%F 0.01% 0.00% 0.06% 0.02% 0.00% 0.06% 0.14% 0.02% 0.00% 0.03%
M&F 0.03% 0.00% 0.05% 0.02% 0.00% 0.07% 0.14% 0.03% 0.00% 0.03%
13–17M 0.23% 0.12% 0.53% 0.14% 0.11% 0.53% 0.67% 0.26% 0.04% 0.36%F 0.11% 0.13% 0.48% 0.13% 0.18% 0.54% 1.47% 0.14% 0.05% 0.48%
M&F 0.17% 0.13% 0.51% 0.13% 0.15% 0.53% 0.96% 0.20% 0.05% 0.43%
18–64M 0.06% 0.09% 0.31% 0.06% 0.62% 0.29% 0.33% 0.10% 0.13% 0.36%F 0.12% 0.14% 0.22% 0.15% 0.53% 0.29% 0.28% 0.19% 0.15% 0.36%
M&F 0.10% 0.12% 0.25% 0.12% 0.56% 0.29% 0.31% 0.16% 0.14% 0.36%
65M 0.00% 0.00% 0.00% 0.00% 0.00% 0.00% 0.00% 0.00% 0.08% 0.09%F 0.00% 0.00% 0.00% 0.00% 0.00% 0.00% 0.00% 0.00% 0.07% 0.00%
M&F 0.00% 0.00% 0.00% 0.00% 0.00% 0.00% 0.00% 0.00% 0.07% 0.03%
UnknownMF
M&F
TotalM 0.07% 0.05% 0.19% 0.05% 0.21% 0.21% 0.33% 0.09% 0.05% 0.18%F 0.08% 0.08% 0.19% 0.10% 0.29% 0.23% 0.46% 0.12% 0.08% 0.24%
M&F 0.08% 0.07% 0.19% 0.08% 0.26% 0.22% 0.38% 0.11% 0.07% 0.22% 0.44% 0.01% 0.04% 0.15% 0.36% 1.55%Outpatient/ED
0–12M 9.54% 7.63% 4.07% 9.79% 8.04% 4.82% 26.16% 9.02% 7.98% 4.27%F 6.03% 4.88% 2.36% 6.17% 4.89% 3.09% 18.43% 5.16% 4.85% 2.54%
M&F 7.83% 6.28% 3.22% 8.01% 6.48% 3.96% 22.96% 7.13% 6.43% 3.42%
13–17M 13.41% 12.46% 6.72% 15.26% 11.07% 8.29% 36.97% 12.62% 12.14% 6.82%F 13.91% 14.53% 6.51% 16.59% 12.44% 8.44% 36.12% 14.56% 13.25% 6.62%
M&F 13.66% 13.49% 6.61% 15.92% 11.75% 8.37% 36.66% 13.59% 12.68% 6.72%
18–64M 9.35% 11.37% 5.63% 10.80% 7.46% 7.93% 14.40% 12.48% 11.12% 8.90%F 11.40% 14.29% 5.21% 14.12% 10.30% 8.24% 8.46% 15.44% 13.41% 8.40%
M&F 10.65% 13.38% 5.34% 13.17% 9.44% 8.16% 11.45% 14.43% 12.71% 8.55%
65M 3.54% 5.47% 3.45% 0.45% 0.00% 2.87% 17.78% 4.31% 4.73% 3.29%F 3.38% 7.82% 3.37% 1.50% 0.55% 2.62% 0.00% 6.66% 6.30% 3.70%
M&F 3.44% 6.96% 3.40% 1.18% 0.36% 2.69% 8.70% 5.95% 5.83% 3.58%
UnknownMF
M&F

2017 HEDIS/CAHPS REPORT
APPENDIX A | Utilization Measure Medicaid Results and Benchmarks
page A-14TennCare 17.EQRO.06.017
Table A. HEDIS 2017 Medicaid Plan-Specific Rates with HEDIS 2016 National Benchmarks: Utilization MeasuresMeasure by Age Sex AGE AGM AGW BCE BCM BCW TCS UHCE UHCM UHCW
2016 National Medicaid Means and PercentilesMean P10 P25 P50 P75 P90
TotalM 9.97% 9.48% 4.94% 10.87% 8.26% 6.25% 26.45% 10.65% 9.49% 6.02%F 9.73% 10.66% 4.29% 11.46% 8.42% 6.39% 19.21% 11.52% 10.00% 5.93%
M&F 9.84% 10.16% 4.55% 11.22% 8.35% 6.33% 23.38% 11.15% 9.79% 5.96% 12.11% 4.44% 6.76% 10.69% 14.61% 20.87%
Antibiotic Utilization: Total (ABX)
Antibiotic Utilization
Average Scripts PMPY for Antibiotics
0–9M 1.10 1.00 0.73 1.46 1.05 1.02 1.30 1.12 1.12 0.86F 1.15 1.04 0.76 1.51 1.10 1.08 1.38 1.17 1.16 0.87
M&F 1.13 1.02 0.75 1.48 1.07 1.05 1.33 1.15 1.14 0.86
10–17M 0.68 0.60 0.46 0.87 0.58 0.59 0.73 0.68 0.62 0.52F 0.89 0.84 0.63 1.16 0.75 0.81 1.07 0.94 0.87 0.67
M&F 0.78 0.72 0.54 1.01 0.66 0.70 0.85 0.81 0.74 0.59
18–34M 0.64 0.62 0.57 0.69 0.55 0.59 0.47 0.62 0.63 0.55F 1.48 1.44 1.54 1.56 1.48 1.57 0.85 1.34 1.40 1.36
M&F 1.20 1.21 1.28 1.34 1.22 1.32 0.64 1.12 1.19 1.14
35–49M 0.82 0.88 0.91 0.96 0.82 0.93 0.29 0.87 0.91 0.86F 1.43 1.49 1.48 1.60 1.46 1.62 0.33 1.44 1.49 1.42
M&F 1.21 1.31 1.32 1.41 1.28 1.48 0.31 1.25 1.31 1.28
50–64M 0.96 1.16 0.90 1.05 1.00 0.97 0.44 1.10 1.13 0.96F 1.40 1.79 1.36 1.59 1.46 1.52 0.74 1.71 1.72 1.52
M&F 1.19 1.50 1.16 1.39 1.26 1.31 0.57 1.44 1.47 1.26
65–74M 1.63 1.82 1.08 0.15 0.53 0.40 0.87 1.52 1.07 1.10F 2.28 2.59 1.75 0.30 0.38 0.39 0.49 2.05 1.67 1.46
M&F 2.00 2.28 1.51 0.26 0.44 0.39 0.67 1.85 1.46 1.32
75–84M 2.02 1.74 1.63 0.01 0.60 0.00 0.00 1.20 0.88 0.54F 1.94 2.34 1.66 0.09 0.39 0.11 0.00 1.54 0.96 0.75
M&F 1.97 2.16 1.65 0.07 0.45 0.09 0.00 1.45 0.93 0.70
85M 1.68 1.42 1.02 0.60 1.11 1.12 0.77 0.44 0.47F 1.22 2.49 1.02 0.38 0.21 0.24 0.70 0.48 0.36
M&F 1.29 2.28 1.02 0.42 0.40 0.38 0.71 0.47 0.38
UnknownMF
M&F
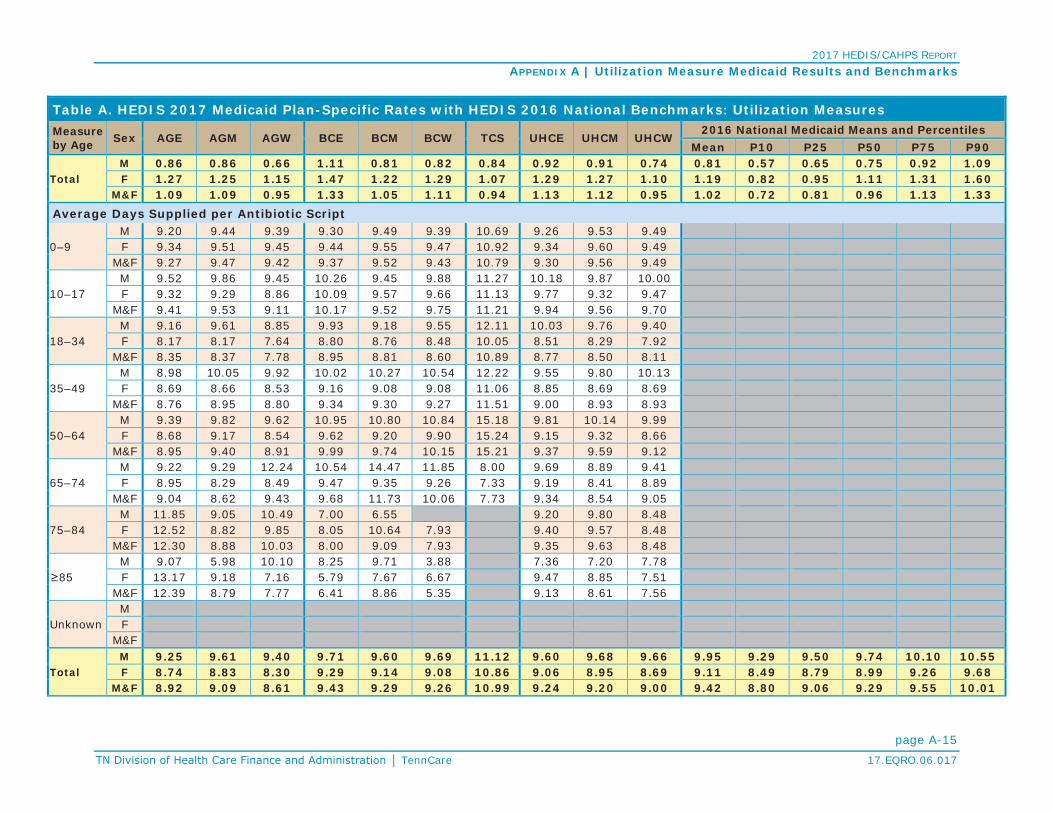
2017 HEDIS/CAHPS REPORT
APPENDIX A | Utilization Measure Medicaid Results and Benchmarks
page A-15TennCare 17.EQRO.06.017
Table A. HEDIS 2017 Medicaid Plan-Specific Rates with HEDIS 2016 National Benchmarks: Utilization MeasuresMeasure by Age Sex AGE AGM AGW BCE BCM BCW TCS UHCE UHCM UHCW
2016 National Medicaid Means and PercentilesMean P10 P25 P50 P75 P90
TotalM 0.86 0.86 0.66 1.11 0.81 0.82 0.84 0.92 0.91 0.74 0.81 0.57 0.65 0.75 0.92 1.09F 1.27 1.25 1.15 1.47 1.22 1.29 1.07 1.29 1.27 1.10 1.19 0.82 0.95 1.11 1.31 1.60
M&F 1.09 1.09 0.95 1.33 1.05 1.11 0.94 1.13 1.12 0.95 1.02 0.72 0.81 0.96 1.13 1.33Average Days Supplied per Antibiotic Script
0–9M 9.20 9.44 9.39 9.30 9.49 9.39 10.69 9.26 9.53 9.49F 9.34 9.51 9.45 9.44 9.55 9.47 10.92 9.34 9.60 9.49
M&F 9.27 9.47 9.42 9.37 9.52 9.43 10.79 9.30 9.56 9.49
10–17M 9.52 9.86 9.45 10.26 9.45 9.88 11.27 10.18 9.87 10.00F 9.32 9.29 8.86 10.09 9.57 9.66 11.13 9.77 9.32 9.47
M&F 9.41 9.53 9.11 10.17 9.52 9.75 11.21 9.94 9.56 9.70
18–34M 9.16 9.61 8.85 9.93 9.18 9.55 12.11 10.03 9.76 9.40F 8.17 8.17 7.64 8.80 8.76 8.48 10.05 8.51 8.29 7.92
M&F 8.35 8.37 7.78 8.95 8.81 8.60 10.89 8.77 8.50 8.11
35–49M 8.98 10.05 9.92 10.02 10.27 10.54 12.22 9.55 9.80 10.13F 8.69 8.66 8.53 9.16 9.08 9.08 11.06 8.85 8.69 8.69
M&F 8.76 8.95 8.80 9.34 9.30 9.27 11.51 9.00 8.93 8.93
50–64M 9.39 9.82 9.62 10.95 10.80 10.84 15.18 9.81 10.14 9.99F 8.68 9.17 8.54 9.62 9.20 9.90 15.24 9.15 9.32 8.66
M&F 8.95 9.40 8.91 9.99 9.74 10.15 15.21 9.37 9.59 9.12
65–74M 9.22 9.29 12.24 10.54 14.47 11.85 8.00 9.69 8.89 9.41F 8.95 8.29 8.49 9.47 9.35 9.26 7.33 9.19 8.41 8.89
M&F 9.04 8.62 9.43 9.68 11.73 10.06 7.73 9.34 8.54 9.05
75–84M 11.85 9.05 10.49 7.00 6.55 9.20 9.80 8.48F 12.52 8.82 9.85 8.05 10.64 7.93 9.40 9.57 8.48
M&F 12.30 8.88 10.03 8.00 9.09 7.93 9.35 9.63 8.48
85M 9.07 5.98 10.10 8.25 9.71 3.88 7.36 7.20 7.78F 13.17 9.18 7.16 5.79 7.67 6.67 9.47 8.85 7.51
M&F 12.39 8.79 7.77 6.41 8.86 5.35 9.13 8.61 7.56
UnknownMF
M&F
TotalM 9.25 9.61 9.40 9.71 9.60 9.69 11.12 9.60 9.68 9.66 9.95 9.29 9.50 9.74 10.10 10.55F 8.74 8.83 8.30 9.29 9.14 9.08 10.86 9.06 8.95 8.69 9.11 8.49 8.79 8.99 9.26 9.68
M&F 8.92 9.09 8.61 9.43 9.29 9.26 10.99 9.24 9.20 9.00 9.42 8.80 9.06 9.29 9.55 10.01

2017 HEDIS/CAHPS REPORT
APPENDIX A | Utilization Measure Medicaid Results and Benchmarks
page A-16TennCare 17.EQRO.06.017
Table A. HEDIS 2017 Medicaid Plan-Specific Rates with HEDIS 2016 National Benchmarks: Utilization MeasuresMeasure by Age Sex AGE AGM AGW BCE BCM BCW TCS UHCE UHCM UHCW
2016 National Medicaid Means and PercentilesMean P10 P25 P50 P75 P90
Average Scripts PMPY for Antibiotics of Concern
0–9M 0.53 0.44 0.31 0.74 0.45 0.50 0.63 0.55 0.49 0.38F 0.52 0.44 0.31 0.71 0.45 0.49 0.61 0.55 0.50 0.36
M&F 0.53 0.44 0.31 0.73 0.45 0.49 0.62 0.55 0.49 0.37
10–17M 0.33 0.27 0.22 0.42 0.26 0.28 0.31 0.34 0.28 0.25F 0.40 0.36 0.27 0.53 0.32 0.37 0.43 0.45 0.38 0.29
M&F 0.36 0.32 0.25 0.47 0.29 0.32 0.36 0.40 0.33 0.27
18–34M 0.32 0.30 0.28 0.32 0.26 0.27 0.20 0.30 0.30 0.27F 0.64 0.60 0.61 0.66 0.59 0.61 0.33 0.60 0.60 0.56
M&F 0.53 0.52 0.52 0.57 0.50 0.52 0.25 0.51 0.52 0.48
35–49M 0.42 0.44 0.46 0.50 0.40 0.47 0.11 0.46 0.47 0.44F 0.73 0.72 0.69 0.82 0.70 0.74 0.11 0.75 0.73 0.68
M&F 0.62 0.63 0.63 0.72 0.62 0.69 0.11 0.66 0.65 0.62
50–64M 0.54 0.59 0.46 0.53 0.48 0.48 0.15 0.59 0.58 0.47F 0.78 0.95 0.70 0.84 0.76 0.77 0.23 0.95 0.95 0.80
M&F 0.66 0.79 0.59 0.73 0.64 0.66 0.18 0.79 0.80 0.65
65–74M 0.98 1.01 0.44 0.08 0.21 0.22 0.48 0.89 0.62 0.62F 1.34 1.35 0.93 0.15 0.21 0.22 0.16 1.14 0.95 0.76
M&F 1.19 1.21 0.76 0.13 0.21 0.22 0.31 1.05 0.83 0.71
75–84M 1.31 1.01 0.74 0.00 0.35 0.00 0.00 0.66 0.53 0.31F 0.87 1.46 0.75 0.03 0.24 0.07 0.00 0.82 0.52 0.41
M&F 1.01 1.33 0.75 0.02 0.27 0.05 0.00 0.78 0.52 0.39
85M 1.08 0.85 0.61 0.38 0.39 0.70 0.48 0.28 0.35F 0.55 1.41 0.51 0.19 0.14 0.11 0.36 0.26 0.19
M&F 0.63 1.30 0.53 0.22 0.19 0.20 0.38 0.26 0.21
UnknownMF
M&F
TotalM 0.43 0.40 0.30 0.55 0.37 0.40 0.38 0.46 0.42 0.34 0.35 0.21 0.27 0.32 0.40 0.53F 0.59 0.56 0.48 0.69 0.52 0.56 0.44 0.63 0.58 0.49 0.50 0.32 0.38 0.46 0.57 0.74
M&F 0.52 0.49 0.41 0.63 0.46 0.49 0.41 0.56 0.51 0.43 0.43 0.27 0.33 0.40 0.49 0.63Percentage of Antibiotics of Concern of All Antibiotic Scripts
0–9M 48.42% 44.05% 41.84% 50.31% 43.13% 48.47% 48.77% 49.29% 43.93% 43.88%F 45.18% 41.85% 40.43% 47.43% 41.44% 45.33% 44.02% 47.24% 42.62% 41.90%
M&F 46.81% 42.95% 41.13% 48.87% 42.28% 46.88% 46.65% 48.26% 43.27% 42.90%

2017 HEDIS/CAHPS REPORT
APPENDIX A | Utilization Measure Medicaid Results and Benchmarks
page A-17TennCare 17.EQRO.06.017
Table A. HEDIS 2017 Medicaid Plan-Specific Rates with HEDIS 2016 National Benchmarks: Utilization MeasuresMeasure by Age Sex AGE AGM AGW BCE BCM BCW TCS UHCE UHCM UHCW
2016 National Medicaid Means and PercentilesMean P10 P25 P50 P75 P90
10–17M 48.98% 45.69% 48.15% 48.05% 45.58% 47.43% 42.95% 50.12% 45.79% 47.65%F 44.41% 43.27% 43.68% 45.99% 42.44% 45.09% 40.38% 48.14% 44.14% 43.69%
M&F 46.41% 44.28% 45.55% 46.88% 43.82% 46.05% 41.76% 48.98% 44.84% 45.39%
18–34M 49.01% 48.21% 49.21% 46.32% 47.22% 45.25% 41.51% 49.19% 48.22% 49.08%F 43.23% 41.71% 39.43% 42.22% 39.85% 38.54% 38.44% 44.76% 42.76% 41.47%
M&F 44.28% 42.64% 40.58% 42.75% 40.78% 39.30% 39.70% 45.51% 43.54% 42.46%
35–49M 51.12% 49.18% 50.39% 51.55% 48.95% 50.36% 39.50% 53.28% 51.81% 51.69%F 51.26% 48.30% 46.77% 51.19% 48.17% 45.82% 34.99% 52.11% 49.35% 47.76%
M&F 51.23% 48.48% 47.49% 51.26% 48.32% 46.42% 36.74% 52.37% 49.89% 48.43%
50–64M 56.04% 50.63% 50.66% 50.51% 48.13% 49.29% 33.75% 53.52% 51.85% 48.64%F 55.68% 53.48% 51.61% 53.14% 52.48% 50.47% 31.56% 55.33% 55.11% 53.03%
M&F 55.82% 52.47% 51.28% 52.39% 51.02% 50.15% 32.53% 54.72% 54.06% 51.51%
65–74M 60.24% 55.45% 40.46% 50.00% 40.28% 54.55% 55.56% 58.65% 58.39% 55.86%F 58.76% 51.99% 53.09% 50.93% 55.42% 56.46% 33.33% 55.93% 56.78% 52.14%
M&F 59.28% 53.12% 49.93% 50.75% 48.39% 55.87% 46.67% 56.75% 57.19% 53.30%
75–84M 64.71% 58.30% 45.28% 0.00% 59.09% 54.53% 60.78% 56.96%F 44.93% 62.61% 45.19% 31.82% 61.11% 57.14% 53.37% 54.40% 54.94%
M&F 51.46% 61.56% 45.21% 30.43% 60.34% 57.14% 53.63% 56.14% 55.35%
85M 64.29% 60.00% 60.00% 62.50% 35.29% 62.50% 62.30% 63.64% 74.51%F 45.00% 56.64% 50.00% 50.00% 66.67% 44.44% 51.69% 53.87% 51.67%
M&F 48.65% 57.06% 52.08% 53.13% 48.28% 52.94% 53.37% 55.29% 55.67%
UnknownMF
M&F
TotalM 49.61% 46.13% 45.74% 49.62% 44.90% 48.12% 45.65% 50.71% 46.36% 46.60% 43.03% 36.76% 39.39% 42.43% 46.66% 50.13%F 46.08% 44.44% 42.06% 46.66% 42.76% 43.33% 41.42% 49.05% 45.50% 44.45% 41.58% 35.72% 38.53% 40.98% 44.79% 48.29%
M&F 47.31% 45.00% 43.11% 47.67% 43.45% 44.74% 43.62% 49.62% 45.79% 45.14% 42.10% 36.01% 38.83% 41.73% 45.40% 48.90%
Antibiotics of Concern Utilization
Average Scripts PMPY for Quinolones
0–9M 0.00 0.00 0.00 0.00 0.00 0.00 0.01 0.00 0.00 0.00F 0.00 0.00 0.00 0.00 0.00 0.00 0.01 0.00 0.00 0.00
M&F 0.00 0.00 0.00 0.00 0.00 0.00 0.01 0.00 0.00 0.00
10–17M 0.00 0.01 0.00 0.01 0.00 0.01 0.01 0.01 0.01 0.00F 0.01 0.02 0.01 0.02 0.01 0.02 0.03 0.02 0.02 0.01
M&F 0.01 0.01 0.01 0.01 0.01 0.01 0.02 0.01 0.01 0.01

2017 HEDIS/CAHPS REPORT
APPENDIX A | Utilization Measure Medicaid Results and Benchmarks
page A-18TennCare 17.EQRO.06.017
Table A. HEDIS 2017 Medicaid Plan-Specific Rates with HEDIS 2016 National Benchmarks: Utilization MeasuresMeasure by Age Sex AGE AGM AGW BCE BCM BCW TCS UHCE UHCM UHCW
2016 National Medicaid Means and PercentilesMean P10 P25 P50 P75 P90
18–34M 0.04 0.04 0.04 0.04 0.04 0.04 0.03 0.04 0.05 0.04F 0.11 0.11 0.11 0.12 0.12 0.12 0.07 0.11 0.11 0.10
M&F 0.09 0.09 0.09 0.10 0.09 0.10 0.05 0.09 0.09 0.08
35–49M 0.09 0.10 0.12 0.11 0.11 0.11 0.04 0.10 0.11 0.10F 0.17 0.17 0.16 0.20 0.17 0.19 0.03 0.18 0.17 0.16
M&F 0.14 0.14 0.15 0.17 0.15 0.17 0.03 0.15 0.15 0.15
50–64M 0.16 0.19 0.14 0.16 0.16 0.15 0.05 0.18 0.18 0.15F 0.24 0.28 0.22 0.27 0.27 0.25 0.13 0.29 0.28 0.26
M&F 0.20 0.24 0.18 0.22 0.22 0.21 0.08 0.24 0.24 0.21
65–74M 0.36 0.40 0.09 0.03 0.08 0.10 0.19 0.31 0.20 0.22F 0.49 0.51 0.37 0.07 0.11 0.08 0.00 0.43 0.35 0.27
M&F 0.43 0.47 0.28 0.05 0.10 0.09 0.09 0.38 0.30 0.25
75–84M 0.66 0.54 0.34 0.00 0.08 0.00 0.00 0.24 0.18 0.12F 0.35 0.69 0.42 0.01 0.12 0.04 0.00 0.34 0.23 0.19
M&F 0.45 0.64 0.40 0.01 0.11 0.03 0.00 0.31 0.21 0.17
85M 0.96 0.50 0.31 0.30 0.07 0.14 0.21 0.11 0.19F 0.24 0.84 0.21 0.06 0.09 0.05 0.15 0.11 0.09
M&F 0.35 0.77 0.23 0.11 0.08 0.07 0.16 0.11 0.11
UnknownMF
M&F
TotalM 0.03 0.03 0.03 0.03 0.03 0.02 0.02 0.04 0.03 0.03 0.04 0.01 0.02 0.03 0.04 0.09F 0.08 0.08 0.07 0.09 0.08 0.09 0.03 0.10 0.08 0.08 0.09 0.04 0.06 0.08 0.10 0.15
M&F 0.06 0.06 0.06 0.07 0.06 0.06 0.02 0.08 0.06 0.06 0.07 0.03 0.04 0.06 0.08 0.13Average Scripts PMPY for Cephalosporins 2nd–4th Generation
0–9M 0.19 0.19 0.10 0.29 0.20 0.18 0.24 0.20 0.21 0.12F 0.20 0.20 0.11 0.30 0.21 0.18 0.24 0.22 0.23 0.13
M&F 0.19 0.19 0.10 0.29 0.20 0.18 0.24 0.21 0.22 0.12
10–17M 0.06 0.06 0.04 0.09 0.06 0.05 0.06 0.06 0.06 0.04F 0.08 0.09 0.05 0.12 0.08 0.07 0.10 0.10 0.08 0.05
M&F 0.07 0.07 0.04 0.11 0.07 0.06 0.08 0.08 0.07 0.04
18–34M 0.02 0.02 0.02 0.03 0.02 0.02 0.02 0.03 0.02 0.02F 0.05 0.05 0.03 0.06 0.05 0.04 0.03 0.05 0.05 0.03
M&F 0.04 0.05 0.03 0.05 0.04 0.04 0.02 0.05 0.05 0.03

2017 HEDIS/CAHPS REPORT
APPENDIX A | Utilization Measure Medicaid Results and Benchmarks
page A-19TennCare 17.EQRO.06.017
Table A. HEDIS 2017 Medicaid Plan-Specific Rates with HEDIS 2016 National Benchmarks: Utilization MeasuresMeasure by Age Sex AGE AGM AGW BCE BCM BCW TCS UHCE UHCM UHCW
2016 National Medicaid Means and PercentilesMean P10 P25 P50 P75 P90
35–49M 0.03 0.03 0.03 0.04 0.03 0.04 0.01 0.03 0.04 0.02F 0.06 0.07 0.04 0.07 0.06 0.04 0.01 0.07 0.06 0.04
M&F 0.05 0.05 0.04 0.06 0.05 0.04 0.01 0.06 0.06 0.03
50–64M 0.04 0.04 0.02 0.05 0.04 0.03 0.02 0.05 0.04 0.02F 0.06 0.07 0.04 0.08 0.06 0.05 0.00 0.09 0.10 0.05
M&F 0.05 0.06 0.03 0.07 0.05 0.04 0.01 0.07 0.07 0.04
65–74M 0.06 0.10 0.07 0.00 0.01 0.01 0.00 0.11 0.09 0.05F 0.10 0.12 0.09 0.02 0.01 0.02 0.08 0.15 0.11 0.07
M&F 0.09 0.11 0.09 0.02 0.01 0.02 0.04 0.14 0.10 0.06
75–84M 0.21 0.04 0.00 0.00 0.03 0.00 0.00 0.09 0.08 0.05F 0.15 0.21 0.07 0.00 0.01 0.00 0.00 0.13 0.08 0.03
M&F 0.17 0.16 0.05 0.00 0.02 0.00 0.00 0.12 0.08 0.03
85M 0.00 0.14 0.00 0.00 0.13 0.56 0.09 0.02 0.05F 0.16 0.15 0.05 0.05 0.00 0.00 0.08 0.04 0.03
M&F 0.14 0.15 0.04 0.04 0.03 0.09 0.08 0.04 0.03
UnknownMF
M&F
TotalM 0.09 0.11 0.06 0.16 0.11 0.10 0.11 0.10 0.12 0.07 0.06 0.01 0.02 0.05 0.08 0.12F 0.10 0.11 0.06 0.14 0.10 0.09 0.12 0.11 0.12 0.06 0.06 0.02 0.03 0.05 0.08 0.12
M&F 0.10 0.11 0.06 0.15 0.10 0.09 0.12 0.11 0.12 0.07 0.06 0.01 0.03 0.05 0.08 0.12Average Scripts PMPY for Azithromycins and Clarithromycins
0–9M 0.20 0.13 0.09 0.26 0.12 0.16 0.18 0.20 0.13 0.12F 0.18 0.12 0.09 0.23 0.12 0.15 0.17 0.19 0.13 0.11
M&F 0.19 0.12 0.09 0.25 0.12 0.15 0.18 0.19 0.13 0.11
10–17M 0.15 0.12 0.09 0.18 0.11 0.12 0.11 0.17 0.13 0.11F 0.18 0.16 0.13 0.23 0.13 0.16 0.15 0.21 0.17 0.13
M&F 0.17 0.14 0.11 0.20 0.12 0.14 0.13 0.19 0.15 0.12
18–34M 0.11 0.12 0.11 0.10 0.08 0.09 0.06 0.11 0.12 0.11F 0.24 0.24 0.26 0.24 0.22 0.22 0.13 0.23 0.24 0.24
M&F 0.20 0.21 0.22 0.20 0.18 0.19 0.09 0.19 0.20 0.20
35–49M 0.12 0.14 0.13 0.14 0.11 0.14 0.02 0.14 0.16 0.14F 0.24 0.25 0.24 0.26 0.23 0.25 0.05 0.25 0.26 0.23
M&F 0.20 0.22 0.21 0.23 0.20 0.22 0.04 0.21 0.23 0.21

2017 HEDIS/CAHPS REPORT
APPENDIX A | Utilization Measure Medicaid Results and Benchmarks
page A-20TennCare 17.EQRO.06.017
Table A. HEDIS 2017 Medicaid Plan-Specific Rates with HEDIS 2016 National Benchmarks: Utilization MeasuresMeasure by Age Sex AGE AGM AGW BCE BCM BCW TCS UHCE UHCM UHCW
2016 National Medicaid Means and PercentilesMean P10 P25 P50 P75 P90
50–64M 0.14 0.17 0.13 0.13 0.13 0.12 0.03 0.17 0.19 0.13F 0.25 0.31 0.23 0.25 0.22 0.22 0.05 0.30 0.31 0.26
M&F 0.20 0.25 0.18 0.20 0.18 0.18 0.04 0.24 0.26 0.20
65–74M 0.24 0.24 0.10 0.02 0.02 0.06 0.10 0.25 0.15 0.15F 0.52 0.41 0.29 0.04 0.04 0.05 0.00 0.31 0.28 0.22
M&F 0.40 0.34 0.22 0.03 0.03 0.05 0.04 0.29 0.24 0.20
75–84M 0.21 0.25 0.15 0.00 0.16 0.00 0.00 0.16 0.15 0.06F 0.17 0.34 0.18 0.01 0.08 0.02 0.00 0.18 0.13 0.10
M&F 0.18 0.31 0.18 0.01 0.10 0.02 0.00 0.17 0.14 0.09
85M 0.00 0.14 0.00 0.08 0.07 0.00 0.11 0.09 0.06F 0.04 0.26 0.11 0.02 0.00 0.03 0.05 0.06 0.02
M&F 0.03 0.24 0.08 0.03 0.01 0.02 0.06 0.06 0.03
UnknownMF
M&F
TotalM 0.16 0.13 0.10 0.19 0.11 0.13 0.12 0.17 0.13 0.12 0.14 0.08 0.11 0.13 0.15 0.19F 0.21 0.20 0.18 0.24 0.17 0.19 0.15 0.22 0.20 0.18 0.20 0.12 0.15 0.18 0.22 0.27
M&F 0.19 0.17 0.15 0.22 0.15 0.17 0.13 0.20 0.17 0.15 0.17 0.11 0.13 0.16 0.19 0.23Average Scripts PMPY for Amoxicillin/Clavulanates
0–9M 0.13 0.10 0.08 0.17 0.11 0.13 0.16 0.14 0.13 0.11F 0.12 0.10 0.08 0.16 0.11 0.13 0.15 0.13 0.12 0.10
M&F 0.13 0.10 0.08 0.17 0.11 0.13 0.16 0.14 0.13 0.10
10–17M 0.09 0.07 0.06 0.11 0.07 0.07 0.08 0.09 0.07 0.06F 0.09 0.08 0.06 0.12 0.07 0.08 0.10 0.10 0.09 0.06
M&F 0.09 0.07 0.06 0.12 0.07 0.08 0.09 0.10 0.08 0.06
18–34M 0.08 0.07 0.06 0.08 0.07 0.07 0.05 0.07 0.07 0.06F 0.12 0.12 0.11 0.14 0.12 0.13 0.06 0.12 0.12 0.12
M&F 0.11 0.11 0.10 0.13 0.10 0.11 0.05 0.11 0.11 0.10
35–49M 0.10 0.10 0.11 0.12 0.09 0.11 0.04 0.11 0.10 0.11F 0.15 0.15 0.15 0.17 0.14 0.16 0.02 0.15 0.15 0.15
M&F 0.13 0.13 0.14 0.15 0.13 0.15 0.03 0.14 0.13 0.14
50–64M 0.10 0.11 0.09 0.12 0.09 0.11 0.04 0.11 0.11 0.10F 0.15 0.18 0.15 0.16 0.14 0.16 0.04 0.17 0.17 0.15
M&F 0.13 0.15 0.12 0.14 0.12 0.14 0.04 0.14 0.15 0.13

2017 HEDIS/CAHPS REPORT
APPENDIX A | Utilization Measure Medicaid Results and Benchmarks
page A-21TennCare 17.EQRO.06.017
Table A. HEDIS 2017 Medicaid Plan-Specific Rates with HEDIS 2016 National Benchmarks: Utilization MeasuresMeasure by Age Sex AGE AGM AGW BCE BCM BCW TCS UHCE UHCM UHCW
2016 National Medicaid Means and PercentilesMean P10 P25 P50 P75 P90
65–74M 0.17 0.13 0.08 0.03 0.04 0.04 0.10 0.13 0.10 0.12F 0.15 0.21 0.10 0.02 0.03 0.06 0.08 0.18 0.12 0.14
M&F 0.16 0.18 0.10 0.02 0.03 0.05 0.09 0.16 0.11 0.13
75–84M 0.03 0.13 0.18 0.00 0.00 0.00 0.00 0.10 0.09 0.06F 0.08 0.16 0.07 0.00 0.02 0.00 0.00 0.10 0.06 0.05
M&F 0.07 0.15 0.11 0.00 0.02 0.00 0.00 0.10 0.07 0.05
85M 0.12 0.07 0.31 0.00 0.00 0.00 0.05 0.05 0.04F 0.04 0.10 0.05 0.00 0.05 0.00 0.04 0.03 0.04
M&F 0.05 0.09 0.11 0.00 0.04 0.00 0.04 0.04 0.04
UnknownMF
M&F
TotalM 0.10 0.09 0.08 0.13 0.09 0.10 0.10 0.11 0.10 0.09 0.08 0.05 0.06 0.08 0.10 0.12F 0.12 0.12 0.10 0.15 0.11 0.13 0.10 0.13 0.12 0.11 0.10 0.06 0.08 0.09 0.11 0.14
M&F 0.11 0.11 0.09 0.14 0.10 0.12 0.10 0.12 0.11 0.10 0.09 0.06 0.07 0.09 0.10 0.13Average Scripts PMPY for Ketolides
0–9M 0.00 0.00 0.00 0.00 0.00 0.00 0.00 0.00 0.00 0.00F 0.00 0.00 0.00 0.00 0.00 0.00 0.00 0.00 0.00 0.00
M&F 0.00 0.00 0.00 0.00 0.00 0.00 0.00 0.00 0.00 0.00
10–17M 0.00 0.00 0.00 0.00 0.00 0.00 0.00 0.00 0.00 0.00F 0.00 0.00 0.00 0.00 0.00 0.00 0.00 0.00 0.00 0.00
M&F 0.00 0.00 0.00 0.00 0.00 0.00 0.00 0.00 0.00 0.00
18–34M 0.00 0.00 0.00 0.00 0.00 0.00 0.00 0.00 0.00 0.00F 0.00 0.00 0.00 0.00 0.00 0.00 0.00 0.00 0.00 0.00
M&F 0.00 0.00 0.00 0.00 0.00 0.00 0.00 0.00 0.00 0.00
35–49M 0.00 0.00 0.00 0.00 0.00 0.00 0.00 0.00 0.00 0.00F 0.00 0.00 0.00 0.00 0.00 0.00 0.00 0.00 0.00 0.00
M&F 0.00 0.00 0.00 0.00 0.00 0.00 0.00 0.00 0.00 0.00
50–64M 0.00 0.00 0.00 0.00 0.00 0.00 0.00 0.00 0.00 0.00F 0.00 0.00 0.00 0.00 0.00 0.00 0.00 0.00 0.00 0.00
M&F 0.00 0.00 0.00 0.00 0.00 0.00 0.00 0.00 0.00 0.00
65–74M 0.00 0.00 0.00 0.00 0.00 0.00 0.00 0.00 0.00 0.00F 0.00 0.00 0.00 0.00 0.00 0.00 0.00 0.00 0.00 0.00
M&F 0.00 0.00 0.00 0.00 0.00 0.00 0.00 0.00 0.00 0.00
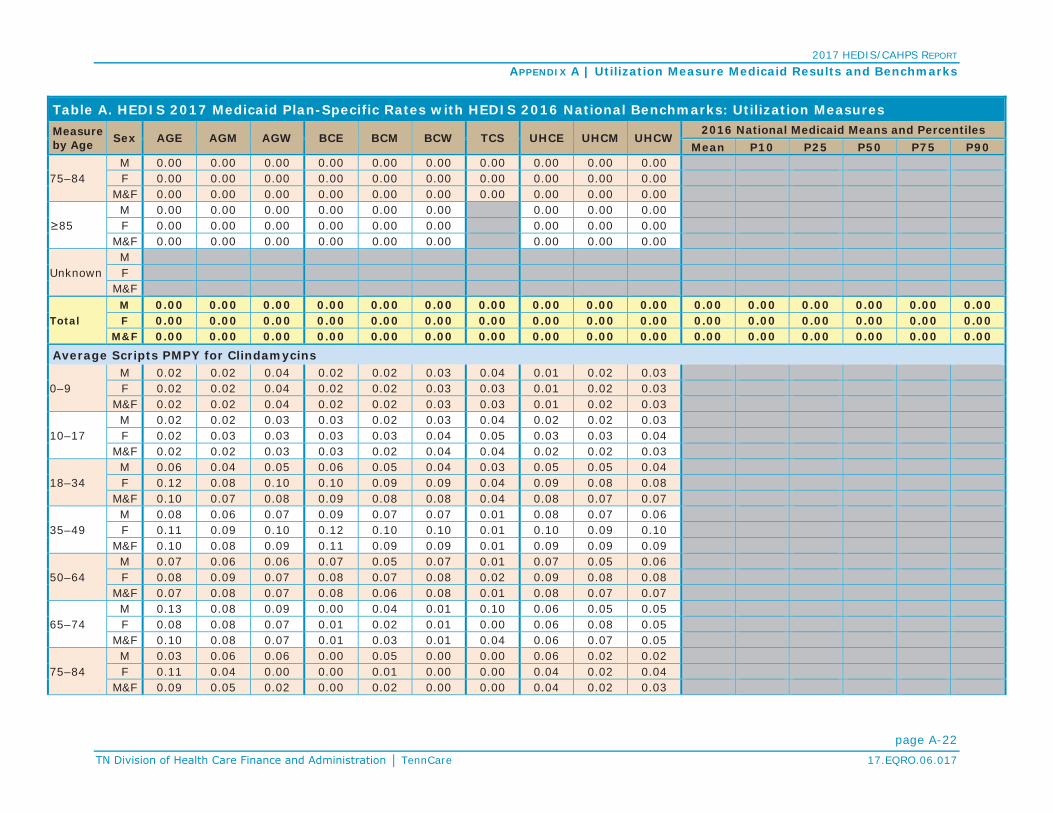
2017 HEDIS/CAHPS REPORT
APPENDIX A | Utilization Measure Medicaid Results and Benchmarks
page A-22TennCare 17.EQRO.06.017
Table A. HEDIS 2017 Medicaid Plan-Specific Rates with HEDIS 2016 National Benchmarks: Utilization MeasuresMeasure by Age Sex AGE AGM AGW BCE BCM BCW TCS UHCE UHCM UHCW
2016 National Medicaid Means and PercentilesMean P10 P25 P50 P75 P90
75–84M 0.00 0.00 0.00 0.00 0.00 0.00 0.00 0.00 0.00 0.00F 0.00 0.00 0.00 0.00 0.00 0.00 0.00 0.00 0.00 0.00
M&F 0.00 0.00 0.00 0.00 0.00 0.00 0.00 0.00 0.00 0.00
85M 0.00 0.00 0.00 0.00 0.00 0.00 0.00 0.00 0.00F 0.00 0.00 0.00 0.00 0.00 0.00 0.00 0.00 0.00
M&F 0.00 0.00 0.00 0.00 0.00 0.00 0.00 0.00 0.00
UnknownMF
M&F
TotalM 0.00 0.00 0.00 0.00 0.00 0.00 0.00 0.00 0.00 0.00 0.00 0.00 0.00 0.00 0.00 0.00F 0.00 0.00 0.00 0.00 0.00 0.00 0.00 0.00 0.00 0.00 0.00 0.00 0.00 0.00 0.00 0.00
M&F 0.00 0.00 0.00 0.00 0.00 0.00 0.00 0.00 0.00 0.00 0.00 0.00 0.00 0.00 0.00 0.00Average Scripts PMPY for Clindamycins
0–9M 0.02 0.02 0.04 0.02 0.02 0.03 0.04 0.01 0.02 0.03F 0.02 0.02 0.04 0.02 0.02 0.03 0.03 0.01 0.02 0.03
M&F 0.02 0.02 0.04 0.02 0.02 0.03 0.03 0.01 0.02 0.03
10–17M 0.02 0.02 0.03 0.03 0.02 0.03 0.04 0.02 0.02 0.03F 0.02 0.03 0.03 0.03 0.03 0.04 0.05 0.03 0.03 0.04
M&F 0.02 0.02 0.03 0.03 0.02 0.04 0.04 0.02 0.02 0.03
18–34M 0.06 0.04 0.05 0.06 0.05 0.04 0.03 0.05 0.05 0.04F 0.12 0.08 0.10 0.10 0.09 0.09 0.04 0.09 0.08 0.08
M&F 0.10 0.07 0.08 0.09 0.08 0.08 0.04 0.08 0.07 0.07
35–49M 0.08 0.06 0.07 0.09 0.07 0.07 0.01 0.08 0.07 0.06F 0.11 0.09 0.10 0.12 0.10 0.10 0.01 0.10 0.09 0.10
M&F 0.10 0.08 0.09 0.11 0.09 0.09 0.01 0.09 0.09 0.09
50–64M 0.07 0.06 0.06 0.07 0.05 0.07 0.01 0.07 0.05 0.06F 0.08 0.09 0.07 0.08 0.07 0.08 0.02 0.09 0.08 0.08
M&F 0.07 0.08 0.07 0.08 0.06 0.08 0.01 0.08 0.07 0.07
65–74M 0.13 0.08 0.09 0.00 0.04 0.01 0.10 0.06 0.05 0.05F 0.08 0.08 0.07 0.01 0.02 0.01 0.00 0.06 0.08 0.05
M&F 0.10 0.08 0.07 0.01 0.03 0.01 0.04 0.06 0.07 0.05
75–84M 0.03 0.06 0.06 0.00 0.05 0.00 0.00 0.06 0.02 0.02F 0.11 0.04 0.00 0.00 0.01 0.00 0.00 0.04 0.02 0.04
M&F 0.09 0.05 0.02 0.00 0.02 0.00 0.00 0.04 0.02 0.03

2017 HEDIS/CAHPS REPORT
APPENDIX A | Utilization Measure Medicaid Results and Benchmarks
page A-23TennCare 17.EQRO.06.017
Table A. HEDIS 2017 Medicaid Plan-Specific Rates with HEDIS 2016 National Benchmarks: Utilization MeasuresMeasure by Age Sex AGE AGM AGW BCE BCM BCW TCS UHCE UHCM UHCW
2016 National Medicaid Means and PercentilesMean P10 P25 P50 P75 P90
85M 0.00 0.00 0.00 0.00 0.13 0.00 0.02 0.02 0.00F 0.00 0.03 0.08 0.00 0.00 0.03 0.02 0.01 0.01
M&F 0.00 0.03 0.06 0.00 0.03 0.02 0.02 0.02 0.01
UnknownMF
M&F
TotalM 0.04 0.03 0.04 0.04 0.03 0.04 0.04 0.04 0.03 0.04 0.03 0.02 0.02 0.03 0.04 0.05F 0.07 0.05 0.07 0.07 0.06 0.07 0.04 0.06 0.05 0.06 0.05 0.03 0.04 0.05 0.06 0.07
M&F 0.06 0.04 0.06 0.05 0.05 0.05 0.04 0.05 0.04 0.05 0.04 0.02 0.03 0.04 0.05 0.06Average Scripts PMPY for Misc. Antibiotics of Concern
0–9M 0.00 0.00 0.00 0.00 0.00 0.00 0.00 0.00 0.00 0.00F 0.00 0.00 0.00 0.00 0.00 0.00 0.00 0.00 0.00 0.00
M&F 0.00 0.00 0.00 0.00 0.00 0.00 0.00 0.00 0.00 0.00
10–17M 0.00 0.00 0.00 0.00 0.00 0.00 0.00 0.00 0.00 0.00F 0.00 0.00 0.00 0.00 0.00 0.00 0.00 0.00 0.00 0.00
M&F 0.00 0.00 0.00 0.00 0.00 0.00 0.00 0.00 0.00 0.00
18–34M 0.00 0.00 0.00 0.00 0.00 0.00 0.00 0.00 0.00 0.00F 0.00 0.00 0.00 0.00 0.00 0.00 0.00 0.00 0.00 0.00
M&F 0.00 0.00 0.00 0.00 0.00 0.00 0.00 0.00 0.00 0.00
35–49M 0.01 0.00 0.00 0.00 0.00 0.00 0.00 0.00 0.00 0.01F 0.00 0.00 0.00 0.00 0.00 0.00 0.00 0.00 0.00 0.00
M&F 0.00 0.00 0.00 0.00 0.00 0.00 0.00 0.00 0.00 0.00
50–64M 0.02 0.02 0.01 0.00 0.01 0.00 0.00 0.01 0.01 0.01F 0.01 0.02 0.00 0.01 0.00 0.00 0.00 0.00 0.01 0.01
M&F 0.01 0.02 0.00 0.01 0.01 0.00 0.00 0.01 0.01 0.01
65–74M 0.01 0.05 0.00 0.00 0.02 0.00 0.00 0.03 0.04 0.02F 0.00 0.00 0.00 0.00 0.00 0.01 0.00 0.01 0.00 0.01
M&F 0.01 0.02 0.00 0.00 0.01 0.00 0.00 0.02 0.02 0.01
75–84M 0.18 0.00 0.00 0.00 0.03 0.00 0.00 0.01 0.01 0.01F 0.00 0.02 0.00 0.00 0.00 0.00 0.00 0.03 0.00 0.00
M&F 0.06 0.02 0.00 0.00 0.01 0.00 0.00 0.02 0.00 0.00
85M 0.00 0.00 0.00 0.00 0.00 0.00 0.00 0.00 0.00F 0.06 0.03 0.00 0.06 0.00 0.00 0.02 0.00 0.00
M&F 0.05 0.03 0.00 0.05 0.00 0.00 0.01 0.00 0.00

2017 HEDIS/CAHPS REPORT
APPENDIX A | Utilization Measure Medicaid Results and Benchmarks
page A-24TennCare 17.EQRO.06.017
Table A. HEDIS 2017 Medicaid Plan-Specific Rates with HEDIS 2016 National Benchmarks: Utilization MeasuresMeasure by Age Sex AGE AGM AGW BCE BCM BCW TCS UHCE UHCM UHCW
2016 National Medicaid Means and PercentilesMean P10 P25 P50 P75 P90
UnknownMF
M&F
TotalM 0.00 0.00 0.00 0.00 0.00 0.00 0.00 0.00 0.00 0.00 0.00 0.00 0.00 0.00 0.00 0.01F 0.00 0.00 0.00 0.00 0.00 0.00 0.00 0.00 0.00 0.00 0.00 0.00 0.00 0.00 0.00 0.00
M&F 0.00 0.00 0.00 0.00 0.00 0.00 0.00 0.00 0.00 0.00 0.00 0.00 0.00 0.00 0.00 0.00
All Other Antibiotics Utilization
Average Scripts PMPY for Absorbable Sulfonamides
0–9M 0.04 0.03 0.04 0.06 0.04 0.05 0.10 0.04 0.03 0.04F 0.08 0.06 0.06 0.09 0.06 0.08 0.13 0.07 0.06 0.07
M&F 0.06 0.04 0.05 0.07 0.05 0.07 0.12 0.06 0.05 0.06
10–17M 0.04 0.03 0.03 0.06 0.04 0.04 0.07 0.04 0.04 0.03F 0.08 0.08 0.06 0.11 0.07 0.07 0.14 0.09 0.08 0.06
M&F 0.06 0.05 0.05 0.08 0.05 0.06 0.09 0.07 0.06 0.05
18–34M 0.08 0.07 0.06 0.07 0.06 0.05 0.05 0.07 0.07 0.05F 0.16 0.14 0.13 0.15 0.15 0.13 0.10 0.13 0.14 0.12
M&F 0.13 0.12 0.11 0.13 0.13 0.11 0.07 0.11 0.12 0.10
35–49M 0.11 0.12 0.10 0.11 0.10 0.10 0.02 0.11 0.11 0.09F 0.16 0.15 0.14 0.16 0.16 0.14 0.04 0.15 0.16 0.14
M&F 0.14 0.14 0.13 0.14 0.14 0.13 0.03 0.13 0.14 0.13
50–64M 0.12 0.16 0.12 0.13 0.12 0.09 0.06 0.13 0.16 0.10F 0.14 0.19 0.13 0.14 0.15 0.13 0.07 0.16 0.18 0.13
M&F 0.13 0.18 0.12 0.13 0.14 0.11 0.07 0.15 0.17 0.12
65–74M 0.14 0.21 0.09 0.02 0.04 0.02 0.29 0.15 0.11 0.08F 0.22 0.30 0.15 0.02 0.03 0.03 0.16 0.19 0.16 0.14
M&F 0.19 0.26 0.13 0.02 0.03 0.02 0.22 0.17 0.14 0.12
75–84M 0.15 0.18 0.12 0.00 0.00 0.00 0.00 0.10 0.07 0.05F 0.22 0.22 0.21 0.00 0.07 0.01 0.00 0.13 0.10 0.06
M&F 0.20 0.21 0.18 0.00 0.05 0.01 0.00 0.12 0.09 0.05
85M 0.12 0.07 0.10 0.23 0.00 0.00 0.03 0.04 0.04F 0.18 0.23 0.11 0.05 0.02 0.00 0.08 0.04 0.03
M&F 0.17 0.20 0.11 0.08 0.01 0.00 0.07 0.04 0.03

2017 HEDIS/CAHPS REPORT
APPENDIX A | Utilization Measure Medicaid Results and Benchmarks
page A-25TennCare 17.EQRO.06.017
Table A. HEDIS 2017 Medicaid Plan-Specific Rates with HEDIS 2016 National Benchmarks: Utilization MeasuresMeasure by Age Sex AGE AGM AGW BCE BCM BCW TCS UHCE UHCM UHCW
2016 National Medicaid Means and PercentilesMean P10 P25 P50 P75 P90
UnknownMF
M&F
TotalM 0.06 0.06 0.05 0.07 0.05 0.05 0.07 0.06 0.06 0.05 0.07 0.03 0.04 0.05 0.06 0.09F 0.12 0.11 0.10 0.13 0.11 0.11 0.12 0.12 0.11 0.10 0.11 0.06 0.07 0.09 0.12 0.15
M&F 0.10 0.09 0.08 0.10 0.09 0.09 0.09 0.09 0.09 0.08 0.09 0.05 0.06 0.07 0.09 0.12Average Scripts PMPY for Aminoglycosides
0–9M 0.00 0.00 0.00 0.00 0.00 0.00 0.01 0.00 0.00 0.00F 0.00 0.00 0.00 0.00 0.00 0.00 0.01 0.00 0.00 0.00
M&F 0.00 0.00 0.00 0.00 0.00 0.00 0.01 0.00 0.00 0.00
10–17M 0.00 0.00 0.00 0.00 0.00 0.00 0.00 0.00 0.00 0.00F 0.00 0.00 0.00 0.00 0.00 0.00 0.01 0.00 0.00 0.00
M&F 0.00 0.00 0.00 0.00 0.00 0.00 0.01 0.00 0.00 0.00
18–34M 0.00 0.00 0.00 0.00 0.00 0.00 0.00 0.00 0.00 0.00F 0.00 0.00 0.00 0.00 0.00 0.00 0.00 0.00 0.00 0.00
M&F 0.00 0.00 0.00 0.00 0.00 0.00 0.00 0.00 0.00 0.00
35–49M 0.00 0.00 0.00 0.00 0.00 0.00 0.00 0.00 0.00 0.00F 0.00 0.00 0.00 0.00 0.00 0.00 0.00 0.00 0.00 0.00
M&F 0.00 0.00 0.00 0.00 0.00 0.00 0.00 0.00 0.00 0.00
50–64M 0.00 0.00 0.00 0.00 0.00 0.00 0.00 0.02 0.00 0.00F 0.00 0.00 0.00 0.00 0.00 0.00 0.00 0.00 0.00 0.00
M&F 0.00 0.00 0.00 0.00 0.00 0.00 0.00 0.01 0.00 0.00
65–74M 0.00 0.00 0.00 0.00 0.00 0.00 0.00 0.01 0.00 0.00F 0.04 0.01 0.02 0.00 0.00 0.00 0.00 0.00 0.00 0.01
M&F 0.02 0.01 0.01 0.00 0.00 0.00 0.00 0.00 0.00 0.00
75–84M 0.00 0.00 0.00 0.00 0.00 0.00 0.00 0.01 0.00 0.01F 0.00 0.01 0.00 0.00 0.00 0.00 0.00 0.00 0.00 0.00
M&F 0.00 0.00 0.00 0.00 0.00 0.00 0.00 0.00 0.00 0.00
85M 0.00 0.00 0.00 0.00 0.00 0.00 0.00 0.00 0.00F 0.00 0.03 0.00 0.00 0.00 0.00 0.00 0.01 0.00
M&F 0.00 0.02 0.00 0.00 0.00 0.00 0.00 0.01 0.00
UnknownMF
M&F

2017 HEDIS/CAHPS REPORT
APPENDIX A | Utilization Measure Medicaid Results and Benchmarks
page A-26TennCare 17.EQRO.06.017
Table A. HEDIS 2017 Medicaid Plan-Specific Rates with HEDIS 2016 National Benchmarks: Utilization MeasuresMeasure by Age Sex AGE AGM AGW BCE BCM BCW TCS UHCE UHCM UHCW
2016 National Medicaid Means and PercentilesMean P10 P25 P50 P75 P90
TotalM 0.00 0.00 0.00 0.00 0.00 0.00 0.00 0.00 0.00 0.00 0.00 0.00 0.00 0.00 0.00 0.00F 0.00 0.00 0.00 0.00 0.00 0.00 0.01 0.00 0.00 0.00 0.00 0.00 0.00 0.00 0.00 0.00
M&F 0.00 0.00 0.00 0.00 0.00 0.00 0.00 0.00 0.00 0.00 0.00 0.00 0.00 0.00 0.00 0.00Average Scripts PMPY for 1st Generation Cephalosporins
0–9M 0.04 0.06 0.03 0.06 0.06 0.05 0.06 0.05 0.07 0.04F 0.06 0.07 0.04 0.07 0.08 0.06 0.07 0.06 0.07 0.04
M&F 0.05 0.07 0.04 0.06 0.07 0.05 0.06 0.05 0.07 0.04
10–17M 0.05 0.06 0.04 0.06 0.06 0.05 0.06 0.05 0.06 0.04F 0.06 0.07 0.04 0.08 0.07 0.06 0.07 0.06 0.07 0.05
M&F 0.06 0.06 0.04 0.07 0.06 0.05 0.06 0.05 0.07 0.04
18–34M 0.05 0.06 0.05 0.06 0.06 0.05 0.04 0.05 0.06 0.05F 0.11 0.12 0.10 0.12 0.12 0.11 0.06 0.10 0.11 0.09
M&F 0.09 0.10 0.08 0.10 0.10 0.10 0.05 0.08 0.10 0.08
35–49M 0.07 0.09 0.07 0.08 0.08 0.07 0.02 0.07 0.08 0.08F 0.09 0.12 0.09 0.11 0.12 0.10 0.02 0.10 0.11 0.09
M&F 0.09 0.11 0.09 0.10 0.11 0.10 0.02 0.09 0.11 0.09
50–64M 0.09 0.12 0.09 0.08 0.09 0.09 0.04 0.10 0.11 0.10F 0.10 0.15 0.10 0.12 0.12 0.12 0.04 0.13 0.13 0.13
M&F 0.09 0.14 0.09 0.10 0.11 0.10 0.04 0.12 0.12 0.11
65–74M 0.17 0.21 0.10 0.01 0.05 0.02 0.10 0.11 0.09 0.10F 0.08 0.32 0.10 0.02 0.03 0.08 0.00 0.17 0.15 0.14
M&F 0.12 0.28 0.10 0.01 0.04 0.06 0.04 0.15 0.13 0.13
75–84M 0.18 0.21 0.28 0.00 0.00 0.00 0.00 0.08 0.11 0.09F 0.21 0.21 0.20 0.04 0.00 0.01 0.00 0.11 0.09 0.06
M&F 0.20 0.21 0.22 0.03 0.00 0.01 0.00 0.10 0.09 0.07M 0.00 0.21 0.00 0.00 0.72 0.42 0.09 0.03 0.03F 0.14 0.24 0.00 0.08 0.00 0.03 0.08 0.05 0.06
M&F 0.12 0.24 0.00 0.07 0.15 0.09 0.09 0.05 0.06
UnknownMF
M&F
TotalM 0.05 0.07 0.04 0.06 0.06 0.05 0.05 0.06 0.07 0.05 0.06 0.04 0.04 0.06 0.07 0.09F 0.08 0.10 0.07 0.10 0.10 0.08 0.06 0.09 0.09 0.07 0.09 0.05 0.06 0.08 0.10 0.13
M&F 0.07 0.09 0.06 0.08 0.08 0.07 0.06 0.07 0.08 0.06 0.07 0.04 0.05 0.07 0.08 0.11

2017 HEDIS/CAHPS REPORT
APPENDIX A | Utilization Measure Medicaid Results and Benchmarks
page A-27TennCare 17.EQRO.06.017
Table A. HEDIS 2017 Medicaid Plan-Specific Rates with HEDIS 2016 National Benchmarks: Utilization MeasuresMeasure by Age Sex AGE AGM AGW BCE BCM BCW TCS UHCE UHCM UHCW
2016 National Medicaid Means and PercentilesMean P10 P25 P50 P75 P90
Average Scripts PMPY for Lincosamides
0–9M 0.00 0.00 0.00 0.00 0.00 0.00 0.00 0.00 0.00 0.00F 0.00 0.00 0.00 0.00 0.00 0.00 0.00 0.00 0.00 0.00
M&F 0.00 0.00 0.00 0.00 0.00 0.00 0.00 0.00 0.00 0.00
10–17M 0.00 0.00 0.00 0.00 0.00 0.00 0.00 0.00 0.00 0.00F 0.00 0.00 0.00 0.00 0.00 0.00 0.00 0.00 0.00 0.00
M&F 0.00 0.00 0.00 0.00 0.00 0.00 0.00 0.00 0.00 0.00
18–34M 0.00 0.00 0.00 0.00 0.00 0.00 0.00 0.00 0.00 0.00F 0.00 0.00 0.00 0.00 0.00 0.00 0.00 0.00 0.00 0.00
M&F 0.00 0.00 0.00 0.00 0.00 0.00 0.00 0.00 0.00 0.00
35–49M 0.00 0.00 0.00 0.00 0.00 0.00 0.00 0.00 0.00 0.00F 0.00 0.00 0.00 0.00 0.00 0.00 0.00 0.00 0.00 0.00
M&F 0.00 0.00 0.00 0.00 0.00 0.00 0.00 0.00 0.00 0.00
50–64M 0.00 0.00 0.00 0.00 0.00 0.00 0.00 0.00 0.00 0.00F 0.00 0.00 0.00 0.00 0.00 0.00 0.00 0.00 0.00 0.00
M&F 0.00 0.00 0.00 0.00 0.00 0.00 0.00 0.00 0.00 0.00
65–74M 0.00 0.00 0.00 0.00 0.00 0.00 0.00 0.00 0.00 0.00F 0.00 0.00 0.00 0.00 0.00 0.00 0.00 0.00 0.00 0.00
M&F 0.00 0.00 0.00 0.00 0.00 0.00 0.00 0.00 0.00 0.00
75–84M 0.00 0.00 0.00 0.00 0.00 0.00 0.00 0.00 0.00 0.00F 0.00 0.00 0.00 0.00 0.00 0.00 0.00 0.00 0.00 0.00
M&F 0.00 0.00 0.00 0.00 0.00 0.00 0.00 0.00 0.00 0.00
85M 0.00 0.00 0.00 0.00 0.00 0.00 0.00 0.00 0.00F 0.00 0.00 0.00 0.00 0.00 0.00 0.00 0.00 0.00
M&F 0.00 0.00 0.00 0.00 0.00 0.00 0.00 0.00 0.00
UnknownMF
M&F
TotalM 0.00 0.00 0.00 0.00 0.00 0.00 0.00 0.00 0.00 0.00 0.00 0.00 0.00 0.00 0.00 0.00F 0.00 0.00 0.00 0.00 0.00 0.00 0.00 0.00 0.00 0.00 0.00 0.00 0.00 0.00 0.00 0.00
M&F 0.00 0.00 0.00 0.00 0.00 0.00 0.00 0.00 0.00 0.00 0.00 0.00 0.00 0.00 0.00 0.00Average Scripts PMPY for Macrolides (not azith. or clarith.)
0–9M 0.00 0.00 0.00 0.00 0.00 0.00 0.02 0.00 0.00 0.00F 0.00 0.00 0.00 0.00 0.00 0.00 0.03 0.00 0.00 0.00
M&F 0.00 0.00 0.00 0.00 0.00 0.00 0.02 0.00 0.00 0.00

2017 HEDIS/CAHPS REPORT
APPENDIX A | Utilization Measure Medicaid Results and Benchmarks
page A-28TennCare 17.EQRO.06.017
Table A. HEDIS 2017 Medicaid Plan-Specific Rates with HEDIS 2016 National Benchmarks: Utilization MeasuresMeasure by Age Sex AGE AGM AGW BCE BCM BCW TCS UHCE UHCM UHCW
2016 National Medicaid Means and PercentilesMean P10 P25 P50 P75 P90
10–17M 0.00 0.00 0.00 0.00 0.00 0.00 0.00 0.00 0.00 0.00F 0.00 0.00 0.00 0.00 0.00 0.00 0.00 0.00 0.00 0.00
M&F 0.00 0.00 0.00 0.00 0.00 0.00 0.00 0.00 0.00 0.00
18–34M 0.00 0.00 0.00 0.00 0.00 0.00 0.00 0.00 0.00 0.00F 0.00 0.00 0.00 0.00 0.00 0.00 0.00 0.00 0.00 0.00
M&F 0.00 0.00 0.00 0.00 0.00 0.00 0.00 0.00 0.00 0.00
35–49M 0.00 0.00 0.00 0.00 0.00 0.00 0.00 0.00 0.00 0.00F 0.00 0.00 0.00 0.00 0.00 0.00 0.00 0.00 0.00 0.00
M&F 0.00 0.00 0.00 0.00 0.00 0.00 0.00 0.00 0.00 0.00
50–64M 0.00 0.00 0.00 0.00 0.00 0.00 0.00 0.00 0.00 0.00F 0.00 0.00 0.00 0.00 0.00 0.00 0.00 0.00 0.00 0.00
M&F 0.00 0.00 0.00 0.00 0.00 0.00 0.00 0.00 0.00 0.00
65–74M 0.00 0.01 0.00 0.00 0.00 0.00 0.00 0.00 0.00 0.00F 0.00 0.01 0.00 0.00 0.00 0.00 0.00 0.01 0.00 0.00
M&F 0.00 0.01 0.00 0.00 0.00 0.00 0.00 0.00 0.00 0.00
75–84M 0.00 0.00 0.00 0.00 0.00 0.00 0.00 0.08 0.00 0.00F 0.00 0.01 0.00 0.00 0.00 0.00 0.00 0.00 0.00 0.00
M&F 0.00 0.00 0.00 0.00 0.00 0.00 0.00 0.02 0.00 0.00
85M 0.00 0.00 0.00 0.00 0.00 0.00 0.00 0.00 0.00F 0.00 0.02 0.00 0.00 0.00 0.00 0.00 0.00 0.00
M&F 0.00 0.01 0.00 0.00 0.00 0.00 0.00 0.00 0.00
UnknownMF
M&F
TotalM 0.00 0.00 0.00 0.00 0.00 0.00 0.01 0.00 0.00 0.00 0.00 0.00 0.00 0.00 0.00 0.00F 0.00 0.00 0.00 0.00 0.00 0.00 0.01 0.00 0.00 0.00 0.00 0.00 0.00 0.00 0.00 0.01
M&F 0.00 0.00 0.00 0.00 0.00 0.00 0.01 0.00 0.00 0.00 0.00 0.00 0.00 0.00 0.00 0.00Average Scripts PMPY for Penicillins
0–9M 0.48 0.47 0.35 0.60 0.49 0.43 0.47 0.47 0.52 0.40F 0.49 0.47 0.35 0.62 0.50 0.44 0.51 0.48 0.52 0.39
M&F 0.48 0.47 0.35 0.61 0.50 0.43 0.49 0.47 0.52 0.40
10–17M 0.21 0.19 0.14 0.26 0.19 0.17 0.21 0.19 0.20 0.15F 0.27 0.24 0.18 0.31 0.23 0.21 0.27 0.24 0.25 0.18
M&F 0.24 0.21 0.16 0.28 0.21 0.19 0.23 0.21 0.22 0.16

2017 HEDIS/CAHPS REPORT
APPENDIX A | Utilization Measure Medicaid Results and Benchmarks
page A-29TennCare 17.EQRO.06.017
Table A. HEDIS 2017 Medicaid Plan-Specific Rates with HEDIS 2016 National Benchmarks: Utilization MeasuresMeasure by Age Sex AGE AGM AGW BCE BCM BCW TCS UHCE UHCM UHCW
2016 National Medicaid Means and PercentilesMean P10 P25 P50 P75 P90
18–34M 0.14 0.12 0.11 0.15 0.12 0.13 0.10 0.12 0.12 0.10F 0.24 0.22 0.22 0.27 0.24 0.26 0.14 0.21 0.22 0.20
M&F 0.20 0.20 0.19 0.24 0.21 0.23 0.12 0.18 0.19 0.17
35–49M 0.13 0.13 0.16 0.17 0.16 0.17 0.09 0.14 0.15 0.14F 0.19 0.20 0.20 0.23 0.21 0.26 0.09 0.18 0.20 0.20
M&F 0.17 0.18 0.19 0.22 0.20 0.24 0.09 0.17 0.18 0.18
50–64M 0.10 0.15 0.13 0.18 0.19 0.19 0.07 0.13 0.14 0.16F 0.15 0.21 0.18 0.22 0.20 0.23 0.16 0.17 0.16 0.21
M&F 0.13 0.18 0.16 0.21 0.19 0.21 0.11 0.15 0.15 0.19
65–74M 0.18 0.23 0.31 0.04 0.13 0.10 0.00 0.14 0.13 0.16F 0.28 0.29 0.26 0.04 0.05 0.03 0.08 0.18 0.14 0.18
M&F 0.24 0.27 0.28 0.04 0.08 0.05 0.04 0.16 0.13 0.17
75–84M 0.12 0.08 0.09 0.00 0.00 0.00 0.00 0.12 0.03 0.03F 0.08 0.18 0.16 0.01 0.04 0.01 0.00 0.12 0.08 0.08
M&F 0.10 0.15 0.14 0.01 0.03 0.01 0.00 0.12 0.07 0.07
85M 0.12 0.21 0.10 0.00 0.00 0.00 0.06 0.02 0.01F 0.04 0.09 0.19 0.06 0.05 0.05 0.05 0.03 0.02
M&F 0.05 0.11 0.17 0.05 0.04 0.05 0.05 0.03 0.02
UnknownMF
M&F
TotalM 0.27 0.29 0.23 0.38 0.30 0.28 0.27 0.27 0.32 0.25 0.28 0.17 0.22 0.26 0.33 0.39F 0.30 0.30 0.25 0.37 0.31 0.30 0.31 0.27 0.31 0.25 0.30 0.20 0.25 0.29 0.35 0.41
M&F 0.29 0.30 0.24 0.37 0.30 0.29 0.28 0.27 0.31 0.25 0.29 0.19 0.24 0.28 0.34 0.40Average Scripts PMPY for Tetracyclines
0–9M 0.00 0.00 0.00 0.00 0.00 0.00 0.00 0.00 0.00 0.00F 0.00 0.00 0.00 0.00 0.00 0.00 0.00 0.00 0.00 0.00
M&F 0.00 0.00 0.00 0.00 0.00 0.00 0.00 0.00 0.00 0.00
10–17M 0.03 0.04 0.03 0.06 0.02 0.04 0.06 0.05 0.04 0.04F 0.04 0.04 0.03 0.07 0.03 0.05 0.05 0.05 0.04 0.04
M&F 0.04 0.04 0.03 0.06 0.03 0.05 0.06 0.05 0.04 0.04
18–34M 0.04 0.05 0.04 0.06 0.04 0.06 0.07 0.06 0.05 0.05F 0.07 0.06 0.07 0.08 0.06 0.08 0.05 0.07 0.07 0.07
M&F 0.06 0.06 0.06 0.07 0.05 0.08 0.06 0.07 0.06 0.06
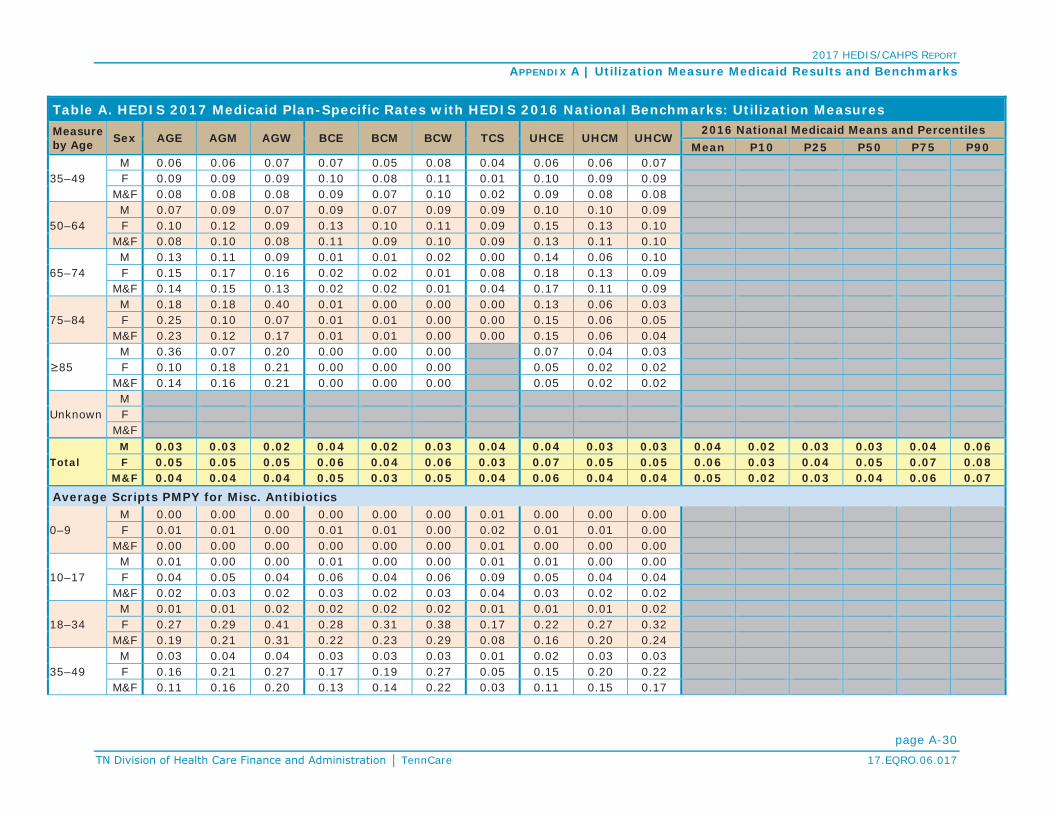
2017 HEDIS/CAHPS REPORT
APPENDIX A | Utilization Measure Medicaid Results and Benchmarks
page A-30TennCare 17.EQRO.06.017
Table A. HEDIS 2017 Medicaid Plan-Specific Rates with HEDIS 2016 National Benchmarks: Utilization MeasuresMeasure by Age Sex AGE AGM AGW BCE BCM BCW TCS UHCE UHCM UHCW
2016 National Medicaid Means and PercentilesMean P10 P25 P50 P75 P90
35–49M 0.06 0.06 0.07 0.07 0.05 0.08 0.04 0.06 0.06 0.07F 0.09 0.09 0.09 0.10 0.08 0.11 0.01 0.10 0.09 0.09
M&F 0.08 0.08 0.08 0.09 0.07 0.10 0.02 0.09 0.08 0.08
50–64M 0.07 0.09 0.07 0.09 0.07 0.09 0.09 0.10 0.10 0.09F 0.10 0.12 0.09 0.13 0.10 0.11 0.09 0.15 0.13 0.10
M&F 0.08 0.10 0.08 0.11 0.09 0.10 0.09 0.13 0.11 0.10
65–74M 0.13 0.11 0.09 0.01 0.01 0.02 0.00 0.14 0.06 0.10F 0.15 0.17 0.16 0.02 0.02 0.01 0.08 0.18 0.13 0.09
M&F 0.14 0.15 0.13 0.02 0.02 0.01 0.04 0.17 0.11 0.09
75–84M 0.18 0.18 0.40 0.01 0.00 0.00 0.00 0.13 0.06 0.03F 0.25 0.10 0.07 0.01 0.01 0.00 0.00 0.15 0.06 0.05
M&F 0.23 0.12 0.17 0.01 0.01 0.00 0.00 0.15 0.06 0.04
85M 0.36 0.07 0.20 0.00 0.00 0.00 0.07 0.04 0.03F 0.10 0.18 0.21 0.00 0.00 0.00 0.05 0.02 0.02
M&F 0.14 0.16 0.21 0.00 0.00 0.00 0.05 0.02 0.02
UnknownMF
M&F
TotalM 0.03 0.03 0.02 0.04 0.02 0.03 0.04 0.04 0.03 0.03 0.04 0.02 0.03 0.03 0.04 0.06F 0.05 0.05 0.05 0.06 0.04 0.06 0.03 0.07 0.05 0.05 0.06 0.03 0.04 0.05 0.07 0.08
M&F 0.04 0.04 0.04 0.05 0.03 0.05 0.04 0.06 0.04 0.04 0.05 0.02 0.03 0.04 0.06 0.07Average Scripts PMPY for Misc. Antibiotics
0–9M 0.00 0.00 0.00 0.00 0.00 0.00 0.01 0.00 0.00 0.00F 0.01 0.01 0.00 0.01 0.01 0.00 0.02 0.01 0.01 0.00
M&F 0.00 0.00 0.00 0.00 0.00 0.00 0.01 0.00 0.00 0.00
10–17M 0.01 0.00 0.00 0.01 0.00 0.00 0.01 0.01 0.00 0.00F 0.04 0.05 0.04 0.06 0.04 0.06 0.09 0.05 0.04 0.04
M&F 0.02 0.03 0.02 0.03 0.02 0.03 0.04 0.03 0.02 0.02
18–34M 0.01 0.01 0.02 0.02 0.02 0.02 0.01 0.01 0.01 0.02F 0.27 0.29 0.41 0.28 0.31 0.38 0.17 0.22 0.27 0.32
M&F 0.19 0.21 0.31 0.22 0.23 0.29 0.08 0.16 0.20 0.24
35–49M 0.03 0.04 0.04 0.03 0.03 0.03 0.01 0.02 0.03 0.03F 0.16 0.21 0.27 0.17 0.19 0.27 0.05 0.15 0.20 0.22
M&F 0.11 0.16 0.20 0.13 0.14 0.22 0.03 0.11 0.15 0.17

2017 HEDIS/CAHPS REPORT
APPENDIX A | Utilization Measure Medicaid Results and Benchmarks
page A-31TennCare 17.EQRO.06.017
Table A. HEDIS 2017 Medicaid Plan-Specific Rates with HEDIS 2016 National Benchmarks: Utilization MeasuresMeasure by Age Sex AGE AGM AGW BCE BCM BCW TCS UHCE UHCM UHCW
2016 National Medicaid Means and PercentilesMean P10 P25 P50 P75 P90
50–64M 0.04 0.05 0.03 0.04 0.04 0.04 0.03 0.03 0.04 0.04F 0.12 0.16 0.15 0.14 0.13 0.16 0.14 0.14 0.17 0.14
M&F 0.08 0.11 0.10 0.10 0.09 0.12 0.08 0.09 0.11 0.10
65–74M 0.03 0.03 0.05 0.00 0.08 0.02 0.00 0.08 0.05 0.04F 0.17 0.14 0.14 0.05 0.04 0.02 0.00 0.18 0.14 0.14
M&F 0.11 0.10 0.11 0.03 0.05 0.02 0.00 0.14 0.11 0.10
75–84M 0.09 0.07 0.00 0.00 0.24 0.00 0.00 0.04 0.07 0.01F 0.30 0.15 0.27 0.00 0.03 0.02 0.00 0.19 0.10 0.10
M&F 0.23 0.12 0.19 0.00 0.09 0.02 0.00 0.15 0.09 0.07
85M 0.00 0.00 0.00 0.00 0.00 0.00 0.04 0.02 0.02F 0.20 0.30 0.00 0.00 0.00 0.05 0.07 0.07 0.04
M&F 0.17 0.24 0.00 0.00 0.00 0.05 0.07 0.06 0.04
UnknownMF
M&F
TotalM 0.01 0.01 0.01 0.01 0.01 0.01 0.01 0.01 0.01 0.01 0.01 0.01 0.01 0.01 0.02 0.03F 0.13 0.14 0.20 0.14 0.14 0.18 0.09 0.11 0.13 0.14 0.13 0.08 0.09 0.12 0.15 0.19
M&F 0.08 0.08 0.12 0.09 0.09 0.11 0.04 0.07 0.08 0.09 0.08 0.05 0.06 0.07 0.09 0.11
Standardize Healthcare-Associated Infection Ratio (HAI):For HAI-1: Central line-associated blood stream infection (CLABSI); HAI-2: Catheter-associated urinary tract infection (CAUTI); HAI-5: MRSA bloodstream infection (MRSA) and HAI-6: Clostridium difficile intestinal infection (CDIFF)
Percentage of Total Discharges From High SIR HospitalsCLABSI 0.22 0.33 0.39 0.29 0.40 0.36 0.32 0.33 0.33 0.46CAUTI 0.15 0.21 0.19 0.30 0.33 0.13 0.35 0.35 0.25 0.47MRSA 0.12 0.09 0.24 0.28 0.09 0.27 0.11 0.28 0.23 0.46CDIFF 0.14 0.45 0.22 0.13 0.48 0.39 0.11 0.25 0.56 0.09Percentage of Total Discharges From Moderate SIR HospitalsCLABSI 0.01 0.17 0.01 0.00 0.16 0.01 0.02 0.01 0.15 0.00CAUTI 0.01 0.09 0.25 0.01 0.11 0.32 0.04 0.02 0.14 0.00MRSA 0.01 0.16 0.00 0.02 0.20 0.00 0.02 0.00 0.13 0.01CDIFF 0.22 0.02 0.11 0.34 0.03 0.14 0.09 0.29 0.07 0.00

2017 HEDIS/CAHPS REPORT
APPENDIX A | Utilization Measure Medicaid Results and Benchmarks
page A-32TennCare 17.EQRO.06.017
Table A. HEDIS 2017 Medicaid Plan-Specific Rates with HEDIS 2016 National Benchmarks: Utilization MeasuresMeasure by Age Sex AGE AGM AGW BCE BCM BCW TCS UHCE UHCM UHCW
2016 National Medicaid Means and PercentilesMean P10 P25 P50 P75 P90
Percentage of Total Discharges From Low SIR HospitalsCLABSI 0.31 0.19 0.23 0.41 0.22 0.36 0.20 0.38 0.40 0.24CAUTI 0.46 0.43 0.21 0.48 0.37 0.32 0.18 0.51 0.54 0.33MRSA 0.37 0.37 0.36 0.39 0.40 0.41 0.40 0.36 0.36 0.02CDIFF 0.27 0.27 0.34 0.32 0.31 0.29 0.36 0.35 0.32 0.81Percentage of Total Discharges From Hospitals With Unavailable SIRCLABSI 0.46 0.30 0.37 0.30 0.22 0.28 0.46 0.28 0.12 0.29CAUTI 0.38 0.27 0.35 0.22 0.20 0.23 0.44 0.12 0.07 0.20MRSA 0.49 0.39 0.40 0.32 0.31 0.32 0.47 0.36 0.27 0.51CDIFF 0.37 0.27 0.32 0.21 0.17 0.19 0.43 0.11 0.05 0.09

2017 HEDIS/CAHPS REPORT
page B-1TennCare 17.EQRO.06.017
APPENDIX B | HEDIS 2016 National Medicaid Means and PercentilesTable B. HEDIS 2016 National Medicaid Means and Percentiles
Measure MeanPercentile
10th 25th 50th 75th 90thHEDIS Effectiveness of Care Measures
Prevention and Screening
Adult BMI Assessment (ABA) 80.77% 69.47% 77.13% 84.54% 89.35% 92.54%
Weight Assessment and Counseling for Nutrition and Physical Activity for Children/Adolescents (WCC):
BMI Percentile: 3–11 years 64.83% 41.32% 55.03% 68.22% 78.38% 86.30%
12–17 years 63.19% 39.16% 51.63% 65.74% 76.76% 85.16%
Total 64.37% 40.14% 54.50% 67.54% 77.78% 86.37%
Counseling for Nutrition: 3–11 years 61.62% 43.53% 53.03% 63.33% 73.36% 80.22%
12–17 years 57.30% 40.15% 47.83% 57.35% 68.39% 78.69%
Total 60.22% 42.92% 51.84% 62.65% 70.88% 79.52%
Counseling for Physical Activity: 3–11 years 52.40% 35.59% 43.61% 53.99% 62.19% 71.30%
12–17 years 55.24% 37.04% 46.51% 55.75% 65.36% 74.62%
Total 53.44% 35.90% 45.09% 55.38% 63.47% 71.58%
Childhood Immunization Status (CIS):
DTaP/DT 76.33% 66.89% 72.51% 77.97% 82.24% 85.15%
IPV 87.70% 81.02% 86.09% 89.78% 92.46% 93.79%
MMR 89.21% 83.76% 87.86% 90.47% 92.70% 94.25%
HiB 87.62% 81.01% 85.95% 89.37% 91.97% 93.67%
HepB 87.70% 79.16% 85.64% 90.05% 93.19% 94.81%
VZV 88.79% 83.56% 87.27% 89.97% 92.49% 93.95%
PCV 76.53% 66.24% 72.75% 78.59% 82.64% 85.40%
HepA 83.70% 74.51% 79.69% 84.91% 88.89% 91.85%
RV 67.94% 54.50% 63.46% 69.34% 74.25% 79.12%

2017 HEDIS/CAHPS REPORT
APPENDIX B | National Medicaid Means and Percentiles
page B-2TennCare 17.EQRO.06.017
Table B. HEDIS 2016 National Medicaid Means and Percentiles
Measure MeanPercentile
10th 25th 50th 75th 90th
Influenza 45.74% 28.32% 36.34% 45.99% 54.01% 63.09%
Combination 2 72.46% 62.86% 68.03% 75.18% 78.59% 82.88%
Combination 3 68.99% 57.84% 64.30% 71.06% 75.60% 79.81%
Combination 4 65.91% 54.30% 60.81% 67.96% 72.54% 78.06%
Combination 5 57.21% 43.27% 52.55% 58.98% 63.77% 69.06%
Combination 6 39.01% 22.87% 30.61% 39.14% 46.47% 54.50%
Combination 7 55.17% 41.28% 49.82% 56.85% 61.92% 67.88%
Combination 8 38.01% 21.65% 29.36% 38.20% 45.99% 53.01%
Combination 9 33.86% 18.73% 25.78% 33.10% 41.57% 46.89%
Combination 10 33.24% 18.00% 25.99% 32.64% 40.91% 46.47%
Immunizations for Adolescents (IMA):
Meningococcal 74.79% 58.48% 67.26% 77.21% 84.47% 88.52%
Tdap/Td 83.36% 73.48% 81.28% 86.14% 89.92% 91.75%
HPV* 22.71% 13.64% 17.66% 22.30% 27.09% 32.25%
Combination 1 72.66% 56.90% 66.03% 74.52% 82.09% 86.57%
Combination 2**
Lead Screening in Children (LSC) 66.50% 40.28% 56.44% 71.05% 79.50% 84.77%
Breast Cancer Screening (BCS) 58.50% 47.21% 52.24% 58.08% 65.30% 71.52%
Cervical Cancer Screening (CCS) 55.85% 41.12% 48.18% 55.94% 63.88% 69.95%
Chlamydia Screening in Women (CHL):
16–20 years 51.49% 39.57% 43.87% 50.56% 58.45% 66.67%
21–24 years 60.65% 48.51% 54.76% 61.37% 67.95% 72.06%
Total 55.27% 43.07% 48.83% 55.16% 61.63% 68.92%
Respiratory Conditions
Appropriate Testing for Children With Pharyngitis (CWP) 71.12% 55.08% 63.24% 71.62% 81.01% 86.59%

2017 HEDIS/CAHPS REPORT
APPENDIX B | National Medicaid Means and Percentiles
page B-3TennCare 17.EQRO.06.017
Table B. HEDIS 2016 National Medicaid Means and Percentiles
Measure MeanPercentile
10th 25th 50th 75th 90th
Use of Spirometry Testing in the Assessment and Diagnosis of COPD (SPR) 30.96% 21.59% 25.81% 30.26% 35.43% 40.54%
Pharmacotherapy Management of COPD Exacerbation (PCE):
Systemic Corticosteroid 67.10% 48.84% 61.44% 70.39% 75.48% 79.07%
Bronchodilator 79.92% 66.11% 77.05% 83.70% 86.75% 88.78%
Medication Management for People With Asthma (MMA):
Medication Compliance 50%***: 5–11 years
12–18 years
19–50 years
51–64 years
Total
Medication Compliance 75%: 5–11 years 28.33% 17.13% 20.98% 25.88% 34.24% 41.18%
12–18 years 26.33% 14.84% 19.20% 25.00% 30.65% 37.63%
19–50 years 37.72% 25.18% 31.26% 36.25% 43.08% 50.98%
51–64 years 50.01% 39.66% 43.14% 49.48% 55.56% 62.75%
Total 32.67% 19.64% 25.08% 31.28% 37.50% 46.72%
Asthma Medical Ratio (AMR):
5–11 years 70.15% 56.36% 65.00% 71.74% 76.39% 82.70%
12–18 years 59.13% 46.77% 53.67% 60.50% 65.45% 69.65%
19–50 years 48.90% 38.05% 44.13% 49.00% 55.09% 58.96%
51–64 years 51.72% 40.64% 45.35% 52.03% 59.18% 63.64%
Total 59.67% 46.83% 54.55% 61.26% 65.36% 70.00%
Cardiovascular Conditions
Controlling High Blood Pressure (CBP) 54.74% 39.41% 46.87% 54.78% 63.99% 70.69%
Persistence of Beta-Blocker Treatment After a Heart Attack (PBH) 80.43% 64.04% 76.92% 83.06% 88.30% 91.67%

2017 HEDIS/CAHPS REPORT
APPENDIX B | National Medicaid Means and Percentiles
page B-4TennCare 17.EQRO.06.017
Table B. HEDIS 2016 National Medicaid Means and Percentiles
Measure MeanPercentile
10th 25th 50th 75th 90th
Statin Therapy for Patients with Cardiovascular disease (SPC)†:Received Statin Therapy: Males 21-75 yearsReceived Statin Therapy: Females 40 -75 yearsReceived Statin Therapy: TotalStatin Adherence 80%: Males 21-75 yearsStatin Adherence 80%: Females 40 -75 yearsStatin Adherence 80%: TotalDiabetesComprehensive Diabetes Care (CDC):HbA1c Testing 85.94% 79.56% 82.98% 85.95% 89.42% 92.88%
HbA1c Control (<7.0%) 32.36% 23.52% 29.27% 33.82% 38.31% 40.43%
HbA1c Control (<8.0%) 45.54% 31.16% 39.80% 46.76% 52.55% 58.39%
Retinal Eye Exam Performed 52.68% 35.64% 44.53% 53.28% 61.50% 68.11%
Medical Attention for Nephropathy 90.01% 85.94% 88.32% 90.51% 91.97% 93.56%
Blood Pressure Control (<140/90 mm Hg) 59.04% 43.75% 52.26% 59.73% 68.61% 75.73%Statin Therapy for Patients with Diabetes (SPD)†:Received Statin Therapy: 40 -75 yearsStatin Adherence 80%: 40 -75 yearsMusculoskeletal ConditionsDisease-Modifying Anti-Rheumatic Drug Therapy for Rheumatoid Arthritis (ART) 71.69% 57.36% 65.67% 72.22% 79.20% 85.71%
Behavioral HealthAntidepressant Medication Management (AMM):Effective Acute Phase Treatment 54.45% 44.00% 48.32% 53.38% 59.52% 67.57%
Effective Continuation Phase Treatment 39.44% 28.11% 32.77% 38.06% 43.39% 54.30%Follow-Up Care for Children Prescribed ADHD Medication (ADD):Initiation Phase 42.20% 28.77% 34.16% 42.19% 49.55% 55.48%
Continuation and Maintenance Phase 50.93% 33.96% 40.91% 52.47% 62.50% 67.23%

2017 HEDIS/CAHPS REPORT
APPENDIX B | National Medicaid Means and Percentiles
page B-5TennCare 17.EQRO.06.017
Table B. HEDIS 2016 National Medicaid Means and Percentiles
Measure MeanPercentile
10th 25th 50th 75th 90th
Follow-Up After Hospitalization for Mental Illness (FUH):
7-Day Follow-Up 43.71% 24.71% 34.23% 44.05% 55.34% 64.23%
30-Day Follow-Up 61.29% 41.31% 54.58% 63.94% 72.56% 78.52%
Follow-Up After Emergency Department Visit for Mental Illness (FUM)**:
7-Day Follow-Up
30-Day Follow-Up
Follow-Up After Emergency Department Visit for Alcohol and Other Drug Dependence (FUA)**:
7-Day Follow-Up: 13–17 years
18 years and older
Total
30-Day Follow-Up: 13–17 years
18 years and older
Total
Diabetes Screening for People With Schizophrenia or Bipolar Disorder Who Are Using Antipsychotic Medications (SSD) 80.37% 72.35% 76.99% 80.72% 84.01% 87.17%
Diabetes Monitoring for People With Diabetes and Schizophrenia (SMD) 68.20% 57.45% 62.69% 68.93% 74.55% 78.26%
Cardiovascular Monitoring for People With Cardio-vascular Disease and Schizophrenia (SMC) 78.47% 65.38% 73.89% 80.00% 83.75% 88.37%
Adherence to Antipsychotic Medications for Individuals With Schizophrenia (SAA) 57.88% 42.86% 52.80% 59.79% 65.44% 70.88%
Metabolic Monitoring for Children and Adolescents on Antipsychotics (APM):
1–5 Years 16.70% 6.06% 10.26% 15.33% 20.00% 31.25%
6–11 Years 26.16% 17.02% 21.21% 25.19% 29.73% 36.67%
12–17 Years 32.05% 20.42% 26.39% 32.33% 37.31% 43.48%
Total 29.84% 18.57% 23.89% 29.63% 34.93% 42.33%

2017 HEDIS/CAHPS REPORT
APPENDIX B | National Medicaid Means and Percentiles
page B-6TennCare 17.EQRO.06.017
Table B. HEDIS 2016 National Medicaid Means and Percentiles
Measure MeanPercentile
10th 25th 50th 75th 90th
Medication Management
Annual Monitoring for Patients on Persistent Medications (MPM):
ACE Inhibitors or ARBs 87.51% 83.31% 85.63% 87.43% 89.92% 92.13%
Digoxin 54.01% 46.15% 49.57% 53.94% 58.55% 61.98%
Diuretics 87.49% 83.33% 85.18% 87.52% 90.00% 92.28%
Total 87.28% 83.16% 85.19% 87.23% 89.56% 91.84%
Overuse/Appropriateness
Appropriate Treatment for Children With Upper Respiratory Infection (URI) 87.76% 76.23% 84.92% 89.39% 93.38% 96.08%
Avoidance of Antibiotic Treatment in Adults With Acute Bronchitis (AAB) 28.09% 19.38% 22.12% 26.17% 32.51% 38.91%
Use of Imaging Studies for Low Back Pain (LBP) 73.57% 66.04% 69.88% 73.71% 77.09% 81.42%
Measures Collected Though CAHPS
Flu vaccinations for adults ages 18 to 64 (FVA) 38.46% 28.70% 33.79% 38.03% 43.54% 48.01%
Medical Assistance With Smoking Cessation (MSC):
Advising Smokers and Tobacco Users to Quit 75.89% 67.83% 73.14% 76.59% 79.36% 81.85%
Discussing Cessation Medications 48.12% 36.67% 43.01% 48.31% 53.85% 58.39%
Discussing Cessation Strategies 43.28% 34.00% 38.86% 43.82% 47.83% 51.75%
Supplemental Data - % Current Smokers 31.02% 17.50% 22.97% 31.68% 39.01% 43.79%HEDIS Effectiveness of Care Measures Where Lower Rates Indicated Better Performance
Diabetes
Comprehensive Diabetes Care (CDC):
HbA1c Poor Control (>9.0%) 45.35% 61.31% 52.31% 43.80% 36.87% 29.23%
Overuse/Appropriateness
Non-Recommended Cervical Cancer Screening in Adolescent Females (NCS) 2.71% 5.35% 3.77% 2.42% 1.42% 0.85%

2017 HEDIS/CAHPS REPORT
APPENDIX B | National Medicaid Means and Percentiles
page B-7TennCare 17.EQRO.06.017
Table B. HEDIS 2016 National Medicaid Means and Percentiles
Measure MeanPercentile
10th 25th 50th 75th 90th
Use of Multiple Concurrent Antipsychotics in Children and Adolescents (APC):
1-5 Years 0.66% 2.86% 1.96% 0.00% 0.00% 0.00%
6-11 Years 1.82% 3.75% 2.74% 1.56% 0.63% 0.00%
12-17 Years 3.00% 6.29% 3.97% 2.53% 1.41% 0.00%
Total 2.49% 5.30% 3.14% 1.99% 1.17% 0.00%HEDIS Access/Availability of Care Measures
Adults’ Access to Preventive/Ambulatory Health Services (AAP):
20–44 years 77.27% 63.73% 73.35% 79.48% 83.42% 86.04%
45–64 years 85.52% 76.95% 82.49% 86.83% 89.78% 91.57%
Children and Adolescents’ Access to Primary Care Practitioners (CAP):
12–24 months 94.69% 89.89% 93.14% 95.74% 97.28% 97.85%
25 months–6 years 87.24% 81.16% 84.83% 87.69% 90.98% 93.34%
7-11 years 90.23% 84.16% 87.91% 91.00% 93.25% 96.10%
12–19 years 88.60% 83.13% 85.84% 89.37% 92.67% 94.69%
Initiation and Engagement of Alcohol and Other Drug (AOD) Dependence Treatment (IET):
Initiation of AOD Treatment: 13–17 years 42.25% 27.49% 35.94% 42.75% 50.00% 52.99%
37.94% 30.00% 34.17% 37.78% 42.67% 46.16%
Total 38.23% 30.21% 34.37% 38.07% 42.82% 46.56%
Engagement of AOD Treatment: 13–17 years 15.44% 7.43% 9.18% 13.53% 21.46% 26.70%
9.69% 4.16% 6.33% 9.29% 12.32% 16.65%
Total 10.23% 4.42% 6.92% 9.63% 13.20% 16.93%
Prenatal and Postpartum Care (PPC):
Timeliness of Prenatal Care 80.03% 66.91% 74.21% 82.25% 87.56% 91.00%
Postpartum Care 60.93% 48.94% 55.47% 60.98% 67.53% 73.61%

2017 HEDIS/CAHPS REPORT
APPENDIX B | National Medicaid Means and Percentiles
page B-8TennCare 17.EQRO.06.017
Table B. HEDIS 2016 National Medicaid Means and Percentiles
Measure MeanPercentile
10th 25th 50th 75th 90thUse of First-Line Psychosocial Care for Children and Adolescents on Antipsychotics (APP):1-5 Years 49.04% 33.33% 40.48% 45.45% 62.99% 66.67%
6-11 Years 58.83% 36.03% 47.96% 61.54% 68.35% 77.78%
12-17 Years 59.12% 39.84% 50.57% 61.20% 68.25% 76.47%
Total 57.44% 36.73% 48.83% 60.43% 68.57% 74.34%HEDIS Utilization and Relative Resource Use Measures
UtilizationFrequency of Ongoing Prenatal Care (FPC):<21% 11.96% 2.87% 4.87% 8.22% 14.69% 23.60%
21–40% 7.26% 2.33% 3.95% 5.82% 9.02% 13.93%
41–60% 8.59% 4.65% 6.03% 7.92% 10.46% 12.99%
61–80% 15.23% 10.48% 12.58% 14.95% 17.95% 20.45%
56.61% 32.79% 45.72% 59.26% 69.54% 75.77%Well-Child Visits in the First 15 Months of Life (W15):0 Visits 2.62% 0.44% 0.93% 1.71% 3.24% 5.77%
1 Visits 2.30% 0.70% 1.26% 1.95% 2.92% 4.12%
2 Visits 3.45% 1.23% 2.06% 3.19% 4.62% 5.84%
3 Visits 5.54% 2.66% 3.72% 5.42% 6.98% 8.57%
4 Visits 9.64% 6.01% 7.54% 9.16% 11.30% 13.40%
5 Visits 17.11% 12.02% 14.29% 16.49% 19.23% 23.72%
6 or More Visits 59.35% 45.38% 53.49% 59.57% 67.76% 73.88%
Well-Child Visits in the Third, Fourth, Fifth and Sixth Years of Life (W34) 71.27% 60.64% 64.72% 71.42% 77.57% 82.97%
Adolescent Well-Care Visits (AWC) 48.89% 32.26% 40.88% 48.41% 57.66% 66.04%
*For HEDIS 2017, the HPV measure was integrated into the IMA measure for reporting purposes and expanded to both genders.**First-year measure.***Benchmarks are currently not reported by Quality Compass for this rate.†Benchmarks are not reported by Quality Compass for 2016 first-year measures.

2017 HEDIS/CAHPS REPORT
page C-1TennCare 17.EQRO.06.017
APPENDIX C | MCO Medicaid Population in Member MonthsTable C1. HEDIS 2017 MCO Medicaid Population Reported in Member Months by Age and Sex—AG
Age GroupAGE AGM AGW
Male Female Total Male Female Total Male Female Total
<1 24,463 22,860 47,323 37,943 36,655 74,598 27,484 25,991 53,4751–4 93,348 87,156 180,504 152,175 145,968 298,143 104,614 100,080 204,694
5–9 118,823 114,341 233,164 168,907 164,673 333,580 125,679 126,475 252,15410–14 122,898 117,959 240,857 119,236 118,151 237,387 105,541 106,015 211,55615–17 43,325 43,277 86,602 75,338 74,823 150,161 41,396 41,985 83,381
18–19 33,513 31,438 64,951 36,986 42,086 79,072 30,829 31,683 62,512
0–19Subtotal
436,370 417,031 853,401 590,585 582,356 1,172,941 435,543 432,229 867,772
65.33% 49.24% 56.33% 72.15% 52.27% 60.69% 71.95% 49.21% 58.48%
20–24 48,624 84,095 132,719 38,676 90,149 128,825 48,242 89,064 137,30625–29 30,795 98,381 129,176 21,882 94,398 116,280 18,406 124,726 143,13230–34 31,163 69,978 101,141 27,617 96,900 124,517 18,059 73,645 91,704
35–39 27,994 52,285 80,279 29,735 82,943 112,678 17,276 42,446 59,72240–44 21,836 39,031 60,867 25,495 53,550 79,045 12,674 32,340 45,014
20–44 Subtotal
160,412 343,770 504,182 143,405 417,940 561,345 114,657 362,221 476,878
24.02% 40.59% 33.28% 17.52% 37.51% 29.04% 18.94% 41.24% 32.14%
45–49 18,559 29,250 47,809 21,114 33,595 54,709 10,718 26,393 37,11150–54 19,027 23,929 42,956 20,276 26,347 46,623 12,950 21,789 34,739
55–59 19,065 18,385 37,450 19,647 22,073 41,720 16,746 19,106 35,85260–64 12,086 10,653 22,739 14,334 16,064 30,398 12,239 11,630 23,869
45–64 Subtotal
68,737 82,217 150,954 75,371 98,079 173,450 52,653 78,918 131,571
10.29% 9.71% 9.96% 9.21% 8.80% 8.97% 8.70% 8.98% 8.87%

2017 HEDIS/CAHPS REPORT
APPENDIX C | MCO Population in Member Months
page C-2TennCare 17.EQRO.06.017
Table C1. HEDIS 2017 MCO Medicaid Population Reported in Member Months by Age and Sex—AG
Age GroupAGE AGM AGW
Male Female Total Male Female Total Male Female Total
65–69 1,419 1,760 3,179 4,400 6,157 10,557 1,472 2,482 3,954
70–74 467 721 1,188 2,551 3,839 6,390 492 1,098 1,59075–79 309 472 781 1,315 2,485 3,800 250 677 92780–84 117 405 522 561 1,739 2,300 159 327 486
85–89 67 326 393 277 1,025 1,302 57 211 26848 317 365 91 515 606 82 261 343
Subtotal2,427 4,001 6,428 9,195 15,760 24,955 2,512 5,056 7,568
0.36% 0.47% 0.42% 1.12% 1.41% 1.29% 0.41% 0.58% 0.51%
Total 667,946 847,019 1,514,965 818,556 1,114,135 1,932,691 605,365 878,424 1,483,789
Table C2. HEDIS 2017 MCO Medicaid Population Reported in Member Months by Age and Sex—BC and TCS
Age Group
BCE BCM BCW TCS
Male Female Total Male Female Total Male Female Total Male Female Total
<1 48,796 46,671 95,467 37,198 36,001 73,199 33,660 32,283 65,943 5,918 6,264 12,182
1–4 162,214 154,231 316,445 126,684 123,425 250,109 122,279 117,821 240,100 53,959 46,447 100,406
5–9 172,045 167,643 339,688 155,050 151,919 306,969 133,918 131,853 265,771 91,313 61,373 152,686
10–14 139,184 136,041 275,225 152,345 151,570 303,915 111,825 115,481 227,306 102,929 60,111 163,040
15–17 79,990 79,066 159,056 52,305 50,791 103,096 64,708 68,320 133,028 73,993 43,346 117,339
18–19 43,506 52,694 96,200 35,648 40,655 76,303 35,001 41,756 76,757 49,666 26,544 76,210
0–19Subtotal
645,735 636,346 1,282,081 559,230 554,361 1,113,591 501,391 507,514 1,008,905 377,778 244,085 621,863
72.70% 49.20% 58.77% 72.83% 51.57% 60.43% 77.08% 51.00% 61.31% 83.03% 74.39% 79.41%

2017 HEDIS/CAHPS REPORT
APPENDIX C | MCO Population in Member Months
page C-3TennCare 17.EQRO.06.017
Table C2. HEDIS 2017 MCO Medicaid Population Reported in Member Months by Age and Sex—BC and TCS
Age Group
BCE BCM BCW TCS
Male Female Total Male Female Total Male Female Total Male Female Total
20–24 41,502 118,561 160,063 50,182 106,280 156,462 37,866 89,125 126,991 41,282 28,732 70,014
25–29 19,629 117,713 137,342 25,294 118,819 144,113 12,104 77,428 89,532 7,039 15,515 22,554
30–34 28,870 107,716 136,586 27,032 85,857 112,889 16,459 88,808 105,267 7,326 14,027 21,353
35–39 31,933 90,945 122,878 24,962 65,065 90,027 16,409 80,822 97,231 6,691 10,852 17,543
40–44 29,801 63,107 92,908 17,980 44,977 62,957 14,112 49,332 63,444 4,949 6,349 11,298
20–44 Subtotal
151,735 498,042 649,777 145,450 420,998 566,448 96,950 385,515 482,465 67,287 75,475 142,762
17.08% 38.50% 29.78% 18.94% 39.16% 30.74% 14.91% 38.74% 29.32% 14.79% 23.00% 18.23%
45–49 25,270 46,369 71,639 16,399 35,086 51,485 12,479 31,793 44,272 3,207 3,545 6,752
50–54 23,216 41,145 64,361 16,603 26,998 43,601 12,883 25,334 38,217 2,891 2,377 5,268
55–59 21,503 33,417 54,920 16,754 20,585 37,339 13,455 21,784 35,239 2,403 1,419 3,822
60–64 15,377 25,936 41,313 11,069 12,401 23,470 10,722 16,647 27,369 1,270 1,076 2,346
45–64 Subtotal
85,366 146,867 232,233 60,825 95,070 155,895 49,539 95,558 145,097 9,771 8,417 18,188
9.61% 11.35% 10.64% 7.92% 8.84% 8.46% 7.62% 9.60% 8.82% 2.15% 2.57% 2.32%
65–69 2,516 5,386 7,902 1,136 1,888 3,024 1,472 2,868 4,340 109 87 196
70–74 1,592 3,120 4,712 520 752 1,272 552 1655 2,207 32 59 91
75–79 781 1,683 2,464 309 581 890 278 802 1,080 24 12 36
80–84 320 1,198 1,518 159 586 745 174 693 867 0 0 0
85–89 114 536 650 102 419 521 84 304 388 0 0 0
58 286 344 102 346 448 2 161 163 0 0 0
Subtotal5,381 12,209 17,590 2,328 4,572 6,900 2,562 6,483 9,045 165 158 323
0.61% 0.94% 0.81% 0.30% 0.43% 0.37% 0.39% 0.65% 0.55% 0.04% 0.05% 0.04%
Total 888,217 1,293,464 2,181,681 767,833 1,075,001 1,842,834 650,442 995,070 1,645,512 455,001 328,135 783,136

2017 HEDIS/CAHPS REPORT
APPENDIX C | MCO Population in Member Months
page C-4TennCare 17.EQRO.06.017
Table C3. HEDIS 2017 MCO Medicaid Population Reported in Member Months by Age and Sex—UHC
Age GroupUHCE UHCM UHCW
Male Female Total Male Female Total Male Female Total<1 24,549 22,878 47,427 37,273 35,880 73,153 26,290 25,434 51,7241–4 121,480 116,400 237,880 148,550 144,341 292,891 115,750 111,303 227,0535–9 146,083 141,688 287,771 161,500 158,038 319,538 134,452 131,987 266,43910–14 114,191 110,672 224,863 117,453 114,847 232,300 98,567 98,804 197,37115–17 70,709 71,962 142,671 72,832 70,665 143,497 58,891 62,010 120,90118–19 36,885 40,580 77,465 36,773 42,157 78,930 31,422 36,293 67,7150–19Subtotal
513,897 504,180 1,018,077 574,381 565,928 1,140,309 465,372 465,831 931,20365.79% 47.55% 55.29% 72.23% 51.09% 59.92% 72.87% 50.82% 59.87%
20–24 37,801 77,258 115,059 34,397 84,622 119,019 35,464 82,374 117,83825–29 21,789 75,040 96,829 19,189 90,763 109,952 14,507 68,534 83,04130–34 23,601 77,040 100,641 25,195 93,877 119,072 12,608 65,855 78,46335–39 29,327 78,660 107,987 29,394 80,108 109,502 16,911 68,399 85,31040–44 28,994 58,575 87,569 25,114 52,344 77,458 16,240 45,757 61,99720–44 Subtotal
141,512 366,573 508,085 133,289 401,714 535,003 95,730 330,919 426,64918.12% 34.57% 27.59% 16.76% 36.26% 28.11% 14.99% 36.10% 27.43%
45–49 27,143 41,210 68,353 21,794 34,640 56,434 14,816 28,277 43,09350–54 26,122 36,241 62,363 20,112 28,200 48,312 16,783 22,934 39,71755–59 27,480 32,068 59,548 17,587 24,596 42,183 17,504 20,548 38,05260–64 21,857 26,742 48,599 13,867 18,536 32,403 14,608 15,367 29,97545–64 Subtotal
102,602 136,261 238,863 73,360 105,972 179,332 63,711 87,126 150,83713.14% 12.85% 12.97% 9.22% 9.57% 9.42% 9.98% 9.50% 9.70%
65–69 9,206 15,489 24,695 4,575 8,896 13,471 5,588 8,392 13,98070–74 6,058 10,772 16,830 3,935 6,903 10,838 3,415 6,619 10,03475–79 3,836 8,562 12,398 2,418 5,439 7,857 2,178 5,078 7,25680–84 2,110 7,423 9,533 1,773 4,798 6,571 1,354 4,740 6,09485–89 1,187 5,727 6,914 984 4,114 5,098 831 4,204 5,035
713 5,382 6,095 528 3,971 4,499 484 3,768 4,252
Subtotal23,110 53,355 76,465 14,213 34,121 48,334 13,850 32,801 46,6512.96% 5.03% 4.15% 1.79% 3.08% 2.54% 2.17% 3.58% 3.00%
Total 781,121 1,060,369 1,841,490 795,243 1,107,735 1,902,978 638,663 916,677 1,555,340

2017 HEDIS/CAHPS REPORT
page D-1TN Division of Health Car TennCare 17.EQRO.06.017
APPENDIX D | Measure Reporting OptionsThe reporting options are presented for each measure: administrative and/or hybrid. Currently, when the hybrid option is available, TennCare MCOs are required to use the hybrid method.
Table D. 2017 Measure reporting options: Administrative/HybridMeasure Administrative Hybrid
HEDIS Effectiveness of Care
Prevention and Screening
Adult BMI Assessment (ABA)
Weight Assessment and Counseling for Nutrition and Physical Activity for Children/Adolescents (WCC)
Childhood Immunization Status (CIS)
Immunizations for Adolescents (IMA)
Human Papillomavirus Vaccine for Female Adolescents (HPV)
Lead Screening in Children (LSC)
Breast Cancer Screening (BCS)
Cervical Cancer Screening (CCS)
Chlamydia Screening in Women (CHL)
Respiratory Conditions
Appropriate Testing for Children With Pharyngitis (CWP)
Use of Spirometry Testing in the Assessment and Diagnosis of COPD (SPR)
Pharmacotherapy Management of COPD Exacerbation (PCE)
Medication Management for People With Asthma (MMA)
Asthma Medical Ratio (AMR)
Cardiovascular Conditions
Controlling High Blood Pressure (CBP)
Persistence of Beta-Blocker Treatment After a Heart Attack (PBH)
Statin Therapy for Patients with Cardiovascular Disease (SPC)
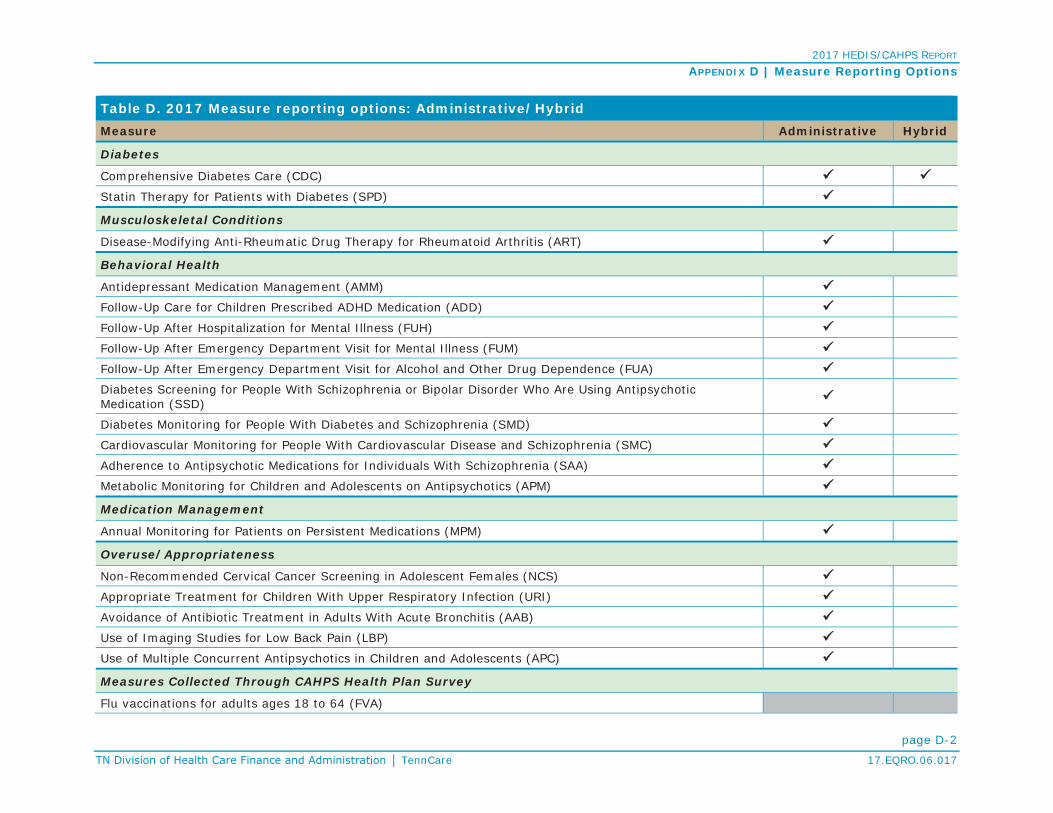
2017 HEDIS/CAHPS REPORT
APPENDIX D | Measure Reporting Options
page D-2TennCare 17.EQRO.06.017
Table D. 2017 Measure reporting options: Administrative/HybridMeasure Administrative Hybrid
Diabetes
Comprehensive Diabetes Care (CDC)
Statin Therapy for Patients with Diabetes (SPD)
Musculoskeletal Conditions
Disease-Modifying Anti-Rheumatic Drug Therapy for Rheumatoid Arthritis (ART)
Behavioral Health
Antidepressant Medication Management (AMM)
Follow-Up Care for Children Prescribed ADHD Medication (ADD)
Follow-Up After Hospitalization for Mental Illness (FUH)
Follow-Up After Emergency Department Visit for Mental Illness (FUM)
Follow-Up After Emergency Department Visit for Alcohol and Other Drug Dependence (FUA)
Diabetes Screening for People With Schizophrenia or Bipolar Disorder Who Are Using Antipsychotic Medication (SSD)
Diabetes Monitoring for People With Diabetes and Schizophrenia (SMD)
Cardiovascular Monitoring for People With Cardiovascular Disease and Schizophrenia (SMC)
Adherence to Antipsychotic Medications for Individuals With Schizophrenia (SAA)
Metabolic Monitoring for Children and Adolescents on Antipsychotics (APM)
Medication Management
Annual Monitoring for Patients on Persistent Medications (MPM)
Overuse/Appropriateness
Non-Recommended Cervical Cancer Screening in Adolescent Females (NCS)
Appropriate Treatment for Children With Upper Respiratory Infection (URI)
Avoidance of Antibiotic Treatment in Adults With Acute Bronchitis (AAB)
Use of Imaging Studies for Low Back Pain (LBP)
Use of Multiple Concurrent Antipsychotics in Children and Adolescents (APC)
Measures Collected Through CAHPS Health Plan Survey
Flu vaccinations for adults ages 18 to 64 (FVA)

2017 HEDIS/CAHPS REPORT
APPENDIX D | Measure Reporting Options
page D-3TennCare 17.EQRO.06.017
Table D. 2017 Measure reporting options: Administrative/HybridMeasure Administrative HybridMedical Assistance With Smoking Cessation (MSC)
HEDIS Access/Availability of Care MeasuresAdults’ Access to Preventive/Ambulatory Health Services (AAP)
Children and Adolescents’ Access to Primary Care Practitioners (CAP)
Initiation and Engagement of Alcohol and Other Drug (AOD) Dependence Treatment (IET)
Prenatal and Postpartum Care (PPC)
Use of First-Line Psychosocial Care for Children and Adolescents on Antipsychotics (APP)HEDIS Utilization and Risk-Adjusted Utilization Measures
Frequency of Ongoing Prenatal Care (FPC)
Well-Child Visits in the First 15 Months of Life (W15)
Well-Child Visits in the Third, Fourth, Fifth and Sixth Years of Life (W34)
Adolescent Well-Care Visits (AWC)

2017 HEDIS/CAHPS REPORT
page E-1TennCare 17.EQRO.06.017
APPENDIX E | CHIP Measures, Frequencies, andPopulation by Member MonthsIn the tables of this appendix, rates reported are for CKBC, the only HPA during HEDIS 2017. Cells are shaded gray for those measures that were not calculated or for which data were not reported. HEDIS definitions for measures apply to all lines of business.
Additional Utilization Measures: CHIP Plan-Specific RatesTable E1. HEDIS 2017 Utilization Measures: CHIP—FPC and W15Measure/Data Element Rate
Frequency of Ongoing Prenatal Care (FPC):
<21 Percent 7.80%
21-40 Percent 5.85%
41-60 Percent 10.73%
61-80 Percent 15.85%
81+ Percent 59.76%
Well-Child Visits in the First 15 Months of Life (W15):
0 Visits 3.28%
1 Visit 0.60%
2 Visits 0.90%
3 Visits 2.69%
4 Visits 4.78%
5 Visits 12.54%
6+ Visits 75.22%
Table E2. HEDIS 2017 Utilization Measures: CHIP—Frequency of Selected Procedures (FSP)Age Sex Procedures / 1,000 Member Months
Bariatric Weight Loss Surgery:
0-19M 0.00
F 0.00
20-44M 0.00
F 0.00
45-64M
F 0.00
Tonsillectomy:0-9
M&F1.17
10-19 0.39Hysterectomy, Abdominal:
15-44F
0.0445-64 0.00
Hysterectomy, Vaginal:15-44
F0.00
45-64 0.00

2017 HEDIS/CAHPS REPORT
APPENDIX E | CHIP Measures, Frequencies and Population
page E-2TennCare 17.EQRO.06.017
Table E2. HEDIS 2017 Utilization Measures: CHIP—Frequency of Selected Procedures (FSP)Age Sex Procedures / 1,000 Member Months
Cholecystectomy, Open:30-64 M15-44
F0.01
45-64 0.00Cholecystectomy (laparoscopic):
30-64 M
15-44F
0.39
45-64 0.00
Back Surgery:
20-44M 0.00
F 0.02
45-64M
F 0.00
Mastectomy:15-44
F0.00
45-64 0.00
Lumpectomy:15-44
F0.05
45-64 0.00
Table E3. HEDIS 2017 Utilization Measures: CHIP—Ambulatory Care: Total (AMB)
Age Visits/ 1,000 Member MonthsOutpatient Visits ED Visits
<1 722.93 41.15
1-9 268.42 24.28
10-19 228.20 25.60
20-44 298.43 53.15
45-64 281.69 14.08
65-74
75-84
85+ 62.50 62.50
Unknown
Total 250.88 26.88
Table E4a. HEDIS 2017 Utilization Measures: CHIP—Inpatient Utilization General Hospital/Acute Care: Total (IPU)
AgePer 1,000 Members Months Average
Length of StayDischarges DaysMaternity
10-19 0.82 2.08 2.56
20-44 95.26 225.83 2.37
45-64 56.34 119.72 2.13
Unknown
Total 9.29 22.16 2.38

2017 HEDIS/CAHPS REPORT
APPENDIX E | CHIP Measures, Frequencies and Population
page E-3TennCare 17.EQRO.06.017
Table E4b. HEDIS 2017 Utilization Measures: CHIP—Inpatient Utilization General Hospital/Acute Care: Total (IPU)
Age
Per 1,000Members Months
Average Length of
Stay
Per 1,000Members Months
Average Length of
Stay
Per 1,000Member Months
Average Length of
StayDischarges Days Discharges Days Discharges DaysTotal Inpatient Surgery Medicine
<1 5.67 40.90 7.22 0.86 26.49 30.71 4.80 14.41 3.001-9 0.73 2.21 3.02 0.16 0.64 3.94 0.57 1.56 2.7510-19 1.54 4.57 2.96 0.22 0.83 3.78 0.51 1.62 3.1920-44 95.87 227.62 2.37 0.43 1.18 2.76 0.18 0.61 3.3345-64 56.34 119.72 2.13 0.00 0.00 0.00 0.0065-7475-8485+ 0.00 0.00 0.00 0.00 0.00 0.00UnknownTotal 6.76 17.00 2.52 0.22 1.03 4.72 0.55 1.66 3.02
Table E5. HEDIS 2017 Utilization Measures: CHIP—Total IAD and Total MPT Rates
Age Sex Any Services Inpatient Intensive Outpatient/Partial Hospitalization Outpatient/ED
Identification of Alcohol and Other Drug Services: Total (IAD)
0-12
M 0.05% 0.00% 0.01% 0.05%
F 0.01% 0.00% 0.00% 0.01%
Total 0.03% 0.00% 0.00% 0.03%
13-17
M 1.26% 0.25% 0.45% 1.06%
F 1.00% 0.34% 0.35% 0.70%
Total 1.13% 0.30% 0.40% 0.88%
18-24
M 2.38% 0.57% 0.62% 1.94%
F 1.81% 0.68% 0.34% 1.29%
Total 2.05% 0.63% 0.45% 1.56%

2017 HEDIS/CAHPS REPORT
APPENDIX E | CHIP Measures, Frequencies and Population
page E-4TennCare 17.EQRO.06.017
Table E5. HEDIS 2017 Utilization Measures: CHIP—Total IAD and Total MPT Rates
Age Sex Any Services Inpatient Intensive Outpatient/Partial Hospitalization Outpatient/ED
25-34
M 0.00% 0.00% 0.00% 0.00%
F 0.32% 0.04% 0.00% 0.32%
Total 0.32% 0.04% 0.00% 0.32%
35-64
M
F 0.25% 0.12% 0.00% 0.25%
Total 0.25% 0.12% 0.00% 0.25%
65+
M 0.00% 0.00% 0.00% 0.00%
F
Total 0.00% 0.00% 0.00% 0.00%
Unknown
M
F
Total
TotalM 0.63% 0.13% 0.20% 0.52%F 0.50% 0.17% 0.14% 0.36%
Total 0.56% 0.15% 0.17% 0.44%Mental Health Utilization: Total (MPT)
0-12
M 6.72% 0.08% 0.03% 6.69%
F 3.82% 0.05% 0.02% 3.81%
Total 5.30% 0.06% 0.02% 5.28%
13-17
M 7.56% 0.64% 0.20% 7.39%
F 8.70% 1.20% 0.26% 8.38%
Total 8.12% 0.91% 0.23% 7.87%
18-64
M 4.90% 0.75% 0.13% 4.72%
F 2.86% 0.43% 0.06% 2.74%
Total 3.39% 0.51% 0.08% 3.25%

2017 HEDIS/CAHPS REPORT
APPENDIX E | CHIP Measures, Frequencies and Population
page E-5TennCare 17.EQRO.06.017
Table E5. HEDIS 2017 Utilization Measures: CHIP—Total IAD and Total MPT Rates
Age Sex Any Services Inpatient Intensive Outpatient/Partial Hospitalization Outpatient/ED
65+
M 0.00% 0.00% 0.00% 0.00%
F
Total 0.00% 0.00% 0.00% 0.00%
Unknown
M
F
Total
TotalM 6.89% 0.32% 0.09% 6.80%F 5.15% 0.47% 0.10% 5.03%
Total 5.99% 0.40% 0.10% 5.88%
Utilization Measures: CHIP—Antibiotic Utilization: Total (ABX)Table E6. HEDIS 2017 Utilization Measures: CHIP—Antibiotic Utilization
Age Sex Average Scripts PMPY for Antibiotics
Average Days Supplied per
Antibiotic Script
Average Scripts PMPY for Antibiotics of Concern
Percentage of Antibiotics of Concern of All Antibiotic Scripts
0-9M 1.02 9.29 0.49 48.45%F 1.11 9.54 0.52 46.40%
Total 1.06 9.42 0.50 47.41%
10-17M 0.64 10.59 0.31 48.18%F 0.84 10.56 0.38 45.94%
Total 0.74 10.58 0.35 46.94%
18-34
M 0.53 11.72 0.25 46.26%
F 0.88 9.42 0.29 33.01%
Total 0.78 9.86 0.28 35.58%

2017 HEDIS/CAHPS REPORT
APPENDIX E | CHIP Measures, Frequencies and Population
page E-6TennCare 17.EQRO.06.017
Table E6. HEDIS 2017 Utilization Measures: CHIP—Antibiotic Utilization
Age Sex Average Scripts PMPY for Antibiotics
Average Days Supplied per
Antibiotic Script
Average Scripts PMPY for Antibiotics of Concern
Percentage of Antibiotics of Concern of All Antibiotic Scripts
35-49MF 0.68 8.18 0.16 23.20%
Total 0.68 8.18 0.16 23.20%
50-64
M
F 0.00 0.00
Total 0.00 0.00
65-74
M
F
Total
75-84
M
F
Total
85+
M 0.00 0.00
F
Total 0.00 0.00
Unknown
M
F
Total
TotalM 0.78 10.00 0.38 48.23%F 0.93 9.95 0.41 43.88%
Total 0.86 9.97 0.39 45.77%

2017 HEDIS/CAHPS REPORT
APPENDIX E | CHIP Measures, Frequencies and Population
page E-7TennCare 17.EQRO.06.017
Table E7. HEDIS 2017 Utilization Measures: CHIP—Antibiotics of Concern Utilization
Age SexAverage Scripts PMPY for
Quinolones Cephalosporins 2nd-4th Generation
Azithromycins and Clarithromycins
Amoxicillin/ Clavulanates Ketolides Clindamycins Misc. Antibiotics
of Concern
0-9M 0.00 0.18 0.18 0.12 0.00 0.02 0.00F 0.00 0.21 0.17 0.12 0.00 0.02 0.00
Total 0.00 0.19 0.17 0.12 0.00 0.02 0.00
10-17M 0.01 0.07 0.13 0.08 0.00 0.02 0.00F 0.01 0.09 0.17 0.09 0.00 0.03 0.00
Total 0.01 0.08 0.15 0.09 0.00 0.02 0.00
18-34M 0.03 0.03 0.09 0.07 0.00 0.03 0.00F 0.03 0.04 0.12 0.06 0.00 0.03 0.00
Total 0.03 0.04 0.11 0.06 0.00 0.03 0.00
35-49MF 0.02 0.02 0.04 0.06 0.00 0.02 0.00
Total 0.02 0.02 0.04 0.06 0.00 0.02 0.00
50-64MF 0.00 0.00 0.00 0.00 0.00 0.00 0.00
Total 0.00 0.00 0.00 0.00 0.00 0.00 0.00
65-74MF
Total
75-84MF
Total
85+M 0.00 0.00 0.00 0.00 0.00 0.00 0.00F
Total 0.00 0.00 0.00 0.00 0.00 0.00 0.00
Unknown
M
F
Total
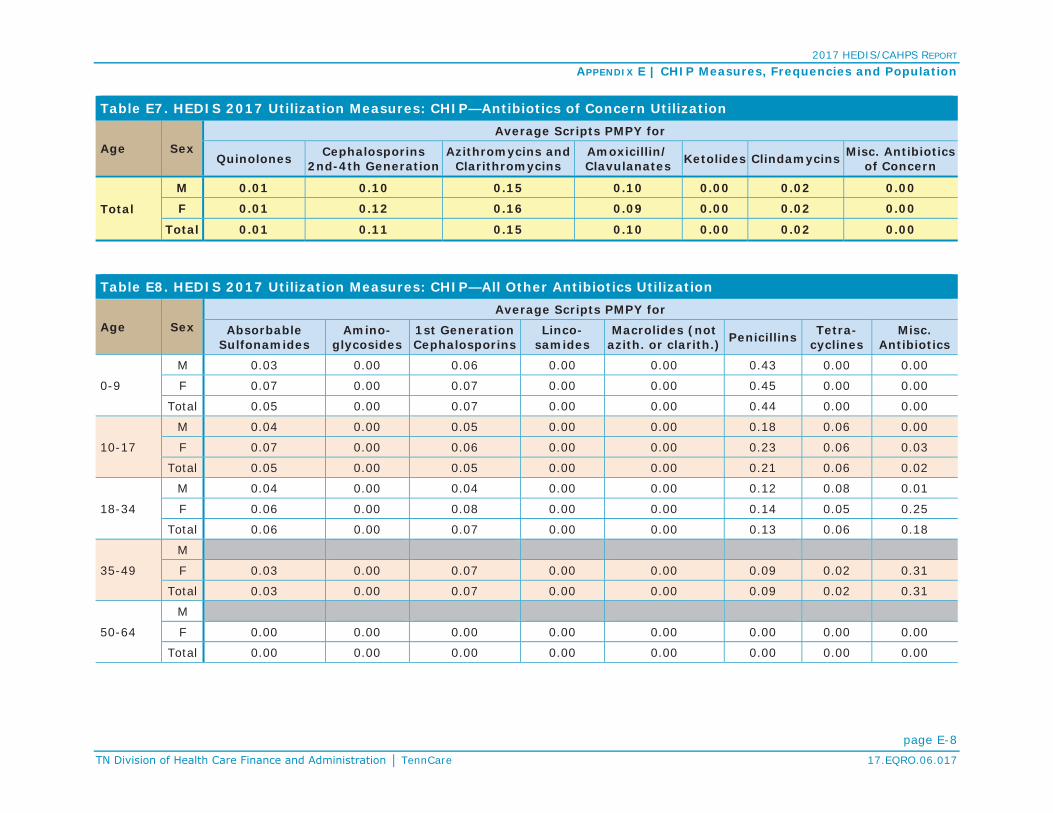
2017 HEDIS/CAHPS REPORT
APPENDIX E | CHIP Measures, Frequencies and Population
page E-8TennCare 17.EQRO.06.017
Table E7. HEDIS 2017 Utilization Measures: CHIP—Antibiotics of Concern Utilization
Age SexAverage Scripts PMPY for
Quinolones Cephalosporins 2nd-4th Generation
Azithromycins and Clarithromycins
Amoxicillin/ Clavulanates Ketolides Clindamycins Misc. Antibiotics
of Concern
Total
M 0.01 0.10 0.15 0.10 0.00 0.02 0.00
F 0.01 0.12 0.16 0.09 0.00 0.02 0.00
Total 0.01 0.11 0.15 0.10 0.00 0.02 0.00
Table E8. HEDIS 2017 Utilization Measures: CHIP—All Other Antibiotics Utilization
Age SexAverage Scripts PMPY for
Absorbable Sulfonamides
Amino-glycosides
1st Generation Cephalosporins
Linco-samides
Macrolides (not azith. or clarith.) Penicillins Tetra-
cyclinesMisc.
Antibiotics
0-9
M 0.03 0.00 0.06 0.00 0.00 0.43 0.00 0.00
F 0.07 0.00 0.07 0.00 0.00 0.45 0.00 0.00
Total 0.05 0.00 0.07 0.00 0.00 0.44 0.00 0.00
10-17
M 0.04 0.00 0.05 0.00 0.00 0.18 0.06 0.00
F 0.07 0.00 0.06 0.00 0.00 0.23 0.06 0.03
Total 0.05 0.00 0.05 0.00 0.00 0.21 0.06 0.02
18-34
M 0.04 0.00 0.04 0.00 0.00 0.12 0.08 0.01
F 0.06 0.00 0.08 0.00 0.00 0.14 0.05 0.25
Total 0.06 0.00 0.07 0.00 0.00 0.13 0.06 0.18
35-49
M
F 0.03 0.00 0.07 0.00 0.00 0.09 0.02 0.31
Total 0.03 0.00 0.07 0.00 0.00 0.09 0.02 0.31
50-64
M
F 0.00 0.00 0.00 0.00 0.00 0.00 0.00 0.00
Total 0.00 0.00 0.00 0.00 0.00 0.00 0.00 0.00

2017 HEDIS/CAHPS REPORT
APPENDIX E | CHIP Measures, Frequencies and Population
page E-9TennCare 17.EQRO.06.017
Table E8. HEDIS 2017 Utilization Measures: CHIP—All Other Antibiotics Utilization
Age SexAverage Scripts PMPY for
Absorbable Sulfonamides
Amino-glycosides
1st Generation Cephalosporins
Linco-samides
Macrolides (not azith. or clarith.) Penicillins Tetra-
cyclinesMisc.
Antibiotics
65-74
M
F
Total
75-84
M
F
Total
85+
M 0.00 0.00 0.00 0.00 0.00 0.00 0.00 0.00
F
Total 0.00 0.00 0.00 0.00 0.00 0.00 0.00 0.00
Unknown
M
F
Total
Total
M 0.03 0.00 0.05 0.00 0.00 0.27 0.04 0.00
F 0.07 0.00 0.07 0.00 0.00 0.29 0.04 0.06
Total 0.05 0.00 0.06 0.00 0.00 0.28 0.04 0.03
Table E8. HEDIS 2017 Utilization Measures: CHIP—Standardize Healthcare-Associated Infection Ratio (HAI)
ClassificationPercentage of Total Discharges From Hospitals With SIRHigh Moderate Low Unavailable
HAI-1: Central line-associated blood stream infection (CLABSI) 0.55% 0.02% 0.30% 0.13%
HAI-2: Catheter-associated urinary tract infection (CAUTI) 0.30% 0.13% 0.48% 0.10%
HAI-5: MRSA bloodstream infection (MRSA) 0.21% 0.14% 0.42% 0.23%
HAI-6: Clostridium difficile intestinal infection (CDIFF) 0.44% 0.18% 0.29% 0.10%

2017 HEDIS/CAHPS REPORT
APPENDIX E | CHIP Measures, Frequencies and Population
page E-10TennCare 17.EQRO.06.017
Health Plan Descriptive Information Table E9. Board Certification (BCR)Type of Physician Board Certification PercentFamily Medicine 72.02%
Internal Medicine 69.82%
Pediatricians 80.99%
OB/GYN Physicians 75.41%
Geriatricians 71.43%
Other Physician Specialists 73.90%
HPA Population in CHIP Member MonthsTable E10. HPA CHIP Population in Member Months
AgeMember Months
Male Female Total<1 4304 3813 8,117
1-4 39825 37303 77,128
5-9 110499 106459 216,958
10-14 140569 134539 275,108
15-17 85425 82504 167,929
18-19 27202 29072 56,2740-19 Subtotal 407,824 393,690 801,5140-19 Subtotal: Percent 99.99% 88.87% 94.20%20-24 2 9944 9,94625-29 2 15605 15,60730-34 0 14106 14,10635-39 0 7558 7,55840-44 0 1931 1,93120-44 Subtotal 4 49,144 49,14820-44 Subtotal: Percent 0.00% 11.09% 5.78%

2017 HEDIS/CAHPS REPORT
APPENDIX E | CHIP Measures, Frequencies and Population
page E-11TennCare 17.EQRO.06.017
Table E10. HPA CHIP Population in Member Months
AgeMember Months
Male Female Total45-49 0 129 129
50-54 0 13 13
55-59 0 0 0
60-64 0 0 045-64 Subtotal 0 142 14245-64 Subtotal: Percent 0.00% 0.03% 0.02%65-69 0 0 0
70-74 0 0 0
75-79 0 0 0
80-84 0 0 0
85-89 0 0 0
>=90 48 0 48>=65 Subtotal 48 0 48>=65 Subtotal: Percent 0.01% 0.00% 0.01%Total 407,876 442,976 850,852

ATTACHMENT G
QUALITY IMPROVEMENT STRATEGY
Required by STC 42.c.
2017 UPDATE TO THE QUALITY ASSESSMENT AND PERFORMANCE IMPROVEMENT
STRATEGY

2
TABLE OF CONTENTS Acronyms .............................................................................................................................. 3 Section I: Introduction ............................................................................................................ 8 Managed Care Goals, Objectives, and Overview .............................................................................. 8 Strategy Goals and Objectives ........................................................................................................ 21 Development and Review of Quality Strategy ................................................................................ 39 Section II: Assessment .......................................................................................................... 40 Quality and Appropriateness of Care ............................................................................................. 40 National Performance Measures .................................................................................................... 44 Monitoring and Compliance ........................................................................................................... 48 External Quality Review.................................................................................................................. 57 State Requirements vs. NCQA Accreditation .................................................................................. 59 Section III: State Standards ................................................................................................... 70 Access Standards .................................................................................................................................. 70 Structure and Operations Standards .............................................................................................. 80 Measurement and Improvement Standards .................................................................................. 91 Section IV: Improvement and Interventions .......................................................................... 96 Interventions with Goals ................................................................................................................ 96 Other Interventions Affecting All Goals and Objectives ............................................................... 107 Intermediate Sanctions ................................................................................................................ 114 Health Information Technology .................................................................................................... 115 Section V: Delivery System Reforms .................................................................................... 116 Section VI: Conclusions and Opportunities .......................................................................... 121 Attachments: Attachment I: CRA Access Standards ........................................................................................... 127 Attachment II: Specialty Network Standards ................................................................................ 129 Attachment III: Access and Availability for Behavioral Health Services ........................................ 131 Attachment IV: Covered Benefits ................................................................................................. 135 Attachment V: Bridging Life & Health Gaps ..................................................................................... 153 Attachment VI: Public Comments ...................................................................................................... 169

3
Acronyms
AAAD Area Agency on Aging and Disability
AAP American Academy of Pediatrics
ACS Affiliated Computer Services Inc.
ADHD Attention Deficit Hyperactivity Disorder
ADT Admission, Discharge, Transfer
AI Audacious Inquiry
AIU Adopt, Implement, Upgrade
AQS Annual Quality Survey
ASH Abortion, Sterilization, Hysterectomy
ASO Administrative Services Only
BA Business Associate
BCBST BlueCross BlueShield of Tennessee
BHO Behavioral Health Organization
BMI Body Mass Index
CAHPS Consumer Assessment of Healthcare Providers and Systems
CAP Corrective Action Plan
CCM Chronic Care Management Group
CCT Care Coordination Tool
CD Consumer Direction
CDC Centers for Disease Control and Prevention
CFR Code of Federal Regulations
CHAT Children’s Hospital Alliance of Tennessee
CHCS Center for Health Care Strategies
CKM Clinical Knowledge Management
CLS Community Living Supports
CLS-FM Community Living Supports-Family Model
CM Case Management
CMS Centers for Medicare & Medicaid Services
COPD Chronic Obstructive Pulmonary Disease
CRA Contractor Risk Agreement
DBM Dental Benefits Manager
DD Developmental Disabilities

4
DIDD Department of Intellectual and Developmental Disabilities
D-SNPs Dual Eligible Special Needs Plans
DHS Department of Human Services
DM Disease Management
DME Durable Medical Equipment
ECF CHOICES Employment and Community First CHOICES
ED Emergency Department
EDI Electronic Data Interchange
EHR Electronic Health Record
EP Eligible Professional
EPLS Excluded Parties List System
EPSDT Early and Periodic Screening, Diagnostic and Treatment
EQR External Quality Review
EQRO External Quality Review Organization
ERC Enhanced Respiratory Care
EVV Electronic Visit Verification
FEA Fiscal Employer Agent
FHSC First Health Services Corporation
FFM Federally Facilitated Market
FFS Fee-For-Service
HCBS Home and Community-Based Services
HCFA Health Care Finance and Administration
HEDIS Healthcare Effectiveness Data and Information Set
HHA Home Health Agency
HIE Health Information Exchange
HIPAA Health Insurance Portability and Accountability Act
HIT Health Information Technology
HITECH Health Information Technology for Economic and Clinical Health
HHS Health and Human Services
HMO Health Maintenance Organization
HPE Hewlett Packard Enterprise
HRM Health Risk Management
IAM Identify Access Management
I/DD Intellectual and/or Developmental Disabilities

5
ICF/IID Immediate Care Facility for Individuals with Intellectual Disabilities
IDEA Individuals with Disabilities Education Act
IEP Individualized Education Plan
ISP Initial Support Plan
IUD Intrauterine Contraceptive Device
LARC Long Acting Removable Contraceptives
LEIE List of Excluded Individuals and Entities
LEP Limited English Proficiency
LOC Level of Care
LTC Long Term Care
LTSS Long Term Services and Supports
MCC Managed Care Contractor
MCO Managed Care Organization
MDM Master Data Management
MDS Minimum Data Set
MFP Money Follows the Person
MH Mental Health
MIPPA Medicare Improvements for Patients and Providers Act
MLTSS Medicaid Managed Long Term Services and Supports
MMIS Medicaid Management Information System
MRR Medical Record Review
MU Meaningful Use
NAS Neonatal Abstinence Syndrome
NASUAD National Association of States United for Aging and Disabilities
NCI National Core Indicators
NCI-AD National Core Indicators – Aging and Disabilities
NCQA National Committee for Quality Assurance
NDC National Drug Code
NEMT Non-Emergency Medical Transportation
NF Nursing Facility
NPI National Provider Identifier
OCR Office for Civil Rights
OeHI Office of eHealth Initiatives
OIG Office of Inspector General

6
ONC Office of the National Coordinator for Health Information Technology
ORR On Request Report
PA Performance Activity or Prior Authorization
PAE Pre-Admission Evaluation
PAHP Prepaid Ambulatory Health Plan
PASRR Preadmission Screening and Resident Review
PBM Pharmacy Benefits Manager
PCMH Patient Centered Medical Home
PCP Primary Care Provider
PCP Person-Centered Planning
PCSP Person-Centered Support Plan
PDV Provider Data Validation
PERS Personal Emergency Response Systems
PH Population Health
PHI Protected Health Information
PHIT Pediatric Healthcare Improvement Initiative for Tennessee
PIHP Prepaid Inpatient Health Plan
PIP Performance Improvement Project
PIPP Provider Incentive Payment Portal
PLHSO Prepaid Limited Health Services Organization
POC Plan of Care
QA Quality Assurance
QI Quality Improvement
QIA Quality Improvement Activity
QI/UM Quality Improvement/Utilization Management
QM/QI Quality Management/Quality Improvement
QMP Quality Management Program
QO Quality Oversight
QuILTSS Quality Improvement in Long Term Services and Supports
RCI Rapid Cycle Improvement
RFI Request for Information
RFP Request for Proposal
SED Serious Emotional Disturbance
SIM State Innovation Model (grant)

7
SOS System of Support
SPMI Serious and Persistent Mental Illness
SPOE Single Point of Entry
SSA Social Security Administration
SSI Supplemental Security Income
STORC Standard Obstetric Record Charting system
STC Special Terms and Conditions
STS Short-Term Stay
TAMHO Tennessee Association of Mental Health Organizations
TCS TennCare Select
TDCI Tennessee Department of Commerce and Insurance
TDMHSAS Tennessee Department of Mental Health and Substance Abuse Services
TEDS Tennessee Eligibility Determination System
TNAAP Tennessee Chapter of the American Academy of Pediatrics
TSPN Tennessee Suicide Prevention Network
UM Utilization Management
VLARC Long Acting Removable Contraceptives
WCAG Web Content Accessibility Guidelines
WCC Weight Assessment and Counseling for Nutrition and Physical Activity for
Children/Adolescents

8
SECTION I: INTRODUCTION Managed Care Goals, Objectives, and Overview
CMS Requirement: Include a brief history of the State’s Medicaid managed care programs. On January 1, 1994, Tennessee launched TennCare, a new health care reform program. This original TennCare waiver, TennCare I, essentially replaced the Medicaid program in Tennessee; Tennessee moved almost its entire Medicaid program into a managed care model. TennCare I was implemented as a five-year demonstration program and received several extensions after the initial waiver expiration date of December 30, 1999. The original TennCare design was extraordinarily ambitious. TennCare I extended coverage to large numbers of uninsured and uninsurable people, and almost all benefits were delivered by Managed Care Organizations (MCOs) of varying size, operating at full risk. Enrollees under the TennCare program are eligible to receive only those medical items and services that are within the scope of defined benefits for which the enrollee is eligible and determined by the TennCare program to be medically necessary. TennCare II, the demonstration program that started on July 1, 2002, revised the structure of the original program in several important ways. The program was divided into "TennCare Medicaid” and “TennCare Standard." TennCare Medicaid served Medicaid eligibles, while TennCare Standard served the demonstration population. When TennCare II began, several MCOs were either leaving the program or at risk of leaving the program due to their inability to maintain financial viability. A Stabilization Plan was introduced under TennCare II whereby the MCOs were temporarily removed from risk. Pharmacy benefits and dental benefits were carved out of the MCO scope of services, and new single benefit managers were selected for those services. Enrollment of demonstration eligibles was sharply curtailed, with new enrollment being open only to uninsurable persons with incomes below poverty and "Medicaid rollovers,” persons losing Medicaid eligibility who met the criteria for the demonstration population. In 2004, in the face of projections that TennCare’s growth would soon make it impossible for the state to meet its obligations in other critical areas, Governor Phil Bredesen proposed a TennCare Reform package to accomplish goals such as "rightsizing" program enrollment and reducing the dramatic growth in pharmacy spending. With approval from the Centers for Medicare & Medicaid Services (CMS), the state began implementing these modifications in 2005. On October 5, 2007, the waiver for the TennCare II extension was approved for three additional years. Subsequent extensions of the TennCare II managed care demonstration were approved in 2009 and 2013. The integration of behavioral health into the managed care model evolved from the TennCare I waiver. In 1996, behavioral health services were carved out and the Partner’s program was established whereby Behavioral Health Organizations (BHOs) contracted directly with TennCare to manage behavioral health services. A primary focus of the carve-out was to provide services for the priority population, a group that included adults with serious and persistent mental illness (SPMI) and children with serious emotional

9
disturbance (SED). TennCare began integrating behavioral and medical health care delivery for Middle Tennessee members in 2007 with the implementation of two expanded MCOs. TennCare continued the process with the implementation of new MCO contracts in West Tennessee in November 2008 and East Tennessee in January 2009. The transferring of behavioral health services to Volunteer State Health Plan of Tennessee for TennCare Select members completed TennCare’s phased-in implementation of a fully integrated service delivery system that works with health care providers, including doctors and hospitals, to ensure that TennCare members receive all of their medical and behavioral services in a coordinated and cost-effective manner. On July 22, 2009 TennCare received approval from CMS for a demonstration amendment to implement the CHOICES program outlined by the State’s Long-term Care and Community Choices Act of 2008. Under the CHOICES program the State provides community-based alternatives to people who would otherwise require Medicaid-reimbursed care in a Nursing Facility (NF), and to those at risk of Nursing Facility (NF) placement. The CHOICES program utilizes the existing Medicaid MCOs to provide eligible individuals with nursing facility services or home and community based services. Tennessee was one of the first states in the country to implement managed Medicaid long-term services and supports and in a manner that does not require enrollees to change their MCO. The CHOICES program was implemented in stages over time in different geographic areas of the state. The first phase of the CHOICES program was successfully implemented in Middle Tennessee on March 1, 2010, with the East and West Grand Region MCOs’ implementation occurring in August 2010. Also, in August 2010, the Statewide Home and Community Based Waiver for the Elderly and Disabled was terminated as it was no longer needed with full implementation of the CHOICES program. With implementation of the CHOICES program, the MCOs became responsible for coordination of all covered medical, behavioral, and long-term care services provided to their members, age 65 and older and adults age 21 and older with physical disabilities. Currently, the only remaining carve-out services are for dental and pharmacy services, as well as individuals with intellectual disabilities. Effective July 1, 2016, the Employment and Community First CHOICES program was added to the managed care demonstration. Employment and Community First CHOICES is an integrated managed long-term services and supports program that is specifically geared toward promoting and supporting integrated, competitive employment and independent, integrated community living as the first and preferred option for individuals with intellectual and development disabilities (I/DD). With the implementation of Employment and Community First CHOICES initially by Amerigroup and BlueCare, with UnitedHealthcare Community Plan joining on July 1, 2017, MCOs are responsible for coordination of all medical, behavioral, and LTSS provided to individuals with I/DD newly enrolling in HCBS under the new MLTSS program. Section 1915(c) waivers continue to be carved out of managed care, although individuals enrolled in those waivers are enrolled in managed care for their physical and behavioral health services. Members enrolled in a section 1915(c) waiver will have the opportunity to elect transition to the Employment and Community First CHOICES program at a future date.

10
The most recent extension of the TennCare demonstration waiver was approved by CMS in 2016, extending the life of the demonstration for five additional years under essentially the same terms and conditions (with minor modifications). Today, TennCare is a mature, data-driven managed care program with well-functioning component parts and a stable, established infrastructure that delivers high-quality care to many of the state’s most vulnerable citizens. In its current approval period, TennCare retains its commitment to the program’s core values, including broad access to care, improved health status of program participants, and cost effective use of resources.
MCO Contracting and Turnover Experience
Traditionally, MCOs, operating in the TennCare demonstration, have been "at risk." However, because of instability among some of the MCOs participating in TennCare, the "at risk" concept was replaced in July 2002 with an "administrative services only" arrangement. The state added its own MCO, TennCare Select, to serve as a backup if other plans failed or there was inadequate MCO capacity in any area of the state. TennCare Select also serves enrollees in specific populations such as foster children, children receiving Supplemental Security Income (SSI) benefits, and children receiving services in a nursing facility or an Intermediate Care Facility for Individuals with Intellectual Disabilities.
Maintaining MCO participation in Middle Tennessee has been a focus of the program over the years. During the 2006-2007 state fiscal year, one of the major TennCare priorities was recruiting well-run, well-capitalized MCOs to Middle Tennessee. In addition to bringing in new MCOs, TennCare wanted to establish a new service-delivery model – an integrated medical and behavioral health model. Another crucial factor in the implementation was structuring the MCOs' contracts to return the organizations to full financial risk. To meet these goals, the state conducted its first competitive procurement process for TennCare MCOs. TennCare secured contracts with two successful bidders. The two new MCOs "went live" on schedule on April 1, 2007. TennCare placed the managed care contracts for the East and West grand regions of the state up for competitive bid in January 2008. In April 2008, the state awarded the regional contracts to two companies in each region. The MCO contractors accepted full financial risk to participate in the program and the new contracts also established an integrated medical and behavioral health care system for members. The plans began serving West Tennessee members on November 1, 2008 and began serving East Tennessee members on January 1, 2009. In September 2009, behavioral health services for TennCare Select enrollees were transferred to BCBST.
For most of TennCare’s history, managed care organizations (MCOs) delivered services on a regional basis (e.g., East Tennessee, Middle Tennessee, and West Tennessee). On October 2, 2013, TennCare issued a Request for Proposals (RFP) for three organizations to furnish managed care services statewide to the TennCare population. The RFP required the winning bidders to provide physical health services, behavioral health services, and Long Term Services and Supports (LTSS) throughout the state, with actual service delivery to begin in Middle Tennessee on January 1, 2015, and in East and West Tennessee later that calendar year.
On December 16, 2013, TennCare announced that the winning proposals had been submitted by Amerigroup, BlueCare, and UnitedHealthcare Community Plan, the three companies that currently form TennCare’s managed care network. New contracts with these entities will last from January 1, 2014 through December 31, 2016 and contain options for five (5) one (1) year extensions.

11
Between 1994 and 2002, dental services were part of physical health services delivered by TennCare’s medical MCOs. Some MCOs chose to contract directly with dentists and operate their own dental networks, while others subcontracted their dental program to a Dental Benefits Manager (DBM). During this time, dentists did not participate in the TennCare program to the extent desired or anticipated by the State. Differences in the practice of dentistry versus medicine made participation in a managed care “medical” model a challenging business decision for dentists. Dentists complained of inefficiencies associated with participation in multiple MCOs relative to credentialing, authorization, billing, and reimbursement. Each MCO or its dental subcontractor negotiated dental reimbursement rates individually with dentists, and fees were a confidential, contractual matter. Most dentists only signed contracts with certain MCOs, which complicated efforts to ensure enrollee access. Effective October 2002, in an effort to strengthen dental provider networks and improve enrollee access to care, the State moved from a managed care medical model to a managed care dental model for administration of dental services. The dental benefit was removed (carved-out) from the MCOs. Definitive funding was allocated for the revamped dental program, and administration of the dental benefit was awarded to a single DBM following a competitive bid process. The dental contract was an Administrative Services Only (ASO) contract where the DBM was not financially “at risk” for delivery of dental care. The State paid the DBM an administrative fee for managing the dental benefit and covered expenditures associated with dental claims. In 2013, TennCare transitioned from an ASO contract to a partial risk bearing contract to reflect the maturation of the DBM model and to provide additional incentives for the DBM to improve quality of dental care while lowering costs.
The Dental carve-out model has proven to be beneficial for the State, enrollees, and providers. DBM administration has resulted in more streamlined administrative processes making the program more “dental” friendly for providers. Dentists sign one provider agreement, are subjected to one credentialing process, and are reimbursed on a fee-for-service basis using one approved maximum allowable dental fee schedule. A single DBM means there is one set of program policies, one provider agreement, one provider reference manual, one claims processor, and one organization responsible for all contract deliverables. State oversight of Medicaid dental services is simplified because TennCare is responsible for one DBM versus multiple MCOs delivering or subcontracting for dental care.
The DBM has also been responsible, among other things, for maintaining and managing an adequate statewide dental provider network, processing and paying claims, managing program data, conducting utilization management and utilization review, detecting fraud and abuse, as well as meeting utilization benchmarks or outreach efforts reasonably calculated to ensure participation of all children who have not received screenings.
As mentioned, the pharmacy program was carved out of the managed care plans in 2003 and transferred to a single Pharmacy Benefits Manager (PBM) payer system, which still remains in place today. The first PBM, Affiliated Computer Services (ACS), went into effect for the latter half of 2003 and established the preferred drug list. First Health Services Corporation (FHSC) became the PBM in 2004 and remained until 2008. SXC Health Solutions (which later became known as Catamaran) followed FHSC until 2013 at which time Magellan Medicaid Administration became the current PBM.
The largest drivers of change in pharmacy utilization since the carve-out came with a change in a federal Consent Decree in 2005 and establishment of the Medicare Part D program in 2006. These changes allowed TennCare to more effectively manage the pharmacy program and shifted most dual eligible members to a

12
Medicare drug plan.
Each enrollee has an MCO for his/her primary care, medical/surgical, mental health and substance abuse, and long-term services and supports and a Pharmacy Benefits Manager (PBM) for his/her pharmacy services. Children under the age of 21 and enrolled in the TennCare program are eligible for dental services, which are provided by a Dental Benefits Manager (DBM).
Population Description/Changes
All Medicaid and demonstration eligibles are enrolled in TennCare, including those are dually eligible for TennCare and Medicare. There are approximately 1.45 million persons currently enrolled in TennCare. There are several mechanisms for TennCare eligibility.
TennCare Medicaid serves Tennesseans who are eligible for a Medicaid program. Some of the groups TennCare Medicaid covers include:
Low income children under age 21
Women who are pregnant
Caretakers of a minor child
Individuals who need treatment for breast or cervical cancer
People who receive Supplemental Security Income (SSI).
People who have received both an SSI check and a Social Security check for the same month at least once since April 1977 AND who still receive a Social Security check
People who live in a nursing home and have income below $2,022 per month (300% of SSI benefit) OR receive other long-term care services that TennCare pays for
TennCare Standard is only available for children under age 19 who are losing their TennCare Medicaid AND lack access to group health insurance through their parents’ employer.
There are two ways these children can qualify and be able to keep their healthcare benefits: The Uninsured category is only available to children under age 19 whose TennCare Medicaid eligibility is ending, who do not have access to insurance through a job or a family member’s job, and whose family incomes are below 211% of the poverty level.
The Medically Eligible category is only available to children under age 19 whose TennCare Medicaid eligibility is ending and whose family income equals or is greater than 211% of the poverty level. To be medically eligible, the child must have health conditions that make the child “uninsurable” from a pre-Affordable Care Act perspective.
Coinsurance for some services is required for members with TennCare Standard if the family income is over ninety-nine percent (99%) of the poverty level.
TennCare Standard also includes a number of demonstration eligibility categories for individuals enrolled in CHOICES and in Employment Community First CHOICES.
CHOICES in Long-Term Services and Supports
In July 2009, CMS approved an amendment to the TennCare waiver that allows MCOs to coordinate all of the care a TennCare member needs, including medical, behavioral, and long-term services and supports for
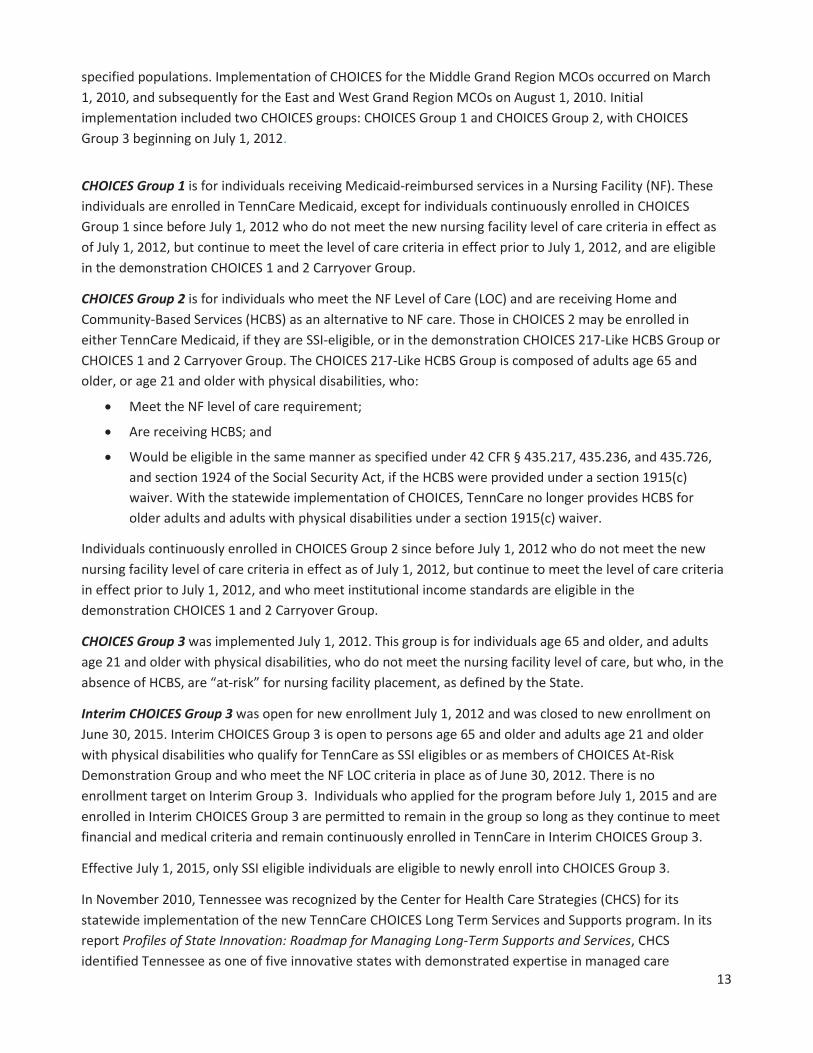
13
specified populations. Implementation of CHOICES for the Middle Grand Region MCOs occurred on March 1, 2010, and subsequently for the East and West Grand Region MCOs on August 1, 2010. Initial implementation included two CHOICES groups: CHOICES Group 1 and CHOICES Group 2, with CHOICES Group 3 beginning on July 1, 2012.
CHOICES Group 1 is for individuals receiving Medicaid-reimbursed services in a Nursing Facility (NF). These individuals are enrolled in TennCare Medicaid, except for individuals continuously enrolled in CHOICES Group 1 since before July 1, 2012 who do not meet the new nursing facility level of care criteria in effect as of July 1, 2012, but continue to meet the level of care criteria in effect prior to July 1, 2012, and are eligible in the demonstration CHOICES 1 and 2 Carryover Group.
CHOICES Group 2 is for individuals who meet the NF Level of Care (LOC) and are receiving Home and Community-Based Services (HCBS) as an alternative to NF care. Those in CHOICES 2 may be enrolled in either TennCare Medicaid, if they are SSI-eligible, or in the demonstration CHOICES 217-Like HCBS Group or CHOICES 1 and 2 Carryover Group. The CHOICES 217-Like HCBS Group is composed of adults age 65 and older, or age 21 and older with physical disabilities, who:
Meet the NF level of care requirement;
Are receiving HCBS; and
Would be eligible in the same manner as specified under 42 CFR § 435.217, 435.236, and 435.726, and section 1924 of the Social Security Act, if the HCBS were provided under a section 1915(c) waiver. With the statewide implementation of CHOICES, TennCare no longer provides HCBS for older adults and adults with physical disabilities under a section 1915(c) waiver.
Individuals continuously enrolled in CHOICES Group 2 since before July 1, 2012 who do not meet the new nursing facility level of care criteria in effect as of July 1, 2012, but continue to meet the level of care criteria in effect prior to July 1, 2012, and who meet institutional income standards are eligible in the demonstration CHOICES 1 and 2 Carryover Group.
CHOICES Group 3 was implemented July 1, 2012. This group is for individuals age 65 and older, and adults age 21 and older with physical disabilities, who do not meet the nursing facility level of care, but who, in the absence of HCBS, are “at-risk” for nursing facility placement, as defined by the State.
Interim CHOICES Group 3 was open for new enrollment July 1, 2012 and was closed to new enrollment on June 30, 2015. Interim CHOICES Group 3 is open to persons age 65 and older and adults age 21 and older with physical disabilities who qualify for TennCare as SSI eligibles or as members of CHOICES At-Risk Demonstration Group and who meet the NF LOC criteria in place as of June 30, 2012. There is no enrollment target on Interim Group 3. Individuals who applied for the program before July 1, 2015 and are enrolled in Interim CHOICES Group 3 are permitted to remain in the group so long as they continue to meet financial and medical criteria and remain continuously enrolled in TennCare in Interim CHOICES Group 3.
Effective July 1, 2015, only SSI eligible individuals are eligible to newly enroll into CHOICES Group 3.
In November 2010, Tennessee was recognized by the Center for Health Care Strategies (CHCS) for its statewide implementation of the new TennCare CHOICES Long Term Services and Supports program. In its report Profiles of State Innovation: Roadmap for Managing Long-Term Supports and Services, CHCS identified Tennessee as one of five innovative states with demonstrated expertise in managed care

14
approaches to long-term services and supports. Tennessee, along with Arizona, Hawaii, Texas and Wisconsin, was noted as a “true pioneer” in designing innovative approaches to delivering care to the elderly and adults with disabilities. Tennessee in particular was recognized for its open communication and collaboration with the public and stakeholders in designing and implementing the new program.
The key component of the CHOICES program is person-centered care coordination. The “whole person” care coordination approach includes:
Implementation of active transition and diversion programs for people who can be safely and effectively supported at home or in another integrated community setting outside the nursing home; and
Installation of an electronic visit verification system to monitor home care access, timeliness and quality through the use of GPS technology, and to immediately address potential gaps in care.
Other components of CHOICES include:
Consumer choice of service setting and providers
o Consumer-directed care options, including the ability to hire non-traditional providers like family members, friends, and neighbors with accountability for taxpayer funds.
o Broadening of residential care choices in the community beyond nursing facilities with options such as companion care, community living supports and adult “foster” family living arrangements and improved access to assisted care living facilities.
Simplified Process for Accessing Services
o Streamlining the eligibility process for faster service delivery and the enrollment process for new providers.
o Maintaining a single point of entry for people who are not on TennCare today and need access to long-term services and supports through Medicaid or other available programs.
o Efficient use of Medicaid funds to serve more people in cost-effective home and community settings.
Employment and Community First (ECF) CHOICES
In February 2016, CMS approved Amendment 27 to the TennCare demonstration that allows MCOs to coordinate HCBS (as well as medical and behavioral health services) for individuals with intellectual and developmental disabilities. Dental benefits provided under the ECF CHOICES program will be administered through the DBM. Statewide implementation of Employment and Community First CHOICES began on July 1, 2016. The program was implemented with a choice of only two MCOs: Amerigroup and BlueCare. A third MCO, UnitedHealthcare Community Plan, implemented ECF CHOICES on July 1, 2017.
Employment and Community First CHOICES is specifically designed to align financial incentives to support integrated competitive employment and independent, integrated community living as the first and preferred option for individuals with intellectual and developmental disabilities. The comprehensive array of employment supports, designed with technical assistance from subject matter experts with the federal Office of Disability Employment Policy creates a pathway to employment, even for individuals with significant disabilities, with many services reimbursed on an outcome-basis as that step along the employment pathway is complete. Other employment services are reimbursed in part on the provider’s performance on specified employment outcomes. Once sufficient data is available to establish further benchmarks for quality employment supports that lead to valued employment outcomes, (e.g., the # or %

15
of persons supported employed in individual employment in integrated settings, # hours worked/week, and the # or % of people employed earning a competitive wage) there will be additional implementation of value-based reimbursement strategies to incentivize employment provider use of best practices and attention to sustaining and improving individual outcomes.
The new ECF CHOICES program will demonstrate the following:
A tiered benefit structure based on the needs of individuals enrolled in the program allows the State to provide HCBS and other Medicaid services more cost-effectively so that more people who need HCBS can receive them. This includes people with intellectual disabilities who would otherwise be on the waiting list for a section 1915(c) waiver and people with other developmental disabilities who are not eligible for Tennessee’s current section 1915(c) waivers.
The development of a benefit structure and the alignment of financial incentives specifically geared toward promoting integrated competitive employment and integrated community living will result in improved employment and quality of life outcomes.
The quality assurance and continuous quality improvement structure for Employment and Community First CHOICES is unique in a number of ways. First, in addition to quality assurance and performance improvement activities performed by the MCOs, quality assurance monitoring and quality improvement activities will be conducted by TennCare. Second, TennCare has a contract with the Department of Intellectual and Development Disabilities (DIDD) to conduct quality monitoring surveys, on behalf of MCOs, for providers enrolled to deliver specified services in the Employment and Community First CHOICES program. While a Quality Assurance survey process has long been in place for the State’s Section 1915(c) waivers for individuals with ID, the Quality Monitoring survey process for Employment and Community First CHOICES has been uniquely designed to shift the focus from compliance monitoring to true quality monitoring and continuous quality improvement. This has been done in part because MCOs have roles related to compliance monitoring, accomplished through both on-going re-credentialing and provider contract monitoring. This allows the opportunity for Quality Monitoring to focus on authentic measures of quality, distinct from compliance. As part of this critical shift, a new quality monitoring evaluation tool for Employment and Community First CHOICES has been developed to define quality indicators that represent provider performance above minimum compliance expectations. The approach to scoring quality monitoring surveys further emphasizes and reinforces the program’s intentional focus on promoting employment and integrated community living by weighting domains focused on these outcomes. Finally, the results of the quality monitoring process are used to establish each provider’s preferred provider status, allowing members in the process of selecting specific providers to distinguish providers achieving higher levels of quality. Where providers score below a certain threshold, a quality improvement plan is required, with approval and monitoring of implementation being done by the MCOs that contract with the provider. Adjustments in scoring are also planned as provider longevity with the program increases, setting increasingly higher bars for providers to achieve each of the preferred provider categories. Employment and Community First CHOICES Quality Monitoring surveys are completed on site at provider agencies and include time spent with people receiving services, thereby obtaining invaluable information
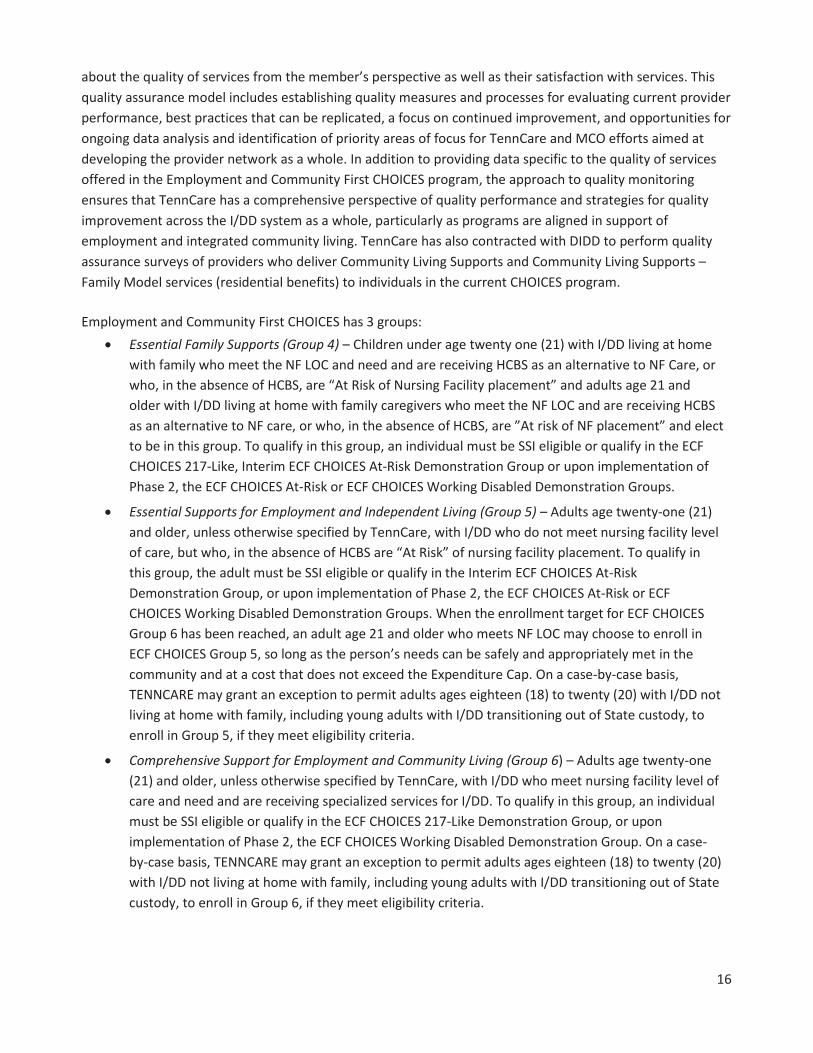
16
about the quality of services from the member’s perspective as well as their satisfaction with services. This quality assurance model includes establishing quality measures and processes for evaluating current provider performance, best practices that can be replicated, a focus on continued improvement, and opportunities for ongoing data analysis and identification of priority areas of focus for TennCare and MCO efforts aimed at developing the provider network as a whole. In addition to providing data specific to the quality of services offered in the Employment and Community First CHOICES program, the approach to quality monitoring ensures that TennCare has a comprehensive perspective of quality performance and strategies for quality improvement across the I/DD system as a whole, particularly as programs are aligned in support of employment and integrated community living. TennCare has also contracted with DIDD to perform quality assurance surveys of providers who deliver Community Living Supports and Community Living Supports – Family Model services (residential benefits) to individuals in the current CHOICES program. Employment and Community First CHOICES has 3 groups:
Essential Family Supports (Group 4) – Children under age twenty one (21) with I/DD living at home with family who meet the NF LOC and need and are receiving HCBS as an alternative to NF Care, or who, in the absence of HCBS, are “At Risk of Nursing Facility placement” and adults age 21 and older with I/DD living at home with family caregivers who meet the NF LOC and are receiving HCBS as an alternative to NF care, or who, in the absence of HCBS, are ”At risk of NF placement” and elect to be in this group. To qualify in this group, an individual must be SSI eligible or qualify in the ECF CHOICES 217-Like, Interim ECF CHOICES At-Risk Demonstration Group or upon implementation of Phase 2, the ECF CHOICES At-Risk or ECF CHOICES Working Disabled Demonstration Groups.
Essential Supports for Employment and Independent Living (Group 5) – Adults age twenty-one (21) and older, unless otherwise specified by TennCare, with I/DD who do not meet nursing facility level of care, but who, in the absence of HCBS are “At Risk” of nursing facility placement. To qualify in this group, the adult must be SSI eligible or qualify in the Interim ECF CHOICES At-Risk Demonstration Group, or upon implementation of Phase 2, the ECF CHOICES At-Risk or ECF CHOICES Working Disabled Demonstration Groups. When the enrollment target for ECF CHOICES Group 6 has been reached, an adult age 21 and older who meets NF LOC may choose to enroll in ECF CHOICES Group 5, so long as the person’s needs can be safely and appropriately met in the community and at a cost that does not exceed the Expenditure Cap. On a case-by-case basis, TENNCARE may grant an exception to permit adults ages eighteen (18) to twenty (20) with I/DD not living at home with family, including young adults with I/DD transitioning out of State custody, to enroll in Group 5, if they meet eligibility criteria.
Comprehensive Support for Employment and Community Living (Group 6) – Adults age twenty-one (21) and older, unless otherwise specified by TennCare, with I/DD who meet nursing facility level of care and need and are receiving specialized services for I/DD. To qualify in this group, an individual must be SSI eligible or qualify in the ECF CHOICES 217-Like Demonstration Group, or upon implementation of Phase 2, the ECF CHOICES Working Disabled Demonstration Group. On a case-by-case basis, TENNCARE may grant an exception to permit adults ages eighteen (18) to twenty (20) with I/DD not living at home with family, including young adults with I/DD transitioning out of State custody, to enroll in Group 6, if they meet eligibility criteria.

17
Evolution of Health Information Technology
TennCare continues to work to enhance accurate and timely data collection, analysis, and distribution. TennCare’s comprehensive information management strategy affects every aspect of Tennessee’s “Medicaid Enterprise,” from medical and eligibility policy to budget and financial accountability. The process of transforming from a traditional transaction-driven medical program to a health care monitoring and management organization recognizes the advantages of Tennessee’s unique, fully managed care framework and builds on the TennCare’s commitment to be a wise and efficient contractor of services, steward of public funds, and advocate for quality healthcare for all constituents. With guidance from TennCare’s Health care Informatics group, the State is revamping its data strategy to take into account changes in the Health Information Exchange (HIE) landscape. This includes taking steps to critically examine current data assets and design options to collect and analyze data, make better use of currently available encounter data via the State’s Medicaid Management Information System (MMIS), and target methods to distribute the resulting information in ways that are most streamlined and effective for providers through enhanced dashboards, web portals, and DIRECT Messaging. Examples of these efforts are outlined through the following ongoing projects:
Admission, Discharge, Transfer (ADT) feeds and Care Coordination Tools (CCT): Edifecs has developed a Clinical Knowledge Management (CKM) tool within the Edifecs Module to collect and standardize the hospital ADT feeds which will contain emergency room visits, inpatient admissions, and discharge information that will allow for follow-up care. The CCT will allow providers to coordinate their attributed patients’ care across primary and behavioral health providers. Subsequently, claims data will be populated with the HIE data to allow for a common risk score, identify gaps in care and present to providers a patient register (history, medications, etc.).
Quality Applications: These applications will allow TennCare to collect clinical quality data that cannot be acquired from processed medical billing claims. Ultimately, these Quality Apps will provide all payers, beginning with the State’s Medicaid participating MCOs, with the necessary information to reimburse providers for high quality health outcomes. Initially, Quality Applications will be based on a contractor-provided service that will support two innovation strategies: Episodes of Care and Long Term Services and Supports. As part of payment reform efforts within the Tennessee Health Care Innovation Initiative, these two strategies aim to increase the quality of care, reduce health care costs, and improve the health of Tennessee’s population. Episodes of Care Quality Applications will track certain quality measures for clinical encounters that are not included in medical billing claims data. LTSS Quality Applications will support the payment calculations, data aggregation, and quality measures for Nursing Facilities and Home and Community Based Services value-based purchasing initiatives.
Identify Access Management: This project will implement enterprise-wide Identify Access Management (IAM) for TennCare. This functionally is needed to ensure the privacy and security of patient clinical data and will be the standard for future TennCare applications. This is a security tool that automates user’s provisioning based upon roles based access.
Master Patient Index and Master Provider Directory: TennCare has contracted with Audacious Inquiry (AI) to implement a Master Data Management (MDM) module. This project will provide a data management tool that will enable TennCare to uniquely identify patients and providers through the use of MPI and Master Provider Directory.

18
Care Coordination Tool: Tennessee has developed a shared Care Coordination Tool that will allow providers participating in the Patient Centered Medical Home (PCMH) and Tennessee Health Link programs to be more successful in the state’s new payment models. The tool will identify and track the closure of gaps in care linked to quality measures. It will also allow providers to view their member panel and members’ risk scores, which will facilitate provider outreach to members with a higher likelihood of adverse health events. The tool will also enable users to see when one of their attributed members has had an admission, discharge, or transfer from a hospital, such as a visit to the emergency room, and track follow-up actions. The Care Coordination Tool was piloted with nine practices from across Tennessee in the summer of 2016. Based on feedback from providers, additional enhancements and customization were made to the tool prior to launch and additional enhancements have been scheduled for future releases. The Care Coordination Tool was rolled out to PCMH and Tennessee Health Link providers in February 2017. In 2018, the tool will be made available to additional Tennessee primary care providers who wish to participate in the State’s strategies.
Integration of Behavioral Health Services with Primary Care Services: This project is designed to provide an electronic holistic view of an enrollee’s care to providers and is currently in the developmental phase.
As an early leader in the work to develop digital health information capacity, Tennessee has built a comprehensive set of health information technology (HIT) and health information exchange (HIE) assets. One of these is the collective level of experience and lessons learned among stakeholders about fostering HIT and HIE innovation amidst evolving health systems, technology environments, and data priorities.
Both TennCare and the Office of eHealth Initiatives (OeHI) within Tennessee’s Health Care Finance and Administration Division play integral leadership roles in the promotion of statewide HIT/HIE. Given the interdependencies between Health Information Technology adoption and Health Information Exchange, efforts to administer Health Information Technology for Economic and Clinical Health (HITECH) Act programs in Tennessee are a highly integrated collaboration between TennCare and OeHI. These programs include the State HIE Cooperative agreement Program and the CMS Medicaid EHR Incentive Program. Strategies and activities are guided with input and active participation by an array of other state partners and stakeholders such as state government agencies, TennCare MCOs, health information organizations throughout the state, and provider associations. For example, to disseminate information about specific EHR Incentive Program features and policies, both TennCare and OeHI have conducted dedicated outreach to entities such as the Tennessee Medical Association, Tennessee Hospital Association, Tennessee Primary Care Association, the Children’s Hospital Alliance of Tennessee, and TennCare’s MCOs.
Additional examples of the evolution of Information Technology include the continued modularization of the Medicaid Management Information System (MMIS) and the Tennessee Eligibility Determination System (TEDS).
Medicaid Management Information System: Tennessee currently has a contract with Hewlett Packard Enterprise (HPE) to provide Facility Management services. Direction from the Centers for Medicare and Medicaid Services has encouraged states to pivot from large single vendor systems and contracts to a modular environment with multiple contracts. After careful consideration of the current environment in Tennessee and multiple ongoing projects, Tennessee has elected to continue the business relationship with HPE. Going forward, TennCare will determine functionality
19
that can be uncoupled and modularized. Examples of future modules are Program Integrity, Fee-For-Service (FFS) Claims, and Electronic Data Interchange (EDI). This approach allows an already highly modular Medicaid Enterprise to meet the objectives of CMS with the lowest amount of risk and greatest potential for success.
Tennessee Eligibility Determination System: The goal of the TEDS project is to modernize and enhance the State’s Medicaid and CHIP program eligibility determination system and processes through updated technology, as well as the eligibility appeals functions that protect and support the interests of the State’s citizens while complying with the requirements of federal law and regulations. TennCare envisions a client service model that is customer-centric, efficient, and effective and provides a customer friendly experience. Within this vision TennCare enrollees, excluding applicants for Supplement Security Income (SSI) benefits, who must continue to file applications through the Social Security Administration (SSA), will be able to file applications for services or benefits, as well as report changes through an online process. Most required materials and verification documents will be scanned and stored electronically within the electronic case record. Whenever possible, verification of required information will be captured electronically through a web-based service and updated automatically in the electronic case record. Workers or automated processes will review applications and send additional questions or request additional documentation electronically or through print media to communicate with customers.
CMS Requirement: Include an overview of the quality management structure that is in place at the state level. TennCare’s commitment to quality and continuous improvement in the lives of Tennesseans are reflected in its Vision and Mission Statements:
Vision Statement: “A healthier Tennessee”
Mission Statement: “Improving lives through high-quality cost-effective care.”
Core Values:
Commitment: Ensuring that Tennessee taxpayers receive value for their tax dollars Agility: Be nimble when situations require change Respect: Treat everyone as we would like to be treated Integrity: Be truthful and accurate New Approaches: Identify innovative solutions Great customer service: Exceed expectations
All quality improvement activities are consistent with the “three aims” outlined in the National Quality Strategy for better care, healthy people/healthy communities, and affordable care. Wendy Long, M.D. is the Deputy Commisioner for Health Care Finance and Administration and Director of the TennCare Division for the State of Tennessee. The Chief Medical Officer for TennCare, Victor Wu, M.D., M.P.H, reports to Director Long and in turn provides supervision for the Quality Oversight, Pharmacy, Dental, Provider Services, and Medical Appeals divisions of TennCare. The Division of Quality Oversight is led by Vickie Duncan and is comprised of a staff of 22 individuals.
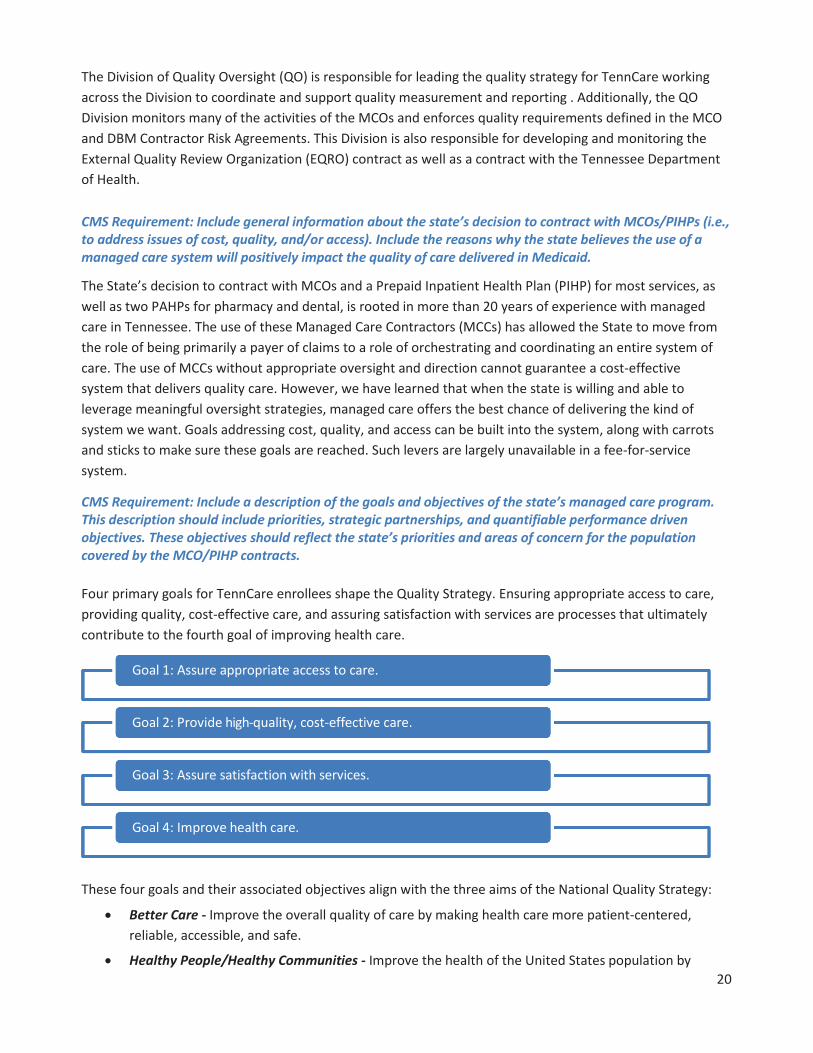
20
The Division of Quality Oversight (QO) is responsible for leading the quality strategy for TennCare working across the Division to coordinate and support quality measurement and reporting . Additionally, the QO Division monitors many of the activities of the MCOs and enforces quality requirements defined in the MCO and DBM Contractor Risk Agreements. This Division is also responsible for developing and monitoring the External Quality Review Organization (EQRO) contract as well as a contract with the Tennessee Department of Health. CMS Requirement: Include general information about the state’s decision to contract with MCOs/PIHPs (i.e., to address issues of cost, quality, and/or access). Include the reasons why the state believes the use of a managed care system will positively impact the quality of care delivered in Medicaid.
The State’s decision to contract with MCOs and a Prepaid Inpatient Health Plan (PIHP) for most services, as well as two PAHPs for pharmacy and dental, is rooted in more than 20 years of experience with managed care in Tennessee. The use of these Managed Care Contractors (MCCs) has allowed the State to move from the role of being primarily a payer of claims to a role of orchestrating and coordinating an entire system of care. The use of MCCs without appropriate oversight and direction cannot guarantee a cost-effective system that delivers quality care. However, we have learned that when the state is willing and able to leverage meaningful oversight strategies, managed care offers the best chance of delivering the kind of system we want. Goals addressing cost, quality, and access can be built into the system, along with carrots and sticks to make sure these goals are reached. Such levers are largely unavailable in a fee-for-service system.
CMS Requirement: Include a description of the goals and objectives of the state’s managed care program. This description should include priorities, strategic partnerships, and quantifiable performance driven objectives. These objectives should reflect the state’s priorities and areas of concern for the population covered by the MCO/PIHP contracts. Four primary goals for TennCare enrollees shape the Quality Strategy. Ensuring appropriate access to care, providing quality, cost-effective care, and assuring satisfaction with services are processes that ultimately contribute to the fourth goal of improving health care.
These four goals and their associated objectives align with the three aims of the National Quality Strategy:
Better Care - Improve the overall quality of care by making health care more patient-centered, reliable, accessible, and safe.
Healthy People/Healthy Communities - Improve the health of the United States population by
Goal 1: Assure appropriate access to care.
Goal 2: Provide high-quality, cost-effective care.
Goal 3: Assure satisfaction with services.
Goal 4: Improve health care.

21
supporting proven interventions to address behavioral, social, and environmental determinants of health in addition to delivering higher-quality care.
Affordable Care - Reduce the cost of quality health care for individuals, families, employers, and government.
Progress toward these four goals is gauged by physical health, behavioral health, long term services and support performance measures. The objectives are drawn from nationally recognized and respected measure sets. Many of the strategy objectives are statewide weighted Healthcare Effectiveness Data and Information Set (HEDIS) rates or statewide average Consumer Assessment of Healthcare Providers and Systems (CAHPS) rates. The MCOs annually complete and submit all applicable HEDIS measures designated by the National Committee for Quality Assurance (NCQA) as relevant to Medicaid. The MCOs are required to contract with an NCQA-certified HEDIS auditor that validates the processes of the health plan in accordance with NCQA requirements. In addition, they annually conduct CAHPS surveys (adult survey, child survey, and children with chronic conditions survey) using an NCQA-certified CAHPS survey vendor.
Strategy Goals and Objectives
The tables below present the Quality Strategy goals and objectives established by the State for physical and behavioral health as well as Long Term Services and Supports.
Physical and Behavioral Health Goals
Goal 1: Assure appropriate access to care for enrollees
Objective 1.1: The CMS-416 EPSDT screening rate will show incremental improvement through 2019 and beyond, bringing the statewide rate to the CMS standard of 80% in the coming years.
A particular focus will be on adolescent screenings, with a goal of improving the statewide HEDIS rate for adolescent well-care visits from 42.3% to the national median of 48.4%.
Data Sources: HEDIS/CAHPS Report: A Comparative Analysis of Audited Results from TennCare MCOs and CMC-416
Objective 1.2: TennCare will establish and begin monitoring travel time standards to augment existing travel distance standards for primary care (adult and pediatric), OB/GYN, behavioral health, specialist (adult and pediatric), hospital, pharmacy, and pediatric dental networks.
By 2019, each managed care plan will have achieved 100% compliance or have an approved corrective action plan on file.
Data Source: TennCare Provider Services
Objective 1.3: By 2019, at least 35% of TennCare members will be cared for through a Patient Centered Medical Home (PCMH) model.
By 2019, PCMH family practices, pediatric practices, and adult-only practices will be measured on 17, 10, and 8, quality metrics, respectively, and providers will be given quarterly updates on how their performance compares to their peers statewide.
Data Source: TennCare Strategic Planning and Innovation Group

22
Goal 2: Provide quality care to enrollees
Objective 2.1: By 2019, statewide HEDIS rates for timeliness of prenatal care, frequency of ongoing prenatal care ( 81% of expected visits), and postpartum care will improve to the national medians:
timeliness of prenatal care: from 76.34% to 85.19%
frequency of prenatal care ( 81%): from 55.51% to 59.49%
postpartum care: from 55.57% to 62.77%
Data Source: HEDIS/ CAHPS Report: A Comparative Analysis of Audited Results from TennCare MCOs.
Objective 2.2: By 2019, TennCare will have designed 66 Episodes of Care, which are acute or specialist-driven health care events with a specified duration to treat physical or behavioral health conditions.
By 2019, every Episode of Care will have a minimum of two quality metrics, and providers will be given quarterly updates on how their performance compares to their peers statewide.
Data Source: TennCare Strategic Planning and Innovation Group
Objective 2.3: Through 2019, the number of TennCare members enrolled in the Tennessee Health Link program for members with the highest behavioral health needs will remain at least 60,000 members each month.
By 2019, Health Link practices will be measured on 19 quality metrics, and providers will be given quarterly updates on how their performance compares to their peers statewide.
Data Source: TennCare Behavioral Health enrollment data
Objective 2.4: By 2019, statewide HEDIS rates for the following child and adolescent immunization measures will improve to the national medians:
MMR: from 88.46% to 90.93%
Combo 1 (Meningococcal and Tdap/Td) : from 67.13% to 73.15%
Influenza: from 42.86% to 51.34%
Data Source: HEDIS/ CAHPS Report: A Comparative Analysis of Audited Results from TennCare MCOs.
Goal 3: Assure enrollees' satisfaction with services.
Objective 3.1: Through 2019, the number of TennCare enrollees who expressed satisfaction with TennCare will remain at least 95%.
Data source: The Impact of TennCare: A Survey of Recipients.
Objective 3.2: Through 2019, the statewide average for CAHPS measures Getting Needed Care (responding “Always” or “Usually”) will remain above the national benchmarks of 80.82% for the adult Medicaid population and 84.39% for the child Medicaid population.
Data Source: HEDIS/ CAHPS Report: A Comparative Analysis of Audited Results from TennCare MCOs.

23
Goal 4: Improve health care for program enrollees.
Objective 4.1: By 2019, the statewide HEDIS rates related to child and adolescent weight management will improve as follows:
BMI percentile documentation will improve from 69.55% to the national 75th percentile of 77.98% Counseling for nutrition will improve from 60.29% to the national median of 61.44% Counseling for physical activity will improve from 53.59% to the national median of 53.89%.
Data Source: HEDIS/ CAHPS Report: A Comparative Analysis of Audited Results from TennCare MCOs.
Objective 4.2: TennCare members will show improvement across the following Population Health outcome measures:
Emergency department visits per 1000 members: improve from 770 in CY 2015 to 600 in CY 2018.
Readmissions (within 30 days) per 100 members: improve from 13.1 in CY 2015 to 11.6 in CY 2018
NICU babies: improve from 8,877 in CY 2015 to 8,250 in CY 2018; average length of stay will remain less than 14 days
End stage renal disease per 100 members with diabetes: improve from 7.7 in CY 2015 to 7.3 in CY 2018.
Data Source: TennCare Informatics Population Health Outcome Measures
Long-Term Services and Supports
Performance measures in the Quality Strategy specific to CHOICES were initially established based on certain section 1915(c) waiver assurances and sub-assurances, including level of care, service plan, qualified providers, health and welfare, administrative authority, and participant rights. The table below reflects these core domains and performance measures and how TennCare monitors each under the 1115 waiver authority to ensure prompt remediation of individual findings and promote system improvements in the managed long-term services and supports delivery system. Additional measures were added for 2014 in anticipation of new standardized MLTSS program measures under development by NCQA. Beginning with the baseline year for Employment and Community First CHOICES in 2017, some of these measures will also be applied to the Employment and Community First CHOICES population (with separate sampling and reporting). In addition, one measure is added that is specific to Employment and Community First CHOICES.

24
Long-Term Services and Supports Goals
Goal 1: CHOICES and Employment and Community First CHOICES members have a level of care determination indicating the need for institutional services or being “At-Risk” for institutional placement, as applicable, prior to enrollment in CHOICES or Employment and Community First
CHOICES, as applicable, and receipt of Medicaid-reimbursed HCBS.
Domain Performance Measure Measurement Method Level of Care
Number and percent of CHOICES Employment and Community First CHOICES members who had an approved CHOICES Pre-Admission Evaluation (i.e., nursing facility or At-Risk level of care eligibility, as applicable) prior to enrollment in CHOICES or Employment and Community First CHOICES and receipt of Medicaid-reimbursed HCBS.
Data Source: MMIS report Sampling Approach: 100% of all CHOICES and Employment and Community First CHOICES members enrolled Frequency: Quarterly Remediation: TennCare is responsible for quarterly reports and review/analysis of data, as well as remediation of individual findings.
Goal 2: CHOICES members are offered a choice between institutional (NF) services and HCBS.
Domain Performance Measure Measurement Method Service Plan
Number and percent of CHOICES Group 2 member records reviewed with an appropriately completed and signed freedom of choice form that specifies choice was offered between institutional services and HCBS.
Data Source: Member record review Sampling Approach: Stratified, with strata comprised of CHOICES Group 2 members enrolled in each of the MCOs per region serving the CHOICES Group 2 population. The sample population for both the New Member and Referral audits are drawn based on the total number of newly enrolled CHOICES members for the review period. Specifically, the New Member audit examines members who are new to both TennCare and CHOICES, and the Referral audit examines existing TennCare members who are new to CHOICES. Sample size for each audit is based on a 10% margin of error, 90% confidence interval and the response distribution of the previous audit. Frequency: Semi-annually Remediation: TennCare is responsible for semi-annual member record review and review/analysis of data. MCO will be responsible for remediation of individual findings with review/validation by TennCare.

25
Goal 3: LTSS Assessment Composite
Domain Performance Measure Measurement Method Service Plan
Number and percent of CHOICES Group 2 and 3 and Employment and Community First CHOICES members reviewed for whom an assessment, including key elements specified in the CRA or by TennCare protocol, was completed within the timeframes specified in the Contractor Risk Agreement.
Data Source: Member Record Review Sampling Approach: Stratified, with strata comprised of CHOICES Groups 2 and 3 and Employment and Community First CHOICES members enrolled in each of the MCOs per region serving the CHOICES and/or Employment and Community First CHOICES population. A 95% confidence interval will be achieved. Any records used previously in a semi-annual audit will be excluded. Frequency: Annually in October Remediation: TennCare is responsible for annual member record reviews and review/analysis of data. MCOs will be responsible for remediation of individual findings with review/validation by TennCare.
Goal 4: LTSS Person Centered Support Plan Composite
Domain Performance Measure Measurement Method Service Plan
Number and percent of CHOICES Group 2 and 3 and Employment and Community First CHOICES member records reviewed in which a PCSP, was developed as specified by the Contractor Risk Agreement or by TennCare protocol.
Data Source: Member Record Review Sampling Approach: Stratified, with strata comprised of CHOICES Groups 2 and 3 and Employment and Community First CHOICES members enrolled in each of the MCOs per region serving the CHOICES and/or Employment and Community First HCBS population. A 95% confidence interval will be achieved. Any records used previously in a semi-annual audit will be excluded. Frequency: Annually in October Remediation: TennCare is responsible for annual member record reviews and review/analysis of data. MCOs will be responsible for remediation of individual findings with review/validation by TennCare.

26
Goal 5: Plans of Care are reviewed/updated at least annually. Domain Performance Measure Measurement Method Service Plan
Number and percent of CHOICES Groups 2 and 3 and Employment and Community First CHOICES member records reviewed in which the PCSPs were reviewed and updated prior to the member’s annual review data.
Data Source: Member record review Sampling Approach: Stratified, with strata comprised of CHOICES Group 2 and 3 and Employment and Community First members enrolled in each of the MCOs per region serving the CHOICES and/or Employment and Community First CHOICES HCBS population. A 95% confidence interval will be achieved. Any records used previously in a semi-annual audit will be excluded. Frequency: Annually in October Remediation: TennCare is responsible for annual member record review and review/ analysis of data. MCOs will be responsible for remediation of individual findings with review/validation by TennCare.
Goal 6: Plans of Care reflect member goals, needs and preferences.
Domain Performance Measures Measurement Method Service Plan
Number and percent of CHOICES Groups 2 and 3 and Employment and Community First CHOICES member records reviewed whose PCSPs clearly identify the member’s goals, needs and preferences and include services and supports that are consistent with the member’s goals, needs and preferences.
Data Source: Member record review Sampling Approach: Stratified, with strata comprised of CHOICES Group 2 and 3 and Employment and Community First CHOICES members enrolled in each of the MCOs per region servicing the CHOICES and/or Employment and Community First CHOICES HCBS population. A 95% confidence interval will be achieved. Any records used previously in a semi-annual audit will be excluded. Frequency: Annually in October Remediation: Tenncare is responsible for annual member record review and review/analysis of data. MCOs will be responsible for remediation of individual findings with review/validation by TennCare.

27
Goal 7: Employment and Community First CHOICES members of working age participate in an employment informed choice process to help them understand and explore individual integrated employment and self-employment options.
Domain Performance Measure Measurement Method Service Plan
Number and percent of Employment and Community First CHOICES member records reviewed in which there is signed documentation that indicates the employment informed choice process was completed for individuals needing community integrated supports and/or independent living skills training services, or that employment services were authorized and initiated concurrently with community integrated supports and/or independent living skills training services.
Data Source: Member record review Sampling Approach: Employment and Community First CHOICES members enrolled in each of the MCOs per region serving the population. The sample population for the Employment Informed Choice audit is drawn based on the total number of Employment and Community First CHOICES working-age members who are not currently working or receiving employment supports and are eligible for, and want to receive, Community Integration Support Services and/or Independent Living Skills Training services. Sample size for the audit is based on a 10% margin of error, 90% confidence interval and the response distribution of the previous audit.
Frequency: Semi-annually Remediation: TennCare is responsible for semi-annual record review and review/analysis of data. MCOs will be responsible for remediation of individual findings with review/validation by TennCare.
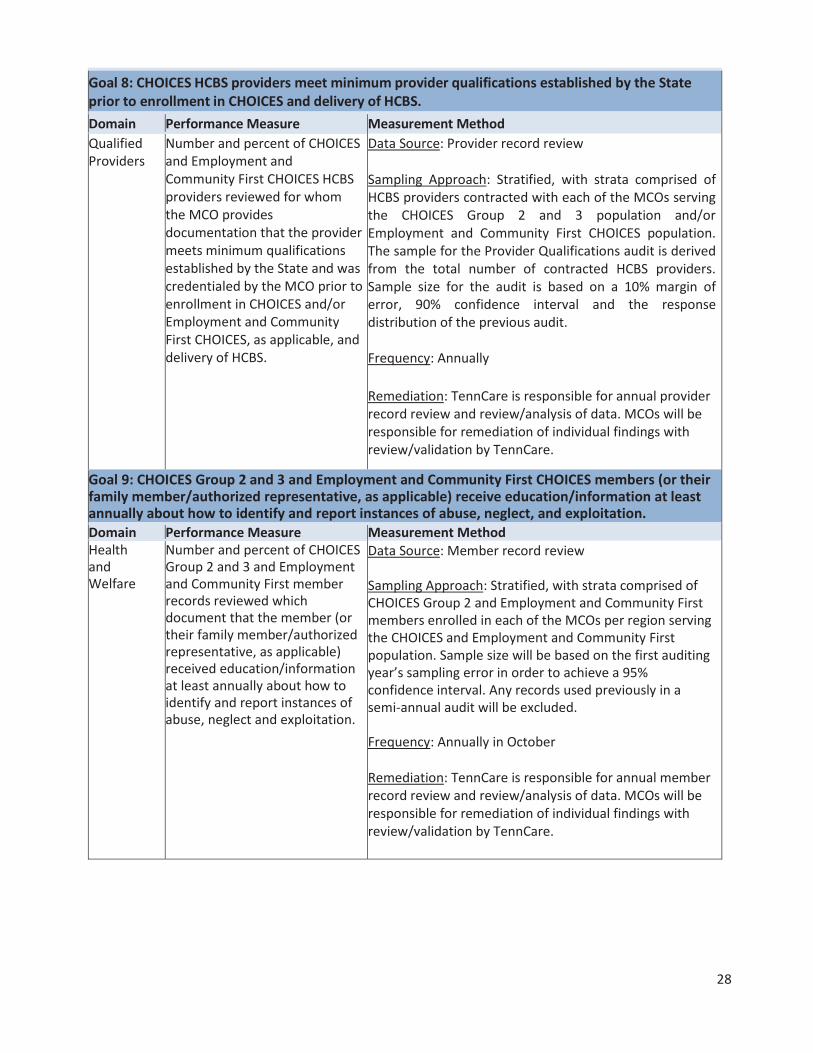
28
Goal 8: CHOICES HCBS providers meet minimum provider qualifications established by the State prior to enrollment in CHOICES and delivery of HCBS. Domain Performance Measure Measurement Method Qualified Providers
Number and percent of CHOICES and Employment and Community First CHOICES HCBS providers reviewed for whom the MCO provides documentation that the provider meets minimum qualifications established by the State and was credentialed by the MCO prior to enrollment in CHOICES and/or Employment and Community First CHOICES, as applicable, and delivery of HCBS.
Data Source: Provider record review Sampling Approach: Stratified, with strata comprised of HCBS providers contracted with each of the MCOs serving the CHOICES Group 2 and 3 population and/or Employment and Community First CHOICES population. The sample for the Provider Qualifications audit is derived from the total number of contracted HCBS providers. Sample size for the audit is based on a 10% margin of error, 90% confidence interval and the response distribution of the previous audit. Frequency: Annually Remediation: TennCare is responsible for annual provider record review and review/analysis of data. MCOs will be responsible for remediation of individual findings with review/validation by TennCare.
Goal 9: CHOICES Group 2 and 3 and Employment and Community First CHOICES members (or their family member/authorized representative, as applicable) receive education/information at least annually about how to identify and report instances of abuse, neglect, and exploitation. Domain Performance Measure Measurement Method Health and Welfare
Number and percent of CHOICES Group 2 and 3 and Employment and Community First member records reviewed which document that the member (or their family member/authorized representative, as applicable) received education/information at least annually about how to identify and report instances of abuse, neglect and exploitation.
Data Source: Member record review Sampling Approach: Stratified, with strata comprised of CHOICES Group 2 and Employment and Community First members enrolled in each of the MCOs per region serving the CHOICES and Employment and Community First population. Sample size will be based on the first auditing year’s sampling error in order to achieve a 95% confidence interval. Any records used previously in a semi-annual audit will be excluded. Frequency: Annually in October Remediation: TennCare is responsible for annual member record review and review/analysis of data. MCOs will be responsible for remediation of individual findings with review/validation by TennCare.

29
Goal 10: Critical incidents are reported within timeframes specified in the Contractor Risk Agreement. Domain Performance Measure Measurement Method Health and Welfare
Number and percent of critical incident records reviewed in which the incident was reported within timeframes specified in the Contractor Risk Agreement.
Data Source: Sample record review Sampling Approach: Stratified, with strata comprised of reported incidents for CHOICES Group 2 and 3 and Employment and Community First CHOICES members enrolled in each of the MCOs per region. For CHOICES, sample size will be based on the first auditing year’s sampling error in order to achieve a 95% confidence interval. In the first year of Employment and Community First CHOICES, sample size will consist of all records, up to 25 per stratum. For following years, of Employment and Community First CHOICES, the sample size will be based on the first auditing year’s sampling error in order to achieve a 95% confidence interval. Frequency: Semi-annually Remediation: TennCare is responsible for semi-annual record review and review/analysis of data. MCOs will be responsible for remediation of individual findings with review/validation by TennCare.
Goal 11: CHOICES and Employment and Community First CHOICES members are informed of and afforded the right to request a Fair Hearing when services are denied, reduced, suspended, or terminated. Domain Performance Measure Measurement Method Participant Rights
Number and percent of CHOICES Group 2 and 3 and Employment and Community First member records reviewed in which HCBS were denied, reduced, suspended, or terminated as evidenced in the PCSP (as applicable) and, consequently, member was informed of and afforded the right to request a Fair Hearing as determined by the presence of a notice of action.
Data Source: Member record review Sampling Approach: Stratified, with strata comprised of reported incidents for CHOICES Group 2 and 3 and Employment and Community First members enrolled in each of the MCOs per region serving the CHOICES and Employment and Community First CHOICES HCBS population. Sample size will be a subset of the sample used in Sub-Assurance 2. Frequency: Semi-annually in April and October Remediation: TennCare is responsible for semi-annual record review and review/analysis of data. MCOs will be responsible for remediation of individual findings with review/validation by TennCare.

30
In addition to the preceding measures and as detailed herein, TennCare’s LTSS Division has an established quality monitoring system to monitor the quality and appropriateness of care delivered to its members in the CHOICES and ECF CHOICES programs that meets the new requirements for managed long-term services and supports quality assessment and performance improvement in the Medicaid Managed Care Rule included in 42 C.F.R. § 438.330. Specifically, TennCare’s LTSS Division has been engaging in monitoring MCO performance based on specified measures that align with the Medicaid Managed Care Rule requirements as explained below in the narrative and in the chart following the narrative: (1) Assessing care between settings; (2) Comparing services and supports with those in the member’s plan; (3) Incorporating MCOs into efforts to prevent, detect, and remediate critical incidents; (4) and assessing member quality of life, rebalancing, and community integration activities. To measure and act on member care when members transition between settings – meaning members transitioning from institutional to community settings, transitioning to specific types of community-based residential alternatives regardless of whether the member is coming from an institutional or community setting, or transitioning from the community to an institutional setting – TennCare monitors these transitions through a variety of MCO deliverables. These deliverables include the Quarterly CHOICES and ECF CHOICES Nursing Facility and Intermediate Care Facility for Individuals with Intellectual and Developmental Disabilities Transition Report. The Monthly Nursing Facility Short-Term Stay Report, the Quarterly Housing Profile Assessment Report (which monitors the housing needs of CHOICES and ECF CHOICES members pre and post-housing transition, and includes information on transition wait times, transition barriers, monthly income amounts, housing options chosen, counties chosen for transition, and methods of funding, including subsidies and grants). The Quarterly reports on the State’s Community Living Supports and Community Living Supports-Family Model benefits provide information on individuals who have transitioned in and out of residential benefits or had hospital admissions while receiving the benefit. TennCare also contracts with the Area Agencies on Aging and Disability to provide Ombudsman services to individuals referred for and/or receiving CLS and CLS-FM services. An Ombudsman meets face-to-face with each member to offer advocacy and support, provide education regarding their rights (including choice) and the identification and prevention of abuse, neglect, and/or financial exploitation, and assist members in the resolution of complaints relating to CLS. Quarterly reports from the AAADs to TennCare summarize their ongoing Ombudsman activities, including complaints and resolutions. To compare services and supports with the members’ plan, in both the CHOICES and ECF CHOICES programs, the State receives Monthly Late and Missed Visit Reports, Quarterly Care and Support Coordination Reports, and Monthly Utilization Reports prepared by TennCare’s MCOs. TennCare’s LTSS Division reviews these reports to determine if there are gaps in service provision, that service initiation of authorized services occurs timely, and that utilization reports are consistent with the services authorized in members' plans. Timely initiation of services in accordance with a member’s service plan is also part of TennCare new member and referral audits. To incorporate MCOs into efforts to prevent, detect, and remediate critical incidents in CHOICES and reportable events in ECF CHOICES, TennCare LTSS has clearly defined critical incidents and reportable events in the CRA, established timelines for reporting and investigation, and requires MCOs to maintain effective systems for identification, reporting, and management. MCOs are required to train staff and providers on critical incidents, identify and track critical incidents/reportable events and review and analyze critical incidents/reportable events to identify and address potential and actual quality of care and/or health and safety issues. MCOs regularly review the number and types of incidents/events, identify trends and patterns; identify opportunities for improvement; and develop and implement strategies to reduce the occurrence of incidents/events and improve the quality of

31
CHOICES and ECF CHOICES HCBS, and provide reports to TennCare of their monitoring activities. TennCare’s Critical Incident Audit addresses MCO determination, documentation, responsiveness, and investigation of critical incidents/reportable events within specified timeframes, and addresses the systemic response to patterns of incidents. To measure and assess member quality of life, TennCare relies on both MCO reports and reports from other contracted entities. In terms of collecting data on member quality from the MCOs, TennCare LTSS receives Quarterly Point of Service Satisfaction Reports for CHOICES and ECF CHOICES, which provide member satisfaction data entered directly and recorded in electronic visit verification systems. Additionally, at each member’s annual visit, a Care or Support Coordinator will conduct the Individual Experience Assessment; a tool developed using the Exploratory Questions developed by CMS as part of the toolkit for implementing the HCBS Settings Rule. This data is entered into an electronic system that TennCare can use to aggregate and analyze data by health plan, and by provider. Finally, TennCare contracts with the State’s nine Area Agencies on Aging and Disability to conduct the NCI-AD survey for its CHOICES members, and provides MCO-specific feedback on member quality of life to MCOs based on the results of this survey. The NCI will be used for individuals enrolled in ECF CHOICES with a similar oversampling approach in order to compare health plan performance. To assess rebalancing efforts in the State, TennCare LTSS reviews the MCO-provided Semi-Annual Nursing Facility Diversion Report for CHOICES and ECF CHOICES, which includes narrative explanations from each MCO of their efforts and successes at delaying or preventing nursing facility placement for members wishing to remain in the community. Each MCO is further provided the opportunity to state systematic barriers for TennCare’s attention so the State can continue to increase community living for members in choosing this option. Additionally, TennCare MCOs submit a Monthly Money Follows the Person Participants Report, which includes information on all CHOICES and ECF CHOICES members participating in Money Follows the Person, and further includes information on their Qualified Residence, the date of their last coordination visit, and any inpatient stays such members have experienced during the reporting period. Lastly, the baseline data MCOs set forth for CHOICES and ECF CHOICES include clear performance measures pertaining to system balancing that are tracked at program implementation and on an ongoing basis. Finally, to assess community integration, TennCare LTSS and TennCare MCOs receive data on community integration for CHOICES members through survey results in the NCI-AD. For members in ECF CHOICES, TennCare LTSS will receive this data through survey results in the NCI, and through responses to the Individual Experience Assessment. As noted above, the Individual Experience Assessment is a tool developed using the Exploratory Questions developed by CMS as part of the toolkit for implementing the HCBS Settings Rule. The data is entered into an electronic system that TennCare can use to aggregate and analyze data by health plan, and by provider. TennCare LTSS and TennCare MCOs also receive data on community integration for ECF CHOICES members through a Monthly ECF CHOICES Employment Report, which includes information on the number of ECF CHOICES members who are actively seeking or actively engaged in competitive, integrated employment, along with a stratification of wages and job types.

32
CMS Quality Requirement Current TennCare Performance Measurement
Approach
Assessing care between settings
Quarterly CHOICES and ECF CHOICES Nursing Facility and Intermediate Care Facility for Individual with Intellectual and Developmental Disabilities Transition Report
Monthly Nursing Facility Short-Term Stay Report
Quarterly Housing Profile Assessment Report
Quarterly Community Living Supports and Community Living Supports-Family Model Reports
Contracted Area Agency on Aging and Disability Ombudsman Services for the Community Living Supports and Community Living Supports-Family Model benefits, including related quarterly reports on ombudsman activities
Comparing services and supports with members' plans
Monthly Late and Missed Visit Reports
Quarterly Care and Support Coordination Reports
Monthly Utilization Reports
MCO efforts to prevent, detect, and remediate critical incidents
Quarterly CHOICES HCBS Critical Incident Report
Quarterly ECF CHOICES Reportable Event Report TennCare LTSS Critical Incident Audit
Assessing member quality of life, rebalancing, and community
integration activities
CHOICES Quarterly Point of Service Satisfaction Report
ECF CHOICES Quarterly Point of Service Satisfaction Report
Individual Experience Assessment
National Core Indicators - Aging and Disability
National Core Indicators
Monthly Money Follows the Person Participants Report
Monthly ECF CHOICES Employment Report MCO baseline data on system rebalancing efforts

33
Data Sources
HEDIS/CAHPS Report: A Comparative Analysis of Audited Results from TennCare Managed Care Organizations (MCOs) Using individual MCO results, the External Quality Review Organization (EQRO) calculates the statewide weighted HEDIS rates and the statewide CAHPS averages in this annual report.
The Impact of TennCare: A Survey of Recipients TennCare contracts with the Boyd Center for Business and Economic Research at the University of Tennessee, Knoxville to conduct a survey of 5,000 Tennesseans to gather information on their perceptions of their health care. The design for the survey is a household sample, and the interview is conducted with the head of the household. This report allows comparison between responses from all households and households receiving TennCare.
CMS-416 Report The Statewide EPSDT Screening Rate is calculated by utilizing MCO encounter data submissions in accordance with specifications for the annual CMS-416 report.
Medicaid Management Information Systems (MMIS) Report Monthly reports are generated by the MMIS to reflect CHOICES and Employment and Community First CHOICES enrollment.
CHOICES and Employment and Community First CHOICES Record Reviews (both member and provider records) The CHOICES and Employment and Community First CHOICES Record Reviews are conducted by TennCare Long Term Services and Supports staff to evaluate member or provider records, as applicable. The reviews are completed annually or semi-annually based on the performance measure associated with each review.
CHOICES and Employment and Community First CHOICES Critical Incidents Audit The CHOICES Critical Incident Audit and the Employment and Community First CHOICES Critical Incident Audits address MCO and DIDD determination, documentation, responsiveness, and investigation of critical incidents with specific timeframes on a member specific basis. They also address the systemic response to patterns of incidents. These audits are conducted each year and the results are used to improve individual MCO performance and general program performance.
Employment Informed Choice Audit This audit addresses MCO performance related to completion of required processes to help members understand and explore individual integrated employment and self-employment options. Compliance with this standard is also monitored through the quarterly MCO submission of the Employment and Community First CHOICES Employment Report and through the individual record reviews specified above.
Provider Qualifications Audit TennCare assures that MCOs are contracting only with qualified providers through the CHOICES Provider Qualifications Audit and the Employment and Community First CHOICES Provider Qualifications Audit. These audits address MCO compliance with contract requirements by examining whether MCOs ensure that providers possess appropriate qualifications before serving CHOICES or Employment and Community First CHOICES members. The process must meet NCQA requirements as well as state requirements.
34
Other Data In addition to the measures listed above, a baseline data plan has been developed for each MLTSS program component. These data plans are focused on collecting data to determine if the program is accomplishing its key policy goals as follows:
Baseline Data Plan CHOICES Program: The CHOICES baseline data plan is organized around five key program objectives. These objectives, together with the baseline measures and the data elements to be collected are provided below. All of the baseline data elements will be collected on the basis of program participation and program expenditures prior to or at the start of the CHOICES program. All of the CHOICES data elements identified below will be collected annually, beginning at one year after implementation, and measured against the baseline data elements each year.
Program Objective #1: Expand access to HCBS for older adults and adults with physical disabilities. Baseline data elements:
Number of older adults and adults with physical disabilities actively receiving HCBS as the time of CHOICES implementation and annually thereafter.
Unduplicated number of older adults and adults with physical disabilities receiving HCBS during the 12 months prior to CHOICES implementation and annually thereafter.
Number of persons receiving NF services at the time of CHOICES implementation and annually thereafter.
Unduplicated number of persons receiving NF services during the first year after CHOICES implementation and annually thereafter.
CHOICES Data Elements:
Number of older adults and adults with physical disabilities actively receiving HCBS one year after CHOICES implementation and annually thereafter.
Unduplicated number of older adults and adults with physical disabilities receiving HCBS during the first year after CHOICES implementation and annually thereafter.
Number of persons receiving NF services one year after CHOICES implementation and annually thereafter.
Unduplicated number of persons receiving NF services during the first year after CHOICES implementation and annually thereafter.
Program Objective #2: Rebalance TennCare spending on long-term services and supports to increase the proportion that goes to HCBS. Baseline Data Elements:
HCBS expenditures on older adults and adults with physical disabilities during the 12 months prior to CHOICES implementation.
HCBS expenditures on older adults and adults with physical disabilities during the 12 months prior to CHOICES implementation as a percentage of total long-term services and supports expenditures (excluding expenditures on LTSS for individuals with I/DD).
NF expenditures during the 12 months prior to CHOICES implementation.
NF expenditures during the 12 months prior to CHOICES implementation as a percentage of

35
total long-term care expenditures (excluding expenditures on LTSS for individuals with I/DD).
CHOICES Data Elements:
HCBS expenditures (based on encounters, not cap payments) during the first year following CHOICES implementation and annually thereafter.
NF expenditures (based on encounters, not cap payments) during the first year following CHOICES implementation and annually thereafter.
HCBS expenditures (based on encounters, not cap payments) during the first year following CHOICES implementation and annually thereafter as a percentage of total long-term care expenditures (excluding expenditures on the population of persons with mental retardation).
NF expenditures (based on encounters, not cap payments) during the first year following CHOICES implementation and annually thereafter as a percentage of total long-term care expenditures (excluding expenditures on the population of persons with mental retardation).
Program Objective #3: Provide cost effective care in the community for persons who would otherwise require NF care. Baseline Data Elements:
Average per person HCBS expenditures on older adults and adults with physical disabilities during the 12 months prior to CHOICES implementation.
Average per person NF expenditures during the 12 months prior to CHOICES implementation.
CHOICES data elements:
Average per person HCBS expenditures on older adults and adults with physical disabilities (based on encounters, not cap payments) during the first year following CHOICES implementation and annually thereafter.
Average per person NF expenditures on older adults with physical disabilities (based on encounters, not cap payments) during the first year following CHOICES implementation and annually thereafter.
Program Objective #4: Provide HCBS that will enable persons who would otherwise be required to enter NFs to be diverted to the community. Baseline data elements:
Average length of stay in HCBS during the 12 months prior to CHOICES implementation.
Percent of new LTSS recipients admitted to NFs during the 12 months prior to CHOICES implementation.
CHOICES Data Elements:
Average length of stay in HCBS during the first year after CHOICES implementation and annually thereafter.
Percent of new LTSS recipients admitted to NFs during the first year after CHOICES implementation and annually thereafter.

36
Program Objective #5: Provide HCBS that will enable persons receiving services in NFs to be able to transition back to the community. Baseline data elements:
Average length of stay in NFs during the 12 months prior to CHOICES implementation.
Number of persons transitioned from NFs to HCBS during the 12 months prior to CHOICES implementation, by average length of stay in the NF.
CHOICES data elements:
Average length of stay in NFs during the first year after CHOICES implementation and annually thereafter.
Number of persons who transitioned from NFs to HCBS during the first year following CHOICES implementation and annually thereafter, by average length of stay in the NF.
Baseline Data Plan: Employment and Community First CHOICES Program: This baseline data plan is also organized around five key program objectives. These objectives, together with the baseline measures and the data elements to be collected are provided below. All of the elements will be collected on the basis of program participation and program expenditures prior to or at the start of the Employment and Community First CHOICES program, except as otherwise specified below. All of the data elements identified below will be collected annually, beginning at one year after implementation, and measured against the baseline data elements each year, except as otherwise specified.
Program Objective #1: Expand access to HCBS for individuals with intellectual and developmental disabilities. Baseline data elements:
Number of individuals with ID actively receiving HCBS at the time of Employment and Community First CHOICES implementation.
Unduplicated individuals with ID receiving HCBS during the 12 months prior to Employment and Community First CHOICES implementation.
Employment and Community First CHOICES baseline data elements:
Number of individuals with ID actively receiving HCBS one year after Employment and Community First CHOICES implementation and annually thereafter.
Unduplicated number of individuals with ID receiving HCBS during the first year after Employment and Community First CHOICES implementation and annually thereafter.
Data shall be reported for Employment and Community First CHOICES and across Medicaid HCBS programs including section 1915 (c) waivers. Baseline data elements – Individuals with developmental disabilities (other than intellectual disabilities):
Number of individuals with DD actively receiving HCBS at the time of Employment and Community First CHOICES implementation.
Unduplicated individuals with DD receiving HCBS during the 12 months prior to Employment and Community First CHOICES implementation.
Employment and Community First CHOICES data elements – individuals with developmental disabilities (other than intellectual disabilities):

37
Number of individuals with DD actively receiving HCBS one year after Employment and Community First CHOICES implementation and annually thereafter.
Unduplicated number of individuals with DD receiving HCBS during the first year after Employment and Community First CHOICES implementation and annually thereafter.
Data shall be reported only for Employment and Community First CHOICES. Baseline data elements – individuals with intellectual and developmental disabilities:
Number of individuals with I/DD actively receiving HCBS at the time of Employment and Community First CHOICES implementation.
Unduplicated individuals with I/DD receiving HCBS during the 12 months prior to Employment and Community First CHOICES implementation.
Employment and Community First CHOICES data elements – individuals with intellectual and developmental disabilities:
Number of individuals with I/DD actively receiving HCBS one year after Employment and Community First CHOICES implementation and annually thereafter.
Unduplicated individuals with I/DD receiving HCBS during the first year after Employment and Community First CHOICES implementation and annually thereafter.
Data shall be reported for Employment and Community First CHOICES and across Medicaid HCBS programs, including section 1915(c) waivers. Program Objective #2: Provide more cost-effective services and supports in the community for persons with intellectual and developmental disabilities. Baseline data element:
Average per person LTSS expenditures on individuals with I/DD during the 12 months prior to Employment and Community First CHOICES implementation.
Employment and Community First CHOICES data element:
Average per person LTSS expenditures on individuals with I/DD (based on encounters, not cap payments) during the first year following Employment and Community First CHOICES implementation and annually thereafter.
Data shall be reported for Employment and Community First CHOICES, section 1915(c) waivers, ICF/IID services, and across Medicaid HCBS (including Section 1915(c) waivers and LTSS, including ICF/IID. Program Objective #3: Continue balancing TennCare spending on long-term services and supports for individuals with intellectual and developmental disabilities to increase the proportion spent on HCBS. Baseline data elements:
HCBS expenditures on individuals with I/DD during the 12 months prior to Employment and Community First CHOICES implementation.
HCBS expenditures on individuals with I/DD during the 12 months prior to Employment and Community First CHOICES implementation as a percentage of total LTSS expenditures for individuals with I/DD.
ICF/IID expenditures during the 12 months prior to Employment and Community First

38
CHOICES implementation.
ICF/IID expenditures during the 12 months prior to Employment and Community First CHOICES implementation as a percentage of total LTSS expenditures for individuals with I/DD.
Employment and Community First CHOICES data elements:
HCBS expenditures on individuals with I/DD (based on encounters, not cap payments) during the first year following Employment and Community First CHOICES implementation and annually thereafter.
ICF/IID expenditures during the first year following Employment and Community First CHOICES implementation and annually thereafter.
HCBS expenditures on individuals with I/DD (based on encounters, not cap payments) during the first year following Employment and Community First CHOICES implementation, and annually thereafter, as a percentage of total LTSS expenditures for individuals with I/DD.
ICF/IID expenditures during the first year following Employment and Community First CHOICES implementation, and annually thereafter, as a percentage of total LTSS expenditures for individuals with I/DD.
Program Objective #4: Increase the number and percentage of persons with intellectual and development disabilities enrolled in HCBS programs who are employed in an integrated setting earning at or above the minimum wage. Baseline data elements:
Number of individuals with I/DD enrolled in HCBS programs who are employed in an integrated setting earning at or above the minimum wage at the time of Employment and Community First CHOICES implementation.
Percent of individuals with I/DD enrolled in HCBS programs who are employed in an integrated setting earning at or above the minimum wage at the time of Employment and Community First CHOICES implementation.
Employment and Community First CHOICES data elements:
Number of individuals with I/DD enrolled in HCBS programs who are employed in an integrated setting earning at or above the minimum wage one year after Employment and Community First CHOICES implementation and annually thereafter.
Percent of individuals with I/DD enrolled in HCBS programs who are employed in an integrated setting earning at or above the minimum wage during the first year following Employment and Community First CHOICES implementation and annually thereafter.
Data shall be reported for Employment and Community First CHOICES and across Medicaid HCBS programs including section 1915(c) waivers. Program Objective #5: Improve the quality of life of individuals with intellectual and developmental disabilities enrolled in HCBS programs. Baseline data element:
Perceived quality of life of individuals with I/DD upon enrollment into Employment and Community First CHOICES as measured by the National Core Indicators Survey.

39
Employment and Community First CHOICES data element:
Perceived quality of life of individuals with I/DD one year after enrollment into Employment and Community First CHOICES as measured by the National Core Indicators Survey.
Development and Review of Quality Strategy
CMS Requirement: Include a description of the formal process used to develop the quality strategy. This must include a description of how the state obtained the input of beneficiaries and other stakeholders in the development of the quality strategy. (42 CFR § 438.202(b)) CMS Requirement: Include a description of how the state made (or plans to make) the quality strategy available for public comment before adopting it in final. (42 CFR § 438.202(b))
Steps for revising the TennCare Quality Strategy include: Collaboration with appropriate divisions within TennCare, with the Division of Quality Oversight holding responsibility for creating the draft.
Review of the draft by TennCare’s Chief Medical Officer.
After a final draft is completed, the Quality Strategy will be posted on TennCare’s website for public review. MCOs, advocacy groups, TennCare’s Medical Care Advisory Committee and beneficiaries will be notified of the posting and given a specific timeframe and e-mail address for comments to be returned to TennCare.
After the designated time frame has elapsed, a final report will be developed including appropriate recommendations made during the public review period.
CMS Requirement: Include a timeline for assessing the effectiveness of the quality strategy (e.g., monthly, quarterly, annually). (CFR § 438.202 (d))
The effectiveness of the Quality Strategy is assessed annually.
CMS Requirement: Include a timeline for modifying or updating the quality strategy. If this is based on an assessment of “significant changes,” include the state’s definition of “significant changes.” (42 CFR § 438.202(d))
TennCare will update its quality strategy annually and will include significant changes that have occurred as well as updated evaluation data. Significant changes are defined as changes that: 1) alter the structure of the TennCare Program; 2) change benefits; and 3) include changes in MCCs. Updated interventions/activities will also be provided. Every three years, TennCare will coordinate a comprehensive review and update.
40
SECTION II: ASSESSMENT Quality and Appropriateness of Care
CMS Requirement: Summarize state procedures that assess the quality and appropriateness of care and services furnished to all Medicaid enrollees under the MCO and PIHP contracts, and to individuals with special health care needs. This must include the state’s definition of special health care needs. (42 CFR § 438.204(b)(1)). Since TennCare’s inception, a continuous quality improvement (QI) process has been in place and has been refined over time. Assessment occurs in a variety of ways. Examples of these are listed below.
TennCare requires all MCOs to be NCQA accredited. MCOs are required, by contract, to provide TennCare with the entire accreditation survey and associated results. They are also required to submit to TennCare their annual NCQA Accreditation update.
All of the contracted MCOs are required to submit a full set of HEDIS and CAHPS data to TennCare annually. This information is also provided to Qsource, Tennessee’s EQRO, for review and trending. Qsource then prepares an annual report of findings for TennCare.
The MCOs are contractually required to submit a variety of reports to various divisions within TennCare. The reports include performance improvement projects (PIPs), Population Health, EPSDT, dental, CHOICES care coordination, annual quality improvement/utilization management (QI/UM) descriptions, evaluations and work plans, provider satisfaction surveys, dual eligible care coordination, etc. These reports are reviewed throughout the year and an annual analysis is completed.
Qsource conducts an Annual Quality Survey (AQS) for each MCO and the Dental Benefits Manager that evaluates contractual requirements related to quality.
Annual audits are conducted related to compliance with federal requirements for Abortions, Sterilizations, and Hysterectomies (ASH).
Quality Oversight and Long Term Services and Supports staff conduct MCO audits related to compliance with the federal Special Terms and Conditions for TennCare’s CHOICES program and the Employment and Community First CHOICES programs.
Collaborative workgroups with all MCOs are held periodically. These workgroups address issues related to Quality Redesign, EPSDT outreach, Emergency Department diversion, and high risk maternity.
Periodic meetings are held collaboratively with both MCOs and Dual Special Needs Populations (D-SNPs) to discuss ways of coordinating care.
CMS Requirement: Detail the methods or procedures the state uses to identify the age, race, ethnicity, sex, primary language, and disability statuses for each Medicaid enrollee. States must provide this information to the MCO and PIHP for each Medicaid enrollee at the time of enrollment. (42 CFR § 438.340(b)(6)) TennCare has taken steps to identify the age, race, ethnicity, sex, primary language, and disability statuses for each enrollee at the time of enrollment. Eligibility for TennCare and other Medicaid programs is determined by TennCare and the Federally Facilitated Marketplace (FFM). The application includes questions about age, race, ethnicity, sex, primary language, and disability statuses and instructs the applicant that
41
responses to the race and ethnicity questions are voluntary. Pursuant to the eligibility and enrollment data exchange requirements in CRA § A.2.23.5, the MCOs must receive, process, and update enrollment files that are sent daily by TennCare to the MCOs on a daily basis. Within twenty-four (24) hours of receipt of enrollment files, the MCOs must update the eligibility/enrollment databases. The MCOs and their providers and subcontractors that provide services to members participate in TennCare’s efforts to promote the delivery of services in a culturally competent manner to all enrollees, including those with Limited English Proficiency, disabilities, and diverse cultural and ethnic backgrounds regardless of a member’s gender or sex status. This includes the MCOs emphasizing the importance of network providers to have the capabilities to ensure physical access, accommodations, and accessible equipment for the furnishing services to members with physical or mental disabilities.
CMS Requirement: Document any efforts or initiatives that the state or MCO/PIHP has engaged in to reduce disparities in health care. TennCare addresses disparities through tracking the rates of illness and chronic conditions in relation to key demographic factors. TennCare contractually requires the MCOs to include QM/QI activities to improve healthcare disparities identified through data collection and requires them to include the methodology utilized for collecting the data as well as interventions taken to enhance the accuracy of the data collected. Additionally, TennCare is directly working to reduce healthcare disparities through contractually requiring its MCOs to provide essential networks and services required to address disparity issues. These requirements include:
Ensuring an adequate medical provider network of appropriately credentialed providers increasingly committed to evidence-based practices to improve access to care and higher quality outcomes.
Requiring opt-out Population Health services to be available to all TennCare members while providing intensive case management to those high-risk members who choose to opt-in to certain aspects of the program.
Proactively promoting health screenings and preventive healthcare services to all TennCare members.
Providing care coordination and direct support services for CHOICES HCBS enrollees. CHOICES care coordination provides access to several important determinants of health often lacking for our long-term care population, including:
Nutritious food delivered by local meals-on-wheels programs or prepared by homecare providers;
Safer home environments by building ramps and installing safety equipment, providing Personal Emergency Response Systems (PERS) and pest control services, and providing light housekeeping support; and
Personal care and other medical, behavioral, and long-term care services identified as needed through regular home visits by care coordinators.

42
Collaborating with TennCare to develop and implement adult and child health disparities (“opportunity gaps”) surveys. In 2016, the adult and child member health disparities surveys captured the following five (5) measurements: access to care; provider communication; provider rating; MCO communication; and MCO rating. The results of these surveys were segmented by the members’ race and ethnicity, language, disability, sex status and were used to create a healthcare disparities action plan. The action plan includes recommendations for taking the next steps to help bridge life and health opportunity gaps to connect TennCare members to tools they can use to improve and empower their health. For more information about this action plan, please see Attachment V: Bridging Life & Health Gaps.
In 2017, TennCare and its MCOs will continue their collaboration efforts to learn more about the opportunity gaps in our members’ lives that are stopping them from connecting with good health.
The 2017 Life Connects to Health Survey for Child and Adult Members will be conducted using the State of Tennessee’s on-line survey administrator Form Stack. TennCare has successfully used Form Stack to conduct surveys with its Long Term Supports and Services members. The survey will be available in English and several different languages, will be accessible to individuals with disabilities, and will protect the privacy and health care data of survey responders.
Coordination of Care for Dual Members
Since withdrawing from the Financial Alignment Demonstration, Tennessee is leveraging Medicare Part C authority and the D-SNP platform to help align members in the same health plan for Medicare and Medicaid benefits. TennCare utilizes the MIPPA agreement to require activities designed to support improved coordination of benefits across both programs—for aligned members as well as members enrolled in a non-aligned D-SNP.
To promote member alignment in MCO and D-SNP enrollment, TennCare has employed the following strategies:
Procurement: during the last Medicaid procurement (for contract term beginning 2015), all plans were required to have a statewide companion D-SNP or to include in their proposals a plan for establishing a statewide companion D-SNP by 2016. All three MCOs now have fully operational statewide D-SNPs.
Member Reassignment: With the implementation of the new statewide Medicaid contracts, TennCare reassigned members to new MCOs in each grand region of the state to equalize membership enrollment across all MCOs. A key priority in the statewide implementation was reassignment to a Medicaid MCO that would achieve alignment with the member’s D-SNP enrollment. Reassignment notices included explanations to help selected members understand why they might want to proceed with reassignment to aligned enrollment, rather than opting to remain with their current Medicaid MCO.
MIPPA Contracting: While TennCare will continue to maintain MIPPA agreements with current D-SNPs, we will not contract with any new D-SNPs that are not contracted (through a competitive procurement process) to also provide Medicaid benefits.
Member Education: A process has been implemented for sending educational letters to Medicaid members in advance of their attaining Medicare eligibility to encourage them to enroll in an aligned D-SNP.

43
Hardship: Going forward, the hardship criteria will be modified to include requests that would result in alignment with the member’s D-SNP.
Seamless Conversion: TennCare has been working with the contracted Medicaid plans that have companion D-SNPs to support them in implementing seamless conversion of Medicaid enrollees attaining Medicare eligibility pursuant to federal requirements. Currently, all three eligible plans are approved for seamless conversion, with all three operational at this point. Prospective Medicare enrollment dates derived from the MMA file submission process are submitted to assist them in identifying their members attaining Medicare eligibility. Upon notification of a Medicaid member’s prospective Medicare eligibility date, the state also sends a letter to the member informing them of their upcoming Medicare enrollment, the benefits of enrolling in an aligned D-SNP, and encouraging them to remain enrolled in the aligned plan.
Coordination of Benefits: TennCare exchanges full Medicaid enrollment files with all D-SNPs to assure they are aware of the member’s Medicaid MCO assignment. Medicare enrollment data is also provided to Medicaid MCOs for the same purposes. MIPPA agreements include strengthened coordination requirements for D-SNPs, specifically as it relates to discharge planning; care transitions; and use of long-term services and supports. Medicare data, including D-SNP encounter data required by the Medicaid Agency, is also provided to the MCOs for care coordination purposes. Additionally, D-SNPs are required to exchange daily inpatient admission and discharge reports, including observation stays, to help facilitate timely discharge planning. Finally, the MIPPA agreement requires the submission of a Quarterly Dual Coordination Report, a Quarterly Seamless Conversion Report, a Quarterly D-SNP Appeals and Grievances Report, and a clinical audit conducted by TennCare LTSS Operations' staff. The audit samples members identified in the Quarterly Dual Coordination Report having multiple readmissions during a quarter to determine whether adequate coordination occurred to reduce preventable readmissions.
Prescription for Success
In 2014, TennCare partnered with the Tennessee Department of Mental Health and Substance Abuse Services, in conjunction with the U.S. Drug Enforcement Administration, the Tennessee Bureau of Investigation, and the State Departments of Health, Safety and Homeland Security, Corrections, and Children’s Services to develop a report entitled Prescription for Success: Statewide Strategies to Prevent and Treat the Prescription Drug Abuse Epidemic in Tennessee. This report outlines a comprehensive, multi-faceted plan to combat prescription drug abuse in Tennessee and includes information on each partner’s current strategies in addition to the partnership’s future collaborative goals. TennCare’s current strategies include:
Covered Treatment Services – TennCare covers a comprehensive continuum of substance abuse services for its beneficiaries, including outpatient, inpatient, and residential treatment/detoxification and medication-assisted treatment.
Formulary Regulations – The TennCare Formulary has regulations in place (i.e., five prescription limit per month, policy for tamper-resistant prescriptions, and formulation strategy on coverage of products containing buprenorphine) to prevent doctor shopping and prescription abuse.
Pharmacy “Lock-In” Program – TennCare possesses the authority to restrict or “lock-in” TennCare enrollees to a limited and specified number of pharmacy providers if it is determined that the enrollee has abused TennCare’s Pharmacy Program. There are currently 3,326 active beneficiaries

44
locked into a pharmacy and 951 ineligible persons still subject to the Lock-In (should they regain eligibility) due to being arrested or convicted of TennCare Fraud, Drug Sales or TennCare Doctor Shopping.
Prescriber Identification – TennCare has developed a unique and innovative algorithm to identify prescribers who are potentially prescribing opioids and other controlled substances in a way that is very inconsistent with their peers. Identified providers are manually evaluated by TennCare’s pharmacy staff, and appropriate interventions (e.g., targeted education, blocking of prescriptions by the TennCare Drug Utilization Review Board, etc.) are employed based on the results of the manual evaluation.
Opioid Utilization
The TennCare Pharmacy Advisory Committee adopted criteria to curb potential over utilization and/or misuse of psychotropic medications in enrollees diagnosed with I/DD. TennCare’s pharmacy division is working closely with the Pharmacy Benefits Manager to address over prescribing and misuse of opioids by adopting portions of the Centers for Disease Control’s opioid prescribing guidelines.
Voluntary Reversible Long Acting Contraceptives (VRLAC)
The TennCare Pharmacy Division implemented an outpatient clinic or medical practice VRLAC pilot project on August 1, 2016 with Bayer Pharmaceuticals and EnTrusRx (Fred’s) Specialty Pharmacy. The project allows physicians to obtain VRLACs (IUD – intrauterine contraceptive devices) on a consignment basis to insert at a scheduled appointment thus avoiding a follow-up visit by the enrollee. By allowing same day access to VRLACs, the goal is to readily accommodate TennCare enrollees who desire long-acting contraceptives to prevent unintended or closely spaced pregnancies. Additionally, the pilot project could potentially reduce Neonatal Abstinence Syndrome (NAS) births, abortions, and unused IUD prescriptions because an enrollee was unable to return for a VRLAC placement office visit. The initial pilot included twenty-five (25) medical practices in the first month. At the one (1) year mark, thirty-seven (37) outpatient clinics and medical practices, representing seventy-nine (79) practitioners, are participating in the pilot project and a third IUD product was introduced. The ultimate goal of the project is to offer VRLAC products on a consignment basis to all interested practitioners state-wide.
Additionally, in Q4 of 2017, with full support from TennCare, each MCO launched an initiative to allow for increased access to post-partum VRLACs including both IUDs and implants. Each MCO now allows hospital billing for the VRLAC device and practitioner professional insertion fee billing to be added to the standard Diagnosis Related Group (DRG) bundled fee for labor and delivery.
National Performance Measures
CMS Requirement: Include a description of any required national performance measures and levels identified and developed by CMS in consultation with states and other stakeholders. (42 CFR § 438.204(c))
At this time, CMS has not identified any required national performance measures.
CMS Requirement: Indicate whether the state plans to voluntarily collect any of the CMS core performance measures for children and adults in Medicaid/CHIP. If so, identify state targets/goals for any of the core measures selected by the state for voluntary reporting.
Performance goals are based on improvement to or maintenance of the following national benchmarks: HEDIS 25th, 50th, and 75th percentiles, and CAHPS Quality Compass national benchmarks.

45
Child Health Quality Measures
Measure Name 2016
Baseline 2017
Update 2019 Goal
Timeliness of Prenatal Care 76.34% 76.94% 85.19% Frequency of Ongoing Prenatal Care ( 81 of expected visits) 55.51% 57.09% 59.49% Childhood Immunization Status
DTaP/DT 76.91% 73.60% 79.52% IPV 91.23% 89.47% 94.70% MMR 88.46% 86.49% 90.93% HiB 88.77% 86.28% 91.00% Hepatitis B 92.14% 90.60% 93.67% VZV 88.52% 86.55% 91.17% Pneumococcal Conjugate 79.20% 75.52% 79.88% Hepatitis A 87.18% 85.67% 89.29% Rotavirus 69.62% 68.68% 69.91% Influenza 42.86% 37.56% 51.34% Combination 2 74.27% 70.82% 75.47% Combination 3 71.88% 68.02% 76.50% Combination 4 70.27% 67.66% 73.24% Combination 5 57.87% 56.44% 58.36% Combination 6 37.28% 32.31% 43.65% Combination 7 57.32% 56.20% 62.04% Combination 8 37.02% 32.19% 42.23% Combination 9 31.78% 28.06% 36.68% Combination 10 31.64% 27.94% 35.88%
Adolescent Immunization Status Meningococcal 67.84% 69.74% 75.69% Tdap/Td 81.80% 82.75% 86.26% Combination 1 67.13% 68.87% 73.15%
Weight Assessment and Counseling for Nutritional and Physical Activity for Children/Adolescents BMI Percentile (3 - 11 years) 71.33% 75.08% 77.48% BMI Percentile (12 - 17 years) 65.74% 71.33% 67.47% Counseling for Nutrition (3 - 11 years) 62.76% 66.25% 63.00% Counseling for Nutrition (12 - 17 years) 54.98% 61.33% 58.33% Counseling for Physical Activity (3 - 11 years) 53.08% 55.64% 53.36% Counseling for Physical Activity (12 - 17 years) 54.47% 59.45% 56.34%
Chlamydia Screening 51.19% 52.76% 57.64% Well-Child Visits in the First 15 Months of Life: Six or More Visits 57.63% 60.94% 59.76% Well-Child Visits in the 3rd, 4th, 5th, and 6th Years of Life 68.01% 69.18% 72.02% Adolescent Well-Care Visits 42.34% 46.61% 49.15% Child and Adolescent Access to Primary Care Practitioners
12-24 months 91.77% 93.70% 96.28%

46
25 months – 6 years 85.15% 84.48% 88.46% 7 – 11 years 91.15% 89.55% 91.42% 12 – 19 years 87.78% 86.19% 90.06%
Follow-up Care for Children Prescribed Attention Deficit Hyperactivity Disorder (ADHD) Medication
Initiation Phase 49.26% 44.95% 49.07% Continuation and Follow-Up Phase 63.14% 59.45% 58.36%
Follow-Up After Hospitalization for Mental Illness 7 day follow- up 55.95% 58.82% 56.78% 30 day follow-up 70.63% 71.29% 75.28%
Medication Management for People with Asthma – 75 Ages 5-11 26.87% 24.38% 32.80% Ages 12-18 26.63% 25.20% 28.99%
Human Papillomavirus Vaccine for Female Adolescents 15.89% 13.23% 21.90% Consumer Assessment of Health Plans – Child Medicaid Survey
Getting Needed Care (Always + Usually) 86.60% 88.01% 84.39% Getting Care Quickly (Always + Usually) 91.58% 92.24% 88.60% How Well Doctors Communicate (Always + Usually) 93.79% 94.15% 93.14% Customer Service (Always + Usually) 89.23% 89.76% 87.52% Shared Decision Making (Yes) 80.49% 80.27% 78.00% Rating of All Health Care (9+10) 70.94% 73.72% 66.41% Rating of Personal Doctor (9+10) 76.89% 77.08% 74.58% Rating of Specialist Seen Most Often (9+10) 75.96% 79.17% 70.75% Rating of Health Plan (9+10) 73.62% 75.19% 68.71%
Consumer Assessment of Health Plans – Children With Chronic Conditions Getting Needed Care (Always + Usually) 87.93% 89.07% 85.90% Getting Care Quickly ( Always + Usually) 93.57% 94.18% 91.31% How Well Doctors Communicate (Always + Usually) 94.22% 95.03% 93.69% Customer Service ( Always + Usually) 89.79% 92.73% 88.47% Shared Decision Marking (Yes) 85.83% 84.27% 84.33% Rating of All Health Care (9+10) 69.52% 70.69% 63.84% Rating of Personal Doctor (9+10) 75.45% 77.02% 73.52% Rating of Specialist Seen Most Often (9+10) 72.87% 74.92% 70.26% Rating of Health Plan (9+10) 69.18% 72.31% 64.28% Access to Specialized Services (Always + Usually) 80.20% 82.46% 77.55% FCC-Doctor or Nurse Who Knows Child (Yes) 90.95% 91.28% 89.70% Coordination of Care (Yes) 77.58% 79.99% 77.56% FCC – Getting Needed Information (Always + Usually) 91.11% 92.22% 91.15% Access to Prescription Medicines (Always + Usually) 92.63% 92.85% 89.97%

47
Adult Quality Measures:
Measure Name 2016
Baseline 2017
Update 2019 Goal
Adult BMI Assessment 82.46% 86.96% 83.45% Breast Cancer Screening 54.47% 54.90% 58.34% Cervical Cancer Screening 55.60% 59.21% 61.05% Chlamydia Screening in Women Ages 21-24 54.61% 57.38% 61.21% Follow-Up After Hospitalization for Mental Illness
7 Day Follow-Up 55.95% 58.82% 56.78% 30 Day Follow-Up 70.63% 71.29% 75.28%
Controlling High Blood Pressure 55.10% 55.63% 57.53% Comprehensive Diabetes Care: Hemoglobin A1c Testing 82.59% 82.51% 86.20% Comprehensive Diabetes Care: HbA1c Poor Control ( 9.0 ) 43.23% 41.92% 42.22% Initiation and Engagement of Alcohol and Other Drug Dependence Treatment
Initiation of AOD Treatment 33.36% 35.62% 37.61% Engagement of AOD Treatment 8.70% 10.34% 9.83%
Prenatal and Postpartum Care: Postpartum Care Rate Timeliness of Prenatal Care 76.34% 76.94% 85.19% Postpartum Care 55.57% 59.35% 62.77%
Antidepressant Medication Management Effective Acute Phase Treatment 47.75% 46.52% 50.51% Effective Continuation Phase Treatment 32.19% 30.56% 34.02%
Flu Vaccinations for Adults Ages 18-64 36.92% 40.31% 39.04% Annual Monitoring of Patients on Persistent Medications
Ace Inhibitors or ARBs 90.46% 90.30% 92.01% Digoxin 54.95% 58.22% 58.64% Diuretics 90.92% 90.70% 91.78%
Medical Assistance with Smoking and Tobacco Use Cessation Advising Smokers and Tobacco Users to Quit 77.05% 77.12% 79.41% Discussing Cessation Medications 43.01% 44.72% 46.70% Discussing Cessation Strategies 38.28% 38.55% 42.50% % Current Smokers 37.28% 36.94% 39.60%
Consumer Assessment of Health Plans Survey – Adult Getting Needed care (Always + Usually) 82.45% 84.50% 80.82% Getting Care Quickly (Always + Usually) 82.14% 84.54% 80.73% How Well Doctors Communicate (Always + Usually) 90.13% 91.42% 90.66% Customer Service (Always + Usually) 88.88% 90.39% 87.11% Shared Decision Making (Yes) 77.06% 79.45% 78.71% Rating of All Health (9+10) 52.70% 57.40% 52.56% Rating of Personal Doctor (9+10) 64.24% 68.03% 64.66% Rating of Specialist Seen Most Often (9+10) 67.25% 67.26% 65.06% Rating of Health Plan (9 + 10) 58.71% 62.39% 57.93%

48
Monitoring and Compliance
CMS Requirement: Detail procedures that account for the regular monitoring and evaluation of MCO and PIHP compliance with the standards of subpart D (access, structure and operations, and measurement and improvement standards). Some examples of mechanisms that may be used for monitoring include, but are not limited to: Member or provider surveys; HEDIS results; Report cards or profiles; Required MCO/PIHP reporting of performance measures; Required MCO/PIHP reporting on performance improvement projects; Grievance/Appeal logs, etc. (CFR § 438.204(b)(3))
NCQA Accreditation
Each MCO must obtain and maintain NCQA accreditation, and failure to obtain and/or maintain accreditation is considered to be a breach of the Contractor Risk Agreement (CRA) and will result in termination of the Agreement. Achievement of provisional accreditation status requires a Corrective Action Plan within 30 days of receipt of notification from NCQA and may result in termination of the Agreement. Each MCO is required to submit every accreditation report immediately upon receipt of the written report from NCQA, at which point it is reviewed by staff to determine areas of deficiency. If the reviewer deems necessary, a Corrective Action Plan may be required.
Quarterly and Annual Reports from Managed Care Contractors
All MCCs are required to submit a variety of reports to TennCare throughout the year. When received through a secure tracking system, each report is reviewed by staff and a Corrective Action Plan is required for any report deemed deficient. Liquidated damages may be applied for deficient reports. Information from the reports is used by program staff to help monitor compliance with program requirements. Examples of reports include Population Health, EPSDT Outreach, Behavioral Health, Nursing Facility Diversion Activities, CHOICES Care Coordination, CHOICES and Employment and Community First CHOICES Member Complaints, and Provider Satisfaction.
HEDIS results
Annually each MCO is required to submit all HEDIS measures designated by NCQA as relevant to Medicaid, with an exception for dental measures. The results must be reported separately for each Grand Region in which the MCO operates. The MCO must contract with an NCQA certified HEDIS auditor to validate the processes in accordance with NCQA requirement. HEDIS data is then submitted to both TennCare and the EQRO, which provides analyses of the data as well as a written comparative report.
Performance Improvement Projects (PIPs)
All MCOs are required to submit at least two clinical and three non-clinical PIPs annually, as well as a PIP in the area of EPSDT. The two clinical PIPs must include one in the area of behavioral health that is relevant to one of the Population Health programs for bipolar disorder, major depression, or schizophrenia, and one in the area of either child health or perinatal (prenatal/postpartum) health. One of the three non-clinical PIPs must be in the area of long-term services and supports. All PIPs must be in accordance with CMS Protocols for Performance Improvement Projects. After three years, a decision is made jointly between the MCO and TennCare on the continuation of the PIP.
Annual Quality Survey
The EQRO is contractually required to conduct an Annual Quality Survey of each MCC to assure compliance

49
with contractual requirements. As part of the preparation for the survey, the EQRO, in conjunction with TennCare, reviews all contractual standards for changes that have occurred during the previous year and develops the criteria for review. EQRO staff conducts the survey and provide a detailed written report of findings for each MCO. If an MCO scores less than 100% on any element, a Corrective Action Plan must be submitted within two weeks of receipt of the findings. Both the EQRO and TennCare staff review the Corrective Action Plans to ensure the MCCs take appropriate action. Follow-up on the plans is conducted by the TennCare Division of Quality Oversight.
Site visits/collaborative work groups
Both the Division of Quality Oversight and the Behavioral Health Operations Unit conduct periodic site visits to learn about and monitor various aspects of MCC activities. On a semi-annual basis, or more frequently if needed, TennCare staff meet with each MCO to receive updates on different initiatives and special projects. The Division of Quality Oversight meets with the Quality Directors on a monthly basis to discuss issues, projects, etc. and participates on multiple workgroups facilitated by the Tennessee Department of Health. Additionally, TennCare and the MCOs have created Technical Advisory Groups for Tennessee Health Link implementation and Episodes of Care. Other workgroups that TennCare Behavioral Health staff participates in include TDMHSAS Planning and Policy Council, Tennessee Suicide Prevention Network (TSPN) Zero Suicide Initiative Task Force, Children’s Cabinet state-wide, multi-agency Collaboration Pilot, Department of Children’s Services/TennCare Select Coordination of Care Meeting, and Tennessee Association of Mental Health (TAMHO) Finance and Administration meetings.
Audits/Medical Record Reviews
Either annually or semi-annually the following Medical Record Reviews (MRRs) are conducted by the EQRO, the Division of Quality Oversight, or the Division of Long-Term Services and Supports:
A sample of provider records is reviewed to determine compliance with Abortion, Sterilization, and Hysterectomy (ASH) federal regulations.
CHOICES and Employment and Community First CHOICES chart reviews are conducted to determine compliance with federal and/or state standards for Level of Care, Person-Centered Support Plans, Freedom of Choice, Qualified Providers, Critical Incidents, Participant Rights, and Abuse and Neglect Education. Some of these areas are audited annually while some are audited bi-annually.
Chart reviews are conducted on a quarterly basis by desk audits to determine compliance with the coordination of benefits for members who receive services from an MCO and are also enrolled in a Home and Community Based Services (HCBS), Department of Intellectual and Developmental Disabilities (DIDD) Waiver.
Provider Validation Surveys
TennCare’s EQRO is required to conduct a quarterly provider data validation (PDV) survey. The purpose of this activity is to determine the accuracy of the provider data files submitted by the TennCare MCCs and to use the results as a proxy to determine the extent to which providers are available and accessible to TennCare members. Liquidated damages are recommended each quarter if data for more than 10% of providers is incorrect for each data element.
50
Provider Satisfaction Surveys
Each MCO is required to submit an annual Provider Satisfaction Survey Report that encompasses both physical and behavioral health. The report must summarize the provider survey methods and findings and must provide an analysis of opportunities for improvement. An additional CHOICES and Employment and Community First CHOICES survey of providers is also required. This report must address results for CHOICES and Employment and Community First CHOICES long-term services and supports providers. It also must include a summary of survey methods and findings as well as an analysis of opportunities for improvement.
Customer Satisfaction Surveys
Annually each MCO must conduct a CAHPS survey utilizing a vendor that is certified by NCQA. The surveys conducted are the CAHPS Adult Survey, the CAHPS Child Survey, and the CAHPS Children with Chronic Conditions Survey. The data is then submitted to both TennCare and the EQRO, which provides analyses of the data as well as a written report.
TennCare contracts with The University of Tennessee Boyd Center for Business and Economic Research to conduct an annual survey of 5,000 Tennesseans to gather information on their perceptions of their health care. The design for the survey is a “household sample,” and the interview is conducted with the head of the household. The report, The Impact of TennCare: A Survey of Recipients, allows comparison between responses from all households and households receiving TennCare.
TennCare contracts with the nine Area Agencies on Aging and Disability, the State’s Single Point of Entry, to conduct a face-to-face CHOICES Customer Satisfaction Survey. Previously, TennCare contracted with the EQRO, Qsource, to conduct an analysis of the customer satisfaction survey data and compile a report of findings. The report evaluates CHOICES members’ satisfaction with the services and supports they receive, as well as their overall contentment. In 2015, TennCare contracted with NASUAD to participate in the National Core Indicators consumer satisfaction survey for the elderly and adults with disabilities. TennCare continues to contract with the nine Area Agencies on Aging and Disability to conduct the face-to-face interviews. Human Services Research Institute completes the data analysis as a component of the contract with NASUAD. This NCI-AD survey measures CHOICES members’ satisfaction with services, their ability to access services, their understanding of their rights and their ability to live the life they intend with the necessary supports in place to help them achieve their desired health and psycho-social outcomes.
As part of the baseline data plan for Employment and Community First CHOICES, TennCare will utilize the NCI survey to assess the quality of life of each person with I/DD enrolled into the Employment and Community First CHOICES and one year following enrollment. Beginning in late 2017, TennCare will also use the NCI tool to conduct a satisfaction survey for individuals with I/DD who have been enrolled in Employment and Community First CHOICEs for more than one year.
Prior approval of all member materials
The Division of Quality Oversight, in conjunction with Managed Care Operations staff and Member Communications, reviews all member materials that have clinical information included. Staff reviews information for clinical accuracy, culturally appropriate information, and appropriateness of clinical

51
references. LTSS staff, in conjunction with MCO staff, reviews all member materials related to the CHOICES and the Employment and Community First CHOICES program as well as all materials submitted by the D-SNPs. All member materials must be approved by TennCare before distribution can occur.
Tennessee Department of Commerce and Insurance
The TDCI TennCare Quality Oversight Division is considered to be a Health Oversight Authority under the guidelines of the Health Insurance Portability and Accountability Act. As such the release of protected health information without authorization is permitted under 45 CFR § 164.512 for the purposes of regulation. The TennCare Oversight Division is required to:
Act upon licensure applications;
Examine HMOs at least once every five years (examinations are currently conducted once every two years);
Review and analyze quarterly and annual financial reports filed by the TennCare HMOs;
Process eligible requests for independent review of denied TennCare provider claims;
Review and either approve or disapprove material modifications to organization documents, including but not limited to, provider agreements, subcontracts, evidences of coverage, marketing materials, and any other item that would materially change the operations of the HMO;
Administer and enforce the TennCare Prompt Pay Act found at TCA § 56-32-126; and
Provide support services to the Selection Panel for TennCare Reviewers, pursuant to the TennCare Prompt Pay Act.
Policies and Procedures
Policies and Procedures are developed by the MCOs and are reviewed by TennCare staff upon readiness review for new contracts or programs and as needed throughout the life of their contracts.
LTSS CHOICES Audits
The LTSS Quality and Compliance Unit conducts eleven types of contract compliance audits as listed below, in addition to other audits conducted as the need arises. The measurement criteria for the audits are determined by the CRA with the MCOs or the contract with other entities, as well as CHOICES protocols. Based on these audits, an MCO may be subject to the Corrective Action Plan process and/or liquidated damages when performance is not compliant with the MCO’s Contractor Risk Agreement. Additionally, aggregate information obtained from the audits is used for program management and program improvements, including adjustments to program or contract requirements, technical assistance, etc.
New Member Audit for members who are new to Medicaid and/or CHOICES – addresses identification of services in the Person Centered Support Plan (PCSP), MCO authorization of HCBS, and the timely initiation of HCBS.
Referral Audits for existing Medicaid enrollees who are referred for potential enrollment in CHOICES – addresses MCO performance of applicant telephonic screenings, face-to-face assessments, and Pre-Admission Evaluation submissions.

52
Critical Incident Audit – addresses MCO determination, documentation, responsiveness, and investigation of critical incidents within specified timeframes. It also addresses the systemic response to patterns of incidents.
Fiscal Employer Agent (FEA) Audit – addresses the timeliness of support broker assignment to new Consumer Direction (CD) members, notification and provision of the support broker contact information to CD member and care coordinator, and initiation of CD services.
Area Agency on Aging and Disability (AAAD) Audit – addresses AAAD performance related to information and referral requests, contact with members and potential members, processing of referrals related to the Minimum Data Set (MDS), ensuring face-to-face evaluations, and completion/submission of eligibility, evaluation and enrollment information consistent with contractual guidelines.
Money Follows the Person (MFP) Audit – addresses MCO performance related to member eligibility qualifications, member notification about enrollment and disenrollment, reporting of inpatient admissions and discharges, and post inpatient admission follow-up.
Provider Qualifications Audit – addresses MCO compliance with contract requirements by examining whether MCOs ensure that providers possess appropriate qualifications before serving CHOICES members.
Short-Term Stay (STS) Audit – addresses MCO performance related to verification of Nursing Facility level of care prior to admission, verification that the MCO properly managed the STS benefit (i.e., 90 days or less), verification that the MCO reviewed circumstances resulting in multiple STS benefit periods, and verification of the MCO’s evaluation of services and supports for members receiving multiple STS.
Annual Level of Care Reassessment Audit – addresses MCO performance as it relates to conducting a Level of Care Reassessment for all CHOICES members on an annual basis. The reassessment is conducted to ensure our members are receiving services consistent with their needs and are enrolled in the appropriate CHOICES group, particularly focusing on the Carryover demonstration group.
Select Community Audit – addresses the MCOs performance related to enrolling members of the specified population into the program and completing assignment and assessment within specified timeframes.
CHOICES MCO capitation Reconciliation Audit – determines if MCOs are exempt from recoupment of overpayments when members have had an extended period without services. This process examines whether or not the lapse in service was justified or represents underperformance by the MCO, such that readjustment of the capitation payment is appropriate.
LTSS Employment and Community First CHOICES Audits
The LTSS Quality and Compliance Unit conducts contract compliance audits as listed below, in addition to other focused reviews conducted as the need arises. The measurement criteria for the audits are determined by the CRA with the MCOs or the contract with other entities, as well as Employment and Community First CHOICES protocols. Based on the performance on these audits, an MCO may be subject to

53
the Corrective Action Plan process and/or liquidated damages when performance is not compliant with the CRA. Additionally, aggregate information, obtained from the audits is used for program management which may include adjustments to the CRA, technical assistance, etc.
New Enrollee Audit for members who are new to Medicaid and/or Employment and Community First CHOICES – addresses identification of services in the Initial Support Plan (ISP), the comprehensive Person-centered Support Plan (PCSP), when the initial SP is waived, MCO authorization of Employment and Community First CHOICES services, and the timely initiation of Employment and Community First CHOICES services.
Referral Audits for individuals who are referred for potential enrollment in Employment and Community First CHOICES – addresses the referral, intake and enrollment processes, MCO response time and documentation.
Reportable Event Audit – addresses MCO or DIDD determination, documentation, responsiveness, and investigation of critical incidents within specified timeframes. It also addresses MCO categorization of reportable events, timelines and the systemic response to patterns of incidents.
Fiscal Employer Agent (FEA) Audit – addresses the timeliness of support broker assignment to new Consumer Direction (CD) members, notification and provision of the support broker contact information to CD member and support coordinator and initiation of CD services.
Provider Qualifications Audit – addresses MCO performance in determining the qualifications of an Employment and Community First provider prior to entering into a contract for Employment and Community First CHOICES services and periodically recredentialing the provider, including review of the provider’s processes for compliance with background and registry check requirements. The process must meet NCQA requirements as well as state requirements.
Employment Informed Choice Audit –addresses MCO performance related to completion of required processes to help members understand and explore individual integrated employment and self-employment options. Compliance with this standard is also monitored through the quarterly MCO submission of Employment and Community First CHOICES Employment Report and through individual record reviews.
Family Caregiver Stipend Audit – addresses MCO performance related to this service to ensure that recipients who may benefit from the service have access to the service and to ensure that the service is properly included in the PCSP, authorized, delivered, documented and reimbursed in accordance with the PCSP and approved waiver authority. This audit is supplemented by the Reimbursement Services Report submitted quarterly by MCOs and validated using data from the MMIS.
Employment Benefits Audit – addresses MCO performance related to the availability, delivery and management of the employment benefits in accordance with the approved waiver authority. Ensures that for recipients receiving employment benefits, these services are properly included in the PCSP, authorized, delivered, documented and reimbursed in accordance with approved waiver authority, including applicable benefit limits. This audit is driven by the Employment Report submitted quarterly by MCOs and validated using data from the MMIS.
Individual Education and Training Audit – addresses MCO performance related to this service to ensure that recipients who may benefit from the service have access to the service and to ensure that the service is properly included in the PCSP, authorized, delivered, documented and

54
reimbursed in accordance with the approved waiver authority. This audit is supplemented by the Reimbursement Services Report submitted quarterly by MCOs and validated using data from the MMIS.
Family Caregiver Education and Training Audit – addresses MCO performance related to this service to ensure that recipients who may benefit from the service have access to the service and to ensure that the service is properly included in the PCSP, authorized, delivered, documented and reimbursed in accordance with the approved waiver authority. This audit is supplemented by the Reimbursement Services Report submitted quarterly by MCOs and validated using data from the MMIS.
Consumer Directed Community Transportation Audit – addresses MCO performance related to this service to ensure the required processes of authorizing Community Transportation as a benefit, receiving and reviewing required documents for appropriateness of reimbursement and submitting all necessary documents to the Fiscal Employer Agent are adhered to.
CHOICES Care Coordination Monitoring
Because care coordination is the cornerstone of an effective MLTSS program, monitoring the quality of the Care Coordination function is essential to the program’s success. This monitoring is conducted by the LTSS Quality and Compliance unit and includes the following:
CHOICES chart reviews are conducted to determine compliance with federal and/or state Standards for Level of Care, Person-Centered Support Plans, Freedom of Choice, Qualified Providers, Critical Incidents, Participant Rights, and Abuse and Neglect Education. Some of these areas are audited annually while some are audited bi-annually. Chart reviews are conducted on a quarterly basis by desk audits to determine compliance with the coordination of benefits for members who receive services from an MCO and are also enrolled in Home and Community Based Services (HCBS) waiver.
Ride-along assessments are conducted by TennCare staff with the CHOICES care coordinators to determine depth of knowledge of the program and available services as well as ensure program information is shared in a manner that reflects compliance with state and federal regulations.
Person-Centered Support Plan (PCSP) reviews, along with interviews with the member, are conducted. These activities evaluate the effectiveness of the person-centered planning process and ensure the member is being assisted as needed in driving the PCP process and receiving the assessed needed supports. They also assure that supports required for assisting the member in meaningful day activities and achieving personal health and psycho-social outcomes are provided.
Employment and Community First CHOICES Support Coordination Monitoring
Similar to CHOICES, person-centered support coordination for Employment and Community First CHOICES members will be critical for individual and program success. For this reason, monitoring of this function will be a process that is essential to a successful quality strategy. This monitoring is conducted by LTSS and includes the following:
Employment and Community First CHOICES chart reviews are conducted to determine compliance with federal and/or state standards for Person-Centered Support Plans, Qualified Providers, Critical Incidents, Participant Rights, and Abuse and Neglect Education. Some of these areas are audited

55
annually while some are audited bi-annually. Chart reviews are conducted on a quarterly basis by desk audits to determine compliance with the coordination of benefits for members who receive additional services from an MCO.
Ride-along assessments are conducted by TennCare staff with the Employment and Community First CHOICES support coordinators to determine depth of knowledge of the program and available services as well as ensure program information is shared in a manner that reflects compliance with state and federal regulations.
Person-Centered Support Plan (PCSP) reviews along with interviews with the member are conducted. These activities evaluate the effectiveness of the PCSP planning process and ensure the member is being assisted as needed in leading the PCSP process and receiving the assessed needed supports. They also assure that supports required to assist the member in achieving community integration and employment goals are being provided.
LTSS Quality Assurance Processes
In addition to the audits described above, processes are being implemented to achieve and ensure ongoing compliance with the HCBS final rule including HCBS settings and PCP provisions across all HCBS settings (1915(c) waiver programs, CHOICES and Employment and Community First CHOICES). These quality assurance and monitoring activities include MCO and DIDD oversight of provider transition plan implementation and quarterly reporting to TennCare, ongoing MCO credentialing and re-credentialing processes, and quarterly reporting to TennCare, ongoing MCO credentialing and re-credentialing processes, Employment and Community First CHOICES Quality Monitoring, conducting an Individual Experience Assessment for all individuals receiving HCBS in each LTSS program, standardizing plan of care documents (i.e., PCSPs)across programs and MCOs, and annual consumer/family satisfaction and quality of life surveys.
LTSS Quality Assurance Surveys of Community Living Supports (CLS) and CLS–Family Model Providers
Effective July 1, 2015, CMS approved new community based residential alternative benefits. These are small shared living arrangements designed to serve people who would otherwise require or be at risk of nursing facility placement because they can no longer live alone. These individuals also do not have family members or others who can assist them with ongoing support needs. The benefits offer assistance with daily living activities, and support the member’s full participation in community activities. The Department of Intellectual and Developmental Disabilities (DIDD) conducts an initial survey of all newly-licensed CLS and CLS-FM providers. The initial survey includes an on-site visit to the home to observe service delivery in action. It also includes an administrative review of the agency’s compliance with program requirements. DIDD will also conduct annual quality surveys of these providers, including on-site visits with members regarding their experience of care in the CHOICES program.
LTSS Quality Assurance Surveys of Employment and Community First CHOICES provider:
With the implementation of Employment and Community First CHOICES, DIDD will partner with TennCare to conduct Quality Monitoring Surveys for Employment and Community First CHOICES providers of CLS and CLS-FM services as well as providers of other specified Employment and Community First CHOICES HCBS. The surveys include an initial, onsite consultative survey and subsequent annual surveys In the Employment and Community First CHOICES program, compliance assessment is a function of the MCO credentialing and re-credentialing process, as well as ongoing provider monitoring in a managed care environment. This approach to quality monitoring reflects the new benefit structure and expectations in Employment and

56
Community First CHOICES with particular focus on employment and integrated community living. This quality assurance model includes performance measures and processes for discovery, remediation, and ongoing data analysis as well as quality improvement. Highest quality providers will be expected to demonstrate strong policies and related strategies that are being appropriately and consistently implemented by all staff, for all people receiving services, with quality outcomes resulting for those served. It was designed to encourage and assist providers to engage in continuous quality improvement. This model is aligned with a continued focus on person-centered thinking, helping people have meaningful and fulfilling lives.
Readiness Reviews
TennCare conducts readiness reviews with the MCOs and other contractors whenever there are substantial changes to the contract requirements. This allows us to determine if the contractor is adequately prepared to implement programmatic changes. These reviews consist of a document review as well as an onsite review of critical processes and operating functions. Feedback is provided to the contractor and they are required to implement corrections before proceeding. Readiness reviews were conducted with the MCOs implementing Employment and Community First CHOICES prior to July 1, 2016. These reviews included IT system readiness testing, desk reviews of all required documentation, demonstration of reporting abilities and onsite review of processes to demonstrate compliance.
Critical Incidents, Reportable Events, and Complaints
TennCare has a mechanism within both the Division of Quality Oversight and LTSS for addressing critical incidents, reportable events, and quality of care concerns. The Division of Quality Oversight monitors critical incidents occurring during the delivery of home health services, and the Division of LTSS monitors critical incidents occurring during the delivery of CHOICES services and Reportable Events occurring during the delivery of ECF CHOICES services. These processes include tracking, receiving information from the MCOs, and resolving issues if possible. As a result staff have the ability to observe trends in MCC or program performance and utilize this information in quality improvement activities.
Dental Benefits Manager (DBM) Reports and Other Deliverables
The DBM is responsible for submitting a variety of monthly, quarterly, and annual reports and other deliverables through Team Track, TennCare’s secure tracking system. These reports are reviewed by the appropriate business owner at TennCare and a Corrective Action Plan is issued for reports or other deliverables deemed deficient. Liquidated damages may be applied for deficiencies. Examples of DBM reports include Fraud and Abuse activities, QI/UM Committee Meeting minutes, Quarterly Outreach Activities, Case Referral and Corrective Action Assistance, Enrollee Cost Sharing, Quarterly Non-discrimination Compliance, Annual Member Satisfaction Surveys, Annual Provider Satisfaction Surveys, Annual Quality Improvement Activity (QIA) Dental Studies, and Annual QMP Report.
The DBM is required to submit two PIPs related to children’s clinical dental care or administrative process annually. After three years, a decision will be made jointly between the DBM and TennCare on the continuation of the PIP.
Qsource conducts an Annual Quality Survey of the DBM to assure compliance with contractual requirements. A detailed written report of findings is provided by the EQRO. If the DBM scores less than 100% on any element, a Corrective Action Plan must be submitted and is reviewed by both Qsource and TennCare to assure the DBM takes appropriate action.

57
The DBM is required to conduct both a Customer Satisfaction Survey and a Provider Satisfaction Survey and report on the findings annually.
The DBM is responsible for maintaining and managing an adequate statewide dental provider network, processing and paying claims, managing program data, conducting utilization management and utilization review, and detecting fraud and abuse, as well as meeting utilization benchmarks for annual dental screening percentages, annual dental participation ratios, or outreach efforts calculated to ensure participation of all children who have not received screenings.
External Quality Review
CMS Requirement: Include a description of the state’s arrangements for an annual, external, independent quality review of the quality, access, and timeliness of the services covered under each MCO and PIHP contract. Identify what entity will perform the EQR and for what period of time. (42 CFR § 438.204(d)) Tennessee contracts with Qsource to provide External Quality Review (EQR) activities. The services to be provided under this contract include multiple tasks and deliverables that are consistent with applicable federal EQR regulations and protocols for Medicaid Managed Care Organizations and state-specific requirements related to federal court orders. This contract allows the State to be compliant with Federal EQR regulations and rules and to measure MCC-specific compliance with the TennCare Section 1115 Waiver. The Annual Quality Survey must include, but not be limited to, review of enrollee rights and protections, quality assessment and performance improvement, structure and operation standards, measurement and improvement standards, and compliance with the appeal process. The survey process includes document review, interviews with key MCC personnel, and an assessment of the adequacy of information management systems. In addition to this survey, QSource conducts Performance Improvement Project validations and Performance Measure Validations in accordance with federal requirements. Qsource also conducts an Annual Network Adequacy Survey to determine the extent to which the MCCs’ networks are compliant with contractual requirements.
CMS Requirement: Identify what, if any optional EQR activities the state has contracted with the External Quality Review Organization (EQRO) to perform. The five optional activities include: validation of encounter data reported by an MCO or PIHP; administration or validation of consumer or provider surveys of quality of care; calculation of performance measures in addition to those reported by an MCO or PIHP and validated by an EQRO; conduct of performance improvement projects (PIPs) in addition to those conducted by an MCO or PIHP and validated by an EQRO; and conduct of studies on quality and focus on a particular aspect of clinical or nonclinical services at a point in time. While Tennessee has not required the EQRO to conduct any of the specified optional activities, Qsource has assisted TennCare with a number of other activities that are not required by CMS. These activities are as follows:
Participation in MCO collaborative workgroups.
Training of MCO staff on conducting Performance Improvement Projects.
Quarterly validation of the accuracy of provider information reported by the MCOs.
Preparation of an annual comparative analysis of HEDIS measures, Relative Resource Use Measures,
58
and CAHPS measures provided to TennCare by D-SNPS who have signed a MIPPA Agreement. Because the health plans are required to submit the measures listed above and because of improved statistical capability within TennCare, the measures that QSource might otherwise calculate are limited.
Preparation of an Annual Impact Analysis Report outlining national initiatives/changes that have potential to impact managed care in Tennessee.
Planning and execution of an educational meeting three times a year for TennCare’s Quality Oversight staff as well as all MCOs and the DBM.
Analysis of the National Core Indicators – Aging and Disabilities Survey.
Assisting the Division of Quality Oversight with its strategic planning sessions and Quality Strategy development.
Providing technical assistance to MCCs on a variety of topics including HEDIS and CAHPS reporting.
CMS requirement: If applicable, identify the standards for which the EQR will use information from Medicare or private accreditation reviews. This must include an explanation of the rationale for why the Medicare or private accreditation standards are duplicative to those in 42 CFR § 438.204(g). (42 CFR § 438.360(b))
Below is a table reflecting those contractual standards that are deemed met by the NCQA Accreditation Survey. Annually all contractual requirements are compared with the most current NCQA standards. Those contractual requirements that are greater than the comparable NCQA standard remain a part of the TennCare Annual Quality Survey. If any contractual standards are equal to or lesser than the NCQA standards they will be deemed met by the NCQA survey.

59
State Requirements Deemed Met by NCQA Accreditation Survey 2017 State Standards 2017 NCQA Accreditation Standards
CRA § 2.11.1.5.-2.11.1.5.1-4 (E/W, Middle, & TCS) QI 3B Affirmative Statement
The contractor may not prohibit or other-wise restrict, a health care professional acting within the lawful scope of practice, from advising or advocating on behalf of a member who is his or her patient for the following:
The member’s health status or medical, behavioral health, or long-term care treatment options, including alternative treatment that may be self- administered; Any information the member needs in order to decide among all relevant treatment options; The risks, benefits, and consequences of treatment or non-treatment; or The member’s right to participate in decisions regarding his or her health care, including the right to refuse treatment, and to express preferences about future treatment decisions.
Contracts with practitioners include an affirmative statement indicating that practitioners may freely communicate with patients about their treatment, regardless of benefit coverage limitations.
CRA § 2.18.3-2.18.3.1.4 (E/W, Middle, & TCS)
NET 1A - Cultural Needs and Preferences RR 3, Element B, Interpreter Services
As required by 42 CFR 438.206, the CONTRACTOR and its Providers and Sub-contractors that are providing services pursuant to this Contract shall participate in the State’s efforts to promote the delivery of services in a culturally competent manner to all enrollees, including those with Limited English Proficiency, disabilities, and diverse cultural and ethnic backgrounds regardless of an enrollee’s gender, sexual orientation, or gender identify. This includes the CONTRACTOR emphasizing the importance of network providers to have the capabilities to ensure physical access, accommodations, and accessible equipment for the furnishing of services with physical or mental disabilities.
The organization assesses the cultural, ethnic, racial and linguistic needs of its members and adjusts the availability of practitioners within its network, if necessary. Based on the linguistic need of its subscribers, the organization provider interpreter or bilingual services in its Member Services Department and telephone functions.

60
CRA § 2.8.4.3.2 QI 6, Elements A-J
The CONTRACTOR shall develop and operate the “opt out” health risk management program per NCQA standard QI 6 for disease management. Program services shall be provided to eligible members un-less they specifically ask to be excluded.
QI 6A– Program Content The content of the organization’s DM programs addresses the following for each condition. 1. Condition monitoring (including self-monitoring, and
medical testing) 2. Adherence to treatment plan (including medication
adherence, as appropriate) 3. Medical and behavioral health co-morbidities and
other health conditions (e.g., cognitive deficits, physical limitations)
4. Health behaviors 5. Psychosocial issues 6. Depression screening 7. Providing information about the patient’s condition to
caregivers who have patient’s consent 8. Encouraging patients to communicate with their
practitioners about their health conditions and treatment.
9. Additional resources external to the organization, as appropriate.
QI 6B–Identifying Members for DM Programs The organization uses the following sources to identify members who qualify for DM programs: 1. Claim or encounter data 2. Pharmacy data 3. Health appraisal results 4. Laboratory results 5. Data collected through the UM process, case
management process, or care management process 6. Data from health management, wellness, or health
coaching programs 7. Information from Electronic Health Records EHR 8. Member and practitioner referrals
QI 6C–Frequency of Member Identification The organization systematically identifies members who qualify for each of its DM programs.
QI 6D–Providing Members with Information The organization provides eligible members with the following written information about the program: 1. How to use the services 2. How members become eligible to participate 3. How to opt in or opt out

61
QI 6E–Interventions Based on Assessment The organization provides interventions to members based on assessment.
QI 6F–Eligible Member Active Participation The organization measures active participation rates annually.
QI 6G–Informing and Educating Practitioners The organization provides practitioners with written information about the DM program that includes the following:
Instructions on how to use disease management services. How the organization works with a practitioner’s patients in the program.
QI 6H Integrating Member Information The organization integrates information from the following systems to facilitate access to member health information for continuity of care: 1. A health information line, if applicable 2. A DM program 3. A case management program 4. A UM program, if applicable 5. A wellness program, if applicable
QI 6I–Experience with Disease Management The organization annually evaluates experience with its disease management services by: 1. Analyzing member feedback 2. Analyzing member complaints
QI 6J–Measuring Effectiveness The organization employs and tracks one performance measure for each DM program. Each measure: 1. Addresses a relevant process or outcome 2. Produces a quantitative result 3. Is population based 4. Uses data and methodology that are valid for the
process or outcome being measured 5. Has been analyzed in comparison with a benchmark
or goal

62
CRA § 2.8.4.7.3 QI 5 Complex Case Management
The CONTRACTOR shall develop and implement the Complex Case Management Program according to NCQA standard QI 5 for complex case management.
QI 5A–Population Assessment The organization annually: 1. Assesses the characteristics and needs of its member
population and relevant subpopulations 2. Assess the needs of children and adolescents 3. Asses the needs of individuals with disabilities 4. Assess the needs of individuals with serious and
persistent mental illness (SPMI) 5. Reviews its complex case management processes and
updates them, if necessary to address member needs 6. Reviews its complex case management resources and
updates them, if necessary to address member needs
QI 5B-Program Description The description of the organization’s complex case management program includes: 1. Evidence used to develop the program 2. Criteria for identifying members who are eligible for
the program 3. Services offered to members 4. Defined program goals 5. How case management services are integrated with
the services of others involved in the member’s care
QI 5C–Identifying Members for Case Management The organization uses the following sources to identify members for complex case management: 1. Claims or encounter data 2. Hospital discharge data 3. Pharmacy data, if applicable 4. Data collected through UM management process, if
applicable 5. Data supplied by purchasers, if applicable 6. Data supplied by members or caregivers 7. Data supplied by practitioners
QI 5D – Access to Case Management The organization has multiple avenues for members to be considered for complex CM services, including: 1. Health information line referral, if applicable 2. DM program referral 3. Discharge planner referral 4. UM referral, if applicable. 5. Member or caregiver referral 6. Practitioner referral

63
QI 5E–Case Management Systems The organization uses CM systems that support: 1. Evidence-based clinical guidelines or algorithms to
conduct assessment and management 2. Automatic documentation of the staff member’s ID
and date, and time of action on the case or when interaction with the member occurred
3. Automated prompts for follow-up, as required by the case management plan.
QI 5F–Case Management Process The organization’s complex case management procedures address the following: 1. Initial assessment of members’ health status,
including condition-specific issues 2. Documentation of clinical history, including
medications 3. Initial assessment of the activities of daily living 4. Initial assessment of behavioral health status,
including cognitive functions 5. Initial assessment of psychosocial issues 6. Initial assessment of life-planning activities 7. Evaluation of cultural and linguistic needs,
preferences, or limitations 8. Evaluation of visual and hearing needs,
preferences, or limitations 9. Evaluation of caregiver resources and
involvement 10. Evaluation of available benefits 11. Evaluation of community resources 12. Development of an individualized case
management plan, including prioritized goals, that considers the member’s and caregivers’ goals, preferences and desired level of involvement in the CM plan
13. Identification of barriers to a member meeting goals or complying with the plan
14. Facilitation of member referrals to resources and follow-up process to determine whether members act on referrals
15. Development of a schedule for follow-up and communication with members
16. Development and communication of member self-management plans
17. A process to assess members’ progress against case management plans for members

64
QI5G – Initial Assessment: An NCQA review of the organization’s Complex Case Management files demonstrates that the organization follows its’ documented processes for: 1. Initial assessment of member health status, including
condition-specific issues 2. Documentation of clinical history, including medications 3. Initial assessment of activities of daily living 4. Initial assessment of behavioral health status,
including cognitive functions 5. Initial assessment of psychosocial issues 6. Evaluation of cultural and linguistic needs,
preferences or limitations 7. Evaluation of visual and hearing needs, preferences or
limitations 8. Evaluation of caregiver resources and involvement 9. Evaluation of available benefits 10. Evaluation of available community resources 11. Assessment of life-planning activities
QI 5H–Case Management-Ongoing Management The NCQA review of a sample of organization’s complex case management files that demonstrates that the organization follows its documented processes for: 1. Development of case management plans, including
prioritized goals, that take into account member and caregivers’ goals, preferences and desired level of involvement in the complex case management program
2. Identification of barriers to meeting goals and complying with the plans
3. Development of schedules for follow-up and communication with members.
4. Development and communication of member self- management plans
5. Assessment of progress against case management plans and goals, and modification as needed.
QI 5I–Experience with Case Management At least annually, the organization evaluates experience with its complex case management program by: 1. Obtaining feedback from members 2. Analyzing member complaints

65
QI 5J-Measuring Effectiveness The organization annually measures the effectiveness of its complex case management program using three measures. For each measure, the organization: 1. Identifies a relevant process or outcome 2. Uses valid methods that provide quantitative results 3. Sets a performance goal 4. Clearly identifies measure specifications 5. Collects data and analyzes results 6. Identifies opportunities for improvement if applicable.
QI 5K – Action and Remeasurement
Based on the results of its measurement and analysis of complex case management effectiveness and satisfaction, the organization:
Implements at least one intervention to improve clinical performance (from Element J), if applicable Implements at least one intervention to improve member satisfaction (from Element I), if applicable Remeasures to determine impact on clinical performance , if applicable Remeasures to determine impact on member experience, if applicable.
CRA § 2.14.1.6 - 2.14.1.6.5 UM 2A - UM Criteria
The UM program shall have criteria that: Are objective and based on medical, behavioral, health and/or long-term care evidence, to the extent possible. Are applied based on individual need. Are applied based on an assessment of the local delivery system. Involve appropriate practitioners in developing, adopting, and reviewing them; and Are annually reviewed and updated as appropriate.
The organization: 1. Has written UM decision-making criteria that are
objective and based on medical evidence. 2. Has written policies for applying the criteria based on
individual needs 3. Has written policies for applying the criteria based on
an assessment of the local delivery system 4. Involves appropriate practitioners in developing,
adopting and reviewing criteria 5. Annually reviews the UM criteria and the procedures
for applying them, and updates the criteria when appropriate

66
CRA § 2.14.1.8 (E/W, Middle and TCS) UM 4 - Appropriate Professionals The CONTRACTOR shall use appropriately licensed professionals to supervise all medical necessity decisions and specify the type of personnel responsible for each level of UM, including prior authorization and decision making. The CONTRACTOR shall have written procedures documenting access to Board Certified Consultants to assist in making medical necessity determinations. Any decision to deny a service authorization request or to authorize a service in an amount, duration, or scope that is less than requested shall be made by a physical health or behavioral health care professional who has appropriate clinical expertise in treating the member’s condition or disease or, in the case of long-term care services, a long-term care professional who has appropriate expertise in providing long-term care services.
Element A: The organization has written procedures: Requiring appropriately licensed professionals to supervise all medical necessity decisions Specifying the type of personnel responsible for each level of UM decision-making.
Element C: The organization uses a physician or other health care professional, as appropriate, t o review any non-behavioral healthcare denial based on medical necessity. Element D: The organization uses a physician or appropriate behavioral health care practitioner, as appropriate, to review any behavioral healthcare denial of care based on medical necessity. Element E: The organization uses a physician or a pharmacist to review pharmacy denials based on medical necessity. Element F: The organization
Has written procedures for using board-certified consultants to assist in making medical necessity determinations Provides evidence that organization uses board- certified consultants for medical necessity determinations.
CRA § 2.14.1.10 UM 4G – Affirmative Statement about Incentives The CONTRACTOR shall have mechanisms in place to ensure that required services are not arbitrarily denied or reduced in amount, duration, or scope solely because of the diagnosis, type of illness or condition.
The organization distributes a statement to all members and to all practitioners, providers, and employees who make UM decisions, affirming the following:
UM decision making is based only on appropriateness of care and service and existence of coverage. The organization does not specifically reward practitioners or other individual for issuing denials of coverage. Financial incentives for UM decision makers do not encourage decisions that result in underutilization.

67
CRA § 2.14.1.11 UM 4G – Affirmative Statement about Incentives The CONTRACTOR shall assure, consistent with 42 CFR § 438.6(h), 42 CFR § 422.208 and § 422.210, that compensation to individuals or entities that conduct UM activities is fo r the indiv idua l or ent ity not structured so as to provide incentives to deny, limit, or discontinue medically necessary covered services to any member.
The organization distributes a statement to all members and to all practitioners, providers, and employees who make UM decisions, affirming the following:
UM decision making is based only on appropriateness of care and service and existence of coverage. The organization does not specifically reward practitioners or other individual for issuing denials of coverage. Financial incentives for UM decision makers do not encourage decisions that result in underutilization.
CRA § 2.15.1.2 QI 2B – Informing Members The CONTRACTOR shall make all information about i t s QM/QI program available to providers and members.
The organization annually makes information about its QI program available to members.
CRA § 2.27.2 & 2.27.5.7 (E/W, Middle, & TCS) MED 5 Element B – Privacy and Confidentiality In accordance with HIPAA/HITECH regulations, the CONTRACTOR shall, at a minimum: Make available to TENNCARE enrollees the right to amend their PHI in accordance with the federal HIPAA regulations. The CON-TRACTOR shall also send information to enrollees educating them of their rights and necessary steps in this regard.
The organization has policies and procedures that address members' right to authorize or deny the release of PHI beyond uses for treatment, payment or health care operations.

68
CRA § 2.26.1; 2.26.1.1; 2.26.1.2; 2.26.1.3; 2.26.1.4; 2.26.1.5; 2.26.1.6 CR 8 – Elements A, C, and E
If the CONTRACTOR delegates responsibilities to a subcontractor, the CONTRACTOR shall ensure that the subcontracting relationship and subcontracting document(s) comply with federal requirements, including, but not limited to, compliance with the applicable provisions of 42 CFR 438.230(b) and 42 CFR 434.6 as described below and as specified in Contract Section D.5.
The CONTRACTOR shall evaluate the prospective subcontractor’s ability to per-form the activities to be delegated. The CONTRACTOR shall require that the agreement be in writing and specify the activities and report responsibilities delegated to the subcontractor and provide for revoking delegation or imposing other sanctions if the sub-contractor’s performance is inadequate. Effective with any new subcontracts or upon the next amendment to existing subcontracts, the CONTRACTOR shall include a requirement that the sub-contract may be terminated by the CONTRACTOR for convenience and without cause upon a specified number of day’s written notice. The CONTRACTOR shall monitor the subcontractors’ performance on an on-going basis and subject it to formal review, on at least an annual basis consistent with NCQA standards and state MCO laws and regulations. The CONTRACTOR shall identify deficiencies or areas for improvement, and the CONTRACTOR and the subcontractor shall take corrective action as necessary. If the subcontract is for purposes of providing or securing the provision of covered services to enrollees, the CONTRACTOR shall ensure that all requirements described in Section A.2.12 of this Contract are included in the subcontract and/or a separate provider agreement executed by the appropriate parties.
CR 8A Delegation Agreement- The written delegation agreement: 1. Is mutually agreed upon 2. Describes the delegated activities and the
responsibilities of the organization and the delegated entity
3. Requires at least semiannual reporting of the dele-gated entity to the organization
4. Describes the process by which the organization evaluates the delegated entity’s performance
5. Specifies that the organization retains the right to approve, suspend, and terminate individual practitioners, providers and sites, even if the organization delegates decision making.
6. Describes the remedies available to the organization if the delegated entity does not fulfill its obligations, including revocation of the delegation agreement.
CR 8A Factor 5 Right to Approve, Suspend and Terminate- No additional explanation required. CR 8E Opportunities for Improvement- For delegation arrangements that have been in effect for more than 12 months, at least once in each of the past 2 years, the organization identified and followed up opportunities for improvement, if applicable.

69
CMS Requirement: If applicable, for MCOs or PIHPs serving only dual eligibles, identify the mandatory activities for which the state has exercised the non-duplication under 42 CFR § 438.360(c) and include an explanation of the rationale for why the activities are duplicative to those under 42 CFR § 438.358(b)(1) and (b)(2). (CRA § 438.360(c)(4))
Not applicable.

70
SECTION III: STATE STANDARDS Access Standards
CMS Requirement: This section should include a discussion of the standards that the state has established in the MCO/PIHP contracts for access to care, as required by 42 CFR, Part 438, subpart D. These standards should relate to the overall goals and objectives listed in the quality strategy’s introduction. States may either reference the access to care provisions from the state’s managed care contracts or provide a summary description of the contract provisions. CMS recommends states minimize reference to contract language in the quality strategy. However, if the state chooses the latter option, the summary description must be sufficiently detailed to offer a clear picture of the specific contract provisions and be written in language that may be understood by stakeholders who are interested in providing input as part of the public comment process.
STATE ACCESS STANDARDS AS REQUIRED BY 42 CFR, PART 438, SUBPART D 42 CFR § 438.206 AVAILABILITY OF SERVICES
42 CFR § 438.206(b)(1) Maintains and monitors a network of appropriate providers The Contractor Risk Agreement (CRA) between TennCare and the MCOs addresses provider networks in section 2.11 including primary care providers, specialty service providers, prenatal care providers, behavioral health services, long-term services & supports providers, and safety net providers; credentialing and other certification; and network notice requirements. CRA § 2.12 addresses provider agreements. CRA § 2.18 addresses customer service for members, including member services toll-free phone line, interpreter/translation services, cultural competency, and member involvement with behavioral health services. CRA Attachment III addresses general access standards and CRA Attachment IV addresses specialty network standards. CRA Attachment V addresses access and availability for behavioral health services.
42 CFR § 438.206(b)(2) Female enrollees have direct access to a women’s health specialist CRA § 2.11.4.1 states that a sufficient number of providers must be enrolled in the TennCare program so that prenatal or other medically necessary covered services are not delayed or denied to pregnant women at any time, including during their presumptive eligibility period. Additionally, the CONTRACTOR shall make services available from non-contract providers, if necessary, to provide medically necessary covered services to a woman enrolled in the CONTRACTOR’s MCO.
42 CFR § 438.206(b)(3) Provides for a second opinion from a qualified health care professional CRA Section 2.6.4 provides for a second opinion in any situation where there is a question concerning a diagnosis or the options for surgery or other treatment of a health condition when requested by a member, parent, and/or legally appointed representative. The second opinion must be provided by a contracted qualified health care professional or the MCO shall arrange for a member to obtain one from a non-contract provider. The second opinion shall be provided at no cost to the member.

71
42 CFR § 438.206(b)(4) Adequate and timely coverage of services not available in network CRA § 2.11.1.9 States if the MCO is unable to provide medically necessary covered services to a particular member using contract providers, it must adequately and timely cover these services for that member using non-contract providers, for as long as the provider network is unable to provide them. At such time that the required services become available within the CONTRACTOR’s network and the member can be safely transferred, the CONTRACTOR may transfer the member to an appropriate contract provider as specified in § A.2.9.4.
42 CFR § 438.206 (b)(5) Out of network providers coordinate with the MCO or PIHP with respect to CRA § 2.13.12-15 address circumstances under which out-of-network providers may seek payment from the MCO. It states the following:
The MCO shall pay for any medically necessary covered services provided to a member by a non- contract provider at the request of a contract provider; The payment shall not be less than 80% of the rate that would have been paid by the MCO if the member had received the services from a contract provider; and The MCO shall only pay for covered long-term care services for which the member was eligible and that were authorized by the MCO in accordance with the requirements of this contract.
42 CFR § 438.206(b)(6) Credential all providers as required by 438.214 CRA § 2.11.9 addresses credentialing of both contract and non-contract providers. CRA § 2.11.9.1.1 states the MCCs shall utilize the current NCQA Standards and Guidelines for the Accreditation of MCOs for the credentialing and recredentialing of licensed independent providers and provider groups with whom it contracts or employs and who fall within its scope of authority and action. CRA § 2.11.9.2.1 states the MCCs must utilize the current NCQA standards for credentialing and recredentialing of licensed independent providers with whom it does not contract but with whom it has an independent relationship. An independent relationship exists when the CONTRACTOR selects and directs its members to see a specific provider or group of providers. CRA § 2.11.9.2.2 states that all credentialing applications shall be completely processed within 30 calendar days of receipt of a completed credentialing application, including all necessary documentation and attachments, and a signed contract/agreement if applicable. Completely process shall mean that the CONTRACTOR shall review, approve and load approved applicants to its provider files in its claims processing system or deny the application and assure that the provider is not used by the CONTRACTOR.

72
42 CFR § 438.206(c)(1)(i) Providers meet state standards for timely access to care and services CRA Attachment III states that, in general, MCOs shall provide available, accessible, and adequate numbers of institutional facilities, service locations, service sites, and professional, allied, and paramedical personnel for the provision of covered services, including all emergency services, on a 24 hour a day, seven day a week basis. At a minimum, this shall include: Primary Care Physician or Extender
Rural – 30 miles. Urban – 20 miles. Patient Load – 2,500 or less for physician; one-half this for a physician extender. Appointment/Waiting times – Not to exceed 3 weeks from date of a patient’s request for regular appointments and 48 hours for urgent care. Waiting times shall not exceed 45 minutes. Documentation/Tracking requirements: Documentation – Plans must have a system in place to document appointment scheduling times. Tracking – Plans must have a system in place to document the exchange of member information if a provider, other than the primary care provider, (i.e., school-based clinic or health department clinic), provides health care.
Specialty Care and Emergency Care Referral appointments to specialists (e.g., specialty physician services, hospice care, home health care, substance abuse treatment, rehabilitation services, etc.) shall not exceed 30 days for routine care or 48 hours for urgent care. All emergency care is immediate, at the nearest facility available, regardless of contract. Waiting times shall not exceed 45 minutes.
Hospitals Transport distance will be the usual and customary, not to exceed 30 miles, except in rural areas where access distance may be greater. If greater, the standard needs to be the community standard for accessing care, and exceptions must be justified and documented to the State on the basis of community standards.
Long-Term Care Services Transport distance to licensed Adult Day Care providers will be the usual and customary, not to exceed 20 miles in urban areas, not to exceed 30 miles for suburban areas, and not to exceed 60 miles in rural areas except where community standards and documentation shall apply.
General Optometry Services: Transport distance will be the usual and customary, not to exceed 30 miles, except in rural areas where community standards and documentation shall apply. Appointment/Waiting Times: Usual and customary, not to exceed 3 weeks for regular appointments and 48 hours for urgent care. Waiting times shall not exceed 45 minutes.
All Other Services Usual and customary as defined by TennCare.
Access to specialty care (CRA Attachment IV) The MCO shall have provider agreements with providers practicing the following specialties: Allergy,Cardiology, Dermatology, Endocrinology, Otolaryngology, Gastroenterology, General Surgery, Nephrology, Neurology, Neurosurgery, Oncology/Hematology, Ophthalmology, Orthopedics, Psychiatry (adult, child, and adolescent), and Urology. Travel distance must not exceed 60 miles for at least 75% of non-dual members. Travel distance must not exceed 90 miles for all non-dual members.

73
Access for Behavioral Health Services (CRA Attachment V) Psychiatric Inpatient Hospital Services – Travel does not exceed 90 miles for at least 90% of members. Maximum time for admission/appointment is 4 hours (emergency involuntary), 24 hours (involuntary), and 24 hours (voluntary). 24 Hour Psychiatric Residential Treatment – Shall contract with at least one provider of service in each Grand Region (3 statewide) for adult members. Travel distance does not exceed 60 miles for at least 75% of child members and does not exceed 90 miles for at least 90% of child members. Maximum time for admission/appointment is within 30 calendar days. Outpatient Non-MD Services – Travel distance does not exceed 30 miles for all members. Maximum time for admission/appointment is within 10 business days; if urgent, within 48 hours. Intensive Outpatient [may include day treatment (adult), intensive day treatment (children/adolescents), or Partial Hospitalization] – Travel distance does not exceed 90 miles for at least 90% of members. Maximum time for admission/appointment is within 10 business days; if urgent, within 48 hours. Inpatient Facility Services (Substance Abuse) – Travel distance does not exceed 90 miles for at least 90% of members. Maximum time for admission/appointment is within 2 calendar days; for detoxification-within 4 hours in an emergency and 24 hours for non-emergency. 24 Hour Residential Treatment Services (Substance Abuse) – Shall contract with at least one provider of service in each Grand Region (3 Statewide) for adult members and one provider of service in the Grand Region for child members. Timeframe: within 10 business days. Outpatient Treatment Services (Substance Abuse) – Travel distance does not exceed 30 miles for all members. Timeframe: within 10 business days; within 24 hours for detoxification. Intensive Community Based Treatment Services– Not subject to geographic access standards. Timeframe: within seven calendar days. Tennessee Healthlink Services – Not subject to geographic access standards. Timeframe: within 30 calendar days. Psychosocial Rehabilitation (may include Supported Employment, Illness Management & Recovery, Peer Recovery services, or Family Support service) – Not subject to geographic access standards. Timeframe: within ten business days. Supported Housing – Not subject to geographic access standards. Timeframe: within 30 calendar days. Crisis Services (Mobile) – Not subject to geographic access standards. Timeframe: face-to-face contact within two hours for emergency situations and four hours for urgent situations. Crisis Stabilization – Not subject to geographic access standards. Timeframe: within 4 hours of referral.
42 CFR § 438.206(c)(1)(ii) Network providers offer hours of operation that are no less than the hours of operation offered to commercial enrollees or comparable to Medicaid Fee For Service
CRA section 2.12.9.65 require that providers offer hours of operation that are no less than the hours of operation offered to commercial enrollees.
42 CFR § 438.206(c)(1)(iii) Services included in the contract are available 24 hours a day, 7 days a week
CRA Section 2.7.1.1 requires that emergency services be available 24 hours a day, seven days a week.

74
42 CFR § 438.206(c)(1)(iv-v) Mechanisms/monitoring to ensure compliance by providers. Monitor
network providers regularly to determine compliance.
Each MCO has a provider services unit that monitors the network for compliance with certain standards. TennCare has contracted with Qsource, TennCare’s EQRO, to conduct a quarterly provider data validation (PDV) survey. The purpose of this activity is to determine the accuracy of the provider data files submitted by the TennCare MCCs and to use the results as a proxy to determine the extent to which providers are available and accessible to TennCare members. The survey is conducted using a hybrid methodology developed to maximize response rates. The survey consists of telephone calls and facsimile follow-up protocol as necessary. The validation tool was programmed into a Microsoft Access database and pre-populated with data elements from the MCC provider files. Qsource attempts to contact providers up to three times by telephone.
Providers were also notified of a toll-free number to allow the provider to call back if the time was not convenient. The following standards are monitored through this survey.
MCC Data Accuracy - Provider Credentialed Specialty/Behavioral Health Service Code. Provider Panel Status (Open/Closed) Routine and Urgent Care Services - Provider offices were questioned regarding whether they offered routine and/or urgent care during the time reported for validation. Accuracy was determined by comparing the responses to the thresholds specific to each provider. Services for Patients - Two questions were asked of the providers: 1) Do you provide services to patients less than 21 years of age? And 2) Do you provide services to patients 21 years of age and older? Primary Care Services Prenatal Care Services
42 CFR § 438.206(c)(2) Culturally competent services to all enrollees MCCs are contractually required in CRA 2.18.3 to participate in the State’s efforts to promote the delivery of services in a culturally competent manner to all enrollees, including those with Limited English Proficiency, disabilities and diverse cultural and ethnic backgrounds regardless of an enrollee's gender, sexual orientation, or gender identity. Additionally, the CRA 2.8.4.3.1 states that health coaching or other interventions for health risk management shall emphasize self-management strategies addressing healthy behaviors (i.e., weight management and tobacco cessation), self-monitoring, co-morbidities, cultural beliefs, depression screening, and appropriate communication with providers.
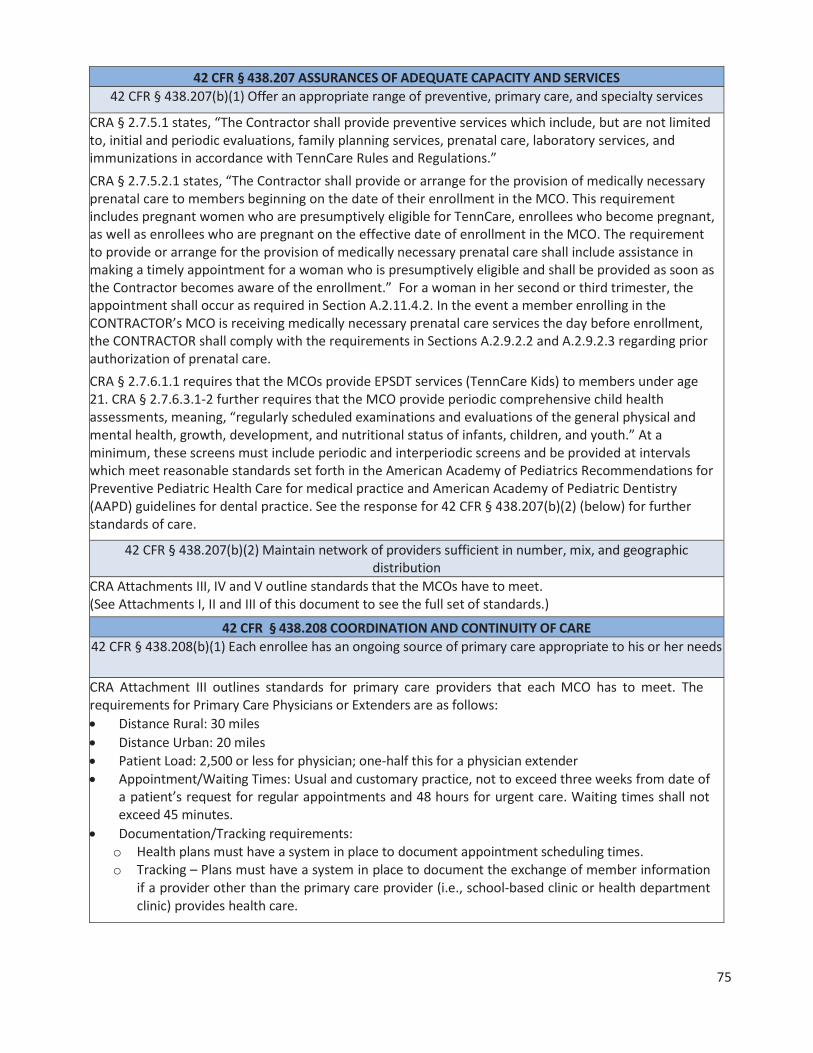
75
42 CFR § 438.207 ASSURANCES OF ADEQUATE CAPACITY AND SERVICES 42 CFR § 438.207(b)(1) Offer an appropriate range of preventive, primary care, and specialty services
CRA § 2.7.5.1 states, “The Contractor shall provide preventive services which include, but are not limited to, initial and periodic evaluations, family planning services, prenatal care, laboratory services, and immunizations in accordance with TennCare Rules and Regulations.” CRA § 2.7.5.2.1 states, “The Contractor shall provide or arrange for the provision of medically necessary prenatal care to members beginning on the date of their enrollment in the MCO. This requirement includes pregnant women who are presumptively eligible for TennCare, enrollees who become pregnant, as well as enrollees who are pregnant on the effective date of enrollment in the MCO. The requirement to provide or arrange for the provision of medically necessary prenatal care shall include assistance in making a timely appointment for a woman who is presumptively eligible and shall be provided as soon as the Contractor becomes aware of the enrollment.” For a woman in her second or third trimester, the appointment shall occur as required in Section A.2.11.4.2. In the event a member enrolling in the CONTRACTOR’s MCO is receiving medically necessary prenatal care services the day before enrollment, the CONTRACTOR shall comply with the requirements in Sections A.2.9.2.2 and A.2.9.2.3 regarding prior authorization of prenatal care. CRA § 2.7.6.1.1 requires that the MCOs provide EPSDT services (TennCare Kids) to members under age 21. CRA § 2.7.6.3.1-2 further requires that the MCO provide periodic comprehensive child health assessments, meaning, “regularly scheduled examinations and evaluations of the general physical and mental health, growth, development, and nutritional status of infants, children, and youth.” At a minimum, these screens must include periodic and interperiodic screens and be provided at intervals which meet reasonable standards set forth in the American Academy of Pediatrics Recommendations for Preventive Pediatric Health Care for medical practice and American Academy of Pediatric Dentistry (AAPD) guidelines for dental practice. See the response for 42 CFR § 438.207(b)(2) (below) for further standards of care.
42 CFR § 438.207(b)(2) Maintain network of providers sufficient in number, mix, and geographic distribution
CRA Attachments III, IV and V outline standards that the MCOs have to meet. (See Attachments I, II and III of this document to see the full set of standards.)
42 CFR § 438.208 COORDINATION AND CONTINUITY OF CARE 42 CFR § 438.208(b)(1) Each enrollee has an ongoing source of primary care appropriate to his or her needs
CRA Attachment III outlines standards for primary care providers that each MCO has to meet. The requirements for Primary Care Physicians or Extenders are as follows:
Distance Rural: 30 miles Distance Urban: 20 miles Patient Load: 2,500 or less for physician; one-half this for a physician extender Appointment/Waiting Times: Usual and customary practice, not to exceed three weeks from date of a patient’s request for regular appointments and 48 hours for urgent care. Waiting times shall not exceed 45 minutes. Documentation/Tracking requirements:
o Health plans must have a system in place to document appointment scheduling times. o Tracking – Plans must have a system in place to document the exchange of member information
if a provider other than the primary care provider (i.e., school-based clinic or health department clinic) provides health care.
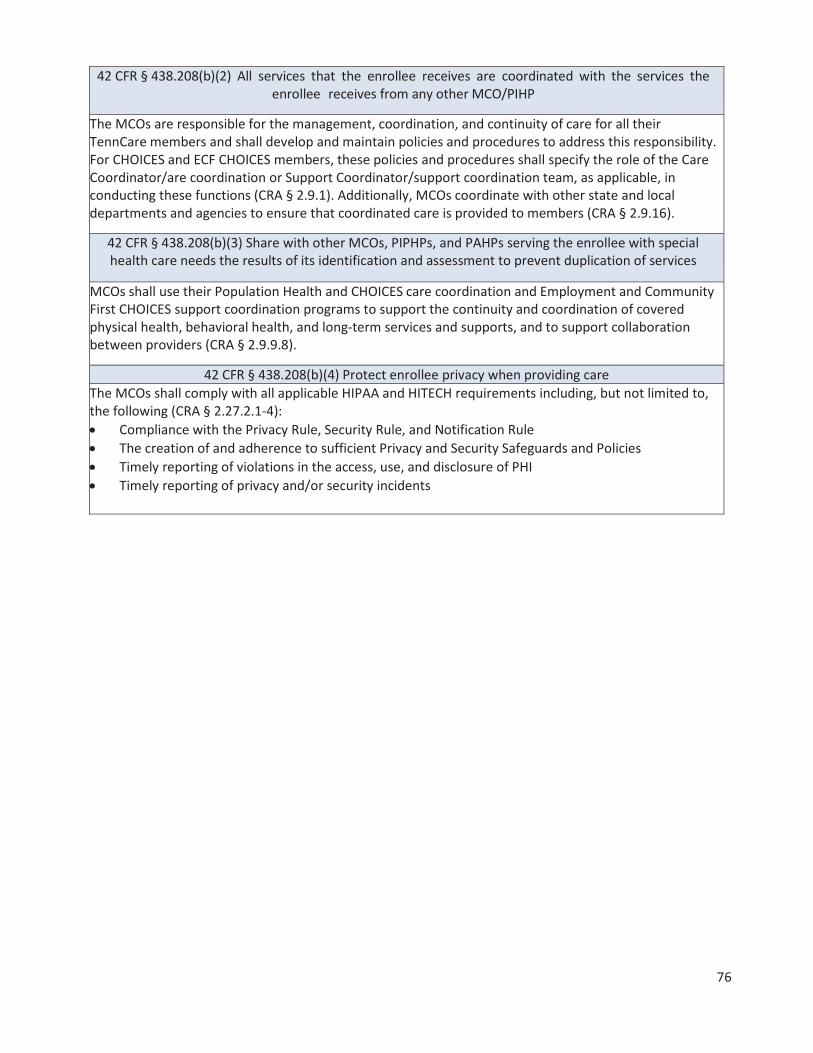
76
42 CFR § 438.208(b)(2) All services that the enrollee receives are coordinated with the services the enrollee receives from any other MCO/PIHP
The MCOs are responsible for the management, coordination, and continuity of care for all their TennCare members and shall develop and maintain policies and procedures to address this responsibility. For CHOICES and ECF CHOICES members, these policies and procedures shall specify the role of the Care Coordinator/are coordination or Support Coordinator/support coordination team, as applicable, in conducting these functions (CRA § 2.9.1). Additionally, MCOs coordinate with other state and local departments and agencies to ensure that coordinated care is provided to members (CRA § 2.9.16).
42 CFR § 438.208(b)(3) Share with other MCOs, PIPHPs, and PAHPs serving the enrollee with special health care needs the results of its identification and assessment to prevent duplication of services
MCOs shall use their Population Health and CHOICES care coordination and Employment and Community First CHOICES support coordination programs to support the continuity and coordination of covered physical health, behavioral health, and long-term services and supports, and to support collaboration between providers (CRA § 2.9.9.8).
42 CFR § 438.208(b)(4) Protect enrollee privacy when providing care The MCOs shall comply with all applicable HIPAA and HITECH requirements including, but not limited to, the following (CRA § 2.27.2.1-4):
Compliance with the Privacy Rule, Security Rule, and Notification Rule The creation of and adherence to sufficient Privacy and Security Safeguards and Policies Timely reporting of violations in the access, use, and disclosure of PHI Timely reporting of privacy and/or security incidents

77
42 CFR § 438.208(c)(1) State mechanisms to identify persons with special health care needs
CRA § 2.9.16.1-7 requires MCOs to coordinate with other state and local departments and agencies to ensure that coordinated care is provided to members. This includes, but is not limited to, coordination with:
Tennessee Department of Mental Health & Substance Abuse Services (TDMHSAS) and Tennessee Department of Intellectual & Developmental Disabilities (DIDD) for the purpose of interfacing with and assuring continuity of care and for coordination of specialized services in accordance with federal PASRR requirements; Tennessee Department of Children’s Services (DCS) for the purpose of interfacing with and assuring continuity of care; Tennessee Department of Health (DOH) for the purposes of establishing and maintaining relationships with member groups and health service providers; Tennessee Department of Human Services (DHS) and DCS Protective Services Section, for the purposes of reporting and cooperating in the investigation of abuse and neglect; Tennessee Department of Intellectual Disabilities Services (DIDD), for the purposes of coordinating physical and behavioral health services with HCBS available for members who are also enrolled in a Section 1915(c) HCBS waiver for persons with intellectual disabilities, and for purposes of ECF CHOICES, including intake, critical incident reporting and management, and quality monitoring; Area Agencies on Aging and Disability (AAADs) regarding intake of members new to both TennCare and CHOICES, and assisting CHOICES members in Groups 2 and 3 with the TennCare eligibility redetermination process; Tennessee Department of Education (DOE) and local education agencies for the purposes of coordinating educational services in compliance with the requirements of Individuals with Disabilities Education Act (IDEA) and to ensure school-based services for students with special needs are provided;
MCOs are responsible for the delivery of medically necessary covered services to school-aged children. MCOs are encouraged to work with school-based providers to manage the care of students with special needs. The State has implemented a process, referred to as TennCare Kids Connection, to facilitate notification of MCOs when a school-aged child enrolled in TennCare has an Individualized Education Plan (IEP) that identifies a need for medical services. In such cases, the school is responsible for obtaining parental consent to share the IEP with the MCO and for subsequently sending a copy of the parental consent and IEP to the MCO. The school is also responsible for clearly delineating the services on the IEP that the MCOs are to consider for payment. If a school-aged member, needing medical services, is identified by the CONTRACTOR by another means, the CONTRACTOR shall request the IEP from the appropriate school system. (CRA § 2.9.16.7.1)
42 CFR § 438.208(c)(2) Mechanisms to assess enrollees with special health care needs by appropriate health care professionals
For members determined to need a course of treatment or regular care monitoring, the MCO shall have a mechanism in place to allow members to directly access a specialist as appropriate for the members’ condition and identified needs (CRA § 2.14.3.3).
42 CFR § 438.208(c)(3) If applicable, treatment plans developed by the enrollee’s primary care provider with enrollee participation, and in consultation with any specialists caring for the enrollee;
approved in a timely manner; and in accord with applicable state standards
Not Applicable

78
42 CFR § 438.208(c)(4) Direct Access to specialists for enrollees with special health care needs
The MCOs shall establish and maintain a network of physician specialists that is adequate and reasonable in number, in specialty type, and in geographic distribution to meet the medical and behavioral health needs of its members (adults and children) without excessive travel requirements. (CRA § 2.11.3.2.1) TENNCARE will monitor CONTRACTOR compliance with specialty network standards on an ongoing basis. TENNCARE will use data from the monthly Provider Enrollment File required in CRA § A.2.30.8.1, to verify compliance with the specialty network requirements. TENNCARE will use these files to confirm the CONTRACTOR has a sufficient number and distribution of physician specialists and in conjunction with MCO enrollment data to calculate member to provider ratios. TENNCARE will also periodically phone providers listed on these reports to confirm that the provider is a contract provider as reported by the CONTRACTOR. TENNCARE shall also monitor appeals data for indications that problems exist with access to specialty providers. (CRA § 2.11.3.3.1)
42 CFR § 438.210 COVERAGE AND AUTHORIZATION OF SERVICES 42 CFR § 438.210(a)(1) Identify, define, and specify the amount, duration, and scope of each service.
See Attachment IV for covered benefits. 42 CFR § 438.210(a)(2) Services are furnished in an amount, duration, and scope that is no less
than those furnished to beneficiaries under fee-for-service Medicaid. All covered benefits are provided if medically necessary through a capitated arrangement with the MCCs.
42 CFR § 438.210(a)(3)(i) Services are sufficient in amount, duration, or scope to reasonably be expected to achieve the purpose for which the services are furnished.
CRA § 2.6.3.1 relates to Medical Necessity Determinations. It states that the MCCs may establish procedures for the determination of medical necessity and for the use of medically appropriate cost effective alternative benefits. The CONTRACTOR may also limit benefits for the purpose of utilization control in accordance with NCQA standards, as long as (1) the furnished benefits can reasonably achieve the purpose for which they are furnished, and as long as (2) the benefits furnished for enrollees with chronic conditions (or who require LTSS) are authorized in a manner that reflects the enrollee’s ongoing need for such benefits. See 42 CFR § 438.3(e)(2) and 42 CFR § 438.210(a)(4).
42 CFR § 438.210(a)(3)(ii) No arbitrary denial or reduction in service solely because of diagnosis, type of illness or condition
CRA § 2.6.3.2 shall use written criteria based on sound clinical evidence to make utilization decisions. The written criteria shall specify procedures for appropriately applying the criteria. The criteria must satisfy NCQA standards. The CONTRACTOR shall apply objective and evidence-based criteria and take individual circumstances and the local delivery into account when determining the medical appropriateness of health care services and § 2.6.3.3 The CONTRACTOR shall ensure that the services are sufficient in amount, duration, or scope to reasonably achieve the purpose for which the services are furnished. The CONTRACTOR shall not arbitrarily deny or reduce the amount, duration, or scope of a required service solely because of the diagnosis, type of illness, or condition.
42 CFR § 438.210(a)(3)(iii) Each MCO/PIHP may place appropriate limits on a service, such as medical necessity.
CRA § 2.6.3.2 and 2.6.3.3 state the MCCs may not employ, and shall not permit others acting on their behalf to employ, utilization control guidelines or other quantitative coverage limits, whether explicit or de facto, unless supported by an individualized determination of medical necessity based upon the needs of each TennCare enrollee and his/her medical history. The MCCs must not arbitrarily deny or reduce the amount, duration, or scope of a required service solely because of the diagnosis, type of illness, or condition.

79
42 CFR § 438.210(a)(5) Specify what constitutes “medically necessary services”.
CRA § 2.6.3 relates to Medical Necessity Determinations. It states that the MCCs may establish procedures for the determination of medical necessity with the determination being made on a case- by-case basis and in accordance with the definition of medical necessity defined in TCA 71-5-1944 and TennCare rules and regulations governing medical necessity, which are delineated at 1200-13-16. Specifically, to be medically necessary, the benefit must meet each of the following criteria:
It must be recommended by a licensed physician who is treating the enrollee or other licensed healthcare provider practicing within the scope of his or her license who is treating the enrollee; It must be required in order to diagnose or treat an enrollee’s medical condition; It must be safe and effective; It must not be experimental or investigational; and It must be the least costly alternative course of diagnosis or treatment that is adequate for the enrollee’s medical condition.
42 CFR § 438.210(b)(1) Each MCO/PIHP and its subcontractors must have written policies and procedures for authorization of services.
42 CFR § CFR § 438.210(b)(2)(i) Each MCO/PIHP must have mechanisms to ensure consistent application of review criteria for authorization decisions.
CRA § 2.14.1.8 states that MCOs shall use appropriately licensed professionals to supervise all medical necessity decisions and specify the type of personnel responsible for each level of UM, including prior authorization and decision making. They must also have written procedures documenting access to Board Certified Consultants to assist in making medical necessity determinations. Any amount, duration, or scope that is less than requested shall be made by a physical health or behavioral health care professional that has appropriate clinical expertise in treating the member’s condition or disease or, in the case of long-term care services, a long-term care professional that has appropriate expertise in providing long-term care services. CRA § 2.14.2.1 states that MCOs shall have in place, and follow, written policies and procedures for processing requests for initial and continuing prior authorizations of services and have in effect mechanisms to ensure consistent application of review criteria for prior authorization decisions. The policies and procedures shall provide for consultation with the requesting provider when appropriate. If prior authorization of a service is granted by the MCO and the service is provided, payment for the prior authorized service shall not be denied based on the lack of medical necessity, assuming that the member is eligible on the date of service, unless it is determined that the facts at the time of the denial of payment are significantly different than the circumstances which were described at the time the prior authorization was granted. CRA § 2.14.5.1 states that MCOs shall have in place an authorization process for covered long-term services and cost effective alternative services that is separate from but integrated with the prior authorization process for covered physical and behavioral health services.

80
42 CFR § 438.210(b)(3) Any decision to deny or reduce services is made by an appropriate health care professional.
CRA § 2.14.1.8states that MCOs shall use appropriately licensed professionals to supervise all medical necessity decisions and specify the type of personnel responsible for each level of UM, including prior authorizations and decision making. They shall also have written procedures documenting access to Board Certified Consultants to assist in making medical necessity determinations. Any decision to deny a service authorization request or to authorize a service in an amount, duration, or scope that is less than requested shall be made by a physical health or behavioral health care professional who has appropriate clinical expertise in treating the member’s condition or disease or, in the case of long-term care services, a long-term care professional who has appropriate expertise in providing long-term care services.
42 CFR § 438.210(c) Each MCO/PIHP must notify the requesting provider, and give the enrollee written notice of any decision to deny or reduce a service authorization request, or to authorize a service in an
amount, duration, or scope that is less than requested. 42 CFR § 438.210(d) Provide for the authorization decisions and notices as set forth in CFR § 438.210(d).
42 CFR § 438.210(e) Compensation to individuals or entities that conduct utilization management activities does not provide incentives to deny, limit, or discontinue medically necessary services.
CRA § 2.14.7, Notice of Adverse Benefit Determination Requirements, require MCOs to: CRA § 2.14.7.1 In accordance with 42 CFR § 438.210(c), the CONTRACTOR must notify the requesting provider, and give the enrollee written notice of any decision to deny a service authorization request, or to authorize a service in an amount, duration, or scope that is less than requested. The Notice of Adverse Benefit Determination must meet the requirements set forth in CRA § A.2.19.2. CRA § 2.14.7.2 The CONTRACTOR shall comply with all member notice provisions in TennCare rules and regulations. CRA § 2.14.7.3 The CONTRACTOR shall issue appropriate notice prior to any CONTRACTOR-initiated decision to reduce or terminate CHOICES or non-CHOICES nursing facility services and shall comply with all federal court orders, and federal and state laws and regulations regarding members’ transfer or discharge from nursing facilities.
Clearly document and communicate the reasons for each denial of a prior authorization request in a manner sufficient for the enrollee to understand the denial basis and decide about requesting reconsideration of or appealing the decision; Comply with all member notice provisions in TennCare rules and regulations; and Issue appropriate notice prior to any contractor-initiated decision to reduce or terminate CHOICES or non-CHOICES nursing facility services and shall comply with all federal court orders, and federal and state laws and regulations, regarding members’ transfer or discharge from nursing facilities.
Structure and Operations Standards
CMS Requirement: This section should include a discussion of the standards that the state has established in the MCO/PIHP contracts for structure and operations, as required by 42 CFR, § 438(D)D. These standards should relate to the overall goals and objectives listed in the quality strategy’s introduction. States may either reference the structure and operations provisions from the state’s managed care contracts, or provide a summary description of such provisions. CMS recommends states minimize reference to contract language in the quality strategy. However, if the state chooses the latter option, the summary description

81
must be sufficiently detailed to offer a clear picture of the specific contract provisions and be written in language that may be understood by stakeholders who are interested in providing input as part of the public comment process.
STATE STRUCTURE & OPERATIONS STANDARDS AS REQUIRED BY 42 CFR, PART 438, SUBPART D 42 CFR § 438.214 Provider Selection
42 CFR § 438.214(a) Written Policies and procedures for Selection and Retention of Providers. CRA § 2.11.1.3.3 states the MCO must have in place written policies and procedures for the selection and retention of providers. These policies and procedures must not discriminate against particular providers that service high risk populations or specialize in conditions that require costly treatment.
42 CFR § 438.214(b)(1) Uniform credentialing and recredentialing policy that each MCO/PIHP must follow.
CRA § 2.11.9.1 - Credentialing of Contract Providers: The MCO must utilize the current NCQA Standards and Guidelines for the Accreditation of MCOs for the credentialing and recredentialing of licensed independent providers and provider groups with whom it contracts or employs and who fall within its scope of authority and action. The MCO must completely process credentialing applications from all types of providers (physical health, behavioral health, and long-term care providers) within 30 calendar days of receipt of a completed credentialing application, including all necessary documentation and attachments, and a signed provider agreement. “Completely process” means that the MCO shall approve and load approved applicants to its provider files in its claims processing system or deny the application and assure that the provider is not used by the MCO. The MCO must ensure all providers submitted to it by the delegated credentialing agent are loaded to its provider files and into its claims processing system within 30 days of receipt.
CRA § 2.11.9.2 - Credentialing of Non-Contract Providers The MCO must utilize the current NCQA Standards and Guidelines for the Accreditation of MCOs for the credentialing of licensed independent providers with whom it does not contract but with whom it has an independent relationship. An independent relationship exists when the MCO selects and directs its members to see a specific provider or group of providers. The MCO must completely process credentialing applications within 30 calendar days of receipt of a completed credentialing application, including all necessary documentation and attachments, and a signed contract/agreement if applicable. “Completely process” means that the MCO shall review, approve, and load approved applicants to its provider files in its claims processing system or deny the application and assure that the provider is not used by the MCO. The MCO must notify TennCare when it denies a provider credentialing application for program integrity-related reasons or otherwise limits the ability of providers to participate in the program for program integrity reasons.
CRA § 2.11.9.3 - Credentialing of Behavioral Health Entities The MCO must ensure each behavioral health provider’s service delivery site meets all applicable requirements of law and has the necessary and current license/certification/accreditation/desig-nation approval per state requirements.
When individuals providing behavioral health treatment services are not required to be licensed or certified, it is the responsibility of the MCO to ensure, based on applicable state licensure rules and/or program standards, that they are appropriately educated, trained, qualified, and competent to perform their job responsibilities.

82
42 CFR § 438.214(d) MCOs/PIHPs may not employ or contract with providers excluded from Federal Health Care Programs.
CRA § 2.20.1.5 states, “The contractor, as well as its subcontractors and providers, whether contract or non-contract, shall comply with all federal requirements (42 CFR § 1002) on exclusion and debarment screening. All tax-reporting provider entities that bill and/or receive TennCare funds…..shall screen their owners and employees against the federal exclusion databases.” CRA § 2.20.3.6 states, “The contractor shall have provisions in its Compliance Plan regarding conducting monthly comparison of their provider files, including atypical providers, against both the Excluded Parties List System (EPLS) and the HHS-OIG List of Excluded Individuals/Entities (LEIE) and provide a report of the result of comparison to TENNCARE each month. The contractor shall establish an electronic database to capture identifiable information on the owners, agents and managing employees listed on providers’ Disclosure forms.” CRA § 2.20.3.7 states, “The contractor shall have provisions in its Compliance Plan regarding performing a monthly check for exclusions of their owners, agents and managing employees. The contractor shall establish an electronic database to capture identifiable information on its owners, agents and managing employees and perform monthly exclusion checking. The contractor shall provide the State Agency with such database and a monthly report of the exclusion check.”

83
42 CFR § 438.218 Enrollee Information
42 CFR § 438.218 Incorporate the requirements of 438.10
CRA § 2.17 incorporates the responses to 4 2 CFR § 438.10. Primary language is identified by the enrollment contractor at the time of each person’s application for TennCare services. If the primary language is omitted from the enrollment files received by the MCO, the MCO staff then collects the information during new member calls. Requirements for the MCOs are as follows:
Must submit all materials that will be distributed to members to TennCare for prior approval. This includes, but is not limited to member handbooks, provider directories, member newsletters, identification cards, fact sheets, notices, brochures, form letters, mass mailings, and system generated letters. Modifications to existing materials must also receive prior approval. All member materials must be worded at a sixth grade reading level and must be clearly legible. They must also be available in alternative formats for persons with special needs at no expense to the member. Formats may include Braille, large print, and audio, depending on the needs of the member. All vital documents must be translated and available in Spanish. Within 90 calendar days of notification from TennCare, all vital documents must be translated and available to each Limited English Proficiency (LEP) group identified by TennCare that constitutes 5% of the TennCare population or 1,000 enrollees, whichever is less. All written member materials contain language and communication taglines and civil rights notices, which inform members that free oral interpretation is available for any language, free written translation and auxiliary aids or services are available upon request, and how to ask for help with their services. The language taglines are printed in the top 17 prevalent non-English languages in Tennessee. The taglines also comply with the 18 point font requirements. Electronic information and services are readily accessible and incorporate the Section 508 guidelines and Web Content Accessibility Guidelines (WCAG) 2.0 AA. The MCOs may provide member materials electronically or on their websites as long as it meets the following requirements: (1) the material/information must be placed on the MCO’s website in a location that is prominent and readily accessible for applicants and members to link to from the MCO’s home page; (2) the material/information must be provided in a format that can be electronically saved and printed; and (3) if a member or applicant requests that the MCO mail them a copy of the material/information, the MCO must mail free of charge the material/information to them within five (5) days of that request. The MCO must provide written notice to members of any changes in policies or procedures described in written materials previously sent to members. They must provide written notice at least 30 days before the effective date of a request. The contractor must use the approved Glossary of Required Spanish Terms in the Spanish translation of all member materials. All educational materials must be reviewed and updated concurrently with the update of the Clinical Practice Guidelines to assure the materials reflect current evidence-based information.

84
The MCO must develop a member handbook based on a template provided by TennCare and update it periodically (at least annually). It must be distributed within 30 calendar days of receipt of notice of enrollment in the MCO or prior to enrollees’ enrollment effective date and at least annually thereafter. Members must receive a revised member handbook whenever material changes are made.
CRA § 2.17.4.6 requires that each member handbook include the following: Table of Contents. Explanation of how members will be notified of member-specific information such as effective date of enrollment, PCP assignment, and care coordinator assignment for CHOICES members or support coordinator assignment for Employment and Community First CHOICES members. Explanation of how members can request to change PCPs. Description of services provided including benefit limits, the consequences of reaching a benefit limit, non-covered services, and use of non-contract providers, including that members are not entitled to a fair hearing about non-covered services and that members shall use contract providers except in specified circumstances. Explanation that prior authorization is required for some services, including non-emergency services provided by a non-contract provider, and that service authorization is required for all long-term care services; that such services will be covered and reimbursed only if such prior authorization/service authorization is received before the service is provided; that all prior authorizations/service authorizations are null and void upon expiration of a member’s TennCare eligibility; and that the member shall be responsible for payment for any services provided after the member’s eligibility has expired. Descriptions of the Medicaid Benefits, Standard Benefits, and the covered long-term care services for CHOICES and Employment and Community First CHOICES members, by CHOICES group and Employment and Community First CHOICES group. Provide information regarding Employment and Community First CHOICES as specified in a template provided by TennCare. Description of TennCare cost sharing or patient liability responsibilities including an explanation that providers and/or the CONTRACTOR may utilize whatever legal actions are available to collect these amounts. Further, the information shall specify the instances in which a member may be billed for services, and shall indicate that the member may not be billed for covered services except for the amounts of the specified TennCare cost sharing or patient liability responsibilities and explain the member’s right to appeal in the event that they are billed for amounts other than their TennCare cost sharing or patient liability responsibilities. The information shall also identify the potential consequences if the member does not pay his/her patient liability, including loss of the member’s current nursing facility provider, disenrollment from CHOICES or Employment and Community First CHOICES, and, to the extent the member’s eligibility depends on receipt of long-term care services, loss of eligibility for TennCare. Information about preventive services for adults and children, including TennCare Kids; a listing of covered preventive services; and notice that preventive services are at no cost and without cost sharing responsibilities. Procedures for obtaining required services, including procedures for obtaining referrals to specialists as well as procedures for obtaining referrals to non-contract providers. The handbook shall advise members that if they need a service that is not available from a contract provider or MCO, for certain reasons, including, moral or religious reasons, they will be referred to a non-contract provider and any copayment requirements would be the same as if this provider were a contract provider.

85
Information on the CHOICES program, including a description of the CHOICES groups; eligibility for CHOICES; enrollment in CHOICES, including whom to contact at the MCO regarding enrollment in CHOICES; enrollment targets for Group 2 and Group 3 (excluding Interim Group 3), including reserve capacity and administration of waiting lists; and CHOICES benefits, including benefit limits, the individual cost neutrality cap for Group 2, and the expenditure cap for Group 3.
Information on the Employment and Community First CHOICES program including a description of the Employment and Community First CHOICES groups, eligibility for Employment and Community First CHOICES , enrollment in Employment and Community First CHOICES including who to contact at the MCO regarding enrollment in Employment and Community First CHOICES, and Employment and Community First CHOICES benefits including benefit limits and the individual expenditure caps for Employment and Community First CHOICES.
Information on care coordination for CHOICES members, including but not limited to the role of the care coordinator, level of care assessment and reassessment, needs assessment and reassessment, and care planning, including the development of a plan of care for members in CHOICES Groups 2 and 3.
Information on support coordination for Employment and Community First CHOICES members, including but not limited to the role of the support coordinator, level of care assessment and reassessment, needs assessment and reassessment, and care planning, including the development of a person centered support plan.
Information on the right of CHOICES and Employment and Community First CHOICES members to request an objective review by the State of their needs assessment and/or care planning processes and how to request such a review.
Information regarding consumer direction of eligible CHOICES and Employment and Community First CHOICES HCBS, including but not limited to the roles and responsibilities of the member or the member’s representative, the services that can be directed, the member’s right to participate in or voluntarily withdraw from consumer direction at any time, the role of and services provided by the FEA, and a statement that voluntary or involuntary withdrawal from consumer direction will not affect a member’s eligibility for CHOICES or Employment and Community First CHOICES.
Explanation of emergency services and procedures on how to obtain emergency services both in and out of the contractor’s service area, including but not limited to an explanation of post-stabilization services, the use of 911, locations of emergency settings, and locations for post-stabilization services.
Information on how to access the primary care provider on a 24 hour basis as well as the 24 hour nurse line. The handbook may encourage members to contact the PCP or 24 hour nurse line when they have questions as to whether they should go to the emergency room.
Information on how to access a care coordinator, including the ability to access a care coordinator after regular business hours through the 24 hour nurse triage/advice line. Notice of the right to file a discrimination complaint as provided for by applicable federal and state civil rights laws, including but not limited to Title VI of the Civil Rights Act of 1964, the Age Discrimination Act of 1975, Title IX of the Education Amendments of 1972, Section 504 of the Rehabilitation Act of 1973, and Titles II and III of the Americans with Disabilities Act of 1990, as well as a complaint form on which to do so. The notice must be considered a Vital Document and shall be available at a minimum in the English and Spanish languages. Also included are the language and communication taglines, which inform members that free oral interpretation is available for any language, free written translation and auxiliary aids or services are available upon request, and how to ask for help with their services. The language taglines are printed in the top 17 prevalent non-English languages in Tennessee. In accordance with the regulations, the taglines comply with the 18 point font requirements.
Information about the Long Term Care Ombudsman Program

86
Information about the CHOICES and Employment and Community First CHOICES consumer advocate, including but not limited to the role of the consumer advocate in the CHOICES and Employment and Community First CHOICES program and how to contact the consumer advocate for assistance. Information about how to report suspected abuse, neglect, and exploitation of members who are adults (see TCA 71-6-101 et seq.) and suspected brutality, abuse, or neglect of members who are children (see TCA 37-1-401 et seq. and TCA 37-1-601 et seq.), including the phone numbers to call to report suspected abuse/neglect. Complaint and appeal procedures. Notice that in addition to the member’s right to file an appeal directly to TennCare for adverse actions taken by the MCO, the member shall have the right to request reassessment of eligibility related decisions directly to TennCare. Written policies on member rights and responsibilities, pursuant to 42 CFR § 438.100 and NCQA’s Standards and Guidelines for the Accreditation of MCOs. Written information concerning advance directives as described in 42 CFR § 489 Subpart I and in accordance with 42 CFR § 422.128. Notice that enrollment in the contractor’s MCO invalidates any prior authorization for services granted by another MCO but not utilized by the member prior to the member’s enrollment into the contractor’s MCO and notice of continuation of care when entering the contractor’s MCO as described in § 2.9.2 of this Agreement. Notice to the member that it is his or her responsibility to notify the MCO, TennCare, and Department of Human Services (DHS) (or for SSI eligibles, SSA) each and every time the member moves to a new address and that failure to notify DHS (or for SSI eligibles, SSA) could result in the member not receiving important eligibility and/or benefit information. Notice that a new member may request to change MCOs at any time during the 45 calendar day period immediately following their initial enrollment in an MCO, subject to the capacity of the selected MCO to accept additional members and any restrictions limiting enrollment levels established by TennCare. This notice must include instructions on how to contact TennCare to request a change. Notice that the member may change MCOs at the next choice period and shall have a 45 calendar day period immediately following the enrollment, as requested during said choice period, in a new MCO to request to change MCOs, subject to the capacity of the selected MCO to accept additional enrollees and any restrictions limiting enrollment levels established by TennCare. This notice shall include instructions on how to contact TennCare to request a change. Notice that the member has the right to ask TennCare to change MCOs based on hardship, the circumstances which constitute hardship, explanation of the member’s right to file an appeal if such request is not granted, and how to do so. Notice of the enrollee’s right to terminate participation in the TennCare program at any time with instructions to contact TennCare for termination forms and additional information on termination. TennCare and MCO member services toll-free telephone numbers, including the TennCare hotline, the MCO’s member services information line, and the MCO’s 24/7 nurse triage/advice line with a statement that the member may contact the MCO or TennCare regarding questions about the TennCare program, including CHOICES and Employment and Community First CHOICES, as well as the service/information that may be obtained from each line. Information educating members of their rights and necessary steps to amend their data in accordance with HIPAA regulations and state law. Directions on how to request and obtain information regarding the “structure and operation of the MCO” and “physician incentive plans.” Information that the member has the right to receive information on available treatment options

87
and alternatives, presented in a manner appropriate to the member’s condition and ability to understand. Information that the member has the right to be free from any form of restraint or seclusion used as a means of coercion, discipline, convenience, or retaliation. Information on appropriate prescription drug usage. Any additional information required in accordance with NCQA’s Standards and Guidelines for the Accreditation of MCOs.
Provider Directory requirements, listed in CRA § 2.17.8, are as follows: The MCO must distribute information regarding general provider directories to new members within 30 calendar days of receipt of notification of enrollment in the MCO or prior to the member’s enrollment effective date. Such information must include how to access the provider directory, including the right to request a hard copy and to contact the member services line to inquire regarding a provider’s participation in the network. Members receiving a hard copy of the provider directory must be advised that the network may have changed since the directory was printed and told how to access current information regarding participating providers. The MCO must provide information regarding the CHOICES or Employment and Community First CHOICES provider directory to each CHOICES or Employment and Community First CHOICES member as part of the face-to-face visit (for members enrolled through the SPOE) or face-to-face intake visit (for current members) as applicable, but not more than 30 days from notice of CHOICES enrollment. Such information shall include how to access the CHOICES or Employment and Community First CHOICES provider directory, including the right to request a hard copy and to contact the member services line to inquire regarding a provider’s participation in the network. Members receiving a hard copy of the CHOICES or Employment and Community First CHOICES provider directory shall be advised that the network may have changed since the directory was printed, and how to access current information regarding the MCO’s participating providers. The MCO is also responsible for maintaining updated provider information in an online searchable electronic general provider directory and an online searchable electronic CHOICES and Employment and Community First CHOICES provider directory. A PDF copy of the hard copy version will not meet this requirement. The online searchable version of the general provider directory and the CHOICES or Employment and Community First CHOICES provider directory shall be updated on a daily basis during the business week. In addition, the MCO must make available upon request, in hard copy format, a complete and updated general provider directory to all members and an updated CHOICES or Employment and Community First CHOICES provider directory to CHOICES or Employment and Community First CHOICES members. The hard copy of the general provider directory and the CHOICES or Employment and Community First CHOICES provider directory shall be updated at least on an annual basis. Members receiving a hard copy and/or accessing a PDF version of the hard copy on the MCO’s website of the general provider directory or the CHOICES provider directory must be advised that the network may have changed since the directory was printed and told how to access current information regarding participating providers, including the searchable electronic version of the general provider directory and the CHOICES or Employment and Community First CHOICES provider directory as well as the member services line. Provider directories (including the general provider directory, the CHOICES provider directory and the Employment and Community First CHOICES provider directory) and any revisions thereto, must be submitted to TennCare for written approval prior to distribution to enrollees. The text of the directory must be in the format prescribed by TennCare. In addition, the provider information used to populate the provider directory must be submitted as a TXT file or such format as otherwise approved in writing by TennCare and be produced using the same extract process as the actual provider directory.

88
The MCO must develop and maintain a general provider directory, which shall be made available to all members. The provider directory must be posted on the MCC website and provided in hard copy upon request of the member. Members must be advised in writing regarding how to access the provider directory, including the right to request a hard copy and to contact the member services line to inquire regarding a provider’s participation in the network. Members receiving a hard copy of the provider directory must be advised that the network may have changed since the directory was printed and told how to access current information regarding participating providers. The online version of the provider directory shall be updated on a daily basis. The general provider directory must include the following: names, locations, telephone numbers, web site; office hours, and non-English languages spoken and cultural capabilities by contract PCPs and specialists; whether the provider’s office/facility has accommodations for people with physical disabilities, including offices, exam room(s) and equipment; identification of providers accepting new patients; identification of whether or not a provider performs TennCare Kids screens; Specialty, as appropriate; hospital listings, including locations of emergency settings and post-stabilization services, with the name, location, and telephone number of each facility/setting; and a prominent notice that CHOICES or Employment and Community First CHOICES members should refer to the CHOICES or Employment and Community First CHOICES provider directory for information on long-term services and supports providers.
42 CFR § 438.224 Confidentiality 42 CFR § 438.224 Individually identifiable health information is closed in accordance with Federal
privacy requirements. Individually identifiable health information is used and disclosed in accordance with HIPAA privacy requirements (CRA § 2.23.2.1).
42 CFR § 438. 226 Enrollment and Disenrollment 42 CFR § 438.226 Each MCO/PIHP complies with the enrollment and disenrollment requirements and
limitations in § 438.56 CRA § 2.5.3 states that the MCO must not request disenrollment of an enrollee for any reason, and TennCare shall not disenroll members for any of the following reasons:
Adverse changes in the enrollee’s health; Pre-existing medical or behavioral health conditions; High cost medical or behavioral health bills; Failure or refusal to pay applicable TennCare cost sharing responsibilities, except when this results in loss of eligibility for TennCare; Enrollee’s utilization of medical or behavioral health services; Enrollee’s diminished mental capacity; or Enrollee’s uncooperative or disruptive behavior resulting from his or her special needs (except when his or her continued enrollment in the MCO seriously impairs the entity’s ability to furnish services to either this particular enrollee or other enrollees).

89
42 CFR § 438.228 Grievance Systems
42 CFR § 438.228(a) Grievance system meets the requirements of § 438 (F)
42 CFR § 438.228(b) If applicable, random State reviews of notice of action designation to ensure notification of enrollees in a timely manner
CRA § 2.19.3 outlines all requirements related to appeals as stated below: The MCO must have a contact person who is knowledgeable of appeal procedures and shall direct all appeals, whether the appeal is verbal or the member chooses to file in writing, to TennCare. Should a member choose to appeal in writing, the member shall be instructed to file via mail or fax to the designated TennCare P.O. Box or fax number for medical appeals. The MCO must have sufficient support staff (clerical and professional) available to process appeals in accordance with TennCare requirements related to the appeal of adverse actions affecting a TennCare member. The MCO must notify TennCare of the names of appointed staff members and their phone numbers. Staff must be knowledgeable about applicable state and federal law, TennCare rules and regulations, and all court orders and consent decrees governing appeal procedures, as they become effective. The MCO must educate its staff concerning the importance of the appeals procedure, the rights of the member, and the time frames in which action must be taken by the MCO regarding the handling and disposition of an appeal. The MCO must identify the appropriate internal individual or body having decision-making authority as part of the appeal procedure. The MCO must have the ability to take telephone appeals and accommodate persons with disabilities during the appeals process. Appeal forms shall be available at each service site and by contacting the MCO. However, members shall not be required to use a TennCare-approved appeal form in order to file an appeal. Upon request, the MCO must provide members a TennCare approved appeal form(s). The MCO must provide reasonable assistance to all appellants during the appeal process. At any point in the appeal process, TennCare has the authority to remove a member from the MCO when it is determined that such removal is in the best interest of the member and TennCare. The MCO must require providers to display notices of members’ right to appeal adverse actions affecting services in public areas of each facility in accordance with TennCare rules and regulations. The MCO must ensure that providers have correct and adequate supply of public notices. Neither the MCO nor TennCare shall prohibit or discourage any individual from testifying on behalf of a member. The MCO must ensure compliance with all notice requirements and notice content requirements specified in applicable state and federal law, TennCare rules and regulations, and all court orders and consent decrees governing notice and appeal procedures, as they become effective. TennCare may develop additional appeal process guidelines or rules, including requirements as to content and timing of notices to members, which must be followed by the MCO. However, the MCO must not be precluded from challenging any judicial requirements, and to the extent judicial requirements that are the basis of such additional guidelines or rules are stayed, reversed, or otherwise rendered inapplicable, the MCO must not be required to comply with such guidelines or rules during any period of such inapplicability. The MCO must provide general and targeted education to providers regarding expedited appeals (described in TennCare rules and regulations), including when an expedited appeal is appropriate, and procedures for providing written certification thereof.
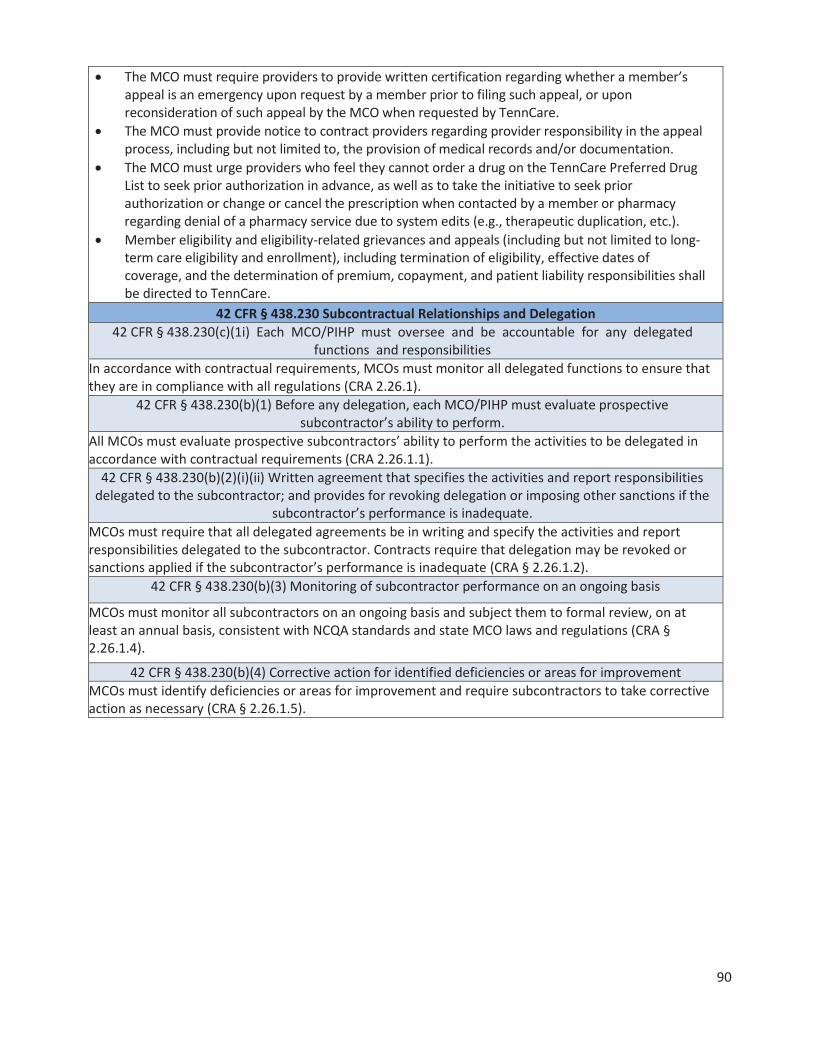
90
The MCO must require providers to provide written certification regarding whether a member’s appeal is an emergency upon request by a member prior to filing such appeal, or upon reconsideration of such appeal by the MCO when requested by TennCare. The MCO must provide notice to contract providers regarding provider responsibility in the appeal process, including but not limited to, the provision of medical records and/or documentation. The MCO must urge providers who feel they cannot order a drug on the TennCare Preferred Drug List to seek prior authorization in advance, as well as to take the initiative to seek prior authorization or change or cancel the prescription when contacted by a member or pharmacy regarding denial of a pharmacy service due to system edits (e.g., therapeutic duplication, etc.). Member eligibility and eligibility-related grievances and appeals (including but not limited to long-term care eligibility and enrollment), including termination of eligibility, effective dates of coverage, and the determination of premium, copayment, and patient liability responsibilities shall be directed to TennCare.
42 CFR § 438.230 Subcontractual Relationships and Delegation 42 CFR § 438.230(c)(1i) Each MCO/PIHP must oversee and be accountable for any delegated
functions and responsibilities In accordance with contractual requirements, MCOs must monitor all delegated functions to ensure that they are in compliance with all regulations (CRA 2.26.1).
42 CFR § 438.230(b)(1) Before any delegation, each MCO/PIHP must evaluate prospective subcontractor’s ability to perform.
All MCOs must evaluate prospective subcontractors’ ability to perform the activities to be delegated in accordance with contractual requirements (CRA 2.26.1.1).
42 CFR § 438.230(b)(2)(i)(ii) Written agreement that specifies the activities and report responsibilities delegated to the subcontractor; and provides for revoking delegation or imposing other sanctions if the
subcontractor’s performance is inadequate. MCOs must require that all delegated agreements be in writing and specify the activities and report responsibilities delegated to the subcontractor. Contracts require that delegation may be revoked or sanctions applied if the subcontractor’s performance is inadequate (CRA § 2.26.1.2).
42 CFR § 438.230(b)(3) Monitoring of subcontractor performance on an ongoing basis
MCOs must monitor all subcontractors on an ongoing basis and subject them to formal review, on at least an annual basis, consistent with NCQA standards and state MCO laws and regulations (CRA § 2.26.1.4).
42 CFR § 438.230(b)(4) Corrective action for identified deficiencies or areas for improvement MCOs must identify deficiencies or areas for improvement and require subcontractors to take corrective action as necessary (CRA § 2.26.1.5).

91
Measurement and Improvement Standards
CMS requirement: This section should include a discussion of the standards that the state has established in the MCO/PIHP contracts for measurement and improvement, as required by 42 CFR § 438(D). These standards should relate to the overall objectives listed in the quality strategy’s introduction. States may either reference the measurement and improvement provisions from the state’s managed care contracts, or provide a summary description of such provisions. CMS recommends states minimize reference to contract language in the quality strategy. However, if the state chooses the latter option, the summary description must be sufficiently detailed to offer a clear picture of the specific contract provisions and be written in language that may be understood by stakeholders who are interested in providing input as part of the public comment process.
STATE MEASUREMENT & IMPROVEMENT STANDARDS AS REQUIRED BY 42 CFR, PART 438, SUBPART D
42 CFR § 438.236 Practice Guidelines 438.236(b) Practice guidelines: 1) are based on valid and reliable clinical evidence or a consensus of health care professionals in the particular field; 2) consider the needs of enrollees; 3) are adopted in consultation with contracting health care professionals; and 4) are reviewed and updated periodically,
as appropriate. CRA § 2.15.4 states that the MCO must utilize evidence-based clinical practice guidelines in its Population Health Programs. Wherever possible, MCOs utilize nationally recognized clinical practice guidelines. On occasion, tools for standardized specifications for care to assist practitioners and patient decisions about appropriate care for specific clinical circumstances are developed through a formal process and are based on authoritative sources that include clinical literature and expert consensus. The guidelines must be reviewed and revised whenever the guidelines change and at least every two years. The MCO is required to maintain an archive of its clinical practice guidelines for a period of five years. Such archive must contain each clinical guideline as originally issued so that the actual guidelines for prior years are retained for program integrity purposes. NCQA standard QI 9, Element A requires that guidelines be distributed to appropriate practitioners. All MCOs are required to be NCQA accredited. As part of the accreditation survey, files are reviewed to assure that the NCQA requirements for clinical practice guidelines are met. It should be noted that TennCare defines evidenced-based practice as a clinical intervention that has demonstrated positive outcomes in several research studies to assist consumers in achieving their desired goals of health and wellness. Implied in that definition is that the evidence-based guidelines will incorporate the enrollee’s needs and interests as part of the development of evidence-based guidelines.
438.236(c) Dissemination of practice guidelines to all providers, and upon request, to enrollees
All MCOs are required to be NCQA accredited. As part of the accreditation survey, files are reviewed to assure that the NCQA requirements for clinical practice guidelines are met.

92
42 CFR 438.240 Quality Assessment and Performance Improvement Program
438.240(a) Each MCO and PIHP must have an ongoing quality assessment and performance improvement program.
CRA Section 2.15 addresses the Quality Assessment and Performance Improvement standards for the MCOs. They must:
Receive and maintain accreditation from NCQA. Have a written program that clearly defines its quality structures and processes and assigns responsibility to appropriate individuals. Use NCQA standards as a guide and include a plan for improving patient safety. Address physical health, behavioral health, and long-term care services. Be accountable to the MCC Board of Directors and executive management team. Have substantial involvement of a designated physician and designated behavioral health practitioner. Have a Quality Improvement (QI) Committee that oversees the QI functions. Have an annual work plan. Have dedicated staff as well as data and analytical resources. Evaluate the program annually and update as appropriate. Make all information available to providers and members. Make performance data available to providers and members. Use results of activities to improve the quality of physical health, behavioral health, and long-term care service delivery with appropriate input from providers and members. Take appropriate action to address service delivery, provider, and other QI issues as they are identified. Participate in workgroups hosted by TennCare and agree to establish and implement policies and procedures, including billing and reimbursement, in order to address specific quality concerns. Collect data on race and ethnicity. Include QM/QI activities to improve healthcare disparities identified through data collection. Have a QM/QI committee which must include medical, behavioral health, and long-term care staff as well as contract providers, including medical, behavioral, and long-term care. This committee analyzes and evaluates results, recommends policy decisions, and ensures participation of providers. It must also review and approve the QM/QI program description, annual evaluation, and associated work plan prior to submission to TennCare.
438.240(b)(1) and 438.240(d) Each MCO and PIHP must conduct PIPs and measure and report to the state its performance. List out PIPs in the quality strategy.
CRA 2.15.3 – Performance Improvement Projects (PIPs) – requires that each MCO must perform at least two clinical and three non-clinical PIPs. The two clinical PIPs must include one in the area of behavioral health that is relevant to bipolar disorder, major depression, or schizophrenia and one in the area of either child health or perinatal (prenatal/postpartum) health. One of the three non-clinical PIPs must be in the area of long-term care. The MCOs must use existing processes, methodologies, and protocols, including the CMS protocols. Beginning in 2017, a PIP in the area of EPSDT is also required. CMS protocols must be followed for all PIPs.

93
438.240(b)(2) and 438.240(c) Each MCO and PIHP must measure and report performance measurement
data as specified by the State. List out performance measures in the quality strategy. CRA 2.15.6 states that MCOs must complete all HEDIS measures designated by NCQA as relevant to Medicaid. Due to a Dental carve-out, the dental measures are excluded. Measure results are reported separately for each Grand Region of the state. MCOs must use the Hybrid methodology (i.e., gathered from administrative and medical record data) as the data collection method for any Medicaid HEDIS measure containing Hybrid specifications as identified by NCQA. The MCOs must contract with an NCQA certified HEDIS auditor to validate the processes of the MCO in accordance with NCQA requirements. Audited HEDIS results are submitted both to TennCare and to the EQRO, who then provides a written report to TennCare. See Attachment V for a list of all HEDIS measures.
438.240(b)(3) Each MCO and PIHP must have mechanisms to detect both underutilization and overutilization of services.
CRA Section 2.14, Utilization Management (UM), requires MCOs to provide for methods of assuring the appropriateness of inpatient care. Such methodologies must be based on individualized determinations of medical necessity in accordance with UM policies and procedures and, at a minimum, must include:
Pre-admission certification process for non-emergency admissions; A concurrent review program to monitor and review continued inpatient hospitalization, length of stay, or diagnostic ancillary services regarding their appropriateness and medical necessity. Admission review for urgent and/or emergency admissions, on a retroactive basis when necessary, in order to determine if the admission is medically necessary and if the requested length of stay for the admission is reasonable based upon an individualized determination of medical necessity. Such reviews must not result in delays in the provision of medically necessary urgent or emergency care. Restrictions against requiring pre-admission certification for admissions for the normal delivery of children; and Prospective review of same day surgery procedures. MCOs must review ED utilization data, at a minimum, every six months to identify members with utilization exceeding the threshold defined by TennCare as ten or more visits in the defined six month period (CRA 2.14.1.16.1).
MCOs must have in place, and follow, written policies and procedures for processing requests for initial and continuing prior authorizations of services and have in effect mechanisms to ensure consistent application of review criteria for prior authorization decisions (CRA 2.14.2.1). Any decision to deny a service authorization request or to authorize a service in an amount, duration, or scope that is less than requested shall be made by a physical health or behavioral health care professional who has appropriate clinical expertise in treating the member’s condition or disease or, in the case of long-term care services, a long-term care professional who has appropriate expertise in providing long-term care services (CRA 2.14.1.9).
MCOs must not place maximum limits on the length of stay for members requiring hospitalization and/or surgery. MCOs may not employ, and shall not permit others acting on their behalf to employ, utilization control guidelines or other quantitative coverage limits, unless supported by an individualized determination of medical necessity based upon the needs of each member and his/her medical history (CRA 2.14.1.10). MCOs must have mechanisms in place to ensure that required services are not arbitrarily denied or reduced in amount, duration, or scope solely because of the diagnosis, type of illness, or condition (CRA 2.14.1.11).
94
438.240(b)(4) Each MCO and PIHP must have mechanisms to assess the quality and appropriateness of care furnished to enrollees with special health care needs.
MCOs are contractually required to have in place a written Quality Management/Quality Improvement program that describes all of the mechanisms that they have in place for assessing the quality and appropriateness of care for all enrollees, including those with special health care needs (CRA 2.15).
438.240(e) Annual review by the State of each quality assessment and improvement program. If the state requires that an MCO or PIHP have in effect a process for its own evaluation of the impact and
effectiveness of its quality assessment and performance improvement program, indicate this in the quality strategy.
The MCO quality assessment and improvement programs are reviewed in multiple ways. The first is the NCQA Accreditation Review that occurs for all health plans every three years. The second review is done annually by the EQRO and includes the following:
Policies and procedures ensuring coordination between physical, behavioral health, and long-term care (LTC) services by including the following key elements: o Screening for behavioral health needs o Referral to physical health, behavioral health, and LTC providers o Screening for LTC needs o Confidentiality o Exchange of information o Assessment o Treatment plan development o Collaboration o Case management (CM) and Population Health (PH) o Provider training o Monitoring implementation and outcomes o Encourages PCPs and other providers to use state-approved behavioral health screening tool Processes in place to assure that members discharged from psychiatric inpatient hospitals and psychiatric residential treatment facilities are evaluated for mental health CM services and provided with appropriate behavioral health follow-up services. Process in place to identify and enroll eligible members in each PH program including CHOICES and Employment and Community First CHOICES members, through the same process used for identification of non-CHOICES and Employment and Community First CHOICES members and the CHOICES non-Employment and Community First CHOICES care coordination process or Employment and Community First CHOICES support coordination process. Processes to assure that each Population Health program includes the development of program descriptions that serve as the outline for all activities and interventions in the program. Condition monitoring, patient adherence to the program, consideration of other co-morbidities and condition related lifestyle issues are addressed.

95
Processes to assure that PH program descriptions address how the CHOICES care-coordinator or Employment and Community First support coordinator will receive notification of the member’s participation, information collected about the member, and educational materials given to the member. Processes to identify CHOICES and Employment and Community First CHOICES member needs when they are in transition between MCOs. Must assures that a comprehensive needs assessment is immediately conducted, the plan of care is updated, and the changes in services are implemented within 10 days of the MCO becoming aware of the change in needs. Processes for assuring that members transitioning from a nursing facility to a community based residential alternative or to live with a relative or other caretaker, the care coordinator makes contact with the member within the first 24 hours of transition and visits the member in his/her new residence within seven days of transition. Processes to assure the MCO conducts a CHOICES or Employment and Community First CHOICES level of care assessment at least annually and within five business days of awareness of a change in a member’s functional or medical status that could potentially affect eligibility.
Quality Oversight staff receive many different reports from the health plans that are due at various times of the year. These include, but are not limited to:
EPSDT Annual Community Outreach Plan and subsequent quarterly reports. Annual Quality Report that outlines major initiatives conducted by the health plan. Population Health Program reports – both quarterly and annually. 24/7 Nurse Line reports
Additionally there are collaborative workgroups that address specific topics and includes individuals from all health plans; monthly meetings with the MCO Quality Director’s; and site visits with the health plans at least annually.
42 CFR 438.242 Health Information Systems 438.242(a) Each MCO and PIHP must maintain a health information system that can collect, analyze, integrate, and report data and provide information on areas including, but not limited to, utilization,
claims, grievances and appeals, and disenrollments for other than loss of Medicaid eligibility.
By contract, each MCO must maintain all information related to interactions with enrollees and providers, including complaints and appeals. Each MCO is also required by contract to maintain all information and/or encounter information for providers with whom the MCO has a capitated arrangement both current and historical. Each MCO is also required to maintain all records and information related to member health status and outcomes.
438.242(b)(1) Each MCO and PIHP must collect data on enrollee and provider characteristics and on services furnished to enrollees.
By contract, each MCO is required to maintain all member enrollment and other information, both current and historical. By contract, each MCO is required to maintain all claims information and/or encounter information and all authorization and care coordination both current and historical.
438.242(b)(2) Each MCO and PIHP must ensure data received is accurate and complete. By contract, each MCO is responsible for ensuring that the level of care is accurate and complete and reflects the member’s current medical and functional status based on information gathered and/or claims and encounters submitted.

96
SECTION IV: IMPROVEMENT AND INTERVENTIONS CMS Requirement: Describe, based on the results of assessment activities, how the state will attempt to improve the quality of care delivered by MCOs and PIHPs through interventions such as, but not limited to:
Cross state agency collaborative Pay-for-performance or value-based purchasing initiatives Accreditation requirements Grants Disease management programs Changes in benefits for enrollees Provider network expansion, etc.
Describe how the state’s planned interventions tie to each specific goal and objective of the quality strategy.
PLANNED INTERVENTIONS’ ALIGNMENT WITH QUALITY STRATEGY GOALS AND OBJECTIVES GOAL: ACCESS TO CARE
OBJECTIVE INTERVENTION
Adult’s access to preventive/ ambulatory health services
Distribution of Member Materials: MCOs distribute a large number of educational and informational materials to their membership, including but not limited to member handbooks, newsletters, fact sheets, and brochures. Each MCO is required to receive prior written approval from TennCare of all materials that are distributed to members, whether developed by the MCOs or their contractors. TennCare staff reviews the submitted materials for both clinical and programmatic content and either approves or denies them within 15 calendar days from the date of submission. QO staff works closely with the MCOs regarding continual quality improvement of materials developed.
Children & adolescents’ access to primary care
MCC EPSDT (TennCare Kids) Collaborative: The Division of Quality Oversight will continue to host ad hoc MCC EPSDT (TennCare Kids) collaborative meetings that include representatives from all MCOs, the Dental Benefits Manager, and the Department of Health. This group addresses ways of reaching out to TennCare enrollees who are under the age of 21 as well as to their families.
Children and adults visit doctor/clinic when first seeking care as opposed to hospital/ED
Strategic Planning: Annually, the Division of Quality Oversight staff, in collaboration with Qsource and the Division of Healthcare Informatics, reviews and analyzes all data coming in to the Division of Quality Oversight through MCC reporting and other areas. At that time, and in subsequent meetings, decisions are made about areas of performance that need additional emphasis. In 2015, staff expanded strategies to address excessive Emergency Department utilization and will continue these through 2017. The strategies included:
Identified opportunities for improvement led QO to eliminate the MCO self-report in lieu of an automated ED claims report along with individual medical record reviews;

97
Changing medical record reviews from semi-annually to quarterly for timelier results;
Adding additional fields to the ED database in order to trend the data by member and to compare member utilization rankings from quarter to quarter;
Placing a strong focus on members who appear in multiple quarterly reports as high utilizers and those that did not receive outreach attempts from the MCOs;
Enhancing the sampling methodology; Established a target population of the top five ED utilizers for
each MCO by region and began auditing MCO records for these individuals; and
Continue conducting medical record reviews and determining if appropriate interventions were conducted by the MCOs.
In 2017, QO continued medical record reviews of the top five ED utilizers for each MCO by region on a quarterly basis with a focus on case management outreach to members. A MCO ED Diversion Collaborative and Operational Workgroup was established to allow the MCO’s to collaborate and share best practices to encourage appropriate utilization of the Emergency Department
Adolescent Access to Care
The Adolescent Screening Workgroup is a collaboration of the MCOs, the Dental Benefits Manager, and the Tennessee Department of Health. Workgroup members are tasked with implementing approaches to raising adolescent screening rates, for members ages 12-20 across the State. Adolescents have the lowest screening rates of all ages. The workgroup meets bi-monthly, with conference calls held between meetings as necessary. The ASW hosted its first large scale provider screening campaign in August 2016, where 1,243 screens were conducted. Thus far in 2017, over 6,000 adolescents have been screened and 112 dental screens completed.

98
Adolescent well - care visits
Teen Newsletter: As described above, the MCC EPSDT (TennCare Kids) Collaborative focuses its efforts on improving health care access, education, and services for enrollees. An extremely hard population to reach is the adolescent population. For this reason, the Collaborative specifically targets this age group through a quarterly MCO teen newsletter that includes adolescent- specific articles that address physical, behavioral, and dental health. In 2015, TennCare began allowing the MCOs to deliver this newsletter through social media, if appropriate, rather than always through a mailing. A specialized workgroup was also initiated to focus on increasing adolescent well-care visits. Members of the workgroup included staff from all MCOs, the Dental Benefits Manager, and the Department of Health. TennCare has included the HEDIS Adolescent Well-Care Visits measure in the list of measures with which the MCOs can receive a pay for performance incentive. Likewise, the MCOs have included this measure in their Provider Pay for Performance program. TennCare has included the HEDIS Medication Management for People with Asthma Measure in the list of measures for which the MCOs can receive a pay for performance incentive. Likewise, the MCOs may include this measure in their Provider Pay for Performance program.
Diabetes
TennCare has included the HEDIS Comprehensive Diabetes Care Measures for Retinal Eye Exams, Nephropathy, and Blood Pressure <140/90 in the list of measures for which the MCOs can receive a pay for performance incentive. Likewise, the MCOs have included this measure in their Provider Pay for Performance program.
Timeliness of Prenatal Care
TennCare has included the HEDIS Timeliness of Prenatal Care Measure in the list of measures with which the MCOs can receive a pay for performance incentive. Likewise, the MCOs have included this measure in their Provider Pay for Performance program. Department Of Health Perinatal Advisory Committee: The Quality Oversight Clinical Quality Review Manager participates on the Department of Health’s Perinatal Advisory Committee. The committee continues to meet on a semi-annual basis to address Neonatal Abstinence Syndrome, Post-neonatal Follow-up, Baby and Me Tobacco Free, Safe Sleep, Breastfeeding, the Tennessee Infant Mortality Reduction Strategic Plan, Certificate of Need Changes, Mothers’ Milk Bank of Tennessee, and issues identified by the Regional Perinatal Centers. A new workgroup is reviewing and revising the Educational Objectives for Nurses.
GOAL: QUALITY OF CARE

99
Breast and Cervical Cancer Screening
Breast and Cervical Cancer Screening Program: This program provides breast and cervical cancer screening to eligible women and diagnostic follow-up tests for those with suspicious results. Women diagnosed with breast or cervical cancer or pre-cancerous conditions for these cancers are enrolled for treatment coverage through TennCare. The mission of the program is to reach and serve lower income uninsured or underinsured women for these basic preventive health screening exams.
Quality of Care Concerns
Quality of Care Concern’s Process: The Division of Quality Oversight receives notification of quality of care concerns regarding enrollees that are sent directly to TennCare. These concerns are addressed in a variety of ways – through calls to the person submitting the concern, correspondence with the MCOs, or referrals to other agencies. Quality of care concerns may also be received from other Divisions within TennCare. Home Health Agency (HHA) critical incidents are also sent directly to TennCare from the MCOs. These incidents are investigated and addressed through action taken by the agency involved or through other State agencies, action taken by the MCOs, corrective action as indicated, and follow-up actions.
100
Child Health
Asthma Medication Management Project: TennCare staff participate in a statewide asthma workgroup. The goal of the workgroup is to reduce the number of Emergency Department (ED) visits for children that are due to asthma related complications. The workgroup is convened by the Department of Health and is composed of TennCare staff as well as staff from MCOs, hospitals, pharmacy and the Department of Health. Subcommittees work on various issues such as enhanced care coordination and enhanced asthmas education. The data extraction unit is the Children’s Hospital Alliance of Tennessee (CHAT) and is focusing on data extractions for acute asthma repeat encounters at 30 days and 6 months. The goal for this unit is to develop evidence-based clinical pathway guidelines for asthma encounters. Another group involved in this project is the Pediatric Healthcare Improvement Initiative for Tennessee (PHIT) and is focused on education. This group has completed a series of training videos for providers dealing with identification and diagnosing asthma, determination of severity and control, developing a partnership and action plan for asthma treatment, both acute and maintenance. All subgroups are working to coordinate and educate providers and develop stakeholder care coordination for children with asthma. The ultimate goal is to develop a statewide asthma plan that includes stakeholders from both the medical community and school communities. The Tennessee Health Care Innovation Initiative Episodes of Care strategy includes an Attention Deficit and Hyperactivity Disorder (ADHD) episode. The ADHD episode revolves around patients who are diagnosed with ADHD. The trigger event is either a professional claim with a primary diagnosis of ADHD, or a professional claim with a primary diagnosis for ADHD specific symptoms and a secondary diagnosis code for ADHD, along with a procedure code that is for assessments and testing, case management, evaluation and management code, or therapy visits. Only care with a primary diagnosis of ADHD, or a primary diagnosis of ADHD specific symptoms and a secondary diagnosis from among the ADHD trigger codes, as well as a specific list of medications, are included in the episode spend. The Quarterback of the episode is the specific health care provider deemed to have the greatest accountability for the quality and cost of care for the patient. The ADHD episode begins on the day of the triggering visit and extends or an additional 79 days. TennCare has included a measure for increasing the ratio for EPSDT screenings to 80% in the list of measures for which the MCOs can receive a pay for performance incentive.
101
Activities Related to Child Health Conducted by Individual MCOs: The HEDIS Compliance Impact Report uses claims data to show non- compliant measures at a member level. As a result a monthly report is created to identify members who were missing required immunizations two months prior to their 13th birthday. A brochure entitled “Protecting Teens and Young Adults” is then sent to both male and female members who were on this report. The Pregnancy Identification List compiles all pregnant members based on claims data, pharmacy data and obstetric authorizations. Each weekly list of pregnant members is combined quarterly to mail the Tdap Immunization/Maternity Postcard to pregnant members. The Be Wise Immunize Program provides an outreach reminder to eligible TennCare Kids members who will reach certain age milestones. These mailings remind parents about the importance of childhood and adolescent immunizations, and include a schedule of immunizations recommended by the American Academy of Pediatrics (AAP) and the Centers for Disease Control and Prevention (CDC). These interventions encourage parents to call their health care provider for an appointment. The “Taking Care of Baby and Me” program provides pregnant members prenatal packets offering healthcare information, MCO contact information for assistance in scheduling appointments or transportation, and an incentive (gift card) to members when their doctor sends written verification to the MCOs indicating the member has been seen.

102
Comprehensive Diabetes Care
As part of TennCare’s Population Health Program all members are stratified, according to associated risks, into levels of care that have specific interventions associated with them. Diabetes is one of the diagnoses that are categorized into either the Health Risk Management (HRM) group or the Chronic Care Management Group (CCM). Pregnant women who have diabetes are placed into a High Risk Maternity Program. If the member is in the HRM group they will receive one to four non-interactive contacts, offer of individual support for self-management, 24/7 nurse line, offer of health coaching, and offer of weight management and/or tobacco cessation assistance. If the member is in the CCM group, they receive monthly coaching calls with a face to face visit as appropriate, clinical reminders, development of a plan of care, and after hours’ assistance if needed. The following are other interventions conducted by TennCare Managed Care Organizations.
Diabetic self-management care plans for topics such as foot care, signs and symptoms of hyper/hypoglycemia, management of co-morbidities, management of diabetes when they are ill. Members who are identified with health risk behaviors are directed to local community resources. Members identified with psychosocial issues receive education on their condition and treatment plan. They are provided access to transportation and receive assistance with any identified barriers. Depression screening. Education on types of questions to ask their Primary Care Physician (PCP) Interactive web-based health tools that members may use to track, chart, and respond to clinical and wellness parameters, such as blood glucose. Availability of home monitoring services. Member outreach calls to diabetic members that are no-compliant to discuss and encourage recommended screenings. Mobile Diabetic Retinal Eye Exams, Member mailings. Member incentives. Medical Record Documentation Audits of providers. Rapid Cycle Improvement Projects related to Diabetes.
GOAL: SATISFACTION
Consumer Satisfaction
CAHPS Survey: Annually, each MCO must conduct a CAHPS survey by entering into a contract with a vendor that is certified by NCQA to perform CAHPS surveys. The vendor must conduct the adult survey, the child survey, and the survey for children with chronic conditions. Survey results must be reported to TennCare separately for each required CAHPS survey and must be reported by grand region.
GOAL: IMPROVE HEALTHCARE

103
F/U after hospitalization for mental illness
MCO Monitoring: The contracted MCOs are required to submit a Post-Discharge Services quarterly report that shows the length of time between psychiatric hospital discharge and first subsequent mental health service that qualifies as a post-discharge service. These services may include MD services, non-MD services, substance abuse outpatient services, psychosocial rehabilitation services, and mental health case management services. TennCare reviews the reports and determines if the MCO meets the performance measure benchmark listed in the Contractor Risk Agreement. A service that qualifies as a post-discharge service must be received by a member within seven calendar days of discharge. For the reporting period of calendar year 2014, 59% of a MCO’s post-discharge services must meet the standard in order to be considered compliant with the performance measure. When an MCO falls under the performance measure, TennCare first issues a Corrective Action Plan (CAP) to alert the MCO to address the issue with contracted providers. The response to the CAP also helps TennCare learn more about MCO initiatives to improve compliance. At this time, no MCOs are under a CAP for the Post-Discharge Services report.
EPSDT (TennCare Kids) screening
Community Outreach: All federal requirements will continue to be met. Each MCO must submit to TennCare a comprehensive EPSDT outreach plan annually by August 15 for the Federal Fiscal Year. The following information must be included in each plan:
Methodology for developing the plan to include data assessments conducted, policy and procedure reviews, and any other research that may have been conducted; Outreach efforts that include both written and oral communications as well as both rural and urban areas of the state; Outreach efforts to teens; Interim evaluation criteria; Annual evaluation criteria.
Each plan must be resubmitted quarterly with updates on their progress. A Year-End Update of the Plan shall be due no later than 60 days following the federal fiscal year. While the MCOs are expected to develop a comprehensive outreach plan, other outreach criteria also remain as contractual requirements. They are as follows:
Ability to conduct EPSDT outreach in formats appropriate to members who are blind, deaf, illiterate or have Limited English Proficiency (LEP). New member calls if screening rate is below 90%; Minimum of six (6) outreach contacts per member per calendar year; Method for notifying families when screenings are due

104
Follow-up for members who do not receive their screenings timely; Two attempts to re-notify families if no services were used within a year; Must have outreach activities informing pregnant women, prior to their expected delivery date, about the availability of EPSDT services for their children and to offer these services for the children when they are borne.
Currently, all of the MCOs hire Spanish-speaking bilingual outreach staff, if available, for community outreach events targeting the Hispanic TennCare population. These events promote the importance of preventive health care and educate members about how to access their benefits and improve their health outcomes by properly utilizing available health care resources.
Antidepressant medication management
Children’s Special Workgroups: The TennCare Division of Behavioral Health Operations participates in regular workgroup meetings with the Department of Children’s Services addressing the issues affecting children in foster care. This workgroup includes representatives from all MCOs and the Department of Mental Health and Substance Abuse Services. These meetings focus on the use of psychotropic medications, coordination of treatment, and identification of data that can be shared between agencies that will increase the quality of care. The workgroup continues to review the data on an annual basis and discuss relevant issues.
F/U care for children prescribed ADHD medication

105
Education/information
CHOICES Group 2 and 3 member records and Employment and Community First CHOICES member records reviewed which document that the member/authorized representative (as applicable) received education/information at least annually about how to identify and report instances of abuse, neglect and exploitation.
Critical incidents
Critical incident records for CHOICES and Employment and Community First CHOICES reviewed in which the incident was reported within timeframes specified in the Contractor Risk Agreement.
LTSS-CHOICES and Employment and Community First CHOICES
GOAL: LEVEL OF CARE
Pre-admission evaluation
CHOICES Group 2 and 3 and Employment and Community First CHOICES members who had an approved CHOICES Pre- Admission Evaluation prior to enrollment in CHOICES or Employment and Community First CHOICES and receipt of Medicaid-reimbursed HCBS.
GOAL: SERVICE PLAN
Freedom of choice CHOICES Group 2 member records reviewed with an appropriately completed and signed freedom of choice form that specifies choice was offered between institutional services and HCBS.
Completion of Assessment
Employment and Community First CHOICES member records reviewed with an appropriately completed and signed Employment Informed CHOICE form indicating that the member declined to pursue employment services. CHOICES Group 2 and 3 and Employment and Community First CHOICES members who had an assessment, including key elements specified in the CRA or by TennCare protocol, were completed within the timeframes specified in the Contractor Risk Agreement.
Person-Centered Support Plan updated
CHOICES Group 2 and Group 3 member records and Employment and Community First member records whose Person-Centered Support Plan (PCSP) were reviewed/updated prior to the member’s annual review date.
GOAL: PROVIDERS
Documentation of minimum qualifications
CHOICES HCBS and Employment and Community F irst CHOICES providers reviewed for whom the MCO provides documentation that the provider meets minimum qualifications established by the State and was credentialed by the MCO in accordance with NCQA guidelines prior to enrollment in CHOICES and delivery of HCBS.
GOAL: HEALTH & WELFARE

106
Right to fair hearing when services denied, reduced, suspended or terminated
CHOICES Group 2 and 3 member records and Employment and Community First CHOICES member records reviewed in which HCBS were denied, reduced, suspended, or terminated as evidenced in the Plan of Care and consequently, the member was informed of and afforded the right to request a Fair Hearing when services were denied, reduced, suspended, or terminated as determined by the presence of a notice of action.
Satisfaction Surveys
Additionally, Tennessee conducts annual customer satisfaction surveys of CHOICES and Employment and Community First CHOICES members through participation in the National Core Indicators (NCI) and National Core Indicators – Aging and Disability (NCI-AD) surveys.
The NCI-AD survey measures CHOICES members’ satisfaction with services, their ability to access services, their understanding of their rights and their ability to live the life they intend with the necessary supports in place to help them achieve their desired health and psycho-social outcomes. The NCI survey assesses the quality of life of each person with I/DD enrolled into the Employment and Community First CHOICES program.

107
Other Interventions Affecting All Goals and Objectives
Pay-for-performance or value-based purchasing initiatives TennCare has been providing performance incentives, based on improvement to specific HEDIS measures, to the MCOs for several years. As a result of the Quality Redesign meetings conducted in 2015, the Quality Incentive performance measures were re-evaluated. The following measures were included in the July 2015 Contractor Risk Agreement (CRA) for payment year 2016 and will continue for at least three years. These measures were selected because all three (3) MCOs scored below the 25th percentile of the National Medicaid Average. The MCOs intend to use the same incentive measures, as appropriate, in provider contracts. The EPSDT measure was selected because of performance as reflected in the CMS 416 report. The measures are:
Timeliness of Prenatal Care;
Postpartum Care;
Medication Management for People with Asthma – 75% measure;
Diabetes – Nephropathy, Retinal Exam, and BP <140/90;
Follow-up Care for Children Prescribed ADHD medication-initiation phase;
Follow-up Care for Children Prescribed ADHD medication – continuation phase. Both initiation and continuation measures have to be calculated in order to receive the quality incentive payment;
Adolescent Well-Care Visits;
Immunizations for Adolescents – Combo 1;
Antidepressant Medication Management – acute and continuation;
EPSDT screening ratio 80% or above. Quality Improvement Collaborative Meetings
Qsource facilitates three meetings per year that are attended by TennCare and MCCs. Each meeting is organized around several quality improvement topics and features keynote presentations, panel discussion, and breakout session. TennCare works with Qsource to bring in local and regional providers and public health experts to inform attendees about innovations in healthcare and healthcare delivery. Qsource also arranges for continuing education opportunities to be offered at all of the health plan meetings.
LTSS Initiatives
Quality Improvement in Long Term Services and Supports (QuILTSS)
In the fall of 2013 TennCare began the QuILTSS initiative with the assistance of Lipscomb University’s School of TransformAging®, supported by a Robert Wood Johnson Foundation State Quality and Value Strategies Program grant. Community forums, stakeholder meetings and an on-line survey for members, families, and providers were implemented. The quality framework that resulted from this input focused on Satisfaction, Person Centered Practices/Culture Change, Staffing/Staff Competency, and Clinical Performance. This framework has been applied to NFs since August 2014, first as a quarterly submission process, and currently as a bi-annual submission process, that allows TennCare to evaluate NF quality practices and provide quarterly retrospective per diem rate adjustments, based on quality practices and performance. In the first year of implementation, NFs expanded their quality improvement activities to include resident,

108
family, staff satisfaction surveys and Culture Change/Person Centered Practices assessments. NFs have produced quality improvement activities based on the results of these surveys and assessments. As a result changes were made that are consistent with the proposed regulations for Long-Term Care Facilities (CMS-3260-P) and which support the delivery of more person-centered care in more homelike environments. Going forward, the initiative will continue to evolve, moving from quality improvement activities to quality performance on specified measures that most impact the member’s experience of care.
TennCare is additionally developing plans to apply the QuILTSS framework to specified CHOICES and Employment and Community First CHOICES HCBS and eventually to the performance of the MCOs. While many of the quality strategies ensure compliance with minimum standards, the QuILTSS initiative incentivizes providers and MCOs to improve quality to approach the expectations of members who receive services. Enhanced Respiratory Care (ERC)
In 2010, TennCare began providing enhanced reimbursement to NFs that provide Enhanced Respiratory Care (ERC) services (chronic ventilator care, ventilator weaning and frequent tracheal suctioning). Beginning in 2014 TennCare initiated a quality improvement initiative to better align the higher levels of NF reimbursement for these services with desired program outcomes. TennCare, in consultation with respiratory care experts, developed a set of technology and quality outcome measures and a new reimbursement approach that aligns incentives toward ventilator liberation and other measures that impact the quality of care and quality of life of residents with ERC needs. TennCare requires monthly submissions from all facilities that are eligible to receive the enhanced rate and bi-annually calculates facility tier-scores in order to determine each facility’s reimbursement rate. As a result of this process, across three periods of analysis the state has observed a substantial increase in the overall rate of ventilator liberation and in ventilator weaning utilization, as well as a substantial decrease in chronic ventilator utilization. In addition, we have implemented CRA changes to increase MCO focus on this vulnerable and high-cost population. MCOs are implementing changes to provider contracting and the utilization review and authorization practices as well as improved quality monitoring of these services. MCOs have been required to obtain clinical expertise in the area of respiratory care to improve their functioning with the service area and population. Workforce Development
Through its extensive stakeholder input processes, Tennessee has identified that one of the most critical aspects of LTSS value pertains to the level of training and competency of professionals delivering direct supports—whether in a NF or in the community. As a result of these processes TennCare has invested in the development of a comprehensive training program for individuals paid to deliver LTSS through research of best practices and stakeholder meetings, including members and providers, we are developing a comprehensive competency based workforce development program and credentialing registry. It is our goal for training in this program to be recognized by secondary, vocational/technical schools, trade schools, community colleges, and 4-year institutions, as offering portable, stackable credentials eligible for college credit towards certificate and/or degree program. Professionals delivering services will have the opportunity to both enhance their own proficiency by learning person centered practices and to develop a career path by earning credentials with clear labor market value. The earned credentials will be recognized and accepted (portable) by employers across service settings and a registry for search/matching by individuals, families, providers based on needs/interests of person needing support will be developed.

109
Agencies employing better trained and qualified staff will be appropriately compensated for the higher quality of care experienced by individuals they serve, with higher compensation for staff based on competencies earned.
Person-Centered Planning (PCP)
PCP is an important activity for MCO and TennCare staff. Program activities have already begun. Leveraging MFP Rebalancing Funds, National experts Michael Smull and associates have worked extensively with TennCare and MCO LTSS staff and leadership on person-center thinking, PCP, and how to operate as a person-centered organization. A leadership group of TennCare, MCO, DIDD and provider staff will help to embed key learnings across the service delivery system, transforming service and support delivery to align with person-centered values and best practices.
Tennessee Asthma Coalition
TennCare’s Managed Care Organizations are working in collaboration with the Tennessee Department of Health, the American Lung Association, Vanderbilt University, numerous physicians, and educators around the state and TennCare Population Health staff. The first meeting for the initiative was in May 2015 with a goal of putting together a coalition for asthma prevention in each county of the state. Goals for the initiative include:
Enhanced data availability, sharing;
Improved quality of care for children with asthma;
Improved coordination of care for children with asthma, and;
Enhanced knowledge/understanding of asthma among key populations (general public, parents, children, providers).
In 2017, TennCare staff continues to participate in a statewide asthma coalition with the goal of reducing ER visits for children due to asthma related complications. The group includes medical professionals from across the state, Managed Care Organizations, hospitals, pharmacists, and health department personnel. The group has formed subcommittees dealing with enhancing care coordination and enhancing asthma education. The ultimate goal is to develop a statewide asthma plan that includes stakeholders from both the medical and school communities. The asthma coalition is currently taking steps to formalize by becoming a non-profit organization, enabling the coalition to have an online presence.
Diabetes Action Plan
In 2016, state agencies collaborated to develop a report based on the requirements set forth in Senate Bill No. 988. The State of Tennessee Public Chapter No. 404 states, “The bureau of TennCare, the department of health, and the department of finance and administration shall collaborate to identify goals and benchmarks while also developing individual agency plans to reduce the incidence of diabetes in this state, improve diabetes care, and control complications associated with diabetes”. The three state agencies listed above did collaborate to create a report and submit it to the Health Committee of the House of Representatives and the Health and Welfare Committee of the Senate. This report is to be submitted by February 1 of each odd-numbered year.
Clinical Practice Guidelines
MCOs are contractually required to utilize evidence-based clinical practice guidelines in their Population

110
Health Programs. These guidelines must be formally adopted by the MCO’s QM/QI committee or other clinical committees. The guidelines must include a requirement to conduct a mental health and substance abuse screening and must be reviewed and revised whenever the guidelines change and at least every two years. The MCOs are required to maintain an archive of their clinical practice guidelines for a period of five years.
HEDIS Measures
Annually, each MCO must submit all HEDIS measures designated by NCQA as relevant to Medicaid, excluding dental measures. The MCOs must use the hybrid methodology for any measure containing Hybrid Specifications as identified by NCQA. The results must be reported annually for each grand region in which the Contractor operates. They must contract with an NCQA-certified HEDIS auditor to validate their processes in accordance with NCQA requirements.
Each D-SNP that has signed a MIPPA agreement with TennCare also submits HEDIS and CAHPS measures designated for D-SNPs to both TennCare and Qsource, who then aggregates the data and provides a written report.
Performance Improvement Projects
Requirements for the MCOs to conduct Performance Improvement Projects relevant to the enrollee population will be continued. The two clinical PIPs must include one in the area of behavioral health that is relevant to one of the Population Health programs for bipolar disorder, major depression, or schizophrenia and one in the area of either child health or perinatal (prenatal/postpartum) health. Two of the three non-clinical PIPs must be in the area of long-term services and supports. Beginning in 2017, a PIP in the area of EPSDT is also required. CMS protocols must be followed for all PIPs.
Strategic Planning
Annually, the Division of Quality Oversight staff, in collaboration with Qsource and the Division of HealthCare Informatics, review and analyze all data coming in to the Division of Quality Oversight through MCC reporting and other areas. At that time, and in subsequent meetings, decisions are made about areas of performance that need additional emphasis. In early 2014, Quality Oversight chose to develop additional improvement strategies addressing two major issues: 1) excessive ED utilization and 2) heart attacks/strokes.
Recognizing cardiovascular disease as one of the primary modifiable factors contributing to morbidity and mortality among TennCare members, Quality Oversight began researching programs to improve outcomes in this area. In May 2014, TennCare partnered with HHS Million Hearts® campaign, a national initiative to prevent one million heart attacks and strokes by 2017. The campaign focuses on education and awareness of the ABCS (appropriate use of aspirin, blood pressure control, cholesterol management and smoking cessation) to address risk factors for heart attack and strokes. There has been great reception and participation in the campaign by the MCOs and within TennCare. As a result of this process, medical reviews are conducted on the top five (5) emergency department utilizers from each MCO. This process provides staff insight to behaviors causing excessive utilization. The following opportunity for improvement was identified in the 2016 Emergency Department Utilization Report. TennCare Quality Oversight facilitates an Emergency Department Utilization workgroup to collaborate with the MCOs to ensure members are using the Emergency Department appropriately.

111
Population Health
In December 2011, Quality Oversight staff began leading discussions with the MCOs about moving from a disease management model to a more comprehensive Population Health model. Discussion continued throughout 2012. Up until this point a traditional disease management model was utilized, addressing only those members who already have a distinct disease process. Beginning in January 2013, a phased in implementation of the new model began with full implementation occurring in July 2013. The newly designed model was a collaborative effort across all MCOs and reflects a consensus of all participants.
Advantages of the Population Health model include:
Targeting all members’ needs across the continuum, with all eligible populations being included;
Providing both proactive and reactive interventions;
Targeting interventions based on risk and lifestyle, not just disease;
Addressing multiple risks and co-morbidities in a whole-person approach; and
Addressing upstream causes of poor health (e.g., nutrition, physical inactivity, substance abuse).
Under the new Population Health model, the entire TennCare population for each MCO is identified/stratified into the following seven programs, with specific minimum interventions required for each:
1. Wellness - To include behavioral and physical Health Promotion, and Preventive services.
2. Low to Moderate risk Maternity - Formerly Opt out low to moderate DM maternity program.
3. “Opt Out” Health Risk Management - Includes members in the low or moderate risk categories with one of the current DM conditions; members in high risk category with multiple conditions who did not “Opt in” to the high risk Chronic Care management program; and members who may not have a chronic disease but need help with any health risk they might have, such as tobacco use or weight management. This must include, at a minimum, obesity and tobacco cessation programs.
4. Care Coordination - Helps Level 1 members navigate and coordinate health care services available to them. A care plan may or may not be developed.
5. “Opt In” Chronic Care Management - Includes members with complex chronic conditions that fall within the top 3% of the population and who agree to participate. Formerly opt out high risk DM plus other chronic conditions
6. “Opt In” High Risk Maternity - Includes members having high risk pregnancy needs and who agree to participate.
7. “Opt In” Complex Case Management - Includes members that fall within the top 1% of the population but have complex needs outside of chronic conditions . Members may also be identified as potentials for CM by trigger lists or referrals.
As part of the evaluation process, all MCOs are required to conduct Rapid Cycle Improvement (RCI) projects. Some of the RCI’s that were successful included changing or improving member behavior with a focus on completing appropriate diabetic screenings; decreasing the rate of “unable to contact” members in a given county by six percent; and improving the health of members by successful weight management. There were

112
also some RCIs that were attempted and were not successful. These include attempting to improve the retention of enrollees in Chronic Care Management; and improving the ability of members to track and update their own personal health care information via a web portal device.
MCO Provider Agreements
The Tennessee Department of Commerce and Insurance (TDCI) operates under an inter-agency agreement with TennCare to review all MCOs’ provider agreements to ensure the provider agreements meet the uniform requirements set forth in the CRA. When TDCI receives a provider agreement that contains clinical information or other information outside their area of expertise, a copy is sent to TennCare for review and comments. As a means of quality assurance, the Tennessee Comptroller’s office is responsible for auditing the activities of TDCI.
Grants
Money Follows the Person – TennCare implemented its Money Follows the Person (MFP) Rebalancing Demonstration Grant program in October 2011. A unique incentive payment structure rewards MCOs who are successful in achieving the state’s transition, rebalancing, and related benchmarks established under the program. In addition to help significant numbers of individuals transition from institutions to qualified residences in the community, the State has utilized rebalancing funds to increase housing capacity across the state, creating more affordable and accessible housing for individuals served in Medicaid programs.
In 2013, TennCare was awarded a grant from the Robert Wood Johnson Foundation to fund technical assistance in the state’s Quality Improvement in Long-Term Services and Supports (QuILTSS) value-based purchasing initiative. As part of the QuILTSS initiative, TennCare will develop a new payment approach based in part on a quality framework, including a core set of quality domains and quality performance measures that will be collected to measure the quality of services provided by LTSS providers. These providers include both those in nursing facilities and in home and community based services (HCBS). The framework, developed in conjunction with stakeholders, focuses on quality from the member’s perspective—the member’s experience of care. The data will be used to calculate payments in order to properly align incentives, enhance the customer experience of care, support better health and improve health outcomes for persons receiving LTSS. State Innovations Models Initiative: Model Test Award
In 2015, TennCare was awarded a State Innovations Model (SIM) Model Test grant by the Centers for Medicare and Medicaid Innovation (CMMI). This grant supports the Tennessee Health Care Innovation Initiative which includes three strategies: Primary Care Transformation, Episodes of Care, and Long-Term Services and Supports. The State’s Primary Care Transformation strategy includes an aligned TennCare Patient Centered Medical Home (PCMH) model, a Tennessee Health Link program for TennCare members with the highest behavioral health needs, as well as a shared Care Coordination Tool that allows providers to identify and track the closure of gaps in care linked to quality measures. Episodes of Care focuses on improving the quality and cost of health care delivered in association with acute or specialist-driven health care events such as a surgical procedure or an inpatient hospitalization. TennCare’s LTSS strategy focuses on improving quality and shifting payment to outcomes-based measures for NF and HCBS services and for Enhanced Respiratory Care services. It also supports the development and implementation of a comprehensive, competency based workforce development program and credentialing registry for direct

113
service workers in NF and HCBS settings. The Tennessee Health Care Innovation Initiative will further advance the vision of improved quality of services from the perspective of the member. The Tennessee Health Care Innovation Initiative continues to be a strong priority for TennCare.

114
Compliance with Federal Requirements
Intermediate Sanctions
CFR 438.204(e) For MCOs, detail how the state will appropriately use intermediate sanctions that meet
the requirements of 42 C.F.R. Part 428, Subpart I. CRA E.29.1 Addresses Intermediate Sanctions:
TennCare may impose any or all sanctions upon reasonable determination that the contractor failed to comply with any Corrective Action Plan (CAP) or is otherwise deficient in the performance of its obligations under the Agreement, which shall include, but may not be limited to the following:
o Fails substantially to provide medically necessary covered services; o Imposes on members cost sharing responsibilities that are in excess of the cost sharing
permitted by TennCare; o Acts to discriminate among enrollees on the basis of health status or need for health care
services; o Misrepresents or falsifies information that it furnishes to CMS or to the State; o Misrepresents or falsifies information furnished to a member, potential member, or provider; o Fails to comply with the requirements for physician incentive plans as listed in 42 CFR 438.6(h); o Has distributed directly, or indirectly through any agent or independent contractor, marketing
or member materials that have not been approved by the State or that contain false or materially misleading information; and
o Has violated any of the other applicable requirements of Sections 1903(m) or 1932 of the Social Security Act and any implementing regulations.
TennCare shall only impose those sanctions it determines to be appropriate for the deficiencies identified. However, TennCare may impose intermediate sanctions on the contractor simultaneously with the development and implementation of a Corrective Action Plan if the deficiencies are severe and/or numerous. Intermediate sanctions may include:
o Liquidated damages; o Suspension of enrollment in the contractor’s MCO; o Disenrollment of members; o Limitation of contractor’s service area; o Civil money penalties as described in 42 CFR 438.704; o Appointment of temporary management for an MCO as provided 42 CFR 438.706 o Suspension of all new enrollment, including default enrollment, after the sanction’s effective
date; o Suspension of payment for members enrolled after the sanction’s effective date and until CMS
or the State is satisfied that the reason for the sanction no longer exists and is not likely to recur; or
o Additional sanctions allowed under federal law or state statue or regulation that address areas of non-compliance;
o Suspension of payment for members enrolled after the effective date of the sanction and until CMS or the State is satisfied that the reason for the sanction no longer exists and is not likely to recur; or
o Additional sanctions under federal law or state statute or regulation that address areas of non-compliance.

115
Specify the state’s methodology for using intermediate sanctions as a vehicle for addressing identified quality of care problems.
Each Division of TennCare is responsible for recommending sanctions on an MCO if any of the following are identified. The Division of Managed Care Operations reviews all recommendations for sanctions and has the final responsibility for either approving or disapproving them. Once sanctions are approved, the MCO involved is notified that the sanctions will be imposed. Liquidated damages may be assessed for a variety of quality of care issues, including:
Failure to perform specific responsibilities or requirements that result in a significant threat to patient care or to the continued viability of the TennCare program; Failure to perform specific responsibilities or requirements that pose threats to TennCare integrity, but which do not necessarily imperil patient care; Failure to perform specific responsibilities or requirements that result in threats to the smooth and efficient operation of the TennCare Program Failure to meet performance standards
Deficiencies may be identified through review of MCO reports, audits, or failure to meet other contractual obligations.
Health Information Technology
42 CFR 438.204(f) Detail how the state’s information system supports initial and ongoing operation and review of the state’s quality strategy. Describe any innovative health information technology (HIT)
initiatives that will support the objectives of the state’s quality strategy and ensure the state is progressing toward its stated goals.
Tennessee’s Quality Strategy represents a different route for meeting the goals and priorities outlined by ONC for expanding statewide e-Prescribing, sharing electronic structured lab results from labs, and supporting patient care transitions with electronic care summaries. These basic HIE building blocks will support numerous care improvements for patients, including better treatment and diagnosis, improved chronic care coordination, and reductions in medication errors and unnecessary repeat testing, as well as protecting enrollee privacy by utilizing electronic health records.
In addition to promoting Electronic Health Records, and in accordance with the HITECH Act of 2009, a Business Associate’s (BA) disclosure, handling, and use of PHI must comply with HIPAA Security Rule and HIPAA Privacy Rule mandates. Under the HITECH Act, any HIPAA business associate that serves a health care provider or institution is now subject to audits by the Office for Civil Rights (OCR) within the Department of Health and Human Services and can be held accountable for a data breach and penalized for noncompliance.
With these new regulations in mind, TennCare’s HIPAA business associate agreement explicitly spells out how a BA will report and respond to a data breach, including data breaches that are caused by a business associate’s subcontractors. In addition, TennCare’s HIPAA business associate agreement requires a BA to demonstrate how it will respond to an OCR investigation. CRA Section 2.12.9.55 requires that the provider safeguard enrollee information according to applicable state and federal laws and regulations including, but not limited, to HIPAA and Medicaid laws, rules and regulations.

116
SECTION V: Delivery System Reforms CMS requirement: This section should be completed by states that have recently implemented or are planning to implement delivery system reforms. Examples of such delivery system reforms include, but are not limited to, the incorporation of the following services and/or populations into a managed care delivery system: aged, blind, and disabled population; long-term services and supports; dental services, behavioral health; substance abuse services; children with special health care needs; foster care children; or dual eligibles.
Describe the reasons for incorporating this population/service into managed care. Include a definition of this population and methods of identifying enrollees in this population.
N/A List any performance measures applicable to this population/service, as well as the reasons for
collecting these performance measures. N/A
List any performance improvement projects that are tailored to this population/service. This should include a description of the interventions associated with the performance improvement projects.
N/A Address any assurances required in the state’s Special Terms and Conditions (STCs), if applicable.
N/A
In the first quarter 2015, TennCare began working with behavioral health experts to design and implement a new Behavioral Health Crisis Prevention, Intervention and Stabilization Services benefit for individuals with I/DD who experience challenging behaviors that place themselves or others at risk of harm. Services began in early 2016. The service is delivered under a new person-centered model, building systems of support (SOS) designed to improve quality of life by promoting crisis planning and prevention. Crisis prevention includes person-centered assessment and planning, and training on the SOS as well as the needs of the individual in order to avoid potential triggers and to provide positive behavior supports so that individuals have the opportunity to experience greater independence and an improved quality of life, free of challenging behavior. The model will further support sustained integrated community living by equipping families and providers supporting individuals with I/DD to quickly identify and address potential crisis situations, intervening immediately to de-escalate a potential crisis situation whenever possible. When necessary, the SOS includes the availability of an in-home crisis intervention and stabilization response to assist and support the person or agency who is primarily responsible for supporting an individual with I/DD who is experiencing a behavioral crisis that presents a threat to the individual’s health and safety or community living arrangement, or the health and safety of others. The goal is to stabilize in place, divert from inpatient, and support sustained integrated community living whenever possible and appropriate. If it is determined that short-term placement (i.e., respite) out of the current living arrangement is needed in order to stabilize the crisis or that inpatient psychiatric hospitalization is appropriate, the model includes preparation and planning for transition back to the appropriate community living arrangement as soon as appropriate, and with review and revision as needed of the Crisis Prevention and Intervention Plan prior to such transition. TennCare is examining quality data that will be used to develop an incentive or shared savings model based on such key performance indicators, including a decrease in emergency department utilization, a decrease in crisis events requiring out-of-home placement or behavioral respite services a decrease in inpatient psychiatric admissions and inpatient days, decreased use of psychotropic medications

117
(except to treat diagnosed MH conditions), a reduction in the intensity/cost of HCBS needed to sustain community living (i.e., more cost-effective services/more integrated settings); an increase in sustained community living (community tenure), and in integrated employment. Additional quality metrics are also being tracked that will not directly impact reimbursement, but will help to monitor the quality of services and impact on quality of life for program participants. TennCare Patient Centered Medical Homes (PCMH)
PCMH is a comprehensive care delivery model designed to improve the quality of primary care services for TennCare members, the capabilities of and practice standards of primary care providers, and the overall value of health care delivered to the TennCare population.
Tennessee has built on the existing PCMH efforts by providers and payers in the State to create a robust PCMH program that features alignment across payers on critical elements. A PCMH Technical Advisory Group of Tennessee clinicians was convened in 2015 to develop recommendations in several areas of program design including quality measures, sources of value, and provider activity requirements. Following much stakeholder input and design work, TennCare’s three health plans launched a statewide aligned PCMH program with 29 organizations on January 1, 2017.
PCMH providers commit to member centered access, team based care, Population Health management, care management support, care coordination, performance measurement and quality improvement. Participating providers receive training and technical assistance, quarterly reports with actionable data, and access to the Care Coordination Tool. These providers are compensated with ongoing financial support and an opportunity for an annual outcome payment based on quality and efficiency performance.
Tennessee is also partnering with the Tennessee Chapter of the American Academy of Pediatrics (TNAAP) to implement a portfolio of quality improvement projects with Tennessee pediatricians that meet the distinct health care needs of infants, children and adolescents. Since 2008, TNAAP has collaborated with the Bureau of TennCare in a multi-year medical home implementation project to promote Pediatric PCMH implementation across the state.

118

119
Efficiency measures for TennCare’s PCMH program are as follows:
All-cause hospital readmission rate
Avoidable ED visits
Ambulatory care – ED visits
Inpatient admissions
Mental health utilization
Rate of inpatient psychiatric admissions
Tennessee Health Link
The primary objective of Tennessee Health Link is to coordinate health care services for TennCare members with the highest behavioral health needs.
TennCare has worked closely with providers and TennCare’s three health plans to create a program to address the diverse needs of people these members. A Health Link Technical Advisory Group of Tennessee clinicians and practice administrators was convened in 2015 to develop recommendations in several areas of program design including, quality measures, sources of value, and provider activity requirements. The design of Health Link was also influenced by federal Health Home requirements.
Through better coordinated behavioral and physical health services, the Health Link program is meant to produce improved member outcomes, greater provider accountability and flexibility when it comes to the delivery of appropriate care for each individual and improved cost control for the state. Health Link providers are encouraged to ensure the best care setting for each member, offer expanded access to care, improve treatment adherence, and reduce hospital admissions. In addition, the program is built to encourage the integration of physical and behavioral health, as well as, mental health recovery, giving every member a chance to reach his or her full potential for living a rewarding and increasingly independent life in the community.
Health Link providers commit to providing comprehensive care management, care coordination, referrals to

120
social supports, member and family support, transitional care, health promotion, and Population Health management. Participating providers receive training and technical assistance, quarterly reports with actionable data, and access to the Care Coordination Tool. These providers are compensated with financial support in the form of activity payments and an opportunity for an annual outcome payment based on quality and efficiency performance.
The Health Link program began statewide on December 1, 2016.
Efficiency measures for Tennessee Health Link are as follows:
All-cause hospital readmission rates
Ambulatory care – ED visits
Inpatient admissions – total inpatient
Mental health utilization – inpatient
Rate of inpatient psychiatric admissions
121
SECTION VI: CONCLUSIONS AND OPPORTUNITIES
Identify any successes that the state considers to be best or promising practices:
The TennCare MCOs have successfully transitioned from Disease Management to Population Health (PH). All 1.45 million TennCare enrollees are now stratified into three PH levels across the care continuum based on their health risk rather than disease. This approach allows for both proactive and reactive interventions and supports staying healthy as well as managing a chronic illness. 2016 evaluation data showed positive results for a number of the measures. These are listed in a previous section of this document. An effective process is now in place for seamless coordination of a dual member surrounding an inpatient admission through TennCare’s MIPPA Dual Care Coordination Project. In January 2013, staff from TennCare’s Long Term Services and Supports Division and the Quality Oversight Division began discussions with five D-SNPs related to coordinating care for dual eligible enrollees. These D-SNPs included two who were associated with currently contracted MCOs and three who had no contractual relationships with TennCare other than through the MIPPA agreements. Also included was one contracted MCO in the process of becoming a D-SNP who has since successfully completed the process and is now a fully-functioning collaborator. A series of planning meetings was held with all MCOs and these D-SNPs, with the ultimate goal of developing procedures that would allow all of the plans to refer to each other in order to meet the needs of the enrollees. The group gained consensus and jointly developed two referral tools that could be electronically sent on a daily basis. The tools include information about inpatient admissions and discharges and indicate needs for referrals for specific services, such as Nursing Facility Diversion and Exhaustion of Benefits. The Health Plans work together to address any issues in real time, and the TennCare staff have continued to have regular phone and face-to-face meetings to improve data collection and reporting processes. During such discussions, it was revealed that members admitted to the hospital for ‘Observation’ were not always captured, so the processes were revised to ensure inclusion of this important dual population for coordination of care. Currently, there are six D-SNPs operating in Tennessee. Each D-SNP and MCO submit Quarterly reports on Dual Coordination to TennCare for monitoring and support of the process. Additionally, in August 2017, TennCare began a quarterly audit of D-SNP members who have multiple readmissions during a quarter, as presented on the quarterly report, to review and provide feedback on D-SNP and MCO coordination efforts to decrease preventable readmissions. These plans submit HEDIS data to TennCare for measures identified for D-SNPs by NCQA.

122
During the 2017 AQS, surveyors noticed several MCO improvements from the previous year, demonstrating a strong commitment to addressing the opportunities identified during the 2016 AQS. TennCare MCCs achieved 100% compliance on a majority of assessed elements during the 2017 AQS, and scores remained high on the remaining measures. The most significant improvements over 2016 occurred in quality assessments for provider credentialing and re-credentialing, with one MCO raising its score 29.5 percentage points over last year to achieve 100% compliance. In addition each MCO continued to participate in the statewide collaborative work groups with TennCare and other MCOs. These collaborations remain important strengths for 2016 and have improved how the MCOs educate and conduct outreach to members and providers by presenting a unified message on topics such as adolescent outreach and increasing the number of adolescent well-child visits. Innovation has always been a priority throughout TennCare. Consistent with its mission “to continuously improve the health and satisfaction of TennCare enrollees,” the Division of Quality Oversight works closely with health plan representatives to foster such innovation and encourage adoption of evidence-based practices statewide. In 2016, each MCC demonstrated a strong commitment to quality improvement and best practices across a range of programs. During the various activities monitored by the EQRO, the following activities were identified as promising practices: Performance Measure Validations
Continual use of standard and nonstandard supplemental data sources for HEDIS 2016 reporting. Ongoing efforts to increase electronic claims submissions from providers Excellent processes for tracking and trending all sources of HEDIS data Commitment to achieving a more sophisticated internal body of knowledge of the HEDIS reporting process Robust audit procedures in place to ensure accuracy
Performance Improvement Projects
Dedication to ensuring compliance across all PIPs Detailed analyses of PIPs maturing to subsequent re-measurement years Ongoing multidisciplinary barrier analyses to determine the effectiveness of implemented interventions Thorough, comprehensive results covering all required criteria Complete measurement descriptions & corresponding documentation of results and significance of findings Extensive interpretation of results that illustrated the effectiveness of the improvement activities
Annual Network Adequacy and Benefit Delivery Review
Improvements to the overall credentialing and re-credentialing process Staff training to improve knowledge of documentation requirements High compliance with provider to member ratios and geographical-across standards Ongoing provider education to improve member outcomes

123
Excellent scores related to provider & member benefit notification Implementation of the Employment and Community First CHOICES program using the same network of providers and standardized forms and procedures
Annual Quality Survey
Continued commitment to participating in the statewide collaborative workgroups with TennCare and other MCCs Continued commitment to monitoring EPSDT services High ratings on Quality Performance standards and Performance Activity Standards Ongoing and improved outreach to members and providers
Include a discussion of the ongoing challenges the state faces in improving the quality of care for beneficiaries.
Lack of member engagement in chronic condition programs, wellness programs, and even complex case management programs continues to be a barrier to positive outcomes, both nationally and the TennCare population. Proven programs can be implemented, but fail if members cannot be engaged. TennCare MCOs, as well as national research, have identified several reasons for lack of engagement by the Medicaid population. Lack of correct or current phone numbers is always the first barrier listed. Medicaid members are very mobile; they change phone numbers and discontinue use of cell phones frequently. Health plans have found this to be true even when the attempt is made one day after receiving the number. When using traditional identification methodologies, there is often a significant lag time between diagnosis and engagement attempts. Members are much more receptive to help at the time of diagnosis. Psychosocial issues also affect engagement rates. If a member has a behavioral health problem, lack of housing and food, or low self-worth, engaging them in health issues is difficult. Another concern for those attempting to engage Medicaid members in continuing program is the fact that many want their immediate needs met and are not receptive to addressing long-term issues. Often initial engagement occurs but retention in a program does not. The last barrier identified is discovering the right message for the targeted audience. This is extremely difficult and varies tremendously among subpopulations. All TennCare health plans use motivational interviewing techniques in an attempt to engage their members. They are also testing engagement techniques such as social media, face-to-face engagement, focus group approaches, and telephonic strategies. Include a discussion of challenges or opportunities with data collection systems, such as registries, claims
or enrollment reporting systems, pay-for-performance tracking or profiling systems, electronic health record (EHR) information exchange, regional health information technology collaborative, telemedicine
initiatives, grants that support state HIT/EHR development or enhancement, etc. Although some information systems present challenges to data collection for quality oversight and analysis, the State of Tennessee has multiple opportunities for the collection of data to track a variety of quality metrics. Tennessee is constantly seeking ways to upgrade data analytic capabilities across state systems as well as its Medicaid Management Information System (MMIS). With the implementation of the Care Coordination Tool, Tennessee will be able to provide the ability for health care providers to coordinate patients across multiple payers and plan types (i.e., Medicaid, Medicare and Commercial plans). The solution, once implemented will produce risk scores; prioritize patients and activities based on their risk scores; track gaps in care; allow for view of prescription fill information; produce care plans; allow users to track completion of tasks attributed to the care plans

124
and the patient’s needs; utilize eCommunication to foster greater coordination across the Care Team; and support the work of both Patient Centered Medical Home and Health Link care models. Opportunities also include the ability to provide a greater quality of care to patients in a more timely manner. The implementation of a Clinical Knowledge Module, that includes hospital admission, discharge information and transfer information (ADT), will standardize the clinical information loaded from the ADT feeds. Once hospitals are on-boarded Tennessee will begin to collect and co-locate ADT feeds to begin building a clinical database for the State Health Information Exchange (HIE) that will address gaps in care and reduce hospital admissions. Through the Quality Apps project, the state will have the ability to collect clinical quality data that cannot be acquired from processed medical billing claims. Ultimately, these Quality Apps will provide all payers, beginning with the State’s Medicaid participating MCOs, with the necessary information to reimburse providers for high quality health outcomes. EHR Information Exchange and Regional Health Information Collaborative In Tennessee, HIE development/use has experienced many challenges. Taking advantage of a national initiative, the State has launched Direct Project to create the set of standards and services that, with a policy framework, can enable simple, directed, routed and scalable transport over the Internet to be used for secure and meaningful exchange between known participants in support of meaningful use. Direct technology offers providers a simple and secure way to communicate protected health information (e.g., clinical summaries, continuity of care documents, and laboratory results) between care settings, as well as directly with the patient who also owns a Direct address. Patients are able to communicate via Direct in a secure fashion by using personal health records that are Direct-enabled. The most basic implementation of the Direct Project is secure email via an email client or web portal, which works just like regular email but with an added level of security required for point-to point exchange of sensitive health information. Direct is advantageous for those with an EHR because it helps in meeting the meaningful use requirements for electronic exchange/transport/transfer of electronic health information. As many as six Meaningful Use Modified Stage 2 measures could be met with various implementations of Direct. The state currently has nearly 5,000 DIRECT secure messaging users. Over the past three years, EHR system adoption measured by the number of providers participating in the EHR Provider Incentive Program, through either Medicare or Medicaid has grown by almost 20%, to 10,951 at the end of August 2016. Combined with Medicare EHR registrations, this means that approximately 39% of the eligible provider types in Tennessee (including hospitals) have registered for the EHR Incentive Program. Since the inception of the program, TennCare has made 4,843 payments to unique providers, totaling a little more than $253.5 million.

125
EHR and Meaningful Use
TennCare’s Quality Oversight division is responsible for the meaningful use aspect of the EHR Incentive Program. As such, the Division has four responsibilities:
Evaluating meaningful use attestations (pre-payment verification) Facilitating successful meaningful use Collecting MU data Analysis and reporting
The prepayment verification procedures have been structured to encourage and enable providers’ continued participation in the program even if an attestation is at first incorrect or incomplete. The robust verification procedures also contribute to the success of that participation by correcting mistakes when they are first available for note and identifying areas of common challenge. A key administrative tool in the prepayment verification process is the TennCare attestation portal: the Provider Incentive Payment Program (PIPP) portal. This portal receives attestations, stores the most recent attestation in a given payment year, and allows TennCare staff to approve or return the attestations as they progress through various stages of the portal. Additional functionality in the portal to support administration of the program is constantly being planned and implemented, and such improvements will continue to affect the process, though not the content, of verification procedures. The goal of these improvements is to support electronic submission of Clinical Quality Measures and other measures as technology advances. These improvements will result in greater reliability of submissions, reducing clerical errors. The Quality Oversight Meaningful Use Unit is in their fifth year of prepayment verification of meaningful use. The first year of meaningful use in Tennessee was 2012. Data is complete for payment years 2012 and 2013, 2014 and 2015. We are in the process of closing out the attestation period for payment year 2016. The biggest challenges in 2017 have been related to implementing and educating providers on the modified Stage 2 and Stage 3 mandated changes outlined in the 2015-2017 Modified Stage 2 and Stage 3 rule, Outpatient Prospective Payment rule and the Medicare Quality Payment Program rule. As a result of the rules changes, Modified Stage 2 and Stage 3 screen mock ups were created and submitted with the SMHP to CMS for approval. TennCare PIPP portal opened to accept Stage 3 attestations on April 3, 2017. The Meaningful Use team has worked throughout the year to support educating providers through technical support. A total of 1078 Eligible Professionals (EPs) have attested to modified Stage 2 in 2017 for payment year 2016. No providers have attested to Stage 3. The final rule provided EPs the option of attesting to Modified Stage 2 or Stage 3 for a 90 day HER Reporting Period for payment year 2016. There was an 8% increase in providers (1141) attesting to Meaningful Use in payment year 2016 over the prior year (1049). This reflects the effort of MU staff in providing outreach through webinars, EHR mailbox responses, technical assistance calls and onsite visits. Twenty-seven percent of meaningful use Eligible Professionals attested for the first time in payment year 2016. Overall, 73% of the providers are returning meaningful users. In order to adapt to changes for the 2017 Incentive year and Stage 3, staff is involved in retooling PIPP MU pages, evaluation tools as well as updating web pages and providing educational webinars.

126
Grants that support State HIT/EHR development or enhancement
The state of Tennessee has received grants from the Office of the National Coordinator (ONC), CMS, and SAMSHSA/MITRE to further HIT and HIE across the state. ONC granted $11.7 million for HIE advancement over a four year period (February 2010 to February 2014). These funds have assisted in upgrading the state’s immunization system, electronic lab reporting, a state DIRECT HISP implementation, the statewide roll-out to providers of DIRECT technology, and ePrescribing adoption, as well as operations and oversight of the program. CMS has granted the state a HIT/HIE IAPD grant of $25,551,041. $12,184,496 of these funds is intended to fund administration of the CMS Provider Incentive Program and HIE program in Tennessee as well as updates to the State’s incentive program registration system. $13,366,543. of these funds is intended to fund HIE projects, including providing State HIE Core services, allowing access to clinical data contained in Medicaid claims to both providers and Medicaid recipients, development of regional HIE organizations, and assisting provider practices in attainment of meaningful use.
Include recommendations that the State has for ongoing Medicaid and CHIP quality improvement
activities in the state. Highlight any grants received that support improvement of the quality of care received by managed care enrollees, if applicable.
State Innovation Model (SIM) Grants
Tennessee received a SIM Design grant from the Centers for Medicare and Medicaid Innovation in 2013 that was used to develop payment and delivery system reform models (such as episodes of care and Patient Centered Medical Homes) to enhance the quality of care, improve the patient experience of care for members, and reduce costs. In 2015, TennCare was awarded a State Innovations Model (SIM) Model Test grant by the Centers for Medicare and Medicaid Innovation (CMMI) . This grant supports the Tennessee Health Care Innovation Initiative which includes three strategies: Primary Care Transformation, Episodes of Care, and Long-Term Services and Supports. The State’s Primary Care Transformation strategy includes an aligned TennCare Patient Centered Medical Home (PCMH) model, a Tennessee Health Link program for TennCare members with the highest behavioral health needs, as well as a shared Care Coordination Tool that allows providers to identify and track the closure of gaps in care linked to quality measures. Episodes of Care focuses on improving the quality and cost of health care delivered in association with acute or specialist-driven health care events such as a surgical procedure or an inpatient hospitalization. TennCare’s LTSS strategy focuses on improving quality and shifting payment to outcomes-based measures for NF and HCBS services and for Enhanced Respiratory Care services. It also supports the development and implementation of a comprehensive, competency based workforce development program and credentialing registry for direct service workers in NF and HCBS settings. The Tennessee Health Care Innovation Initiative will further advance the vision of improved quality of services from the perspective of the member.

127
Attachment I: CRA Access Standards
GENERAL ACCESS STANDARDS In general, contractors shall provide available, accessible, and adequate numbers of institutional facilities, service locations, service sites, professional, allied, and paramedical personnel for the provision of covered services, including all emergency services, on a 24-hour-a-day, 7-day-a-week basis. At a minimum, this shall include:
Primary Care Physician or Extender:
(a) Distance/Time Rural: 30 miles
(b) Distance/Time Urban: 20 miles
(c) Patient Load: 2,500 or less for physician; one-half this for a physician extender.
(d) Appointment/Waiting Times: Usual and customary practice (see definition below), not to exceed 3 weeks from date of a patient’s request for regular appointments and 48 hours for urgent care. Waiting times shall not exceed 45 minutes.
(e) Documentation/Tracking requirements:
+ Documentation - Plans must have a system in place to document appointment scheduling times.
+ Tracking - Plans must have a system in place to document the exchange of member information if a provider, other than the primary care provider (i.e., school-based clinic or health department clinic), provides health care.
Specialty Care and Emergency Care: Referral appointments to specialists (e.g., specialty physician services, hospice care, home health care, substance abuse treatment, rehabilitation services, etc.) shall not exceed 30 days for routine care or 48 hours for urgent care. All emergency care is immediate, at the nearest facility available, regardless of contract. Waiting times shall not exceed 45 minutes.
Hospitals (a) Transport time will be the usual and customary, not to exceed 30 miles, except in rural areas
where distance may be greater. If greater, the standard needs to be the community standard for accessing care, and exceptions must be justified and documented to the State on the basis of community standards.
Long-Term Care Services: Transport distance to licensed Adult Day Care providers will be the usual and customary not to exceed 20 miles for TennCare enrollees in urban areas, not to exceed 30 miles for TennCare enrollees in suburban areas and not to exceed 60 miles for TennCare enrollees in rural areas except where community standards and documentation shall apply.

128
General Optometry Services:
(a) Transport time will be the usual and customary, not to exceed 30 minutes, except in rural areas where community standards and documentation shall apply.
(b) Appointment/Waiting Times: Usual and customary not to exceed 3 weeks for regular appointments and 48 hours for urgent care. Waiting times shall not exceed 45 minutes.
All other services not specified here shall meet the usual and customary standards for the community as determined by TENNCARE.
TENNCARE will evaluate the need for further action when the above standards are not met. At its sole discretion TENNCARE may elect one of three options: (1) TENNCARE may request a Corrective Action Plan (CAP), (2) a Request for Information (RFI), (3) or an On Request Report (ORR) depending on the severity of the deficiency.
The requested CAP, RFI or ORR response shall detail the CONTRACTOR’s network adequacy considering any alternate measures, documentation of unique market conditions and/or its plan for correction. If TENNCARE determines the CONTRACTOR’s response demonstrates existence of alternate measures or unique market conditions, TENNCARE may elect to request periodic updates from the CONTRACTOR regarding efforts to address such conditions.

129
Attachment II: Specialty Network Standards
SPECIALTY NETWORK STANDARDS
The CONTRACTOR shall adhere to the following specialty network requirements to ensure access and availability to specialists for all members (adults and children) who are not dually eligible for Medicare and TennCare (non-dual members). For the purpose of assessing specialty provider network adequacy, TENNCARE will evaluate the CONTRACTOR’s provider network relative to the requirements described below. A provider is considered a “specialist” if he/she has a provider agreement with the CONTRACTOR to provide specialty services to members. Access to Specialty Care
The CONTRACTOR shall ensure access to specialty providers (specialists) for the provision of covered services. At a minimum, this means that:
The CONTRACTOR shall have provider agreements with providers practicing the following specialties: Allergy, Cardiology, Dermatology, Endocrinology, Otolaryngology, Gastroenterology, General Surgery, Nephrology, Neurology, Neurosurgery, Oncology/Hematology, Ophthalmology, Orthopedics, Psychiatry (adult), Psychiatry (child and adolescent), and Urology; and
The following access standards are met:
o Travel distance does not exceed 60 miles for at least 75% of non-dual members and o Travel distance does not exceed 90 miles for ALL non-dual members
Availability of Specialty Care
The CONTRACTOR shall provide adequate numbers of specialists for the provision of covered services to ensure adequate provider availability for its non-dual members. To account for variances in MCO enrollment size, the guidelines described in this Attachment have been established for determining the number of specialists with whom the CONTRACTOR must have a provider agreement. These are aggregate guidelines and are not age specific. To determine these guidelines the number of providers within each Grand Region was compared to the size of the population in each Grand Region. The CONTRACTOR shall have a sufficient number of provider agreements with each type of specialist in each Grand Region served to ensure that the number of non-dual members per provider does not exceed the following:

130
Maximum Number of Non-Dual Members per Provider by Specialty
Specialty Number of Non-Dual Members
Allergy & Immunology 100,000
Cardiology 20,000
Dermatology 40,000
Endocrinology 25,000
Gastroenterology 30,000
General Surgery 15,000
Nephrology 50,000
Neurology 35,000
Neurosurgery 45,000
Oncology/Hematology 80,000
Ophthalmology 20,000
Orthopedic Surgery 15,000
Otolaryngology 30,000
Psychiatry (adult) 25,000
Psychiatry (child & adolescent) 150,000
Urology 30,000
TENNCARE will evaluate the need for further action when the above standards are not met. At its sole discretion TENNCARE may elect one of three options: (1) TENNCARE may request a Corrective Action Plan (CAP), (2) a Request for Information (RFI), (3) or an On Request Report (ORR) depending on the severity of the deficiency.
The requested CAP, RFI or ORR response shall detail the CONTRACTOR’s network adequacy considering any alternate measures, documentation of unique market conditions and/or its plan for correction. If TENNCARE determines the CONTRACTOR’s response demonstrates existence of alternate measures or unique market conditions, TENNCARE may elect to request periodic updates from the CONTRACTOR regarding efforts to address such conditions.

131
Attachment III: Access & Availability for Behavioral Health Services
ACCESS & AVAILABILITY FOR BEHAVIORAL HEALTH SERVICES
The CONTRACTOR shall adhere to the following behavioral health network requirements to ensure access and availability to behavioral health services for all members (adults and children). For the purpose of assessing behavioral health provider network adequacy, TENNCARE will evaluate the CONTRACTOR’s provider network relative to the requirements described below. Providers serving adults will be evaluated separately from those serving children. Access to Behavioral Health Services
The CONTRACTOR shall ensure access to behavioral health providers for the provision of covered services. At a minimum, this means that:
The CONTRACTOR shall have provider agreements with providers of the services listed in the table below and meet the geographic and time for admission/appointment requirements.
Service Type Geographic Access Requirement Maximum Time for
Admission/Appointment Psychiatric Inpatient Hospital Services
Travel distance does not exceed 90 miles for at least 90% of members
4 hours emergency (involuntary)/24 hours 24 hours (voluntary)
24 Hour Psychiatric Residential Treatment
The CONTRACTOR shall contract with at least one (1) provider of service in the Grand Region for ADULT members ----------------------------------------------- Travel distance does not exceed 60 miles for at least 75% of CHILD members and does not exceed 90 miles for at least 90% of CHILD members
Within 30 calendar days
Outpatient Non-MD Services Travel distance does not exceed 30 miles for ALL members
Within 10 business days; if urgent, within 48 hours
Intensive Outpatient (may include Day Treatment (adult), Intensive Day Treatment (Children & Adolescent) or Partial Hospitalization
Travel distance does not exceed 90 miles for at least 90% of members
Within 10 business days; if urgent, within 48 hours

132
Inpatient Facility Services (Substance Abuse)
Travel distance does not exceed 90 miles for at least 90% of members
Within 2 calendar days; for detoxification - within 4 hours in an emergency and 24 hours for non- emergency
24 Hour Residential Treatment Services (Substance Abuse)
The CONTRACTOR shall contract with at least one (1) provider of service in the Grand Region for ADULT members
----------------------------------------
The CONTRACTOR shall contract with at least one (1) provider of service in each Grand Region (3 statewide) for CHILD members
Within 10 business days
Outpatient Treatment Services (Substance Abuse)
Travel distance does not exceed 30 miles for ALL members
Within 10 business days; for detoxification – within 24 hours
Intensive Community Based Treatment Services
Not subject to geographic access standards
Within 7 calendar days
Intensive Community Based Treatment Services
Not subject to geographic access standards
Within 7 calendar days
Supported Housing Not subject to geographic access standards
Within 30 calendar days
Crisis Services (Mobile) Not subject to geographic access standards
Face-to-face contact within 2 hours for emergency situations and 4 hours for urgent situations
Crisis Stabilization Not subject to geographic access standards
Within 4 hours of referral
TENNCARE will evaluate the need for further action when the above standards are not met. At its sole

133
discretion TENNCARE may elect one of three options: (1) TENNCARE may request a Corrective Action Plan (CAP), (2) a Request for Information (RFI), (3) or an On Request Report (ORR) depending on the severity of the deficiency.
The requested CAP, RFI or ORR response shall detail the CONTRACTOR’s network adequacy considering any alternate measures, documentation of unique market conditions and/or its plan for correction. If TENNCARE determines the CONTRACTOR’s response demonstrates the existence of alternate measures or unique market conditions, TENNCARE may elect to request periodic updates from the CONTRACTOR regarding efforts to address such conditions
At a minimum, providers for the following service types shall be reported on the Provider Enrollment File:
Service Type Service Code(s) for use in position
330-331 of the Provider Enrollment
Psychiatric Inpatient Hospital Services Adult - 11, 79, 85 Child – A1 or H9
24 Hour Psychiatric Residential Treatment Adult - 13, 81, 82 Child – A9, H1, or H2
Outpatient MD Services (Psychiatry) Adult – 19 Child – B5
Outpatient Non-MD Services Adult – 20 Child – B6
Intensive Outpatient/ Partial Hospitalization Adult – 21, 23, 62 Child - B7,
Inpatient Facility Services (Substance
Adult – 15, 17 Child –
24 Hour Residential Treatment Services (Substance Abuse)
Adult - 56 Child - F6
Outpatient Treatment Services (Substance Abuse)
Adult – 27 or 28 Child – D3
Tennessee Health Link Services Adult – 31 Child –D7
Intense Community Based Treatment Services Adult 66 or 83 Child D3 or D4
Psychiatric Rehabilitation Services: Psychosocial Rehabilitation 42 Supported Employment 44 Peer Recover Service 88
Illness Management & Recovery 91

134
Family Support Services 49 Supported Housing 32 and 33 Crisis Services (Mobile) Adult - 37, 38, 39
Child - D8, D9, E1
Crisis Respite Adult – 40 Child – E2
Crisis Stabilization Adult 41

135
Attachment IV: Covered Benefits
A.2.4.1 CONTRACTOR Covered Benefits
2.6.1.1 The CONTRACTOR shall cover the physical health, behavioral health and long-term care services/benefits outlined below. Additional requirements for behavioral health services are included in Section A.2.7.2 and Attachment I.
2.6.1.2 The CONTRACTOR shall integrate the delivery of physical health, behavioral health
and long-term care services. This shall include but not be limited to the following:
2.6.1.2.1 The CONTRACTOR shall operate a member services toll-free phone line (see Section A.2.18.1) that is used by all members, regardless of whether they are calling about physical health, behavioral health and/or long-term care services. The CONTRACTOR shall not have a separate number for members to call regarding behavioral health and/or long-term care services. The CONTRACTOR may either route the call to another entity or conduct a “warm transfer” to another entity, but the CONTRACTOR shall not require an enrollee to call a separate number regarding behavioral health and/or long-term care services.
2.6.1.2.2 If the CONTRACTOR’s nurse triage/nurse advice line is separate from its member
services line, the CONTRACTOR shall comply with the requirements in Section A.2.6.1.2.2 as applied to the nurse triage/nurse advice line. The number for the nurse triage/nurse advice line shall be the same for all members, regardless of whether they are calling about physical health, behavioral health and/or long-term services, and the CONTRACTOR may either route calls to another entity or conduct “warm transfers,” but the CONTRACTOR shall not require an enrollee to call a separate number.
2.6.1.2.3 As required in Section A.2.9.6, the CONTRACTOR shall ensure continuity and
coordination among physical health, behavioral health, and long-term services and supports and ensure collaboration among physical health, behavioral health, and long-term services and supports providers. For CHOICES members and ECF CHOICES members, the member’s Care Coordinator or Support Coordinator, as applicable, shall ensure continuity and coordination of physical health, behavioral health, and long-term services and supports, and facilitate communication and ensure collaboration among physical health, behavioral health, and long-term services and supports providers.
2.6.1.2.4 Each of the CONTRACTOR’s Population Health programs (see Section A.2.8) shall
address the needs of members who have co-morbid physical health and behavioral health conditions.
2.6.1.2.5 The CONTRACTOR shall provide the appropriate level of Population Health services
(see Section A.2.8.4 of this Contract) to non-CHOICES and non-ECF CHOICES members with co-morbid physical health and behavioral health conditions. These members should have a single case manager that is trained to provide Population Health services to enrollees with co-morbid physical and behavioral health conditions. If a member with co-morbid physical and behavioral conditions does not have a single case manager, the CONTRACTOR shall ensure, at a minimum, that the

136
member’s Population Health Care Manager collaborates on an ongoing basis with both the member and other individuals involved in the member’s care. As required in Section A.2.9.6.1.9 of this Contract, the CONTRACTOR shall ensure that upon enrollment into CHOICES or ECF CHOICES, the appropriate level of Population Health activities are integrated with CHOICES care coordination or ECF CHOICES support coordination processes and functions, and that the member’s assigned Care Coordinator or Support Coordinator, as applicable, has primary responsibility for coordination of all the member’s physical health, behavioral health and long-term services and supports needs. The member’s Care Coordinator or Support Coordinator may use resources and staff from the CONTRACTOR’s Population Health program, including persons with specialized expertise in areas such as behavioral health, to supplement but not supplant the role and responsibilities of the member’s Care Coordinator/care coordination or Support Coordinator/support coordination team. The CONTRACTOR shall report on its Population Health activities per requirements in Section A.2.30.5.
2.6.1.2.6 If the CONTRACTOR uses different Systems for physical health services, behavioral
health and/or long-term care services, these systems shall be interoperable. In addition, the CONTRACTOR shall have the capability to integrate data from the different systems.
2.6.1.2.7 The CONTRACTOR’s administrator/project director (see Section A.2.29.1.3.1) shall
be the primary contact for TENNCARE regarding all issues, regardless of the type of service, and shall not direct TENNCARE to other entities. The CONTRACTOR’s administrator/project director shall coordinate with the CONTRACTOR’s Behavioral Health Director who oversees behavioral health activities (see Section A.2.29.1.3.5 of this Contract) for all behavioral health issues and the senior executive responsible for CHOICES activities (see Sections A.2.29.1.3.7 of this Contract) for all issues pertaining to the CHOICES and ECF CHOICES programs.
2.6.1.3 CONTRACTOR Physical Health Benefits Chart
SERVICE BENEFIT LIMIT
Inpatient Hospital Services
Medicaid/Standard Eligible, Age 21 and older: As medically necessary. Inpatient rehabilitation hospital facility services are not covered for adults unless determined by the CONTRACTOR to be a cost effective alternative (see Section A.2.6.5). Medicaid/Standard Eligible, Under age 21: As medically necessary, including rehabilitation hospital facility.
Outpatient Hospital Services
As medically necessary.
Physician Inpatient Services
As medically necessary.

137
SERVICE BENEFIT LIMIT Physician Outpatient Services/Community Health Clinic Services/Other Clinic Services
As medically necessary.
TennCare Kids Services
Medicaid/Standard Eligible, Age 21 and older: Not covered. Medicaid/Standard Eligible, Under age 21: Covered as medically necessary, except that the screenings do not have to be medically necessary. Children may also receive screenings in-between regular checkups if a parent or caregiver believes there is a problem. Screening, interperiodic screening, diagnostic and follow-up treatment services as medically necessary in accordance with federal and state requirements. See Section A.2.7.6.
Preventive Care Services
As described in Section A.2.7.5.
Lab and X-ray Services
As medically necessary.
Hospice Care
As medically necessary. Shall be provided by a Medicare-certified hospice.
Dental Services Dental Services shall be provided by the Dental Benefits Manager or in some cases, through an HCBS waiver program for persons with intellectual disabilities. However, the facility, medical and anesthesia services related to the dental service that are not provided by a dentist or in a dentist’s office shall be covered services provided by the CONTRACTOR when the dental service is covered by the DBM or through an HCBS waiver program for persons with intellectual disabilities.

138
SERVICE BENEFIT LIMIT Vision Services
Medicaid/Standard Eligible, Age 21 and older: Medical eye care, meaning evaluation and management of abnormal conditions, diseases, and disorders of the eye (not including evaluation and treatment of refractive state), shall be covered as medically necessary. Routine periodic assessment, evaluation, or screening of normal eyes and examinations for the purpose of prescribing fitting or changing eyeglass and/or contact lenses are not covered. One pair of cataract glasses or lenses is covered for adults following cataract surgery. Medicaid/Standard Eligible, Under age 21: Preventive, diagnostic, and treatments services (including eyeglasses) are covered as medically necessary in accordance with TennCare Kids requirements.
Home Health Care
Medicaid /Standard Eligible, Age 21 and older: Covered as medically necessary and in accordance with the definition of Home Health Care at Rule 1200-13-13-.01 (for TennCare Medicaid) and Rule 1200-13-14-.01 (for TennCare Standard). Prior authorization required for home health nurse and home health aide services, as described in Rule 1200-13-13-.04 (for TennCare Medicaid) and 1200-13-14-.04 (for TennCare Standard). Medicaid/Standard Eligible, Under age 21: Covered as medically necessary in accordance with the definition of Home Health Care at Rule 1200-13-13-.01 (for TennCare Medicaid) and Rule 1200-13-14-.01 (for TennCare Standard). Prior authorization required for home health nurse and home health aide services, as described in Rule 1200-13-13-.04 (for TennCare Medicaid) and 1200-13-14-.04 (for TennCare Standard).
Pharmacy Services
Pharmacy services shall be provided by the Pharmacy Benefits Manager (PBM), unless otherwise described below. The CONTRACTOR shall be responsible for reimbursement of injectable drugs obtained in an office/clinic setting and to providers providing both home infusion services and the drugs and biologics. The CONTRACTOR shall require that all home infusion claims contain National Drug Code (NDC) coding and unit information to be paid. Services reimbursed by the CONTRACTOR shall not be included in any pharmacy benefit limits established by TENNCARE for pharmacy services (see Section A.2.6.2.2).

139
SERVICE BENEFIT LIMIT Durable Medical Equipment (DME)
As medically necessary. Specified DME services shall be covered/non-covered in accordance with TennCare rules and regulations.
Medical Supplies
As medically necessary.
Specified medical supplies shall be covered/non-covered in accordance with TennCare rules and regulations.
Emergency Air And Ground Ambulance Transportation
As medically necessary.
Non-emergency Medical Transportation (including Non-Emergency Ambulance Transportation)
Covered non-emergency medical transportation (NEMT) services are necessary non-emergency transportation services provided to convey members to and from TennCare covered services (see definition in Exhibit A to Attachment XI). Non-emergency transportation services shall be provided in accordance with federal law and the Bureau of TennCare’s rules and policies and procedures. TennCare covered services (see definition in Exhibit A to Attachment XI) include services provided to a member by a non-contract or non-TennCare provider if (a) the service is covered by Tennessee’s Medicaid State Plan or Section 1115 demonstration waiver, (b) the provider could be a TennCare provider for that service, and (c) the service is covered by a third party resource (see definition in Section A.1 of the Contract). If a member requires assistance, an escort (as defined in TennCare rules and regulations) may accompany the member; however, only one (1) escort is allowed per member (see TennCare rules and regulations). Except for fixed route and commercial carrier transport, the CONTRACTOR shall not make separate or additional payment to a NEMT provider for an escort. Covered NEMT services include having an accompanying adult ride with a member if the member is under age eighteen (18). Except for fixed route and commercial carrier transport, the CONTRACTOR shall not make separate or additional payment to a NEMT provider for an adult accompanying a member under age eighteen (18). The CONTRACTOR is not responsible for providing NEMT to HCBS provided through a 1915(c) waiver program for persons with intellectual disabilities and HCBS provided through the CHOICES program. However, as specified in Section A.2.11.1.8 in the event the CONTRACTOR is unable to meet the access
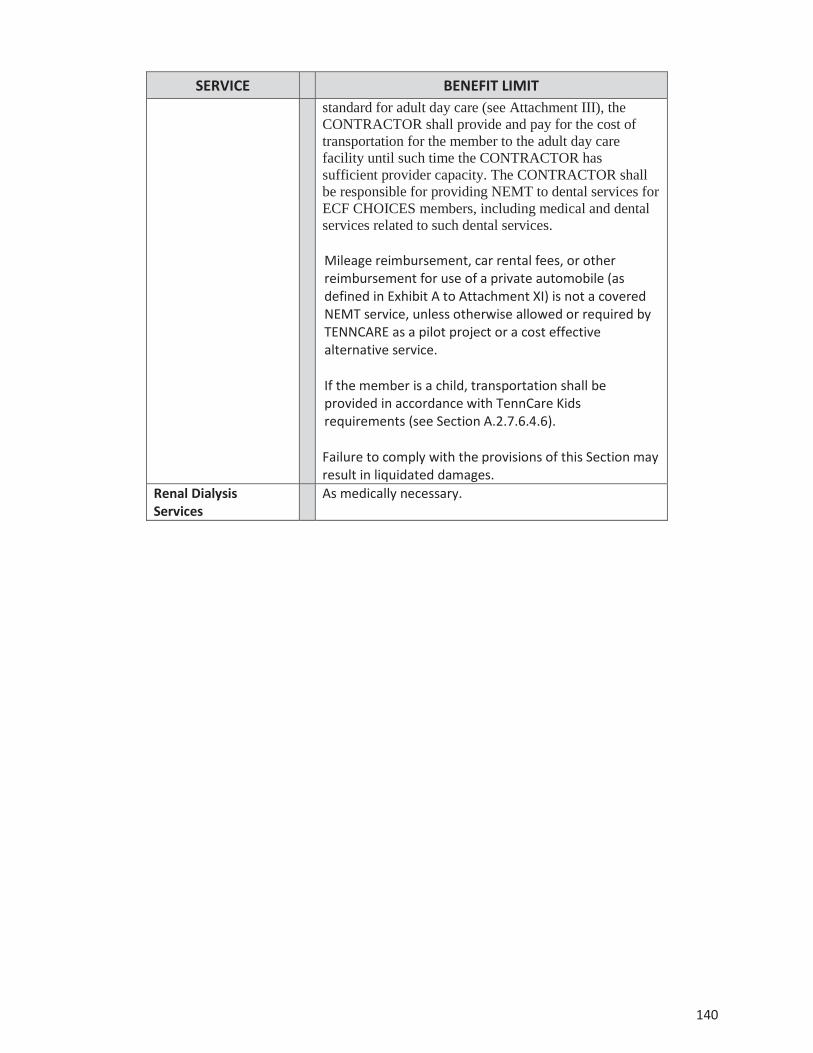
140
SERVICE BENEFIT LIMIT standard for adult day care (see Attachment III), the CONTRACTOR shall provide and pay for the cost of transportation for the member to the adult day care facility until such time the CONTRACTOR has sufficient provider capacity. The CONTRACTOR shall be responsible for providing NEMT to dental services for ECF CHOICES members, including medical and dental services related to such dental services. Mileage reimbursement, car rental fees, or other reimbursement for use of a private automobile (as defined in Exhibit A to Attachment XI) is not a covered NEMT service, unless otherwise allowed or required by TENNCARE as a pilot project or a cost effective alternative service. If the member is a child, transportation shall be provided in accordance with TennCare Kids requirements (see Section A.2.7.6.4.6). Failure to comply with the provisions of this Section may result in liquidated damages.
Renal Dialysis Services
As medically necessary.

141
SERVICE BENEFIT LIMIT Private Duty Nursing
Medicaid/Standard Eligible, Age 21 and older: Covered as medically necessary in accordance with the definition of Private Duty Nursing at Rule 1200-13-13-.01 (for TennCare Medicaid) and Rule 1200-13-14-.01 (for TennCare Standard), when prescribed by an attending physician for treatment and services rendered by a Registered Nurse (R.N.) or a licensed practical nurse (L.P.N.) who is not an immediate relative. Private duty nursing services are limited to services that support the use of ventilator equipment or other life sustaining technology when constant nursing supervision, visual assessment, and monitoring of both equipment and patient are required. Prior authorization required, as described Rule 1200-13-13-.04 (for TennCare Medicaid) and 1200-13-14-.04 (for TennCare Standard). Medicaid/Standard Eligible, Under age 21: Covered as medically necessary in accordance with the definition of Private Duty Nursing at Rule 1200-13-13-.01 (for TennCare Medicaid) and 1200-13-14-.01 (for TennCare Standard) when prescribed by an attending physician for treatment and services rendered by a registered nurse (R.N.) or a licensed practical nurse (L.P.N.), who is not an immediate relative. Prior authorization required as described in Rule 1200-13-13-.04 (for TennCare Medicaid) and 1200-13-14-.04 (for TennCare Standard).
Speech Therapy
Medicaid/Standard Eligible, Age 21 and older: Covered as medically necessary by a Licensed Speech Therapist to restore speech (as long as there is continued medical progress) after a loss or impairment. The loss or impairment must not be caused by a mental, psychoneurotic or personality disorder. Medicaid/Standard Eligible, Under age 21: Covered as medically necessary in accordance with TennCare Kids requirements.
Occupational Therapy
Medicaid/Standard Eligible, Age 21 and older: Covered as medically necessary when provided by a Licensed Occupational Therapist to restore, improve, or stabilize impaired functions. Medicaid/Standard Eligible, Under age 21: Covered as medically necessary in accordance with TennCare Kids requirements.

142
SERVICE BENEFIT LIMIT Physical Therapy
Medicaid/Standard Eligible, Age 21 and older: Covered as medically necessary when provided by a Licensed Physical Therapist to restore, improve, or stabilize impaired functions. Medicaid/Standard Eligible, Under age 21: Covered as medically necessary in accordance with TennCare Kids requirements.
Organ and Tissue Transplant And Donor Organ Procurement
Medicaid/Standard Eligible, Age 21 and older: All medically necessary and non-investigational/experimental organ and tissue transplants, as covered by Medicare, are covered. These include, but may not be limited to: Bone marrow/Stem cell; Cornea; Heart; Heart/Lung; Kidney; Kidney/Pancreas; Liver; Lung; Pancreas; and Small bowel/Multi-visceral. Medicaid/Standard Eligible, Under age 21: Covered as medically necessary in accordance with TennCare Kids requirements. Experimental or investigational transplants are not covered.
Reconstructive Breast Surgery
Covered in accordance with TCA 56-7-2507, which requires coverage of all stages of reconstructive breast surgery on a diseased breast as a result of a mastectomy, as well as surgical procedures on the non-diseased breast to establish symmetry between the two breasts in the manner chosen by the physician. The surgical procedure performed on a non-diseased breast to establish symmetry with the diseased breast shall only be covered if the surgical procedure performed on a non-diseased breast occurs within five (5) years of the date the reconstructive breast surgery was performed on a diseased breast.
Chiropractic Services
Medicaid/Standard Eligible, Age 21 and older: Not covered unless determined by the CONTRACTOR to be a cost effective alternative (see Section A.2.6.5). Medicaid/Standard Eligible, Under age 21: Covered as medically necessary in accordance with TennCare Kids requirements.

143
2.6.1.4 CONTRACTOR Behavioral Health Benefits Chart
SERVICE BENEFIT LIMIT Psychiatric Inpatient Hospital Services (including physician services)
As medically necessary.
24-hour Psychiatric Residential Treatment
Medicaid/Standard Eligible, Age 21 and older: As medically necessary. Medicaid/Standard Eligible, Under age 21: Covered as medically necessary.
Outpatient Mental Health Services (including physician services)
As medically necessary.
Inpatient, Residential & Outpatient Substance Abuse Benefits1
Medicaid/Standard Eligible, Age 21 and older: Covered as medically necessary. Medicaid/Standard Eligible, Under age 21: Covered as medically necessary.
Behavioral Health Intensive Community Based Treatment
As medically necessary.
Psychiatric-Rehabilitation Services
As medically necessary.
Behavioral Health Crisis Services
As necessary.
Lab and X-ray Services As medically necessary.
Non-emergency Medical Transportation (including Non-Emergency Ambulance Transportation)
Same as for physical health (see Section A.2.6.1.3 above).
1When medically appropriate, services in a licensed substance abuse residential treatment facility may be substituted for inpatient substance abuse services. Methadone clinic services are not covered for adults.
2.6.1.4.1 The CMS Managed Care Rules specify that an MCO may cover, in addition to services covered under the state plan, any services necessary for compliance with the requirements for parity in mental health and substance use disorder benefits in 42 CFR part 438, subpart K. In accordance with this requirement, this Contract identifies the types and amount, duration and scope of services consistent with the analysis of parity compliance conducted by TENNCARE.

144
2.6.1.4.1.1 In accordance with 42 CFR 438.905(a), the CONTRACTOR must comply with 42 CFR Subpart K—Parity in Mental Health and Substance Use Disorder Benefits requirements for all enrollees of a MCO in states that cover both medical/surgical benefits and mental health or substance use disorder benefits under the state plan.
2.6.1.4.1.2 TENNCARE does not impose an annual dollar limit on any medical/surgical benefits
or includes an aggregate lifetime or annual dollar limit that applies to medical/surgical benefits provided to enrollees through a contract with the state, therefore, the CONTRACTOR shall not impose an aggregate lifetime or annual dollar limit on mental health or substance use disorder benefits, in accordance with 42 CFR 438.905(b), 42 CFR 438.905(c), and 42 CFR 438.905(e).
2.6.1.4.1.3 In accordance with 42 CFR 438.910(b)(1), the CONTRACTOR shall not apply any
financial requirement or treatment limitation to mental health or substance use disorder benefits in any classification that is more restrictive than the predominant financial requirement or treatment limitation of that type applied to substantially all medical/surgical benefits in the same classification furnished to enrollees (whether or not the benefits are furnished by the same managed care contractor).
2.6.1.4.1.4 In accordance with 42 CFR 438.910(b)(2) and as specified in the benefit charts of
Section A.2.6.1.3 and A.2.6.1.4, if an enrollee is provided mental health or substance use disorder benefits in any classification of benefits (inpatient, outpatient, emergency care, or prescription drugs), mental health or substance use disorder benefits must be provided to the MCO enrollee in every classification in which medical/surgical benefits are provided.
2.6.1.4.1.5 In accordance with 42 CFR 438.910(c)(3), the CONTRATOR shall not apply any
cumulative financial requirements for mental health or substance use disorder benefits in a classification (inpatient, outpatient, emergency care, prescription drugs) that accumulates separately from any established for medical/surgical benefits in the same classification.
2.6.1.5 Long-Term Care Benefits for CHOICES Members
2.6.1.5.1 In addition to physical health benefits (see Section A.2.6.1.3) and behavioral health
benefits (see Section A.2.6.1.4), the CONTRACTOR shall provide long-term care services (including CHOICES HCBS and nursing facility care) as described in this Section A.2.6.1.5 to members who have been enrolled into CHOICES by TENNCARE, as shown in the outbound 834 enrollment file furnished by TENNCARE to the CONTRACTOR.
2.6.1.5.2 TennCare enrollees will be enrolled by TENNCARE into CHOICES if the following
conditions, at a minimum, are met:
2.6.1.5.2.1 TENNCARE or its designee determines the enrollee meets the categorical and financial eligibility criteria for Group 1, 2 or 3;
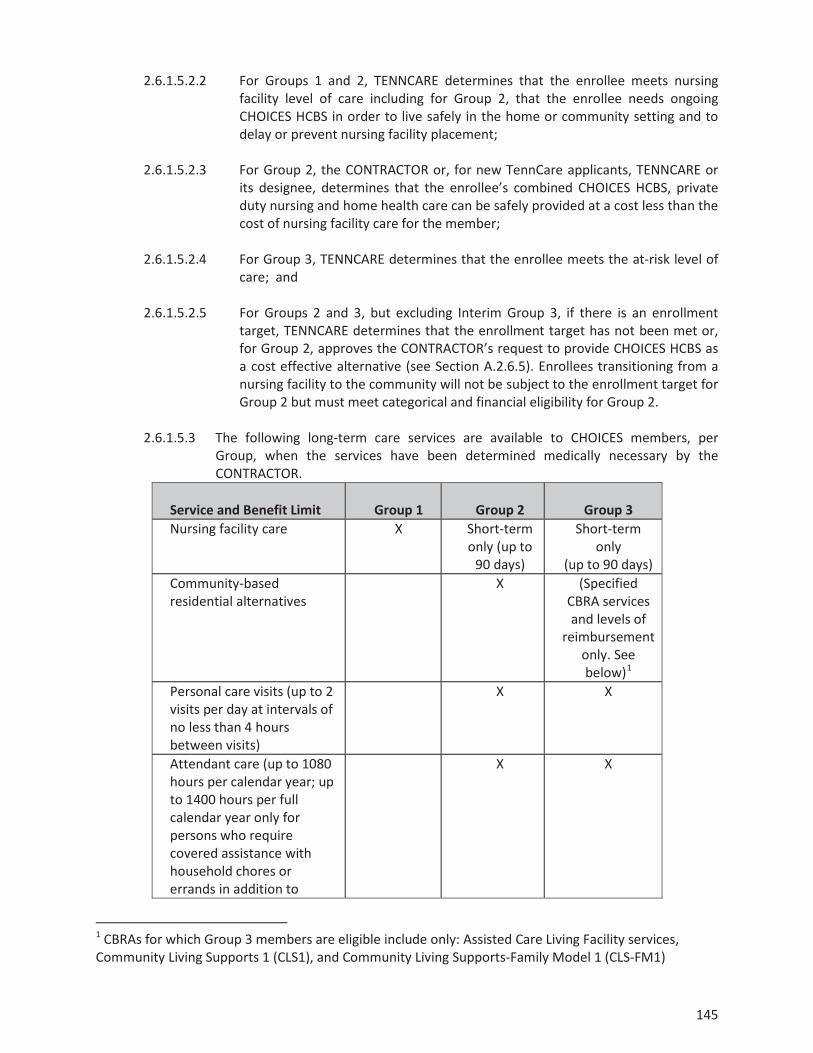
145
2.6.1.5.2.2 For Groups 1 and 2, TENNCARE determines that the enrollee meets nursing facility level of care including for Group 2, that the enrollee needs ongoing CHOICES HCBS in order to live safely in the home or community setting and to delay or prevent nursing facility placement;
2.6.1.5.2.3 For Group 2, the CONTRACTOR or, for new TennCare applicants, TENNCARE or
its designee, determines that the enrollee’s combined CHOICES HCBS, private duty nursing and home health care can be safely provided at a cost less than the cost of nursing facility care for the member;
2.6.1.5.2.4 For Group 3, TENNCARE determines that the enrollee meets the at-risk level of
care; and 2.6.1.5.2.5 For Groups 2 and 3, but excluding Interim Group 3, if there is an enrollment
target, TENNCARE determines that the enrollment target has not been met or, for Group 2, approves the CONTRACTOR’s request to provide CHOICES HCBS as a cost effective alternative (see Section A.2.6.5). Enrollees transitioning from a nursing facility to the community will not be subject to the enrollment target for Group 2 but must meet categorical and financial eligibility for Group 2.
2.6.1.5.3 The following long-term care services are available to CHOICES members, per
Group, when the services have been determined medically necessary by the CONTRACTOR.
Service and Benefit Limit
Group 1
Group 2
Group 3
Nursing facility care X Short-term only (up to
90 days)
Short-term only
(up to 90 days) Community-based residential alternatives
X (Specified CBRA services and levels of
reimbursement only. See below)1
Personal care visits (up to 2 visits per day at intervals of no less than 4 hours between visits)
X X
Attendant care (up to 1080 hours per calendar year; up to 1400 hours per full calendar year only for persons who require covered assistance with household chores or errands in addition to
X X
1 CBRAs for which Group 3 members are eligible include only: Assisted Care Living Facility services, Community Living Supports 1 (CLS1), and Community Living Supports-Family Model 1 (CLS-FM1)

146
Service and Benefit Limit
Group 1
Group 2
Group 3
hands-on assistance with self-care tasks) Home-delivered meals (up to 1 meal per day)
X X
Personal Emergency Response Systems (PERS)
X X
Adult day care (up to 2080 hours per calendar year)
X X
In-home respite care (up to 216 hours per calendar year)
X X
In-patient respite care (up to 9 days per calendar year)
X X
Assistive technology (up to $900 per calendar year)
X X
Minor home modifications (up to $6,000 per project; $10,000 per calendar year; and $20,000 per lifetime)
X X
Pest control (up to 9 units per calendar year)
X X
2.6.1.5.3.1 The CONTRACTOR shall review all requests for short-term NF stays and shall
authorize and/or reimburse short-term NF stays for Group 2 and Group 3 members only when (1) the member is enrolled in CHOICES Group 2 or 3, as applicable, and receiving HCBS upon admission; (2) the member meets the nursing facility level of care in place at the time of admission; (3) the member’s stay in the facility is expected to be less than ninety (90) days; and (4) the member is expected to return to the community upon its conclusion. The CONTRACTOR shall monitor all short-term NF stays for Group 2 and Group 3 members and shall ensure that the member is transitioned from Group 2 or Group 3, as applicable, to Group 1 at any time a) it is determined that the stay will not be short-term or the member will not transition back to the community; and b) prior to exhausting the ninety (90)-day short-term NF benefit covered for CHOICES Group 2 and Group 3 members.
2.6.1.5.3.1.1 The ninety (90) day limit shall be applied on a per admission (and not a per year)
basis. A member may receive more than one short-term stay during the year; however, the visits shall not be consecutive. Further, the CONTRACTOR shall be responsible for carefully reviewing any instance in which a member receives multiple short-term stays during the year or across multiple years, including a review of the circumstances which resulted in each nursing facility admission, and shall evaluate whether the services and supports provided to the member are sufficient to safely meet his needs in the community such that transition back to CHOICES Group 2 or Group 3 (as applicable) is appropriate.
2.6.1.5.3.1.2 The CONTRACTOR shall monitor, on an ongoing basis, members utilizing the
short-term NF benefit, and shall submit to TENNCARE on a monthly basis a

147
member-by-member status for each Group 2 and Group 3 member utilizing the short-term NF stay benefit, including but not limited to the name of each Group 2 and Group 3 member receiving short-term NF services, the NF in which s/he currently resides, the date of admission for short-term stay, the number of days of short-term NF stay utilized for this admission, and the anticipated date of discharge back to the community. For any member exceeding the ninety (90)-day limit on short-term NF stay, the CONTRACTOR shall include explanation regarding why the benefit limit has been exceeded, and specific actions the CONTRACTOR is taking to facilitate discharge to the community or transition to Group 1, as applicable, including the anticipated timeline.
2.6.1.5.3.1.3 In addition to the benefit limits described above, in no case shall the
CONTRACTOR exceed the member’s individual cost neutrality cap (as defined in Section A.1 of this Contract) for CHOICES Group 2 or the expenditure cap for Group 3.
2.6.1.5.3.2 For CHOICES members in Group 2, the services that shall be compared against
the member’s individual cost neutrality cap include the total cost of CHOICES HCBS and Medicaid reimbursed home health care and private duty nursing. The total cost of CHOICES HCBS includes all covered CHOICES HCBS and other non-covered services that the CONTRACTOR elects to offer as a cost effective alternative to nursing facility care pursuant to Section A.2.6.5.2 of this Contract including, as applicable: CHOICES HCBS in excess of specified CHOICES benefit limits, the one-time transition allowance for Group 2 and NEMT for Groups 2 and 3.
2.6.1.5.3.3 For CHOICES members in Group 3, the total cost of CHOICES HCBS, excluding
minor home modifications, shall not exceed the expenditure cap (as defined in Section A.1 of this Contract).

148
2.6.1.5.4 CHOICES members may, pursuant to Section A.2.9.7, choose to participate in consumer direction of eligible CHOICES HCBS and, at a minimum, hire, fire and supervise workers of eligible CHOICES HCBS.
2.6.1.5.5 The CONTRACTOR shall, on an ongoing basis, monitor CHOICES members’ receipt
and utilization of long-term care services and identify CHOICES members who are not receiving long-term care services. Pursuant to Section A.2.30.11.4, the CONTRACTOR shall, on a monthly basis, notify TENNCARE regarding members that have not received long-term care services for a thirty (30) day period of time. The CONTRACTOR shall be responsible for immediately initiating disenrollment of any member who is not receiving TennCare-reimbursed long-term care services and is not expected to resume receiving long-term care services within the next thirty (30) days, except under extenuating circumstances which must be reported to TennCare on the CHOICES Utilization Report. Acceptable circumstances may include, but are not limited to, a member’s temporary hospitalization or temporary receipt of Medicare-reimbursed skilled nursing facility care. Such notification and/or disenrollment shall be based not only on receipt and/or payment of claims for long-term care services, but also upon review and investigation by the CONTRACTOR as needed to determine whether the member has received long-term care services, regardless of whether claims for such services have been submitted or paid.
2.6.1.5.6 The CONTRACTOR may submit to TENNCARE a request to no longer provide long-
term care services to a member due to concerns regarding the ability to safely and effectively care for the member in the community and/or to ensure the member’s health, safety and welfare. Acceptable reasons for this request include but are not limited to the following:
2.6.1.5.6.1 A member in Group 2 for whom the CONTRACTOR has determined that it
cannot safely and effectively meet the member’s needs at a cost that is less than the member’ cost neutrality cap, and the member declines to transition to a nursing facility;
2.6.1.5.6.2 A member in Group 2 or 3 who repeatedly refuses to allow a Care Coordinator
entrance into his/her place of residence (Section A.2.9.6); 2.6.1.5.6.3 A member in Group 2 or 3 who refuses to receive critical HCBS as identified
through a needs assessment and documented in the member’s PCSP; and
2.6.1.5.6.4 A member in Group 1 who fails to pay his/her patient liability and the CONTRACTOR is unable to find a nursing facility willing to provide services to the member (Section A.2.6.7.2).
2.6.1.5.6.5 A member in Group 2 or 3 who refuses to pay his/her patient liability and for
whom the CONTRACTOR is either: 1) in the case of persons receiving CBRA services, unable to identify another provider willing to provide services to the member; or 2) in the case of persons receiving non-residential HCBS or companion care, the CONTRACTOR is unwilling to continue to serve the member, and the Bureau of TennCare has determined that no other MCO is willing to serve the member.

149
2.6.1.5.6.6 The CONTRACTOR’s request to no longer provide long-term care services to a member shall include documentation as specified by TENNCARE. The State shall make any and all determinations regarding whether the CONTRACTOR may discontinue providing long-term care services to a member, disenrollment from CHOICES, and, as applicable, termination from TennCare.
2.6.1.5.6.7 The CONTRACTOR may submit to TENNCARE a request to disenroll from
CHOICES a member who is not receiving any Medicaid-reimbursed LTC services based on the CONTRACTOR’s inability to reach the member only when the CONTRACTOR has exhausted all reasonable efforts to contact the member, and has documented such efforts in writing, which must be submitted with the disenrollment request. Efforts to contact the member shall include, at a minimum:
2.6.1.5.6.8 Multiple attempts to contact the member, his/her representative or designee
(as applicable) by phone. Such attempts must occur over a period of at least two (2) weeks and at different times of the day and evening, including after business hours. The CONTRACTOR shall attempt to contact the member at the phone number provided in the outbound 834 enrollment file, any additional phone numbers the CONTRACTOR has on file, including referral records and case management notes; and phone numbers that may be provided in TENNCARE’s PAE Tracking System. The CONTRACTOR shall also contact the member’s Primary Care Provider and any contracted LTC providers that have delivered services to the member during the previous six (6) months in order to obtain contact information that can be used to reach the member;
2.6.1.5.6.9 At least one (1) visit to the member’s most recently reported place of residence
except in circumstances where significant safety concerns prevent the CONTRACTOR from completing the visit, which shall be documented in writing; and
2.6.1.5.6.10 An attempt to contact the member by mail at the member’s most recently
reported place of residence at least two (2) weeks prior to the request to disenroll.

150
2.6.1.6 Long-Term Services and Supports Benefits for ECF CHOICES Members
2.6.1.6.1 In addition to physical health benefits (see Section A.2.6.1.3) and behavioral health benefits (see Section A.2.6.1.4), the CONTRACTOR shall provide long-term services and supports as described in this Section A.2.6.1.6 to members who have been enrolled into ECF CHOICES by TENNCARE, as shown in the outbound 834 enrollment file furnished by TENNCARE to the CONTRACTOR.
2.6.1.6.2 TennCare enrollees will be enrolled by TENNCARE into ECF CHOICES in accordance with criteria set forth in the approved 1115 waiver and TennCare rule.
2.6.1.6.3 The following long-term services and supports are available to ECF CHOICES
members, per Group and subject to all applicable service definitions, benefit limits, and Expenditure Caps, when the services have been determined medically necessary by the CONTRACTOR.
Benefit
Group 4 Group 5 Group 6
Respite (up to 30 days per calendar year or up to 216 hours per calendar year only for persons living with unpaid family caregivers)
X X X
Supportive home care (SHC) X Family caregiver stipend in lieu of SHC (up to $500 per month for children under age 18; up to $1,000 per month for adults age 18 and older)
X
Community integration support services (subject to limitations specified in the approved 1115 waiver and TennCare Rule)
X X X
Community transportation X X X Independent living skills training (subject to limitations specified in the approved 1115 waiver and TennCare Rule)
X X X
Assistive technology, adaptive equipment and supplies (up to $5,000 per calendar year)
X X X
Minor home modifications (up to $6,000 per project; $10,000 per calendar year; and $20,000 per lifetime)
X X X
Community support development, organization and navigation
X
Family caregiver education and training (up to $500 per calendar year)
X
Family-to-family support X Conservatorship and alternatives to conservatorship counseling and assistance (up to $500 per lifetime)
X X X
Health insurance counseling/forms assistance (up to 15 hours per calendar
X

151
Benefit
Group 4 Group 5 Group 6
year) Personal assistance (up to 215 hours per month)
X X
Community living supports (CLS) X X Community living supports—family model (CLS-FM)
X X
Individual education and training (up to $500 per calendar year)
X X
Peer-to-Peer Support and Navigation for Person-Centered Planning, Self-Direction, Integrated Employment/Self-Employment and Independent Community Living (up to $1,500 per lifetime)
X X
Specialized consultation and training (up to $5,000 per calendar year2)
X X
Adult dental services (up to $5,000 per calendar year; up to $7,500 across three consecutive calendar years)
X3 X X
Employment services/supports as specified below (subject to limitations specified in the approved 1115 waiver and in TennCare Rule)
X X X
Supported employment—individual employment support Exploration Benefits counseling Discovery Situational observation and assessment Job development plan or self-employment plan Job development or self-employment start up Job coaching for individualized, integrated employment or self-employment Co-worker supports Career advancement
X X X
2 For adults in the Group 6 benefit group determined to have exceptional medical and/or behavioral support needs, specialized consultation services are limited to $10,000 per person per calendar year.3 Limited to adults age 21 and older.
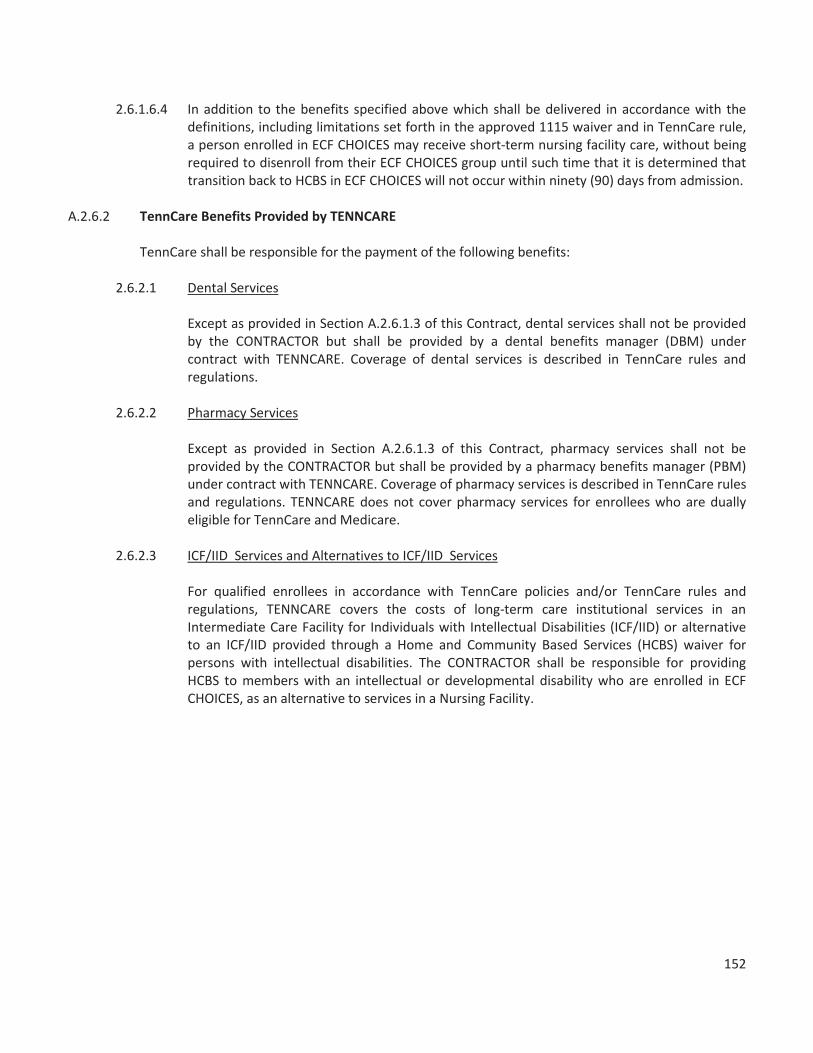
152
2.6.1.6.4 In addition to the benefits specified above which shall be delivered in accordance with the
definitions, including limitations set forth in the approved 1115 waiver and in TennCare rule, a person enrolled in ECF CHOICES may receive short-term nursing facility care, without being required to disenroll from their ECF CHOICES group until such time that it is determined that transition back to HCBS in ECF CHOICES will not occur within ninety (90) days from admission.
A.2.6.2 TennCare Benefits Provided by TENNCARE TennCare shall be responsible for the payment of the following benefits:
2.6.2.1 Dental Services
Except as provided in Section A.2.6.1.3 of this Contract, dental services shall not be provided by the CONTRACTOR but shall be provided by a dental benefits manager (DBM) under contract with TENNCARE. Coverage of dental services is described in TennCare rules and regulations.
2.6.2.2 Pharmacy Services
Except as provided in Section A.2.6.1.3 of this Contract, pharmacy services shall not be provided by the CONTRACTOR but shall be provided by a pharmacy benefits manager (PBM) under contract with TENNCARE. Coverage of pharmacy services is described in TennCare rules and regulations. TENNCARE does not cover pharmacy services for enrollees who are dually eligible for TennCare and Medicare.
2.6.2.3 ICF/IID Services and Alternatives to ICF/IID Services
For qualified enrollees in accordance with TennCare policies and/or TennCare rules and regulations, TENNCARE covers the costs of long-term care institutional services in an Intermediate Care Facility for Individuals with Intellectual Disabilities (ICF/IID) or alternative to an ICF/IID provided through a Home and Community Based Services (HCBS) waiver for persons with intellectual disabilities. The CONTRACTOR shall be responsible for providing HCBS to members with an intellectual or developmental disability who are enrolled in ECF CHOICES, as an alternative to services in a Nursing Facility.

153
Attachment V: Bridging Life & Health Gaps – Connections for Improving & Empowering Health in Tennessee

154

155

156

157

158

159

160

161

162

163

164

165

166

167

168

169
Attachment VI: Public Comments On October 12, the Draft 2017 Quality Assessment and Quality Improvement Strategy was posted on the TennCare Website for Review. The deadline for submission of comments was close of business on November 9. After posting notices were sent by TennCare to the following groups and/or individuals and all three TennCare contracted health plans. The notice included the link for the Quality Strategy as well as the deadline for submission.