Tenderness of Beef Round Roasted at Two Oven Temperatures ...
56
University of Tennessee, Knoxville University of Tennessee, Knoxville TRACE: Tennessee Research and Creative TRACE: Tennessee Research and Creative Exchange Exchange Masters Theses Graduate School 8-1965 Tenderness of Beef Round Roasted at Two Oven Temperatures in Tenderness of Beef Round Roasted at Two Oven Temperatures in Relation to Cooking Losses, Cooking Time, Power Consumption, Relation to Cooking Losses, Cooking Time, Power Consumption, and Other Sensory Properties and Other Sensory Properties Robin Dalrymple Simmers University of Tennessee, Knoxville Follow this and additional works at: https://trace.tennessee.edu/utk_gradthes Part of the Food Science Commons Recommended Citation Recommended Citation Simmers, Robin Dalrymple, "Tenderness of Beef Round Roasted at Two Oven Temperatures in Relation to Cooking Losses, Cooking Time, Power Consumption, and Other Sensory Properties. " Master's Thesis, University of Tennessee, 1965. https://trace.tennessee.edu/utk_gradthes/4101 This Thesis is brought to you for free and open access by the Graduate School at TRACE: Tennessee Research and Creative Exchange. It has been accepted for inclusion in Masters Theses by an authorized administrator of TRACE: Tennessee Research and Creative Exchange. For more information, please contact [email protected].
Transcript of Tenderness of Beef Round Roasted at Two Oven Temperatures ...
University of Tennessee, Knoxville University of Tennessee, Knoxville
TRACE: Tennessee Research and Creative TRACE: Tennessee Research and Creative
Exchange Exchange
Masters Theses Graduate School
8-1965
Tenderness of Beef Round Roasted at Two Oven Temperatures in Tenderness of Beef Round Roasted at Two Oven Temperatures in
Relation to Cooking Losses, Cooking Time, Power Consumption, Relation to Cooking Losses, Cooking Time, Power Consumption,
and Other Sensory Properties and Other Sensory Properties
Robin Dalrymple Simmers University of Tennessee, Knoxville
Follow this and additional works at: https://trace.tennessee.edu/utk_gradthes
Part of the Food Science Commons
Recommended Citation Recommended Citation Simmers, Robin Dalrymple, "Tenderness of Beef Round Roasted at Two Oven Temperatures in Relation to Cooking Losses, Cooking Time, Power Consumption, and Other Sensory Properties. " Master's Thesis, University of Tennessee, 1965. https://trace.tennessee.edu/utk_gradthes/4101
This Thesis is brought to you for free and open access by the Graduate School at TRACE: Tennessee Research and Creative Exchange. It has been accepted for inclusion in Masters Theses by an authorized administrator of TRACE: Tennessee Research and Creative Exchange. For more information, please contact [email protected].
To the Graduate Council:
I am submitting herewith a thesis written by Robin Dalrymple Simmers entitled "Tenderness of
Beef Round Roasted at Two Oven Temperatures in Relation to Cooking Losses, Cooking Time,
Power Consumption, and Other Sensory Properties." I have examined the final electronic copy of
this thesis for form and content and recommend that it be accepted in partial fulfillment of the
requirements for the degree of Master of Science, with a major in Food Science and Technology.
Bernadine Meyer, Major Professor
We have read this thesis and recommend its acceptance:
Ada Marie Campbell, Mary Rose Gram
Accepted for the Council:
Carolyn R. Hodges
Vice Provost and Dean of the Graduate School
(Original signatures are on file with official student records.)
August 6, 1965
\ �>,., To the Graduate Council:
I am submitting herewith a thesis written by Robin Dalrymple Simmers entitled "Tenderness of Beef Round Roasted at Two Oven Temperatures in Relation to Cooking Losses, Cooking Time, Power Consumption, and Other Sensory Properties." I recommend tn.at it be accepted for nine quarter hours of credit in partial fulfillment of th� requirements for the degree of Master of Science, with a major in Foods.
We have read this thesis and recommend its acceptance:
tY4c� 4y14.(_
L1;/ZJ�
Accepted for the Council:
Dean of the Graduate School
TENDERNESS OF BEEF ROUND ROASTED AT TWO OVEN TEMPERATURES
IN RELATION TO COOKING LOSSES, CX>OKING TIME, POWER
CONSUMPrION, AND OTHER SENSORY PROPERTIES
A Thesis
Presented to
the Graduate Council of
The University .of Tennessee
In Partial Fulfillment
of the Requirements for the Degree
Master of Science
by
Robin Dalrymple Simmers
August 1965
ACKNOWLEDGMENT
It is with sincere gratitude that the author acknowledges-the
patient guidance and encouragement given by Dr. Bernadine Meyer
throughout the planning, conducting, and reporting of this study.
Appreciation is also extended to Dr. Ada Marie Campbell and Dr. Mary
Rose Gram for their understanding advice and suggestions.
The author wishes to thank Mrs. Mary Nelle Connelly·for· her
invaluable assistance in the laboratory and for checking data; the
members of the evaluation panel for their cooperation; and Protessor
J. W. Cole and Dr. C. B. Ramsey, Department of Ani�al Husbandry and
Veterinary Science, for their help in procuring the roasts.
The author is especially grateful to the American Home Economics
Association for awarding her the Sybil L .. Smith International scholar
ship for 1964-65 and also the College of Home· Economi�s, University of
Tennessee which granted a special Graduate s�holarship. These awards
helped greatly to make the student's year of graduate study possible,..
R. D. S.
ii
TABLE OF CONTENTS
TABLE
I. INTRODUGrION . . . . . .
II. REVIEW OF LITERATURE ON SOME FACTORS RELATED
TO TENDERNESS OF BEEF
Nature of Muscle Tissue
Muscle fibers
Connective tissue
Age, Sex, and Grade of the Animal
Relation of fat to grade and tenderness •
Feed
Post Mortem Aging
Changes in meat with aging
Mechanisms of changes during post-mortem 'aging
Freezing
Effect of Heat on Meat Proteins . . . .
Effect of Cooking Method on Tenderness
Effect of Oven Temperature on the Tenderness
of Beef
II I. PROCEDURE
Design of the Study
Cooking Methods
Cooking Losses, Cooking Time, and Power
Consumption • • • • .
iii
# • • •
PAGE
1
3
3
4
4
5
7
7
8
8
10
1l
11
12
15
18
18
20
21
TABLE
Sensory Evaluations
Shear Tests
Analysis of Data .
. . . . . . .
IV. RESULTS AND DISCUSSION .
Effect of Two Oven Temperatures on Cooking Losses
Evaporation loss
Drippings loss
Total cooking loss
Effect of Two Oven Temperatures on Cooking
Time, Heat Penetration, and Power Con
sumption
Cooking time
Heat penetration
Power consumption
Effect of Two Oven Temperatures on Flavor
and Juiciness of Top-Round Roasts .
Flavor
Juiciness
Effect of Two Oven Temperatures on Tenderness
Panel scores·
Number o'f chews
Shear·.values
·comparison of results for tenderness
iv
PAGE
22
23
23
24
24
24
24
26
27
27
27
30
30
32
32
32
32
34
34
34
TABLE
Other considerations
V. SUMMARY • •
Scope of the Study • .
Principal Findings •
BIBLIOGRAPHY
APPENDIX
V
PAGE
36
38
38
38
40
44
LIST OF TABLES
TABLE
I. Summary of Cooking Plan
II. Percentage Cooking Losses of Top Round of
Beef Roasted at Two Oven Temperatures .
III. Time Required and Power Consumption to
Roast Top Round of Beef at Two Oven
Temperatures
IV. Panel Scores for Flavor and Juicines·s of
Top Round of Beef Roasted at Two Oven
Temperatures . . . . . . .
v. Comparison of Three Estimates of Tenderness
of Top Round of Beef Roasted at Two Oven
Temperatures . . . . . . . . . . . .
vi
. . . . . . .
. . . .
. . .
PAGE
19
28
31
33
CHAPTER I
INTRODUCTION
The relation of temperature and len:gth of cooking time to the
tenderness of meat has had limited investiga.tion for many years. As
a result of these investigations some evidence has accumulated that
low oven temperatures are advantageous. Cover (1943) was among t�e
first to point out the possible role of slow heat penetration in the
production of tender roast beef. More recently Bramblett et !.!.· (1959)
used less tender cuts of beef and found that the meat roasted at 145° F.
was more tender than that cooked at 155° F., and that at the lower tem
perature'cooking losses were reduced. In a further study the same
group (Bramblett and Vail, 1964) found that roasts cooked at 155° F.
were more tender and had better flavor than those cooked at 200° F.,
but the cooking losses were greater and the meat was less juicy. One
theory that has been proposed to explain the increased tenderness of
roasts cooked at very low oven temperatures is the increased interval
of time during which the roast is held .in the temp�rature range most
favoring the conversion of collagen to gelatin. There is a need to
study further the effect of·Iow oven temperatures on the quality of
beef roasts, and some of the practical aspects of cooking time and
power consumption.
The present study was designed to compare the tenderness and
quality of adjacent top-round roasts cooked at 300° F. and 200° F .. oven
1
2
temperatures. The higher oven temperature is the one usually recom
mended for roasting beef.
The meat was obtained from seven heifers and one steer, of
which five were graded U. S. Good, and three U. s. Choice. Two ad
jacent top-round roasts cut two-and-one-half inches thick were taken
from each animal. The more anterior one was labeled A, and the ad
jacent one B. The roasts weighed an average of 2.46 pounds before
cooking. The plan assigned cuts A and B from each animal alternately
to the higher and low�r 'oven temperature� so that any differences as
sociated with tocation would be distriputed between the two .tempera
tures. The plan had been to test roasts from nine animals and cook
three roasts on each of six days, two at one of the oven temperatures.
The plan was changed slightly as explain�d in Chapter III.
The data obtained included: percentage cooking losses; rate of
heat penetration; power consumption; shear values as an objective meas
urement of tenderness; and sensory evaluations of tenderness, juiciness,
and flavor.
It was hoped that these data would givei further evidence of the
relationship of temperature of cooking to tenderness of roasted top
round of beef and give· increased insight into the practical and eco�
nomical aspects of low temperature co6kerr.
CHAPTER II
REVIEW OF LITERATURE ON SOME FACTORS
RELATED TO TENDERNESS OF BEEF
Of the many factors affe�ting the acc�ptability of meat, tender
ness is possibly that most often and most readily judged by the con
sumer as the important criterion of quality. It is also a factor which
can be determined in the laboratory by both subjective and mechanical
tests, and in many cases the results of these tests are significantly
correlated with each other. Th� elements causing differences in the
tenderness of cooked meat, and- in the various cuts of raw meat are I
less clearly defined. Other factors such as flavor and juiciness also
contribute to the overall acceptability of a piece _o� meat, and may af
fect the subjec.tive sc-oring of tenderness. The tenderness inherent in
any cut of meat is. influenced by many £:.actors. The effect of some of
these on the natl,J.ral components of the voluntary cross-striated mus
cles known to the consumer as "meat" will be considered in this review.
I. NATURE OF MUSCLE TISSUE
Striated muscles are made up of primary muscle-fiber bundles held
together by connec.tive tissue. Several primary muscle bundles are
bound together by connective tissue to form secondary bundles, and
these in turn are bound together to form a tertiary bundle. This
3
4
is continued until a· large muscle is formed. Each muscle bli',ndle com
prises a very large number of parallel independent muscle fibers held
together by interstitial connective tissue or endomysium. lhis end�
mysium is a thin layer of collagenous tissue, which may or may not con
tain e.las-tic fibe·rs (Hiner et al •. , 1953).
Muscle fibers. The contractile matter of muscle tissue is com
posed of two proteins, actin and myosin, which combine to form a soft
elastic gel, actomyosin. The mechanism of contraction is not fully
understood, but seems to involve the in:teraction of actomyosin and the
nucleotide adenosine .triphosphate (Szent-Gy6rgyi, _1953).
Ramsbottom, Strandine, an� Koonz (1945) made a stu�y of twenty
five muscles from· three heifer carcasses and co�cluded that the texture.
of different muscles varied greatly and was determined by the size of
the muscle-fiber bundles and the amount of connective tissue surround-
ing them. They found that small bundles and fine texture were indica
tions of greater tenderness.
Hiner � !!_. (1953) found a curvilinear rela.tionship between
fiber diameter' of beef muscl�s and te·nderness, and a decrease in ten
de,rness as the ,animal became older. The greatest change with age oc1-
curred between eight and fourteen months. As the fiber diamete�. in
creased, so did .the resistance to shear, indicating a decreased tender-
ness.
Connective tissue. It'or many years .the amount and kind;\ of col\-. ' 1
nective tissue has been considered a most important factor affecting
5
the tenderness of meat. Connective tissue (Griswold, 1962) contains
two fibrous proteins, collagen and elastin, embedded in an amorphous
material called ground substance. Collagen is the principle constitu
ent of tendons, which attach muscle to bone, while elastin is more
important in ligaments. Ramsbottom, Strandine, and Koo��(l945)
showed that the collagen and elastin content of various muscles was
different, and that as the content of these increased, so did the
shear values, indicating reduced tenderness. Husaini et al. (1950)
found that tenderness of muscle tissue decreased with an increase in
the amount of connective tissue.
It is generally accepted that muscles which are used more are
inclined to be less tender. Hiner, Anderson, and Fellers (1955)
showed that the elastic fibers in most-used muscles were more numer
ous and larger than those in muscl�s not used so extensively. They
also found an increase in collagenous fibers in the most-used muscles.
By histological means, they demonstrated that in muscles which were
used less strenuously, fatty deposits were evident, and the collagenous
fibers formed a loose network between the muscle bundles. In those
muscles exercised frequently there was less fat, and the collagen fi
bers appeared to be bunched.
II. AGE, SEX, AND GRADE OF THE ANIMAL
Although the tenderness of meat may be influenced very appreci�
ably by the method of cooking, there are factors involved before the
6
meat even reaches the market. These may include: age, sex, and grade
of the animal; feed; and post-mortem aging.
In 1950 Husaini and co-workers tested short-loin roasts from
twenty carcasses of widely varying age, grade, and sex. Conditions
of aging of the loins were careful�y controlled, and the samples of
meat were ground for the purposes of chemical determinations. They
found a signific�nt correlation between carcass grade and tenderness, . .
and between tenderness and alkali�insoluble protein which was used as
an index to the connective tissue content of the tissues.
Hiner and Hankins (1951) tested steaks from nine muscles, rep
resenting the principle beef cuts, of fifty-two animals of varying age
and sex, including nine-week-old veal, five-hundr�d-pound steer calves,
nine-hundred-pound steers, three-year-old barren heifers, and five-year
old cows. The muscles were al� aged under controlled conditions. In
the younger animals there were only.slight di�ferences in tenderness
of different muscles. There was a marked decrease in tenderness of
all the muscles, and a greater difference in tenderness between mus
cles with increasing age of the animal. Hiner, Anderson, and Fellers
( 1955) took samples from the same animals and, .bY: fixing and staining
sections of the muscles, examined them histologically with regard to
collagen and elastin. It was found that the samples with high resist
ance to shearing had an abundance of elastic fibers, and in the less
tender cuts the elastic fibers tended to be bunched into definite areas.
7
The size of elastic fibers increased noticeably with age. It was also
found that colla-genous fibers increased in size with increasing maturity .
Relation of!!!.! to grade� tenderness. One of the factors con
s�dered in the grading of beef carcasses is the degree of marbling or
intramuscular fat, although the predictive value of this measure is
being questioned at present. Cover, Butler, and Cartwright (1956)
were a�ong the first to cast doubt on the importance of marbling as
related to tenderness. They measured the fatness of steers by ma_rb
ling, physical separation, and ether extract. These factors were cor
related with each other and with the palatability of cooked loin and
bottom-round steaks. They reported a low �orrelation between_ fat as
determined by ether extract and by marbling or separation, which �ould
be explained by the fact that ether will extract small deposits not
readily visible. It was also found that tenderness was correlated
with marbling and ether-extracted fat in the bottom-round steaks but
not in the loin. The ether extract of the ribeye muscle was the only
measurement of fatness showing close correlation with tenderness of
both cuts.
III. FEED
In an attempt to determine the feeding practices that would
produce beef of the highest grade, Wanderstock and Miller (1948) used
five different feeding regimens, varying from·pasture only to full
8
grain-feeding in dry lot. There were only small differences in ten
derness of the meat but the animals fed only on pasture tended to be
slightly inferior.
Hershberger��· (1951) studied the gain in weight of ani
mals on different rations and related this to tenderness. All ani
mals were full-fed on the basic ration which was supplemented with
soya-bean meal for one group and with alfalfa-leaf meal for the other.
The protein content of the supplements was equal. The steers having
the alfalfa supplement gained weight more rapidly, and produced as
much or more edible meat than the group receiving soya-bean meal.
The faster-gaining animals produced l�ss-te�der carcasses, but this
was not sufficient to interfere with market value.
Meyer !!_ !.!_. (1960) indicated t�t roas·ts from ,grain-f i�ished
be.ef were more tender than those from grass-finished animals of the
same breed, sex, and age. Roasts were taken from the longissimus
dorsi (loin) muscle and cooked by dry heat, and from .the semimem
branosus (round) muscle for cooking by moist neat. Greater differ
ences in tenderness wer� obser�ed between loin roasts from the grain
and grass-finished animals than between the round roasts from steers
on the two dietary regimens.
IV. POST MORTEM AGING
Changes in-� with aging. After the death of the animal,
glycogen is converted to sug�rs, and finally, by anaerobic oxidation,
9
to lactic acid o The associated lowering of the pH is often accompanied
by an increase in tenderness over a period of several days.
Deatherage and Harsham ( 1947) reported an increased tenderness
during aging, with a maximum at seventeen days, and no further improve
ment up to twenty-four days, after which there was a slight decrease in
tenderness . In a study of tne histological changes taking place, Rams
.bottom and Strandine (1949) revealed that in the pre-rigor state muscle
fibers were slightly wavy. 8:igor mortis was identified by the formation
of hard lumps which eventually involved the whole muscle . The fibers
themselves were arranged in sharp�y-defined waves, beginning from eight
to twenty-four hours after slaughter, and lasting for. twenty-four to
seventy-two hours. By the end of the eighth to the twelfth day there
was a progressive breakdown of muscle fibers by enzymatic act:ion or
autolysis. The fibers broke in both transverse and longit\1dinal di
rections . These changes were ass9ciated with meat that was very tender
for two days after slaughter, and then decreased in tenderness for two
to six days, after which it again became more .tender, reaching a maximum
in twelve days.
In 1960 Meyer et al. showed that ripening caused a significant
improvement· in the tenderness of both grain- and grass-finished beef
roasts, and that most of the increase in tenderness occurred in the
first twenty-one days of ripening . �here was relatively more improve
ment in the tenderness of the grass-finished beef.
10
Mechanisms of changes during post-mortem aging. In 1954
Wierbicki et al. proposed that. the increased tenderness on aging was
related to either: a) a dissociation of actomyosin; or, b) redistri
bution of ions within the muscle and as a result, increase in hydra
tion of the protein. Myosin, actin, and actomyosin account for about
half of the muscle plasma proteins. As plasma goes through a series
of changes after death, and there did not appear to be a change in
the alkali-insoluble protein, much interest was felt in the possi�:
bility that muscle plasma changes were involved in the increased ten
derness of the post-mortem muscle. In 1956, however, the same _group
of workers (Wierbicki et al. ) found that the dissociation of actom�o
sin was not responsible for tendering, although the actomyosin formed
in the early rigor was held responsible for the initi�l toughening of
the muscle. Then it was suggested that the second t_heory of the effect
of redistribution of ions within the muscle was more reliable, and
this was studied and reported by Arnold, Wierbicki, and Deatherage
(1956). They found that during the period after slaughter there w�s
a continual release of sodium and calcium ions from the �uscle pro
tein, and during the first twenty-four hours magnesium ions were re
leased and potassium ions absorbed. The total movement of these
cations caused an increase in the hydration of the muscle proteins,
which resulted in increased tenderness. Calcium is one of the ions
causing dehydration of the protein so its release would have a bene
ficial effect on hydration. The authors concluded that it was not the
11
amounts of each cation that affected tenderness, but their combined
effect and movement.
Freezing . There are some indications that freezing may cause
tendering of beef but the literature is conflicting and will not be
reviewed here.
V. EFFEGr, OF HEAT ON MEAT PROTEINS
Hamm and Deatherage (1960) concurred that the hydration of
muscle protein is very closely associated with the tenderness of
meat, and that heating results in the release of juice in amounts
proportional to the temperature. lt is possible that this dehydration
may influence denaturation which o.cpurs on heating of meat. These
workers found that mild denaturation began between 30° C. and 40° C.
(86° F. and 104° F.), with an unfolding of protein chains and the
formation of new calt and/or hydrogen bonds. Strong denaturation
began at 40° C . (104° F.) and resulted in the formation of new stable
cross linkages. At 65° C. (149° F .) the denaturation which had caused
a tighter network of protein structure was almost complete . There was
a sharp decrease in hydration. between 45° C. and 65° C. (113° F. and 149 ° F.)
indicating a decrease in availabl� polar groups which would bind water.
These groups were rendered unavailable.by the formation of new stable
cross linkages.
· Direct evidence of Wang � al.· (1956) indicated that cooking
may toughen muscle fibers and Griswold (1962) proposed that if a
12
muscle tends to toughen on cooking it is the muscle fiber which is
responsible, as heating causes �ollagen to be converted to gelatin
by hydrolysis, and results in an increase in the tenderness of cooked
meat.
Cover and Hostetler (1960) suggested that there is a need to
compromise between the necessity for a high temperature to increase
collagen-conversion, and a low temperature to avoid toughening of
the muscle proteins. The temperatures critical for these reactions
are therefore important.
Machlik and Draudt (1963) heated cylinders of beef muscle in
test tubes at 1° C. intervals in a temperature-controlled water bath.
They found that hardening of the muscle was accomplished between 66° C.
and 7s0 c (151° F. and 167 ° F. ). They also determined that conversion of
collagen began at 55-56° C. (131-133° F.). Cover (1943), Ritchey, Cover,
and Hostetler (1963), and Winegarden et:!.· (1952) have reported that
the temperature at which hydrolysis of collagen begins is 58° C. , 61° C. ,
and 60-65° C. (136° F. , 142° F. , �nd 140-149° F. ), respectively. From
these data it would seem that this important reaction begins in the
range of 55-65° C. (131-149° F.).
VI. EFFECT OF COOKING METHOD ON TENDERNESS
In recent years, the classical �ethod of cooking less tender
cuts of beef by braising has been questioned and. investigated. Cover
and Hostetler (1960) state that the use of moist heat results in a
13
much higher internal temperature of the meat, and that the internal
temperature rises more quickly with moist-heat than with dry-heat
cooking, as the heat is not lost to. t�e air by evaporation. They
felt that this increase in temperature, while causing greater con
version of collagen to gelatin, may also result in an excessive
toughening of the muscle fibers, and suggested that the time during
which the meat was held in the temperat_ure range most favoring c�l la
gen conversion was the most important factor relating to tenderness
of braised round roasts.
Griswold (1955) compared b�aising, roasting, and pressure
braising of top- and bottom-round r.oasts. An internal temperature of
85° C. (185° F.) was taken as the end-poiqt of cooking for all methods.
It was found that meat roasted at 250° F. required the longest time
to cook and resulted in the lowest shear values.
Cover, Bannister, and Kehlenbrink (1957) trained a panel of
judges to differentiate between muscle fiber and connective tissue in
scoring tenderness, and separate scores for each component were re
corded. Steaks from loin and bottom ... round cuts were broiled and
braised to the rare and well-done, stages. Retention of collagen ni
trogen was considered· in relation to results of palatability and
tenderness tests. They found that the· loin was most tender when
br9iled to the rare stage, and the round when braised to the well
done stage. Collagen content decreased with a longer braising time.
In each muscle the highest score for tenderness of the connective
14
tissue was found when the meat was braised to the well-done stage,
but only in the case of the bottom round was this increase in the
tenderness of the connective tissue accompanied by a maximum score
for overall tenderness. The two different muscles showed d issimilar
responses to an increase in end-point temperature and to the method
of cooking. Whereas in the loin, the muscle. fi�er seemed to take
precedence in the final judgment of overall tenderness, the tender
ness of the bottom-round steaks was influenced by both connective
tissue and muscle f iber.
Working w ith be>ttom-round steaks, Dawson and co-workers ( 1959)
found that tenderness scores were in favor of the dry-heat method ·of
cooking. These authors used temperatures representing different stages
of doneness as the end-point of cook ing for all methods, while Gris
wold (1955) used the same end-point temperatures for the three dif
ferent methods of cooking.
On the theory (Cover and Hostetler, 1960) that connective t is
sue is the principal cause of natural toughness, R itchey, Cover, and
Hostetler (1963) analysed the coliagen content of raw and cooked steaks
·from the longissimus dors i (loin) muscle, and from the biceps femor is
(bottom-round) . The steaks were broiled to 61° C. (142° F.) and 80° C.
(176° F. ). The raw loin was found to have less collagen than the round;•
and after the conversion of collagen to gelatin dur ing cooking, the
residual collagen in the tissues was the principal factor in determin
ing tenderness. The rate of disappearance of collagen was similar in
15
both tissues and increased with an increase in temperature. but as
the temperature was raised the d�fference in tenderness of the two
muscles was reduced. The authors concluded that this may have been
due to a difficulty to detect the tenderness of the loin, or that the
panel was scoring for total tenderness which includes other factors
in addition to collagen.
VII. EFFECT OF OVEN TEMPERATURE ON
THE TENDERNESS OF BEEF
The generally-accepted oven temperature for roasting beef is
300° F. Some of the earliest work relating cooking time to tenderness
of meat was reported by Cover (1937), who roasted both chuck and rump
roasts at oven temperatures of 257° F. and 437° F. Tenderness scores
were in favor of the lower temperature for 93 per cent of the rump
roasts and 97 per cent of the chuck roasts. Cover suggested that
tenderness might be more dependent on cooking time than on oven tem
perature, and showed that the internal temperature of the meat rose
rapidly at first and then more slowly. Further work by Cover (1943)
showed that if two roasts were cooked at 2.57° F. and 176 ° F. the higher
oven temperature produced a roast that was juicier but less tender.
The roast cooked at 176° F. was more tender and although it took five
times longer to cook, the cooking losses were only slightly greater.
Cover attributed the increased tenderness of the latter roast to a
slow rate of heat penetrat_ion, and a release of the water of hydration
that was slow enough to convert collagen to gelatin.
16
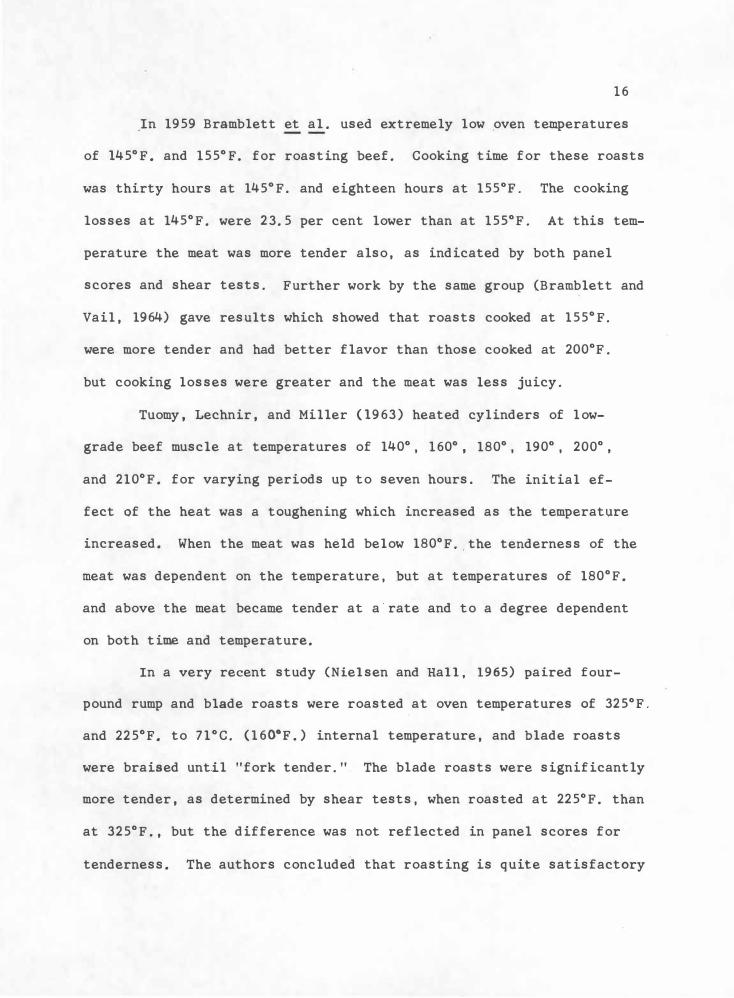
.In 1959 Bramblett et al . used extremely low _oven temperatures
of 145° F. and 155° F. for roasting beef . Cooking time for these roasts
was thirty hours at 145° F. and eighteen hours at 155° F. The cooking
losses at 145° F . were 2 3 . 5 per cent lower than at 155° F. At this tem
perature the meat was more tender also, as indicated by both panel
scores and shear tests. Further work by the same group (Bramblett and
Vail, 1964) gave results which showed that roasts cooked at 155° F.
were more tender and had better flavor than those cooked at 200°F.
but cooking losses were greater and the meat was less juicy.
Tuomy, Lechnir, and Miller (1963) heated cylinders of low
grade beef muscle at temperatures of 140° , 160° , 180° , 190° , 200° ,
and 210° F. for varying periods up to seven hours. The initial ef
fect of the heat was a toughening which increased as the temperature
increased. When the meat was held below 180° F . . the tenderness of the
meat was dependent on the temperature, but at temperatures of 180° F.
and above the meat became tender at a·rate and to a degree dependent
on both time and temperature.
In a very recent study (Nielsen and Hall, 1965) paired four
pound rump and blade roasts were roasted at oven temperatures of 325° F.
and 225° F. to 71 ° C. (160° F . ) internal temperature, and blade roasts
were braised until "fork tender." The blade roasts were significantly
more tender, as determined by shear tests, when roasted at 225° F. than
at 325° F . , but the difference was not reflected in panel scores for
tenderness. The authors concluded that roasting is quite satisfactory
17
for choice blade roasts, and the use of an oven temperature of 225 ° F.
will produce meat that is more tender than a roast cooked at 3 25 ° F.,
and equally as tender as a braised .blade roast. Choice-grade rump
roasts cooked at 225° F. were not found to be superior in any way to
their pair-mates roasted at 325° F.
CHAPTER III
PROCEDURE
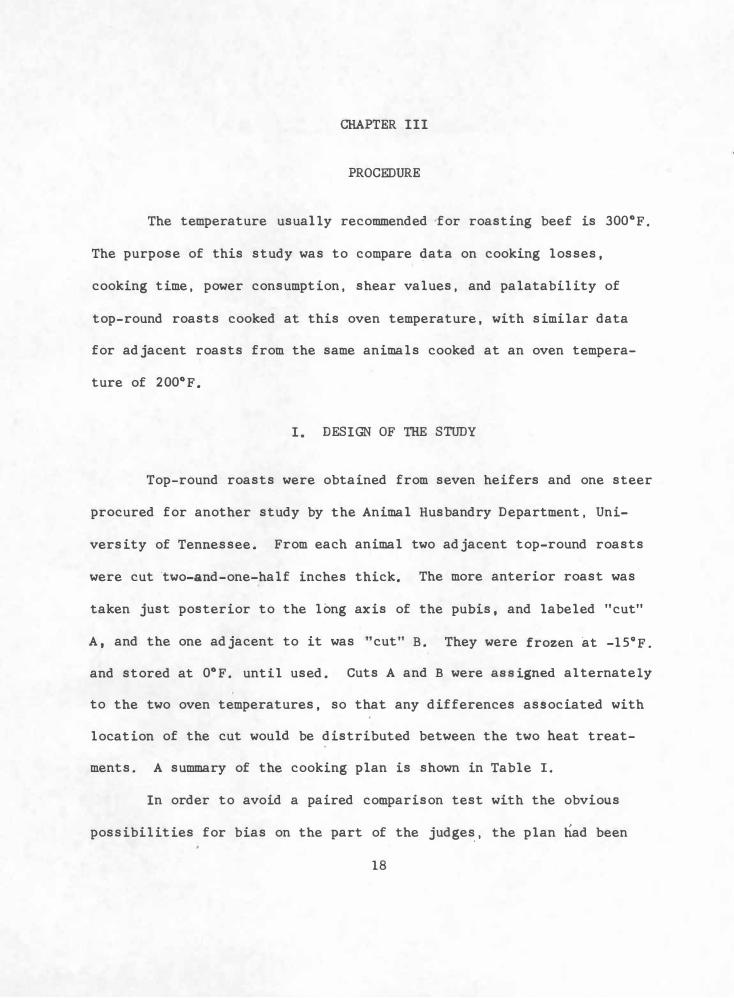
The temperature usually recommended ·for roasting beef is 300° F.
The purpose of this study was to compare �ata on cooking losses,
cooking time, power consumption, shear values, and palatability of
top-round roasts cooked at this oven temperature, with similar data
for adjacent roasts from the same animals cooked at an oven tempera
ture of 200° F.
I. DESIGN OF THE STUDY
Top-round roasts were obtained from seven heifers and one steer
procured for another study by the Animal Husbandry Department, Uni
versity of Tennessee. From each animal two adjacent top-round roasts
were cut ·two-and-one-half inches thick. The more anterior roast was
taken just posterior to the long axis of the pubis, and labeled "cut"
A, and the one adjacent to it was "cut''' B. They were frozen at -15Q F.
and stored at 0° F. until used. Cuts A and B were assigned alternately
to the two oven temperatures, so that any differences associated with
location of the cut would be distributed between the two heat treat
ments. A summary of th� cooking plan is shown in Table I.
In order to avoid a paired comparison test with the obvious
possibilities for bias on the part of the judges_, the plan had been
18
19
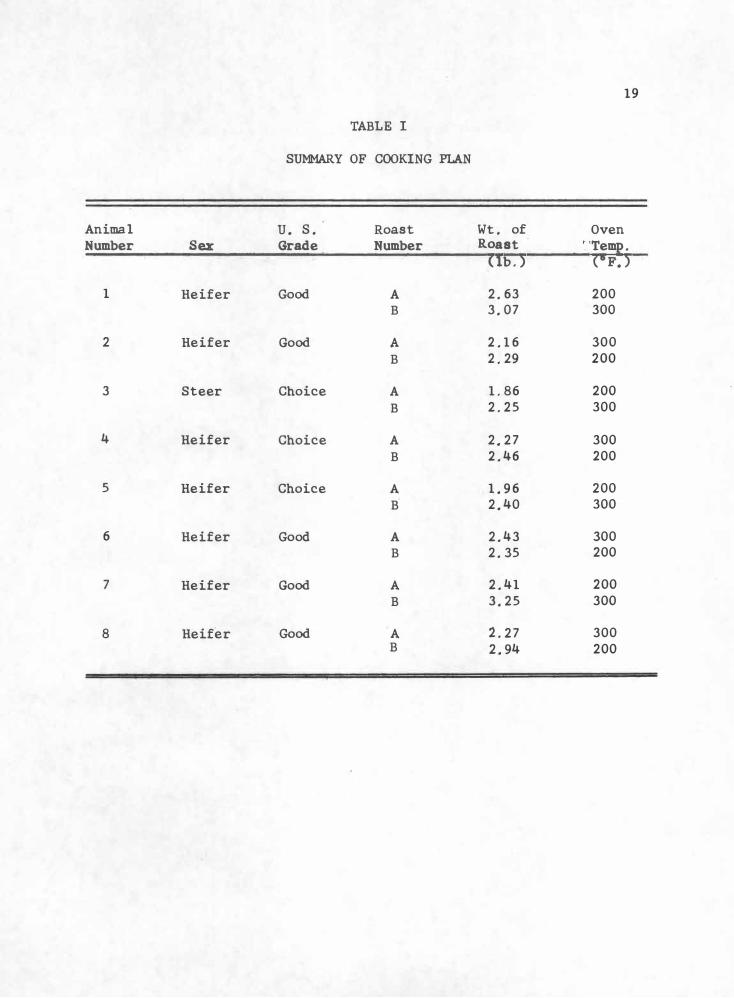
TABLE I
SU:MMARY OF COOKING PLAN
Animal u. s. Roast Wt. of Oven Number Sex Grade Number Roast · 'Temp.
(lb.) (6F.)
1 Heifer Good A 2.63 200
B 3.07 300
2 Heifer Good A 2.16 300
B 2.29 200
3 Steer Choice A 1. 86 200
B 2.25 300
4 Heifer Choice A 2.27 300
B 2.46 200
5 Heifer Choice A 1.96 200
B 2.40 300
6 Heifer Good A 2.43 300
B 2.35 200
7 Heifer Good A 2.41 200
B 3.25 300
8 Heifer Good A 2.27 300 B 2.94 200
20
to test roasts from nine animals, cooking three roasts on each of
six days, two at one of the oven temperatures. The roasts were cooked
as planned but due to an unexplained error the data for one animal could
not be used. All the· sensory data that were averaged however had been
obtained by triplicate test. Data were analyzed for four A roasts and
four B roasts cooked at each of the oven temperatures.
Il. COOKING METHODS
The roasts were removed from the freezer and thawed at room
temperature on the day before cooking. When completely thawed they
were stored in a household refrigerator overnight. In an attempt to
have the roasts ready for testing at about the same time, those to be
roasted at the lower temperature were started early in the morning,
and those to be roasted at the higher temperature were held in the
refrigerator and started about noon. The roasts were weighed to the
nearest gram on a Mettler Type KS balance, and placed fat-side up in
tared shallow pans with racks. It was found necessary to support the
roasts with wooden blocks to prevent them from falling over in the ov�n.
A thermometer was placed in the approximate geometric center of each
roast and used as a final indica�ion of the end-point of cooking. In
some roasts the center was not the thickest part o� the muscle. In
these cases the thermometer was placed in the thickest part of the·
roast. A thermocouple was inserted into the meat close to the ther
mometer. The roasts �ere placed in a cold oven of a household electric
range, and the thermostat was set in a position predetermined to
maintain a temperature of 200-225° F. or 300�325° F. Previous tests
had indicated that there was about a 25° F. range in the thermostat
of each oven. Thermocouple readings were taken at fifteen-minute
intervals to determine heat penetration, and were used as a check
21
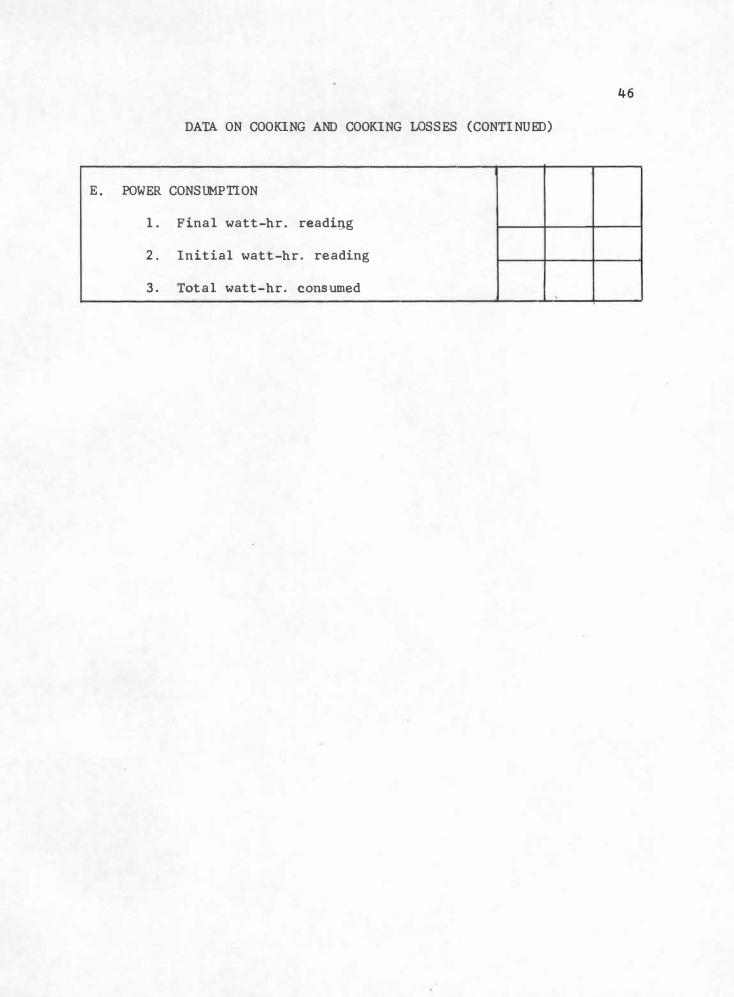
on the end-point temperature·, A watt-hour meter was connected to the
power line of each range to measure power consumption. Readings were
taken before and after cooking to determine the amount of power con
sumed. An end-point temperature of 158° F. was chosen for the 300° F.
roasts. When the roasts in the 200° F. oven reached an internal tem
perature of 154° F. and maintained this temperature for one hour, the
meat was removed from the oven. Preliminary work indicated that
roasts cooked at 200° F. were more well-done at 154° F. than roasts
cooked at 300° F. to an internal temperature of 158° F.
III. COOKING LOSSES, COOKING TIME,
AND POWER CONSUMPTION
Ten minutes after ·removal from the oven, the ·roasts were
weighed in the pan. The difference between this weight and the total
weight before cooking indicated evaporation losses. The meat was re
moved from the pan which was weighed again to determine loss due to
drippings. Evaporation and drippings loss were added to give a figure
for total loss. Cooking losses were expressed as a percentage of the
original weight of the roast. Forms for recording cooking data are·
22
found on page 45 in the Appendix. The weight of the roasts was con
verted to pounds, and cooking time per pound and watt-hours consumed
per pound were calculated.
IV. SENSORY EVALUATIONS
The roasts were cut in half and three slices three-eighths
inch thick were taken from each half using a hand-operated meat slicer.
The slices were numbered one, two, and three, beginning at the center
cut. T�e three slices from the right half were used for scoring, and
those from the left half for llchew count. " The samples to be scored
were coded by letters and judged by a panel of five, all experienced
in the evaluation of beef. Each judge was assigned a top or bottom
half of a specified slice from each roast. The three samples for each
judge were placed on individual plates marked with the code letter, and
set on a white enamel tray. The order of presentation was randomized.
In preliminary work it was found that there was a considerable differ-
ence in the color of the roasts cooked at the two oven temperatures.
Those cooked at the lower oven temperature were quite brown.inside and
appeared well-done, while those at the higher temperature appeared medium
done. To minimize the pbssibility of bias arising from this color differ
ence, the tray for each judge was placed under a red· light in order to, ·
mask the color differences in the samples. The judges did not see the
meat at all until it was under the light. The judges were asked to score
for juiciness, flavor, and tenderness, using a nine-point scale where nine
was designated as optimum qualit_y . (See sample score card in the Append.ix,
page 47. )
23
From·each of the slices from the other half of the roast two
discs one-inch in diameter were cut with a corer, one from the top
half, and the other �rom the bottom half of each slice. Each judge
was assigned a top or bottom disc from a specified slice from each
roast. These were coded differently from the samples that were
scored, and presented separately to the panel members. Each judge
was asked to record the number of chews required for the complete
mastication of each disc assigned to hi�.
V. SHEAR TESTS
An objective index to tenderness was obtained by the use of the
Warner Bratzler shear machine. Six cores one-half inch in diameter
were removed parallel to the muscle fibers, three from each half-roast
remaining after the slices for sensory. evaluation had been removed.
Each core was sheared three times and the average for all six cores
was calculated.
VI. ANALYSIS OF DATA
Means were calculated for each of the measurements made. The
data were analyzed for signific��ce of the difference between the means
by the use of the t-test, which depends on th� assumption that the popu
lation is normally-distributed. Coefficients of correlation between.the
three measurements of tenderness were also calculated.
CHAPTER IV
RESULTS AND DISCUSSION
I. EFFECT OF 'IWO OVEN TEMPERA TURFS
ON COOKING LOSSES
The data obtained for the cooking losses of the roasts at the
two oven temperature are shown in Table II.
Evaporation loss. Evaporation loss was 9. 3 per cent higher at
200 °F. than at 300 °F. This difference was significant (P<0.01), and
was noted in the appearance of the roasts after cooking. The roasts
cooked at 200 °F. appeared hard, dry, and slightly shrunken in size,
while those cooked at the higher oven temperature were plump and had
a glossy, moist outer surface.
Drippings loss. Drippings loss from the 300 °F. roasts was sig
nificantly (P<0.01) higher than from roasts cooked at 200 °F. Some of
J
the difference could be due to the fact that the drippings from the
roasts in the lower-temperature oven had a longer time in which to
evaporate. The drippings in the pan of the 300 °F. roasts were lighter
in color and more fluid than the rather dry and dark residue from. the
roasts cooked at 200 °F.
24
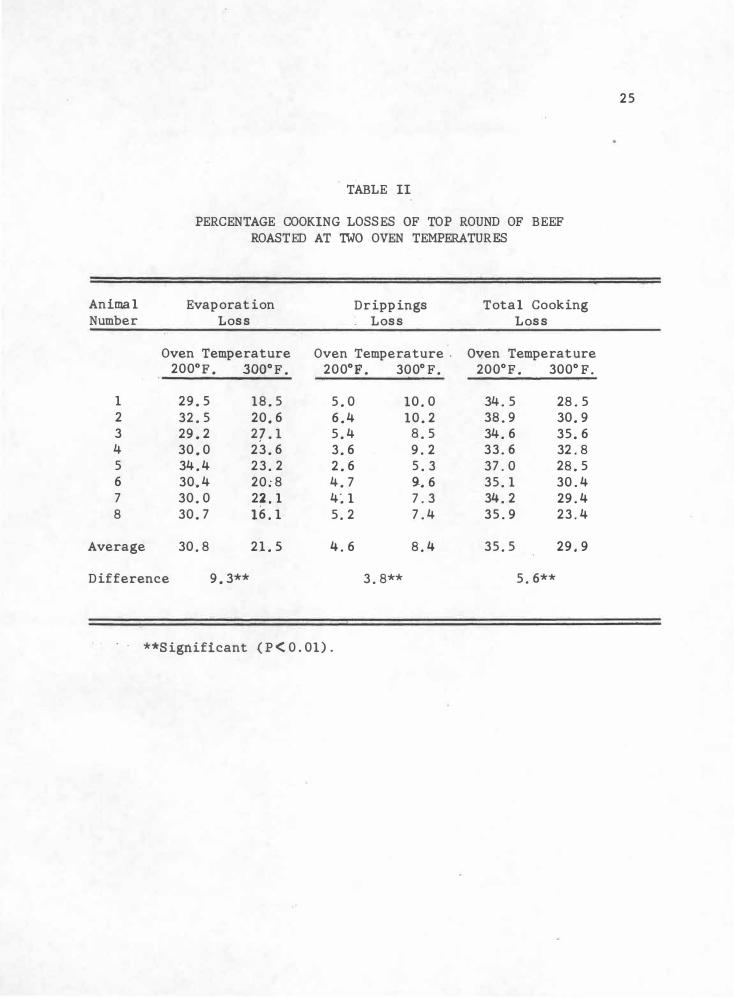
TABLE II
PERCENTAGE COOKING LOSSES OF TOP ROUND OF BEEF ROASTED AT 'IWO OVEN TEMPERATURES
Anima l Evaporation Drippings Total Cooking Number Loss Loss Loss
Oven Temperature Oven Temperature. Oven Temperature 200° F. 300° F. 200° F. 300° F. 200° F. 300° F.
1 29. 5 18.5 5. 0 10. 0 34. 5 28.5 2 32. 5 20. 6 6. 4 10. 2 38. 9 30. 9 3 29.2 27. 1 5. 4 8. 5 34. 6 35. 6 4 30.0 2 3. 6 3. 6 9. 2 33.6 32.8 5 34. 4 2 3. 2 2. 6 5. 3 37. 0 28.5 6 30 .• 4 20.:8 4. 7 9 .• 6 35. 1 30.4 7 30. 0 2�. l 4�1 7. 3 34. 2 29.4 8 30. 7 16.1 5. 2 7.4 35.9 23.4
Average 30. 8 21. 5 4.6 8. 4 35. 5 29,9
Difference 9.3** 3. 8** 5. 6**
· · **Significant (P<0.01) .
25
26
Total cooking �- Total cooking loss was 35. 5 per cent
and 29 . 9 per cent for the roasts from the 200° F . and 300 ° F . ovens
respectively . The difference was significant (P<..0. 01). The in
creased evaporative losses from the 200° F. roasts were largely re
sponsible for the gre�ter total · losses from these roasts . The dif
ference in total loss was, however , reduced by the greater drippings
loss from the 300° F. roasts .
These results show similar trends to those for the blade roasts
of Nielsen and Hal l (1965). Total c0oking losses for the round roasts
cooked at 200° F. in the present study were approximately 9 . 3 per cent
higher than losses from blade roasts cooked at 225° F. in their study .
At 300° F .. in the present study losses were about 13 per cent greater
than for the blade roasts cooked at 325° F. in the Nielsen and Hal l
(1965) study. There was also a greater difference �n total c�oking
losses for the round roasts in the: present study than for the rump
roasts of the Nielsen and Hal l (1965) work. The size and shape of
the roasts and presence of bone would probably account for the dif
ferences in cooking losses in the .two stud ies. The rump is a chunky
roast, and the blade is more rectangular, with a larger surface �rea.
Roasts in the Nielsen and Hal l (1965) study averaged four pounds. The
top-round roasts of the present study would resemble b lade roasts in:
shape ,but were boneless .
II. EFFECT OF TWO OVEN TEMPERATURES ON COOKING TIME
HEAT PENETRATION, AND POWER CONSUMPTION
27
Cooking tµne. There was a significant difference in cooking
time for the roasts cooked at the two oven temperatures as shown in
Table III. At 200° F. the roasts required an average of approximately
three hours per pound to reach the desired end-point temperat ure,
while those cooked at 300° F. required only fifty-four minutes per
pound.
Nielsen and Hall (1965) also reported a longer cooking time for
rump and blade roasts at 225° F. as compared to 325° F. , but the dif.fer
ences between the cooking times per pound for their roasts were not I
as great as in the present study. At 225° F. the roasts in their study
required an average of 2. 35 hours per pound, and at 325° F. rump roasts
required an average of forty-s even minutes per pound, and the blade
roasts an average of twenty-five minutes per pound. Again, diff�r
ences in size, shape, and surface area of the roasts, as well as dif
ferences in oven temperature were probably contributing factors .
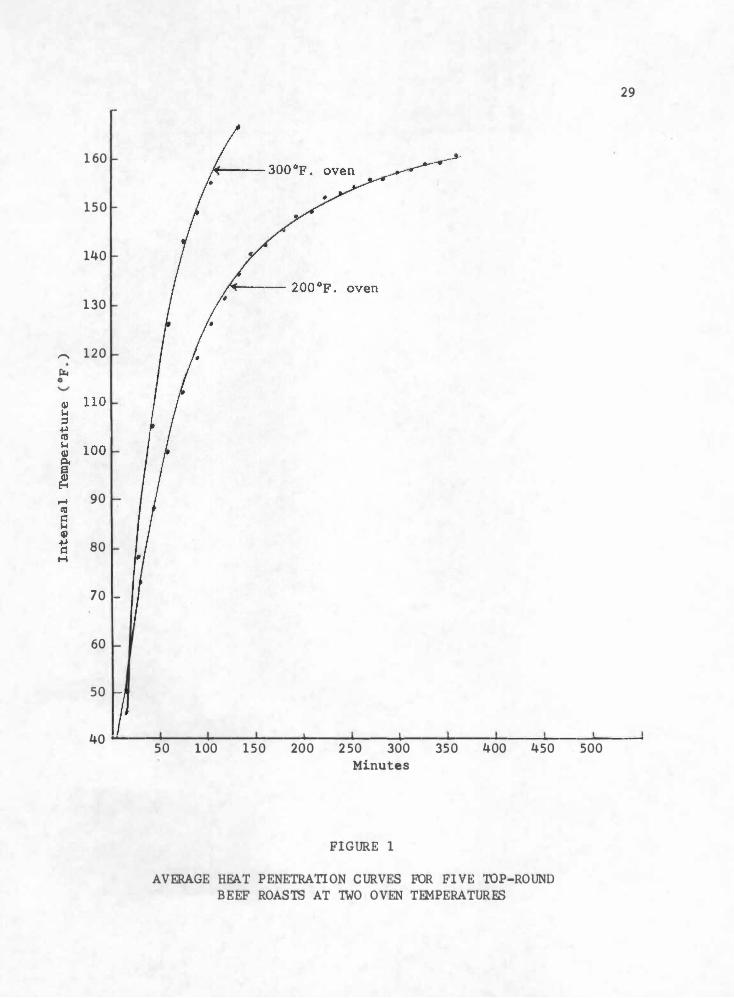
Heat penetration. An average heat-penetration curve for five
roasts at each of the oven temperatures is shown in Figure 1. The
data indicate that the internal temperature of the roasts was simi
lar during the first twenty minutes. Then the temperature of the
roasts in the 200° F. oven rose an average of 56° F. �n the first hour,
only 22° F. in the second hour, and required three-and-one-half more
28
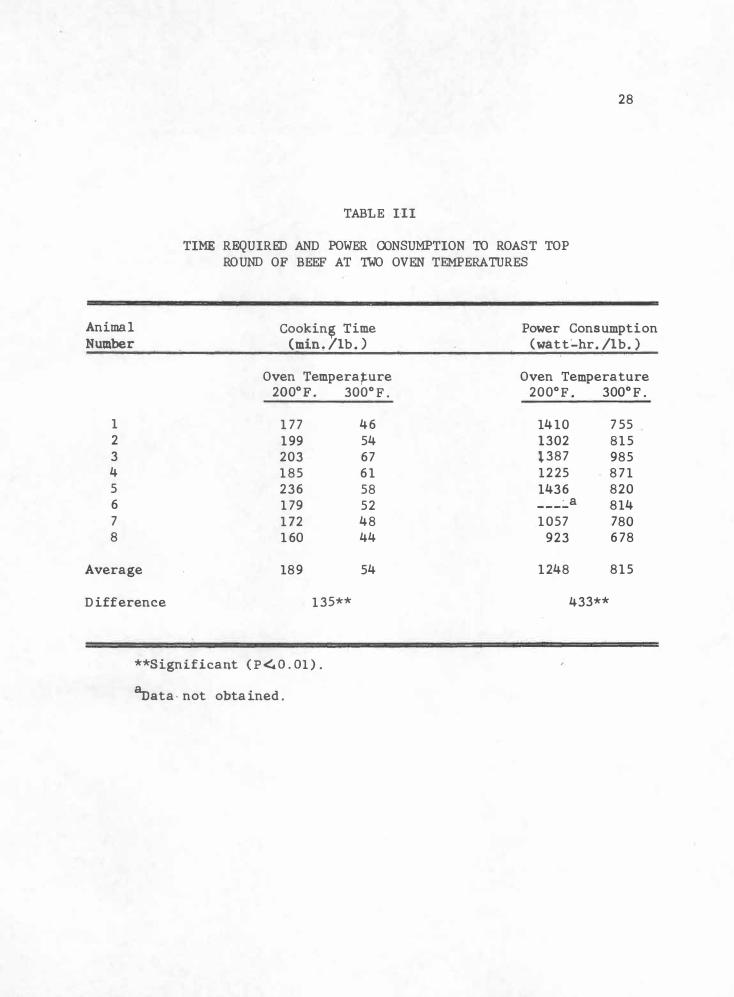
TABLE HI
TIME REQUIRED AND POWER OJNSUMPTION TO ROAST TOP ROUND OF BEEF AT TWO OVEN TEMPERATIJRES
Animal Gookin, Time Number (min ! /lb .. )
Oven Temperature 200° F. 300° F .
1 177 46 2 199 54 3 203 67 4 185 61 5 236 58 6 179 52 7 172 48 8 160 44
Average 189 54
Difference 135**
**Significant ( P <. 0 . 01 ) .
8nata. not obtained .
Power Consumption (watt�hr. /lb. )
Oven Temperature 200° F . 300° F.
14 10 7 55 1302 815 P87 985 12 25 8 7 1 1436 820 ___ :._a 814 1057 780
923 678
1248 8 15
433**
1 60
1 50
140
130
""' 120
�
90
80
70 -
60
so
29
40 --�--��--��--��--� ...... ---����--��---��...,_�__.--�--so 100 150 200 2 50 300 350 400 450 500
Minutes
FIGURE 1
AVERAGE HF.AT PENETRATION CURVES FOR FIVE 'roP-ROUND BEEF ROASTS AT TWO OVEN TEMPERATURES
hours to increase from 138° F . to 160° F. The temperature of the
roasts in the 300° F. oven continued to rise rapidly and reached
30
the end-point temperature in abqut two hours. There was not perfect
agreement between thermocouples and the mercury thermometers . There
fore the final end-point of cooking was determined by the thermometer
readings . The curves are included here merely to give an indication
of the difference in the rate of heat conduction at the two oven tem
peratures �
Power consumption. The wat t-�ours of power consumed per pound
of meat at each oven temperature are shown in Table III ( page 28) also .
The large increase in cooking· time of the roasts in the 200° F. oven
resulted in an increase of approximately 50 per cent in the consump
tion of power per pound of meat. The average power consumption per
pound of meat was 124 8 watt-hours at 200° F . and 815 watt-hours at
300° F . The difference was highly significant ( P L. 0. 01) . These re
sults also agree with those of Nielsen and Hall ( 1965) who reported a
100 per cent increase in power consumption at 225° F . as compared to
325° F. The increased fuel consumed by the lower temperatures might
be a fattor to consider when determining the practical aspects of
the use of the two oven temperatures .
III. EFFECT OF TWO OVEN TEMPERATURES ON FLAVOR AND
JUICINESS OF TOP-ROUND ROASTS
Average panel scores for flavor and juiciness of top-round
roasts cooked at the two oven temperatures are presented in Table IV.
Animal Number
1
2 3 4 5 6 7 8
Average
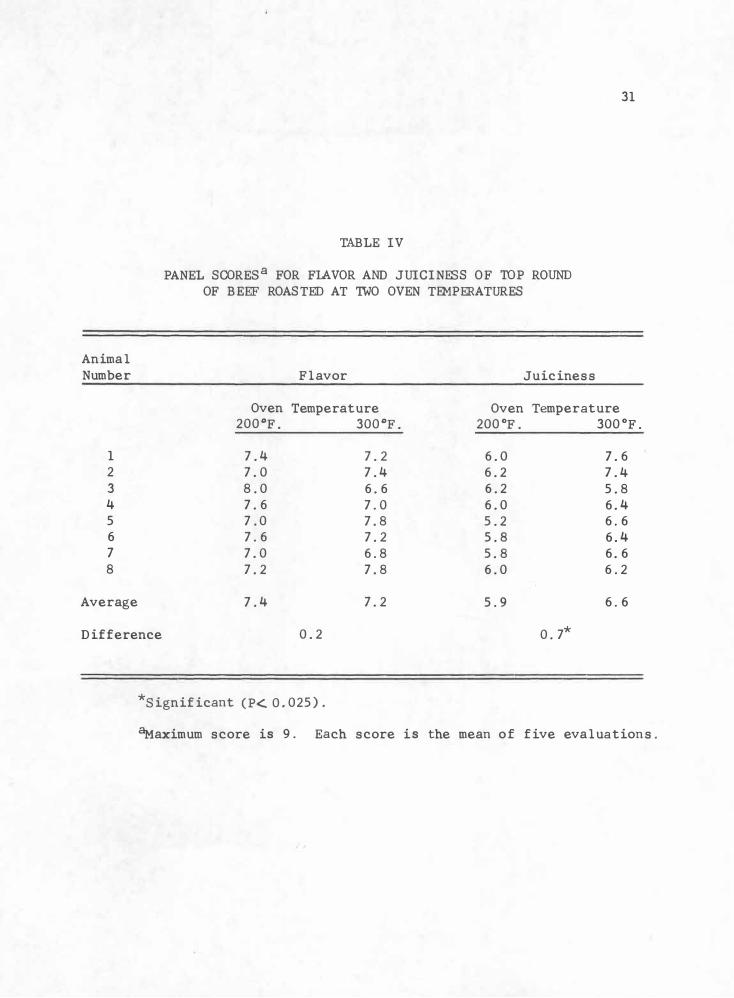
TABLE IV
PANEL SCORES a FOR FLAVOR AND JUICINESS OF TOP ROUND OF BEEF ROASTED AT 'IWO OVEN TEMPERATURES
Flavor Juiciness
31
Oven Temperature Oven Temperature 200 °F. 300 °F. 200 °F . 300 °F .
7 . 4 7 . 2 6 . 0 7 . 6 7 . 0 7 . 4 6 . 2 7 . 4 8 . 0 6 . 6 6 . 2 5 . 8 7 . 6 7 . 0 6 . 0 6 . 4 7 . 0 7 . 8 5 . 2 6 . 6 7 . 6 7 . 2 5 . 8 6 . 4 7 . 0 6 . 8 5 . 8 6 . 6 7 . 2 7 . 8 6 . 0 6 . 2
7 . 4 7 . 2 5 . 9 6 . 6
Difference 0 . 2 0 . 7*
*significant (P<. o . 025).
�aximum score is 9 . Each score is the mean of five evaluations .
32
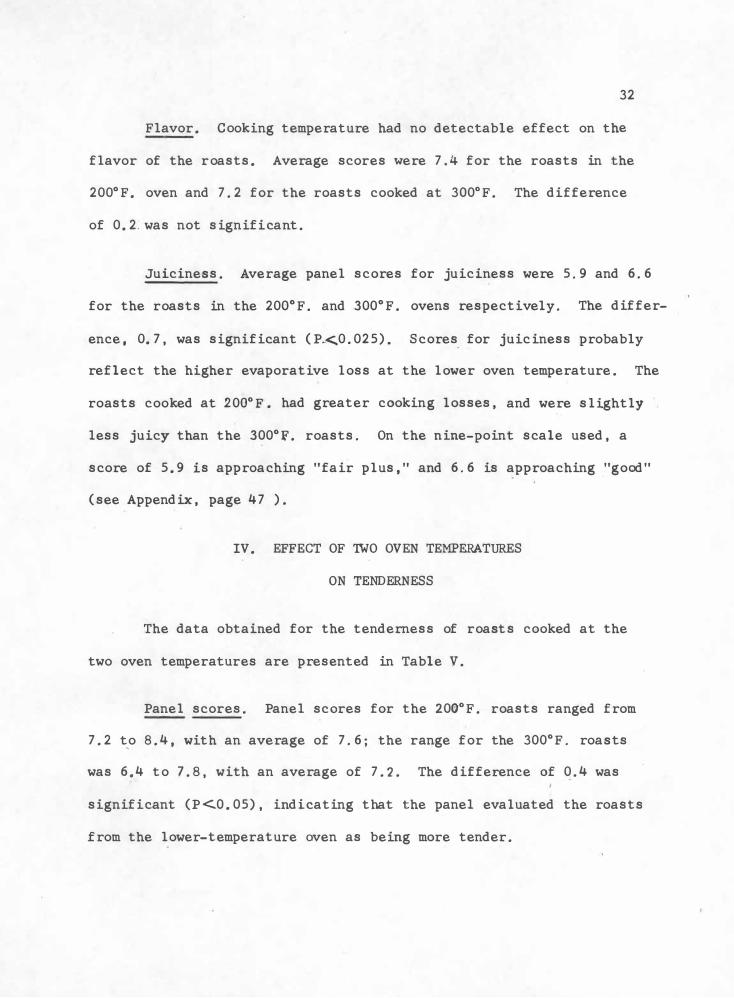
Flavor. Cooking temperature had no detectable effect on the
flavor of the roasts. Average scores were 7 . 4 for the roasts in the
200° F. oven and 7 . 2 for the roasts cooked at 300° F. The difference
of 0. 2. was not significant.
Juiciness. Average panel scores for juiciness were 5 . 9 and 6. 6
for the roasts in the 200° F. and 300° F. ovens respectively. The differ
ence , O. 7 , was significant (P.<0. 025). Scores_ for juiciness probably
reflect the higher evaporative loss at the lower oven temperature. The
roasts cooked at 200° F . had greater cooking losses, and were slightly
less juicy than the 300° f. roasts. On the nine-point scale used, a
score of 5. 9 is approaching "fair plus, " and 6 . 6 is approaching ."good"
(see Appendix, page 47 ).
IV. EFFECT OF 'IWO OVEN TEMPERATURES
ON TENDERNESS
The data obtained for the tenderness of roasts cooked at the
two oven temperatures are presented in Table V.
Panel scores. Panel scores for the 200° F. roasts ranged from
7 . 2 to 8 . 4, with an average of 7 . 6 ; the range for the 300° F. roas ts
was 6 . 4 to 7 . 8 , with an average of 7 . 2 . The difference of 0. 4 was
significant (P <.0. 05), indicating that the panel evaluated the roasts
from the lower-temperature oven as being more tender.
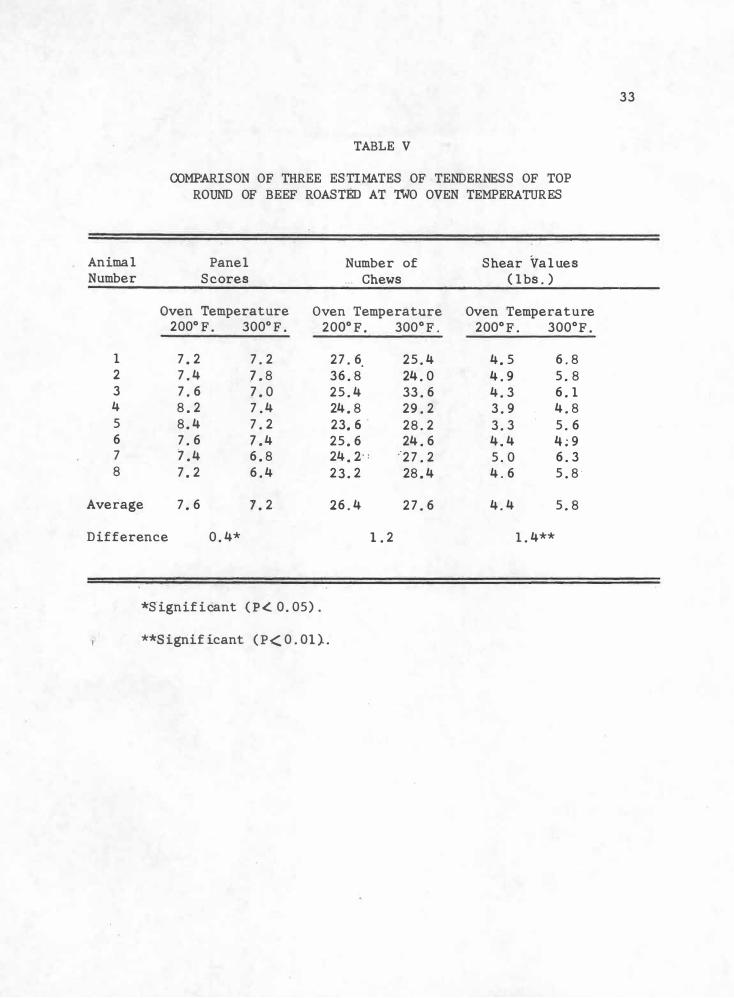
TABLE V
COMPARISON OF THREE ESTIMATES OF TENDERNESS OF TOP ROUND OF BEEF ROASTED AT 1WO OVEN TEMPERATURES
Animal Panel Number of Number Scores . . . Chews
Oven Temperature Oven Temperature 200° F. 300° F. 200° F. 300° F .
1 7 . 2 7 . 2 27 . 6. 25. 4 2 7 . 4 7 . 8 36. 8 24. 0 3 7 . 6 7 . 0 25. 4 33. 6 4 8 . 2 7 . 4 24. 8 29. 2 5 8. 4 7 . 2 23. 6 . 28. 2 6 7 . 6 7 . 4 25. 6 24 . 6 7 7 . 4 6. 8 24 . 2 · : :27 . 2 8 7. 2 6 . 4 23. 2 28. 4
Average 7. 6 1 . 2 26 . 4 27 . 6
Difference 0. 4* 1. 2
*S.ignificant { P .( 0. OS).
**Sigriif icant (P< 0. 01)..
Shear Values (lbs. )
Oven Temperature 200° F. 300° F.
4. 5 6 . 8 4 . 9 5. 8 4. 3 6 . 1 3. 9 4. 8 3. 3 5. 6 4 .. 4 4 ; 9 5. 0 6 . 3 4 . 6 5. 8 ·
4 . 4 5. 8
1. 4**
33
34
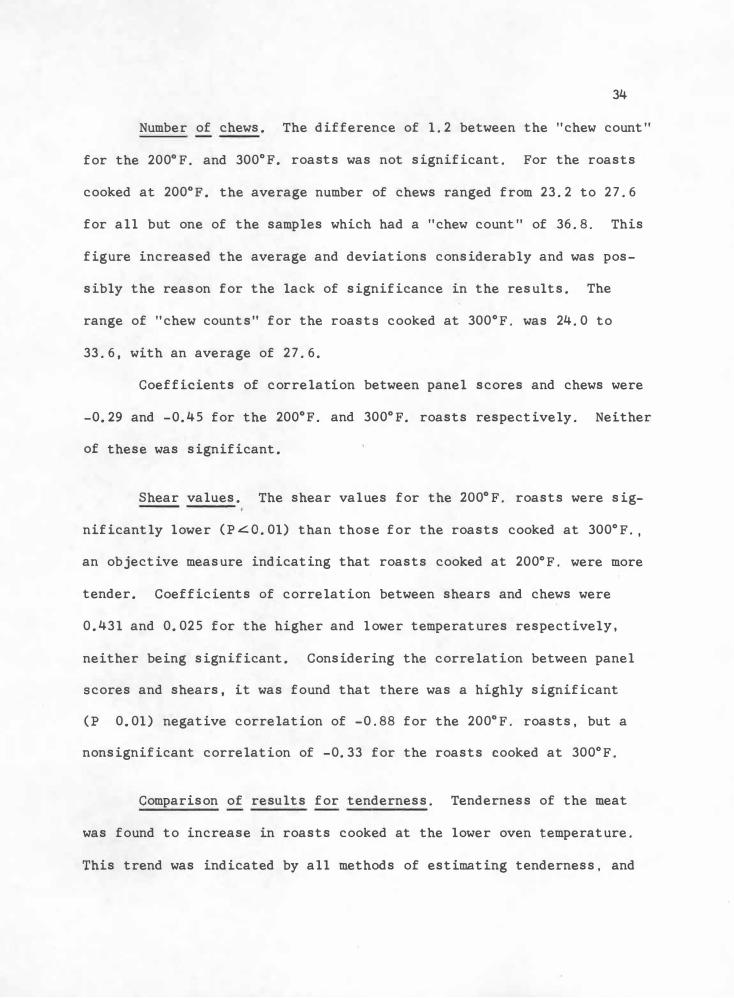
Number of chews. The difference of 1. 2 between the "chew count"
for the 200° F. and 300° F. roasts was not significant. For the roasts
cooked at 200° F. the average number of chews ranged from 23. 2 to 27. 6
for all but one of the samples which had a "chew count" of 36. 8. This
figure increased the average and deviations considerably and was pos
sibly the reason for the lack of significance in the results. The
range of "chew counts" for the roasts cooked at 300° F. was 24. 0 to
33. 6, with an average of 27. 6.
Coeffi�ients of correlation between panel scores and chews were
-0. 29 and -0. 45 for the 200° F. and 300° F. roasts respectively. Neither
of these was significant.
Shear values. The shear values for the 200° F. roasts were sig
nificantly lower (P � O. 01) than those for the roasts cooked at 300° F. ,
an objective measure indicating that roasts cooked at 200° F . were more
tender. Coefficients of correlation between shears and chews were
0. 431 and 0. 025 for the higher and lower temperatures respectively ,
neither being sign ificant. Considering the correlation between panel
scores and shears, it was found that there was a highly significant
(P 0 .01) negative correlation of -0.88 for the 200° F. roasts, but a
nonsignificant correlation of -0. 33 for the roasts cooked at 300° F.
Comparison of results for tenderness. Tenderness of the meat
was found to increase in roasts cooked at the lower oven temperature.
This trend was indicated by all methods of estimating tenderness , and
35
differences between the two oven temperatures were significant when
determined by panel scores and shear values.
Cover (1943) was one of the first to propose that lower oven
temperatures were desirable in the roasting of beef . She stated that
a slow rate of heat penetration would produce meat that was less juicy,
but more tender, and had only slightly greater cooking losses. The
reasons for this increased tenderness of roasts cooked at lower oven
temperatures are not altogether clear, but there seems to be some in
dication that slow penetration of heat is an important factor.
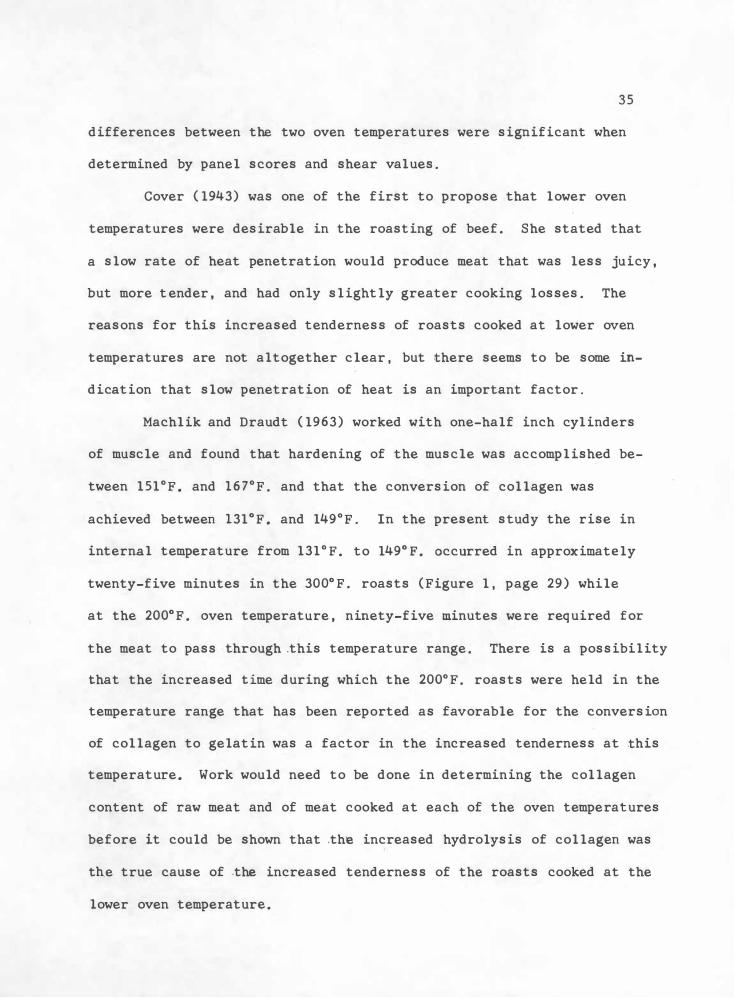
Machlik and Draudt (1963) worked with one-half inch cylinders
of muscle and found that hardening of the muscle was accomplished be
tween 151 ° F. and 16 7° F. and that the conversion of collagen was
achieved between 131° F. and 149 ° F. In the present study the rise in
internal temperature from 131 ° F. to 149° F. occurred in approximately
twenty-five minutes in the 300° F. roasts (Figure 1, page 29) while
at the 200° F. oven temperature, ninety-five minutes we re required for
the meat to pass through .this temperature range. There is a possibility
that the increased t ime during which the 200° F. roasts were held in the
temperature range that has been reported as favorable for the conversion
of collagen to gelatin was a factor in the increased tenderness at this
temperature. Work would need to be done in determining the collagen
content of raw meat and of meat cooked at each of the oven temperatures
before it could be shown that .the increased hydrolysis of collagen was
the true cause of .the increased tenderness of the roasts cooked at the
lower oven temperature.
36
The results in this stu�y were very similar to those obtained
by Nielsen and Hal l (1965) . They fou�d that blade roasts cooked at
225° F. were significantly more tender than the 325° F 0 roasts , as in
dicated by shearing tests , but the difference was not reflected in
their panel scores . Rump roasts also tended to be more tender when
cooked at 225°F. than at 325° F. but the difference was not signifi_
cant. In .the present study, both panel scores and shear tests in
dicated that top-round roasts were significantly more tender when
roasted at 200° F. than at 300° F.
Other considerations . The practical aspects of using either
of the oven temperatures tested in this study for roasting top -round
of beef need to be considered .
The lower oven temperature gives meat that is more tender, but
this is achieved at the expense of cooking time , power consumption , and
juiciness. The meat cooked at the lower oven temperature did not have
such an attractive outer appearance . There was no apparent difference
in flavor which would seem to indicate that the tenderness and juici
ness differences did not influence the scores for flavor .
The increased cooking time at the lower oven temperature could
be an advantage in certain instances such as institutions which use
large roasts that could be cooked overnight . It seems possible, also ,
that cooking losses for larger roasts would not be as great as those
obtained in the present study . Further work in this field to determine

the temperature at which increased tenderness is achieved without
sacrificing other factors is .necessary.
37
CHAPTER V
SUMMARY
I. SCOPE OF THE STUDY
The purpose of this study was to determine the effect of roast
ing at two oven temperatures ·on the cooking losses, cooking time, power
consumption , sensory quality , and tenderness of top round of beef .
Roasts weighing an average of 2 . 46 pounds and cut two-and-one
half inches thick were obtained from seven he ifers and on.e st�er. Two
adjacent roasts were taken from each animal for cooking at oven tem
peratures of 200° F. and 300° F. Four anterior and four posterior roasts
were cooked at each oven temperature . End-point temperatures of 154° F .
and 158° F. were used for the 200° F. and 300° F . roasts respectively .
Three roasts were cooked each day, two at one of the oven ,temperatures.
Sensory evaluations of . flavor, juiciness, and tenderness were
obtained. Tenderness was also determined objectively by use of the
Warner Bratzler shear machine. Heat penetration at each oven tempera
ture was measured.
II . PRINCIPAL FINDINGS .
Evaporation loss was about one-third lower at 300° F . than at
200° F. , being 2 1. S and 30. 8 per cent respectively. On the other
hand, drippings loss was about twice as large at 300° F . as at 200° F .
38
39
being 8. 4 and 4. 6 per cent respectively. The high evaporation loss
contributed to the high t otal cooking losses at 200° F. , 35. 5 as com
pared to 29. 9 per cent at 300° F.
The roasts cooked at 200° F. required approximately three hours
per pound to reach the des ired end-point temperature, while those
cooked at 300° F. required fifty-four m.inutes per pound. The increased
cooking time . at the lower oven temperature required 53 per cent more
watt-hours of power.
Sensory evaluation indicated 'that there was no apparent differ
ence in the flavor of roasts cooked at the two oven temperatures, but
the roasts �ooked at 300° F. were significantly more j uicy than those
cooked at 200° F. As indicated by shea'r ·values· and p�nel scores,'
roasts cooked at 200° F. were s ignif ican.tly' (P < O. 01) more tender than
those cooked at 300° F. When tenderness· was determined by "chew count"
the difference between sampl es cooked at the two oven temperatures was
not significant.
While reducing the oven temperature 100° F. for roasting beef
round yielded meat that was more tender t han was obtained by roasting
at the conventional .temperature of 300° F. this improvement _in tender
ness was achieved . at the expense 'of increased cooking losses, c ooking
time, fuel consumption, and decre.ased juicines.s of the meat. All these
factors need to be considered when 'deciding on the temperature most
practical for use.

BIBLIOGRAPHY
BIBLIOGRAPHY
Arnold, N. , E. Wierbicki, and F. E . Deatherage . 1956. Post mortem changes in the interactions of cation� and proteins of beef and their relation to sex and diethyl-stilbesterol treatment. Food Technol. 1 0, 245.
Bramblett, V. D. , R . L. Hostetler, G. E. Vail, and H. N. Draudt . 1959. Qualities of beef as affected by cooking at very low temperatures for long periods of time. Food Technol. 13, 707 .
Bramblett, V. D. , and G. E. Vail. 1964. Further studies on the qualities of beef as affected by cooking at very low temperatures for long periods.. Food Technol. 18, 245 .
Cover, S. 1937 •· The effect of temperature and time of cooking on the. tenderness· of roasts . Texas Agr. Expt. Sta. Bull. 542.
Cover, S. 194 3 . Effect of extremely low rates of heat penetration on tendering of beef. Food Research � ' 388.
Cover, S. , J. A. Bannister, and E. Kehlenbrink. 1957. Effect of four conditions of c·ooking on the eating quality of two cuts of beef . Food Research 22, 635.
Cover, s . , O. D. Butler, and T. C. Cartwright. 1956. The relationship of fatness in yearling steers to juiciness and tenderness· of broiled and braised ste·aks. J . Animal Sci . 27, 469 .
Cover, s . , and R. L. Hostetler . 1960. Beef tenderness by new methods. Texas Agr. Expt . Sta. Bull. 947.
Dawson, E. H. , G. S. Linton, A . M. Harki�, and C. Miller. 1959. Factors influencing the palatability, vitamin content , and · yield of cooked beef. Home Economic� Research Report No. 9.
Deatherage, F. E. , and A. Harsham. beef to· aging time at 33-35° F·.
1947. Relation of tenderness of Food Research 1 2 � 164.
Gr iswold, R. M. 1955. The effect of different methods of cooking beef round of commercial and prime grades. I . Palatability and shear values. Food Research 20, 160.
Griswold, R. M. 1962. "The Experimen ta 1 Study of Foods. " Houghton Mifflin Company, Atlanta.
4 1
42
Hamm, R. , and F. E. Deatherage. 1960. Changes in hydration, solubility, and charges of muscle proteins during heating of meat . Food Research 25, 587.
Hershberger, T. , R. Deans, L. E. Kunkle, P. Gerlaugh , and F. E. Deatherage. 1951. Studies on meat. III. The biochemistry and quality of meat in relation to certain feeding management practices. · Food Technol. �' 523.
Hiner, R. L. , E. E. Anderson, and C. R. Fellers . 1955. Amount and character of connective tissue as it relates to tenderness ·of beef muscle. Food T·echnol. 2,, 80. ·
Hiner, R. L. , and 0. G. Hankins. 1951. Effects of freezing on tenderness of beef from different muscles and from animals of different ages. Food Technol . � ' 374.
Hiner, R. L . , O. G. Hankins, H. S. Sloane, C . R. Fellers, and E. E . Anderson. 1953. Fiber diameter in relation to tenderness of beef muscle. Food Research 18, 364.
Husain i, s. A . , F. E. Deatherage, L. E. Kunkle, and H. N. Draudt. 1950. Studies on meat .. I. · · The biochemistry of beef as related to tenderness. Food Technol. � ' 313.
Machlik, s. M. , and H . N. Draudt. 1963. The effect of heating time and temperature on the shear of . beef semitendinosus muscle . J. Food Sci. 28, 711.
Meyer, B. , J. Thomas, R . Buckley, and J. W. Cole . 1960. The quality of grain-finished and grass-finished beef as affected ' by ripening . Food Technol. 14, 4.
Nielsen, M. M. , and F. T. Hall. 1965. Dry-roasting of less tender beef cuts. J. Home Econ. 57 , 3 53.
Ramsbottom, J. M . , and E. J. Strandine. 1949. Initial physical and chemical changes in beef as related to tenderness. J. Animal Sci. � . 398.
Ramsbottom, J. M'. , E. J . Strandine, and C. H . Koonz. 1945. Comparative tenderness of representative beef muscles. Food Research 10 , 497.
Ritcney, S. J. , S. Cover , and R . L � Hostetler. 1963. Collagen content and its relation to tenderness of connective tissue in two beef muscles. Food Technol. 17, 194.
43 , , . . Szent-Gyorgy1, A. 1953. "Chemical Physiology of Contraction in Body
and Heart Muscle. " Academic Press, New York.
Tuomy, J. M. , R. J. Lechnir. and T. Miller. 1963 . time and temperature on the tenderness of beef. 1457 .
Effect of cooking Food Technol. !Z,,
Wanderstock, J. J. , and J. I. Miller. 1948 . Quality and palatability of beef as affected by method of fee�ing and carcass grade. Food Research 13, 291.
Wang, H. ; D . M. D oty, F. J. Beard, J. C. Pierce, and 0 . Q. Hankins. 1956. Extensibility of single ·beef muscle . fibers. J. Animal Sci. 15, 97 .
Wierbicki, E. , L . E. Kunkle, Y. R. Cahill, and F . E. Deatherage. 1954. The relation of tenderness to protein alterations during post mortem aging. Food Technol. � ' 506 .
Wierbicki, E. , L . E. Kunkle, V. R. Cahill, and F. E. Deatherage. 1956 . Post mortem changes in meat and their relation to tenderness with some comparisons of meat from heifers, bulls, steers, and diethyl stilbesterol treated bulls and steers. Food Technol. 10, 80.
Winegarden, M. w. , B. Lowe, J. Kastelic, E. A. Kline, A. R�. Elagge, , and
P. S . Shearer. 1952. Physical changes of connective tissue·s of beef during heating. Food Research 17 , 112 ·.

APPENDIX
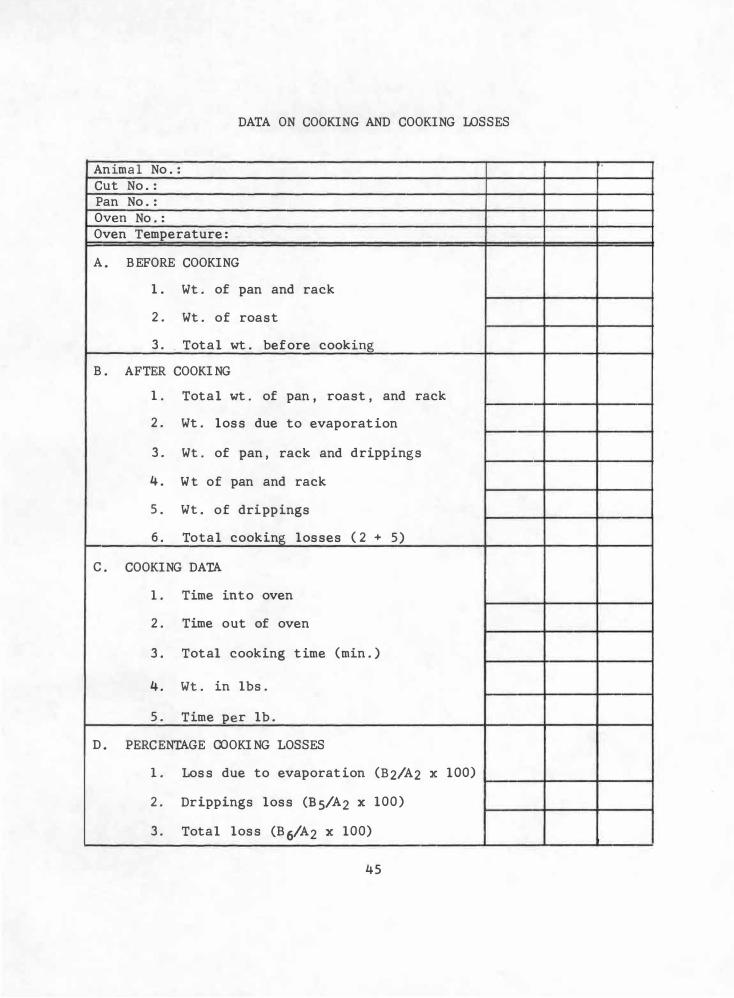
DATA ON COOKING AND COOKING LOSSES
An ima l No. : Cut No. : Pan No. : Oven No. : Oven Temperature:
A . BEFORE COOKING
1 . Wt. of pan and rack
2. Wt. of roast
3. . Total wt. before cooking
B. AFTER COOK! NG
1 . Total wt. of pan , roast , and rack
2. Wt. loss due to evaporation
3. Wt. of pan, rack and drippings
4. Wt of pan and rack
5. Wt. of drippings
6 . Total cooking losses (2 + 5)
c . COOKING DATA
1 . Time into oven
2. Time out of oven
3. Total cooking time (min.)
4. Wt. in lbs.
5. Time per lb.
D . PERCENTAGE CX>OKING LOSSES
1 . Loss due to evaporation (B2/A2 X 100)
2. Drippings loss (B 5/A2 x 100 )
3. Total loss (B 6/A2 x 100)
45
46
DATA ON COOKING AND COOKING LOSSES (CONTI NUED)
E. POWER CONSUMPTI ON
1 . F inal watt-hr. readigg
2 . Initial watt-hr. reading
3. Total watt-hr. consumed
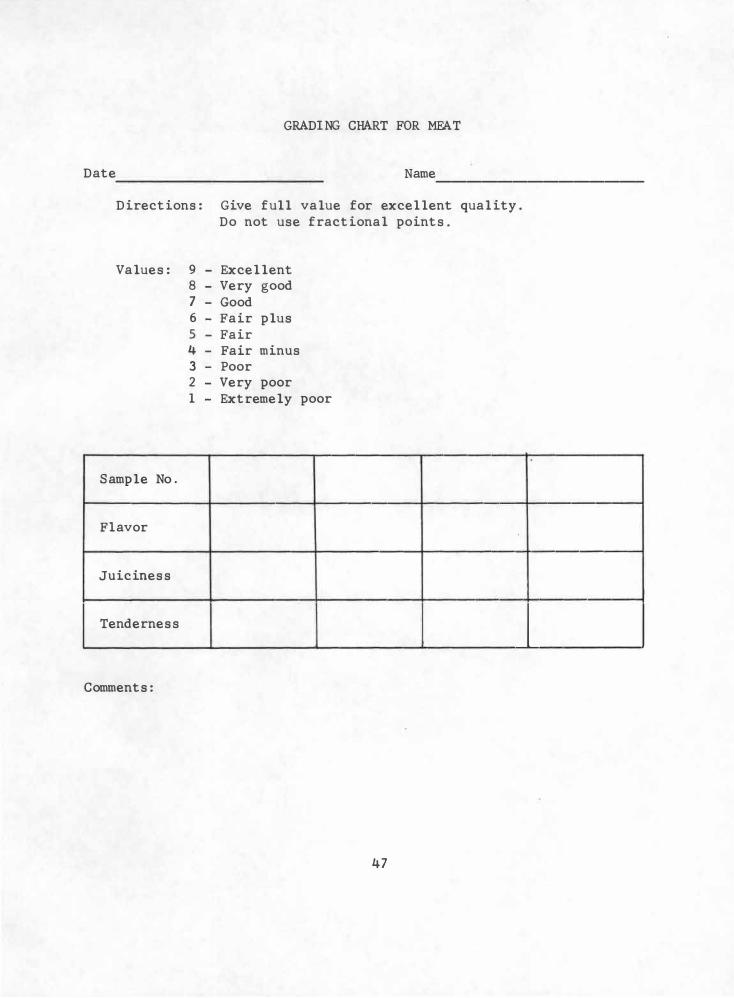
GRAD! NG CHART FOR MFA T
Date Name --------------
Directions: Give full value for excellent quality. Do not use fractional points.
Values: 9 - Excellent 8 - Very good 7 - Good 6 - Fair plus 5 - Fair 4 - Fair minus 3 - Poor 2 - Very poor 1 - Extremely
Sample No .
Flavor
Juiciness
Tenderness
Comments:
poor
47
l I