
TEN YEARS AFTER MAPUTO DECLARATION ON AGRICULTURE AND … · ten years after maputo declaration on...
49
TEN YEARS AFTER MAPUTO DECLARATION ON AGRICULTURE AND FOOD SECURITY: AN ASSESSMENT OF PROGRESS IN NIGERIA 09 BP 884 Ouagadougou 09 Tél. : (226) 50 36 08 25 E-mail : [email protected] / [email protected] ETUDE DU NIGERIA
Transcript of TEN YEARS AFTER MAPUTO DECLARATION ON AGRICULTURE AND … · ten years after maputo declaration on...

TEN YEARS AFTER MAPUTO DECLARATION ON
AGRICULTURE AND FOOD SECURITY:
AN ASSESSMENT OF PROGRESS IN NIGERIA
09 BP 884 Ouagadougou 09
Tél. : (226) 50 36 08 25
E-mail : [email protected] / [email protected]
ETUDE DU NIGERIA
Table of Contents
Acknowledgements
Acronyms
Executive Summary
1. Introduction
2. Methodology
3. Key Policies and Programmes
4. Mobilisation of Financial Resources
5. Institutional Changes
6. Agricultural Productivity Growth
7. Markets and Trade
8. Poverty and Food Security
9. Driving Factors and Bottlenecks Explaining Progress
10. Conclusions and Recommendations
Bibliography
Annex: Methodological Framework
ACRONYMS
ADPs Agricultural Development Programme AfDB African Development Bank AGEX Agriculture Exports AGIM Agriculture Imports AGPV Agriculture Production Value AGPSF Agriculture Policy Support Facility ARCN Agriculture Research Council of Nigeria ATA Agriculture Transformation Agenda ATAIC Agriculture Transformation Agenda Implementation Council CAADP Comprehensive Africa Agriculture Development Programme CBARDP Community-Based Agricultural and Rural Development Programme CBN Central Bank of Nigeria COFOG CSO Civil Society Organizations DFID Department for International Development ECDPM European Centre for Development Policy Management ECOWAP Economic Community of West African States’ Agricultural Policy ECOWAS Economic Community of West African States FADAMA FAO Food and Agriculture Organization FAO STAT Food and Agriculture Organization Statistics FCT Federal Capital Territory FGN Federal Government of Nigeria FMAWR Federal Ministry of Agriculture and Water Resources GDP Gross Domestic Product HNLSS Harmonized National Living Standard Survey IFAD International Fund for Agriculture Development IITA International Institute for Tropical Agriculture
MIRP Marketing Inputs Regional Project
MISTOWA Market Information System for Traders Organizations in West Africa MOFI Ministry of Finance Incorporated MOU Memorandum of Understanding MTSS Medium Term Sector Strategy NADF National Agriculture Development Fund NAIP National Agricultural Investment Plan
NAMIS Nigeria Agricultural Market Information Service NANTS National Association of Nigerian Traders NBS National Bureau of Statistics NEEDS National Economic Empowerment and Development Strategy NEPAD New African Partnership for Development NGOs Non-Governmental Organizations NIRDS National Integrated Rural Development Strategy NIRSAL Nigeria Incentive-Based Risk-Sharing Agriculture Lending

NLSS National Living Standard Survey NPC National Planning Commission NSFR National Strategic Food Reserve NSPFS National Special Programme for Food Security OEC Overall Efficiency PCU Project Coordinating Unit PIA Presidential Initiatives on Agriculture RAIP Regional Agriculture Investment Programme REPAD Regional Network for Research and Development ROPPA Network of Peasant Organizations and Agricultural Producers in West Africa RFIBP Rural Finance Institution Building Programme
RUSEP Rural Sector Enhancement Programme RTEP Root and Tuber Expansion Programme ReSAKSS Regional Strategic Analysis and Knowledge Support System TCH Technical Change TFPC Total Factor Productivity Change UNCTAD United Nations Center for Trade and Development USAID United States Agency for International Development USD United States Dollar WB World Bank

Executive Summary
1.0 Introduction
Nigeria is located on the gulf of Guinea in West Africa with an area of about 92.4 million hectares
consisting of 91.1 million hectares of land and 1.3 million hectares of water bodies. The agricultural land is
83.6 million, which comprises of 28.2 million hectares arable, 2 million hectares FADAMA/irrigable land,
2.5 million hectares permanent crops, 10.9 million hectares forest wood and 40 million hectares pastures
(Philip, 2008). It is 3,773 square kilometres within the tropical zone between latitudes 4o and 14o and
longitudes 2o20’N and 14o30’E extending northward from the coastline for over 1,046 kilometres (Olaloku
et al, 1979). Average rainfall ranges from about 500mm in semi-arid north to about 2500mm in the coastal
areas (ARCN, 2010). With a rapidly growing population of 154 million heads as at 2006 Census (NPC, 2008;
NBS, 2008) and then, 163 million heads in 2010 (NBS,2010); the country is one of the most populous
nations both on the African continent and worldwide. About 65% of the population is based in rural areas
and engages massively in agriculture.
Agriculture currently contributes about 42% to the Nigerian GDP and employs about 70% of the active
population (FMAWR, 2008; Akande, n.d.; Nwafor et al, 2011). Agriculture seems to be a major source of
economic growth as well as a provider of investment opportunities for the Nigerian private sector in
general and peasant (small-holder) farmers in particular. More than 70% of the farming population
consists of small-holder farmers who account for 81% of total land area cultivated, and 95% of agricultural
output (ARCN, 2010). Agriculture performs a wealth creation role, market contribution role, factor
contribution1 role and economic stabilization role as well as the role of mitigating the negative impacts of
external shocks. In fact, the growth of the agriculture sector determines the growth of other sectors of an
economy due to its potentials. Agriculture growth and development is indispensable for poverty reduction
and equitable prosperity (Eboh, 2011).
The Nigerian agriculture has faced myriads of challenges starting from losing its position as the mainstay of
the economy to massive neglect by governments - Federal, State and Local. In the early 1970s, agriculture
was still the mainstay of the economy contributing hugely to overall government revenue, foreign
exchange earnings, export base and employment due to commercial production and export sale of
commodities like palm oil, cassava, cocoa, timber, rice, yam, ground nut and millet.

This changed in the 1980s and 1990s as a result of structural adjustment programmes, in Nigeria as well as
in other African countries. Other challenges at present include having the highest poverty incidence (since
7 out of every 10 farming households are living below poverty line), the problem of crude farming system
of non-mechanization, poor quality implements, lack of defined consistent and robust agriculture policy at
all levels of government, poor private sector investment in the sector, poor access to bank credit facilities
for agriculture investment and poor budgetary provision at all levels of government. This led African Heads
of States and Government to change gears and adopt a Declaration on Agriculture and Food Security in
Maputo in 2003.
The African Union Heads of States and Governments agreed and declared in 2003 at Maputo, that member
nations devote at least 10% of their annual national budgets to agriculture within 5 years in order to
achieve CAADP core goal of revitalizing the agricultural sector and realise 6% agriculture growth annually.
The Comprehensive Africa Agriculture Development Programme (CAADP) is the agricultural component of
NEPAD, the African Union strategic framework for economic development (Alpuerto et al., 2009). Key
CAADP tools are national and regional agricultural investment plans (NAIP/RAIP) with the prime objective
of reducing poverty and hunger amongst the citizenry.
CAADP focuses on five pillars through which agricultural growth is to be achieved:
1. Expansion of the area under sustainable land management and reliable water control systems
2. Improvement of rural infrastructure and trade related capacities for improved market access
3. Enhancement of food supply and reduction of hunger
4. Development of agricultural research , technological dissemination and adoption to sustain long
term productivity growth
5. Sustainable development of livestock, fisheries and forestry resources

Against this backdrop, this study assesses the progress made in Nigeria towards the vision and
commitments of the 2003 Maputo Declaration on Agriculture and Food Security. This ex-ante and ex-post
analyses employs 2003/2004 NLSS and 2009/2010 HNLSS data.
The specific objectives are to:
i. examine agricultural policies and programmes
ii. analyse public spending on agriculture
iii. examine institutional changes affecting the formulation and implementation of agricultural policies
iv. analyse the evolution of agricultural productivity, markets and trade, and poverty and food security
situation
v. identify driving factors and bottlenecks explaining progress and, based on those, formulate
recommendations
First, we describe the methodology in section 2. In section 3, we review key agricultural policies and
programmes since 1995. Section 4 describes mobilization of resources. Section 5 explains institutional
changes. Section 6 explains agriculture productivity growth. Section 7 reviews market and trade. Section 8
explains poverty and food security situation in Nigeria. Section 9 discusses the driving factors and
bottlenecks explaining progress. Section 10 concludes and recommends for policy. Finally, the
appendix/annex contains detailed methodological framework.
2.0 Methodology
The study employed quantitative and qualitative descriptive analysis. Stakeholders’ viewpoints on
effectiveness of agricultural programmes and policies were elicited. The Malmquist index
introduced by Caves et al (1982) but developed by Fare et al (1994) shall be employed. The method
involves decomposing malmquist index into two components. First component measures t,
technical efficiency change and second component measures technological change between two
time periods. Malmquist productivity index calculation will measure two single periods and two
mixed ones (Jahanshahloo et al., 2011). If Malmquist index in periods 1 and 2 is less then unity,

then productivity would be said to have regressed but, if malmquist index is greater than unity,
then productivity would be said to have progressed. Malmquist index equal to unity implies that
there is no change in efficiency. Data were obtained from FMAWR, NBS MOFI and Budget Office.
Agricultural Productivity Policies in Nigeria
The federal government of Nigeria recognizes the importance of agriculture to the economy and as a result has
signed memorandum of understanding (MOU) with many agencies. For instance, in 2001 the federal government of
Nigeria collaborated with African Development Bank (ADB), United States Agency for International Development
(USAID), International Fund for Agricultural Development (IFAD), and World Bank (WB), to draft strategies on how to
improve the standard of living of rural dwellers through agriculture. As a result, community-based agriculture and
rural development programme was set up by the federal government to reduce poverty in rural areas. The
programme was to be implemented in four northern states. In the same year (2001), federal government got grants
from ADB, IFAD, World Bank, and Food and Agricultural Organization (FAO) to finance the “Review of Rural and
Agricultural Sector Institutions” to provide technical services to the agricultural sector. The review was conducted by
FAO and was finalized in 2003.
In 2004, the World Bank, African Development Bank, and Food and Agriculture Organization established the
“Agricultural Policy Support Facility (AGPSF)” to harmonize the activities of the various departments of the federal
ministry of agriculture and rural development and their contribution in the agricultural sector. In 2006, the “Rural
Finance Institution Building Programme (RFIBP)” was drafted by the federal government of Nigeria and IFAD. This
programme was meant to develop the tie between non-banking microfinance institutions and formal financing
institutions. The targeted beneficiaries included widows, rural entrepreneurs and the physically challenged people.
3.0 Key Agricultural Policies and Programmes since 1995
The Federal Government of Nigeria set a higher target 10 percent annual agricultural growth since
she had achieved the CAADP target of 6 percent. Besides CAADP, the country had formulated
policies like the NEEDS 1 (2003-2007) and NEEDS 11, the 7-Point Agenda (2008-2011). The sector
depends also on a three-year MTSS, the National Special Programme for Food Security (NSPFS),
FADAMA (I, II and III) and Root Tuber Expansion Programme (RTEP). The last three programmes
seem not to have achieved much in Nigeria due partly to poor management, poor implementation,

misallocation of resources and unnecessary politics. This has led to Nigeria being regarded as one
of the countries that are lagging behind in terms of budget allocation towards agriculture unlike
some other ECOWAS countries like Mali, Senegal, Burkina Faso, and some African countries namely
Malawi and Ethiopia.
Table 1: Level of Agricultural Investment as a Share of Total Expenditure as at 2007
At least 10 percent 5 percent to less than 10 percent Less than 5 percent
Burkina Faso2 Benin1 Botswana Ethiopia3 Chad4 Burundi4
Ghana1 Madagascar3 Cameroun3
Guinea4 Mauritania4 Central African Republic4
Malawi Mozambique3 Congo, Dem. Rep.3
Mali Namibia3 Cote d’Ivoire Niger2 Nigeria Egypt3
Senegal Sudan4 Gabon4
Swaziland3 Guinea Bissau4
Tanzania3 Kenya1
The Gambia4 Lesotho3
Togo Mauritius3
Tunisia3 Morocco3
Uganda1 Rwanda Zambia2
Zimbabwe3
Source: ReSKASS WP No. 28 (2009).
Before 1995, agriculture related policies did not clearly assign roles to both the public and private
sectors of the economy. Four distinct agricultural policy phases can be identified in Nigeria
(Manyong et al, 2005). However, discussion shall focus on post-SAP agricultural policies (between
1995 and 2013). The 1988 - 2000 agriculture policy showed some inconsistencies like lack robust
and coordinated policy instruments for effective implementation. The policy highlights government
position on agriculture product pricing, trade, exchange rate, agricultural extension, agriculture
credit and insurance and so on. In 2001, a new agricultural policy became operational. This policy
bears most of the features of the old one, but has more focused direction and better articulation
(IITA, 2005). A core feature of the policy was the assignment of clearly defined supportive roles to
the government while investments in the sector are to be left to private sector initiatives (FGN,
2006b).
The objectives of the new agricultural policy include:
Achieving self-sufficiency in basic food production and attaining food security,
Increased production and processing of export crops adopting improved production and
processing technologies,
Creating employment opportunities,
Rational use of agricultural resources; improved protection of agricultural land resources from
drought, desert encroachment, soil erosion and flood, and the general preservation of the
environment for sustainable agricultural production
Improving quality of life of rural inhabitants,
Promoting increased use of modern technology to agricultural production
The key features of the 2001 agriculture policy include:
Adopting strategies that will guarantee self-sufficiency and improved level of technical and
economic efficiency in food supply through the use of improved seeds and seed stock; use of
improved husbandry and appropriate machinery and equipment, value-for-money in the use of
resources, recognizing small-scale farmers as major food suppliers
Adoption of common and broad-based extension delivery system under the ADPs
Decrease of agricultural risks and uncertainties through effective agricultural insurance scheme
to minimize natural shocks against agricultural production and security of investment
Massive promotion of agro-allied industry so as to improve on the linkage impact of agriculture
on the overall economy

Provision of basic infrastructure, primary health care, cottage industries and banking facilities in
order to encourage agricultural and rural development.
Table 2: Agriculture Policy Environment in Nigeria: Stakeholders Critical Viewpoint and Assessment
Policy Assessment
1 Inputs : Fertilizer Highly adverse but with some positive developments: Fertilizer is
regularly subsidized for sale to farmers but it does not always
benefit the poor farmers. The new private ownership of the
national fertilizer company (NOTORE) is expected to yield positive
results
2 Inputs: Seeds Adverse: Provision is highly dominated by the public sector and is
inefficient. Private participation is growing.
3 Inputs: Herbicides etc Mildly Adverse: Poor availability and problematic existence of
adulterated and environmentally harsh and risky products is
worrisome. Prospects for improvement exist.
4 Access to finance Adverse: Low rate of credit lending to farmers due to a host of
institutional reasons.
5 Output market policies Favourable: This is highly dominated by private sector with less
government involvement.
6 Regulatory Policies and Enforcement Adverse: Poor enforcement of standards
7 Policies on trade in agricultural
products
Adverse: Poor support for agricultural exports.
Source: DFID (2003)

Table 3: New Agricultural Policy (2001)
Objectives
The overall goal is to attain self sustaining growth in all sub-sectors in agriculture and structural
transformation necessary for the overall socio-economic development of the country and the
improvement in the quality of life of Nigerians
1 Attainment of self sufficiency in basic food commodities
2 Increase in production of agricultural raw materials for the industrial sector
3 Increase in production and processing of exportable commodities
4 Modernization of agriculture production, processing , storage and distribution
5 Creation of more agricultural and rural employment opportunities to increase income of farmers and rural
population
6 Protection and improvement of agricultural land resources and preservation of the environment for
sustainable agricultural production
7 Establishment of appropriate institutions and creation of administrative organs to facilitate the integrated
development and realization of the country’s agricultural potentials.
Source: FGN (2006b)

Table 4: National Integrated Rural Development Strategy (2001)
Objectives Potential relevance to
CAADP Pillars
1 2 3 4 5
The overall goal is to raise the quality of life of the rural people,
alleviate rural poverty and use rural development to foster
national development.
1 Mobilization and empowerment of rural people to improve
quality of life and create wealth through increased agricultural
production, expansion of small and medium scale off-farm
enterprises and improve rural infrastructure.
X X X X X
2 Support to rural institutions to raise productivity, particularly
poor families, youths and women and at the same time, develop
their access to technical support services, inputs, credit and
markets.
X X
3 Improvement of human resource capacity of rural people through
appropriate training including adult literacy and technical skills
programs
X X X
4 Promotion of the development and improved management of
community based social and economic organizations to
undertake rural infrastructure development and maintenance
and support wider economic initiatives.
X X
5 Conservation and improvement of the physical environment as a
basis for sustainable development
X X X X X
6 Intensification of support specifically aimed at women and youth X X
Source: FGN (2006b)

Table 5: National Policy on Food and Nutrition (2005)
Objectives Potential relevance to CAADP
Pillars
1 2 3 4 5
The overall goal is to improve the nutritional status of all Nigerians with
particular emphasis on the most vulnerable groups i.e. children, women
and the elderly.
X
1 To improve food security at the household and aggregate levels to
guarantee that families have access to adequate (both quality and
quantity) and safe food to meet nutritional requirements for a healthy
and active life.
X
2 To enhance care giving capacity within households with respect to child
feeding and child care practices, as well as address the care and well
being of mothers.
X
3 To improve the provision of human services such as health care,
environmental sanitation, education and community development.
X
4 To improve the capacity within the country to address food and nutrition
problems.
X
5 To raise understanding of malnutrition in Nigeria at all levels of society,
especially with respect to its causes and possible solutions.
X
Source: NPC [2005]
Agriculture support strategies for increased production include the national special program on food
security (NSPFS), the presidential initiatives on agriculture and the 2nd FADAMA development project. The
aggressive strategies for market intervention include the commodity companies, the national strategic
food reserve project, input market development efforts fertilizer market stabilization scheme, and the
agriculture development fund. Other relevant strategies include the community development approach,

the market development, information and communication approach, the succession approach and the
development assistance/cooperation approach.
(a) National Special Program for Food Security.
The NSPFS became operational in 2002 with the objective of applying “innovative low cost approaches to
improving productivity and sustainability of agricultural systems with the ultimate aim of contributing to
food sufficiency and better livelihood of the poor rural farmers”(FGN 2006a). The programme covered 109
sites, one for each of the 109 senatorial zones in the country. Activities undertaken included: soil
conservation, improved varieties dissemination, introduction of improved practices, farm activities
diversification, and sustainable water harvesting techniques introduction, improved extension delivery,
reliable input system and pilot implementation of the voucher scheme for fertilizer subsidy administration
(Ayoola 2007).
(b) Presidential Initiatives on Agriculture
Some agricultural commodities were selected and targeted for special intervention by the Government so
as to improve agricultural output. These included initiatives on rice, vegetable oil, cassava, maize, cotton,
tree crops, livestock and fisheries, tropical fruits and allanblakia (FMARD 2007). The aim of each initiative
was to increase production for both local consumption and export. Each initiative got funding from the
Federal Government with defined targets and focused on specific commodities. The impressive growth of
the agriculture sector in the last few years has been partly due to the successful performance of these
initiatives which were focused on specific commodities unlike the NSPFS.
(c) The 2nd FADAMA Development Project
This project was planned to run between 2004 and 2009 (FGN 2006b). The main agricultural activities
embarked upon included provision of small scale irrigation facilities, investments in sustainable farm
practices, improving access to financial services, supporting community based resource management
programs using an integrated ecosystems approach. By 2007, it had succeeded in building 29km and 38km
of FADAMA and access roads, respectively, while 365 km of roads were rehabilitated (FMARD 2007). More

than 12,000 FADAMA user groups were formed. Other FADAMA activities successfully undertaken
included introduction of integrated fish-crop farming systems, control of erosion, introduction of new
technologies at the least-cost and commencement of an all year round vegetable production. By 2007, an
estimated 2.3 million FADAMA households had benefited from the increase in incomes arising from
services the project provided. Furthermore, the project had surpassed its goal of increasing the incomes of
participating users by 20% (PCU 2008b).
(d) National Strategic Food Reserve
The strategic grains reserve had the objectives, amongst others, of storing 5% of the country’s food
production for national and international emergencies and acting as a buyer of last resort (Eremie and
Ingawa 2006). Broadly, it was meant to foster more stability and information dissemination in the
agricultural produce market. Notable achievements of the initiative include building of new silos and on
farm storage structures, successful storing of products for release, production of 2100 units of fish
smoking cabinets and the successful release of grains to Nigerians, Nigeriens and Mozambiques as the
need arose (FMARD 2007).
(e) Fertilizer market stabilization scheme
Between 1999 and 2007, the Federal Government of Nigeria administered the importation of fertilizer
which was sold in the 36 states and FCT at 25% subsidy. The 36 States and FCT administration and their
ministries of Agriculture were also expected to further subsidize fertilizer. Unfortunately, most farmers
complained that the fertilizers were usually not available during the planting season when they were
needed. It is worthy to note that past governments had plans to stabilize the market.
(f) Input Market Development
Between 1999 and 2007 period, the Federal Government of Nigeria, collaborated with a number of
international agencies including the USAID and established projects which aimed at improving the
functioning of inputs’ markets (Ayoola 2007). One of the projects, for example, involved training of the
private sector in the marketing of inputs and advocacy with regard to quality standards (FMARD 2007).

According to Ayoola (2007) activities successfully undertaken include establishment of agri-input
associations which facilitated the participation of the private sector in fertilizer policy reform. Besides
encouraging the private sector activity in the inputs market, the FGN made aggressive efforts to increase
seeds availability through the National Seed Service. Between 1999 and 2007, the agency established the
New Rice for Africa (NERICA) demonstration plots in all the 36 states and FCT. The agency also distributed
560 MT of certified rice seed in the country (FMARD 2007).
(g) Agriculture Development Fund
In response to the low level and ad-hoc financing of the agriculture sector the National assembly passed a
bill to set up the Nigeria Agricultural Development Fund (NADF). The NAD fund was to be contributed from
many taxes and levies including the sugar levy, profit of oil companies, import duties and the annual
budgets (FMARD 2000). This initiative can increase the level of agricultural funding. Besides, the Federal
Government in collaboration with the financial sector and farmer associations mobilized additional funds
to be made available to farmers as loans at affordable interest rate.
(h) Community Development Approach
This refers to the Community Based Agricultural and Rural Development Program (CBARDP). A key feature
of the project is that it ‘involves the rural communities and the poor in project design and implementation
of field activities’ (FGN 2006b). Activities carried out under the program include the creation of sustainable
agricultural development groups and other community based groups, mobilizing groups for enterprise
promotion and participatory development strategies and financing rural infrastructure construction (PCU,
2008a).
(i) Market development and information approach
This involves projects mostly executed in conjunction with international development partners with the
aim of building information networks about the agriculture market including the seedlings market. The
activities include the Rural Sector Enhancement Program (RUSEP), the Nigeria Agricultural Market

Information Service (NAMIS), the Marketing Inputs regional project and the Market Information System for
Traders Organizations in West Africa (MISTOWA) project.
(j) Development Assistance and Cooperation method
This refers to efforts by Federal Government to work with international community to implement new
initiatives to improve agriculture outcomes. Between 1999 and 2007, the Federal Government of Nigeria
worked with the World Bank, International Fund for Agricultural Development, the FAO, the USAID, DFID,
CIDA and so on to implement agriculture programmes and agriculture policy reforms. According to Ayoola
(2007) notable initiatives under this period include the Comprehensive Africa Agriculture Development
Program (CAADP), the ECOWAS Agriculture Policy (ECOWAP) and South-South cooperation program which
involves tripartite agreements between FAO, China and Nigeria.
The Rural Finance in Nigeria (RUFIN)
The Central Bank of Nigeria issued a policy in 2005 for the setting up of microfinance banks specifically to finance
small scale entrepreneurs. The “Rural Finance Institution-Building Programme”, which was set up in 2006 by the
collaboration between the federal Government of Nigeria and IFAD was meant to exploit the microfinance objective
of financing small scale entrepreneurs in the rural area. The programme was divided into four segments:
development and strengthening of member-based rural microfinance banks; support to microfinance banks;
framework conditions for microfinance development; programme management; coordination, monitoring
and evaluation.
The National Agriculture Investment Plan (NAIP)
The NAIP was launched in the first half of 2010 under the CAADP process. It basically built on the ministry’s
normal medium term sector strategy (MTSS). It was to be implemented in the 2011 – 2014 period. Its
vision was to have a modern technology enabled agriculture sector that fully exploits the vast agricultural
resources of the country, ensures national food security and contributes significantly to foreign exchange
earnings. The plan had 5 components: Agricultural Productivity Enhancement, Support to Commercial
Agriculture, Land and Water Control, Linkages and Support to Inputs and Products Markets and

Programme Coordination, Monitoring and Evaluation. However, its implementation was eventually
overtaken by the initiation of the Agricultural Transformation Agenda. The NAIP was no longer focused on
as the key program of the government. The Agriculture Transformation Agenda (ATA) was drawn up as the
key program. Its implementation has commenced nationally and at the state level as well. Initially there
was an attempt to merge the NAIP and the ATA but this was not achieved.
The Agriculture transformation Agenda
The Agriculture Transformation Agenda (ATA) was launched in late 2011 as the agriculture sector’s
contribution to the Economic Transformation Agenda of the federal government. In essence, it has taken
the place of the NAIP as the medium term plan of the government for the 2011 – 2015 period. It aims at
creating wealth and jobs by driving agriculture growth through the value chain approach. In this approach,
all aspects of the value chain are focused on in order to ensure that no aspect of the chain causes a
disruption in the production, marketing and consumption process. In terms of approach, it has significantly
increased dependence on the private sector in the achievement of sector objectives. For example it has
significantly opened up the space for private sector operators to provide inputs to farmers by terminating
direct supply by the government. This public-private approach is pursued in all its plans including improved
storage facilities, increase in the number of rice processing mills in the country etc. It sees the role of the
government as that of creating an enabling environment for the private sector to provide necessary inputs
and services.
It targets making the country a hunger free nation and has specific performance targets up to the year
2015. For example, it aims to create 3.5 million jobs within key value chains and increase the production of
key staples by 20 million tonnes by 2015. Two key results achieved in 2012 were in the areas of improved
value addition to crops and improved access to inputs (NPC, 2013). Over 1.3 million MT of high quality
cassava flour has been produced in 2012. This is a considerable achievement compared to the virtual absence of
cassava flour. It has supported the production of ‘cassava bread’ which uses cassava flour mixed with wheat flour.
In terms of inputs, 1.5 million farmers received fertilizer through an innovative e-wallet. This is also a huge increase
compared to the near absence of fertilizer for farming purposes. The transparency of the process has also improved
the morale of farmers. Seedlings were also made available through the e-wallet. While the ATA has introduced

some good changes, stakeholders are expectant but sceptical as they believe that past government programs
have not yielded much result as they are abandoned halfway (Civil Society Communiqué, 2013).
The New Alliance
The NEW alliance for food security and nutrition is a G8 initiative designed to improve agriculture and food
security. It aims at helping 50 million people in sub-Saharan Africa emerge from poverty by 2022. Nigeria
became a member of the new alliance around June 2013. The new alliance aims at stimulating private
sector investments in order to achieve hunger and poverty reduction objectives. In this alliance, the
government commits to specific policy changes aimed at stimulating private sector investment in the
sector while local and international private investments and donors commit funds to investments which
will grow the sector. Although, the new alliance was designed to support the CAADP compacts in Africa, it
is unclear how it will be implemented given the weak commitment of the government to CAADP. However,
it is a clear signal that there will be increases in private sector investment in the sector if the government
can address the stated policy constraints.
4.0 Mobilization of Financial Resources
It appears the implementation of CAADP in Nigeria has not succeeded in increasing the share of agriculture
in the federal budget. In the pre-CAADP period of 1995 – 2003, the share of agriculture in the federal
budget ranged from 1.3% to 10.7% and had an average of 4%1. In the CAADP period of 2004 – 2013, it
ranged from 1.3% to 5% and had an average of 2%. It was actually higher in the period immediately
following the launch of CAADP and then it began to fall. Figure 2 below shows the nature of agriculture
funding in the country. The left axis and blue line indicate the share of the capital budget in total budget
while the red line and the right axis indicate the share of agriculture in the federal budget. In terms of the
structure of funding, the capital budget has been receiving a larger share for many years. The average
share of capital in the 2 periods was above 60%. While the share of the sector in the budget is falling, there
is a possibility for it to increase as legislators as well as the ministry have recently made calls for the
1 These figures are not based on the COFOG system. They are based on the budget of the ministry of agriculture and rural
development. They include crop, fishery and livestock expenditure but exclude forestry and irrigation expenditure which are
under other ministries.

MAPUTO target of 10% to be achieved. A further source of funding is the clear partnership the ministry is
forming with the local and international private sector in all aspects of the value chain. This has increased
private sector and market driven funding of agriculture sector activities for e.g. the supply of fertilizer.
Figure 2: Funding of Agriculture in Nigeria
0
10
20
30
40
50
60
70
80
90
100
1995 1996 1997 1998 1999 2000 2001 2002 2003 2004 2005 2006 2007 2010 2011 2012 2013
0.0
2.0
4.0
6.0
8.0
10.0
12.0
Agriculture capital/Total agriculture (%) Share of Agriculture in Federal budget (%)
Source: based on data from the Central Bank of Nigeria and the Ministry of finance (2013)
5.0 Institutional Changes
The CAADP focal person was appointed by the ministry of agriculture in the first quarter of 2006. It took
the form of assigning an existing member of staff as a desk officer for the CAADP process. During this time,
a technical committee was also formed mainly to guide the arrangements leading up to the roundtable,
and subsequently, the drafting of the National agriculture Investment Plan. This committee was funded
and received financial and technical support from development partners and the ministry. The CAADP
process was launched in the first quarter of 2006. With the support of the ReSAKSS and other partners the
stock taking, growth and investment analysis was completed in February 2009. By October 2009,
stakeholder workshops had been completed, the compact had been drafted and the roundtable was
organized. The compact was signed in the same month. The CAADP process is shown in the figure below.
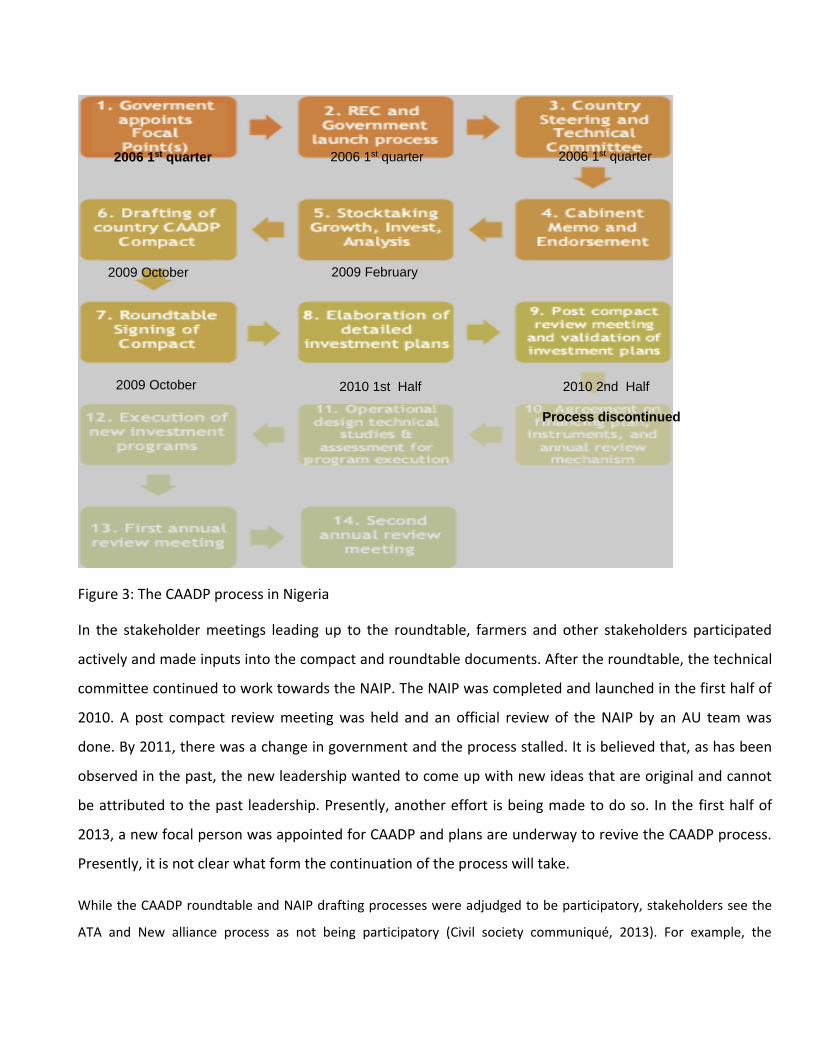
Figure 3: The CAADP process in Nigeria
In the stakeholder meetings leading up to the roundtable, farmers and other stakeholders participated
actively and made inputs into the compact and roundtable documents. After the roundtable, the technical
committee continued to work towards the NAIP. The NAIP was completed and launched in the first half of
2010. A post compact review meeting was held and an official review of the NAIP by an AU team was
done. By 2011, there was a change in government and the process stalled. It is believed that, as has been
observed in the past, the new leadership wanted to come up with new ideas that are original and cannot
be attributed to the past leadership. Presently, another effort is being made to do so. In the first half of
2013, a new focal person was appointed for CAADP and plans are underway to revive the CAADP process.
Presently, it is not clear what form the continuation of the process will take.
While the CAADP roundtable and NAIP drafting processes were adjudged to be participatory, stakeholders see the
ATA and New alliance process as not being participatory (Civil society communiqué, 2013). For example, the
2006 1st quarter 2006 1st quarter 2006 1st quarter
2009 February 2009 October
2009 October 2010 1st Half 2010 2nd Half
Process discontinued

meetings to discuss strategy were not announced to the general public. Only those contacted directly by the
ministry participate thus many are unaware of on-going activities and struggle to get information. In terms of inter-
departmental coordination, there have been significant improvements. At the presidential level, an inter-
ministerial committee which follows the broad guidelines of the CAADP inter-ministerial committee has
been established although it is not referred to as offshoot of CAADP. This committee, the Agriculture
Transformation Agenda Implementation Council (ATAIC) chaired by the President is tasked with providing
high level management for the sector. It is comprised of representatives of key ministries, state
governments and the private sector. However, there is no representative of small scale farmers or the civil
society on the committee. Still, it represents an opportunity to greater align the activities of key
stakeholders towards advancing the sector’s interests.
In terms of monitoring and evaluation, there has been a country wide improvement in the last 2 years.
Each minister has signed a performance contract with the president and has key performance indicators
(KPIs) which are being annually monitored by the National Planning Commission (NPC). At present a mid-
term score card for the Economic Transformation Agenda of the government has been released. This score
card includes a statement of the achievements of the agriculture sector. In the last 2 years, there has also
been a new ministerial reporting by the various ministries to the general public. This is being organized by
the Ministry of information. During this program which goes on for about a month, each minister reports
on the activities of his/her ministry and goes through a question and answer session from the general
public at the venue and also through social media. However, the mid-term reports as well as the
ministerial reporting sessions do not effectively evaluate performance against stated targets. At best only
a few targets are checked. A proper monitoring and evaluation (M&E) system which carefully documents
achievements at the inputs, outputs, outcomes and impact level is needed in order to effectively measure
performance. This would require detailed explanation of how data on achievements were estimated.
6.0 Agricultural Productivity Growth
Agricultural sector growth is necessary for growth in the aggregate economy. This is due to the fact that agricultural
growth contributes to poverty reduction. Empirical evidence supports this, for example, Irz and Roe (2000) and
Dasgupta (1998). These studies show that increased productivity in the agricultural sector leads to low price for
food. This low price increases the purchasing power of households which further trickles down to high standard of
living. Agriculture remains the driving engine needed to achieve growth in many African countries.
Total factor productivity growth has not changed when we compare the pre-CAADP to the CAADP period. The
annual change was 1.03 in the former and 1.02 in the latter. From another perspective, when we assess the yield
growth rates for key crops in the region, there appears to be deterioration in the CAADP period as shown below.

Figure k1: Overall Efficiency Versus Technical Change: 1995 - 2010
Figure k1 depict total factor productivity (TFPC) and overall efficiency (OEC) before and after Maputo. It is
worthy to note that it was for the greater part higher than overall efficiency during the period under
review. However, between 2000 and 2001 OEC seem to be marginally higher than TFPC. Maputo years
showed higher TFPC than OEC with the exception of 2007and 2009 when overall efficiency were less than
unity at respectively 0.928 and 0.887. Figure k2 plays same scenario for technical change. In 2003, TFPC
was 1.056, greater than unity, thus, productivity progressed. In 2010, TFPC was 1.105 greater than unity
implying also that progress in productivity.
Figure k2: Overall Efficiency and Total Factor Productivity Change: 1995-
2010

Figure k3 below depict the dynamics between average technical change and average total productivity
change before and after Maputo. While average overall efficiency (OEC) was unity for both pre-Maputo
and Maputo years, average technical change was higher in pre-Maputo years averaging 1.236 than after
Maputo with average 1.175. Total Average total factor productivity change was higher than unity but
almost same with pre-Maputo average (1.03) higher than Maputo average (1.02). In sum, for both pre-
Maputo and Maputo periods, productivity progressed since both the TFPC and technical were greater than
unity. The average TFPC (total factor productivity change) is 1.03 and 1.02 for pre-Maputo and Maputo
respectively. Also, average TCH (technical change) is 1.236 and 1.175 for pre-Maputo and Maputo
respectively. All of these are clearly depicted in figure k3 below.
Figure k3: Mean Technical Change and Average Total Factor Productivity Change: 1995-2003 and 2004-2010

Table: Simple average annual yield growth (%)
Items/Crops 1995 - 2003 2004 - 2011
Cassava 0.01 3.98
Cow peas, dry 3.98 2.38
Groundnuts, with shell 7.08 -1.54
Maize 2.37 0.95
Millet 4.55 -8.85
Rice, paddy 0.29 3.67
Sorghum 0.80 3.20
Sweet potatoes -1.42 0.98
Taro (cocoyam) 4.69 1.08
Yams -0.73 3.12
All crops above 2.16 0.90
Source: computed from FAOSTAT
7.0 Markets and Trade
Agricultural Production and Import-Export Trade
Nigeria is known for massive involvement in agricultural trade especially importation which is driven partly
by the motive to bridge the food supply as well as to satisfy the demand for foreign food items like rice.
The trade statistics presented in table 1 below suggest that the value of total agriculture production
trended upwardly between 1995 and 1998, but trended declined between 1999 and 2003. The decline in
agricultural production could be attributed to the transition to the agriculture initiative referred to as
“presidential initiatives on agriculture” (PIA) introduced in 2001 which became fully operational in 2002.
Both the share of imports in agriculture production and the share of exports in agriculture of production
were lower in the pre-Maputo years than after Maputo suggesting marginal improvement in trade.
Essentially agriculture export was on steady but marginal increase between 2004 and 2010. Figures 1a, 1b,
2a and 2b depict annual agricultural output and trade dynamics in table 1.
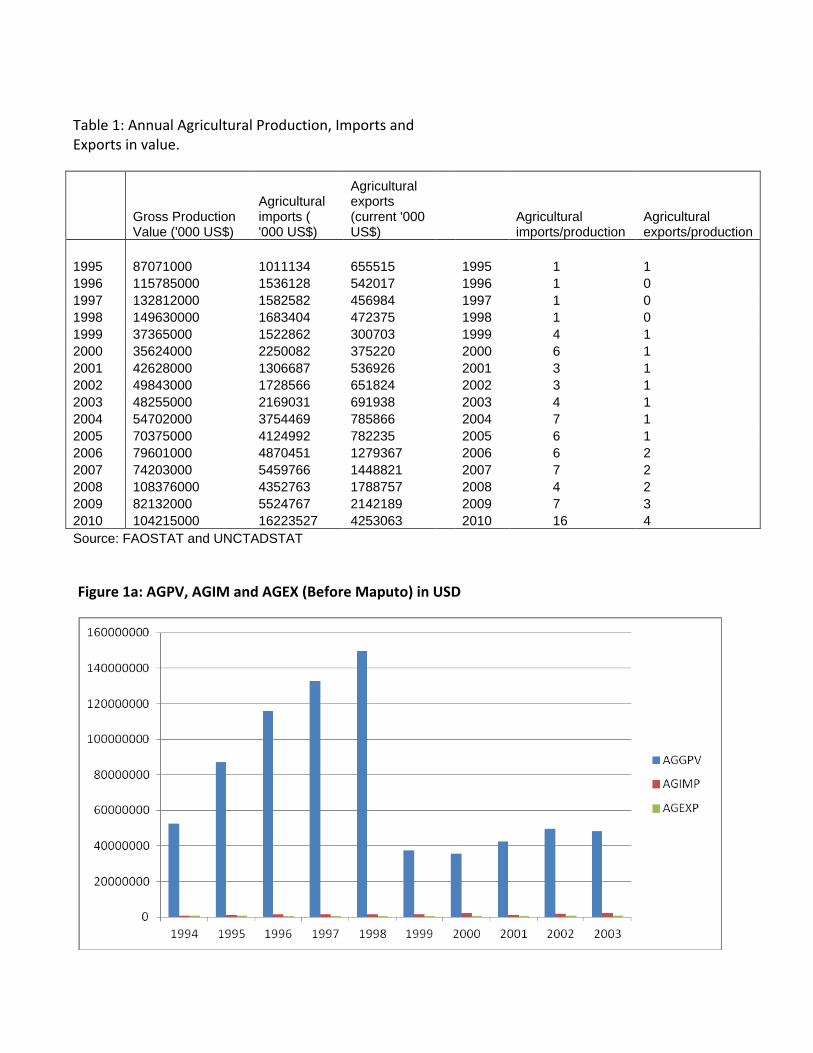
Table 1: Annual Agricultural Production, Imports and Exports in value.
Gross Production Value ('000 US$)
Agricultural imports ( '000 US$)
Agricultural exports (current '000 US$)
Agricultural imports/production
Agricultural exports/production
1995 87071000 1011134 655515
1995 1 1
1996 115785000 1536128 542017
1996 1 0
1997 132812000 1582582 456984
1997 1 0
1998 149630000 1683404 472375
1998 1 0
1999 37365000 1522862 300703
1999 4 1
2000 35624000 2250082 375220
2000 6 1
2001 42628000 1306687 536926
2001 3 1
2002 49843000 1728566 651824
2002 3 1
2003 48255000 2169031 691938
2003 4 1
2004 54702000 3754469 785866
2004 7 1
2005 70375000 4124992 782235
2005 6 1
2006 79601000 4870451 1279367
2006 6 2
2007 74203000 5459766 1448821
2007 7 2
2008 108376000 4352763 1788757
2008 4 2
2009 82132000 5524767 2142189
2009 7 3
2010 104215000 16223527 4253063 2010 16 4
Source: FAOSTAT and UNCTADSTAT
Figure 1a: AGPV, AGIM and AGEX (Before Maputo) in USD
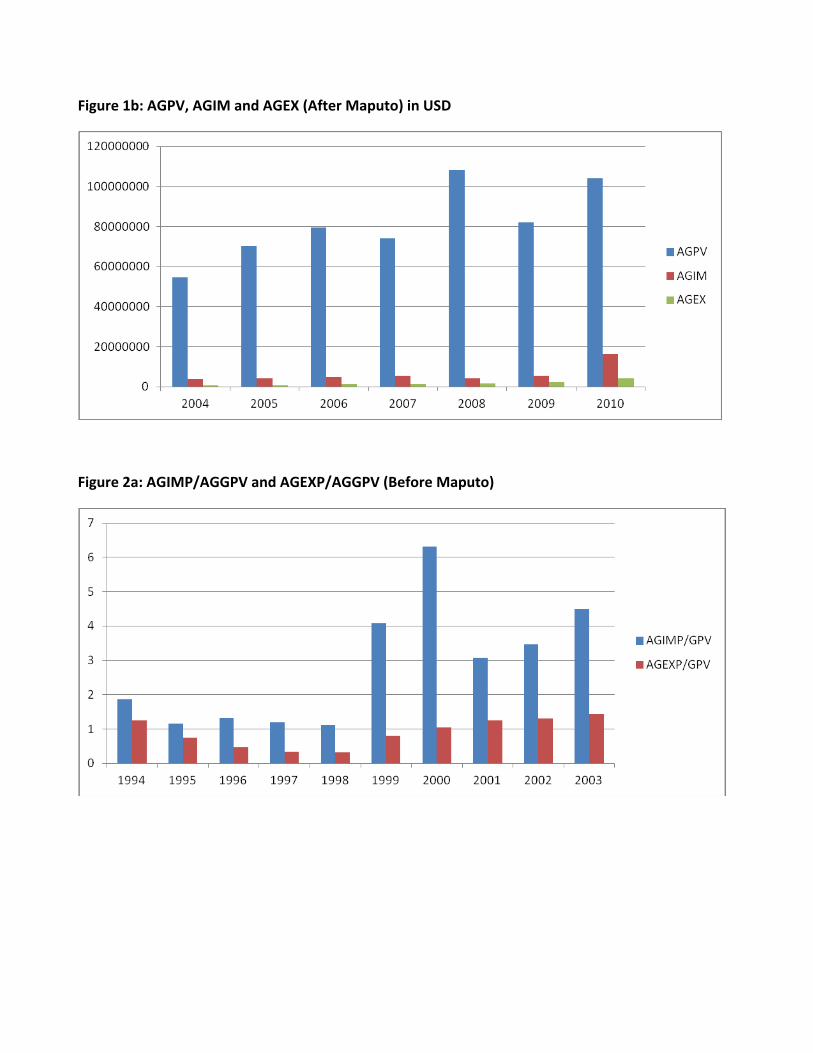
Figure 1b: AGPV, AGIM and AGEX (After Maputo) in USD
Figure 2a: AGIMP/AGGPV and AGEXP/AGGPV (Before Maputo)

Figure 2b: AGIMP/AGGPV and AGEXP/AGGPV (After Maputo)
Cereal Production and Import-Export Trade
Table 2: Annual cereal production, imports and exports in tonnes
Rice (Milled Equivalent) Maize Other cereals
year Production (tonnes)
Import (tonnes)
Export (tonnes)
Production (tonnes)
Import (tonnes)
Export (tonnes)
Production (tonnes)
Import Quantity (tonnes)
Export Quantity (tonnes)
1995 1947640 300902 0 6931000 27 615 12661600 737444 76554
1996 2082374 346539 0 5667000 19 526 12876000 923786 2000
1997 2179756 701157 0 5254000 4119 328 13331000 1199681 44002
1998 2184425 595843 0 5127000 19 9280 13638000 1574902 46774
1999 2185759 814895 0 5476000 19 1600 13652000 1676908 5442
2000 2199766 793574 0 4107000 6514 20284 13965000 2297671 9014
2001 1835584 1775939 13911 4596000 7749 5072 12742000 2254691 48227
2002 1952976 1241189 48511 4890000 33946 13104 13555000 2495263 38272
2003 2078372 1605598 1455 5203000 23886 8589 14417000 2317996 5491
2004 2223778 1405907 2 5567000 18387 29 15420000 2706584 3259
2005 2379189 1185755 4381 5957000 41225 2884 16507000 3836426 9230
2006 2696014 978354 2505 7100000 34198 6845 17722000 3354642 6387
2007 2125062 1246744 252 6724000 43736 11142 17261000 8339177 5906
2008 2787393 219029 46 7525000 16374 1749 18505000 1250304 4807
2009 2269527 219027 46 7338843 29425 1749 10241110 1279508 4824
1995/2003 2071850 908404 7097 5250111 8478 6600 13426400 1719816 30642
2004/2009 2413494 875803 1205 6701974 30558 4066 15942685 3461107 5736
Source: Calculated from FAO STAT (2013)

Trade in basic cereals seems to experience some improvements. Using FAO STAT, between 1995 and 2003,
the average quantity of rice imported was 908,404 tonnes which decreased to 875, 803 tonnes between
2004 and 2009. Consumers’ seemingly outright preference for foreign rice has not helped matters in
Nigeria. Export of rice is still a mirage possibly due to the low quality of rice produced in Nigeria. The
average quantity of rice exported out of Nigeria decreased from 7097 tonnes between 1995 and 2003 to
1205 tonnes between 2004 and 2009. The export of rice seems to require special domestic public policies
geared towards mechanization in order to address the twin problems of low quality and low output for
Nigerian rice to be competitive. Maize continues to perform better than rice in terms of markets and
trade. The quantity of maize exported before Maputo was 6600 tonnes, while export was 4066 tonnes
after Maputo. The total quantity of other cereals imported almost tripled after Maputo from 1,719,816
tonnes in 1995-2003 period to 3,461,107 tonnes in 2004-2009 period. Conversely, total exports of other
cereals decreased from 30,642 tonnes before Maputo to 5736 tonnes after Maputo. Furthermore, output
of all cereals increased from 20,748,361 tonnes before Maputo to 25,058,153 tonnes after Maputo
suggesting improvement. However, both import and export worsened. Import increased from 2,636,697
tonnes before Maputo to 4,367,467 after Maputo. The export of all cereals decreased from 44,339 tonnes
before Maputo to 11,007 tonnes after Maputo as clearly shown in table 3 below. On balance, trade figures
are not favourable.

Table 3: Annual cereal imports and exports/Total Cereals Output, imports and exports (in tonnes)
Rice (Milled)
Maize
Other cereals
Cereals (Total)
year
Import Quantity (tonnes)
Export Quantity (tonnes)
Import Quantity (tonnes)
Export Quantity (tonnes)
Import Quantity (tonnes)
Export Quantity (tonnes)
Output (tonnes)
Import Quantity (tonnes)
Export Quantity (tonnes)
1995 300902 0 27 615 737444 76554 21540240 1038373 77169
1996 346539 0 19 526 923786 2000 20625374 1270344 2526
1997 701157 0 4119 328 1199681 44002 20764756 1904957 44330
1998 595843 0 19 9280 1574902 46774 20949425 2170764 56054
1999 814895 0 19 1600 1676908 5442 21313759 2491822 7042
2000 793574 0 6514 20284 2297671 9014 20271766 3097759 29298
2001 1775939 13911 7749 5072 2254691 48227 19173584 4038379 67210
2002 1241189 48511 33946 13104 2495263 38272 20397976 3770398 99887
2003 1605598 1455 23886 8589 2317996 5491 21698372 3947480 15535
2004 1405907 2 18387 29 2706584 3259 23210778 4130878 3290
2005 1185755 4381 41225 2884 3836426 9230 24843189 5063406 16495
2006 978354 2505 34198 6845 3354642 6387 27518014 4367194 15737
2007 1246744 252 43736 11142 8339177 5906 26110062 9629657 17300
2008 219029 46 16374 1749 1250304 4807 28817393 1485707 6602
2009 219027 46 29425 1749 1279508 4824 19849480 1527960 6619
1995/2003 908404 7097 8478 6600 1719816 30642 20748361 2636697 44339
2004/2009 875803 1205 30558 4066 3461107 5736 25058153 4367467 11007
Source: Calculated from FAO STAT (2013)
In terms of simple annual growth rate (%) as shown in table 4 below, output of all cereals grew at 1%
before Maputo as against 7% after Maputo. In terms of trade, the average growth of imports of all cereals
grew at 15% before Maputo as against 4% after Maputo. The average growth of exports grew at 26%
before Maputo as against -2% after Maputo. Comparing cereals, maize seem to be competitive and best
improved with prospects of comparative advantage.

Table 4: Simple annual growth rate (%)
Rice (Milled) Maize
Other cereals
Cereals (Total)
year Output Imports Exports Output Imports Exports Output Imports Exports Output Imports Exports
1995 20 -14 0
-27 15 -12 -7 10 -13 -8
1996 7 15 -18 -30 -14 2 25 -97 -4 22 -97
1997 5 102 -7 21579 -38 4 30 2100 1 50 1655
1998 0 -15 -2 -100 2729 2 31 6 1 14 26
1999 0 37 7 0 -83 0 6 -88 2 15 -87
2000 1 -3 -25 34184 1168 2 37 66 -5 24 316
2001 -17 124 12 19 -75 -9 -2 435 -5 30 129
2002 6 -30 249 6 338 158 6 11 -21 6 -7 49
2003 6 29 -97 6 -30 -34 6 -7 -86 6 5 -84
2004 7 -12 -100 7 -23 -100 7 17 -41 7 5 -79
2005 7 -16 218950 7 124 9845 7 42 183 7 23 401
2006 13 -17 -43 19 -17 137 7 -13 -31 11 -14 -5
2007 -21 27 -90 -5 28 63 -3 149 -8 -5 120 10
2008 31 -82 -82 12 -63 -84 7 -85 -19 10 -85 -62
2009 -19 0 0 -2 80 0 -45 2 0 -31 3 0
Average (Median) growth
1995/2003 5 15 76 0 9 -27 2 11 -7 1 15 26
2004/2009 7 -14 -62 7 5 31 7 10 -13 7 4 -2
Source: Calculated from FAO STAT (2013)

Meat and Poultry Production and Import-Export Trade
Table 5: Annual meat and poultry production, imports and exports
Poultry Meat Other Meat
Meat (Total)
year Production (tonnes)
Import Quantity (tonnes)
Export Quantity (tonnes)
Production (tonnes)
Import Quantity (tonnes)
Export Quantity (tonnes)
Production (tonnes)
Import Quantity (tonnes)
Export Quantity (tonnes)
1994 168000 50
713006 769 0 881006 819 0
1995 169000 0
742267 6209 0 911267 6209 0
1996 170000 0
782014 7059 0 952014 7059 0
1997 171000 40
838192 7209 0 1009192 7249 0
1998 172000 40
867430 7455 0 1039430 7495 0
1999 172000 0
899986 6943 0 1071986 6943 0
2000 160000 6
893124 320 0 1053124 326 0
2001 183500 0
939204 2250 0 1122704 2250 0
2002 190000 4074
972291 2889 0 1162291 6963 0
2003 201000 1149
955085 3826 0 1156085 4975 0
2004 211000 217
988983 1823 0 1199983 2040 0
2005 218750 50
989513 1314 4 1208263 1364 4
2006 232100 168
991920 777 0 1224020 945 0
2007 243300 150
1033084 761 0 1276384 911 0
2008 243250 604
1069975 865 0 1313225 1469 0
2009 256500 636
1102594 891 0 1359094 1527 0
1995/2003 176500 590
876621 4907 1053121 5497
2004/2009 234150 304 1029345 1072 1263495 1376
Source : FAOSTAT (2013)
Table 5 above shows annual meat and poultry output, imports and exports between 1995 and 2009 using
FAO STAT data set. The average poultry meat supply before Maputo was 176,500 tonnes while the supply
after Maputo is 234,150 tonnes suggesting an increase. Total imports decreased from 590 tonnes before
Maputo to 304 tonnes after Maputo. There was no poultry meat export recorded. This might suggest that
poultry meat export is not viable in Nigeria. Other meat output declined from 4907 tonnes between 1995
and 2003 to 1072 tonnes between 2004 and 2009. It was only in 2005 after Maputo that an export of 4
tonnes of other meat was recorded suggesting unhealthy trade for the other meat category. In aggregate,
all meat supply decreased from 1,053,121 tonnes to 1,263,495 tonnes. However, all meat import
decreased from 5497 tonnes before Maputo to 1376 tonnes after Maputo.

Table 6: Simple annual growth rate (%)
Poultry Meat Other Meat Meat (Total)
year Production Imports Exports Production Imports Exports Production Imports Exports
1995 0.6 -100.0 4.1
3.4 658.1
1996 0.6
5.4 13.7 4.5 13.7
1997 0.6
7.2 2.1 6.0 2.7
1998 0.6 0.0 3.5 3.4 3.0 3.4
1999 0.0 -100.0 3.8 -6.9 3.1 -7.4
2000 -7.0
-0.8 -95.4 -1.8 -95.3
2001 14.7 -100.0 5.2 603.1 6.6 590.2
2002 3.5
3.5
3.5 209.5
2003 5.8 -71.8 -1.8 32.4 -0.5 -28.6
2004 5.0 -81.1 3.5 -52.4 3.8 -59.0
2005 3.7 -77.0 0.1 -27.9 0.7 -33.1
2006 6.1 236.0 0.2
1.3 -30.7
2007 4.8 -10.7 4.1 -2.1 4.3 -3.6
2008 0.0 302.7 3.6 13.7 2.9 61.3
2009 5.4 5.3 3.0 3.0 3.5 3.9
Average (Median) growth
1995 - 2003 1 -100 4 3 3 3
2004 - 2009 5 -3 3 -2 3 -17
The table 6 above show the simple annual growth rate of poultry meat, other meat and all meat between
1995 and 2009 computed using FAO STAT data set. Before Maputo, that is, between 1995 and 2003,
poultry meat production grew at 1 % before Maputo as against 5% after Maputo (2004-2009). Its import
grew at -100% before Maputo as against -3% after Maputo. No export trade was recorded suggesting that
it might not have taken place in the first place. Other meat output grew at 4% before Maputo as against
3% after Maputo. Import of other meat grew at 3% before Maputo as against -2% after Maputo.
Considering all meat, output grew at same rate of 3%, while import grew at 3% before Maputo as against -
17% after Maputo.

Trends in Agricultural Import and Export with the rest of ECOWAS
Table 7: Trends in agricultural imports and exports with ECOWAS and the rest of the World (AGRIC/TRADE)
Share of agriculture in total imports
Share of agriculture in total exports
Share of ECOWAS in total imports
Share of ECOWAS in total exports
Share of ECOWAS in total agriculture imports
Share of ECOWAS in total agriculture exports
1995 12 5 3 6 4 2
1996 16 4 3 6 5 3
1997 16 4 2 6 3 2
1998 17 5 3 7 3 3
1999 20 3 2 7 3 3
2000 17 1 2 5 5 2
2001 19 2 3 5 8 4
2002 17 3 3 6 3 18
2003 16 3 2 5 3 1
2004 15 2 2 5 2 5
2005 18 2 3 6 2 5
2006 16 1 3 5 2 2
2007 15 2 3 5 2 2
2008 11 2 3 5 3 2
2009 13 3 3 5 6 1
2010 12 2 2 5 5 2
2011 29 3 2 4 2 4
2012 21 2 2 4 2 3
Source:
Figure 7: Trends in Agriculture Imports and Exports with rest of ECOWAS and with the rest of the world (Share of agriculture in trade)

Figure 7.1a: Trends in Agriculture Imports and Exports with ECOWAS (Before Maputo)
Figure 7.1b: Trends in Agriculture Imports and Exports with ECOWAS (After Maputo)
From table 7, figure 7, figure 7.1a and figure 7.1b, it is clear that the share of agriculture in total imports
between 1995 and 2012 were all double digit figures. Before Maputo, the figures were high and on the
increase as against the years after Maputo which experienced high ratios but at moderately lower levels
with the exception of 2011 and 2012 which recorded higher ratios of 29 and 21 respectively.

The shares of agriculture in total exports are all single digit figures. Before Maputo, the shares were
moderate at an average of 3.33% as against 2.11% after Maputo.
Share of Processed Agriculture/Food Products in total Agriculture Exports
Figure 7.1c: Exports in USD [Nigeria – World: 1995-2003] Before Maputo
Figure 7.1d: Exports in USD [Nigeria – World: 2004-2012] After Maputo

Table 7.11: Exports in dollars, 1995-2012: Nigeria-ECOWAS
Exports in thousands of dollars, annual, 1995-2012 Nigeria - ECOWAS
Total all products
Food, basic (SITC 0 + 22 + 4)
Agricultural raw materials (SITC 2 less 22, 27 and 28) Agriculture Ag/ALL
1995 719636.6 12159.08 3107.509 15266.589 2 1996 985619.9 10510.556 7927.509 18438.065 2 1997 857593.6 7863.416 1264.452 9127.868 1 1998 712306.3 14143.131 1251.185 15394.316 2 1999 968559.6 11516.245 2122.925 13639.17 1 2000 1075430 4303.089 843.906 5146.995 0 2001 878063.6 15050.602 840.524 15891.126 2 2002 1142923 68212.121 27208.242 95420.363 8 2003 1212222 7776.388 622.925 8399.313 1 2004 2017038 34727.886 524.415 35252.301 2 2005 2569836 31457.513 7790.071 39247.584 2 2006 2840653 11340.032 1580.788 12920.82 0 2007 3098455 20958.244 4398.798 25357.042 1 2008 4491012 26696.368 1679.062 28375.43 1 2009 2967385 22900.389 1829.379 24729.768 1 2010 3977722 32520.408 1898.996 34419.404 1 2011 4398823 99699.436 62164.602 161864.038 4 2012 4963669 78214.608 22152.844 100367.452 2
Source: UNCTADSTAT

Figure 7.11a: Exports in USD [Nigeria – ECOWAS: 1995 - 2003] Before Maputo
Figure 7.11b: Exports in USD [Nigeria – ECOWAS 2004 – 2012] After Maputo

Table 7.12: Exports in dollars, 1995-2012 (Nigeria - World)
Total all products
Food, basic (SITC 0 + 22 + 4)
Agricultural raw materials (SITC 2 less 22, 27 and 28) Agriculture Ag/ALL
1995 12342000 367561.42 287930.318 655491.742 5 1996 16153600 340923.53 314591.909 655515.437 4 1997 15207300 291931.6 250085.587 542017.187 4 1998 9854900 322884.99 134099.486 456984.474 5 1999 13855600 348607.9 123766.925 472374.827 3 2000 20975000 185094.93 115608.181 300703.109 1 2001 18046078.73 282650.15 92569.865 375220.012 2 2002 18607065.93 432422.86 104503.063 536925.926 3 2003 24078329.29 573090.6 78733.708 651824.311 3 2004 38631000 575177.56 116760.523 691938.083 2 2005 45789352.32 649160.19 136705.851 785866.039 2 2006 59215233.33 534308.69 247926.262 782234.951 1 2007 66605950 1025486 253881.263 1279367.29 2 2008 81820518.37 1152703.8 296116.916 1448820.69 2 2009 56741900 1331411.3 457345.388 1788756.7 3 2010 86567912.53 1786471.3 355718.022 2142189.36 2 2011 125641031.2 1984211.8 2268851.62 4253063.44 3 2012 125092380.4 1873344.8 1046194.56 2919539.39 2
Source: UNCTADSTAT
Figure 7.12a: Exports in USD Nigeria – World 1995-2003 & 2004-2012

Table 7.13: Imports in $, 1995-2012 (Nigeria-World)
Imports in thousands of dollars, annual, 1995-2012 (Nigeria - World)
YEAR Total all products
Food, basic (SITC 0 + 22 + 4)
Agricultural raw materials (SITC 2 less 22, 27 and 28) Agriculture Ag/ALL
1995 8221500 903923.52 71472.641 975396.161 12
1996 6438400 957008.77 54125.2 1011133.97 16
1997 9501300 1458883 77245.204 1536128.22 16
1998 9211400 1514028.2 68553.769 1582581.98 17
1999 8587800 1593839.6 89564.197 1683403.76 20
2000 8721300 1471271.6 51590.457 1522862.1 17
2001 11586000 2101775.4 148306.493 2250081.93 19
2002 7547000 1251272.3 55414.4 1306686.69 17
2003 10853000 1658926.4 69639.801 1728566.2 16
2004 14163943 2083354 85677 2169031 15
2005 20753958.24 3613452.9 141016.39 3754469.28 18
2006 26522541 3946028.9 178962.683 4124991.61 16
2007 32357346.94 4637418.1 233032.853 4870450.95 15
2008 49950644 5063768.8 395997.29 5459766.06 11
2009 33906281.58 4102432.9 250330.165 4352763.09 13
2010 44235268.67 5225843.4 298923.843 5524767.26 12
2011 56000000 14619770 1603757.86 16223527.4 29
2012 51000000 9639989.6 905272.931 10545262.5 21
Source: UNCTADSTAT
Figure 7.13: Imports in USD Nigeria – World [1995-2003 & 2004 – 2012]
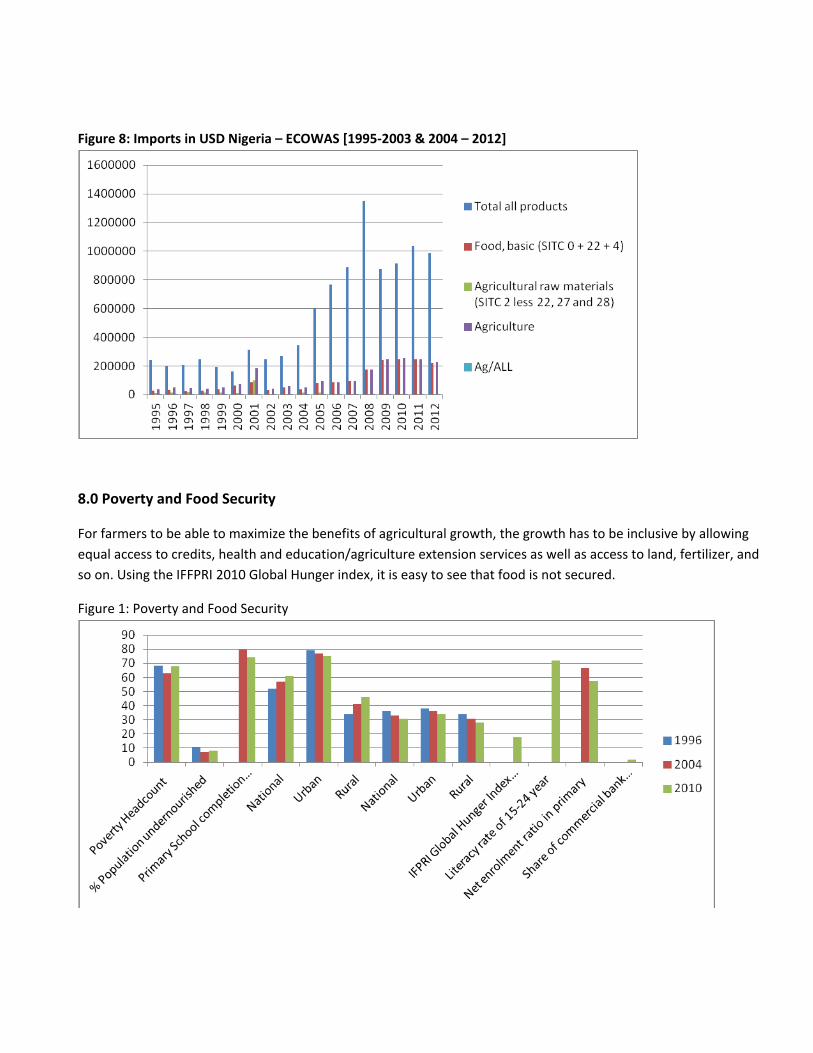
Figure 8: Imports in USD Nigeria – ECOWAS [1995-2003 & 2004 – 2012]
8.0 Poverty and Food Security
For farmers to be able to maximize the benefits of agricultural growth, the growth has to be inclusive by allowing
equal access to credits, health and education/agriculture extension services as well as access to land, fertilizer, and
so on. Using the IFFPRI 2010 Global Hunger index, it is easy to see that food is not secured.
Figure 1: Poverty and Food Security

Figure 2: Food Security and Poverty
Figure 3: Access to Financial Services: 2008, 2010 and 2012

Figure 4: Access to Financial Services 2008, 2010 and 2012
9.0 Driving factors and bottlenecks explaining progress
A key factor influencing progress is the change in the national and sectoral leadership. The willingness of
the national leadership to assign a technical expert as the minister and also allow freedom to implement
policy reform has been a major factor in recent progress noted. In the reform of the fertilizer supply
system, strong political will was required from the national leadership as this was a system from which
huge rents were obtained for over 3 decades. At the ministerial level, the willingness to withdraw from
various aspects of market activity and encourage private sector participation has improved results
significantly. For example, increased involvement of the private sector in fertilizer and seed distribution
has caused a national change in the ease with which inputs can be received. Although, there is room for
improvement, it is generally acknowledged that the input distribution system has never been more
transparent. While these are long awaited developments, the unclear procedure acquiring data on
achievements limits the assessment of how much progress is being made. However, the perception of the
general public is that the agriculture sector is becoming more transparent and private sector oriented. A
key constraint that remains to be addressed is the funding of the sector which is still low in terms of public
0
20
40
60
80
100
120
140
160
180
2012
2010
2008

and financial institutions support to the sector. This constraint will lead to lower growth rates than would
have been possible with the other positive changes occurring.
10 Conclusions and Recommendations
In terms of funding, productivity growth and poverty reduction, it appears that the CAADP period was
worse than earlier years. All 3 indicators worsened in the CAADP period. Although the performance was
worse, it should be noted that while there was strong commitment in the planning of CAADP in Nigeria,
there was lower commitment in its implementation. As such it is difficult to assess whether CAADP is
succeeding or not when commitment to its implementation is very low. Although, there is officially weak
commitment to it, there are CAADP-like organs which appear to be growing in the country (for e.g. the
Agriculture Transformation Implementation Council). However, there is strong drive by the present
leadership of the ministry to involve the private sector as much as possible in meeting sector targets. This
approach has achieved some significant results and is attracting more actors into the sector. Two areas
where attention is needed is in increasing the inclusiveness of the sector’s policy process and improving
the thoroughness of the monitoring and evaluation system. Small scale farmers, for example, should be
included in the agriculture transformation (ATA) implementation council and a more rigorous monitoring
evaluation system possibly involving research institutions and the National Bureau of Statistics should be
implemented.
REFERENCES
Afolabi M. O. (2007); “Rural-Urban Migration and Productivity in the Nigerian Agricultural Sector”,
Simon Fraser University Library, Burnaby, BC, Canada.
Alpuerto, V, Diao, X, Salau, S and Nwafor, M. (2009); Agricultural Investment for Growth and Poverty
Reduction in Nigeria, NSSP 001.
Appropriation Bill (2012); Budget Office of the Federation, Federal Ministry of Finance, Abuja.
ARCN, (2010), Agricultural Research Council of Nigeria: Strategic Plan 2011-2020.
CBN (2011); An Assessment of the Operations of the Presidential Initiatives on Agriculture in Nigeria:
2001-2007, Occasional Paper 40, Abuja.

Chukwu J. O. (2013); “2013 Budget: What do the Numbers Imply?”, MSc Lecture Slides.
DFID (2003), Promoting Pro-Poor Opportunities through Commodity and Service Markets;
Draft Programme Report Abuja; Quoted in AIAE (2004); Towards the ECOWAS Common Agricultural
Policy Framework: Nigeria Case Study and Regional Analysis. AIAE, Enugu.
Diao, X, Nwafor, M, Alpuerto, V, Akramov, K, Rhoe, V, and Salau, S (); Agricultural Growth and Investment Options for Poverty Reduction in Nigeria, IFPRI Discussion Paper, Washington D.C. Eboh, E. C. (2011); Agricultural Economy of Nigeria: Paradoxes and Crossroads of Multimodal Nature, 56th Inaugural Lecture of the University of Nigeria, Nsukka, January 27.
Eyo E. O (2008); “Macroeconomic Environment and Agricultural Sector Growth in Nigeria”;
World Journal of Agricultural Science 4(“6): 781-786
Fan, S, Omilola, B, and Lambert, M, (2009); Public Spending for Agriculture in Africa: Trends and
Composition, ReSAKSS Working Paper No. 28.
Fan, S, Yu, B, and Saurkar, A. (2008); Public Spending in Developing Countries: Trends, Determination,
and Impact. In Fan, S, (e.d.); Public Expenditures, Growth and Poverty: Lessons from Developing Countries;
Washington DC.
Fiscal Responsibility Act (2007), Act No. 31.
Irz, X. and T. Roe, (2000); “Can the World Feed Itself?” Some Insights from Growth Theory”. Agrekon.
Vol. 39, no. 4
Jeske, V, Dolly, A, and Rampa, F. (2012); Regional Approaches to Food Security in Africa; European Centre
for Development Policy Management Article NO. 128d.
Jonathan G.E, GCFR (2013), Budget 2013: “Fiscal Consolidation with Inclusive Growth”.
Manyong, V. M, Ikpi, A, Olayemi, J. K, Yusuf, S. A, Omonona, B. T, Okoruwa, V, and Idachaba, F. S. (2005);
Agriculture in Nigeria: Identifying Opportunities for Increased Commercialisation and Investment,
USAID/IITA/ UI Press.
Medium Term Expenditure Framework and Fiscal Strategy Paper 2012-2015

Melissa, L, Omilola, B, Shenggen, F. (2009): Public Spending for Agriculture in Africa: Trends and
Composition.
Mogues, T, Morris, M, Freinkman, L, Adubi, A, Ehui, S, Nwoko, C, Taiwo, O, Nege, C, Okonji, P, and Chete, L.
(2008); Agricultural Public Spending in Nigerhia. IFPRI Discussion Paper 789. Washinton, D.C: International
Food Policy Research Institute.
NBS (2007a), Annual Abstract of Statistics, Abuja.
NBS (2009), Annual Abstract of Statistics, Abuja.
National Economic Empowerment and Development Strategy (2005), the NEEDS Secretariat, National
Planning Secretariat, Abuja.
Nkamleu G. B, S. Kalilou and A. Zonon, (2008); “What Accounts for Growth in African Agriculture”.
American Journal of Agricultural and Biological Science 3(1): 379-388
Nwafor, M; E.C. Eboh; J.O. Chukwu and J.I. Amuka (2011); Cost Effective Agriculture Growth Options for Poverty Reduction in Nigeria: Evidence and Policy Implications; AIAE Research Paper No. 6, May 2011. Olalokun, F.A. et al (1979), Structure of the Nigerian Economy, Lagos: Macmillan
Publishers Ltd.
Philip, D. (2008); Constraints to Increasing Agricultural Productivity in Nigeria: A Review, NSSP Programme Background Paper, NSSP 001, IFPRI, Abuja. Regional Strategic Analysis and Knowledge Support System (); Agriculture Expenditure as Share of Total
Expenditure, ReSAKSS Database.
TAHRCA (2005); “Sustainable Funding of Agricultural Sector in Nigeria, Technical Assistance to the House of Representatives Committee on Agriculture”, Policy Brief No.2, August. World Bank (2008), World Development Indicators.

METHODOLOGICAL APPENDIX
Annexure 1: Total factor productivity growth
Year Overall Efficiency Change
Technical Change
Total Factor Productivity Change
1995 1 1.026 1.026
1996 1 1.051 1.051
1997 1 1.043 1.043
1998 1 1.034 1.034
1999 1 1.02 1.02
2000 1 0.984 0.984
2001 1 0.994 0.994
2002 1 1.035 1.035
2003 1 1.056 1.056
2004 1 1.063 1.063
2005 1 1.032 1.032
2006 1 1.04 1.04
2007 1 0.928 0.928
2008 1 1.07 1.07
2009 1 0.887 0.887
2010 1 1.103 1.103
Averages: 1995-- 2003 1 1.236 1.03
2004-2010 1 1.175 1.02
Source: REPAD Estimates


![Maputo Corridor Mar2007[1]](https://static.fdocuments.us/doc/165x107/55cf9d24550346d033ac69df/maputo-corridor-mar20071.jpg)


