Temporal Constraints on Holocene Initiation and ...
36
University of South Carolina Scholar Commons eses and Dissertations 12-15-2014 Temporal Constraints on Holocene Initiation and Termination of Mound Development at an Episodic Gas Hydrate and Cold Seep System, Woolsey Mound, Northern Gulf of Mexico Nathan Robinson University of South Carolina - Columbia Follow this and additional works at: hps://scholarcommons.sc.edu/etd Part of the Geology Commons is Open Access esis is brought to you by Scholar Commons. It has been accepted for inclusion in eses and Dissertations by an authorized administrator of Scholar Commons. For more information, please contact [email protected]. Recommended Citation Robinson, N.(2014). Temporal Constraints on Holocene Initiation and Termination of Mound Development at an Episodic Gas Hydrate and Cold Seep System, Woolsey Mound, Northern Gulf of Mexico. (Master's thesis). Retrieved from hps://scholarcommons.sc.edu/etd/ 3047
Transcript of Temporal Constraints on Holocene Initiation and ...
University of South CarolinaScholar Commons
Theses and Dissertations
12-15-2014
Temporal Constraints on Holocene Initiation andTermination of Mound Development at anEpisodic Gas Hydrate and Cold Seep System,Woolsey Mound, Northern Gulf of MexicoNathan RobinsonUniversity of South Carolina - Columbia
Follow this and additional works at: https://scholarcommons.sc.edu/etd
Part of the Geology Commons
This Open Access Thesis is brought to you by Scholar Commons. It has been accepted for inclusion in Theses and Dissertations by an authorizedadministrator of Scholar Commons. For more information, please contact [email protected].
Recommended CitationRobinson, N.(2014). Temporal Constraints on Holocene Initiation and Termination of Mound Development at an Episodic Gas Hydrate andCold Seep System, Woolsey Mound, Northern Gulf of Mexico. (Master's thesis). Retrieved from https://scholarcommons.sc.edu/etd/3047

TEMPORAL CONSTRAINTS ON HOLOCENE INITIATION AND TERMINATION OF
MOUND DEVELOPMENT AT AN EPISODIC GAS HYDRATE AND COLD SEEP
SYSTEM, WOOLSEY MOUND, NORTHERN GULF OF MEXICO
by
Nathan Robinson
Bachelor of Science
University of South Carolina, 2013
Submitted in Partial Fulfillment of the Requirements
For the Degree of Master of Science in
Geological Sciences
College of Arts and Sciences
University of South Carolina
2014
Accepted by:
James H. Knapp, Director of Thesis
Howie Scher, Reader
Robert Thunell, Reader
Lacy Ford, Vice Provost and Dean of Graduate Studies

ii
© Copyright by Nathan Robinson. 2014
All Rights Reserved.
iii
ACKNOWLEDGEMENTS
First I would like to thank my family and friends who provided support
throughout my educational experience, especially my mother Mary Louise Robinson and
my father Heyward Robinson. Special thanks to my undergraduate and graduate advisor,
Dr. James Knapp, who provided support and guidance throughout my collegiate career. I
would like to thank the Bureau of Ocean Energy Management and the Gulf of Mexico
Hydrate Research Consortium for providing data used in this project. I thank Dr.
Charlotte Brunner with The University of Southern Mississippi for providing access to
sediment cores and her assistant Franklin Williams in the sampling process. I thank Dr.
Wesley Ingram and Dr. Stephen Meyers for allowing the use of their oxygen isotope data.
I thank the Marine Sediments Research Lab at the University of South Carolina for
guidance through picking foraminifera, materials, facilities, and mass spectrometer usage.
Special thanks to my committee members Dr. Howie Scher and Dr. Robert Thunell for
advice and insight throughout the project. Finally, I would like to thank the students
from the Tectonics and Geophysics Lab and the Geophysical Exploration Lab for
fellowship and support.

iv
ABSTRACT
Woolsey Mound is a thermogenic gas hydrate and cold seep system in the
deepwater (900m) Gulf of Mexico. A set of sub-bottom seismic profiles acquired at MC-
118 Woolsey Mound provide decimeter-scale vertical resolution of the upper ~50m of the
subsurface throughout the lease block. Integration of these data with radiocarbon,
lithostratigraphic, and biostratigraphic data from shallow gravity cores provides the basis
for detailed interpretation of the mound evolution within the last 12,000 years. Uniform
sedimentation during the Last Glacial Maximum and following changes in sediment
distribution over MC-118 suggests modern mound activity did not begin until at least
~12ka. Development of the mound system appears to be related to salt tectonism, and
was characterized in sequence by (1) formation of NNE-trending folds (~10 m structural
relief), (2) shallow normal faulting (1-2 m apparent offsets), (3) subsea erosion of the
mound superstructure, and (4) deposition of a sedimentary drape across the entire modern
mound edifice. The base of the sedimentary drape sits in angular unconformity with the
underlying folded, faulted, and eroded strata, and is dated to be no younger than 4 ka,
suggesting the modern mound developed within a period of <8ka, and had assumed its
current configuration by 4 ka. If correct, the mound, and by analogy, the cold seep and
hydrate system, was entirely inactive until after the Last Glacial Maximum. These data
place the first quantitative temporal constraints on the development of an episodic
hydrate mound and associated cold seep system.

v
TABLE OF CONTENTS
ACKNOWLEDGEMENTS ........................................................................................................ iii
ABSTRACT .......................................................................................................................... iv
LIST OF FIGURES ................................................................................................................. vi
LIST OF ABBREVIATIONS .................................................................................................... vii
INTRODUCTION .....................................................................................................................1
CHAPTER 1: TEMPORAL CONSTRAINTS ON HOLOCENE INITIATION AND TERMINATION OF
MOUND DEVELOPMENT AT AN EPISODIC GAS HYDRATE AND COLD SEEP SYSTEM,
WOOLSEY MOUND, NORTHERN GULF OF MEXICO ................................................................2
REFERENCES .......................................................................................................................22
APPENDIX A: SUPPLEMENTARY DATA ................................................................................27

vi
LIST OF FIGURES
Figure 1.1 Location Map....................................................................................................15
Figure 1.2 Salt Dome and Master Faults ...........................................................................15
Figure 1.3 Seismic Analysis ..............................................................................................16
Figure 1.4 Isochore Sedimentation Map ............................................................................17
Figure 1.5 Sediment Core Locations .................................................................................18
Figure 1.6 Sediment Core Analysis ...................................................................................19
Figure 1.7 Geologic Sequence of Events ...........................................................................20
Figure 1.8 Radiocarbon Data Table ...................................................................................21
Figure A.1 Structural and Bathymetric Map Over Woolsey Mound .................................28
vii
LIST OF ABBREVIATIONS
LGM ................................................................................................. Last Glacial Maximum
MC-118 ...................................................................... Mississippi Canyon Lease Block 118
JPC .........................................................................................................Jumbo Piston Cores

1
INTRODUCTION
Deep-water cold seeps are geologic feature expressed by gas leaking through the
hydrate stability zone and to the seafloor. This process is observed in marine
environments worldwide (Judd and Hovland, 2007 and reference therein). These sites are
the interest of multiple disciplines because they may affect climate change by the release
of the potent greenhouse gas methane (Solomon et al., 2009, Dickens et al., 1995), and
ocean acidification by the release of hydrocarbons into the water column (Biastoch et al.,
2011). Furthermore, chemosynthetic life is dependent on the leaking gas, economical
concentrates of gas hydrates may be present where there are free gas conduits through the
hydrate stability zone (Nouze et al., 2004), and slope stability may be effected by gas
hydrate dissociation (Hornbach et al., 2007).

2
CHAPTER 1
TEMPORAL CONSTRAINTS ON HOLOCENE INITIATION AND TERMINATION OF
MOUND DEVELOPMENT AT AN EPISODIC GAS HYDRATE AND COLD SEEP
SYSTEM, WOOLSEY MOUND, NORTHERN GULF OF MEXICO
1.1 INTRODUCTION
Currently, cold seeps are temporally poorly understood on a long-term (hundreds
to millions of years) time scale (Bangs et al. 2013 ), but are better understood on a short-
term time scale (Bangs et al. 2013; Kannberg et al. 2013; Boles et al. 2001; Macelloni et
al., 2013). On a short-term time scale, cold seep flux of hydrocarbons are affected by
hydrate formation/dissociation, temperature and pressure variations exerted on the
systems, and temperature, salinity, and pressure variations within the system.
Addressing the long-term mechanisms controlling cold seeps, and the time-frame in
which cold seeps operate may provide insight into how these geologic features affect
climate change, chemosynthetic life, and ocean acidifications.
Favorable conditions for methane seepage have been proposed during sea-level
lowstands due to relatively low hydrostatic pressure on gas hydrates and seep systems
(Tong et al., 2013; Watanabe et al., 2008; Kiel et al., 2009; Teichert et al., 2003; Wirsig
et al., 2012). Other favorable conditions may include changes in bottom-water
temperatures that affect gas hydrates (Kiel, 2009) salt diapirism (Roberts and Aharon,
1994; Aharon et al., 1997; Feng et al., 2010; Roberts and Carney, 1997; Bian et al., 2013;
Roberts et al., 1990) and other structural/sediment deformation (Bangs et al., 2010;
3
Bayon et al., 2009a, Bayon et al., 2009b; Mazumdar et al., 2009). Methane
derived authigenic carbonates are often used as chronometers for methane seepage
(Kutterolf et al., 2008; Tong et al., 2013, Aharon et al., 1997 and references therein).
Previous studies have dated seepage by U/Th dating of these authigenic carbonates and
have found seepage activation to have occurred both within sea-level high and sea-level
lows (Aharon et al., 1997; Bayon et al., 2009; Kutterolf, 2008; Teichert et al., 2003;
Mazumdar et al., 2009; Feng et al., 2010; Liebetrau et al., 2010; Tong et al., 2013, Wirsig
et al., 2012). This study provides a unique approach of temporal constraints based off
integration of published sediment core data, radiocarbon, biostratigraphic, and δ 18O
isotopic data with high-resolution seismic data. An interdisciplinary approach of stable
isotope chemistry, sedimentology, and seismic analysis provides a dynamic
understanding of this system. This method provides an understanding of time-variant
mechanism affecting mound activity and geological forcing of seep activity.
Understanding the relationship between cold seep activity and sea level will provide
insight into the past and future of cold seeps and their relationship to tectonics.
1.2 REGIONAL SETTING
The Gulf of Mexico is a prolific hydrocarbon basin dominated by salt movement which
complicate subsurface structures and seafloor bathymetry. There are over 21,000 cold
seep sites (Shedd, 2012), and ~22,000 TCF of gas hydrates in the Gulf of Mexico
(Bosewell et al., 2012). Woolsey Mound is a cold seep site located on the continental
slope ~170 km south of Pascagoula, Mississippi and ~50 km from the Mississippi River
delta in the lease block Mississippi Canyon-118 (MC-118) (Figure 1). It is located on the
salt-dominated continental slope in ~900m water depth. MC-118 lease block has been

4
assigned by the Bureau of Ocean Energy Management as the long-term research reserve
for the Gulf of Mexico Hydrates Research Consortium and has a seafloor observatory
with a variety of apparatuses that measure biological, geochemical and geophysical data
associated with Woolsey Mound (Simonetti et al., 2013; Lutkne et al., 2006 and 2011;
Sassen et al., 2006; Ingram et al., 2010, 2013). The ~1km2 field exhibits features
diagnostic of a cold seep where hydrocarbon rich fluid migrate to the seafloor and create
authigenic carbonates, chemosynthetic communities, gas hydrates, natural gas vents, and
reefs (Woolsey et. al., 2005; Sassen et al., 2006; Macelloni et al, 2013, 2012; Sleeper et
al., 2006). Salt tectonics have generated an intricate network of faults (Figure 2), creating
hydrocarbon migration pathways for thermogenic gas from deep petroleum reservoirs up
to the seafloor (Macelloni et al., 2012; Sassen et al., 2006). Transient hydrocarbon
migration processes along the faults may lead to temporary instability for gas hydrates,
making Woolsey Mound a very dynamic setting. Gas hydrate/carbonate mounds formed
by cold seeps contain many structural and stratigraphic components that may be used to
evaluate time-variant mechanisms affecting cold seep related activity. Current short-term
hydrocarbon flux at Woolsey Mound is influenced by hydrates that have been collected
through cores along the faults and imaged with seismic (Macelloni et al., 2012, Simonetti
et al., 2013). This study attempts to address the long-term flux of hydrocarbons at
Woolsey Mound and will be compared with other cold-seep sites in the Gulf of Mexico.
1.3 MATERIALS AND METHODS
1.3.1 SEISMIC DATA
In 2005 C&C Technology Autonomous Underwater Vehicle Hugin 3000 collected 25 E-
W and 2 N-S lines CHIRP reflection lines over the MC-118 lease block with an E-W line

5
spacing of 200 meters. This CHIRP seismic data has a vertical resolution of ~0.1 m,
providing a very high resolution image of the subsurface. Acquisition parameters include
a frequency modulated between 2 and 8 kHz, a record length of 300 ms, and a 63-ms
sampling interval. Details about CHIRP collection can be found at Sleeper et al. (2006).
CHIRP seismic data was outputted in SEG-Y format and imported into Kingdom Suite
SMT for further analysis. A time-depth conversion was applied to the seismic data using
an average velocity of 1500 m/s in order to tie sediment cores with seismic data. There is
an uncertainty in the degree of precision, but this does not significantly change structural
and stratigraphic relationships. Depth converted seismic data was integrated with the
sediment cores and was used to relate seismic signatures with different lithologies and
ages, providing chronostratigraphic boundaries. This provides a mechanism to
understand sedimentation throughout the area in time. Temporal constraints on structural
and stratigraphic features of the mound system are inferred by dated horizons provided
by published sediment cores (Ingram et al. 2010, Ingram et al. 2013) and sediment core
analysis done through this project. Isochore maps are made by subtracting mapped
horizons depths from each other, revealing sediment thickness throughout the study area.
Comparing sediment thickness with the associated times of the horizons reveals
variations in deposition rates. Understanding these components can further constrain
mound activity and associated sedimentation surrounding the mound. Focus was given
on the shallow sediment and structure which appears to reveal operations of the most
recent phase of Woolsey Mound. Further seismic analysis of data collected over
Woolsey Mound can be found in Macelloni et al., (2012). Previous phases of mound
activity in the area is documented with deeper seismic data (Simonetti, Antonello, 2013).
6
1.3.2 “RED BAND” AND CHRONOSTRATIGRAPHY
Ingram et al. (2010, 2013) provides lithostratigraphy, biostratigraphy, and
chronostratigraphy for MC-118 shallow sediment cores. These studies provided insight
into sedimentation and stratigraphy surrounding Woolsey Mound (Ingram et al. 2010,
2013). Particular focus was given to a red band, identified by a negative δ18O excursion
and visibly red oxidized terrigenous sediment (Ingram et al. 2010, Ingram et al. 2013).
This band has been linked to the deglaciation and meltwater pulse 1A (Ingram et al.
2010, Ingram et al. 2013). Biostratigraphic and radiocarbon dates constrain deposition of
this ~1-2cm thick unit to ~14.5ky (Ingram et al. 2010). Meltwater pulse 1A was a period
of rapid sea-level rise during the latest sea-level transgression and occurred within ~14.5-
13 ky ago (Richard Fairbanks, 1989). The red band is marked by a distinct horizon in
the seismic data and was mapped throughout the study area as a key horizon.
1.3.3 AUTHIGENIC CARBONATES
Methane derived authigenic carbonates precipitate in deep water cold seep
settings and are used as an indicator of methane seepage. Anaerobic oxidation of methane
causes favorable conditions for authigenic carbonate precipitation (Bayon et al., 2009).
Authigenic carbonates are distinguishable from surrounding sediments because their high
acoustic impedance compared to unconsolidated slope sediments (Taylor et al., 2010).
Radiometric dating of authigenic carbonates has been used as a proxy for dating methane
seepage, but this type of study has not been done in our study area.
1.3.4 JUMBO PISTON CORES
Jumbo Piston Cores (JPC) were collected over the mound in January, 2011 to
acquire deep (up to 20 m b.s.f) geological, geochemical and geophysical data (Simonetti

7
et al., 2013). Specifically, these cores targeted locations with seismic indications of
hydrates, gas, and deep sediments of interest (Simonetti et al., 2013). JPC-3 (Figure 5, 6)
acts as a background control site, due to its location, being up-dip from the mound and
the least affected by mound activity, but still close to the mound. JPC-6 targeted a gas
chimney along a synthetic fault. Sediments recovered were slightly disturbed and gassy.
JPC-2 did not have free gas or gas hydrate and was collected to find the oldest
stratigraphic constraint with a 20 m core. This study will focus on the upper 2 meters of
these three cores, which record erosional and depositional processes of the most recent
mound activity.
1.3.5 δ 18O ANALYSIS
Oxygen stable isotope stratigraphy is based on the relationship between 18O
and 16O in a given sample. Foraminifera shells of calcium carbonate contain oxygen of
different isotopic composition depending on water salinity, temperature of surrounding
water, and the amount of water in ice sheets (Williams, 1984). Glacial-interglacial
paleoclimatic cycles, associated eustatic change, and relative dating can be done using
oxygen isotope analysis in the Gulf of Mexico. The 18O /16O of seawater becomes more
positive during glacial times due to Rayleigh Distillation of oxygen isotopes where more
light 16O molecules are being stored in glacial ice (Williams, 1984). These ratios become
more negative during interglacial periods when glacial water is returned to the oceans
(Williams, 1984). Glacial sediments are represented by more positive δ 18O values and
Holocene interglacial sediments have a stronger negative δ 18O isotope ratio (Williams,
1984). δ18O sediment core analysis was done using Isoprime stable isotope ratio mass
spectrometer. The upper 2 meters of JPC-2, JPC-3, and JPC-6 were sampled for 20 cc’s

8
at a 5 cm interval. Foraminifera were cleaned of fine-grained sediments using water and
a 63 micron sieve. The sediment was dried and picked for the species Globigerinoides
Ruber due to its presence throughout the Last Glacial Maximum (LGM) and the most
recent deglaciation. This species is then washed in methanol and sonicated. The
foraminifera are transferred to vials and put into the mass spectrometer. The mass
spectrometer ionizes the CO2 molecules into positively charged ions and separated into
different ion beams. The ratio of the beam intensities yields the 18O /16O ratio. δ 18O
values are reported relative to a universal powdered belemnite from the Cretaceous Pee
Dee Formation of South Carolina. δ 18O data from the Hat-03 core published in Ingram
et al. (2010, 2013) was given to us courtesy of Dr. Wes Ingram and Dr. Stephen Meyers
and is included in the results section.
1.3.6 BIOSTRATIGRAPHY
The species Globigerinoides Menardii repopulated the Atlantic ~7,000 years ago
(Broeker et al., 2014). This species was not present during the LGM or before until
Marine Isotope Stage 5 (Martinez et al., 2007). The presence of this species in the
shallow gravity cores is used as an indicator of deposition during the Holocene. This is
used in conjunction with oxygen stable isotope stratigraphy.
1.3.7 RADIOCARBON DATING
5 mg of planktonic foraminifera were picked from the sediment for radiocarbon
dating. Radiocarbon dating was done by Keck Carbon Cycle AMS Facility at UC Irvine
as fractions of the Modern standard, D14C, using the conventions of Stuiver and Polach
(1977). Backgrounds of sample preparation were subtracted based on measurements of
14C-free calcite.
9
1.3.8 SOURCES OF ERROR/UNCERTAINTY
The use of the constant time-depth conversion of 1500 m/s represents an
inaccuracy in isochore maps and depth to horizons. Lack of velocity data for the
sediment requires a time-depth conversion to be done based off a constant velocity which
is a misrepresentation of the actual velocity of the sediment. This sediment velocity
could be inaccurate which changes the depth to horizons and stratigraphic layers. By
correlating the red band in the sediment with the horizon picked as the red band in the
time-depth converted seismic data there is an inaccuracy of up to 30 cm between the
depth to horizon and depth to red band. The average inaccuracy of this was +/- 11%.
This could be a result using a constant time-depth conversion or sediment cores not
located directly on the seismic line collected or inclination of cores.
The methods of collecting sediment cores could cause mixing within the cores
and the cores may not be collected perpendicular to the seabed. An inclination of 30
degrees with a sample of interest at 2 meters depth could cause the sediment recovered to
appear to be from the depth of 2.3 meters. This could cause a mismatch between the
depth to the sediment of interests in the seismic and sediment sampled in the cores.
There is a degree of uncertainty in the radiocarbon data (Figure 8) and the process
of using different planktonic species could cause inaccuracies in the sediment time of
deposition. In sampling foraminifera for radiocarbon dating, there is bioturbation and we
may have sampled on the unconformity and as a result have sediment from both above
and below the unconformity used to radiocarbon date the gap in sediment, specifically
sample 3 from JPC-02 (Figure 6, 8).
10
1.4 RESULTS
1.4.1 EVIDENCE OF MOUND INITATION AFTER LAST GLACIAL MAXIMUM
Prior to deposition of the red band, or meltwater pulse 1A (Figure 3, 4), there is quiescent
sedimentation (Figure 4) and no evidence for recent methane derived authigenic
carbonates. After the red band there is a change in depositional patterns at MC-118 with
stratigraphic thinning onto the mound and the red band truncating the sea bed in an
angular unconformity (Figure 3). Bathymetric relief and structural components of the
mound (Figure 3, 4) appear to have developed after the deposition of the red band
because there is predominately uniform sedimentation prior to the red band and the faults
cut through the red band with uniform offset to the underlying stratigraphy (Figure 3).
Authigenic carbonates are present at the seabed, but there is no evidence for recent
authigenic carbonate deposition before the red band chronostratigraphic boundary.
Predominately uniform deposition over the study area is observed in the CHIRP data
throughout the LGM and prior to the LGM (Figure 4). After the LGM and deposition of
the red band, structural and stratigraphic features of the cold seep system were created.
Results based on integrating seismic data and published core data (Ingram et al., 2010,
Ingram et al., 2013) suggests tectonic activity and consequentially Woolsey Mound’s
initiation occurred within the last ~12ky after deposition of the red band (Figure 3, 4).
1.4.2 EVIDENCE OF SEDIMENTARY DRAPE AND TECTONIC TERMINATION
There is a shallow sedimentary drape visible in the seismic data that overlays
faults and eroded sediment on the mound and is in angular unconformity with the
underlying stratigraphy (Figure 3). The drape is in unconformity over the mound and
disconformity moving out of the uplifted mound area to a conformable surface further out

11
from the mound superstructure (Figure 3). The thickness of the drape varies from ~10 to
~30 cm over Woolsey Mound and most of the MC-118 lease block based off seismic, δ
18O, radiocarbon dates, and biostratigraphy (Figure 3, 4, 5, 6). δ 18O, radiocarbon dates,
and biostratigraphy of the JPC’s reveals glacial sediment unconformably overlain by
Holocene sediment, confirming the presence of a sedimentary drape (Figure 6). JPC-3
and Hat-03 δ 18O, and radiocarbon values show a conformable section and record the
sea-level transgression (Figure 6). The red band correlates in Hat-03 and JPC-03 with
spikes of more negative δ 18O values (Figure 6). The unconformable cores JPC-2 and
JPC-6 record sediments deposited during the LGM overlain by recent Holocene
sedimentary drape material without the visible red band (Figure 6). JPC-06 radiocarbon
dates suggest a gap of ~9.5kya over the unconformity (Figure 6). The JPC-02
radiocarbon dates do not effectively record the unconformity, likely due to bioturbation
of sediment, however biostratigraphy and δ 18O values record the unconformity. The
presence of the unconformity suggests that uplift and faulting is no longer occurring at
Woolsey Mound.
1.5 DISCUSSION
1.5.1 INITIATION OF THE WOOLSEY MOUND COLD SEEP SYSTEM
Though there are currently no radiometrically derived chronological data of authigenic
minerals at this site, chronostratigraphic and structural relationships provide a reliable
interpretation for cold seep activation. Previous Gulf of Mexico studies have dated cold
seeps by U/Th and radiocarbon dating of methane derived authigenic carbonates and have
found the timing of carbonate precipitation at cold seeps to vary (Bian et al., 2013, Feng
et al., 2010, Aharon et al., 1997). Woolsey Mound appears to have become active after
12
the LGM and into the most recent sea-level high stand. This signifies that the
depressurization of gas hydrates as a result of a decreased hydrostatic pressure and a drop
in sea level or changes in water temperatures during the LGM was not the trigger for
Woolsey Mound initiation. Based off correlating structural features of the mound and
the creation of hydrocarbon migration pathways through faults, salt-tectonism appears to
have been the trigger for mound initiation. High sediment input into the study area
(Ingram 2010) combined with a rise in sea level may have changed the stress field of the
subsurface near Woolsey Mound and caused the salt to move due to its unique rheology.
Salt may have been sourced from the submarine canyon observed in the NE corner of
MC-118 where there is faulting that appears to have occurred at the same time as
Woolsey Mound formation. Salt withdrawal from this area and subsequent Woolsey
Mound uplift may have created the migration pathways for this cold seep and gas hydrate
system to become active. Further constraints on mound initiation could be made by
radiometrically dating the authigenic carbonates present at Woolsey Mound. This would
provide the time at which methane flux and resulting authigenic carbonate precipitation
began and an archive of fluid flow at the hydrate and cold seep site.
1.5.2 GULF OF MEXICO COLD SEEPS
Roberts and Carney (1997) propose a model by which increased cold-seep
initiation is linked to salt tectonism, sea level, and sedimentation where salt movement is
a function of sea-level and sediment input in the Gulf of Mexico. Therefore, hydrocarbon
flux into the oceans and subsequently the atmosphere is affected by increased salt
movement in the Gulf of Mexico and may be related to sea-level fluctuations. In this
model, cold seep activation is a result of salt tectonism which creates the migration
13
pathways for thermogenically derived hydrocarbons to leak from reservoirs. Increased
sediment loading during the sea-level lowstand followed by a rise in sea level may cause
activation of salt tectonism due to changes in stress fields on underlying salt bodies in the
Gulf of Mexico. U/Th dating of Gulf of Mexico authigenic carbonates have identified
precipitation of authigenic carbonates at two deepwater cold seep sites between 12 and 13
ky. (Feng et al., 2010) which appear to have become active through this process. Aharon
et al. (1997) and Roberts et al. (1990) identifies other seep sites initiated following the
LGM at ~12 ky linked to similar processes. Chen et al. (2007) identified carbonate
precipitation during the middle Holocene attributed to fracture induced fluid flow from
thermogenic sources. Furthermore this increased in thermogenic hydrocarbon flux
associated with increased salt movement and sea-level has been observed at non-hydrate
bearing shallow (260 m b.s.f.) sites (Bian et al., 2013). This study provides structural
evidence of salt driven tectonic activity initiated seep flow within the last ~12ky that may
be linked to these processes. However, salt tectonics is a complicated process that may
not be affected by a uniform increase in hydrostatic pressure.
1.5.3 TECTONIC TERMINATION OF WOOLSEY MOUND COLD SEEP SYSTEM
AND CURRENT HYDROCARBON FLUX
Tectonic activity at Woolsey Mound appears to have occurred within a short
geologic time of <8ky and has since ceased (Figure 7). The presence of a sedimentary
drape that is not faulted is indicative of tectonic termination (Figure 3, 5, 6, 7). Based off
deposition rates (Ingram et al., 2010) and radiocarbon dates we expect this drape to have
been depositing over the mound and surrounding areas for ~4ky. Erosional processes are
interpreted to be related to deep sea currents visible in channels (Figure 3). The

14
unconformable sediment overlaying eroded sediment is indicative that these currents no
longer are significantly eroding the mound, suggesting that bathymetric relief is no longer
being created by salt tectonism and salt movement has ceased (Figure 3, 4, 6, and 7).
This is observable where there is visible offset on the fault leading up towards the
seafloor, but no fault scarp at the seafloor or through the sedimentary drape (Figure 3).
Since there is no active observable fault movement, current hydrocarbon flux through
faults to the seafloor may be controlled by hydrate formation/dissociation along theses
faults, reservoir sourcing, or other factors discussed by Macelloni et al. (2013) and
Simonetti et al. (2013).
1.6 CONCLUSION
This study constrains tectonic activity at a cold seep site, documenting the onset and
tectonic termination of mound activity. Tectonic activity, associated with the underlying
salt body, appears to be the reason for the onset of Woolsey Mound cold seep system.
This occurred after the LGM, within the last ~12ky and was therefore likely not caused
by the depressurization of gas hydrates during a sea level lowstand. This study provides
insight into the tectonic governance of thermogenic cold seep initiation. Documentation
of overlying unconformable sediment suggests quiescent tectonism at Woolsey Mound.
Short-term time variant hydrocarbon flux may be a result of hydrate
formation/dissociation, but initiation of hydrocarbon flux to the seafloor may be
attributed to salt driven seismic activity after the LGM.

15
FIGURES
Figure 1.1. Location map of Woolsey Mound (lease block MC118) on middle slope,
Northern Gulf of Mexico (Simonetti et al., 2013).
Figure 1.2. Salt dome ~300 m b.s.f. and master faults that act as migration pathways for
hydrocarbons to the sea floor where they form craters, authigenic carbonates, gas
hydrates and other stratigraphic features (Macelloni et al., 2012).
16
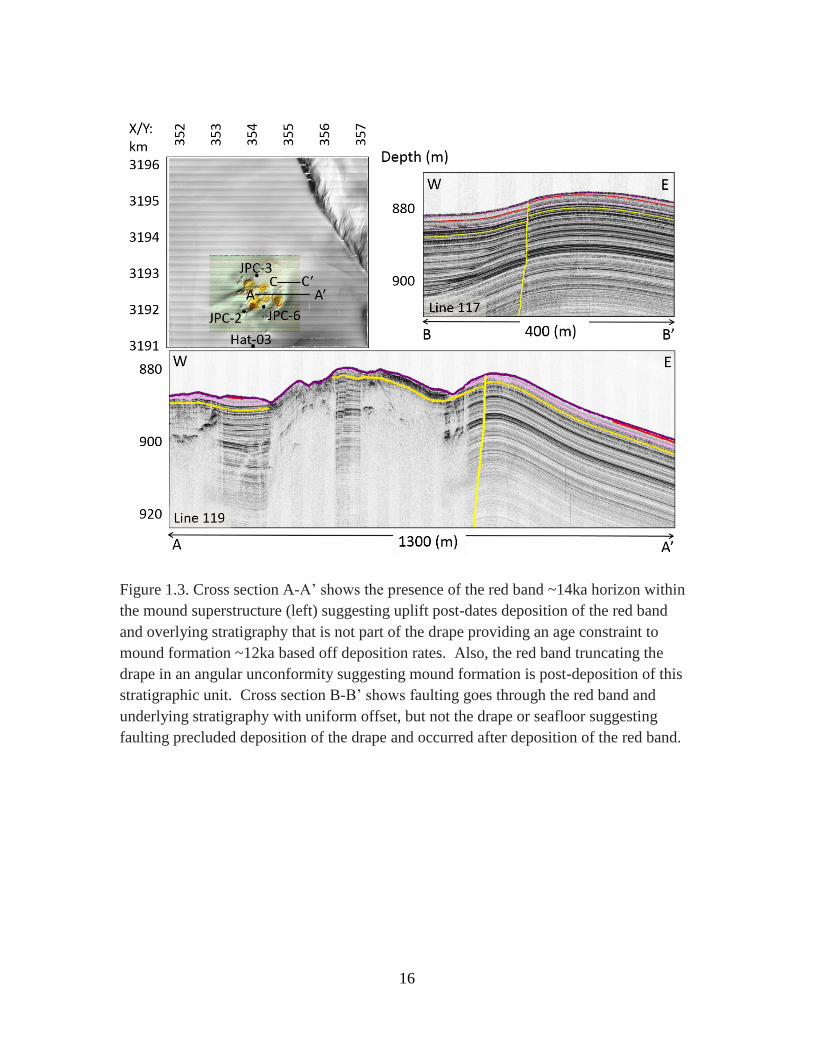
Figure 1.3. Cross section A-A’ shows the presence of the red band ~14ka horizon within
the mound superstructure (left) suggesting uplift post-dates deposition of the red band
and overlying stratigraphy that is not part of the drape providing an age constraint to
mound formation ~12ka based off deposition rates. Also, the red band truncating the
drape in an angular unconformity suggesting mound formation is post-deposition of this
stratigraphic unit. Cross section B-B’ shows faulting goes through the red band and
underlying stratigraphy with uniform offset, but not the drape or seafloor suggesting
faulting precluded deposition of the drape and occurred after deposition of the red band.

17
Figure 1.4. Isochore maps (true vertical thickness) for Late Pleistocene to Recent section
at MC-118 (exclusive of NE corner of lease block). Quiescent sedimentation prior to
deposition of “red band” (Left) ~19ka-14ka sedimentation showing a variance of only
~1m. ~14ka-present sedimentation showing a variance of ~4m and the truncation of the
red band with the seabed (Middle). Presence of drape over the entire mound indicates
erosional processes and tectonic uplift has ceased providing an age constraint of mound
termination to ~4ka (Right).

18
Figure 1.5. Projection on CHIRP profiles of four cores (Hat-3, JPC-2, JPC-3, and JPC-6)
analyzed for oxygen isotope stratigraphy, radiocarbon dating, and biostratigraphy.
Where preserved, red, yellow, and pink horizons are shown; base of drape shown in
purple, section appears conformable at locations of Hat-3 and JPC-3, but clearly
unconformable at locations of JPC-2 and JPC-6. Core locations relative to the mound
structure can be seen in Figure 3.

19
Figure 1.6. N-S core cross section over Woolsey Mound. δ 18 O data from G. Rubers
showing the unconformable sediment on Woolsey Mound (JPC-2 and JPC-6), the
deposition of the warm climate species G. Mernardii, and radiocarbon dates in calendar
age written in red with associated locations highlighted in red dots. Hat-03 oxygen
isotope stratigraphy and radiocarbon dates were provided by Dr. Wes Ingram and Dr.
Stephen Meyers. Hat-03 radiocarbon date of 4,162 calendar age does not have an
associated δ 18 O data point. G. Mernardii were picked to give biostratigraphic
constraint of warm climate deposition (Broeker et al., 2014). The horizons locations are
based off seismic data, and used to understand the extent of erosion. The red band is
visible within the sediment and is recorded based off its location within the sediment
cores. Seismic analysis suggests that JPC-6 has been eroded to a greater extent than
JPC-2 (Figure 5), but radiocarbon dates below the unconformity in these cores suggests
otherwise which may be related to sampling uncertainties discussed earlier.

20
Figure 1.7. Sequence of geologic events at Woolsey Mound in relation to sea level
(modified after Fleming et al, 1998). Modern mound activity began no earlier than ~12ka
and concluded no later than ~4ka based on the presence of the sedimentary drape.
Question marks represent an unknown age but known relative age, and dashed lines
represent a known age. The time of deposition associated with different horizons is
represented by color on the graph and the age of the pink and yellow horizons are based
off radiocarbon dates and expected sedimentation from Ingram et al., (2010).
21
Sample # 1 2 3 4 5 6
Core JPC-06 JPC-06 JPC-02 JPC-02 JPC-03 JPC-03
Depth (cm) 25 40 15 25 50 60
Sample weight for o18
and c13 analysis(mg)
5.5565 6.0125 5.521 5.6614 5.6832 5.1772
c13 1.645 1.518 1.151 1.462 1.172 1.03
o18 -1.693 -1.128 -2.542 -1.266 -2.744 -2.666
G. Mernardi Presence x o x o x o
Fraction Modern 0.574 0.2078 0.2859 0.1463 0.3714 0.2457
+/- 0.001 0.0008 0.0008 0.0007 0.001 0.0008
D14C -426 -792.2 -714.1 -853.7 -628.6 -754.3
+/- 1 0.8 0.8 0.7 1 0.8 14C age (BP) 4460 12620 1055 15440 7955 11275
+/- 15 35 25 45 25 30
Median Probability -2695 -12157 -9122 -16322 -6458 -10792
Calendar Age 4645 14107 11072 18272 8408 12742
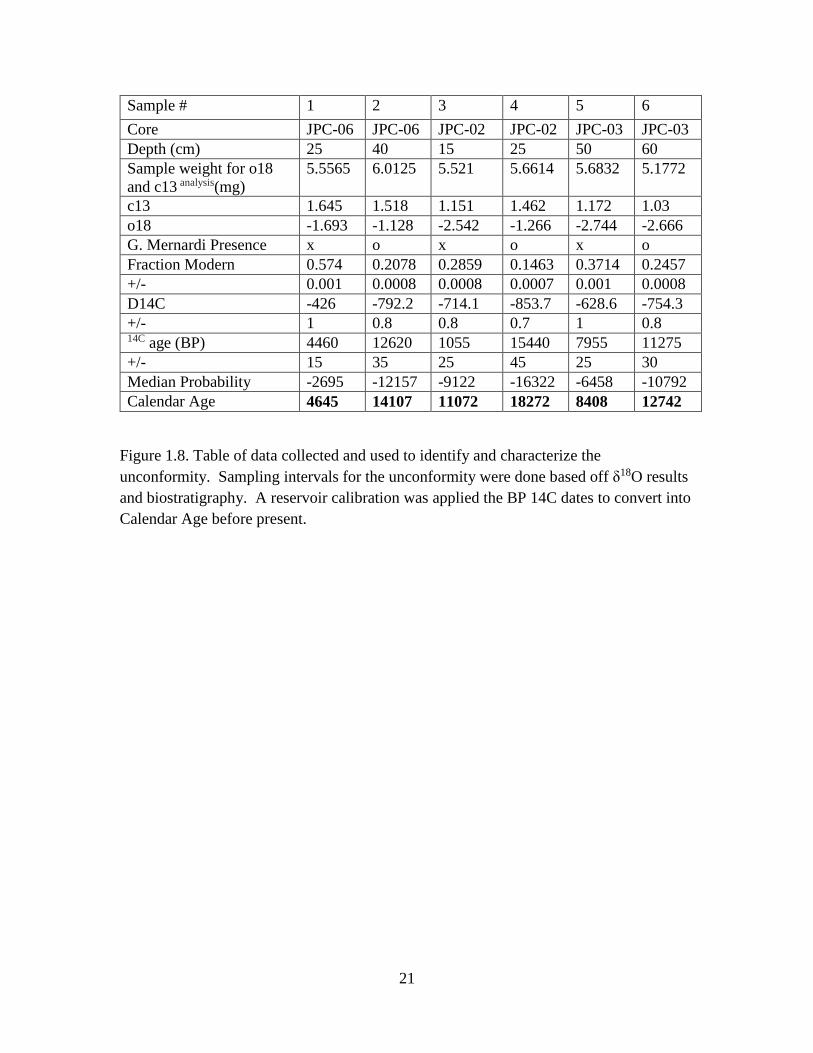
Figure 1.8. Table of data collected and used to identify and characterize the
unconformity. Sampling intervals for the unconformity were done based off δ18O results
and biostratigraphy. A reservoir calibration was applied the BP 14C dates to convert into
Calendar Age before present.
22
REFERENCES
Aharon, P., Schwarcz, H.P., Roberts, H.H., 1997. Radiometric dating of submarine
hydrocarbon seeps in the Gulf of Mexico. Geological Society of America Bulletin
109, 568-579.
Bangs, N.L., Hornbach, M.J., Berndt, C. 2013. The Mechanics of Intermittent Methane
Venting at South Hydrate Ridge Inferred from 4D Seismic Surveying Earth and
Planetary Science Letters, 310, 105-112
Bangs, N.L., Hornbach, Matthew, J., Moore, G.F., Park, O.J., 2010. Massive methane
release triggered by seafloor erosion offshore southwestern Japan. Geology, v. 38
no.11; p. 1019-1022.
Bayon, G., Henderson, G., Bohn, M., 2009a. U–Th stratigraphy of a cold seep carbonate
crust. Chemical Geology 260, 47–56.
Bayon, G., Loncke, L., Dupré, S., Ducassou, E., Duperron, S., Etoubleau, J., Foucher,
J.P., Fouquet, Y., Gontharet, S., Henderson, G.M., Huguen, C., Klaucke, I.,
Mascle, J., Migeon, S., Olu-Le Roy, K., Ondréas, H., Pierre, C., Sibuet, M.,
Stadnitskaia, A., Woodside, J., 2009b. Multi-disciplinary investigation of fluid
seepage on an unstable margin: the case of the Central Nile deep sea fan. Marine
Geology 261, 92–104.
Bian, Y., Feng, D., Roberts, H.H., Chen, D., 2013. Tracing the evolution of seep fluids
from authigenic carbonates: Green Canyon, northern Gulf of Mexico. Marine and
Petroleum Geology, 44, 71-81.
Biastoch, A., Treude, D., Rupke, L., Rievesell, U., Roth, C., Burwicz, E., B., Park, W.,
Latif, M., Boning, C., W., Madec, G., Wallmann, K., 2011. Geophysical
Research Letters, 38, L08602.
Boles, J.R., Clark, J.F., 2001. Temporal variation in natural methane seep rate due to
tides, Coal Oil Point area, California. Journal of Geophysical Research, 106,
27,077-27,086.
Boswell, R., Collett, T.S., Frye, M., Shedd, W., McConnell, D.R., Shelander, D., 2012.
Subsurface gas hydrates in the northern Gulf of Mexico, Marine and Petroleum
Geology,34 (1), 4–30.

23
Brooker, Wally, Leopoldo, Pena, 2014. Delayed Holocene Reappearance of G. menardii.
Paleocenography, doi: 10.1002/2013PA002590.
Brunner, C.A., 2011. Assessment of Cores from MC-118-0709, GC01, 02 and 04,
Department of Marine Science, The University of Mississippi (Unpublished)
Chen, Y., R. Matsumoto, C. K. Paull, W. Ussler, III, T. Lorenson, P. Hart, and W.
Winters 2007. Methane-derived authigenic carbonates from the northern Gulf of
Mexico-MD02 Cruise,
Journal of Geochemical Exploration, 95, 1 – 15, doi:10.1016/j.gexplo. 2007.05.011.
Dickens, G.R., O’neil, J.R., Rea, D.K., and Owen, R.M., 1995. Dissociation of oceanic
methane hydrate as a cause of the carbon isotope excursion at the end of the
Paleocene. Paleocenography 10:965-971.
Fairbanks, Richard, 1989. A 17,000-year glacio-eustatic sea level record: influence of a
glacial melting rates on the Younger Dryas event and deep-ocean circulation.
Nature, v. 342, 637-642.
Feng, D., Roberts, H.H., Cheng, H., Peckmann, J., Bohrmann, G., Lawrence Edwards, R.,
and Chen, D., 2010. U/Th dating of cold-seep carbonates: An initial comparison.
Deep-Sea Research II 57: 2055-2060.
Fleming, K., Johnson, P., Zwartz, D., Yokoyama, Y., Lambeck, K., Chappell, J., 1998.
Refining the eustatic sea-level curve since the Last Glacial Maximum using far-
and intermediate-field sites. Earth and Planetary Science Letters, 163, 327-342.
Hornbach, M., Lavier L., and Ruppel, C., 2007. Triggering mechanism and tsunamogenic
potential of the Cape Fear Slide complex, U.S. Atlantic coastal margin,
Geochemistry Geophysics Geosystems 8, Q12008
Ingram, W.C., Meyers, S.R., Brunner, C.A., Martens, C.S., 2010. Late-Pleistocene-
Holocene sedimentation surrounding an active seafloor gas-hydrate and cold-seep
field on the Northern Gulf of Mexico Slope. Marine Geology, 278, 43-53.
Ingram, W.C., Meyers, S.R., Martens, C.S. 2013. Chemostratigraphy of deep-sea
Quaternary sediments along the Northern Gulf of Mexico Slope: Quantifying the
source and burial of sediments and organic carbon at Mississippi Canyon 118.
Marine and Petroleum Geology, 46, 190-200.
Judd, A.G., Hovland, M., 2007. Seabed Fluid Flow Impact on Geology Biology, and the
Marine Environment. Cambridge University Press, Cambridge, UK.
Kannberg, P.K., Trehu, A.M., Pierce, S.D. Paull, C.K., Caress, D.W. 2013. Temporal
variation of methane flares in the ocean above Hydrate Ridge, Oregon. Earth and
Planetary Science Letters, 368, 33-42.

24
Kiel, Steffen, 2009. Global hydrocarbon seep-carbonate precipitation correlates with
deepwater temperatures and eustatic sea-level fluctuations since the Late Jurassic.
Terra Nova 21, 279–284.
Kutterolf, V., Libetrau, V., Morz, T., Freundt, A., Hammerich, T., Garbe-Schonberg, D.
2008. Lifetime and cyclicity of fluid venting at forearch mound structures
determined by tephrostratigraphy and radiometric dating of authigenic carbonates,
Geology, v. 36, 707-710.
Liebetrau, V., Eisenhauer, A., Linke, P., 2010. Cold seep carbonates and associated cold-
water corals at the Hikurangi Margin, New Zealand: New insights into fluid
pathways, growth structures and geochronology. Marine Geology, 272, 307-318.
Lutken, C.B., Brunner, C.A., Lapham, L.L., Chanton, J.P., Rogers, R., Sassen, R.,
Dearman, J., Lynch, L., Kuykendall, J., Lowrie, A., 2006. Analyses of core
samples from Mississippi Canyon 118, paper OTC 18208. In: Presented at the
Offshore Technology Conference. American Association of Petroleum Geologist,
Houston, TX.
Lutken, C.B., Macelloni, L., Sleeper, K., et al., 2011. New Discoveries At Woolsey
Mound, MC118, Northern gulf of Mexico Proceedings of the 7th International
Conference on Gas Hydrates (ICGH 2011), Edinburgh, Scotland, United
Kingdom, July 17-21, 2011.
Macelloni, L., Brunner, C.B., Caruso, S., Lutken, C.B., D’Emidio, M., Lapham, L.L.,
2013. Spatial distribution of seafloor bio-geological and geochemical processes as
proxies of fluid flux regime and evolution of a carbonate/hydrates mound,
northern Gulf of Mexico. Deep-Sea Research I, 74, 25-38.
Macelloni, L., Simonetti, A., Knapp, J.H., Knapp, C.C., Lutken, C.B., 2012. Multiple
resolution seismic imaging of a shallow hydrocarbon plumbing system, Woolsey
Mound, Northern Gulf of Mexico. Marine and Petroleum Geology (2012), 38,
128-142.
Martinez, J.L., Mora, G., Barrows, T.T., 2007., Paleocenographic conditions in the
western Caribbean Sea for the last 560 kyr as inferred from planktonic
foraminifera, Marine Micropaleontology., 64, 177-188.
Mazumdar, P.A, Dewangan, H.M., Joao, A., Peketi, V.R., Kholsa, M., Kocherla, F.K.,
Badesab, R.K., Josh, P., Roxanne, P.B., Ramamurty, S.M. Karisiddaiah, D.J.,
Patil, A.M., Dayal, T., Ramprasad, C.J., Hawkesworth, R. Avanzinelli, 2009.
Evidence of paleo-cold seep activity from the Bay of Bengal, offshore India.
Geochemisty, Geophysics, Geosystems, 10, Number 6.

25
Nouze’, H., Henry, P., Noble, M., Martin, V., and Pascal, G., 2004. Large gas hydrate
accumulations on the eastern Nankai Trough inferred from new high resolution 2-
D seismic data. Geophysical Research Letters, 31,
Roberts, H.H., Carney, R.S., 1997. Evidence of episodic fluid, gas, and sediment venting
on the northern Gulf of Mexico continental slope. Economic Geology 92, 863-
879.
Roberts, H., Aharon, P., 1994. Hydrocarbon-derived carbonate buildups of the northern
Gulf of Mexico continental slope: a review of submersible investigations. Geo-
Marine Letters 14, 135–148.
Sassen, R., Roberts, H.H., Jung, W., Lutken, C.B., DeFreitas, D.A., Sweet, S.T.,
Guinasso Jr., N.L., 2006. The Mississippi Canyon 118 Gas Hydrate Site: a
Complex Natural System. Paper OTC 18132 Presented at the Offshore
Technology Conference, Houston, TX.
Shedd, W., Boswell, R., Frye, M., Godfriaux, P., Kramer, K., 2012. Occurrence and
nature of “bottom simulating reflectors” in the northern Gulf of Mexico J. Marine
and Petroleum Geology, 34, pp. 31–41
Simonetti, A., Knapp, J.H., Sleeper, K., Lutken, C. B., Macelloni, L., Knapp, C,C., 2013.
Spatial Distribution of Gas Hydrates from High-Resolution Seismic and Core
Data, Woolsey Mound, Northern Gulf of Mexico. Marine and Petroleum
Geology, 44, 21-33.
Simonetti, Antonello, 2013. Spatial and Temporal Characterization of a Cold Seep-
Hydrate System (Woolsey Mound, Deep-Water Gulf of Mexico). University of
South Carolina Ph. D. Thesis.
Sleeper, K.A., Lowrie, A., Bosman, A., Macelloni, L., Swann, C.T., 2006. Bathymetric
Mapping and High Resolution Seismic Profiling by AUV in MC 118 (Gulf of
Mexico). Paper OTC 18133 Presented at Offshore Technology Conference,
Houston, TX.
Solomon, E.A., Kastrier, M., MacDonald, I.R., and Leifer, I., 2009. Considerable
Methane fluxes to the atmosphere from hydrocarbon seeps in the Gulf of Mexico.
Nature Geoscience 2:561-565.
Stuiver, M., Polach, H.A., 1977. Reporting of 14C Data. Radiocarbon, 19, 355-363.
Taylor, M.H., Dillon, W.P., and Pecher, I.A., 2000. Trapping and migration of methane
associated with the gas hydrate stability zone at the Blake Ridge Diapir: new
insights from seismic data. Marine Geology 164: 79-89.

26
Teichert, B.M.A., Eisenhauer, A., Bohrmann, G., Haase-Schramm, A., Bock, B., and
Linke, P., 2003. U/Th systematic and ages of authigenic carbonates from Hydrate
Ridge, Cascadia Margin: Recorders of fluid flow variations. Geochimica et
Cosmochimica Acta, 67, 3845-3857.
Tong, H., Feng, D., Cheng, H., Yang, S., Wang, H., Min, A., Edwards, L. R., Chen, Z.,
Chen, D., 2013. Authigenic carbonates from seeps on the northern continental
slope of the South China Sea: New insights into fluid sources and geochronology.
Marine and Petroleum Geology, 43, 260-271.
Watanabe, Y., Nakai, S., Hiruta, A., Matsumoto, R., Yoshida, K., 2008. U–Th dating of
carbonate nodules from methane seeps off Joetsu, Eastern Margin of Japan Sea.
Earth and Planetary Science Letters 272, 89–96.
Williams, Douglas 1984. Correlation of Pleistocene Marine Sediments of the Gulf of
Mexico and Other Basins Using Oxygen Isotope Stratigraphy, in: Healy-
Williams, N. (ed.), Principles of Pleistocene Stratigraphy Applied to the Gulf of
Mexico, International Human Resources Development Corp., Boston, pp. 65-118.
Wirsig, C., Kowsmann, R.O., Miller, D.J., Godoy, J.M.O., Mangini, A., 2012. U/Th-
dating and post-depositional alteration of a cold seep carbonate chimney from the
Campos Basin offshore Brazil. Marine Geology, 329-331, 24-33.
27
APPENDIX A SUPPLEMENTARY DATA
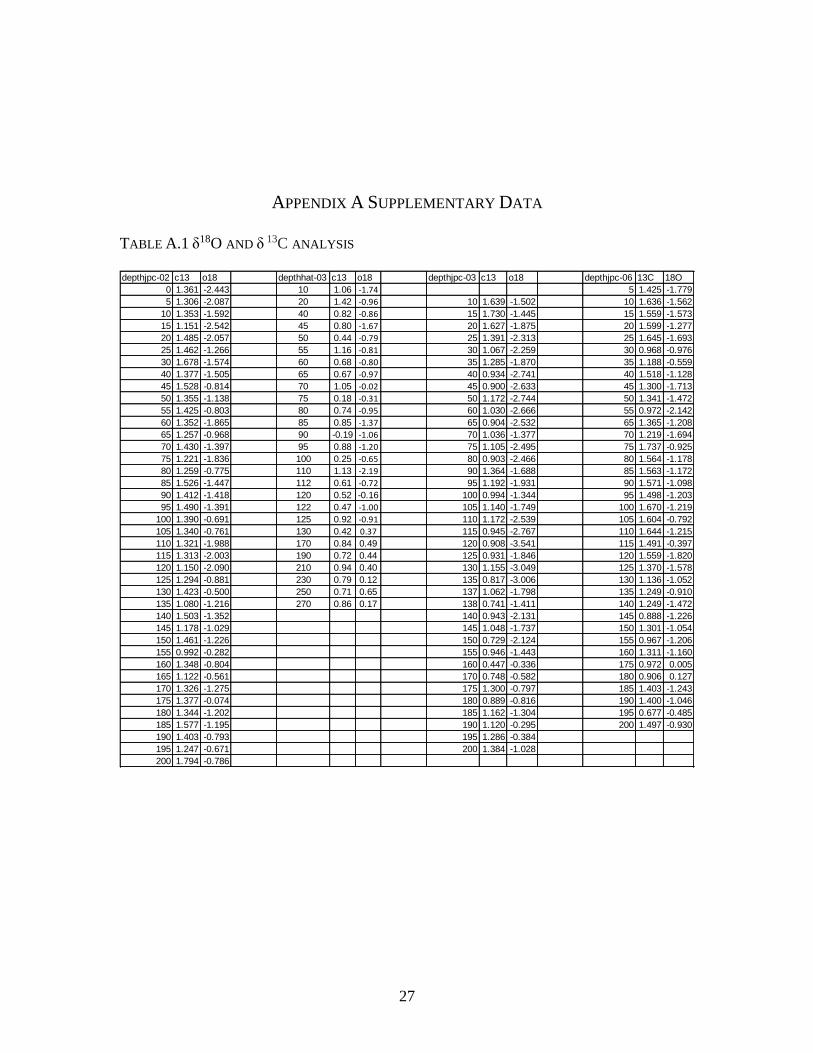
TABLE A.1 δ18O AND δ 13C ANALYSIS
depthjpc-02 c13 o18 depthhat-03 c13 o18 depthjpc-03 c13 o18 depthjpc-06 13C 18O
0 1.361 -2.443 10 1.06 -1.74 5 1.425 -1.779
5 1.306 -2.087 20 1.42 -0.96 10 1.639 -1.502 10 1.636 -1.562
10 1.353 -1.592 40 0.82 -0.86 15 1.730 -1.445 15 1.559 -1.573
15 1.151 -2.542 45 0.80 -1.67 20 1.627 -1.875 20 1.599 -1.277
20 1.485 -2.057 50 0.44 -0.79 25 1.391 -2.313 25 1.645 -1.693
25 1.462 -1.266 55 1.16 -0.81 30 1.067 -2.259 30 0.968 -0.976
30 1.678 -1.574 60 0.68 -0.80 35 1.285 -1.870 35 1.188 -0.559
40 1.377 -1.505 65 0.67 -0.97 40 0.934 -2.741 40 1.518 -1.128
45 1.528 -0.814 70 1.05 -0.02 45 0.900 -2.633 45 1.300 -1.713
50 1.355 -1.138 75 0.18 -0.31 50 1.172 -2.744 50 1.341 -1.472
55 1.425 -0.803 80 0.74 -0.95 60 1.030 -2.666 55 0.972 -2.142
60 1.352 -1.865 85 0.85 -1.37 65 0.904 -2.532 65 1.365 -1.208
65 1.257 -0.968 90 -0.19 -1.06 70 1.036 -1.377 70 1.219 -1.694
70 1.430 -1.397 95 0.88 -1.20 75 1.105 -2.495 75 1.737 -0.925
75 1.221 -1.836 100 0.25 -0.65 80 0.903 -2.466 80 1.564 -1.178
80 1.259 -0.775 110 1.13 -2.19 90 1.364 -1.688 85 1.563 -1.172
85 1.526 -1.447 112 0.61 -0.72 95 1.192 -1.931 90 1.571 -1.098
90 1.412 -1.418 120 0.52 -0.16 100 0.994 -1.344 95 1.498 -1.203
95 1.490 -1.391 122 0.47 -1.00 105 1.140 -1.749 100 1.670 -1.219
100 1.390 -0.691 125 0.92 -0.91 110 1.172 -2.539 105 1.604 -0.792
105 1.340 -0.761 130 0.42 0.37 115 0.945 -2.767 110 1.644 -1.215
110 1.321 -1.988 170 0.84 0.49 120 0.908 -3.541 115 1.491 -0.397
115 1.313 -2.003 190 0.72 0.44 125 0.931 -1.846 120 1.559 -1.820
120 1.150 -2.090 210 0.94 0.40 130 1.155 -3.049 125 1.370 -1.578
125 1.294 -0.881 230 0.79 0.12 135 0.817 -3.006 130 1.136 -1.052
130 1.423 -0.500 250 0.71 0.65 137 1.062 -1.798 135 1.249 -0.910
135 1.080 -1.216 270 0.86 0.17 138 0.741 -1.411 140 1.249 -1.472
140 1.503 -1.352 140 0.943 -2.131 145 0.888 -1.226
145 1.178 -1.029 145 1.048 -1.737 150 1.301 -1.054
150 1.461 -1.226 150 0.729 -2.124 155 0.967 -1.206
155 0.992 -0.282 155 0.946 -1.443 160 1.311 -1.160
160 1.348 -0.804 160 0.447 -0.336 175 0.972 0.005
165 1.122 -0.561 170 0.748 -0.582 180 0.906 0.127
170 1.326 -1.275 175 1.300 -0.797 185 1.403 -1.243
175 1.377 -0.074 180 0.889 -0.816 190 1.400 -1.046
180 1.344 -1.202 185 1.162 -1.304 195 0.677 -0.485
185 1.577 -1.195 190 1.120 -0.295 200 1.497 -0.930
190 1.403 -0.793 195 1.286 -0.384
195 1.247 -0.671 200 1.384 -1.028
200 1.794 -0.786

28
FIGURE A.1 STRUCTURAL AND BATHYMETRIC MAP OVER WOOLSEY MOUND