Templati ng and self -assembl y of bi omi metic mat eri als
94
Templating and self-assembly of biomimetic materials Christian Mille
Transcript of Templati ng and self -assembl y of bi omi metic mat eri als

T e m p l a t i n g a n d s e l f - a s s e m b l y o f b i o m i m e t i c
m a t e r i a l s
Christian Mille


Templating and self-assembly
of biomimetic materials
Christian Mille

©Christian Mille, Stockholm 2012
ISBN 978-91-7447-491-6
Printed in Sweden by US-AB, Stockholm 2012
Distributor: Department of Materials and Environmental Chemistry
Doctoral thesis 2012
YKI, Institute for Surface Chemistry SP, Technical Research Institute of Sweden Stockholm, Sweden and Department of Materials and Environmental Chemistry Arrhenius Laboratory, Stockholm University Stockholm, Sweden Faculty Opponent
Prof. Mika Lindén Ulm University Ulm, Germany Evaluation committee:
Prof. Tommy Nylander Physical Chemistry, Lund University Associate Prof. Eva Blomberg School of Chemical Science and Engineering, KTH - Royal Institute of Technology Dr. Alfonso Garcia-Bennet Department of Engineering Sciences, Uppsala University Substitute
Prof. Arnold Maliniak Department of Materials and Environmental Chemistry, Stockholm University Cover illustration: Schoen’s gyroid, modeled at 30% volume fraction. Simulation and rendering by Robert Corkery

“When the demands of the environment are the blueprints of the construction, structures are pro-duced with the utmost efficiency”
D’Arcy Thompson


Abstract
Use of biomolecular assemblies for creating materials with novel properties is the focus of this thesis. Several aspects of biomimetic materials have been investigated, from fundamental studies on membrane shaping molecules to the integration of biomolecules with inorganic materials.
Triply periodic minimal surfaces (TPMS) are mathematically defined sur-faces that partition space and present a large surface area in a confined space. These surfaces have analogues in many physical systems. The endop-lasmic reticulum (ER) can form intricate structures and it acts as a replica for the wing scales of the butterfly C. rubi, which is characterized by electron microscopy and reflectometry. It was shown to contain a photonic crystal and an analogue to a TPMS. These photonic crystals have been replicated in silica and titania, leading to blue scales with replication on the nanometer scale. Replicas analyzed with left and right handed polarized light are shown be optically active.
A macroporous hollow core particle was synthesized using a double tem-plating method where a swollen block copolymer was utilized to create po-lyhedral nanofoam. Emulsified oil was used as a secondary template which gave hollow spheres with thin porous walls. The resulting material had a high porosity and low thermal conductivity.
The areas of inorganic materials and functional biomolecules were com-bined to create a functional nanoporous endoskeleton. The membrane pro-tein ATP synthase were incorporated in liposomes which were deposited on nanoporous silica spheres creating a tight and functional membrane. Using confocal microscopy, it was possible to follow the transport of Na+ through the membrane.
Yop1p is a membrane protein responsible for shaping the ER. The protein was purified and reconstituted into liposomes of three different sizes. The vesicles in the 10-20 nm size range resulted in tubular structures. Thus, it was shown that Yop1p acts as a stabilizer of high curvature structures.


List of publications
I. Christian Mille, Eric C Tyrode, Robert W Corkery, Inorganic chiral 3-D
photonic crystals with bicontinuous gyroid structure replicated from butterf-
ly wing scales, Chemical Communications, 47, 35 (2011) 9873-9875 II. Christian Mille, Eric C Tyrode, Robert W Corkery, Structural colours in
butterflies - preferred orientation of chiral photonic crystals in C. rubi, Ma-nuscript III. Christian Mille, Eric C Tyrode, Robert W Corkery, Approaching full
band gaps in visible wavelength, 3D chiral photonic crystals, Submitted IV. Christian Mille, Robert W Corkery, A structural and thermal conductiv-
ity study of a highly porous, hierarchical polyhedral nanofoam shells made
by templating silica onto microemulsion films on the surface of emulsified oil
drops, Submitted V. Vitaliy Oliynyk*, Christian Mille* Jovice B S Ng, Christoph von Ball-moos, Robert W Corkery and Lennart Bergström, Selective and ATP-driven
transport of ions across supported membranes into nanoporous carriers
using gramicidin A and ATP synthase, Submitted *Denotes equal contribution

Other publications by the author
1. Christina Schütz, Michaela Salajkova, Nicholas Cervin, Christian Mille, German Salazar-Alvarez, Qi Zhou, Lars Wågberg, Lars Berglund, Lennart Bergström, Super-slippery nanocellulose-based coatings, Manuscript 2. Christian Mille, Eric C Tyrode, Robert W Corkery, 3-D Chiral Photonic
Crystals Replicated from Butterfly Wing Scales, Materials Research Society symposia proceedings, Volume 1389 (2012) 3. Christian Mille, Robert W Corkery, Structuring Membrane Proteins as
Tools in Material Science, NSTI-Nanotech, 3 (2010), 246-249 4. Alina Castell, Christian Mille, Torsten Unge, Structural analysis of my-
cobacterial branched-chain aminotransferase: implications for inhibitor
design, Acta Crystallographica D, 66 (2009) 549-5577

Table of Contents
1. Introduction ............................................................................................. 1
1.1. Biotemplating ..................................................................................................... 1
1.2. Biomimetics ........................................................................................................ 2
1.3. Self-assembly .................................................................................................... 2
1.4. Aims and outline of the thesis ........................................................................ 3
2. Main methods used in this work.......................................................... 4
2.1. Expression and purification of recombinant membrane proteins ............. 4
2.2. Microreflectance spectroscopy ........................................................................ 6
2.3. TIR-Raman Spectroscopy ................................................................................ 7
2.4. Electron microscopy.......................................................................................... 8
2.4.1. CryoTEM ..................................................................................................... 9
2.5. Confocal laser scanning microscopy ............................................................ 10
3. Ordered structures in living systems ............................................... 11
3.1. Triply periodic minimal surfaces ................................................................... 11
3.1.1. The TPMS in living systems - from plants to amoebae. .................. 13
3.2. Morphology of membranes - controlling the curvature using proteins
and lipids ................................................................................................................... 14
3.2.1. Role of membrane proteins in determining the shape of lipid
bilayers ................................................................................................................ 15
3.3. Origin and function of TPMS in biological membranes ............................. 17
3.4. Periodic structures giving rise to color ........................................................ 18
3.5. Structures related to TPMS found in butterflies and beetles
forming a photonic crystal (Paper I and II) .............................................. 20
4. Ordered structures in synthetic systems – templated materials28
4.1. Porous materials – micro to macrostructured ........................................... 28
4.1.1. From microporous zeolites to mesoporous silica .............................. 29
4.2. Preparation of a hollow core shell silica foam of low thermal
conductivity (Paper IV) ..................................................................................... 31
4.3. Biotemplating – from organisms to inorganic material ............................ 33
4.3.1. Templating photonic crystals from arthropods ................................. 34
4.3.2. Eukaryotes as templates....................................................................... 34
4.3.3. Bacteria and viruses as templates ...................................................... 35
4.4. Photonic structures – the electromagnetic spectra................................... 36

4.5. Chiral 3D photonic crystals replicated from butterfly wings
(Paper I and III) ................................................................................................. 40
4.5.1. Silica templates of C. rubi wing scales ............................................... 41
4.5.2. Titania replicas of C. rubi wing scales ................................................ 44
4.5.3. Nanoparticle replicas of C. rubi wing scales ...................................... 47
4.5.4. Band gap analysis of C. rubi replicas.................................................. 48
4.5.5. Discussion and implication of the replication of the photonic
crystals in C. rubi ............................................................................................... 50
5. Artificial cells – from membrane proteins to inorganic carriers . 51
5.1. Biological membranes - lipids and proteins ............................................... 51
5.1.1. Self-assembly of lipids and lipid-water phases ................................. 52
5.1.2. Proteins forming the mosaic of the membrane ................................ 54
5.2. From liposomes to artificial cells .................................................................. 55
5.3. A fully functional primary ion pump immobilized on a lipid
coated mesoporous sphere (Paper V) ......................................................... 56
5.4. Evidence of DP1/Yop1p acting as stabilizer of high curvature structures
in the ER membrane of cells ................................................................................. 60
5.4.1. Protein purification and reconstitution ............................................... 60
5.4.2. Analyzing the interaction between proteins and lipids using
cryoTEM and TIR-Raman .................................................................................. 61
5.4.3. Discussion of lipid-protein interactions in relation to formation of
membrane structures ........................................................................................ 64
6. Summary and conclusions .................................................................. 66
7. Outlook ................................................................................................... 68
8. Populärvetenskaplig sammanfattning .............................................. 70
9. Acknowledgements .............................................................................. 72
10. References ........................................................................................... 74

1
1. Introduction
Nature displays a plethora of intricate assemblies with details in the nanome-ter scale, containing highly ordered structures of different length scales, as-sembled with a minimum in energy and material expenditure. These func-tional materials, both soft and hard, consist mainly of proteins, carbohydrates and lipids and are assembled in aqueous environments under relatively mild conditions. Apart from the many different supramolecular assemblies, indi-vidual biomolecules, such as proteins, perform a number of tasks in living systems, nearly always surpassing what is possible to do using synthetic molecules. By using concepts found in biological systems and applying them to the area of material science, it is possible to achieve novel functionality in man-made systems. For a long time, nature has been a source of inspiration when designing material, including everything from self-cleaning lotus leafs1 to the mechanisms of flight in birds2. In this thesis, the shape and functions of materials found in nature are studied from a fundamental as well as an applied perspective.
1.1. Biotemplating Organisms fabricate materials using a programmed assembly with a genetic blueprint. These materials can be everything from multifunctional3 to hierar-chical4 and highly ordered. Hence, ordered biomolecular assemblies have great potential as a inspiration for novel material design, making them suita-ble as templates for inorganic materials.5 The field of biotemplating includes a very broad range of useful structures, from molecules such as cellulose, chitin, lipids, and proteins up to whole organisms like bacteria and insects.6 The shape of the more complex biomaterials is controlled by the membranes of cells that guide the assembly. This morphogenesis emerges from a num-ber of mechanisms involving lipids and protein. These biomembranes dis-play structures very similar to self-assembled colloid systems of surfactants used in industry, for example in producing foams, emulsions and porous materials, such as MCM-417 and SBA-158. Biological membranes, in which the scale of membrane curvature is approximately 10 times larger than the corresponding curvature in surfactant and lipid-based liquid crystalline as-semblies, are good examples of the superior structural control exercised by organisms. The large number of possible templates can then be combined

2
with a vast number of available inorganic materials. This combination of a precise control of the length scale and membrane morphology and the wide selection of possible materials makes biotemplating promising as an ap-proach in designing materials.
1.2. Biomimetics The term biomimetics, coined by Otto Schmids in 19579, is a broad descrip-tion related to the transfer of concepts from biology to technology. Several illustrative examples exist where nature has been used as an inspiration when designing materials such as Velcro®10, inspired by the gripping hooks found in burs (a plant seed), StoCoat Lotusan®11, a façade paint able to repel wa-ter, inspired by the lotus leaf and the Speedo Fastskin®12, a swimsuit de-signed using shark scales as a model.
Apart from working as a source of inspiration or replication, biological systems contain functional molecules with useful properties, such as cataly-sis or selective transport. These biomolecules can be both isolated and used by itself or form a hybrid construction together with an inorganic material. Examples of useful biomolecules include proteins that act as catalysts, out-performing inorganic catalysts and lipid bilayers, which can form a coating that provides properties such as an ion-tight barrier and self-healing struc-tures.13, 14
1.3. Self-assembly Another key concept that all the materials in this thesis have in common is self-assembly. Biological molecules used in biotemplating are of course an example of this concept but the inorganic materials synthesized and used in this work also rely on self-assembly of amphiphilic molecules. Self-assembly is a very broad term and can be ascribed to everything from galax-ies to single atoms in a crystal. It is also often described as an enabling tech-nique in nanotechnology that allows for a bottom up approach to material synthesis.15, 16 By simply allowing the molecules to arrange themselves, there is much to gain in comparison with assembling structures atom by atom. What we can learn from nature in this aspect cannot be underestimated. The behavior of self-assembling molecules, both synthetic and naturally occur-ring, and how these influence the properties of materials is discussed throughout this thesis.

3
1.4. Aims and outline of the thesis The overall aim of this project was to utilize properties of materials found in nature as well as forming a more fundamental understanding on how and why such structures appear. How can we use these structures and molecules and what could be gained from doing so? A secondary aim was to develop an understanding of why certain membrane structures exist in nature, with a particular focus on ordered structures. This thesis is divided into chapters that describe separate research areas. Each section gives an overview of the area followed by a presentation and discussion of the studies performed in this thesis. The division between reviews of state of the art and the work done here is clearly delineated. Sections containing results are also marked in bold in the table of content.
In Chapter 2, a short theoretical background on the main methods used is presented. Chapter 3 discusses ordered structures that biomaterials often consist of, starting with a description of minimal surfaces. This is followed by the discussion of the physical analogues including their appearance, func-tion and the methods of how the membrane morphology is controlled. The chapter is concluded with results from a study of ordered structures occur-ring in a butterfly (paper I and II). Chapter 4 describes similar ordered struc-tures in synthetic materials, both for well known materials that have been used for many years and novel systems that are directly synthesized using biotemplating. The chapter then discusses results from two studies, one de-scribing the synthesis and characterization of a porous material (paper IV) and one where a biomaterial was used to create an optically active material (paper I and III). Chapter 5 discusses artificial cells, in which biomolecules are used in conjunction with inorganic materials. Initially, the basics of bio-logical membranes are discussed, including the role of the membrane as a partitioner of surfaces, followed by a description of artificial cells, from sim-ple bilayers to organism-like machineries. The chapter is concluded with two studies: one where a membrane protein was inserted into a lipid membrane, covering a mesoporous silica sphere (paper V) and another where the inte-raction between a model membrane and a membrane protein, responsible for shaping the endoplasmic reticulum, is studied.

4
2. Main methods used in this work
This chapter introduces the main techniques and methods used in this thesis. A brief theoretical description is given. For a more detailed description of how different samples were analyzed, see the respective paper (I-IV).
2.1. Expression and purification of recombinant membrane proteins The purification of proteins, and especially membrane proteins, is a complex procedure, mostly because of large hydrophobic patches that easily cause aggregation. Here, a method of expressing and purifying membrane proteins where Green Fluorescent Protein (GFP) is attached to the protein is pre-sented. The GFP motif is attached to the C-terminal of the protein and, since it folds correctly and becomes fluorescent only if the protein is correctly integrated in the membrane, it can be used as an indicator of correctly folded proteins. Further, the whole purification process can be screened and visua-lized by utilizing the fluorescent properties of GFP. This is especially useful for the early screening of the over-expression levels. Very small cell quanti-ties can be analyzed by measuring the whole-cell fluorescence and mem-brane suspension fluorescence in a spectrofluorometer. The main points are given below, for a detailed description of the method used see Drew. et al.
17 The first step is to find the genes encoding for the protein of interest.
These genes are amplified using the corresponding primers and cloned into a vector containing GFP, a His tag and a TEV protease site. This vector is transformed into viable Saccharomyces Cervisiae cells. A yeast-strain that is capable of over expressing the protein is grown in a selective media contain-ing glucose as nutrition. At the point of culturing where the cells are growing exponentially, i.e. the log phase, and the levels of glucose are low, galactose is added to induce over expression of the protein. This is achieved by insert-ing the vector inside the gal operon - a cluster of genes that regulates the expression of enzymes involved in galactose metabolism. Locating the vec-tor between the promoter and the galE gene causes the cell to co-express the protein when utilizing galactose as an energy source. This process continues for 24 hours after which the cells containing the over expressed proteins are homogenized using a high pressure disruptor and the membrane fraction is
5
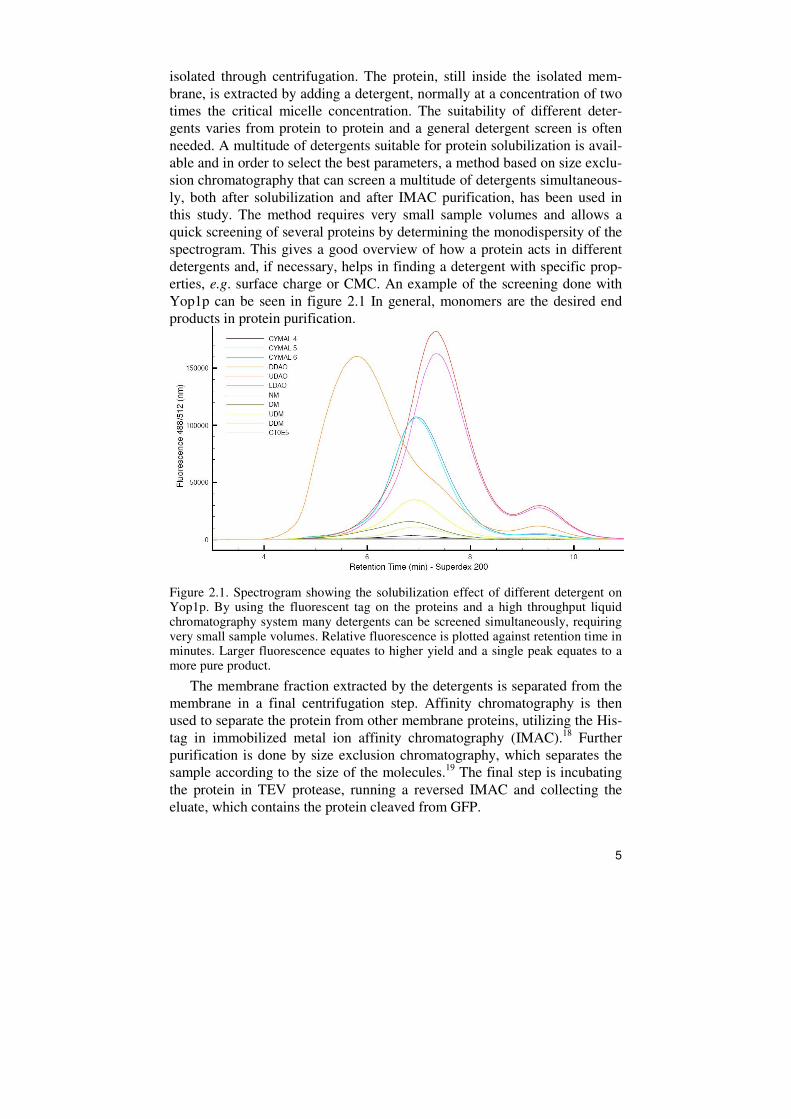
isolated through centrifugation. The protein, still inside the isolated mem-brane, is extracted by adding a detergent, normally at a concentration of two times the critical micelle concentration. The suitability of different deter-gents varies from protein to protein and a general detergent screen is often needed. A multitude of detergents suitable for protein solubilization is avail-able and in order to select the best parameters, a method based on size exclu-sion chromatography that can screen a multitude of detergents simultaneous-ly, both after solubilization and after IMAC purification, has been used in this study. The method requires very small sample volumes and allows a quick screening of several proteins by determining the monodispersity of the spectrogram. This gives a good overview of how a protein acts in different detergents and, if necessary, helps in finding a detergent with specific prop-erties, e.g. surface charge or CMC. An example of the screening done with Yop1p can be seen in figure 2.1 In general, monomers are the desired end products in protein purification.
Figure 2.1. Spectrogram showing the solubilization effect of different detergent on Yop1p. By using the fluorescent tag on the proteins and a high throughput liquid chromatography system many detergents can be screened simultaneously, requiring very small sample volumes. Relative fluorescence is plotted against retention time in minutes. Larger fluorescence equates to higher yield and a single peak equates to a more pure product.
The membrane fraction extracted by the detergents is separated from the membrane in a final centrifugation step. Affinity chromatography is then used to separate the protein from other membrane proteins, utilizing the His-tag in immobilized metal ion affinity chromatography (IMAC).18 Further purification is done by size exclusion chromatography, which separates the sample according to the size of the molecules.19 The final step is incubating the protein in TEV protease, running a reversed IMAC and collecting the eluate, which contains the protein cleaved from GFP.

6
2.2. Microreflectance spectroscopy Microreflectance spectroscopy is used for the characterization of the reflec-tive properties of a material. In this thesis, photonic crystals, with a reflec-tion maximum in the visible part of the spectrum, are characterized using white light as the source.
In spectroscopy, the interaction between matter and electromagnetic radi-ation is studied. Several types of spectroscopy exist and are classified ac-cording to the wavelengths of the incident beam. Here, the visible part of the spectra, i.e. white light, was used to characterize the material. In short, the white light is directed towards the surface and the reflected light is analyzed in a spectrometer over the entire visible spectrum. The photons reaching the surface are scattered, absorbed or transmitted through the sample. In the case of transmission spectroscopy, there is little or no scattering and a component can easily be quantified using the Lambert-Beer law. However, in reflec-tance mode, parts of the photons are scattered, which is a more complex process.20
The scattering can be regarded as two superimposed components; specu-lar and diffuse reflection. Specular or mirror reflection occurs at all surfaces and is characterized by the incoming light and reflected light having the same angle in relation to the surface normal. The reflection is given by the Fresnel reflection law
� � ����������������� [1]
where n is the relative refractive index and κ is the absorption index. Sam-ples with high gloss typically show a high degree of specular reflectance. The other component, diffuse reflectance, is typically reflected from dull or mat surfaces. Here the light penetrates into the sample and undergoes mul-tiple scattering and absorption from the particulate surface. Fresnel’s law however, does not apply to diffuse reflectance, which is a much more com-plex process. This reflectance event is strongly governed by the structure of the surface where a rough surface generally generates a greater amount of diffuse reflectance.20, 21
Small samples can be analyzed by routing the white light through an opti-cal microscope and using a charge-coupled device (CCD) as a detector. Here the visible region of the spectra is used for characterization of photonic crys-tals. For the data treatment a dielectric mirror with 100% reflectivity in the 350-1100 nm range was used to normalize the spectra. For a more detailed description of the samples that have been measured, the reader is referred to section 4.5.

2.3. TIR-Raman SpectroscopySince all molecules of biological interestused to determine secondary structure, conformation and intramolecular interactions, Raman spectroscopy hasHere, a method that allows for the measuremused to study the interaction between a lipid bilayer and a membrane protein.
Raman spectroscopy is a technique cules. A molecule interacting withexcited to a virtual state and then returns to the ground state without any transition. This is called elastic or Rayleigh scattering. In Raman or inelastic scattering, the molecules are, in a similar manner, excited to a virtuabut when returning to a different energy level a shift is created. This shift alters the frequency of the photons away from the initial excitation wavlength. In Raman spectroscopy, a single wavelength laser is used to excite the molecule. The majority of the scattered signals will have the same wavlength as the incident light, which is calledsmall portion of the light will have a shift between the incident and scattered wavelengths, i.e. there has been an energy trand light. For this event to occurchange with the vibration; otherwise there will be no difference in the energy levels and thus no signal.
Fig. 2.2. The Total internal reflection priis completely reflected and an evanescent wave is generated. Illustration by Eric Tyrode.
Total internal reflection is an optical ing light beam hits a medium of higher refraccal angle, see fig. 2.2. When this occursrefractive index media but everything is reflected. Further, a standingevanescent wave, is generated perpendicular to the plitude is given by:
where E1 is the amplitude at the interface, and γ is:
7
Raman Spectroscopy ince all molecules of biological interest have vibrational spectra that can be
o determine secondary structure, conformation and intramolecular Raman spectroscopy has long been used for characterization.22
Here, a method that allows for the measurement of a single lipid bilayer was ction between a lipid bilayer and a membrane protein.
is a technique that measures the vibrations of mole-cules. A molecule interacting with the incoming light absorbs a photon, is excited to a virtual state and then returns to the ground state without any transition. This is called elastic or Rayleigh scattering. In Raman or inelastic scattering, the molecules are, in a similar manner, excited to a virtual state but when returning to a different energy level a shift is created. This shift alters the frequency of the photons away from the initial excitation wave-length. In Raman spectroscopy, a single wavelength laser is used to excite
rity of the scattered signals will have the same wave-, which is called Rayleigh scattering. However, a
small portion of the light will have a shift between the incident and scattered there has been an energy transfer between the molecules
and light. For this event to occur, the polarizability of the molecule must change with the vibration; otherwise there will be no difference in the energy
. The Total internal reflection principle. Above or at a certain angle, the light is completely reflected and an evanescent wave is generated. Illustration by Eric
Total internal reflection is an optical phenomenon occurring when an incom-ing light beam hits a medium of higher refractive index at or above the criti-
. When this occurs, no light penetrates through the low refractive index media but everything is reflected. Further, a standing or
is generated perpendicular to the n1/n2 interface. The am-
[2]
is the amplitude at the interface, z is the distance from the interface

8
� � 2 ����������������
���
�� [3]
Thus this wave exhibits exponential decay with the distance traveled from the interface, z.23 By only detecting the evanescent wave generated when passing through the sample located at the interface, this method has a very high surface sensitivity and can easily detect a single lipid bilayer. The TIR phenomenon is well established in IR spectroscopy. However, as shown in eq. 3, the amplitude of the evanescent wave is also proportional to λ of the incoming light and since a single wavelength laser is far shorter than the light source used in IR, the surface sensitivity is many times larger in Raman spectroscopy. Also, since a monochromatic light source is used, the penetra-tion depth is kept constant. The TIR-Raman setup at KTH is described in figure 2.3, further details are available in ref. 24
Fig. 2.3 A schematic view of the liquid cell used in the TIR-Raman. The laser hits the hemisphere which generates an evanescent wave at the interface that is detected through the objective above the sample solution and routed to the CCD detector. Illustration by Eric Tyrode.
2.4. Electron microscopy Electron microscopy includes a large number of techniques and is a power-full way to visualize details in the nanometer scale. Here, several different

9
techniques are used to study both the structures of photonic crystals as well as the interaction between lipid structures and membrane proteins.
Light microscopes have a resolution of approximately 200 nm, limited by the wavelength of light. Electron microscopy uses electrons to generate an image and, with a wavelength 100 000 shorter than that of photons, allows for resolutions down to single nm. Electron microscopes can work in either transmission (TEM) or reflection (SEM) mode. In TEM, the electrons are emitted from either a tungsten filament or a lanthanum hexaboride crystal by applying a high voltage (100-300 kV) to it. To focus the transmitted elec-trons, electromagnetic fields are used much like a glass lens is used for light. The electrons are focused on the sample and will form a magnified 2D pro-jection on a CCD detector or a photographic film. The contrast that makes it possible to see an object is based on the sample scattering a portion of the incoming electrons and keeping them from reaching the detector. In SEM the electrons are focused on a small spot and then scanned across the sample and gradually building up an image. The incident electrons interact with the sample and a portion of the energy generated is converted into secondary electrons, back scattered electrons and x-rays, which all can be detected. Secondary electrons are generated through inelastic scattering and they have a low interaction volume, originating from the top few nm of the sample resulting in an image with a deep field of view. Backscattered electrons are a result of elastic scattering and have a higher interaction volume. Heavy ele-ments scatter more strongly, causing back scattered electrons to give an im-age with a contrast between different elements. X-rays are mainly used for elemental mapping.
2.4.1. CryoTEM CryoTEM allows imaging of biological materials such as the membrane protein studied in this thesis. By keeping the sample at a low temperature it is possible to image the actual lipids and proteins, without the need for heavy metal stains.
Electron microscopy on soft and biological matter is often difficult since the material need to be hydrated. This makes it unsuitable for the high va-cuum environment inside an electron microscope and often the samples have a very low contrast. To solve these problems, cryoTEM, where the sample is analyzed at a very low temperature, can be used. In order to allow imaging at these low temperatures the sample preparation is an important step. The sample is kept in a humidity and temperature controlled chamber and blotted on a polymer coated copper grid to a sub-micron thin film. The grid is quick-ly plunged into liquid ethane (108 K) and then transferred to the liquid nitro-gen cooled sample holder of the microscope where it is kept at a very low temperature during observation. The most important property is the thick-ness of the film. A thick film causes the electrons to scatter which makes

10
observations of low contrast objects difficult. Also, a thin film is necessary for the rapid cooling that enables vitrification of the water i.e. supercooling into an amorphous solid phase.25 Figure 2.4. displays a sketch of the sample preparation chamber.
Fig. 2.4. The thin film of the sample is produced by blotting a small drop of the sample using a pipette on to a polymer coated copper grid and plunging the grid into a small chamber below containing liquid ethane. Illustration by Göran Karlsson.
2.5. Confocal laser scanning microscopy The single wavelength lasers that are used in confocal microscopy makes both high resolution imaging as well as selective excitation of fluorescent molecules possible. This allows for imaging of objects only a few nanome-ters large as well as kinetic studies of a reaction with single second resolu-tion.
Confocal microscopy is an optical imaging technique based on using a pinhole diaphragm conjugate to the focal plane. This aperture only detects light coming from the focal plane and thus removes much of the unwanted signal from the sample. The light source used is a laser routed through a dichroic mirror that can separate certain wavelengths from each other. The laser excites the sample, passes through the pinhole described above, and is then detected by a photomultipler tube. This is done for multiple spots on the sample which are combined to form an image. By using very small spots, which are limited in the field of view, to form an image, the resolution can be increased significantly compared to a conventional optical microscope.26

11
3. Ordered structures in living systems
In nature, a wide range of intricate structures is produced, with a hierarchical length scale ranging from nanometers to millimeters and often with proper-ties surpassing that of man-made materials. The process of biomineralization for example, where bones, teeth and shells of invertebrates are synthesized, produce highly ordered structures. An example is the diatom, a unicellular alga with a silica shell that can adopt complex shapes. In the process of forming these structures particles are secreted through the cellular membrane and mineralize to form a hard exterior.27 Another example is the mollusk nacre in which a hybrid approach is used, forming well-defined layers of organic molecules, intergrown with calcium carbonate layers. The hybrid composite can both absorb external forces, provide toughness and be highly crack resistant.28 While many of these structures are ordered and controlled by similar mechanisms, they lack the mathematically described symmetry of a crystal. In this chapter, highly ordered materials that can be described us-ing differential geometry and are found in numerous species, will be de-scribed. The cause and functions of these structures will be discussed, in-cluding a description on how membrane proteins, which are believed to be very important in the formation of these structures, influence membranes. The chapter is concluded with results obtained here, regarding triply periodic minimal surface structures found in two butterflies and one weevil.
3.1. Triply periodic minimal surfaces As a theoretical background to structures found across all kingdom of life as well as in crystals of virtually all elements, a short review concerning the connection between these structures and the mathematically defined triply periodic minimal surfaces (TPMS) is given here. A brief explanation of mi-nimal surfaces is given since this concept, and its importance, returns throughout the thesis.
In 1744, Leonhard Euler discovered the catenoid, which is defined as the surface of a soap film spanning two circular wires. The surface that forms the smallest possible area in a given boundary was discussed by Lagrange in 1762. The link between these two discoveries, surface and curvature, was made by Meusnier in 1776. He defined a minimal surface by the following: “For a minimal surface, the principal curvatures are equal, but opposite in

12
sign at every point”. This describes a surface of negative Gaussian curvature and a mean curvature of zero. The negative Gaussian curvature is a result of multiplying the two curvatures of opposite sign, always leading to a negative value of the product. The mean curvature is zero since the two principal cur-vatures cancel out. The resulting surface is equally convex and concave (saddle shaped) at every point on the surface. More than 100 years later, Schwarz described several triply periodic minimal surfaces The D-surface, P-surface are depicted in figure 3.1 (a-b). The third structure (figure 3.1c) is the gyroid, discovered by Alan Schoen in the 1960s.29 Together with Schoen’s gyroid these are the topologically simplest examples from a large family and analogues to these often manifest themselves physically. As will be seen throughout this thesis, the gyroid is especially important. Apart from the three surface described above there are numerous examples of periodic minimal surface that exhibit varying properties. The Batwing surface for example, first published by Corkery, 30 is a surface predicted to have a high mechanical strength.31
Figure 3.1. The three minimal surface of lowest genus. A) is the D-surface or double diamond, b) is the gyroid and c) is the P-surface. Computer simulations and render-ings by Robert Corkery.
In the context of this thesis, dealing with physical systems, the importance of the three surfaces depicted in figure 3.1 relate to their relative simplicity and homogeneity. The distribution of flat points is, per unit cell, the lowest among all TPMS - giving these surfaces the lowest energy possible or, in the case of a lipid-water systems (section 5.1), a minimum of bilayer frustra-tion.32 These three surfaces have an identical distribution of flat points and, in physical systems, a very narrow surface to volume ratio difference.29
A simple method to generate an approximation of a TPMS is to use the description for a standing wave or a periodic nodal surface. For example, the P-surface is generated within a few percent using the expression:
cos � � cos � cos ! � 0 [4]
13
This method is simpler than the analytical calculation of the TPMS and is therefore very valuable when describing physical systems.33
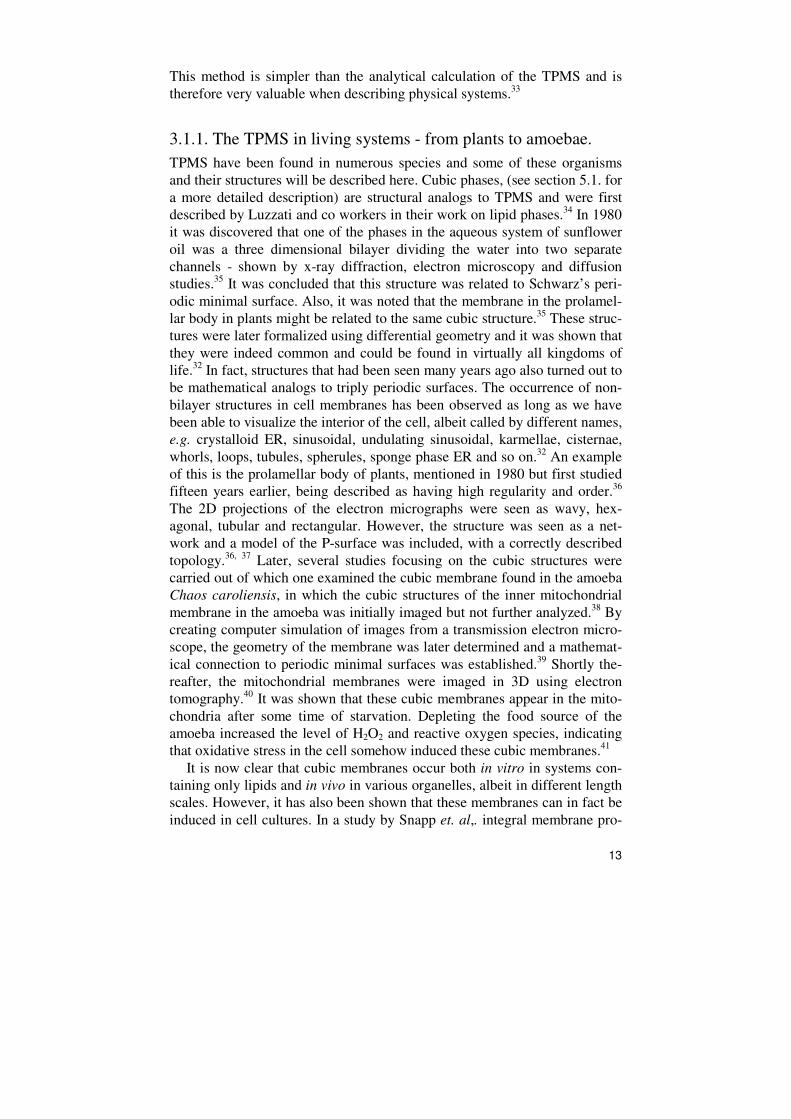
3.1.1. The TPMS in living systems - from plants to amoebae. TPMS have been found in numerous species and some of these organisms and their structures will be described here. Cubic phases, (see section 5.1. for a more detailed description) are structural analogs to TPMS and were first described by Luzzati and co workers in their work on lipid phases.34 In 1980 it was discovered that one of the phases in the aqueous system of sunflower oil was a three dimensional bilayer dividing the water into two separate channels - shown by x-ray diffraction, electron microscopy and diffusion studies.35 It was concluded that this structure was related to Schwarz’s peri-odic minimal surface. Also, it was noted that the membrane in the prolamel-lar body in plants might be related to the same cubic structure.35 These struc-tures were later formalized using differential geometry and it was shown that they were indeed common and could be found in virtually all kingdoms of life.32 In fact, structures that had been seen many years ago also turned out to be mathematical analogs to triply periodic surfaces. The occurrence of non-bilayer structures in cell membranes has been observed as long as we have been able to visualize the interior of the cell, albeit called by different names, e.g. crystalloid ER, sinusoidal, undulating sinusoidal, karmellae, cisternae, whorls, loops, tubules, spherules, sponge phase ER and so on.32 An example of this is the prolamellar body of plants, mentioned in 1980 but first studied fifteen years earlier, being described as having high regularity and order.36 The 2D projections of the electron micrographs were seen as wavy, hex-agonal, tubular and rectangular. However, the structure was seen as a net-work and a model of the P-surface was included, with a correctly described topology.36, 37 Later, several studies focusing on the cubic structures were carried out of which one examined the cubic membrane found in the amoeba Chaos caroliensis, in which the cubic structures of the inner mitochondrial membrane in the amoeba was initially imaged but not further analyzed.38 By creating computer simulation of images from a transmission electron micro-scope, the geometry of the membrane was later determined and a mathemat-ical connection to periodic minimal surfaces was established.39 Shortly the-reafter, the mitochondrial membranes were imaged in 3D using electron tomography.40 It was shown that these cubic membranes appear in the mito-chondria after some time of starvation. Depleting the food source of the amoeba increased the level of H2O2 and reactive oxygen species, indicating that oxidative stress in the cell somehow induced these cubic membranes.41
It is now clear that cubic membranes occur both in vitro in systems con-taining only lipids and in vivo in various organelles, albeit in different length scales. However, it has also been shown that these membranes can in fact be induced in cell cultures. In a study by Snapp et. al,. integral membrane pro-

14
teins were used to induce high curvature structures in the ER, termed OSER (ordered smooth endoplasmic reticulum). OSER-inducing proteins, such as cytochrome b(5), were identified and expressed together with green fluores-cent protein (GFP) in COS-7 cells. The OSER structures formed when the concentration of protein exceeded a certain level, resulting in a major rear-rangement of the surrounding ER. Further, it was shown that attaching and overexpressing a protein that dimerized in a low affinity fashion, in this case GFP, to the cytoplasmic part of the membrane induce OSER structures as well. 42
Recently, cubic membranes were induced in HeLa-cells using an artificial membrane protein with a controlled dimerizing motif.43 By expressing the artificial membrane spanning proteins and later adding a dimerizing drug, the cell developed both cubic, representing the D-surface, and whorled membranes. Interestingly, these structures induced an autophagy response, targeting the cubic membranes for degradation. Since ER stress is a stimula-tor for autophagy these structures are likely not desired by the cell.43 No cubic structures have been found in bacteria, with the exception of a cya-nobacteria.44 A likely explanation is the scarcity of membranes in a proka-ryotic cell compared to the eukaryotic. Not surprisingly, when the amount of membranes in a cell is greatly increased, a structure resembling a cubic phase is the result. In a modified strain of E. coli, designed to over-express subunit b of the F1F0 ATP synthase complex, structures resembling a cubic phases can be seen.45 This unique morphology was further studied, still without any conclusions regarding the origin of the structure.46 These structures do not share the topology of most cell membranes. In order to induce such a complex transformation a number of components are likely needed. Therefore, before continuing in attempting to answer how these structures are formed, a short review regarding the bending of a membrane by proteins is required.
3.2. Morphology of membranes - controlling the curvature using proteins and lipids As is now clear, eukaryotic cells contain a myriad of membrane shapes in-cluding tubes, sheets, cicternae and vesicles, all optimized for a specific function in an organelle. For a general description of lipid and lipid mem-branes, the reader is referred to section 5.1. Shaping the membrane is essen-tial in such diverse processes as cell division, cell movement and vesicular trafficking. How the cell controls the morphology and bilayer characteristics of these structures is both a well studied and complex issue.47, 48 Numbers of methods are used to control membrane shape, both involving proteins and lipids. Here, four of these will be considered. Each will be described sepa-

15
rately even if it is unlikely that one isolated method would be used by the cell. Most likely the events leading to different membrane shapes in a cell are dependent on several mechanisms operating simultaneously.
3.2.1. Role of membrane proteins in determining the shape of lipid bilayers A large number of proteins are involved in shaping the membrane, both by associating with the membrane and by directly inserting in it. This mechan-ism of bending is important and is likely heavily involved in generation of the ordered and functional structures discussed later in the thesis.
While the shape of the lipids is important it is clear that proteins are re-quired in the process of shaping membranes. Three distinct mechanisms are used; some based on the same principles as when lipids shape membranes while other are caused by the unique properties of membrane proteins, the three mechanisms are illustrated in figure 3.2. The first example is scaffold-ing proteins or membrane associative proteins. A protein or protein complex can form a scaffold and bend the membrane. The protein is recruited to an area of the membrane where it transiently binds and, in some cases, oligome-rizes. The shape of the protein can then determine the shape of the mem-brane. In events that require a temporary bending of a membrane, such as vesicle fission or fusion, the protein can disassemble and the membrane re-gains its previous curvature.47
Fig. 3.2. A cell membrane can be bent by proteins using three principally different mechanisms. In a) a protein with a wedge shape is located in the membrane and the bilayer bends to accommodate it. b) Involves association of a protein with a specific shape to the bilayer. The lipids below then adapts to this shape. c) Is the incorpora-tion of short amphipatic moieties in the head groups of one leaflet.

16
An example of a scaffolding protein is the BAR-domain. Amphiphysins are proteins found in the brain of vertebrates, known to be involved in endo-cytosis.49 This group of proteins all contains a specific motif called Bin/ am-phiphysin/Rvs or BAR; a domain that has been shown to be highly con-served and is found in virtually all eukaryotic organisms. The BAR-domain has been ascribed functions in processes such as fission of synaptical ve-sicles, cell polarity, endocytosis, regulation of the actin cytoskeleton, tran-scription suppression, cell-cell fusion, signal transduction, apoptosis, secre-tory vesicle function and tissue differentiation. 50 BAR is an elongated bana-na-shaped dimer consisting of 245 amino acids. Each monomer is a six-helix bundle of α helices. The curvature comes from both the overlap of two mo-nomers and a kink in helix 2 and 3. Further, BAR contains a hydrophobic interface, a flexible loop between helix 2 and 3 and several positively charged residues at the concave surface. It has been shown that the binding mechanism is initially driven by electrostatic forces and later two amphi-pathic loops are inserted in the membrane. This insertion induces curvature and more BAR-proteins can be recruited to the site.51 Hence the BAR-domain is also an example of the next bending mechanism to be described.
The second example is the amphipathic moiety, containing both a hydro-phobic and a hydrophilic part. These helices are random coils until inserted in the lipid bilayer where the hydrophobic side chains face the hydrophobic fatty acid-part of the lipid. This placement will cause the headgroups and chains to rearrange which in turn induces curvature. The reason for this is the bilayer asymmetry which is created when inserting a motif in only one leaflet. Further, unlike lipids with a large headgroup, the amphipatic helices are, due to the strong hydrophobic interactions, difficult to remove from the membrane.48 It has also been shown that such helices can act as membrane sensors, being recruited and binding to areas of a particular curvature or, more specifically, areas of a certain lipid packing.52
The third method for controlling the curvature is similar to the bilayer-coupling effect, i.e. the hydrophobic chains of the lipids keep the bilayer intact, causing it to bend rather than rupture when lipid asymmetry is in-duced. A protein with helices of suitable hydrophobicity and length can, in a similar manner, be located in the hydrophobic region of the lipid bilayer. The shape parameter of the proteins then influences the whole bilayer which introduces an area difference between the monolayers.53 One of the most well known examples of an integral membrane protein involved in shaping the membrane is Yop1p, whose role is discussed in section 5.4.

17
3.3. Origin and function of TPMS in biological membranes A fundamental question regarding the cellular structures similar to cubic phases in self-assembled systems relates to the mechanisms on how these structures are formed. Is the morphology of the cell membrane based solely on energy minimization and self-assembly? What is the contribution of the genes? When and why do these structures appear and when they do, is it desired by the cell? The suggestions about why these structures occur vary almost as much as the cell type and organelle that have been studied. They have been related to a need for an efficient transport of reactive oxygen spe-cies out of the cell40 , a specific distance in order to achieve a photonic band gap54 or simply a method of compartmentalization of the ER into OSER in order to protect the nucleus and organelles42. With the discussion about the triply periodic minimal surfaces in mind, an explanation involving maximi-zation of surface also seems reasonable. For example when the cell is in need of energy it can maximize the surface area towards the mitochondria in order to transport the largest possible amount of ATP. This is also exempli-fied by Deng that discussed the transport of reactive oxygen species.41 These examples can, in general terms, be described as optimization of cell space.
Still, the fact that many of these structures appear under stress indicates this to be a consequence of specific events in the cell. Another important example of cubic structures, also related to stress, is the induction by viruses. It is well known that a virus infection can cause a membrane transition in the subcellular membrane of the host and this transition can lead to formation of cubic membranes in the ER.55
In order to answer the question how TPMS are formed, the energy mini-mization of a system could be considered. A molecule in a bilayer gives it a specific curvature, if the cell would deviate from this curvature it costs bend-ing energy, both on a local and global level. A related conclusion is drawn by McMahon and coworkers: “A protein will curve membranes if the differ-
ence in the energy of binding to curved versus flat membranes is greater
than the energy required for membrane deformation“, thus illustrating that the protein induces a certain curvature, which the cell adapts due to its lo-wering of the free energy of the membrane.56
In conclusion, structures corresponding to a TPMS in a cell membrane appear to be generated in several ways. In order to achieve the large repeat-ing distances observed, membrane proteins are likely required. One method seems to be to use a membrane protein of a specific curvature that, by locat-ing to the flat points, induces these structures. If a membrane adopts a TPMS, the saddle points are symmetrically distributed. For this to occur over-expressing a single membrane protein would be important since the generated curvature would be identical across the membrane. Further, this protein would then be able to sit on each saddle point.57 Another method

18
involves a potentially small membrane anchoring domain connected to a dimerizing motif that interconnects the membrane to increase its homogenei-ty.42, 43
There is no detailed understanding of how the transformation occurs in a cell membrane but several mechanisms have been proposed. The initial cell membrane often adopts the topology of a sphere and the transition from a sphere to a TPMS requires points of fusion. The transformation event could be triggered by the local invagination of a membrane, possibly triggered by the incorporation of a membrane protein, that ultimately requires fusion of the membrane to achieve a connected network throughout the cell.32
An area where structural analogues to TPMS are frequently studied is the colors of beetles, butterflies and birds where the spacing of the periodic structure gives rise to a photonic material; this will be discussed below.
3.4. Periodic structures giving rise to color The method used by organism to generate colors utilizes structures in the nanometer-range and often contain other interesting properties such as su-perhydrophobicity and mechanical strength. This makes them suitable both as templates and as a source of inspiration in designing materials.
In nature, there are two distinctly different methods of producing color. The most common one are pigments, based on the interaction of light with organic molecules containing delocalized electrons. The other variant is col-or based on structure, most commonly found in the exoskeleton of the inver-tebrates but also in the feathers of birds and the scales of fish.58 The pheno-menon has historically been described by several independent mechanisms such as thin-film interference, multilayer interference, diffraction gratings, light scattering, photonic crystals etc.59 The nomenclature is far from estab-lished and confusion in the identification of different mechanism is common. The structures found in butterflies can be divided into diffraction gratings, multilayer reflectors and three dimensional structures. Diffraction gratings can simply be considered as slits or grooves oriented along the surface with a repeat spacing corresponding to the frequency of the light. Each slit func-tions as a line scatterer and the combined effect is what determines the color. Since this effect is angular dependent, the color will change depending on the angle of observation. Multilayer reflectors also contain a periodicity but perpendicular to the surface. The surface still contains slits but each slit is made up from several stacked lines that form a multilayer of individual ref-lectors. This is the most common of all photonic structures in nature. The last type of structure is the three-dimensional photonic crystal with a peri-odicity in three dimensions. Often this is realized using “air-holes” in a ma-trix of solid materials. These holes are then packed in an ordered manner, forming so called inverse opals.60 It is possible to simplify the description

19
even further and only consider coherent and incoherent scattering of light. In this explanation, incoherent scattering occurs when the scattering objects are randomly oriented and smaller or of the same size as the wavelength of the incoming light, i.e. Tyndall and Rayleigh scattering. The coherent scattering occurs when the variation in refractive index is periodical, which is the defi-nition of a photonic crystal and includes all of the mechanisms mentioned initially. Iridescence is a word often used to describe reflection from photon-ic structures in nature – defined by the change in brilliance with the angle of observation. In almost all cases, this effect can be ascribed to coherent scat-tering.61 The theory of photonic crystals and how structures related to TPMS can function as one are further described in section 4.4
Considering Lepidoptera, a large order that includes moths and butter-flies, structural color is common and arise from the ordered structures of chitin. Scales cover the top and/or bottom side of the wings, much like shin-gles on a roof. Each scale, as can be seen in figure 3.3., consists of ridges aligned in rows which make up the photonic crystal. The wings of a butterfly have more tasks to perform that display a specific color and therefore, other details, responsible for IR-reflection and mechanical strength, can be found. This often makes the photonic crystal in butterflies quite complex. As will be discussed in the next section, beetles are another example of naturally occur-ring photonic crystals, which are often less complex.62 How structures like these are induced and controlled by the butterfly is still uncertain. Ghiradella proposed that during the development of butterfly wings, cells in the pupae act as a template for the developing scales. The smooth ER forms a network with a specific spacing. The nascent cuticle is excreted through the plasma membrane and forms a continuous structure with the same topology. As the pupae grow the cell dies, leaving only the chitin wing scale in a structure templated by the ER. Further, Ghiradella also showed that the structured membranes appearing in the cytosol are only found in colored scales.63
Figure 3.3. (a) Photograph of Papilio glaucus. (b) Upon magnifying one yellow scale the structure is visible containing the overlapping ridges with the cross ridges in between. Scale bar is 100 nm. FFT of b) shows a distance of 240 nm between the ridges and 18 nm between the cross ribs.

20
3.5. Structures related to TPMS found in butterflies and beetles forming a photonic crystal (Paper I and II) Here, results regarding the photonic structures found in several organisms are presented. As we will see, these can adopt both different forms and occur in several species. These structures can then be utilized when designing in-organic photonic crystals using butterflies as templates.
The butterfly Callophrys rubi, or the green hairstreak, is common across Europe. Sitting on a branch or in foliage it is hard to distinguish due to its matt green color. When magnified in a light microscope, it can be noted that the wing scales covering the wing are actually comprised of a multitude of colors, from orange/yellow to blue. Further magnification reveals that each scale is made from a mosaic structure with each domains lighting up in a different color, figure 3.4. It has been shown that the mosaic domains cor-responds to peaks between 400 and 550 nm, which on average produce a green color.64 Viewed in an electron microscope such details as the ridges and cross ribs can easily be observed and when the wing scale is polished using an argon ion beam and viewed perpendicular to the top, a highly or-dered structures can be seen to extend from the top to the bottom of the scale. Also, several domains, 5-7 µm long, span across the whole scale, fig-ure 3.5. and 3.6. These domains correspond to the mosaic structure seen from above. The reflection spectra of the butterfly, figure 3.7., reveal a peak at 540 nm, corresponding to the green color. The spectra are taken over an average of 5 domains and the peak position of individual scales and spots on the same scale are seen to differ within a few nanometers.
Figure 3.4. Photograph of Callophrys rubi (a) with its multicolored scales oriented like shingles on a roof (b). By using SEM the ridged and cross ribs and a porous underlying structure can be seen (c). Looking at an individual scale reveals the mo-saic structure (d).
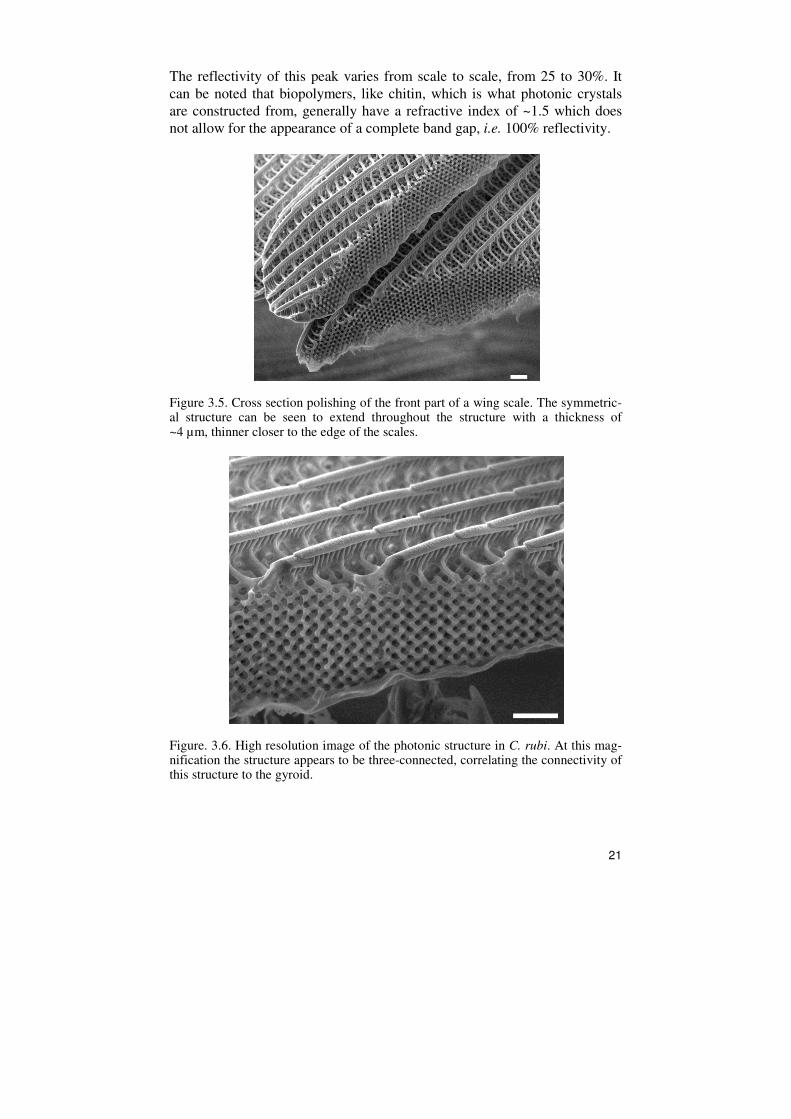
21
The reflectivity of this peak varies from scale to scale, from 25 to 30%. It can be noted that biopolymers, like chitin, which is what photonic crystals are constructed from, generally have a refractive index of ~1.5 which does not allow for the appearance of a complete band gap, i.e. 100% reflectivity.
Figure 3.5. Cross section polishing of the front part of a wing scale. The symmetric-al structure can be seen to extend throughout the structure with a thickness of ~4 µm, thinner closer to the edge of the scales.
Figure. 3.6. High resolution image of the photonic structure in C. rubi. At this mag-nification the structure appears to be three-connected, correlating the connectivity of this structure to the gyroid.

22
Figure 3.7. Callophrys rubi spectra showing a peak around 540 nm corresponding to green. The three spectra are from different spots on the same scales from a single butterfly. Note that the reflectivity measured here, around 30%, is far from a com-plete band gap. Adapted from paper I.
By analyzing the butterfly wings using small angle X-ray scattering sev-eral peaks can be observed. Taking the same indexing scheme as used by Prum and coworkers for a closely related Callophrys butterfly, the result corresponds to space group I4132.65 From this, a unit cell of 339±5 nm can be calculated, similar to that calculated from FFT of SEM micrographs (330±15 nm). Notice however that the indexed peaks are not of the lowest symmetry, which is due to the limited q-values obtained at the SAXS beam-line, figure 3.8.

23
Figure 3.8. SAXS data from a piece of C. rubi wing oriented at right angles to the synchrotron beam. The indexing scheme here is in good agreement with the x-ray patterns of various Callophyrs species reported elsewhere65. A unit cell of a = 339 ±5 nm was calculated. *denotes a peak not used in the calculations due to the close proximity of the central beam.
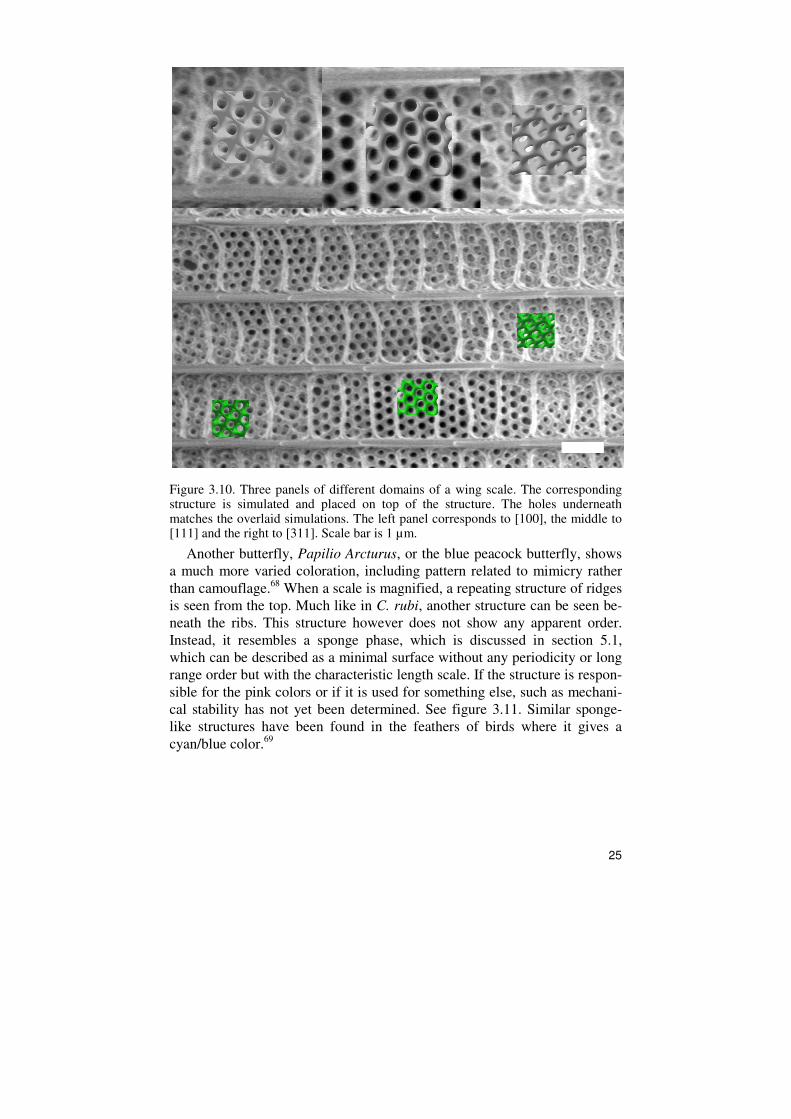
The structure of the photonic crystals in wing scales of C. rubi belong to space group I4132, which contains both left and right handed chiral ele-ments.66 These are easily visualized by studying the srs-net shown in figure 3.9. a-b (for a review of the connection between srs-nets and C. rubi see 67). The srs-net has a three-fold connectivity that represents the topology of the tunnel axes on one side of the gyroid i.e two srs-nets of opposite handedness make up the tunnel axes of both sides of the gyroid. By viewing the net from the [111] direction (figure 3.9a) the chiral elements seen are right handed while looking down the [100] direction (figure 3.9b) the chiral elements seen are left handed. Thus, the butterfly should contain both left and right handed elements within a single domain. The chiral elements of the structure and its replicas are further analyzed in section 5.6. Another intriguing property of this structure is the crystallographic orientations of the individual domains. By analyzing the arrangement and the angles of the porous network and re-lating this to the unit cell size, as determined by SAXS, it can be concluded that the photonic crystal domains are oriented with the [100], [111] or the [311] axes normal to the plane of the wing scale. The individual distribution of these orientations, measured on the surface of a typical wing scale, is 55.2% for the [100] direction, 10.9% for [111] and 33.9% for [311]. A panel with these three different projections is seen in figure 3.10. Interestingly, these three orientations are all related by a single rotation around one of the <110> axes. When looking down the [100], [111] or the [311] crystallo-

24
graphic orientation, (110) Bragg planes are always oriented normal to the surface of the wing scale. This is likely connected to the chiral properties of the different orientations and also has implications of the formation of the gyroid structure nm wing scales. It can be noted that chiral elements are not present along the [110] direction of the srs-net. The absence of photonic crystals oriented with the [110] direction normal to the wing scale suggests that the organism is somewhat optimized towards a chiral response.
Figure 3.9. The srs-network from two different directions: a) [111] which show a right hand twist and b) [100] which shows a left hand twist. Thus, this structure has the potential to twist the light in both directions. In c and d the same network is seen but here with the gyroid minimal surface modeled on it, separating the space in two equal and continuous compartments. Adapted from paper II
25
Figure 3.10. Three panels of different domains of a wing scale. The corresponding structure is simulated and placed on top of the structure. The holes underneath matches the overlaid simulations. The left panel corresponds to [100], the middle to [111] and the right to [311]. Scale bar is 1 µm.
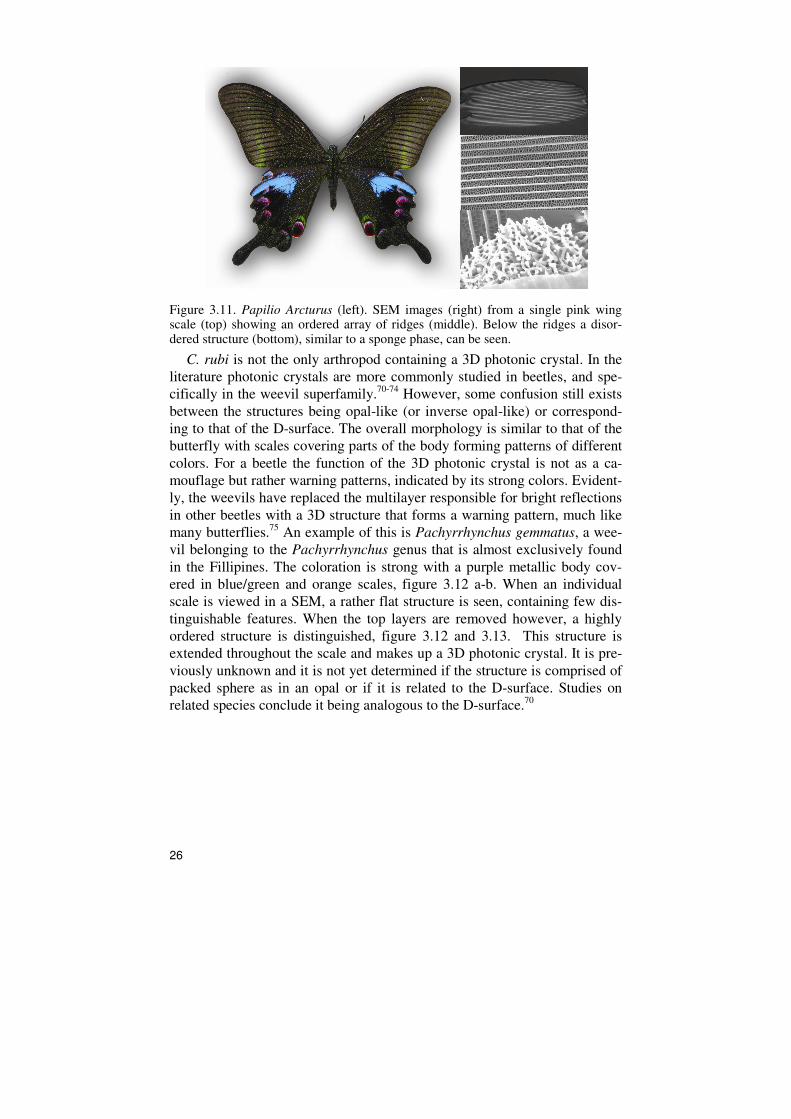
Another butterfly, Papilio Arcturus, or the blue peacock butterfly, shows a much more varied coloration, including pattern related to mimicry rather than camouflage.68 When a scale is magnified, a repeating structure of ridges is seen from the top. Much like in C. rubi, another structure can be seen be-neath the ribs. This structure however does not show any apparent order. Instead, it resembles a sponge phase, which is discussed in section 5.1, which can be described as a minimal surface without any periodicity or long range order but with the characteristic length scale. If the structure is respon-sible for the pink colors or if it is used for something else, such as mechani-cal stability has not yet been determined. See figure 3.11. Similar sponge-like structures have been found in the feathers of birds where it gives a cyan/blue color.69
26
Figure 3.11. Papilio Arcturus (left). SEM images (right) from a single pink wing scale (top) showing an ordered array of ridges (middle). Below the ridges a disor-dered structure (bottom), similar to a sponge phase, can be seen.
C. rubi is not the only arthropod containing a 3D photonic crystal. In the literature photonic crystals are more commonly studied in beetles, and spe-cifically in the weevil superfamily.70-74 However, some confusion still exists between the structures being opal-like (or inverse opal-like) or correspond-ing to that of the D-surface. The overall morphology is similar to that of the butterfly with scales covering parts of the body forming patterns of different colors. For a beetle the function of the 3D photonic crystal is not as a ca-mouflage but rather warning patterns, indicated by its strong colors. Evident-ly, the weevils have replaced the multilayer responsible for bright reflections in other beetles with a 3D structure that forms a warning pattern, much like many butterflies.75 An example of this is Pachyrrhynchus gemmatus, a wee-vil belonging to the Pachyrrhynchus genus that is almost exclusively found in the Fillipines. The coloration is strong with a purple metallic body cov-ered in blue/green and orange scales, figure 3.12 a-b. When an individual scale is viewed in a SEM, a rather flat structure is seen, containing few dis-tinguishable features. When the top layers are removed however, a highly ordered structure is distinguished, figure 3.12 and 3.13. This structure is extended throughout the scale and makes up a 3D photonic crystal. It is pre-viously unknown and it is not yet determined if the structure is comprised of packed sphere as in an opal or if it is related to the D-surface. Studies on related species conclude it being analogous to the D-surface.70

27
Figure 3.12. The weevil Pachyrrhynchus gemmatus with its strong coloration (a) which, upon magnification, can be seen to originate from individual orange or blue/green colored scales (b). In the SEM, a single scale is almost featureless (c). When the topmost layer is peeled off, an ordered structure can be seen (d). Scale bar is 10 µm in c and 1 µm in d.
Figure 3.13. SEM of the photonic structure in P. gemmatus. The ordered structure has, in related species, been determined to correspond to the D-surface. In a) the structure can be seen from multiple angles and it appears to be divided in several domains. In b) the diamond symmetry and its 4-connectivity can be seen. Scale bar is 1 µm. FFT of b) shows an average distance of 256±3 nm which indicates a unit cell of 362 nm.

28
4. Ordered structures in synthetic systems – templated materials
Ordering is a loose definition that can include both crystallographic order as well as dimensional order. Many, but not all, of the ordered materials de-scribed here are somehow related to the minimal surfaces introduced in the previous chapter. As discussed, ordered materials are plentiful in nature but are also common in man-made systems where they are used in numerous industrially important applications such as cracking of fuels and as laundry detergent. Several different materials, all produced by using a template, will be described – starting with materials having a very small unit cell and then progressively increasing in size. As a background to the results, this chapter contains a brief review of some different porous materials and their struc-ture. The discussion is then extended to biotemplating, where techniques used in creating porous materials are applied on biological templates. Then, photonic materials, which are defined by the interaction with electromagnet-ic waves, will be described, including the fundamentals of electromagnetic interaction with a photonic crystal. The result from two studies, correspond-ing to paper I, III and IV, is presented following each of the theoretical backgrounds. The first study concerns the synthesis of a macroporous hierar-chical material and the second describe the usage of scales from C. rubi in producing inorganic 3D photonic crystals.
4.1. Porous materials – micro to macrostructured Porous materials, defined by having a porous interior, are a very broad re-search area. The importance of these materials arises from their ability to store, contain, separate and protect molecules, the use as nanoreactors in catalysis as well as their interesting properties in fluid and heat flow. Fur-ther, they often have macroscopic outer dimensions which improve material processing. Plenty of disordered porous materials exists, but using materials with an internal order gives a tight pore size distribution which ensures re-producible behavior and helps the characterization and classification of the material. The research in this area has, during the past decades, made some significant advances and today it is to a large part focused on increasing the control of the size, shape and uniformity of the pores as well as creating new

29
compositions and applications. A fundamental field of study is how different materials subdivide space. Two types of porous materials will be described here, the crystalline zeolite and the amorphous mesoporous material. As an overview of the length scale discussed in this chapter, the reader is referred to figure 4.1.
Figure 4.1. Transmission electron microscopy images of templated materials of different length scales, from microporous via mesoporous up to macroporous. Start-ing from the right side, Zeolite β polymorph C templated using a cation (Scale bar 10 nm, image courtesy of O. Terasaki76) , mesoporous silica templated using a ca-tionic surfactant (scale bar 50 nm), mesoporous silica templated using block co-polymer (scale bar 100 nm), silica foam templated using a swollen block co-polymer (scale bar 50 nm) and finally a silica photonic crystal templated using a butterfly wing (scale bar 500 nm). The images with a red frame are materials presented within this thesis.
4.1.1. From microporous zeolites to mesoporous silica Zeolites are porous aluminosilicates with a uniform pore size, ranging from a few Ångström up to 2 nm, and a highly ordered structure. They are con-structed from TO4 tetrahedras where the T is either Al or Si. Each oxygen atom is shared with a tetrahedral atom (T) which gives a framework ratio between O/T of 2. Since silicon has a net charge of +4 it generally prefers a tetrahedral coordination. Since oxygen has a charge of -2 and is shared in a framework, the net charge for silicon will be zero. Thus, a framework made up purely from silica will not contain any charge. When alumina is intro-duced in the network, with its +3 valency, the net charge will instead be -1. This aluminosilicate framework is therefore balanced by a cation, typically Na+, K+, alkali earth metals or H+.77 Zeolites are synthesized through crystal-lization of the precursors at elevated temperatures (50-200°C) in alkaline

30
aqueous systems.78 A zeolite can be described as an open framework solid. Tthere are 133 different framework structures, resulting in over 800 zeolites, of which many are very complex. Some of these frameworks have been shown to sit on or close to one of the periodic minimal surfaces. This realiza-tion allowed for some predictions regarding the properties of zeolites. It has been shown that the adsorption in hydrophobic zeolites, consisting of only Si2, depends on the Gaussian curvature. The adsorption is maximized when the Gaussian curvature is negative, forming a saddle structure, preferably with a similar size as the adsorbing molecule. Further, a smooth transition between curvatures, as in the case of minimal surfaces, will help the adsor-bates find the preferred site of adsorption. Therefore, the higher the negative Gaussian curvature, the stronger the adsorption energy, up to a point.79 Using a TPMS description in the quantitative analysis of zeolites have been useful in understanding the range of framework densities.80
While zeolites are microporous and crystalline, mesoporous materials are generally amorphous and contain pores in the meso-range (2-50 nm). Surfac-tants are used as structure directing agents when synthesizing ordered meso-porous materials. Therefore, the behavior of a surfactant in solution is the key factor behind the diverse structures found among the different classes of materials. Surfactants in solution can have complex phase diagrams includ-ing structures such as micells, rods, bicontinuous and lamellar81, much like lipids described in section 5.1. Similar to the lyotropic lipids; altering the concentration of the surfactant in the solution results in materials with differ-ent structure.82 There are several types of surfactants, the most commonly used being cationic and nonionic due to the positive charge of silica. Utiliz-ing co-structure directing agents (e.g. aminosilanes), anionic surfactants can also be used.83 The materials first reported by Kresge et. al. at Mobile Cor-poration contained pores between 15 and 100 Å large.84, 85 MCM-41, as it was designated, had a hexagonal pore arrangement with a surface area of 700 m2/g. The transmission electron diffraction pattern revealed a highly ordered structure with a d-spacing of 40 Å and, by using x-ray diffraction, a hexagonal unit cell with a = 45 Å. It was also discovered that the pore size could be altered by using surfactants with different chain length and by using oil as a swelling agent86. Shortly thereafter, by using a triblock copolymer, e.g. poly(ethylene oxide)poly(alkylene oxide)poly(propylene oxide), as structure directing agent, a well ordered material with a pore size up to 300Å was synthesized. These materials were designated SBA from the group at University of California Santa Barbara and the most well known material is SBA-15, which has a hexagonal pore arrangement.8
Several of the mesostructured materials contain a cubic phase and can, similarly to several zeolites, be described by periodic minimal surfaces. Us-ing TEM, X-ray diffraction and computer simulation it was shown that MCM-48 lies close to the midplane of the gyroid surface.87

31
There are numerous methods to produce mesostructured materials. The first to be described employed precipitation of the silica from solution. The silica source is first hydrolyzed and the dissolved template molecule is added under stirring. This solution forms a milky suspension of silica particles that grow over time, forming rod shaped structures with an internally ordered pore system that can be filtered from the solution.88 An alternative method for producing mesostructured materials was presented in 199589 and the term evaporation induced self assembly was coined in 199790. This method is based on the use of solvents to solubilize the templating molecules and then achieving a selective evaporation by using different solvents. Thus, both the hydrolysis and condensation of the silica species can be controlled in a more precise manner compared with the precipitation method. In 1999, mesopor-ous colloids created by an aerosol generator were reported. Using the selec-tive evaporation approach and by quickly heating up aerosol droplets, or-dered materials in the shape of solid spheres were made. Several different amphiphilic molecules were used to produce cubic, hexagonal, and lamellar structures.91 The mechanism of silica hydrolyzation and condensation at the interface of the block-copolymer in solution and the simultaneous phase transformation by the block-copolymer is complex. It is affected by several parameters such as temperature, polymer concentration, pH, ethanol concen-tration, and presence of salt. For a more detailed description, the reader is referred to other papers on the subject.92-94
4.2. Preparation of a hollow core shell silica foam of low thermal conductivity (Paper IV) Here, results from a study, in which hollow spheres with walls made of a polyhedral silica nanofoam with open cells have been synthesized, are pre-sented. The SBA-type materials described in the previous chapters have been the basis for many materials with pores in the meso range but with varying morphology and surface chemistry. The same group later expanded the pore sizes by introducing trimethylbenzene (TMB) as a swelling agent to the poly(ethylene oxide)-poly(propylene oxide)-poly(ethylene oxide) triblock copolymer. By adding TMB, the pore size can be expanded - from a unit cell of 6 nm to 12 nm at a TMB/P123 ratio of 0.2-0.3. Above this ratio a new type of material is formed, named mesocellular foams (MCFs).86, 95 At a TMP/P123-ratio of 2.5, a transition to a spherical void-containing foam structure is seen, with a pore size between 22-42 nm and 84% porosity with uniform foam cells with an inter-connected network of windows. The TMB is preferentially solubilized in the micelle core which forces the pores to swell. More recently, this system was further extended by increasing the swelling agent to polymer ratio at elevated temperatures, leading to polygon-

32
al foams with pores beyond 100 nm and porosities up to 90% and a material with foam like properties, referred to as polyhedral nanofoams (PNF’s) .96 Here, the design principles of a silica nanofoam is combined with a hollow core approach, which is achieved by combining a microemulsion with an emulsion of triglyceride oil droplets. Firstly, the microemulsion film of block co-polymer is used as a template for the condensation of the silica species at the macroscopic oil-water interface. The microemulsion controls the length scale of the foam cells, similar to the formation of other meso-structured materials, giving a monodisperse silica nanofoam. Since the trig-lyceride oil is poorly solubilized in the P123 corona, the emulsion droplets only determine the dimensions of the spherical shells. The connectivity of the foam arises when the faces of a foam bubble meet another face, giving a small opening in the structure and an ink bottle shape to the pore system. By using P123:TMB in a 5:1 ratio the resulting pore size is around 30 nm and the porosity is achieved by removing the templates by calcination. The final material is a hierarchically structured and porous shell foam that packs into beds with a porosity of approximately 97.9%, which is in the range of silica aerogels. Figure 4.2a shows a single sphere, approximately 60 µm in diame-ter, and 4.2b a cross sectioned sphere where the individual foam cells can be seen. The thickness of the wall is 800 nm and the large foam cells extend through the entire structure. This hierarchical material has a number of prop-erties, such as low density and high porosity, originating from the double templating which produces structures both on a mesoscale and a macroscale. The large pores running through the structure allow for fast diffusion through the shell, making it a suitable material in separation applications while the high porosity and thin primary walls could be useful in insulation applications.
Figure 4.2. The mesocellular hollow core particles. A) a single particle, ~60 µm in diameter with b) a porous wall with an interconnected network of macroporous cells. Scale bar is 10 µm (a) and 100 nm (b)

33
Figure. 4.3. Illustration describing the double emulsion templating method. The block copolymer form micelles to which the silica species condense. These micelles assemble, and in the presence of the triglyceride emulsion droplets, form a shell surrounding the droplets.
Figure 4.4. Nitrogen porosimetry (a) and SAXS-data (b) for the hollow core par-ticles. The nitrogen porosimetry indicates the material to show macroporous charac-teristics while the SAXS confirms the long range order of the pore structure.
4.3. Biotemplating – from organisms to inorganic material The use of biological assemblies as a template in creating inorganic mate-rials is a method to achieve the length scale or hierarchy possessed by these materials. The process of material synthesis occurring in organisms often far surpasses the self-assembled systems used in inorganic synthesis. As will be shown, the engineering of new materials from biomolecules often mimics the process of biomineralization. Here, as a background to the results pre-sented in section 5.5, structures relevant in biotemplating are described to-gether with resulting material.
Biotemplating covers all possible length scales, from biomolecules with details in the single nm range such as DNA, proteins and lipids via microor-ganisms with larger features such as bacteria, and single cell eukaryotes up to multicellular structures, including cellulose fibers, diatom frustules and

34
the wings scales of butterflies. In general, the conversion of a naturally oc-curring structure into the inorganic replica can be done by two different me-thods. The precursors, being a vapor, liquid or a solid can either react with the template itself, converting it through chemical processes, or deposit on the surface of the template and form a hybrid material with the option to remove the starting material. The wide palette of available biological tem-plates can be used to create, as will be shown here, a multitude of different materials. In organisms, biomineralization occurs through the concentration of inorganic species onto a support that initiates the crystallization process. The support could be everything from a planar sheet to an intricate 3D ma-trix and the inorganic species assemble due to diffusion or by the aid of pro-teins.97 This process is occurring across the whole kingdom of life, from the shells of the sea urchins to the bones in our body.98
4.3.1. Templating photonic crystals from arthropods As described in Chapter 3, colors in invertebrates such as butterflies and beetles originate from complex structures. These materials provide a suitable template for creating material useful in optical applications and a number of materials have been used such as silica99, 100, titania101, 102, tungsten (IV) oxide103 and several transitional metals such as Pt, Au and Cu104. The me-thods used for synthesis range from sol-gel chemistry100 to chemical vapor deposition (CVD)105 and atomic layer deposition (ALD)106, 107. As has been shown, butterfly wings are especially useful as templating material as they have been used in a number of applications such as a SERS substrate104, a gas sensor103, 108 and an optical beam splitter106.
4.3.2. Eukaryotes as templates Eukaryotic cells contain a nucleus and a number of organelles not present in prokaryotic cells. As has been shown throughout the thesis, these organelles can sometimes contain highly structured cellular assemblies.
Among eukaryotes, there is a large number of species that contain struc-tures potentially useful in biotemplating. An example is the hard exoskele-tons of various organisms, including many marine plankton species. Particu-larly noteworthy are the unicellular diatoms, photosynthetic microorganisms with more than 10 000 known species. The cell wall naturally incorporates silica and forms very complex structures. This process of silica formation or biomineralization is carried out using a specialized intracellular compart-ment that acts as a reaction vessel for both precipitation of precursor mole-cules and structure formation.109 Similar to the butterflies, the structure of diatoms has been replicated by several methods – creating cell walls consist-ing of boron nitride110, TiO2
111 and elemental Si.112 Several applications, including a low-voltage NO sensor112 and a SERS substrate for detection of

35
organic molecules have been realized.113 Apart from the structure being use-ful in itself, diatoms have been used in the field of proteomics. By isolating the protein responsible for the silica formation, silaffins, silica was precipi-tated from solution in vitro.114
The echinoderms or sea urchins contain a skeletal system that is built from a single crystal calcite. Interestingly, it was noted in a 1969 publication by Donnay et. al. that the interface between the calcite and the organic amorphous matter divides the space in two approximately equal parts, and it was proposed that this structure was related to Schoen’s minimal surface, the Gyroid.115 Later, this structure was used as a template, generating a macro-porous gold structure by depositing gold particles on the surface.116 The system was extended to include CaCO3, SrSO4, PbSO4, PbSO3, NaCl and CuSO4.
117 By using swollen block-copolymers, a structure of the same to-pology as found in the echinoderm skeletal plates could be synthesized and converted into calcite, an example of “bioinspiration”.118
4.3.3. Bacteria and viruses as templates Bacteria are easy to grow and they have a short generation time, two proper-ties that make them suitable in large scale production of potential templates. Even though a bacterial membrane usually does not contain structures useful for templating they have, to a limited degree, been used as biotemplates, creating bacterially shaped zinc oxide119, lead sulfide and zink sulfide.120 Another, perhaps more useful approach is to use superstructures created by bacteria, for example filaments. An example is the extraction of fibrous mul-ticellular threads from a bacterial solution, giving large mineralized threads of silica.121 The ability of some bacteria to bind and precipitate metallic ions has been used as a method to create metal structures. One example being magnetotactic bacteria which use magnetic nanoparticles for navigation.122 It is not known how this biomineralization process occurs in details. It is be-lieved that the bacteria express a metal chelating protein on the cell surface that binds and reduces the iron, after which another protein then transports the ion, possibly by a proton gradient, to a separate vesicle where nanopar-ticles of various crystal structures and compositions are assembled.123 By applying this principle, gold and palladium structures have been synthesized through the reduction of corresponding metal salts, resulting in nanoparticles in the range of 20-50 nm.124 For a general review on the subject, see Mandal et.al.
125 A highly ordered structure has been found in prokaryotes, named the S-
layers, a planar array of ordered protein structures found in the cell mem-brane among many bacteria and archea.126 The S-layer protein is the outer-most component of the cell wall and can, on a molecular level, vary widely in structure but with the common property of assembling into 2D molecular arrays in vivo, in suspensions, at the air-water interface and on solid sup-

36
ports. Following recombinant expression and purification, S-layer proteins can be deposited on various substrates, creating ordered surfaces for templat-ing.127 It has, for example, been used in the templating and alignment of CdSe quantum dots.128
If the usefulness of bacteria in templating has been limited the situation is the opposite for viruses. Their often complex shapes and nanoscale features make them highly useful as templates for various materials. Since a virus can be described as a self-assembled structure consisting of RNA and coat pro-teins that can form the same structures when purified and assembled in vi-
tro,129 it is a versatile tool in material science. One of the earlier studies that used this principle managed to assemble empty virus structures by removing the RNA of the cowpea chlorotic mottle virus. These could then be filled with paratungstate or decavanate. Upon altering the pH the virus capsule swelled and pores formed, leading to a change in pH and the subsequent mineralization of the inorganic specie inside the capsule, forming uniform virus-shaped metal particles.130 Another widely used virus is the tobacco mosaic virus (TMV) that form rod-shaped structures which have been mine-ralized using silica, PbS, CdS and Fe oxide by simple sol-gel or pH based precipitation methods.131 The same virus has also been used to precipitate 4 nm particles of Pt, Au and Ag.132
4.4. Photonic structures – the electromagnetic spectra The 3D photonic crystals found in butterflies and beetles described previous-ly are, in many aspects, very complex materials. Here, the basics of photonic crystals and their interaction with light are described as a background to the results presented at the end of the chapter.
In material science, a crystal is defined as an assembly of atoms or mole-cules periodically arranged in a lattice. In solid-state physics the electrons interacting with a semiconductor crystal are affected by the type of atoms and the arrangement of the lattice. In order to describe this interaction, a quantum mechanical description of electrons is used where they act as waves propagating through the structure. The electrons can be hindered from prop-agating at certain energy levels, an event that forms gaps between the va-lence band and the conducting band. For photonic crystals, the atoms are replaced by a dielectric, macroscopic media while the electrons are replaced by electromagnetic waves, i.e. photons. Thus, a photonic crystal can be de-fined as a periodical structure with a periodicity corresponding to the wave-lengths of photons.133 The photonic crystals described in this thesis interact with visible light, corresponding to 390-770 nm. The theory however, can be applied to all length scales and the whole electromagnetic spectrum. As mentioned, light is treated as an electromagnetic wave without considering quantum mechanical properties. However, since the photonic crystal is an
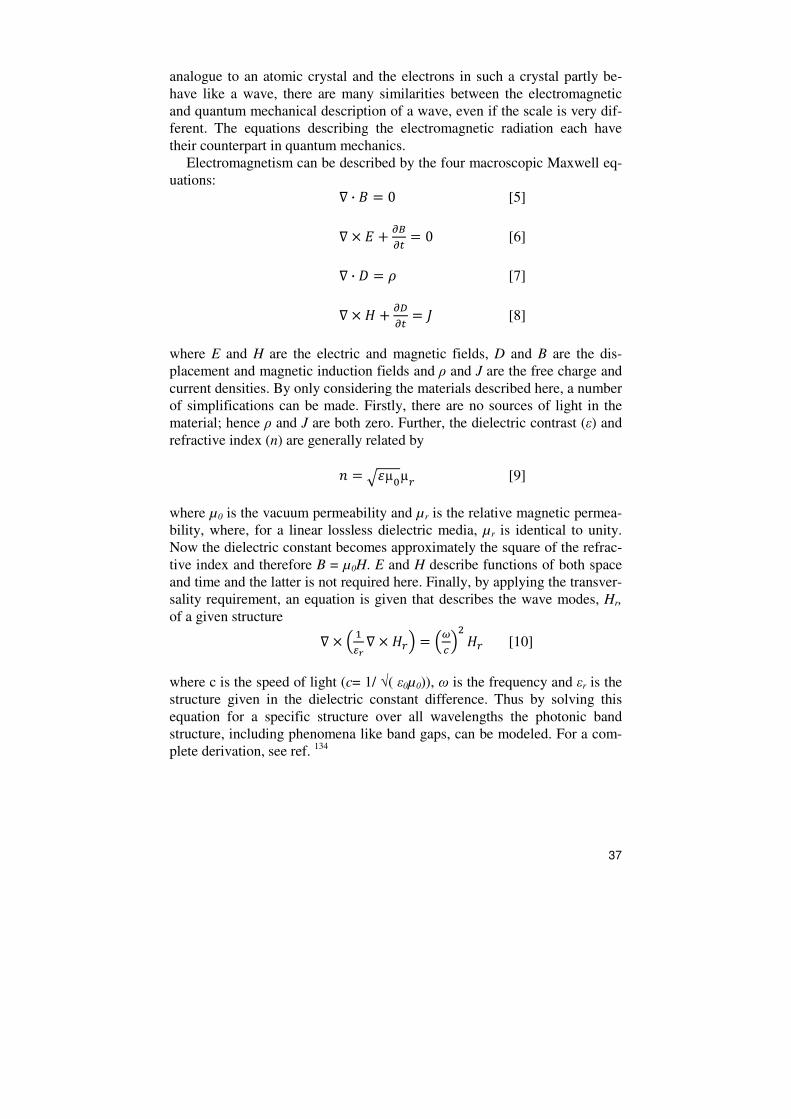
37
analogue to an atomic crystal and the electrons in such a crystal partly be-have like a wave, there are many similarities between the electromagnetic and quantum mechanical description of a wave, even if the scale is very dif-ferent. The equations describing the electromagnetic radiation each have their counterpart in quantum mechanics.
Electromagnetism can be described by the four macroscopic Maxwell eq-uations:
# · % � 0 [5]
# & ' � ()(* � 0 [6]
# · + � , [7]
# & - � (.(* � / [8]
where E and H are the electric and magnetic fields, D and B are the dis-placement and magnetic induction fields and ρ and J are the free charge and current densities. By only considering the materials described here, a number of simplifications can be made. Firstly, there are no sources of light in the material; hence ρ and J are both zero. Further, the dielectric contrast (ε) and refractive index (n) are generally related by
� � 01µ2µ3 [9]
where µ0 is the vacuum permeability and µ r is the relative magnetic permea-bility, where, for a linear lossless dielectric media, µ r is identical to unity. Now the dielectric constant becomes approximately the square of the refrac-tive index and therefore B = µ0H. E and H describe functions of both space and time and the latter is not required here. Finally, by applying the transver-sality requirement, an equation is given that describes the wave modes, Hr, of a given structure
# & � �45 # & -3� � �67��-3 [10]
where c is the speed of light (c= 1/ √( ε0µ0)), ω is the frequency and εr is the structure given in the dielectric constant difference. Thus by solving this equation for a specific structure over all wavelengths the photonic band structure, including phenomena like band gaps, can be modeled. For a com-plete derivation, see ref. 134

38
Figure 4.5. Photonic crystals with the dielectric constant varying along either one (left), two (middle) or three (right) axes made up from two materials with a differ-ence in dielectric constant.
Photonic crystals can be divided into three categories according to their dimensions or the number of directions the dielectric contrast can vary; 1D, 2D and 3D, as illustrated in figure 4.5. A 1D photonic crystal is the simplest possible structure and can be described as a multilayer film of two materials with a difference in the dielectric contrast. Lord Rayleigh wrote as early as 1887 about the color of thin plates and presented an analysis of multilayer films.135 Today, the same concepts are used in mirrors and optical filters. The physical basis for the colors can be explained by considering a plane wave hitting the surface in figure 4.5a perpendicularly. If the blue and the red regions contain a difference in the dielectric constant, the spectrum will contain a frequency gap i.e. there will be no allowed modes in the crystal that have a frequency within a (see figure 4.5), resulting in a band gap. This structure is also called a Bragg mirror and the occurrence of a gap can be explained as constructive interference for a specific frequency. In general, the greater the difference in dielectric contrasts, the wider the band gap. If a wave with a mode in the forbidden frequency would hit the crystal, its am-plitude would exponentially decay within the crystal. The concept of a band gap is important in the field of photonic crystals and the location and the usefulness of a material are often determined from the location and width of the gap.134 The term band gap usually describes a complete band gap, but is also used when talking about partial band gaps where a portion of the light exits the crystal. Another term for a partial band gap is stop gap.
A 2D crystal is simply periodic along two of its axes, a typical example being the packed rods showed in figure 4.5b. Therefore, this structure can have band gaps for wave vectors pointing in the plane of periodicity and similarly dependent of the dielectric contrast between the two materials. As mentioned, the overall photonic band structure, including the location and width of band gaps, depends on the dielectric constant but also the “thick-ness” or the ratio of the high ε structure, here graphically represented by the width of the red rods or veins. This property is also called fill fraction or volume fraction.

39
3D photonic crystals are periodic in three dimensions and are analogous to atomic crystals with its 230 space groups where the atomic bonds represent the veins or rods. Thus, there is a very large number of possible structures but as it turns out, very few give rise to band gaps.134 100 years after Lord Rayleighs publication on 1D photonics, the concept of 3D struc-tures was first discussed.136 The structure predicted to contain a band gap was diamond packed spheres that, if the dielectric contrast was high enough and the radius of the spheres was large enough to make the structure inter-connected, displayed a full band gap. In fact, the spheres need to be large enough to overlap, making the structure a diamond network. This is true both for solid spheres in air or air spheres in a dense media.137
The structure first used to realize a photonic band gap is named Yablono-vite, after its inventor. It can be described as a solid piece of a dielectric ma-terial with an array of holes; each drilled three times at an angle of 35.26°. The reason this construction was the first to display a photonic band gap is simply because it was easy to manufacture. The slab was in the cm size range and analyzed in the microwave region.138 The woodpile structure also produces a band gap and is built from stacks of rods with alternating direc-tions in the plane.139 Inverse opals are another important structure that gives rise to band gaps. The packing of spheres, found in opals, produces a partial band gap, or iridescence – similar to the structural colors in insects, de-scribed in Chapter 4. The inverse structure however, described as air spheres in a dielectric media, is continuous and produces a gap.140
Perhaps not surprisingly, it has been suggested that self assembled struc-tures corresponding to triply periodic minimal surfaces (TPMS) could be used as a photonic band gap material. Calculations were made for the P-surface, the gyroid and the D-surface with the G and the D giving rise to band gaps while the P-surface did not.141 This was calculated at a dielectric constant contrast of 13 and a fill fraction of 50%. All structures discussed above are a representation of the diamond symmetry. Therefore it is interest-ing to note that the gyroid, which is three-connected, also creates a band gap. These simulations were later expanded to cover more TPMS and dielectric constant contrasts. The D-surface and the gyroid performed similarly and the minimum requirement to produce a complete band gap for the latter was a contrast of at least 4.8 at a fill fraction of 25% or a fill fraction between 0.01 and 0.5 at a contrast of 11.9.142
The structures predicted to have excellent band gap properties, are com-plex and difficult to manufacture. A large number of methods has been uti-lized in the attempts. Using traditional methods of manufacturing for micro-electronics can yield a woodpile structure with a band gap in the IR-range.143 The Yablonovite structure has been manufactured using X-ray lithography, without resulting in a complete band gap.144 Self-assembled block-copolymers, showing gyroidal morphology, have been used as photonic crystals, also without creating a full band gap.145 A similar approach of self
40
assembly has been utilized for colloidal spheres that, on a silicon substrate, give structures essentially defect free containing a complete band gap, albeit not in the optical regime.146 As discussed in the previous chapter, some in-sects contain 3D photonic structures that display partial band gaps. By com-bining methods from sol-gel chemistry with available photonic structures in nature, it is possible to create inorganic photonic materials without the need for expensive lithographic techniques and with band gaps in the optical re-gime. This will be discussed in section 4.5.
A topic, which is largely beyond the scope of this thesis, but still deserves to be mentioned, is the possibility of metamaterial-like properties arising from certain photonic structures. Metamaterials are materials that possess a negative refractive index, which can lead to a number of extraordinary ef-fects such as electromagnetic cloaking and the construction of a perfect lens.147 To achieve a negative refraction, i.e. the reflection of light in the opposite direction at an interface, the electric permittivity and the magnetic permeability both need to be negative. This was first postulated in 1968148 and 33 years later it was shown experimentally.149 As stated previously in this chapter, the materials described here are treated as lossless and transpa-rent in respect to the electromagnetic radiation that passes through it and are assumed to have a very small magnetic permeability. If both ε and µ r are non-zero, like they are in a metal for example, a metamaterial would be possible to construct. In 2004, a new approach to produce meta-effects based on chiral materials was presented.150 Normally when constructing a metama-terial, two structures are needed, one controlling the electric and one the magnetic response. This puts very high demand on the two structures to function in the same frequencies. In the case of a chiral material however, the same structure can influence both parameters and thus greatly simplify the construction of a metamaterial. More recently, a chiral structure was constructed from gold helices that only transmitted the electric response in one handedness (same as the pitch of the helix).151 This difference between left and right handed response is a characteristic of negative refraction. In connection to this; note the difference between figure 4.11a and b.
4.5. Chiral 3D photonic crystals replicated from butterfly wings (Paper I and III) The 3D photonic crystal found in C. rubi, described in section 4.3.1., is a material with properties that surpass much of what can be manufactured using conventional techniques. Therefore, it is a suitable template for creat-ing photonic crystals in the visible spectra. Here, we use the chiral structures of the wing scale of C. rubi as template to produce chiral silica and titania replicas, corresponding to the gyroid structure. The results are further pre-

41
sented and discussed in paper I and III. This section is divided in three sec-tions, corresponding to the different templating materials. For a comparison of the different materials used here, see figure 4.6.
Figure 4.6. a) Wing scale of C. rubi with its mosaic-like structure ranging from yellow to blue in color. The ridges and cross ribs can be seen running along the scale Negative replica in b) silica and c) titania of the same structure with the domains still visible. The ridges and cross ribs are not replicated and thus not visible.
4.5.1. Silica templates of C. rubi wing scales Silica sol-gel chemistry is a suitable method of replicating the structures of C. rubi. Two different silica sol-gel methods were used, with and without a surfactant. The different materials are denoted mesoporous silica and solid silica and data from both are presented. The method using surfactants was an adaption of two previously published reports on the mesostructure materi-al152 and the use of the material as a template for photonic crystals from a weevil.99 Later, a method without any surfactants was developed.
Initially, the wings of C. rubi were washed in ethanol in order to remove loosely bound proteins and lipids on the surface. Individual scales were transferred to a glass or silicon wafer and sandwiched. This setup was used as the starting material for all further experiments. The silica precursor was prepared by prehydrolyzing tetra-ethyl orthosilicate (TEOS) in hydrochloric acid at pH 2 until a uniform phase was formed. A small volume (~1µl) was injected between the glass slides, resulting in replicas comprised of solid silica. Alternatively, the Pluronic F 127© was dissolved in ethanol and add-ed in an F-127/Si molar ratio of 0.03 to the TEOS and stirred for 3 days until an initial growth of nanoparticles was seen in the solution. This resulted in mesoporous walls in the butterfly wing scale replicas in contrast to the solid wall in the system without surfactant. The chitin structure was, after inject-ing the silica sol-gel, removed by soaking the sample in piranha solution

42
(conc. sulfuric acid and 30% hydrogen peroxide in a 3:1 ratio) for 1 hour followed by extensive washing. The sol-gel solution of silica penetrates and fills the porous scales to form the inverse structure of the template which faithfully reproduces the structure of the butterfly, from the individual do-mains seen in a light micrograph, figure 4.6.a-c, down to the details at the nm level, figure 4.7. A TEM image of the same silica structure is seen in figure 4.8 with the mesoporous characteristic visible in the magnified image. The spectral response can be measured using a micro reflectance spectrome-ter. The results confirm the long range replication since the spectral shape is retained, only shifting the peak position towards the blue, figure 4.9. The fill fraction of C. rubi is approximately 20%, i.e. the chitin takes up ~20% while the rest of the structure is air.153 When filling the structure with silica the negative replica, with a fill fraction of approx. 80%, is obtained. This can be seen in electron micrographs, and a comparison of the original structure and the template is seen in figure 4.10. Silica replicas analyzed using polarized light and collecting either left or right handed polarized light are seen in figure 4.11. These results are further discussed in section 4.5.4.
Figure 4.7. Solid silica replicas. a) shows a scale from a random cut where the long range order is seen throughout the sample. b) shows the top view in higher resolu-tion and c) shows a perpendicular cut of one wing scale which has been embedded in an epoxy matrix and cross section polished using an argon bean. Scale bar is 1 µm in a and c and 100 nm in b.

43
Figure 4.8. TEM image of a mesoporous silica template displaying the ordered ma-crostructure (a) as well as the disordered mesostructure (b) from the sol gel used to infiltrate the structure. c) is the same image as a) with a projection of the gyroid structure along the [100] direction with a fill fraction of 80% overlaid on the struc-ture. Scale bars are 1 µm in a) and 100 nm in b).
Figure 4.9. Reflectance spectra of a C. rubi wing scale and its silica template show-ing a similarly shaped peak at a lower reflectivity and a blue shifted maxima.

44
Figure. 4.10. Micro- and macroscopical comparison of the original butterfly a-b) and the solid silica template (c-d). The overall morphology is similar to domains visible in the silica template, albeit in a different color. The SEM reveals a difference in the fill fraction due to the silica being a negative replica.
Figure 4.11. Silica replica under a) polarized light collecting only left hand polarized light and b) polarized light collecting only right hand polarized light. Note how some domains light up more under one polarization compared with the other.
4.5.2. Titania replicas of C. rubi wing scales While silica is a useful material and forms stable solutions, the optical prop-erties are similar to that of chitin and not an improvement compared to the original structure. Titania, is heavily used as a pigment for providing white-ness and opacity and it has a refractive index of between 2.1 and 2.9.154
A titania sol-gel solution was also used to infiltrate and replicate the structure. The precursor sol-gel was prepared by adding 3 g of TTIP to

45
4.36 g of ethanol and 0.16 g of acetic acid. For the titania samples, the tem-plating was done at a low humidity to avoid fast hydrolyzation. The excess solvent was then removed by heating the sample to 80°C for 20 minutes. The chitin structure was removed by calcination at various temperatures. In order to vary the crystallinity of the TiO2, and thus also the refractive index, sam-ples were calcined at temperatures ranging from 400 up to 900°C.
Figure 4.12. Replicas of wing scales from C. rubi in titania calcined at 500ºC. a) shows the bottom of a templated scale with the domains clearly visible. b) shows a cross section through a wing scale where the gyroid structure can be seen. Scale bar is 1 µm in a) and 100 nm in b).
Figure 4.13. Reflection spectra from three samples of titania, calcined at different temperatures. The reflectivity of the original butterfly wing is added for comparison. Note how the 700°C sample possesses a higher reflectivity compared with the 500°C sample but when calcined at 900°C the reflectivity drops. Notice also the different scale on the x-axis compared with figure 4.9.
By using titania to replicate the photonic structures of C. rubi considera-bly larger stop bands are given, figure 4.13. The same blue shift is seen as for the silica and it seems almost independent of the refractive index of the templating materials. This suggests that the reversed fill fraction is contribut-

46
ing to the shift. While samples calcined at 700°C gives, as expected, a higher reflection than samples calcined at 500°C the same does not hold for sam-ples calcined at 900°C. When studying the FFT of the domains in all of these different titania samples, the position of the intensity maximas for the 900 °C have a substantially higher standard deviation between the two axes. This indicates degradation or warping of the structure during crystallization of the titania above a temperature of 700°C.
By performing FFT of SEM images depicting domains, as seen in figure 4.7 and 4.12, the size of the unit cell could be calculated. By studying a large number of unit cells and domains, the difference between the C. rubi, the acid etched silica and the calcined titania could be determined to 336 ±3 nm, 315 ±6 nm and 245 ±7 nm respectively. Clearly, the removal of the organic components in the sol-gels, either by etching or calcination, shrinks the structure, as seen in the blue shift in the reflectivity spectra.
4.5.2.1. Double templating titania replicas
While the properties of the inverse reproduction of the gyroid structure, with a fill fraction of ~80% solid material, is highly reflective, the positive struc-ture is predicted to contain a larger band gap at the same refractive index.142 An attempt to replicate the positive structure was done by initially filling the wing scales with silica sol-gel, as described previously, followed by acid etching of the organic parts. The silica replicas were then infiltrated with a titania sol-gel, also as described previously. The SiO2/TiO2 hybrid was then calcined and treated with either sodium hydroxide or hydrofluoric acid to remove the silica. As seen in figure 4.15, the resulting structure has a lower fill fraction compared with the negative replicas. The reflection spectra, fig-ure 4.1.4. however did not reveal a complete band gap, likely because of the sequential accumulation of small defect in the two replication steps. While the reflectivity is relatively high (~75%) the peak is broader than in the sin-gle step replication.
Figure 4.14. Reflective spectra of titania double replica. Note the broad peak at 490 nm, indicating a partial degradation of the structure in the two replication steps.

47
Figure 4.15. SEM images of the double templated titania that show a lower fill frac-tion compared with the single templated PCs. Scale bar is 1 µm in a) and b) and 100 nm in c).
4.5.3. Nanoparticle replicas of C. rubi wing scales While the results presented earlier are based on the infiltration of a sol-gel solution in the wing scales, other routes to replication are also possible. One method is to infiltrate nanoparticles that are dispersed in a liquid. This allows for a multitude of different templating materials with a wide range of proper-ties. An important factor in the templating is the size of the nanoparticles, which should preferably be sub 10-nm large. Here, by infiltrating the struc-ture with cerium oxide and iron oxide nanoparticles, the photonic structure is replicated. CeO and Fe2O3 nanoparticles dispersed in water were used for infiltration of wing scales, clamped in a fashion similar to previous experi-ment. The removal of the chitin structure was done by calcination at 500°C with 1°C min-1 ramp time. The CeO with refractive index similar to that of titania gives blue scales while Fe2O3 results in red scales, figure 4.16. This red shift could possibly be related to the higher refractive index of Fe2O3
and/or the nonlinear optical properties.155 Recently Fe2O3 was used as a tem-plate for butterfly wing scales and a magnetically tunable optical response was demonstrated.156

48
Figure 4.16 replicas of a) CeO nanoparticles and b) Fe2O3 nanoparticles as shown in a light microscope.
4.5.4. Band gap analysis of C. rubi replicas To compare our experimental data with theory, computations of band struc-ture along three primary crystallographic directions of the simulated struc-ture were performed by M. Saba, Erlangen University. Templating the wing scales of C. rubi yields a structure of inverse fill fraction, with approximate-ly 70% solid component. The computational analysis solves Maxwell’s equ-ations for the Bloch modes of the infinite photonic crystal with a frequency domain eigensolver MPB. Coupling of the field patterns of each of these Bloch eigenmodes with normally incident plane waves of both circular pola-rization states is performed to obtain an estimate for reflectance.157 Strong coupling (large dots in the figures) occur when the frequency and amplitude of the fields are matched at the interface, and the wave is allowed to propa-gate into the crystal. For the very small dots, the transmission is weakly coupled and negligible.
Computational analyses were performed with 70% fill fraction and a di-electric constant, ε = 5.76. The results are given in figure 4.17 for each pri-mary direction. In these plots the khkl is the phase change of the Bloch mode field if the crystal is translated by the lattice constant along the specified direction. The plots show khkl on the x-axis, which is a parameter that is somewhat arbitrarily chosen to show maximal separationof the chiral re-

49
sponse. The main point is that plotting khkl value versus wavelength allows non-degenerate modes of left- versus right-handed circular polarization to be visualized. The khkl values are between 0 at the gamma point, Г and khkl max (right edge of each plot) at the Brillouin zone edge. The different lengths along the respective khkl axes are purely due to the shape of the BCC Bril-louin zone. In [110], for example, the bands have periodicity 1/√(2) and for [111] 1/√(3) .A large dot is indicative of a strong coupling between the inci-dent wave and the structure's Bloch mode, which results in greater part of the light being transmitted through the PC. Similarly, a small dot is a weakly coupled mode and corresponds to large reflection of an incoming light wave. A stop band is then an area of low coupling and the absence of a mode in a certain direction is indicative of a partial band gap. The plot in the [100] direction contains a region defined between 490 and 560 nm at the Brillouin zone edge, across k-space, which is devoid in strongly coupling bands and only contains a very weakly coupled mode. This mode can be correlated to the main peak in the experimental reflection spectroscopy data for the TiO2 replica, where 96% reflectivity has been obtained, see figure 4.13.
Figure 4.17. Band structure analysis along the [100], the [110] and the [111] direc-tions. A large stop gap can be seen for the 100 plot with only a very weakly coupled mode between 490 and 560 nm at the Brillouin zone edge, which corresponds well to the large reflectivity peak seen at 505 nm for the TiO2 photonic crystal. Band gap analysis by Matthias Saba.
For the computed data to be predictive of the observed peak in spectral reflectance, then the absence of the response predicted from both the [110] and [111] directions is required. The physical condition which satisfies this, is where crystals in the butterfly scale are oriented with their [100] axis along the optic axis of the spectrometer, which is commonly observed (see
450
500
550
600
650
700
0 0.2 0.4 0.6 0.8 1
wave length
(nm
)
k100 (2π/a)
0 0.2 0.4 0.6
k110 (2π/a)
0 0.2 0.4 0.6 0.8 1 1.2 1.4 1.6
k111 (2π/a)

50
section 3.5 on crystallographic directions of the domains in C. rubi). The gap in the strongly coupled modes in the [111] direction are sometimes mani-fested as a small shoulder at the blue end of the spectra, but is not as domi-nant as the peak assigned to the [100] response, consistent with the less fre-quent occurrence of this orientation.
4.5.5. Discussion and implication of the replication of the photonic crystals in C. rubi The use of biological structures as templates for optical applications is a promising method to access the visible parts of the spectrum since the pro-duction of 3D photonic materials at those wavelengths has proven to be chal-lenging. Further, by varying the starting material it is possible to tune the optical response by forming materials with different optical properties. As stated in the previous chapter, a number of properties can affect the band structure. In the material presented here the refractive index can be altered and tuned depending on the material that is infiltrated. Further, the fill frac-tion can be either ~80% (negative replica) or ~20% (double replication). The structure itself, corresponding to the gyroid minimal surface, is predeter-mined but still presents a number of possibilities depending on the orienta-tion. It has already been concluded that the corresponding space group is chiral, indicating that this would apply to the structure obtained here via replication. By studying a silica replica and analyzing the reflected light with a left or right hand polarizer, a clear difference can be seen in the images - some domains light up under one handedness, as seen by comparing figure 4.11 a and b. The difference in left and right handed polarized light confirms optical activity in the material, which is a strong indicator of chirality. In fact, this butterfly was predicted to contain a complete band gap in the UV-range for one polarization, which is, as discussed in a previous section, a distinctive property of a metamaterial.157
In conclusion, it has been shown that the optical properties of a naturally occurring photonic crystal can be replicated and, by using a high refractive index material, a structure with close to a full band gap is obtained. Biotem-plating is a viable route to access dimensions of structures that are difficult to synthesize. Apart from their optical properties the materials are shown to be optically active. This indication of metamaterial-like properties encourag-es further studies.

51
5. Artificial cells – from membrane proteins to inorganic carriers
As has been discussed throughout this thesis, the cell is an extremely com-plex machinery, capable of performing a large number of tasks, often using large complex proteins. Here, some of the properties of cells and membrane proteins are examined and utilized in the synthesis of hybrid materials. In this last chapter, the concepts discussed previously, such as biotemplating, membrane proteins and porous materials are combined into a system that mimics the basic functions of a cell. The term “artificial cell” is very loosely used and does not have any distinct definitions. Usually, it involved a system that mimics one or more properties of a cell, such as storage, energy conver-sion, transport or catalysis. Therefore, a large number of design principles and materials is used. As a background to the results, this chapter first briefly discusses the concepts of biological membranes and the important role of lipids and their phase behaviors in water. Further, some examples on how the design principles of a cell can be used to create hybrid materials are giv-en. The chapter is concluded with the results from two studies. The first study describes the combination of a membrane protein with a nanoporous silica sphere acting as an endoskeleton, together forming the basic constitu-ents of an artificial cell. The second study concerns the function of an integral membrane protein and how it affects a lipid bilayer.
5.1. Biological membranes - lipids and proteins Membranes are highly organized assemblies of lipids, proteins and other molecules that regulate the interior of the cell by controlling the flow of nu-trients, ions and waste products. Without the membrane, such basic proper-ties as compartmentalization, replication, signal transduction and energy storage would not be possible. The basis of the membranes is formed by lipids, i.e. amphiphilic molecules that self assemble to form bilayers that can be both totally impenetrable and semi permeable.158

52
5.1.1. Self-assembly of lipids and lipid-water phases Here, some fundamentals of lipids found in biological systems will be de-scribed, including the shape parameter and phase behavior. As will be seen, this is important in both using lipids in biomimetic systems as well as when understanding cell membranes.
Lipids can be either polar or non-polar; here focus will be on polar lipids, which comprise of a hydrophilic head group and a hydrophobic tail, thus being amphiphilic. This property, in which the head group is soluble in water and the tail is not, generates a rich phase diagram in water. A single lipid bilayer, measured by TIR-Raman, can be seen in figure 5.1 Several of the characteristic and well known peaks, like the symmetric and antisymmetric methylene stretching vibrations at 2851 cm-1 and 2897 cm-1 respectively, the Fermi doublet of the CH2 scissoring mode at 1441 cm-1 and 1640 cm-1, the in-plane CH2 twisting mode at 1301 cm-1 and the ester carbonyl stretch at 1733 cm-1 can be seen.159
Figure 5.1. TIR Raman spectrum of a supported lipid bilayer consisting of 40% DOPC, 40% DOPE, 20% DOPS with the background signal from water subtracted. Several characteristic peaks can be noted.
All lipids can be classified into three shapes: cylindrical, conical and trun-cated conical (and the inverse or up-side-down of the latter two), as illu-strated in figure 5.2. The deposited bilayer in figure 5.1 contains DOPC which is cylindrical, DOPE which is truncated conical and the DOPS which is conical. These structures can be mathematically described by S = V/al where S is the shape parameter, V is the total volume occupied by the lipid, a is the size of the lipid head and l is the length of the lipid. For example: li-pids with a single chain and large head give a cone and V/al < 1.

53
Figure 5.2. Lipids can have a number of different shapes that can be divided into cylindrical, conical and truncated conical. This depends on the number and composi-tion of fatty acids as well as the size of the head group.
This shape is common among detergents and forms spherical micelles. The opposite, double chained lipids with small head groups have V/al > 1 and gives inverted micelles. The last cylindrical lipid with V/al = 1 forms a bi-layer without curvature. However, a higher salt concentration would for ex-ample shield charges and thus reduces the electrostatic repulsion and alter the physical shape. A similar effect is seen with pH, temperature and hydra-tion of the head group. Therefore, the physical shape of the lipid does not determine all properties. Still, lipids of different shapes usually have differ-ent phase behavior. 160, 161
The atomic-scale disorder and the long-range order of lipids are summa-rized in the classification lipid liquid-crystalline phases. Phases depending on change in temperature are called thermotrophic while changes depending on the amount of water are lyotropic. Biological systems can be affected by both; however, in the systems studied here the latter is of greater importance. The lipid/water system can be divided into spherical, rod, sponge and lamel-lar phases.32
In dilute systems, the lipids form discrete spheres or micelles, in order to minimize the contact between the tails and water. As the lipid concentration is increased, the micelles are elongated and form rods. If the concentration is further increased, the rods pack into a hexagonal pattern and form a hex-agonal phase. Depending on the S = V/al of the lipid, infinite cylindrical micelles or the inverse, water cylinders in a continuous hydrocarbon matrix, can be formed. When the lipid concentration is increased and the rods start to elongate, some systems contain cubic phases before the hexagonal phase. Of course, the bilayer or lamellar is the most considered and well studied phase in biological systems. 33
A related phase, often occurring together with the cubic and hexagonal phases, is the sponge or melted cubic phase. It can be described as a random

54
structure, dividing the space in two compartments. On a local perspective, the structure is similar to cubic bicontinuous phases. The lack of long range order makes the phase hard to characterize, although today there is a great amount of evidence that such a phase exists.162
Since the lipid is a critical constituent of a cell membrane, the cell has a tight regulation of lipid production. This is required for many reasons but one is to maintain or achieve a certain shape. One example is the lipid com-position of the outer cell membrane, which is basically flat and also different from a very small vesicle, which might require another lipid composition. The membrane compartments need different overall shapes which the cell can, to an extent, regulate by inducing bilayer asymmetry – an unequal dis-tribution between the two monolayers. This asymmetry is upheld by the slow spontaneous diffusion, or “flip-flop” and the enzyme flippases that can cata-lyze the flipping.163
5.1.2. Proteins forming the mosaic of the membrane With the behavior of lipids in mind, the role of proteins can now be consi-dered, which is also required in understanding both the fundamental aspects of membranes, why certain structures forms, as well as when dealing with hybrid systems where a protein is utilized to achieve a specific function.
Although initially believed to be the only constituent in a membrane, li-pids cannot tell the story by themselves. In 1972, Singer and Nicolson pre-sented the fluidic mosaic model which is, with some modifications, the cur-rent view on membrane organization. In short, their theory postulates a flui-dic and a mosaic part of a membrane. In other words, the lipid bilayer model from the 20s was kept intact but the role of the proteins was viewed as sepa-rate globular islands with their hydrophobic parts embedded in a lipid ma-trix. This model of interaction was completely different from previous theo-ries but proved to match the data collected later. Another important part of Singer and Nicolsons theory is the fluidity of the membrane, where lipids are predicted to be in constant motion with a fast lateral movement. This model provided explanation of earlier observations, like hydrophobic globular pro-teins and the fast transport across the membrane.164 Another important dis-covery, the transmembrane protein, was reported by Unwin and Henderson. They studied bacteriorhodopsin, a membrane protein found in a Halobacte-
rium that acts as a proton pump driven by the conformational change in-duced by the light absorbing molecule retina. This proton gradient can then be used to generate chemical energy. The protein in the membrane happens to be arranged much like a crystalline lattice which allowed Unwin and Henderson to characterize it using TEM. This was the first reported structure of a membrane protein. From these TEM images they concluded that the protein contains a single peptide chain folded back and forth through the membrane seven times with each of its segments running through the mem-

55
brane composed of hydrophobic residues.165 Even if the model described by Singer and Nicholsen is the dominating view on how membranes are orga-nized and can be found in all textbooks on the subject, some criticism do exists, the main being the picture of membranes as a vast amount of lipids of identical thickness, occasionally containing a dispersed monomeric protein. An updated view is a membrane with large patches of proteins and lipids of different chain length and composition, making the membrane more mosaic than fluid. 166
5.2. From liposomes to artificial cells After this background on lipid bilayers and the role of proteins, the require-ments for the transformation from a simple bilayer to an artificial cell can be discussed. Something that unites nearly all studies of artificial cell is the need for a container, a separating vehicle for the reactions. A very common starting point in synthesizing a minimal cell is to use molecules that self assemble into vesicles, or, in the case of lipids, liposomes. SUVs or small unilamellar vesicles of lipids are easy to prepare, reasonably stable and have been widely used since they were first prepared in the 1970s.167 To further functionalize this very simple model of a cell, there must be transport through the highly impermeable barrier that is a bilayer. To facilitate trans-port, proteins or transmembral section of proteins can be used, for example short amino acid chains forming a α-helix.168 To mimic energy production in a cell, the most used method is coupling the proton pumping activity of bac-teriorhodopsin or another photochemically active protein with the ATP syn-thesizing capabilities of ATP synthase.169 This gives a coupled reaction that produces energy, albeit for the outside of the cell.
A viable, and principally different, approach in creating an artificial cell is to use extracts of whole organisms, i.e. a top down approach. It has been shown that it is possible to encapsulate extracts from E. coli containing ribo-some, tRNA and other required components such as cofactors, amino acids and ATP, in a phospholipid vesicle. This creates a cell-free reactor capable of sustained protein production when applying amino acids and energy.170 The area of artificial life, in which the functions of the synthetic cell include self-replication, has recently gained great interest, mainly due to the success-ful incorporation of synthetic DNA in a bacterium, replacing its native DNA, and subsequent cell division.171
The examples above utilize biomolecules, synthetic or biologically de-rived, and assemble these to mimic some function of the cell. Another ap-proach is to combine biomolecules with inorganic materials, resulting in a material that utilizes the functionality of both systems simultaneously, there-by gaining novel properties compared with a cell. In an early example solid silica beads were coated with multilamellar vesicles as well as the direct

56
immobilization of proteins on the silica surface.172 Another approach is to use the inorganic material as a matrix or support for functionalized vesicles. It has been shown that by combining proteoliposomes containing ATP syn-thase and a silica sol-gel matrix, the functionality of the proteins is pre-served. By immersing the silica matrix in a buffer the trapped proteolipo-somes are active for up to a month.173
Mesoporous silica spheres, which are generally described in section 4.1.1, are particularly interesting as support for biomolecular assemblies and offer several advantages such as having a large available pore volume for loading of actives and can act as a rigorous cellular endoskeleton. These materials also have the required surface chemistry to allow for the deposition of SUVs.174, 175 In a system similar to the previous example, lipids vesicles and proteoliposomes were used with a mesoporous sphere. Simply mixing of the SUVs together with the silica spheres fused the lipid vesicles on the surface, resulting in coated spheres.176 In the same study, an adhesion protein with one transmembrane domain was incorporated together with the lipids to form a protein containing bilayer, as confirmed by binding to fluorescently labeled antibodies. Similar lipid coated mesoporous spheres have also been used as release vehicles. The model drug calcein was loaded into the par-ticle, which was then sealed by fusion of lipid vesicles. The drug loaded particles were then incubated together with eukaryotic cells that took up the particles and later, due to the change in pH, the drug molecules were re-leased.177 A similar system, based on lipid coated spherical porous particles, was combined with a recombinant eukaryotic membrane protein that, when assembled, formed an artificial cell equipped with an ion-tight membrane capable of proton transport. The activity of the membrane bound enzyme was measured and was shown to be fully functional.178 For additional exam-ples on lipid coated particles and liposomal artificial cells the reader is re-ferred to reviews on the subject.179, 180
5.3. A fully functional primary ion pump immobilized on a lipid coated mesoporous sphere (Paper V) Here, techniques and concepts from previous chapters, such as mesoporous materials, heterogeneously expressed membrane proteins and deposited lipid bilayers, are combined to form a functional hybrid material. In one study, ATP synthase reconstituted in lipid bilayers was deposited on mesoporous silica spheres.

57
Figure 5.3. Confocal laser scanning microscope image displaying mesoporous spheres covered with DOTAP lipids containing 1 mol% of TexasRed© labeled li-pids. The lipid bilayer is seen to be continuous, covering the whole particle.
A bioinert material with a rigid structure and the ability to store large amounts of molecules can be used as an endoskeleton of an artificial cell, supporting both lipids and proteins – the basic constituents of a cell. As dis-cussed above, supported lipid bilayers can be used as a membrane model for studying the properties of the biological lipid bilayers.181 SUVs produced by sonication or extrusion are deposited on the mesoporous silica spheres. The particles are synthesized using a spray-based method with the polymeric surfactant Brij 56© as a template. The connected pores have an average di-ameter of 2.7 nm and the particles have a specific surface area of 778 m2.182,
183 By using 1 wt% labeled lipids in the lipid mixture the bilayer can be visu-alized and studied using confocal microscopy, figure 5.2. The resulting coat-ing is shown to be ion-tight and allows for long term (weeks-months) storage of actives within the porous sphere.178
To further functionalize this system, ATP synthase, a large membrane protein, has been reconstituted in the lipid bilayer, schematically depicted in figure 5.4. This protein is a part of the electron transport chain that mediates electrons from a donor molecule to an acceptor and uses the electrochemical Na+-gradient to generate energy in the form of ATP. The opposite case, transport of Na+, independent of a chemical gradient by using up ATP, is also possible and is the mode utilized here. The enzyme used is purified from the anaerobic bacteria Ilyobacter tartaricus in which it is used for

58
transporting Na+. The protein consist of two parts, the water soluble F1 and the membrane bound F0, both operating as independent entities, schematical-ly depicted in figure 5.4. The protein uses the Na+ gradient to rotate the F0 which generates a torque in the F1 part through a mechanical coupling by a central stalk. This conformational change results in a catalytic site for the reaction of ATP from ADP being accessible.184 In the reverse ATP hydroly-sis mode, ATP is instead used up and ions are actively transported through the channel. Reconstitution of the ATP synthase is a robust procedure that has confirmed activity of the proteoliposomes.185 The activity of the ATP synthase is measured by detecting Na+ on the inside of the artificial cell. This is done using Sodium Green (SG), which was loaded in the particles prior to coating of the proteoliposome containing the ATP synthase. By imaging a large number of particles in real time using the confocal microscope, the response can be monitored when ATP and sodium are added to the system. Figure 5.5 shows response curves of 30 particles that, upon adding the ATP and sodium, increase 60% in intensity from the normalized initial value.
The response of the enzyme occurs within 8 seconds, after which it levels out. Usually, the kinetics of ATP synthase in liposomes can be studied for time periods of minutes before the reaction is inhibited. Data from SG-loaded mesoporous spheres without any coating or enzymes indicate that this effect is caused by the fluorescent response of the SG – an increase in so-dium concentration inside the particles does not give a linear response and is limited to low sodium concentrations, i.e. a Na+ concentration above 1 mM is not detected. To determine the activity levels of the enzymes the same batch of proteoliposomes, used for the activity measurements in figure 5.5, was studied in solution as well, where normal activity levels were measured, see paper V for additional details.

59
Figure 5.4. A schematic illustration of ATP synthase, transporting Na+ into the por-ous particles by consuming ATP. The increase in Na+ inside the silica matrix causes the fluorescence of sodium green to increase. Adapted from paper V.
This system mimics the basic components of a cell; a tight membrane, an active transport of ions across a chemical gradient, a robust endoskeleton that maintains the morphology and partitions the inside volume from the outside environment. This allows for a tunable platform for transmembrane proteins and the complexity can be increased by adding more proteins, mi-micking a cascade reaction within each individual particle. One can also envision methods that allow for an event to occur, such as release of active substances or specific binding, when in contact with certain biological moie-ties i.e. highly specific triggering and release of active molecules.
Figure 5.5. ATP synthase driven transport of Na+ into lipid bilayer coated particles. Normalized intensity of fluorescence of SG-loaded porous silica spheres sealed by ATP synthase containing bilayers (left) and lipid bilayers containing only soy PC (right). The reaction is started at 3 seconds by adding 0.4 mM Na2ATP (ATP syn-thase) or 4 mM NaCl (soy PC). Adapted from paper V.
60
5.4. Evidence of DP1/Yop1p acting as stabilizer of high curvature structures in the ER membrane of cells In this section a study describing the expression, purification and reconstitu-tion experiments using an integral membrane protein, Yop1p, is presented. A short background of the protein is followed by the methods used and data from cryoTEM and TIR-Raman spectroscopy. Finally, the results and their implications are discussed. Using lipid structures of different morphology supports the role of Yop1p as a stabilizer rather than an inducer of curvature.
The ER has a number of very characteristic shapes, often far from the spherical shape assumed by a lipid bilayer.47, 186 The peripheral ER consists of a tubular network, and as recent as 10 years ago, little was known about how these intricate structures in the ER are formed. Today, although much is still unknown, some clues to how this highly dynamic network is created and maintained exist where one theory describes two integral membrane proteins being responsible for the tubular morphology in the ER, DP1/Yop1p and Rtn4a/NogoA.187 Yop1p is an integral membrane protein with a proposed unusual topology, with two pairs of hairpin α-helices, too short to span the whole membrane but instead believed to occupy more of the outer leaflet compared to the inner.187 The function of these proteins is suggested to be the generation of tubular structures in the ER and DP1/Yop1p alone has been showed to form tubular structures in vitro with only lipids present.188 In the results presented here, the function of Yop1p together with model mem-branes are studied using two techniques suitable for membrane and mem-brane-protein interaction characterization; cryoTEM and Total Internal Ref-lection (TIR) Raman spectroscopy.
5.4.1. Protein purification and reconstitution Yop1p was amplified using suitable primers from wild-type S. Cervisiae DNA and cloned into a SmaI linearilized vector with a yEGFP, octa-His tag and a TEV protease site at the C-terminus. The yeast strains containing the Yop1p construct were grown in –URA media containing 0.1% glucose. At an OD600 of 0.7, galactose was added to a final concentration of 2% to in-duce protein expression. After 23 hours of expression the cells were spinned down and resuspended in Tris buffer (50 mM Tris, pH 7.5, 150 mM KCl and 5% glycerol). The cells were broken in a cell disruptor and centrifuged at 45K RPM for 90 minutes to sediment the membranes. The membrane sus-pension was solubilized in a 1% Cymal-5 solution for 1 hour at 4º C fol-lowed by centrifugation at 45 K RPM for 90 minutes. The supernatant was loaded on a 5 ml His-Trap column (GE healthcare) and eluted using 0.5 M imidazole and 0.1 % Cymal-5. The eluate was then loaded on a Superdex-200 column (GE Healthcare). The GFP and His-tag was cleaved of by incu-bating the sample in His-tagged TEV protease and running the sample

61
through a 5-ml His-Trap (GE Healthcare) column and collecting the flow through.
DOPC, DOPE, DOPS were mixed in a ratio of 2:2:1 respectively and dried in a rotary evaporator. The dry film was rehydrated in buffer (50 mM Tris, pH 7.5, 150 mM KCl) to a concentration of 1.5 mg/ml. After the point of rehydration, three different preparation methods were used. In the first, small unilamellar vesicles (SUV) were prepared by extrusion through poly-carbonate membranes, five times through 200 nm pore size followed by five times through 100 nm pore size. In the second method, detergent was added to the rehydrated lipids until mixed micelles were formed and the solution became clear. The third method was prepared in a similar manner but with-out complete solubilization, i.e. a cloudy suspension of lipids and detergents. In all of the three vesicle preparation methods Yop1p was added to the lipid vesicles at a lipid to protein ration of 1:1 by weight and was mixed for 1 hour. The surfactants used to solubilize the protein were then slowly re-moved by stepwise addition of BioBeads SM-2 (BioRad) to a total amount of 10 wt% of the whole solution during four hours in room temperature. To study the lipids/proteins in the TIR-Raman a solution of DOPC/DOPE/DOPS SUVs, prepared through extrusion, was injected in the liquid cell and, after allowing it to deposit for 10 minutes, a spectrum was recorded. For reconstitution of Yop1p, 0.2 mg of the protein was diluted to 4 ml of buffer containing 1 mM of Cymal-5 and then injected in the flow cell. After four hours the cell was slowly rinsed with an excess of buffer followed by taking a spectra again.
For the TIR Raman measurements the SUV solution was injected through a glass capillary and a bilayer was formed on the flat silica surface (Ra≤0.7 nm). CryoTEM was performed with a Zeiss 902 A TEM, operating at 80 kV. A thin film of the sample was made in a humidity controlled chamber. A drop of the solution was placed on a copper grid coated with a thin perfo-rated polymer film. The vitrified sample was transferred to the microscope where it was characterized at around 100 K.
5.4.2. Analyzing the interaction between proteins and lipids using cryoTEM and TIR-Raman To investigate the function of the Yop1p, it was studied together with a model membrane with a composition of DOPC, DOPE and DOPS in a 2:2:1 ratio. Three different morphologies of lipid vesicles were prepared, depicted in figure 5.6a, c and e. Using extrusion through a polycarbonate membrane gave vesicles with a homogeneous size distribution, with an average diame-ter of ~100 nm, figure 5.6a.189 Solubilizing the lipids together with the deter-gents, led to the formation of mixed micelles, figure 5.6. The lipids, with a propensity to form lamellar structures are stabilized as micelles by the deter-

62
gent. When the detergent is removed by adsorbtion on the polymeric beads, the lipids again form lamellar structures in the shape of vesicles and the re-sult is a similar homogeneous distribution of vesicles, around 60 nm in di-ameter.190 In the third method, the lipids were rehydrated but the detergent amount added was not enough to stabilize mixed micelles. The suspension was cloudy and with a very broad size distribution, figure 5.6e. To establish the difference between the three lipid preparations, a large number of Cryo-TEM images was examined and the diameter of the particles was recorded and plotted against their frequency, depicted in figure 5.7a-c. Three distinct peaks can be seen, although the rehydrated sample (c) ranges in size from single nm up to well above 100 nm. In all experiments, the amount of pro-tein and the method of detergent removal were kept the same, i.e. slow re-moval through adsorption of the detergent molecules onto polystyrene beads.191 In the first system, with extruded lipids, the same spherical struc-tures can be seen after the addition of Yop1p together with smaller struc-tures, likely aggregated protein, separated and without any apparent interac-tion (fig. 5.6b). Similar structures can be seen in the second system, with mixed micelles forming vesicles; only spherical structures and aggregates surrounding the lipids. In the third case of the rehydrated system, which con-tained structures of varying sizes, introducing Yop1p gave elongated mor-phologies, as can be seen in figure 5.6f. The tubes vary in length, from hun-dreds of nm to many microns, with an average diameter of ~20 nm. To further test what lipid morphologies Yop1p interacts with, Yop1p was introduced in a supported bilayer, representing a vesicle of infinite size. To detect a protein located in a lipid bilayer, TIR-Raman spectroscopy was used. SUVs were injected in the liquid cell and allowed to deposit for 10 minutes, after which a Raman spectra from a single bilayer could be meas-ured, as seen in figure 5.1. Several peaks, like the symmetric and antisym-metric methylene stretching vibrations at 2851 cm-1 and 2897 cm-1 respec-tively, the Fermi doublet of the CH2 scissoring mode at 1441 cm-1 and 1640 cm-1, the in-plane CH2 twisting mode at 1301 cm-1 and the ester carbonyl stretch at 1733 cm-1 were seen.159 The method of incorporating Yop1p in the supported bilayer was based on dilution of the detergent below the CMC.192 This removed the detergent molecules surrounding the protein and forced the protein to move to the bilayer. As expected, this did not result in any mea-surable levels of Yop1p in the bilayer. To test the hypothesis that Yop1p requires a non-flat surface for interaction, the bilayer deposited on the silica substrate was heated using higher laser intensity (500 mW) in order to local-ly increase the temperature and thus the lipid lateral movement.193 After the laser radiation, it could be seen in the phase contrast microscope that the surface was locally altered. The Raman signal still corresponded to a full bilayer, suggesting a local change in lipid bilayer distribution. After incuba-tion and rinsing, several characteristic protein bands could be seen such as Amide III194 at 1249 cm-1 and 1267 cm-1, tryptophan Fermi doublet195 over-

63
lapped with α-Helix signature at 1343 cm-1 and 1357 cm-1 and tryptophan residues195 at 1561 cm-1 and at 1619 cm-1, figure 5.8.
Figure 5.6. CryoTEM micrographs displaying a) preformed PC/PE/PS SUVs with-out any protein, b) preformed PC/PE/PS SUVs with 50 wt% Yop1, c) dissolved PC/PE/PS lipids without protein, d) dissolved PC/PE/PS lipids with 50 wt% Yop1, e) disordered solution of PC/PE/PS without protein and f) disordered solution of PC/PE/PS with 50 wt% Yop1. Neither the preformed lipid vesicles nor the com-pletely dissolved lipids show any change in morphology when mixed with Yop1 while the disordered PC/PE/PS shows elongated structure reaching several microns. Scale bars are 200 nm in a-e and 500 nm in f.

64
Figure 5.7. Individual frequency histograms and statistical summaries of data from the three vesicle preparation methods. Individual vesicle diameters were determined from cryo-TEM micrographs using two measurements each where a) is the extruded sample, b) the solubilized and c) the rehydrated.
Figure 5.8 Raman spectra of Yop1p integral membrane protein and supported lipid bilayer. The black trace is the spectrum of the protein-free lipid bilayer comprising only phospholipids. The red trace is after introducing Yop1p to the membrane. Square dots –Amide III; Round dots – tryptophan Fermi doublet overlapped with α-Helix signature. Triangular dots – tryptophan residues.
5.4.3. Discussion of lipid-protein interactions in relation to formation of membrane structures The three preparation methods resulted in vesicles of three distinct morphol-ogies. In the case of the extruded liposomes, the monodisperse spherical morphology is present both before and after adding Yop1p and removing the detergent, i.e. there is no phase transformation after the vesicles are initially formed. In the system of mixed micelles, there is a transformation from a micellar to a lamellar phase. In the intermediate stage, where sheets are formed, the Yop1p likely locates to the edges. And, as observed in figure 5.6d, the same vesicle formation occurs in the system where Yop1p is

65
present, resulting in spherical vesicles and protein aggregates, indicating that the Yop1p molecules are excluded from the bilayer upon formation of ve-sicles, which have close to zero curvature. In the last example, multilamellar structures of varying sizes are found in the system before and after addition of Yop1p and subsequent detergent removal. In this system, the vesicles incorporate the smaller amount of detergent and form mixed liposomes.
Both the spectra and the micrographs suggest that Yop1p requires a bilay-er of high curvature for interaction and only forms aggregates when exposed to SUVs, which can be seen as close-to-flat surfaces. Rapoport and co-workers report on the formation of tubes when Yop1p is incorporated in lipid systems of various compositions and protein free vesicles that are hete-rogeneous in size.188 This result is in agreement with the data presented here, where only the heterogeneous system results in tubular formation. By mea-suring the diameter of the vesicles and plotting the frequency of each size, it can be seen that the three different lipid samples are quite dissimilar with the most pronounced difference being the occurrence of very small vesicles in the rehydrated sample. As much as 60% of the vesicles are below 40 nm and 30% are between 10-20 nm. Interestingly, this size corresponds well with the diameter of the tubes reported elsewhere188 as well as seen in figure 3.4f.
In the supported lipid bilayer, measured by TIR-Raman spectroscopy, no protein could be detected before defects were introduced in the bilayer. The local heating of the bilayer by increasing the laser intensity is an inexact method of creating defects. However, the lipids below the laser were meas-ured at the same intensity, indicating a complete bilayer. The observed peaks, originating from Yop1p, indicate an association with the surface which can be seen as a further support that Yop1p does not interact with a flat bilayer but requires curved structures. Recently, West et. al. studied the structure of yeast ER by electron tomography with and without Yop1p. The study showed that the high curvature tubes were initially formed but they were found to be unstable and disappeared over time.196 Therefore, it is like-ly that Yop1p is incorporated only in structures of a specific, high, curvature, which then serve as a point of recruitment for additional proteins, leading to the formation of long tubes. Because of this geometrical restriction, the func-tion in vivo is likely to stabilize such high curvature tubes that are found in the ER. Still, many questions remain on how Yop1p affects the curvature. How membrane proteins can curve a membrane is strongly associated with its ability to sense curvature. A protein such as Yo1p, with its predefined geometry, would be classified as a protein that senses curvature on the na-noscale.197 The mechanism of this type of protein has been proven difficult to study in vivo due to the inexact tuning of the curvature in vesicles. An interesting approach would be to use curvature inducing peptides198 in sys-tems to induce a specific curvature and investigate whether Yop1p will be recruited.
66
6. Summary and conclusions
This thesis focuses on ordered and functional structures produced by nature and how these can be used to create material with novel functionalities. The foundation being the self-assembly of amphiphilic molecules, starting with the biological membrane responsible for both shaping the cell and acting as a selective barrier, and then extending the system to polymers and ordered inorganic structures, including hybrid systems where the membrane works as a functionalized barrier. In this thesis, these self assembled systems were studied both from a fundamental point of view as well as from an applied perspective.
The cell membrane often functions as a mold for the very intricate struc-tures found in nature. A select few of these structures corresponds to triply periodic minimal surfaces, such as Schoen’s gyroid. These structures appear throughout virtually all kingdoms of life. Here, one example of such a struc-ture was studied in detail. The wing scales of a butterfly, C. rubi, consist of three dimensionally ordered photonic crystals, giving the butterfly its green color. These photonic crystals were shown to arise from a highly ordered structure corresponding to the gyroid minimal surface that makes up the bulk of the wing scales. The long range order was confirmed using small-angle x-ray diffraction and the local order was characterized using ion beam polish-ing combined with scanning electron microscopy.
These self assembled biological systems provide properties difficult to achieve in man-made systems and are therefore useful as templates for inor-ganic molecules. The photonic crystal from the butterfly provides a template for a 3D structure within the visible region of the spectra, a region difficult to reach through other manufacturing methods. By using silica and titania the properties of these photonic crystals were replicated to a high degree, forming blue photonic crystals with a near complete band gap. Further we showed that these structures are optically active, a strong indication of chi-rality, which suggests metamaterial-like properties.
Similar methods as used when replicating the photonic crystal were uti-lized in synthesizing a mesocellular foam. The formation of a swollen meso-phase of block-copolymers by using a swelling agent and mixing this with a macroscopic emulsion of triglyceride oil resulted in mesoporous spheres with a hollow core. The spheres, with a size of 60 µm, have an 800 nm thick shell that is interconnected, making the material highly porous, light weight and insulating.

67
These concepts of self assembly, membrane proteins and porous materials were combined in a hybrid material where the properties of biomolecules and inorganic particles are combined. A mesoporous silica sphere was coated with a lipid bilayer containing a fully functional ATP synthase. This large asymmetrical protein was successfully incorporated in the bilayer around the inorganic carrier and its activity was followed by adding ATP and studying the reaction in a confocal laser scanning microscope. This sys-tem involves the basic components of an artificial cell that holds promise for a triggered release/uptake device.
In the final study an integral membrane protein that is responsible for shaping the endoplasmic reticulum, Yop1p, was heterogeneously expressed in yeast and purified. By using cryo-transmission electron microscopy and surface sensitive Raman spectroscopy the protein could be studied while incorporated in a lipid membrane. It was found that the function of Yop1p is related to the membrane curvature. Instead of inducing curvature, which was previously believed to be its main function, the results indicate a stabilizing role in the endoplasmic reticulum i.e. requiring a highly curved structure in order to interact with a bilayer.

68
7. Outlook
In this thesis, several aspects of the biomimetic field are discussed– from the more fundamental studies on how a protein behaves in a membrane to the more applied approach where these concepts were realized and functional material synthesized. Given the interdisciplinary approach of the project, several ideas are worthy of a continued exploration, some with a focus on applying the materials prepared and investigated here while other systems are further away from applications and require additional basic research. Some selected examples in different areas are presented below.
The photonic crystals found in the wing scales of C. rubi are unique in several aspects and highly suitable as templates for inorganic photonic crys-tals in the visible regime. Using a double templating approach, where a silica template is filled with titania and the silica etched, leaving a titania positive structure, is predicted by simulations to contain a full band gap in the visible spectra. This approach proved to be experimentally difficult but is nonethe-less the most straight forward method of having a complete band gap. Such a material would allow for many applications in the field of optical communi-cation. Further, the potential metamaterial aspect is also worthy of continued investigation. Replication of the structure in gold, using for example electro-deposition, could possible result in a metamaterial with a full band gap in the visible spectra, something that has never been achieved to date. Also, inde-pendently of full band gap or metamaterial properties, the material could be used in a number of applications such as a substrate for surface enhanced Raman spectroscopy and sensors for gases and liquids. Here, some work has already been performed on other butterfly species but, given the 2D nature of the majority of the photonic crystals used, the 3D structure in C. rubi would likely outperform previous studied materials.
The mesostructured foam synthesized here, with its very high porosity, would be even more attractive as a monolith – allowing use in the field of insulation. Other interesting aspect to pursue is the performance as porous beads in the separation of large biomolecules. Another important possibility would be the optimization of the synthesis to achieve a thermal conductivity below that of air. Regarding the function of Yop1p, many questions still remain. What are the exact prerequisites for membrane bending? How is the protein oriented in the lipid bilayer and how does a single protein behave in comparison with eventual arcs that are formed? Continued research in the area should focus

69
on crystallization attempts and a combination of in vitro and in vivo experi-ments where the bilayer or ER could be tuned to a specific curvature, using for example curvature inducing peptides or other, well-known curvature inducing protein motifs. Parallel experiment would give information on the function of Yop1p and the function of eventual partner proteins responsible for the initial bending of the membrane. Further, using techniques such as sum frequency generation, a nonlinear optical technique that only measure asymmetrical elements at an interface, would give more information on how the protein is orientated in the lipid bilayer.
The artificial cell containing ATP synthase in a lipid bilayer is a versatile system of which several aspects could be interesting to explore further. Firstly, using a combination of other proteins would mimic an artificial cell even closer. Incorporating light sensitive proteins, such as bacteriorhodopsin, and couple these to ATP synthases would result in small energy reactors. Secondly, using pore forming proteins such as mechanosensitive channels, could lead to a triggered release. This triggering could then be coupled to a binding event of a biological motif in the solution. This would give a vessel capable of releasing active molecules upon binding of another protein or tissue.

70
8. Populärvetenskaplig sammanfattning
Fokus i den här avhandlingen är material som förekommer i naturen med egenskaper som skulle kunna vara intressanta inom materialforskningen. Exempel på dessa egenskaper är hög katalytisk effekt och strukturer i nano-meterskala som ger upphov till specifika färger. Genom att kopiera och in-spireras av naturen är målet att kunna framställa nya typer av funktionella material. Avhandlingen behandlar både fundamentala och tillämpade fråge-ställningar.
Membranproteiner är viktiga komponenter i våra cellmembran. Där utför de en mängd uppgifter varav en är att reglera strukturen hos våra membran. Vissa delar av celler har ganska ovanliga former där det endoplasmatiska nätverket, i form av väldigt tunna tuber, är ett exempel. Yop1p är ett protein som förekommer i alla högre organismer, människan inkluderad. Det har tidigare föreslagits att detta protein är ansvarigt för skapandet av dessa tunna tuber i det endoplasmatiska nätverket. För att undersöka detta har vi tillver-kat liposomer, en sfärisk partikel som är uppbyggd av fettmolekyler och som fungerar som modellceller, i tre olika storlekar. Genom att försöka inkorpo-rera proteinet i alla tre system kan vi visa att endast vissa former av lipider bildar tuber. Analyser av mikroskopbilder tagna av proteinet i lipidstrukturer visar att liposomer som är i storleksordningen 10-20 nanometer bildar tuber medan andra, större, strukturer inte inkorporerar proteinet alls. Slutsatsen är att Yop1p troligen inte är ansvarigt för att böja ett membran utan snarare stabiliserar redan böjda strukturer.
Det endoplasmatiska nätverket kan ibland bilda ordnade och komplexa strukturer. I våra studier av en fjäril, grönsnabbvingen, har vi med hjälp av svepelektronmikroskopi visat att dess gröna fjäll består av en ordnad struk-tur, en så kallad fotonisk kristall. Toppen av fjället och hela vägen ner till baksidan består av en symmetrisk struktur som har likheter med oorganiska kristallina material. Den här strukturen är symmetrisk i samma storleksord-ning som våglängden på grönt ljus och är således ansvarig för fjärilens gröna färg. Vi har visat att dessa typer av strukturer även förekommer i andra fjäri-lar men även skalbaggar.
Vidare har vi utnyttjat denna ordnade struktur i fjärilsvingarna till att ska-pa kopior i kisel- och titanoxid. Genom att infiltrera strukturen med en lös-ning av kiseloxid eller titanoxid, två material som normalt är helt genom-skinliga, och sedan bränna eller etsa bort fjärilen får vi blå strukturer. Färg-förändringen beror till viss del på att kopian vi skapar är den motsatta struk-

71
turen som har andra brytningsegenskaper i ljus. Användning av elektronmik-roskopi och studier av det reflekterade ljuset från de fotoniska kristallerna visar att strukturen har kopierats med en mycket hög noggrannhet. Det är alltså möjligt att från fjärilens struktur skapa blåa material från ett genom-skinligt ursprungsmaterial. Vidare har vi visat, genom att belysa replikorna med korspolariserat ljus, som i normalfallet bara ger en svart bild, att de vrider ljuset som träffar ytan. Detta är en stark indikation för kiralitet. Tre-dimensionella fotoniska kristaller som är aktiva inom det synliga ljuset är ovanliga och har en rad potentiella applikationer inom områden där ljus an-vänds som informationsbärare.
Dessa ordnade material förekommer även i andra storleksordningar, som till exempel porösa material som oftast har mycket mindre porer. Dessa an-vänds inom en rad industrier, från krackning av olja till mjukgörare i tvätt-medel. Här har vi syntetiserat ett så kallat. mesoporöst material med porer i storleksordningen 30 nm, eller 0.00003 mm. Genom att använda en polymer har vi först skapat ett skumliknande material som innehåller ett poröst nät-verk med en väldigt låg densitet. Detta skum har sedan kombinerats med en olja som bildat droppar i vatten, vilket resulterar i ihåliga sfärer, ungefär 0.1 mm stora. Då oljan bränns bort så bildas en sfär med tunna och väldigt porösa väggar. Detta material är extremt lätt och vi har visat att det även är en mycket bra isolator.
I den sista delen av avhandlingen kombineras de porösa materialen med biomolekylerna. Genom att rena ett membranprotein och inkorporera det i liposomer som sedan blandas med nanoporösa sfärer får vi ett material där den oorganiska delen fungerar som ett skelett till de funktionella biomoleky-lerna. Membranproteinet är ATP-syntas som normalt används till att bilda energi i form av ATP från en gradient av protoner eller joner. Det är ett stort och komplext enzym som utför livsviktiga funktioner i våra kroppar. Då den oorganiska sfären fyllts med ett färgämne och energi i form av ATP tillsats, kan vi följa enzymets aktivitet när det sitter runt de nanoporösa sfärerna. Detta system bildar grunderna till artificiella celler och kan användas för studier av membranproteiner men även för en kontrollerad frisättning av läkemedel.
72
9. Acknowledgements
Many people have helped me during the years this thesis was produced; here I would like to thank a few of them.
Robert Corkery, thank you for your endless help and patience with me, for everything you have taught me and you unlimited interest in my work. Your amazing ability to solve problems and come up with ideas is un-matched, you are a true polymath. Lennart Bergström, thank you for all your help and support and for getting me through this in one piece, I am very grateful you took me in and guided me during these years. Eric Tyrode, thank you for all of your efforts, both in the lab and with the papers we wrote, I am very glad I got the opportunity to work with you. Osamu Tera-saki, thank you for always showing an interest in my work and for all the valuable advice. Gunnar von Heijne, thank you for all the resources you have provided and for always listening to our problems. Martin Högbom, thank you for the lab space, advice and picking those crucial crystals. Yoy Kim, thank you for teaching me so much about membrane proteins and sup-porting my work. Johannes Bergsten, thank you for finding that very special butterfly for us. Yasuhiro Sakamoto, thank you for teaching me electron microscopy and taking me on when I started. I had the fortune to spend a couple of years in the lab of DBB where I met many amazing people. Especially I would like to thank Karin Skaar for all of the experiments we did and the fun we had in the lab and outside. Christoph von Ballmoos is greatly acknowledged for always providing us with protein, the writing and great advice. The department, MMK, is also full of people who have helped me during these years. Kjell Jansson, thank you for teaching me how to run the electron microscope and for all the support and problem solving throughout the years. I am very grateful you showed an interest in my work. Sam Stevens, thank you for the advice on the electron microscope and for all the fun we have had. Vitaliy Oliynyk for teaching me confocal microscopy and all of the experimental help. Jovice Ng for the experiments and advice on life as a PhD. I would also like to thank many of the people in Lennart’s group: Ger-man, Erik, Christina, Arto, Neda, Linnea and Bertrand.
I am greatly indebted to many of my coworkers here at YKI. Peter Albe-rius, thank you for being a great manager and for believing in me in the first place. Marie Sjöberg, also for being a great manager and for understanding all the perils of doing a PhD. Emiel Speets, thank you for all your comments

73
on my texts and the great wines we have had. Johan Andersson, thank you for the comments on the thesis and for all experimental setups you have helped me with. Merhnaz Amanat Bari, thank you for everything you taught me about myself and all of your experimental efforts. The entire MCS sec-tion is acknowledged for helping me and tolerating me in the lab. Rodrigo, Mikael, Luba, Lukas, Rositsa, Annika, Eva, Paulina, Kerstin, Anwar, And-rea, Kenth, Anders, Anders, Jens, Galina, Bengt, Marie, Annika, Peder and Karin deserve special thanks!
I had the opportunity to travel and meet many interesting people. I would especially like to thank Yuru Deng for allowing me to visit her lab in Singa-pore. Also Steven Hyde and Alan Schoen are acknowledged for showing an interest in my work.
Jonas Gustafsson, thank you for the interest, advice and fun times, both in front of the TEM and in the bar. Adam Feiler, thank you for the support and encouragement.
I have had a great office with the best view in town, and this room was shared with lots of nice people and I would like to thank Malin for introduc-ing me to the life at YKI, Eric for being the most generous and fun office mate imaginable, Viveca for your valuable reflections and wonderful humor and Peter for the mentoring and great lessons of life and work.
Former and current PhD students at YKI are also acknowledged for all the fun we had, Hanna, Petra, Lisa, Anna, Carina and Asaf. Johan and Eva, thank you for all the good times and the excellent bench pressing. Det här är faktiskt forskning!
Tack hela min familj för ert stöd under den här tiden. Tack mamma för att du alltid vill mitt bästa och stöttat mig i allt jag tar mig för. Tack pappa och Anna-Karin för all uppmuntran, stöd och alla avkopplande arbetsläger. Tack Dan, Linda, Emma och Oliver för ert sällskap och att ni alltid hjälpt till med både det ena och andra. Tack Cilla och Leo för alla middagar, goda råd och inspiration. Tack också till Cilla för att du banade vägen till forskningen och stöttat mig under alla år jag har studerat. Till sist vill jag tacka Petra för att du inte bara står ut med mig utan för all hjälp med avhandlingen du gett mig under de här åren och all uppmuntran jag fått, jag skulle aldrig klarat det utan dig och du är världens bästa!

74
10. References
1. C. Neinhuis and W. Barthlott, Annals of Botany, 1997, 79, 667-677. 2. A. A. Paranjape, S. J. Chung and M. S. Selig, Bioinspiration & Bio-
mimetics, 6, 026005. 3. K. Liu and L. Jiang, ACS nano, 2011, 5, 6786-6790. 4. K. Liu and L. Jiang, Nano Today, 2011, 6, 155-175. 5. S. Sotiropoulou, Y. Sierra-Sastre, S. S. Mark and C. A. Batt, Chemi-
stry of Materials, 2008, 20, 821-834. 6. S. R. Hall, Biotemplating: complex structures from natural mate-
rials, Imperial College Pr, 2009. 7. A. Monnier, F. Schüth, Q. Huo, D. Kumar, D. Margolese, R. S.
Maxwell, G. D. Stucky, M. Krishnamurty, P. Petroff and A. Firouzi, Science, 1993, 261, 1299.
8. D. Zhao, Q. Huo, J. Feng, B. F. Chmelka and G. D. Stucky, Journal Of The American Chemical Society, 1998, 120, 6024-6036.
9. J. F. V. Vincent, O. A. Bogatyreva, N. R. Bogatyrev, A. Bowyer and A. K. Pahl, Journal of The Royal Society Interface, 2006, 3, 471-482.
10. G. De Mestral, 1955. 11. W. Barthlott, WO Patent WO/1996/004,123, 1996. 12. J. Rance, D. Yeomans, M. Simmons and P. Harrison, US
2008/0141431 A1, 2007. 13. D. A. Bricarello, J. T. Smilowitz, A. M. Zivkovic, J. B. German and
A. N. Parikh, ACS nano, 2011, 5, 42. 14. R. L. C. Naumann, C. Nowak and W. Knoll, Soft Matter, 2011, 7,
9535-9548. 15. J. A. Pelesko, Self assembly: the science of things that put them-
selves together, Chapman & Hall, 2007. 16. B. H. Robinson, Self-assembly, Ios Pr Inc, 2003. 17. D. Drew, S. Newstead, Y. Sonoda, H. Kim, G. Von Heijne and S.
Iwata, Nature protocols, 2008, 3, 784-798. 18. J. Porath, J. A. N. Carlsson, I. Olsson and G. Belfrage, Nature, 1975,
258, 598-599. 19. J. Porath and P. Flodin, Nature, 1959, 183, 1657-1659. 20. W. W. Wendlandt and H. G. Hecht, Reflectance spectroscopy, In-
terscience Publisher New York 1966. 21. W. W. Wendland and W. Wesley, Plenum Press, New York, 1968. 22. C. Lee and C. D. Bain, Biochimica et Biophysica Acta (BBA)-
Biomembranes, 2005, 1711, 59-71.

75
23. R. Iwamoto, M. Miya, K. Ohta and S. Mima, The Journal of Chemi-cal Physics, 1981, 74, 4780.
24. E. Tyrode, M. W. Rutland and C. D. Bain, Journal Of The American Chemical Society, 2008, 130, 17434-17445.
25. K. A. Taylor and R. M. Glaeser, Journal of ultrastructure research, 1976, 55, 448-456.
26. A. Diaspro, Confocal and two-photon microscopy: foundations, applications, and advances, Wiley-Liss New York, 2002.
27. J. Bradbury, PLoS Biology, 2004, 2, e306. 28. J. Aizenberg, J. C. Weaver, M. S. Thanawala, V. C. Sundar, D. E.
Morse and P. Fratzl, Science, 2005, 309, 275. 29. A. Schoen, Technical Report. NASA, Washington, DC, 1970. 30. R. W. Corkery, Australian National University, Canberra, 1998, Phd
Thesis. 31. S. C. Kapfer, S. T. Hyde, K. Mecke, C. H. Arns and G. E. Schröder-
Turk, Biomaterials, 2011, 32, 6875-6882. 32. S. Hyde, S. Andersson, K. Larsson, Z. Blum, T. Landh, S. Lidin and
B. W. Ninham, Chemistry and Biology, Elsevier, Amsterdam, 1997. 33. K. Larsson, P. Quinn, K. Sato and F. Tiberg, Lipids: structure, phys-
ical properties and functionality, The Oily Press Bridgwater, Eng-land, 2006.
34. T. Gulik-Krzywicki, E. Rivas and V. Luzzati, Journal Of Molecular Biology, 1967, 27, 303-322.
35. K. Larsson, K. Fontell and N. Krog, Chemistry and Physics of Li-pids, 1980, 27, 321-328.
36. B. E. S. Gunning, Protoplasma, 1965, 60, 111-130. 37. B. E. S. Gunning, Protoplasma, 2001, 215, 4-15. 38. G. D. Pappas and P. W. Brandt, The Journal of Cell Biology, 1959,
6, 85-90. 39. Y. Deng and M. Mieczkowski, Protoplasma, 1998, 203, 16-25. 40. Y. Deng, M. Marko, K. F. Buttle, A. D. Leith, M. Mieczkowski and
C. A. Mannella, Journal of Structural Biology, 1999, 127, 231-239. 41. Y. Deng, S. D. Kohlwein and C. A. Mannella, Protoplasma, 2002,
219, 160-167. 42. E. L. Snapp, R. S. Hegde, M. Francolini, F. Lombardo, S. Colombo,
E. Pedrazzini and N. Borgese, J Cell Biol, 2003, 163, 257–269. 43. D. Lingwood, S. Schuck, C. Ferguson, M. J. Gerl and K. Simons,
Journal of Biological Chemistry, 2009, 284, 12041. 44. N. J. Lang, Journal of Phycology, 1965, 1, 127-134. 45. I. Arechaga, B. Miroux, S. Karrasch, R. Huijbregts, B. de Kruijff,
M. J. Runswick and J. E. Walker, FEBS Letters, 2000, 482, 215-219. 46. T. Gales, M. Mazzulla, H. Kallender, F. Hill and B. Maleeff, Micro-
scopy and Microanalysis, 2002, 8, 984-985. 47. G. K. Voeltz and W. A. Prinz, Nature Reviews Molecular Cell Biol-
ogy, 2007. 48. H. T. McMahon and J. L. Gallop, Nature, 2005, 438, 590-596. 49. B. Zhang and A. C. Zelhof, Traffic, 2002, 3, 452-460.

76
50. G. Ren, P. Vajjhala, J. S. Lee, B. Winsor and A. L. Munn, Microbi-ology and Molecular Biology Reviews, 2006, 70, 37.
51. J. L. Gallop, C. C. Jao, H. M. Kent, P. J. G. Butler, P. R. Evans, R. Langen and H. T. McMahon, The EMBO Journal, 2006, 25, 2898-2910.
52. J. Bigay, J. F. Casella, G. Drin, B. Mesmin and B. Antonny, The EMBO Journal, 2005, 24, 2244-2253.
53. P. F. Devaux, Biochimie, 2000, 82, 497-509. 54. T. Landh, FEBS Letters, 1995, 369, 13-17. 55. Z. A. Almsherqi, C. S. McLachlan, P. Mossop, K. Knoops and Y.
Deng, Redox Report, 2005, 10, 167-171. 56. B. J. Peter, H. M. Kent, I. G. Mills, Y. Vallis, P. J. G. Butler, P. R.
Evans and H. T. McMahon, Science, 2004, 303, 495. 57. R. W. Corkery. 58. P. Vukusic and J. R. Sambles, Nature, 2003, 424, 852-855. 59. S. Kinoshita and S. Yoshioka, Chemphyschem, 2005, 6, 1442-1459. 60. A. L. Ingram and A. R. Parker, Philosophical Transactions of the
Royal Society B: Biological Sciences, 2008, 363, 2465. 61. R. O. Prum, T. Quinn and R. H. Torres, Journal of Experimental
Biology, 2006, 209, 748-765. 62. V. L. Welch and J. P. Vigneron, Optical and Quantum Electronics,
2007, 39, 295-303. 63. H. Ghiradella, Appl. Opt, 1991, 30, 3492-3500. 64. K. Michielsen, H. De Raedt and D. G. Stavenga, J. R. Soc. Interface
2009, 7, 765. 65. V. Saranathan, C. O. Osuji, S. G. J. Mochrie, H. Noh, S. Narayanan,
A. Sandy, E. R. Dufresne and R. O. Prum, Proceedings Of The Na-tional Academy Of Sciences Of The United States Of America, 2010, 107, 11676.
66. G. E. Schroder-Turk, S. Wickham, H. Averdunk, F. Brink, J. D. Gerald, L. Poladian, M. C. J. Large and S. T. Hyde, Journal of Structural Biology, 2011, 174, 290-295.
67. S. T. Hyde, M. O'Keeffe and D. M. Proserpio, Angewandte Chemie International Edition, 2008, 47, 7996-8000.
68. H. F. Nijhout, Bioscience, 1994, 44, 148-157. 69. D. G. Stavenga, J. Tinbergen, H. L. Leertouwer and B. D. Wilts, The
Journal of Experimental Biology, 214, 3960-3967. 70. J. W. Galusha, L. R. Richey, J. S. Gardner, J. N. Cha and M. H.
Bartl, Physical Review E, 2008, 77, 50904. 71. V. Welch, V. Lousse, O. Deparis, A. Parker and J. P. Vigneron,
Physical Review E, 2007, 75, 41919. 72. C. Pouya, D. G. Stavenga and P. Vukusic, Optics Express, 2011, 19,
11355-11364. 73. A. R. Parker, V. L. Welch, D. Driver and N. Martini, Nature, 2003,
426, 786-787. 74. P. Simonis and J. P. Vigneron, Physical Review E, 2011, 83,
011908.

77
75. A. E. Seago, P. Brady, J. P. Vigneron and T. D. Schultz, Journal of The Royal Society Interface, 2009, 6, S165-S184.
76. Z. Liu, T. Ohsuna, O. Terasaki, M. A. Camblor, M. J. Diaz-Cabanas and K. Hiraga, Journal Of The American Chemical Society, 2001, 123, 5370-5371.
77. C. Baerlocher, W. M. Meier and D. Olson, Atlas of Zeolite Frame-work Types, Elsevier, 2001.
78. R. W. Thompson and A. Dyer, Zeolites, 1985, 5, 292-301. 79. Z. Blum, S. T. Hyde and B. W. Ninham, The Journal of Physical
Chemistry, 1993, 97, 661-665. 80. S. T. Hyde, B. W. Ninham and Z. Blum, Acta Crystallographica
Section A: Foundations of Crystallography, 1993, 49, 586-589. 81. F. S. Bates, M. F. Schulz, A. K. Khandpur, S. Förster, J. H. Rose-
dale, K. Almdal and K. Mortensen, Faraday Discussions, 1994, 98, 7-18.
82. G. J. T. Tiddy, Physics Reports, 1980, 57, 1-46. 83. S. Che, A. E. Garcia-Bennett, T. Yokoi, K. Sakamoto, H. Kunieda,
O. Terasaki and T. Tatsumi, Nature Materials, 2003, 2, 801-805. 84. J. S. Beck, J. C. Vartuli, W. J. Roth, M. E. Leonowicz, C. T. Kresge,
K. D. Schmitt, C. T. W. Chu, D. H. Olson, E. W. Sheppard, S. B. McCullen, J. B. Higgins and J. L. Schlenker, Journal Of The Ameri-can Chemical Society, 1992, 114, 10834-10843.
85. C. T. Kresge, M. E. Leonowicz, W. J. Roth, J. C. Vartuli and J. S. Beck, Nature, 1992, 359, 710-712.
86. P. Schmidt-Winkel, W. W. Lukens, D. Zhao, P. Yang, B. F. Chmel-ka and G. D. Stucky, Journal Of The American Chemical Society, 1999, 121, 254-255.
87. V. Alfredsson and M. W. Anderson, Chemistry of Materials, 1996, 8, 1141-1146.
88. P. D. Yang, D. Y. Zhao, D. I. Margolese, B. F. Chmelka and G. D. Stucky, Nature, 1998, 396, 152-155.
89. G. S. Attard, J. C. Glyde and C. G. Göltner, Nature, 1995, 378, 366-368.
90. C. J. Brinker, Y. F. Lu, A. Sellinger and H. Y. Fan, Advanced Mate-rials, 1999, 11, 579-585.
91. Y. Lu, H. Fan, A. Stump, T. L. Ward, T. Rieker and C. J. Brinker, Nature, 1999, 398, 223-226.
92. K. Flodström, H. Wennerström and V. Alfredsson, Langmuir, 2004, 20, 680-688.
93. S. Bhattacharya, B. Coasne, F. R. Hung and K. E. Gubbins, Lang-muir, 2008, 25, 5802-5813.
94. D. Grosso, A. R. Balkenende, P. A. Albouy, A. Ayral, H. Amenitsch and F. Babonneau, Chemistry of Materials, 2001, 13, 1848-1856.
95. W. W. Lukens Jr, P. Schmidt-Winkel, D. Zhao, J. Feng and G. D. Stucky, Langmuir, 1999, 15, 5403-5409.
96. R. W. Corkery and A. Fogden, Langmuir, 2008, 24, 10443-10452.

78
97. S. Weiner and L. Addadi, Journal Of Materials Chemistry, 1997, 7, 689-702.
98. S. Weiner and H. D. Wagner, Annual Review of Materials Science, 1998, 28, 271-298.
99. J. W. Galusha, L. R. Richey, M. R. Jorgensen, J. S. Gardner and M. H. Bartl, Journal Of Materials Chemistry, 2009, 20, 1277-1284.
100. C. Mille, E. C. Tyrode and R. W. Corkery, Chemical Communica-tions, 2011, 47, 9873-9875.
101. M. R. Weatherspoon, Y. Cai, M. Crne, M. Srinivasarao and K. H. Sandhage, Angewandte Chemie International Edition, 2008, 47.
102. J. W. Galusha, M. R. Jorgensen and M. H. Bartl, Advanced Mate-rials, 2010, 22, 107-110.
103. S. Zhu, X. Liu, Z. Chen, C. Liu, C. Feng, J. Gu and Q. Liu, Journal Of Materials Chemistry, 2010, 20, 9126-9132.
104. Y. Tan, J. Gu, X. Zang, W. Xu, K. Shi, L. Xu and D. Zhang, Ange-wandte Chemie, 2011, 123, 8457-8461.
105. G. Cook, P. L. Timms and C. Göltner-Spickermann, Angewandte Chemie International Edition, 2003, 42, 557-559.
106. J. Huang, X. Wang and Z. L. Wang, Nano Letters, 2006, 6, 2325-2331.
107. D. Losic, G. Triani, P. J. Evans, A. Atanacio, J. G. Mitchell and N. H. Voelcker, J. Mater. Chem., 2006, 16, 4029-4034.
108. F. Song, H. Su, J. Han, J. Xu and D. Zhang, Sensors and Actuators B: Chemical, 2009.
109. M. Sumper and E. Brunner, Advanced Functional Materials, 2006, 16, 17-26.
110. U. Kusari, Z. Bao, Y. Cai, G. Ahmad, K. H. Sandhage and L. G. Sneddon, Chemical Communications, 2007, 1177-1179.
111. R. R. Unocic, F. M. Zalar, P. M. Sarosi, Y. Cai and K. H. Sandhage, Chemical Communications, 2004, 796-797.
112. Z. Bao, M. R. Weatherspoon, S. Shian, Y. Cai, P. D. Graham, S. M. Allan, G. Ahmad, M. B. Dickerson, B. C. Church and Z. Kang, Na-ture, 2007, 446, 172-175.
113. E. K. Payne, N. L. Rosi, C. Xue and C. A. Mirkin, Angewandte Chemie International Edition, 2005, 44, 5064-5067.
114. N. Poulsen and N. Kröger, Journal of Biological Chemistry, 2004, 279, 42993.
115. G. Donnay and D. L. Pawson, Science, 1969, 166, 1147. 116. F. C. Meldrum and R. Seshadri, Chemical Communications, 2000,
29-30. 117. W. Yue, R. J. Park, A. N. Kulak and F. C. Meldrum, Journal of
Crystal Growth, 2006, 294, 69-77. 118. A. S. Finnemore, M. R. J. Scherer, R. Langford, S. Mahajan, S.
Ludwigs, F. C. Meldrum and U. Steiner, Advanced Materials, 2009, 21, 3928-3932.
119. M. Z. Hussein, W. H. W. N. Azmin, M. Mustafa and A. H. Yahaya, Journal of inorganic biochemistry, 2009, 103, 1145-1150.

79
120. H. Zhou, T. Fan, T. Han, X. Li, J. Ding, D. Zhang, Q. Guo and H. Ogawa, Nanotechnology, 2009, 20, 085603.
121. S. A. Davis, S. L. Burkett, N. H. Mendelson and S. Mann, Nature, 1997, 385, 420-423.
122. L. Chen, D. A. Bazylinski and B. H. Lower, Nature Education Knowledge, 2010, 1, 14.
123. D. A. Bazylinski and R. B. Frankel, Nature Reviews Microbiology, 2004, 2, 217-230.
124. K. Deplanche, R. D. Woods, I. P. Mikheenko, R. E. Sockett and L. E. Macaskie, Biotechnology and bioengineering, 2008, 101, 873-880.
125. D. Mandal, M. E. Bolander, D. Mukhopadhyay, G. Sarkar and P. Mukherjee, Applied microbiology and biotechnology, 2006, 69, 485-492.
126. U. B. Sleytr and T. J. Beveridge, Trends in Microbiology, 1999, 7, 253-260.
127. U. B. Sleytr, E. Gyorvary and D. Pum, Progress in Organic Coat-ings, 2003, 47, 279-287.
128. S. S. Mark, M. Bergkvist, X. Yang, L. M. Teixeira, P. Bhatnagar, E. R. Angert and C. A. Batt, Langmuir, 2006, 22, 3763-3774.
129. X. Zhao, J. M. Fox, N. H. Olson, T. S. Baker and M. J. Young, Vi-rology, 1995, 207, 486-494.
130. T. Douglas and M. Young, Nature, 1998, 393, 152-155. 131. W. Shenton, T. Douglas, M. Young, G. Stubbs and S. Mann, Ad-
vanced Materials, 1999, 11, 253-256. 132. E. Dujardin, C. Peet, G. Stubbs, J. N. Culver and S. Mann, Nano
Letters, 2003, 3, 413-417. 133. C. Kittel, Introduction to solid state physics, Wiley New York, 1986. 134. J. D. Joannopoulos, Photonic crystals: molding the flow of light,
Princeton Univ Pr, 2008. 135. L. Rayleigh, Philosophical Magazine, 1887, 24, 145-159. 136. E. Yablonovitch, Physical Review Letters, 1987, 58, 2059-2062. 137. K. M. Ho, C. T. Chan and C. M. Soukoulis, Physical Review Letters,
1990, 65, 3152-3155. 138. E. Yablonovitch, T. J. Gmitter and K. M. Leung, Physical Review
Letters, 1991, 67, 2295-2298. 139. H. S. Sözuer and J. P. Dowling, Journal of Modern Optics, 1994, 41,
231-239. 140. H. S. Sözuer, J. W. Haus and R. Inguva, Physical Review B, 1992,
45, 13962. 141. L. Martin-Moreno, F. J. Garcia-Vidal and A. M. Somoza, Phys. Rev.
Let., 1999, 83, 73-75. 142. M. Maldovan, A. M. Urbas, N. Yufa, W. C. Carter and E. L. Tho-
mas, Phys. Rev. B 2002, 65, 165123. 143. S. Lin, J. G. Fleming, D. L. Hetherington, B. K. Smith, R. Biswas,
K. M. Ho, M. M. Sigalas, W. Zubrzycki, S. R. Kurtz and J. Bur, Na-ture, 1998, 394, 251-253.

80
144. C. Cuisin, A. Chelnokov, J. M. Lourtioz, D. Decanini and Y. Chen, Applied Physics Letters, 2000, 77, 770.
145. A. M. Urbas, M. Maldovan, P. DeRege and E. L. Thomas, Advanced Materials, 2002, 14, 1850-1853.
146. Y. A. Vlasov, D. J. Norris, X. Z. Bo and J. C. Sturm, Nature, 2001, 414, 289-293.
147. S. Linden, C. Enkrich, M. Wegener, J. Zhou, T. Koschny and C. M. Soukoulis, Science, 2004, 306, 1351.
148. V. G. Veselago, Sov. Phys. USPEKHI, 1968, 10, 509-514. 149. R. A. Shelby, D. R. Smith and S. Schultz, Science, 2001, 292, 77. 150. J. B. Pendry, Science, 2004, 306, 1353. 151. J. K. Gansel, M. Thiel, M. S. Rill, M. Decker, K. Bade, V. Saile, G.
Von Freymann, S. Linden and M. Wegener, Science, 2009, 325, 1513.
152. D. Zhao, P. Yang, N. Melosh, J. Feng, B. F. Chmelka and G. D. Stucky, Advanced Materials, 1998, 10, 1380-1385.
153. K. Michielsen and D. G. Stavenga, J. R. Soc. Interface 2008, 5, 85. 154. E. Mine, M. Hirose, D. Nagao, Y. Kobayashi and M. Konno, Jour-
nal of Colloid and Interface Science, 2005, 291, 162-168. 155. T. Hashimoto, T. Yamada and T. Yoko, Journal of applied physics,
1996, 80, 3184-3190. 156. W. Peng, S. Zhu, W. Wang, W. Zhang, J. Gu, X. Hu, D. Zhang and
Z. Chen, Advanced Functional Materials, 2012, 22, 2071-2071. 157. M. Saba, M. Thiel, M. D. Turner, S. T. Hyde, M. Gu, K. Grosse-
Brauckmann, D. N. Neshev, K. Mecke and G. E. Schröder-Turk, Physical Review Letters, 2011, 106, 103902.
158. D. Segré, D. Ben-Eli, D. W. Deamer and D. Lancet, Origins of Life and Evolution of Biospheres, 2001, 31, 119-145.
159. F. Lhert, D. Blaudez, C. Heywang and J. M. Turlet, Langmuir, 2002, 18, 512-518.
160. B. L. Silver, The physical chemistry of membranes: an introduction to the structure and dynamics of biological membranes, Boston: Al-len & Unwin; New York: Solomon Press, 1985.
161. J. N. Israelachvili, S. Marcelja and R. G. Horn, Q Rev Biophys, 1980, 13, 121-200.
162. D. Roux, C. Coulon and M. E. Cates, The Journal of Physical Che-mistry, 1992, 96, 4174-4187.
163. R. D. Kornberg and H. M. McConnell, Biochemistry, 1971, 10, 1111.
164. S. J. Singer and G. L. Nicolson, Science, 1972, 175, 720-731. 165. N. Unwin and R. Henderson, Scientific American, 1984, 250, 78-94. 166. D. M. Engelman, Nature, 2005, 438, 578-580. 167. D. Deamer and A. D. Bangham, Biochimica et Biophysica Acta
(BBA)-Biomembranes, 1976, 443, 629-634. 168. J. D. Lear, J. P. Schneider, P. K. Kienker and W. F. DeGrado, Jour-
nal Of The American Chemical Society, 1997, 119, 3212-3217.

81
169. G. Steinberg-Yfrach, J. L. Rigaud, E. N. Durantini, A. L. Moore, D. Gust and T. A. Moore, Nature, 1998, 392, 479-482.
170. V. Noireaux and A. Libchaber, Proceedings Of The National Acad-emy Of Sciences Of The United States Of America, 2004, 101, 17669.
171. D. G. Gibson, J. I. Glass, C. Lartigue, V. N. Noskov, R. Y. Chuang, M. A. Algire, G. A. Benders, M. G. Montague, L. Ma and M. M. Moodie, Science, 2010, 329, 52-56.
172. A. Loidl-Stahlhofen, J. Schmitt, J. Noller, T. Hartmann, H. Bro-dowsky, W. Schmitt and J. Keldenich, Advanced Materials, 2001, 13, 3.
173. T. J. M. Luo, R. Soong, E. Lan, B. Dunn and C. Montemagno, Na-ture Materials, 2005, 4, 220-224.
174. J. T. Groves, N. Ulman and S. G. Boxer, Science, 1997, 275, 651. 175. S. Mornet, O. Lambert, E. Duguet and A. Brisson, Nano Letters,
2005, 5, 281-285. 176. T. Buranda, J. Huang, G. V. Ramarao, L. K. Ista, R. S. Larson, T. L.
Ward, L. A. Sklar and G. P. Lopez, Langmuir, 2003, 19, 1654-1663. 177. J. Liu, A. Stace-Naughton, X. Jiang and C. J. Brinker, Journal of the
American Chemical Society, 2009, 131, 1354-1355. 178. G. Nordlund, J. B. Sing Ng, L. Bergström and P. Brzezinski, ACS
Nano, 2009, 3, 2639-2646. 179. A.-L. Troutier and C. Ladavière, Advances in colloid and interface
science, 2007, 133, 1-21. 180. A. Pohorille and D. Deamer, TRENDS in Biotechnology, 2002, 20,
123-128. 181. E. Sackmann, Science, 1996, 271, 43-48. 182. J. B. S. Ng, P. Kamali-Zare, H. Brismar and L. Bergstrom, Lang-
muir, 2008, 24, 11096-11102. 183. G. V. R. Rao, G. P. López, J. Bravo, H. Pham, A. K. Datye, H. F.
Xu and T. L. Ward, Advanced Materials, 2002, 14, 1301-1304. 184. C. von Ballmoos, G. M. Cook and P. Dimroth, Annual Review of
Biophysics, 2008, 37, 43-64. 185. A. Wiedenmann, P. Dimroth and C. Von Ballmoos, Molecular mi-
crobiology, 2009, 72, 479-490. 186. N. Borgese, M. Francolini and E. Snapp, Current Opinion in Cell
Biology, 2006, 18, 358-364. 187. G. K. Voeltz, W. A. Prinz, Y. Shibata, J. M. Rist and T. A. Rapo-
port, Cell, 2006, 124, 573-586. 188. J. Hu, Y. Shibata, C. Voss, T. Shemesh, Z. Li, M. Coughlin, M. M.
Kozlov, T. A. Rapoport and W. A. Prinz, Science, 2008, 319, 1247. 189. B. A. Korgel, J. H. van Zanten and H. G. Monbouquette, Biophysi-
cal Journal, 1998, 74, 3264-3272. 190. M. Ollivon, S. Lesieur, C. Grabielle-Madelmont and M. Paternostre,
Biochimica et Biophysica Acta (BBA)-Biomembranes, 2000, 1508, 34-50.

82
191. J. L. Rigaud, D. Levy, G. Mosser and O. Lambert, European Bio-physics Journal, 1998, 27, 305-319.
192. H. W. Rémigy, D. Caujolle-Bert, K. Suda, A. Schenk, M. Chami and A. Engel, Febs Letters, 2003, 555, 160-169.
193. J. D. Moroz, P. Nelson, R. Bar-Ziv and E. Moses, Physical Review Letters, 1997, 78, 386-389.
194. N. T. Yu, Journal Of The American Chemical Society, 1974, 96, 4664-4668.
195. I. Harada, T. Miura and H. Takeuchi, Spectrochimica Acta Part A: Molecular Spectroscopy, 1986, 42, 307-312.
196. M. West, N. Zurek, A. Hoenger and G. K. Voeltz, The Journal of Cell Biology, 2011, 193, 333.
197. B. Antonny, Annual Review of Biochemistry, 2011, 80, 101-123. 198. K. Shintou, M. Nakano, T. Kamo, Y. Kuroda and T. Handa, Bio-
physical Journal, 2007, 93, 3900.