Temperature-dependent electron-phonon coupling … et al... · Temperature-dependent...
9
PHYSICAL REVIEW B 88, 054507 (2013) Temperature-dependent electron-phonon coupling in La 2−x Sr x CuO 4 probed by femtosecond x-ray diffraction B. Mansart, 1 M. J. G. Cottet, 1 G. F. Mancini, 1 T. Jarlborg, 2 S. B. Dugdale, 3 S. L. Johnson, 4,5 S. O. Mariager, 4 C. J. Milne, 6 P. Beaud, 4 S. Gr¨ ubel, 4 J. A. Johnson, 4 T. Kubacka, 5 G. Ingold, 4 K. Prsa, 7 H. M. Rønnow, 7 K. Conder, 8 E. Pomjakushina, 8 M. Chergui, 6 and F. Carbone 1 1 Laboratory for Ultrafast Microscopy and Electron Scattering, ICMP, Ecole Polytechnique F´ ed´ erale de Lausanne, CH-1015 Lausanne, Switzerland 2 DPMC, University of Geneva, 24 Quai Ernest-Ansermet, CH-1211 Geneva 4, Switzerland 3 H. H. Wills Physics Laboratory, University of Bristol, Tyndall Avenue, Bristol BS8 1TL, United Kingdom 4 Swiss Light Source, Paul Scherrer Institut, CH-5232 Villigen, Switzerland 5 ETH-Z¨ urich, CH-8093 Z¨ urich, Switzerland 6 Laboratory of Ultrafast Spectroscopy, ISIC, Ecole Polytechnique F´ ed´ erale de Lausanne, CH-1015 Lausanne, Switzerland 7 Laboratory for Quantum Magnetism, ICMP, Ecole Polytechnique F´ ed´ erale de Lausanne, CH-1015 Lausanne, Switzerland 8 Laboratory for Developments and Methods, PSI, CH-5232 Villigen PSI, Switzerland (Received 26 February 2013; revised manuscript received 31 July 2013; published 19 August 2013) The strength of the electron-phonon coupling parameter and its evolution throughout a solid’s phase diagram often determines phenomena such as superconductivity, charge- and spin-density waves. Its experimental determination relies on the ability to distinguish thermally activated phonons from those emitted by conduction band electrons, which can be achieved in an elegant way by ultrafast techniques. Separating the electronic from the out-of-equilibrium lattice subsystems, we probed their reequilibration by monitoring the transient lattice temperature through femtosecond x-ray diffraction in La 2−x Sr x CuO 4 single crystals with x = 0.1 and 0.21. The temperature dependence of the electron-phonon coupling is obtained experimentally and shows similar trends to what is expected from the ab initio calculated shape of the electronic density of states near the Fermi energy. This study evidences the important role of band effects in the electron-lattice interaction in solids, in particular, in superconductors. DOI: 10.1103/PhysRevB.88.054507 PACS number(s): 74.72.Gh, 74.20.Pq, 78.47.J− I. INTRODUCTION Electron-phonon (e-ph) coupling is a key parameter for describing the properties of solids. It is particularly important for superconductors, since it mediates the electron pairing in its conventional form, described by the Bardeen-Cooper- Schrieffer theory. 1 On the other hand, even though many attempts have been made to account for the high critical temperatures observed in cuprates, e-ph coupling seems unable to provide the unconventional superconductivity mechanism even in the strong coupling regime. 2 Nevertheless, the peculiar density of states (DOS) and Fermi surface of the cuprates reveal interesting properties related to e-ph coupling, 3,4 which undoubtedly play a role in the evolution of their electronic properties throughout the phase diagram. In pump-probe experiments, intense fs light pulses induce a rapid jump in the electronic temperature of the material (the out-of-equilibrium electron distribution typically thermalizing within a few tens of fs), followed by a slower (∼ps) reequilibration with the lattice temperature through energy transfer via e-ph coupling. 5,6 The transient electronic temperature can be directly mea- sured by photoelectron spectroscopy 7 and optics, 8 while the transient lattice temperature can be obtained via diffraction. 4,9 The relaxation of these observables can be described by a multi-temperature model which in turns yields the e-ph coupling parameter, 4,6,8,10–12 and in the case of k-sensitive probes such as diffraction 4 and Angle-Resolved PhotoElectron Spectroscopy (ARPES), 12,13 its symmetry as well. In this paper, we present a combined theoretical and experimental study of the e-ph coupling in La 2−x Sr x CuO 4 (LSCO). Calculating the energy distribution of the DOS for different electronic temperatures T , we demonstrate that the e-ph coupling can depend on T , even when the latter reaches very high values. This effect is verified by means of time-resolved x-ray diffraction for different Sr dopings, showing the evolution of the e-ph interactions in the phase diagram of a cuprate superconductor. Time-resolved x-ray diffraction experiments were per- formed using the FEMTO slicing source located at the MicroXAS beamline of the Swiss Light Source (Paul Scherrer Institute). After excitation with 1.55 eV photons, we probed the transient lattice temperature by measuring (in an asymmetric scattering geometry 14 ) the (400) Bragg peak, corresponding to the antinodal direction, of two La 2−x Sr x CuO 4 single crystals (x = 0.1 and 0.21). In cuprate systems, the latter corresponds to the strongest e-ph coupling coming from the interaction between antinodal carriers and specific in-plane lattice modes. 3,4 The x-ray source delivers 200 photons per pulse at a 2 kHz repetition rate; its energy was varied between 7.5 and 8 keV, and its incidence angle was chosen to be 0.87 ◦ for both samples in order for the pump and the probe penetration depths to coincide. The overall time resolution was 200 fs. 15 The pump beam had a duration of 100 fs and fluences ranging from 5 to 27.2 mJ/cm 2 ; all measurements were performed at room temperature. A schematic of the experimental setup can be found in Refs. 15 and 16. 054507-1 1098-0121/2013/88(5)/054507(9) ©2013 American Physical Society
Transcript of Temperature-dependent electron-phonon coupling … et al... · Temperature-dependent...

PHYSICAL REVIEW B 88, 054507 (2013)
Temperature-dependent electron-phonon coupling in La2−xSrxCuO4 probedby femtosecond x-ray diffraction
B. Mansart,1 M. J. G. Cottet,1 G. F. Mancini,1 T. Jarlborg,2 S. B. Dugdale,3 S. L. Johnson,4,5 S. O. Mariager,4 C. J. Milne,6
P. Beaud,4 S. Grubel,4 J. A. Johnson,4 T. Kubacka,5 G. Ingold,4 K. Prsa,7 H. M. Rønnow,7 K. Conder,8 E. Pomjakushina,8
M. Chergui,6 and F. Carbone1
1Laboratory for Ultrafast Microscopy and Electron Scattering, ICMP, Ecole Polytechnique Federale de Lausanne,CH-1015 Lausanne, Switzerland
2DPMC, University of Geneva, 24 Quai Ernest-Ansermet, CH-1211 Geneva 4, Switzerland3H. H. Wills Physics Laboratory, University of Bristol, Tyndall Avenue, Bristol BS8 1TL, United Kingdom
4Swiss Light Source, Paul Scherrer Institut, CH-5232 Villigen, Switzerland5ETH-Zurich, CH-8093 Zurich, Switzerland
6Laboratory of Ultrafast Spectroscopy, ISIC, Ecole Polytechnique Federale de Lausanne, CH-1015 Lausanne, Switzerland7Laboratory for Quantum Magnetism, ICMP, Ecole Polytechnique Federale de Lausanne, CH-1015 Lausanne, Switzerland
8Laboratory for Developments and Methods, PSI, CH-5232 Villigen PSI, Switzerland(Received 26 February 2013; revised manuscript received 31 July 2013; published 19 August 2013)
The strength of the electron-phonon coupling parameter and its evolution throughout a solid’s phase diagramoften determines phenomena such as superconductivity, charge- and spin-density waves. Its experimentaldetermination relies on the ability to distinguish thermally activated phonons from those emitted by conductionband electrons, which can be achieved in an elegant way by ultrafast techniques. Separating the electronic fromthe out-of-equilibrium lattice subsystems, we probed their reequilibration by monitoring the transient latticetemperature through femtosecond x-ray diffraction in La2−xSrxCuO4 single crystals with x = 0.1 and 0.21. Thetemperature dependence of the electron-phonon coupling is obtained experimentally and shows similar trends towhat is expected from the ab initio calculated shape of the electronic density of states near the Fermi energy.This study evidences the important role of band effects in the electron-lattice interaction in solids, in particular,in superconductors.
DOI: 10.1103/PhysRevB.88.054507 PACS number(s): 74.72.Gh, 74.20.Pq, 78.47.J−
I. INTRODUCTION
Electron-phonon (e-ph) coupling is a key parameter fordescribing the properties of solids. It is particularly importantfor superconductors, since it mediates the electron pairingin its conventional form, described by the Bardeen-Cooper-Schrieffer theory.1 On the other hand, even though manyattempts have been made to account for the high criticaltemperatures observed in cuprates, e-ph coupling seems unableto provide the unconventional superconductivity mechanismeven in the strong coupling regime.2 Nevertheless, the peculiardensity of states (DOS) and Fermi surface of the cupratesreveal interesting properties related to e-ph coupling,3,4 whichundoubtedly play a role in the evolution of their electronicproperties throughout the phase diagram.
In pump-probe experiments, intense fs light pulses inducea rapid jump in the electronic temperature of the material (theout-of-equilibrium electron distribution typically thermalizingwithin a few tens of fs), followed by a slower (∼ps)reequilibration with the lattice temperature through energytransfer via e-ph coupling.5,6
The transient electronic temperature can be directly mea-sured by photoelectron spectroscopy7 and optics,8 while thetransient lattice temperature can be obtained via diffraction.4,9
The relaxation of these observables can be described bya multi-temperature model which in turns yields the e-phcoupling parameter,4,6,8,10–12 and in the case of k-sensitiveprobes such as diffraction4 and Angle-Resolved PhotoElectronSpectroscopy (ARPES),12,13 its symmetry as well.
In this paper, we present a combined theoretical andexperimental study of the e-ph coupling in La2−xSrxCuO4
(LSCO). Calculating the energy distribution of the DOSfor different electronic temperatures T , we demonstrate thatthe e-ph coupling can depend on T , even when the latterreaches very high values. This effect is verified by meansof time-resolved x-ray diffraction for different Sr dopings,showing the evolution of the e-ph interactions in the phasediagram of a cuprate superconductor.
Time-resolved x-ray diffraction experiments were per-formed using the FEMTO slicing source located at theMicroXAS beamline of the Swiss Light Source (Paul ScherrerInstitute). After excitation with 1.55 eV photons, we probed thetransient lattice temperature by measuring (in an asymmetricscattering geometry14) the (400) Bragg peak, correspondingto the antinodal direction, of two La2−xSrxCuO4 singlecrystals (x = 0.1 and 0.21). In cuprate systems, the lattercorresponds to the strongest e-ph coupling coming from theinteraction between antinodal carriers and specific in-planelattice modes.3,4 The x-ray source delivers 200 photons perpulse at a 2 kHz repetition rate; its energy was varied between7.5 and 8 keV, and its incidence angle was chosen to be0.87◦ for both samples in order for the pump and the probepenetration depths to coincide. The overall time resolutionwas 200 fs.15 The pump beam had a duration of 100 fs andfluences ranging from 5 to 27.2 mJ/cm2; all measurementswere performed at room temperature. A schematic of theexperimental setup can be found in Refs. 15 and 16.
054507-11098-0121/2013/88(5)/054507(9) ©2013 American Physical Society

B. MANSART et al. PHYSICAL REVIEW B 88, 054507 (2013)
FIG. 1. Rocking curves obtained for the La2−xSrxCuO4 sampleswith the core beam of the Micro-XAS-FEMTO beamline.
II. TIME-RESOLVED X-RAY DIFFRACTION DATA
The first step before measuring a pump-probe signal on adiffraction peak is to find its position in asymmetric geometry,since the x-ray incidence angle has to be kept grazing. Therocking curves corresponding to the (400) peak are shown inFig. 1. The sample orientations were (230) for x = 0.1 and(211) for x = 0.21.
We checked carefully the behavior of these rocking curvesas a function of the time delay. Indeed, a transient temperatureanalysis can be performed only if the structural propertiesremain the same as the unperturbed compound, meaning thatthe lattice is not thermally distorted. After a thermal dilatation,the system is too different from the initial state to obtainmeaningful information about the compound at equilibrium.
This dilatation is evidenced by the Bragg peak shiftingtowards larger diffraction angles. The rocking curves of excitedand nonexcited systems are presented in Figs. 2 (x = 0.1) and3 (x = 0.21) for a pump fluence of 20.5 mJ/cm2, from whichwe can see a peak shift occurring between 5 and 10 ps afterexcitation. The system can therefore be considered as beingslightly perturbed only during the first 5 ps.
This thermal dilatation is due to the heat transport byacoustic waves after photoexcitation towards the bulk of thematerial. Indeed, the time needed for the longitudinal acousticphonons of speed vs ≈ 4000 cm/s (Ref. 17) to propagateacross the penetration depth distance of l = 60 nm (Ref. 18)is t = l/vs ≈ 15 ps, close to the value experimentally found.
There is a striking difference in the peak line shape for thetwo studied dopings, particularly visible for delays in the 20–50 ps range. In the overdoped sample, the Bragg peak seems tobe formed by two different peaks, as expected in a compoundcontaining phase separation between two domains havingslightly different lattice parameters. This behavior is possiblyreminiscent of what is observed in La2CuO4+δ thin films byultrafast electron diffraction,9 but it could also be due to a slightmisalignment of the detector on the diffraction peak. Thispossibility does not spoil the data analysis and interpretation.
In order to follow the time dependence of the Bragg peakintensity over a time range of several hundred picoseconds,long delay scans have been performed for three differentdiffraction angles. The latter correspond to the center of theunperturbed peak, and one larger and one smaller diffractionangle. These long delay scans are shown in Figs. 4 and 5.From these results, one can conclude that in the first 5 ps afterexcitation, no lattice dilatation occurs; indeed, the diffractionintensity does not depend on the angle, which indicates thatthe peak shift towards larger angles is negligible.
FIG. 2. (Color online) Rocking curve of the (400) peak inLa2−xSrxCuO4, x = 0.1, for different time delays after excitation.Light blue triangles are the unpumped curve, dark blue circles thepumped one, and the difference between them is shown as red crosses.
The peak shift starts around 5 ps, where the time-dependentdiffraction intensity behavior changes between lower andlarger angles. We deduced from this observation that per-forming a transient temperature analysis was correct if oneconsiders only the first 5 ps of the measurement.
III. TRANSIENT LATTICE TEMPERATURE
The temporal evolution of the normalized diffractionintensities of the (400) Bragg diffraction peak, measured as theratio between the pumped and unpumped signals, is presented
054507-2

TEMPERATURE-DEPENDENT ELECTRON-PHONON . . . PHYSICAL REVIEW B 88, 054507 (2013)
FIG. 3. (Color online) Rocking curve of the (400) peak inLa2−xSrxCuO4, x = 0.21, for different time delays after excita-tion. Light blue triangles are the unpumped curve, dark blue thepumped one, and the difference between them is shown as redcrosses.
in Fig. 6 for the two different dopings studied. The Bragg peakintensity was checked not to change significantly before andafter the pump pulse impinged on the sample, indicating thatno significant average heating took place at this repetition rate.Also, the flatness of the baseline before time zero indicates thatthe system fully recovers its equilibrium condition betweenpulses (see Fig. 6).
We assume that the lattice can be described as an ensembleof different sets of phonons, each of them separately in thermalequilibrium, in which the effective average temperature of
FIG. 4. (Color online) Delay scans at different angles of therocking curve of the (400) peak in La2−xSrxCuO4, x = 0.1.
the lattice increases due to the energy exchange with heatedelectrons. The diffraction intensity is then directly related to theeffective average lattice temperature through the Debye modelfor a nondistorted lattice. A decrease of the initial (equilib-rium) Bragg diffraction intensity indicates the population ofphonons which spoil the diffraction condition by disorderingthe interatomic distances. The average atomic displacementsinduced by such phonons can be evaluated by comparing theperturbed and unperturbed diffraction intensities denoted byI (t) and I0, respectively. The latter is the diffraction intensityat the initial temperature, in our case at T0 = 295 K.
We consider the following expression for diffracted inten-sity in the presence of atomic disorder:
I (q) = N2|〈Fn(q)|〉2 = N2f 2 exp(−2W ), (1)
where Fn is the structure factor, and N the number of unit cells;q is the reciprocal lattice vector corresponding to the measuredBragg peak, so for (400) in La2−xSrxCuO4, q = 6.65 A
−1.
The term exp(−2W ) is the Debye-Waller factor defined in thepresence of an atomic displacement un as
W = 12 〈(q · un)2〉. (2)
The atomic motions considered in this formula are due to thefinite lattice temperature. Therefore, considering an isotropic
FIG. 5. (Color online) Delay scans at different angles of therocking curve of the (400) peak in La2−xSrxCuO4, x = 0.21.
054507-3
B. MANSART et al. PHYSICAL REVIEW B 88, 054507 (2013)
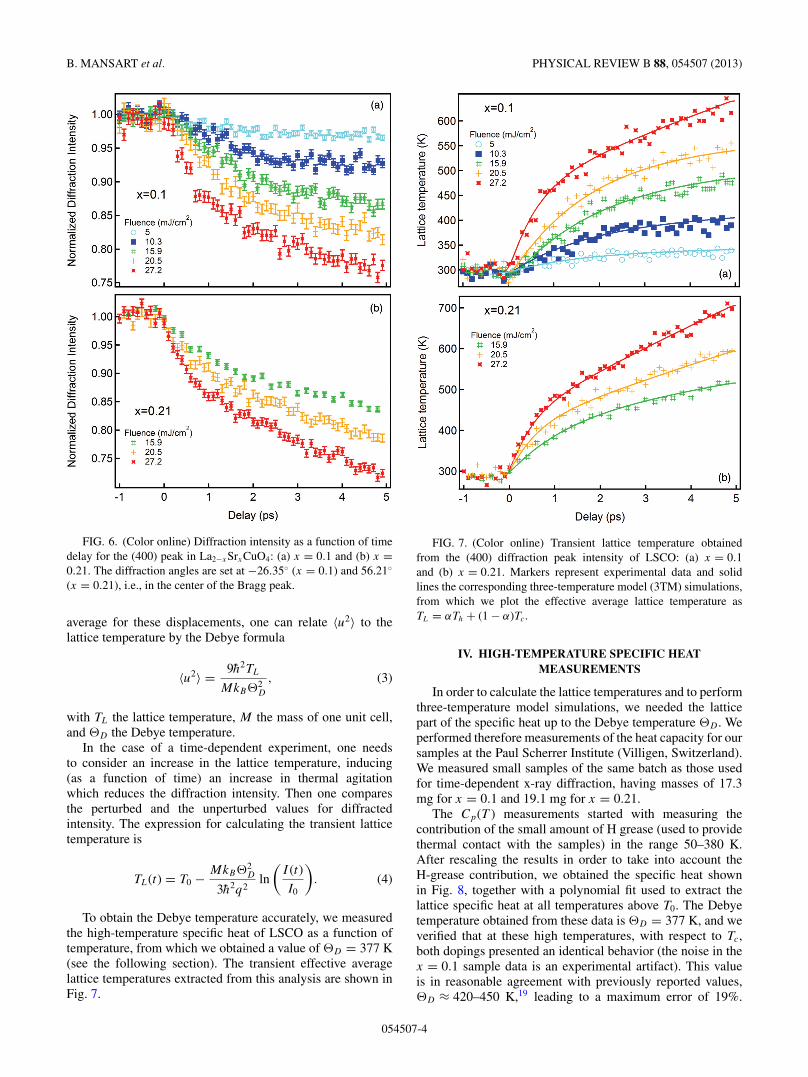
FIG. 6. (Color online) Diffraction intensity as a function of timedelay for the (400) peak in La2−xSrxCuO4: (a) x = 0.1 and (b) x =0.21. The diffraction angles are set at −26.35◦ (x = 0.1) and 56.21◦
(x = 0.21), i.e., in the center of the Bragg peak.
average for these displacements, one can relate 〈u2〉 to thelattice temperature by the Debye formula
〈u2〉 = 9h2TL
MkB�2D
, (3)
with TL the lattice temperature, M the mass of one unit cell,and �D the Debye temperature.
In the case of a time-dependent experiment, one needsto consider an increase in the lattice temperature, inducing(as a function of time) an increase in thermal agitationwhich reduces the diffraction intensity. Then one comparesthe perturbed and the unperturbed values for diffractedintensity. The expression for calculating the transient latticetemperature is
TL(t) = T0 − MkB�2D
3h2q2ln
(I (t)
I0
). (4)
To obtain the Debye temperature accurately, we measuredthe high-temperature specific heat of LSCO as a function oftemperature, from which we obtained a value of �D = 377 K(see the following section). The transient effective averagelattice temperatures extracted from this analysis are shown inFig. 7.
FIG. 7. (Color online) Transient lattice temperature obtainedfrom the (400) diffraction peak intensity of LSCO: (a) x = 0.1and (b) x = 0.21. Markers represent experimental data and solidlines the corresponding three-temperature model (3TM) simulations,from which we plot the effective average lattice temperature asTL = αTh + (1 − α)Tc.
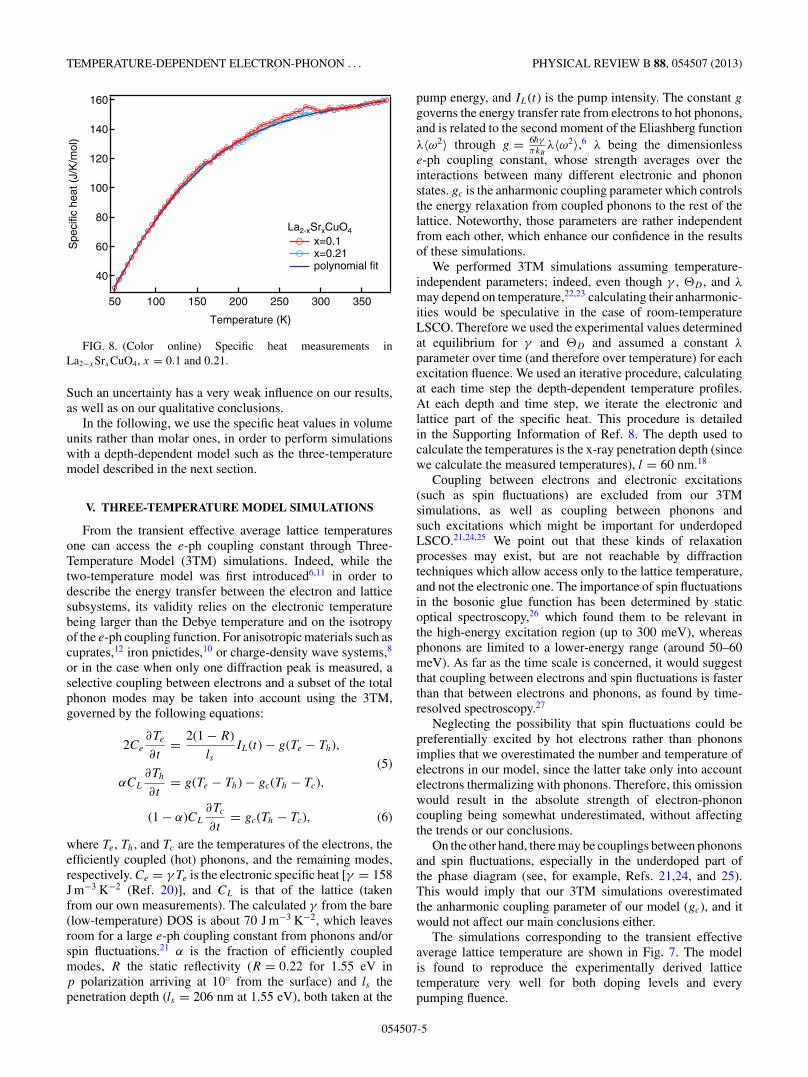
IV. HIGH-TEMPERATURE SPECIFIC HEATMEASUREMENTS
In order to calculate the lattice temperatures and to performthree-temperature model simulations, we needed the latticepart of the specific heat up to the Debye temperature �D . Weperformed therefore measurements of the heat capacity for oursamples at the Paul Scherrer Institute (Villigen, Switzerland).We measured small samples of the same batch as those usedfor time-dependent x-ray diffraction, having masses of 17.3mg for x = 0.1 and 19.1 mg for x = 0.21.
The Cp(T ) measurements started with measuring thecontribution of the small amount of H grease (used to providethermal contact with the samples) in the range 50–380 K.After rescaling the results in order to take into account theH-grease contribution, we obtained the specific heat shownin Fig. 8, together with a polynomial fit used to extract thelattice specific heat at all temperatures above T0. The Debyetemperature obtained from these data is �D = 377 K, and weverified that at these high temperatures, with respect to Tc,both dopings presented an identical behavior (the noise in thex = 0.1 sample data is an experimental artifact). This valueis in reasonable agreement with previously reported values,�D ≈ 420–450 K,19 leading to a maximum error of 19%.
054507-4
TEMPERATURE-DEPENDENT ELECTRON-PHONON . . . PHYSICAL REVIEW B 88, 054507 (2013)
160
140
120
100
80
60
40
Spe
cific
hea
t (J/
K/m
ol)
35030025020015010050
Temperature (K)
La2-xSrxCuO4
x=0.1 x=0.21 polynomial fit
FIG. 8. (Color online) Specific heat measurements inLa2−xSrxCuO4, x = 0.1 and 0.21.
Such an uncertainty has a very weak influence on our results,as well as on our qualitative conclusions.
In the following, we use the specific heat values in volumeunits rather than molar ones, in order to perform simulationswith a depth-dependent model such as the three-temperaturemodel described in the next section.
V. THREE-TEMPERATURE MODEL SIMULATIONS
From the transient effective average lattice temperaturesone can access the e-ph coupling constant through Three-Temperature Model (3TM) simulations. Indeed, while thetwo-temperature model was first introduced6,11 in order todescribe the energy transfer between the electron and latticesubsystems, its validity relies on the electronic temperaturebeing larger than the Debye temperature and on the isotropyof the e-ph coupling function. For anisotropic materials such ascuprates,12 iron pnictides,10 or charge-density wave systems,8
or in the case when only one diffraction peak is measured, aselective coupling between electrons and a subset of the totalphonon modes may be taken into account using the 3TM,governed by the following equations:
2Ce
∂Te
∂t= 2(1 − R)
lsIL(t) − g(Te − Th),
(5)
αCL
∂Th
∂t= g(Te − Th) − gc(Th − Tc),
(1 − α)CL
∂Tc
∂t= gc(Th − Tc), (6)
where Te, Th, and Tc are the temperatures of the electrons, theefficiently coupled (hot) phonons, and the remaining modes,respectively. Ce = γ Te is the electronic specific heat [γ = 158J m−3 K−2 (Ref. 20)], and CL is that of the lattice (takenfrom our own measurements). The calculated γ from the bare(low-temperature) DOS is about 70 J m−3 K−2, which leavesroom for a large e-ph coupling constant from phonons and/orspin fluctuations.21 α is the fraction of efficiently coupledmodes, R the static reflectivity (R = 0.22 for 1.55 eV inp polarization arriving at 10◦ from the surface) and ls thepenetration depth (ls = 206 nm at 1.55 eV), both taken at the
pump energy, and IL(t) is the pump intensity. The constant g
governs the energy transfer rate from electrons to hot phonons,and is related to the second moment of the Eliashberg functionλ〈ω2〉 through g = 6hγ
πkBλ〈ω2〉,6 λ being the dimensionless
e-ph coupling constant, whose strength averages over theinteractions between many different electronic and phononstates. gc is the anharmonic coupling parameter which controlsthe energy relaxation from coupled phonons to the rest of thelattice. Noteworthy, those parameters are rather independentfrom each other, which enhance our confidence in the resultsof these simulations.
We performed 3TM simulations assuming temperature-independent parameters; indeed, even though γ , �D , and λ
may depend on temperature,22,23 calculating their anharmonic-ities would be speculative in the case of room-temperatureLSCO. Therefore we used the experimental values determinedat equilibrium for γ and �D and assumed a constant λ
parameter over time (and therefore over temperature) for eachexcitation fluence. We used an iterative procedure, calculatingat each time step the depth-dependent temperature profiles.At each depth and time step, we iterate the electronic andlattice part of the specific heat. This procedure is detailedin the Supporting Information of Ref. 8. The depth used tocalculate the temperatures is the x-ray penetration depth (sincewe calculate the measured temperatures), l = 60 nm.18
Coupling between electrons and electronic excitations(such as spin fluctuations) are excluded from our 3TMsimulations, as well as coupling between phonons andsuch excitations which might be important for underdopedLSCO.21,24,25 We point out that these kinds of relaxationprocesses may exist, but are not reachable by diffractiontechniques which allow access only to the lattice temperature,and not the electronic one. The importance of spin fluctuationsin the bosonic glue function has been determined by staticoptical spectroscopy,26 which found them to be relevant inthe high-energy excitation region (up to 300 meV), whereasphonons are limited to a lower-energy range (around 50–60meV). As far as the time scale is concerned, it would suggestthat coupling between electrons and spin fluctuations is fasterthan that between electrons and phonons, as found by time-resolved spectroscopy.27
Neglecting the possibility that spin fluctuations could bepreferentially excited by hot electrons rather than phononsimplies that we overestimated the number and temperature ofelectrons in our model, since the latter take only into accountelectrons thermalizing with phonons. Therefore, this omissionwould result in the absolute strength of electron-phononcoupling being somewhat underestimated, without affectingthe trends or our conclusions.
On the other hand, there may be couplings between phononsand spin fluctuations, especially in the underdoped part ofthe phase diagram (see, for example, Refs. 21,24, and 25).This would imply that our 3TM simulations overestimatedthe anharmonic coupling parameter of our model (gc), and itwould not affect our main conclusions either.
The simulations corresponding to the transient effectiveaverage lattice temperature are shown in Fig. 7. The modelis found to reproduce the experimentally derived latticetemperature very well for both doping levels and everypumping fluence.
054507-5

B. MANSART et al. PHYSICAL REVIEW B 88, 054507 (2013)
TABLE I. Maximum electronic temperature, fraction of coupledmodes, and electron-phonon coupling constants extracted from 3TMsimulations.
F Te g (×1017) λ〈ω2〉x (mJ/cm2) (K) α (J/m3/s/K) (meV2) λ
5 1430 0.05 0.7 13.1 0.04310.3 2030 0.085 1.0 18.8 0.063
0.1 15.9 2513 0.14 1.3 24.4 0.08220.5 2849 0.15 1.6 30.0 0.10127.2 3278 0.08 3.0 56.3 0.18715.9 2513 0.1 1.6 30.0 0.094
0.21 20.5 2849 0.065 2.7 50.7 0.15827.2 3278 0.065 3.35 62.9 0.196
The e-ph coupling constant λ was obtained via thesesimulations, given average phonon energies 〈ω〉 of 17.32 meVfor x = 0.1 and 17.89 meV for x = 0.21. This average takesinto account only the modes involving atomic motion alongthe a axis,28 which are mainly influencing the intensity of the(400) diffraction peak, and having finite -point e-ph couplingconstants as calculated at T = 0 K in the QUANTUM ESPRESSO
code.29 It is noteworthy that these calculations provide a valueof λ = 0.031 (x = 0.1) and 0.029 (x = 0.21), in reasonableagreement with the 3TM results at the lowest fluences (seebelow).
The results of the 3TM simulations are given in Table I.We obtained the e-ph coupling constant λ and the fractionof efficiently coupled modes α. The values obtained for λ aresmaller than those found by means of k-integrated probes suchas optics,8,10 and this may be because our experiments onlyprobe a fraction of the whole phonon bath.
For each excitation fluence, the system reaches a givenelectronic temperature in the skin depth at initial time. Thiselectronic temperature may be calculated through the formula
Te =⟨√
T 20 + 2(1 − R)F
lsγe−z/ls
⟩, (7)
where the average is taken over the penetration depth of thepump pulses (ls), and F is the pumping fluence. The values ofTe are also reported in Table I.
VI. TEMPERATURE DEPENDENCE OF THE DENSITY OFSTATES
The temperature dependence of the electron-phonon cou-pling constant in La2CuO4 is calculated from the elec-tronic structure determined using the Linear Muffin-TinOrbital (LMTO) method in the Local Density Approximation(LDA).30 The band structure agrees well with other bandstructures calculated with other methods.31 A single bandcrosses EF , becomes very flat near the X point in the Brillouinzone, and makes a van Hove singularity peak in the DOSnear the position of EF in undoped La2CuO4.24,25 LDA andother forms of density-functional calculations do not get theantiferromagnetic gap for zero doping, but the bands describewell the electronic structure for doped cuprates, as has beenverified from ARPES.32 Doping (x, in holes per Cu) ishere included in a rigid-band manner to account for La/Sr
substitutions. Spin fluctuations are neglected, and althoughthey are certainly important for superconductivity and thelow-T properties of cuprates, they are quenched at the hightemperatures of the experiments presented here.30
A simple form33 for the e-ph coupling constant is
λ = N (EF )B2/Mω2. (8)
Here, N (EF ) is the DOS at EF , M is an atomic mass, and ω aweighted average of the phonon frequency. The denominatoris a force constant, K = d2E/du2, where E is the totalenergy and u an atomic displacement. The matrix elementB = 〈�∗(EF ,r) dV (r)
du�(EF ,r)〉 can be evaluated from the band
structure.30,34,35
The temperature dependence of λ is mainly due to thevariations of the DOS at the Fermi energy (EF ) produced by theT dependence of the Fermi-Dirac occupation, f (ε,EF ,T ) =1/{exp[(ε − μ)/(kBT )] + 1}, where μ = EF (T ). Indeed, onecould imagine that the electronic temperature could influencethe DOS results if the partial DOS functions (Cu-d vs O-pratios, for example) vary very much within kBT around μ.However, the partial DOS ratios of this system are fairly stablewithin 0.7 eV from EF . For energies lower than 0.7 eV belowEF (at the DOS edge) there are some changes, but this is toofar from the Fermi level to be probed by temperatures of theorder 3500 K. Indeed, two sets of self-consistent calculations,one at 150 K and one at 3500 K, produces almost identicalresults for the DOS (see Fig. 9).
Other contributions, such as disorder from thermal atomicvibrations36,37 and from lattice imperfections which alsobroaden the DOS, are neglected in the calculation of theT -dependent DOS NT :38
NT (μ) = −∫ ∞
−∞Neff(ε)
∂f (ε,μ,T )
∂εdε, (9)
where the effective DOS, Neff, can be either the bare DOS orthe one calculated for a lattice with thermal disorder, or for thestructure with defects. The chemical potential μ is determinedfrom the condition of having a constant number of electrons n
FIG. 9. (Color online) Density of states for La2CuO4 self-consistently calculated at two different electronic temperatures.
054507-6

TEMPERATURE-DEPENDENT ELECTRON-PHONON . . . PHYSICAL REVIEW B 88, 054507 (2013)
FIG. 10. (Color online) The T dependence of the effective DOSat the chemical potential, NT , in LSCO owing to the effect ofFermi-Dirac occupation for dopings x indicated in the frame. Thermaldisorder or disorder from lattice defects are neglected. Inset: The bareDOS of La2CuO4 near EF . The vertical dashed lines indicate therigid-band positions of EF for hole dopings 0.1 (red) and 0.21 (lightblue).
at each T :
n =∫ ∞
−∞Neff(ε)f (ε,μ,T )dε. (10)
The T variation of NT , and hence the scaling of λ(T ), isshown in Fig. 10 as a function of the doping. At first thereis a decreasing trend of NT (and hence λ) for increasing T
since EF is close to the small van Hove peak in the DOS (theinset of Fig. 10). However, the trend is reversed when T islarger than ∼2000 K and above, because of the beginning ofhigh DOS feature at about 0.7 eV below EF . This edge ofthe high DOS is due to the hybridized Cu-d O-p bands belowEF .25 This increase of NT will start at a lower temperature andwill be stronger if structural disorders are taken into account,
since the edge of the high DOS feature below EF would besmeared. Note, however, that the short pulse cannot heat thelattice during the pumping time of the experiment. When thedoping level increases, the position of EF moves to lowerenergy, i.e., the band edge will be closer to EF . This explainswhy the T dependence of λ is stronger at large hole doping.
VII. PARTIAL ELECTRON-PHONON COUPLINGCALCULATIONS
The partial electron-phonon couplings for each of the 21modes of La2−xSrxCuO4 have been calculated using pseu-dopotentials, as implemented within the QUANTUM ESPRESSO
code.29 The results of these calculations are presented inTable II, and the histogram of partial electron-phonon couplingconstants in Fig. 11. Note that the three acoustic modes are notrepresented in Table II; their λ constants are null.
The total λ constant, defined as the sum of all partialcouplings, is λ = 1.416 for x = 0.1 and 1.308 for x = 0.21.As expected from the density-of-states calculations at zerotemperature, it is larger in the underdoped sample than inthe overdoped one (see Fig. 10). Interestingly, the two fullysymmetric A1g modes are contributing for more than 97% ofthe total λ; they are schematically shown in Fig. 12. Since theyboth involve only atomic displacements along the c axis, theydo not influence the diffraction intensity of in-plane Braggpeaks which were detected in our time-resolved diffractionmeasurements. This explains why the λ constants determinedthrough 3TM simulations of our data are far smaller thanusually predicted and measured by k-integrated techniquesin cuprates.
Two doubly degenerate Eg modes also present a finitepartial λ constant. The atomic motions involved in these modesare a translation of La/Sr and apical O atoms along the a or b
axis (see Fig. 12), therefore affecting the (400) peak intensityupon excitation. As a consequence, we used the average valueof their energy in order to extract λ from λ〈ω2〉, the latter being
TABLE II. Symmetry, energy, and partial electron-phonon coupling constant for each of the 21 modes of La2−xSrxCuO4, at the point.
Mode No. Symmetry E (meV) (x = 0.1) λ (x = 0.1) E (meV) (x = 0.21) λ (x = 0.21)
4 Eu 4.60 0 8.98 05 Eu 4.60 0 8.98 06 Eg 7.07 0.0131 8.95 0.01067 Eg 7.07 0.0132 8.95 0.01028 A2u 16.27 0 17.62 09 Eu 20.41 0 21.53 010 Eu 20.41 0 21.53 011 B2u 21.36 0 23.91 012 A2u 23.08 0 26.00 013 A1g 26.86 0.3263 27.26 0.239814 Eg 26.93 0.0021 26.83 0.004215 Eg 26.93 0.0021 26.83 0.004016 Eu 40.89 0 42.21 017 Eu 40.89 0 42.21 018 A1g 49.94 1.0587 50.61 1.039119 A2u 57.37 0 57.76 020 Eu 92.36 0 94.84 021 Eu 92.36 0 94.84 0
054507-7

B. MANSART et al. PHYSICAL REVIEW B 88, 054507 (2013)
FIG. 11. (Color online) Electron-phonon coupling constant his-tograms for the 21 modes at the point of La2−xSrxCuO4, x = 0.1and x = 0.21.
FIG. 12. (Color online) Atomic motions corresponding to themost coupled modes in La2−xSrxCuO4, from Ref. 28. Displacementssmaller than 25% of the maximum are not shown.
obtained from the transient lattice temperature along (400), so〈ω〉 = 17.32 meV for x = 0.1 and 17.89 meV for x = 0.21.The sum of electron-phonon coupling constants for these fourmodes gives λ = 0.031 (x = 0.1) and 0.029 (x = 0.21), ingood agreement with the 3TM results at the lowest fluences,where the transient electronic temperatures are the smallest.
The “breathing” mode, with inward-outward movements ofthe O cage surrounding a Cu, is not included within a singleunit cell. Approximate results for electron-phonon couplingmatrix elements in supercells extended along x using theLMTO method, and using experimental information for thephonon energies, give λ = 1.1 for planar O (displacementalong x) and 0.13 for apical O (along z) when the phononenergies are 48 and 58 meV, respectively. For La along z
the values are 0.02 and 17 meV, and the averaged λ for thestrongest modes is 0.36.21 These estimates are of the sameorder as shown in Table I, but they suggest also that the in-planemovements of the O’s can have larger λ.
VIII. DISCUSSION AND CONCLUSION
In Fig. 13, the experimentally obtained e-ph couplingconstants as a function of the different electronic temperatures,photoinduced in our experiments, are reported together withthe values derived from the electronic structure calculations.As is clear, there is a similar trend in the temperature depen-dence between the experimental and calculated behavior of thee-ph coupling constant, even though we find experimentallya much stronger T dependence than we do theoretically. Thismay be an effect of neglecting thermal disorder and spinfluctuations (the latter may reappear at large T in case theypresent a significant coupling with lattice distortions) in thecalculations. Without optimized and well-tested methods forincluding contributions to λ from spin fluctuations (which canhave its own T dependence) in our model, we point out thatone could expect a stronger T dependence upon adding theseexcitations. Moreover, we cannot exclude the possibility thatthe measured peak probes a particular phonon sensitive to apart of the λ function (the calculated DOS being a k average).
The behavior of the LSCO DOS as a function of electronictemperature induces a temperature-dependent λ constant.Such a nonmonotonic dependence had been predicted in
FIG. 13. (Color online) Electron-phonon coupling constant ob-tained from 3TM simulations of time-resolved x-ray diffraction ofthe (400) peak in LSCO (solid symbols, left), and density of states atthe Fermi level obtained by LDA calculations (open symbols, right).
054507-8

TEMPERATURE-DEPENDENT ELECTRON-PHONON . . . PHYSICAL REVIEW B 88, 054507 (2013)
metals,22 even though this would occur at much highertemperature than for LSCO. Some experimental suggestionfor a T -dependent λ constant was proposed in metals,7 aswell as in cuprates,4,39 without a clear determination of theDOS effect. In this respect, cuprates are shown to have ananomalous behavior, originated by their peculiar electronicstructure. These results suggest that band effects play animportant role in the electron-lattice interaction in solids,in particular, for cuprate superconductors. Unveiling theevolution of these interactions throughout a larger part of thephase diagram may provide a useful feedback for the theo-
retical understanding of the unconventional superconductivitymechanism.
ACKNOWLEDGMENTS
The authors thank Marisa Medarde for help during thespecific heat measurements. This work was supported bythe Swiss NSF via Contracts No. PP00P2-128269 and No.20020-127231/1. Part of this work was carried out using thecomputational facilities of the Advanced Computing ResearchCentre, University of Bristol.
1J. Bardeen, L. N. Cooper, and J. R. Schrieffer, Phys. Rev. 108, 1175(1957).
2D. J. Scalapino, J. R. Schrieffer, and J. W. Wilkins, Phys. Rev. 148,263 (1966).
3T. P. Devereaux, T. Cuk, Z.-X. Shen, and N. Nagaosa, Phys. Rev.Lett. 93, 117004 (2004).
4F. Carbone, D.-S. Yang, E. Gianninni, and A. H. Zewail, Proc. Natl.Acad. Sci. U.S.A. 105, 20161 (2008).
5P. B. Allen, in Handbook of Superconductivity, edited by C. P. Poole,Jr. (Academic, New York, 1999), Chap. 9, Sec. G, pp. 478–483.
6P. B. Allen, Phys. Rev. Lett. 59, 1460 (1987).7W. S. Fann, R. Storz, H. W. K. Tom, and J. Bokor, Phys. Rev. Lett.68, 2834 (1992).
8B. Mansart, M. J. G. Cottet, T. Penfold, S. B. Dugdale, R. Tediosi,M. Chergui, and F. Carbone, Proc. Natl. Acad. Sci. U.S.A. 109,5603 (2012).
9N. Gedik, D-S. Yang, G. Logvenov, I. Bozovic, and A. H. Zewail,Science 316, 425 (2007).
10B. Mansart, D. Boschetto, A. Savoia, F. Rullier-Albenque,F. Bouquet, E. Papalazarou, A. Forget, D. Colson, A. Rousse, andM. Marsi, Phys. Rev. B 82, 024513 (2010).
11M. I. Kaganov, I. M. Lifshitz, and L. V. Tanatarov, Sov. Phys. JETP4, 173 (1957).
12L. Perfetti, P. A. Loukakos, M. Lisowski, U. Bovensiepen, H. Eisaki,and M. Wolf, Phys. Rev. Lett. 99, 197001 (2007).
13R. Cortes, L. Rettig, Y. Yoshida, H. Eisaki, M. Wolf, andU. Bovensiepen, Phys. Rev. Lett. 107, 097002 (2011).
14S. L. Johnson, P. Beaud, E. Vorobeva, C. J. Milne, E D. Murray,S. Fahy, and G. Ingold, Acta Cryst. A 66, 157 (2010).
15P. Beaud, S. L. Johnson, A. Streun, R. Abela, D. Abramsohn,D. Grolimund, F. Krasniqi, T. Schmidt, V. Schlott, and G. Ingold,Phys. Rev. Lett. 99, 174801 (2007).
16P. Beaud, S. L. Johnson, E. Vorobeva, C. J. Milne, A. Caviezel,S. O. Mariager, R. A. De Souza, U. Straub, and G. Ingold, Chimia65, 308 (2011).
17P. Boni, J. D. Axe, G. Shirane, R. J. Birgeneau, D. R. Gabbe, H. P.Jenssen, M. A. Kastner, C. J. Peters, P. J. Picone, and T. R. Thurston,Phys. Rev. B 38, 185 (1988).
18http://henke.lbl.gov/optical_constants/atten2.html.19N. Momono and M. Ido, Physica C 264, 311 (1996).20N. Wada, H. Muro-Oka, Y. Nakamura, and K. Kumagai, Physica C
157, 453 (1989).21T. Jarlborg, Phys. Rev. B 79, 094530 (2009).22Z. Lin, L. V. Zhigilei, and V. Celli, Phys. Rev. B 77, 075133
(2008).23S. L. Johnson, P. Beaud, E. Vorobeva, C. J. Milne, E. D. Murray,
S. Fahy, and G. Ingold, Phys. Rev. Lett. 102, 175503 (2009).24T. Jarlborg, Appl. Phys. Lett. 94, 212503 (2009).25T. Jarlborg, Phys. Rev. B 84, 064506 (2011).26E. van Heumen, E. Muhlethaler, A. B. Kuzmenko, H. Eisaki,
W. Meevasana, M. Greven, and D. van der Marel, Phys. Rev. B79, 184512 (2009).
27S. Dal Conte, C. Giannetti, G. Coslovich, F. Cilento, D.Bossini, T. Abebaw, F. Banfi, G. Ferrini, H. Eisaki, M. Greven,A. Damascelli, D. van der Marel, and F. Parmigiani, Science 335,1600 (2012).
28M. Mostoller, J. Zhang, A. M. Rao, and P. C. Eklund, Phys. Rev. B41, 6488 (1990).
29P. Giannozzi et al., J. Phys.: Condens. Matter 21, 395502(2009).
30T. Jarlborg, Physica C 454, 5 (2007).31W. E. Pickett, Rev. Mod. Phys. 61, 433 (1989).32A. Damascelli, Z.-X. Shen, and Z. Hussain, Rev. Mod. Phys. 75,
473 (2003).33J. M. Ziman, Principles of the Theory of Solids (Cambridge
University Press, New York, 1971).34G. D. Gaspari and B. L. Gyorffy, Phys. Rev. Lett. 28, 801
(1972).35M. Dacorogna, T. Jarlborg, A. Junod, M. Pelizzone, and M. Peter,
J. Low Temp. Phys. 57, 629 (1984).36High-T vibrations do not contribute from femtosecond excitations,
since the time scale of lattice vibrations is of the order 10−13 s.37T. Jarlborg, Phys. Rev. B 59, 15002 (1999).38T. Jarlborg and M. Peter, J. Magn. Magn. Mater. 42, 89 (1984).39F. Carbone, N. Gedik, J. Lorenzana, and A. H. Zewail, Adv.
Condens. Matter Phys. 2010, 27 (2010).
054507-9