Temperature dependence of acoustic ... - physics… · Temperature dependence of acoustic harmonics...
7
Temperature dependence of acoustic harmonics generated by nonlinear ultrasound wave propagation in water at various frequencies Borna Maraghechi Department of Physics, Ryerson University, 350 Victoria Street, Toronto, Ontario M5B 2K3, Canada Mojtaba H. Hasani Department of Biomedical Engineering, Amirkabir University of Technology, 424 Hafez Avenue, Tehran, Iran Michael C. Kolios a) and Jahan Tavakkoli a),b) Department of Physics, Ryerson University, 350 Victoria Street, Toronto, Ontario M5B 2K3, Canada (Received 28 May 2015; revised 13 January 2016; accepted 1 April 2016; published online 6 May 2016) Ultrasound-based thermometry requires a temperature-sensitive acoustic parameter that can be used to estimate the temperature by tracking changes in that parameter during heating. The objective of this study is to investigate the temperature dependence of acoustic harmonics generated by nonlinear ultrasound wave propagation in water at various pulse transmit frequencies from 1 to 20 MHz. Simulations were conducted using an expanded form of the Khokhlov–Zabolotskaya–Kuznetsov non- linear acoustic wave propagation model in which temperature dependence of the medium parameters was included. Measurements were performed using single-element transducers at two different trans- mit frequencies of 3.3 and 13MHz which are within the range of frequencies simulated. The acoustic pressure signals were measured by a calibrated needle hydrophone along the axes of the transducers. The water temperature was uniformly increased from 26 C to 46 C in increments of 5 C. The results show that the temperature dependence of the harmonic generation is different at various fre- quencies which is due to the interplay between the mechanisms of absorption, nonlinearity, and fo- cusing gain. At the transmit frequencies of 1 and 3.3 MHz, the harmonic amplitudes decrease with increasing the temperature, while the opposite temperature dependence is observed at 13 and 20 MHz. V C 2016 Acoustical Society of America. [http://dx.doi.org/10.1121/1.4946898] [OAS] Pages: 2475–2481 I. INTRODUCTION Noninvasive thermometry is needed to monitor the tem- perature change in the heated region during thermal treatments in order to improve the treatment efficacy and safety. Ultrasound is an attractive option for temperature mapping since it is non-ionizing, portable, and is inexpensive. Several ultrasonic techniques have been proposed for noninvasive tis- sue thermometry. 1,2 In order to noninvasively estimate the temperature using ultrasound, a temperature sensitive acoustic parameter is required. The temperature could be estimated by knowing the temperature dependence of the parameter and tracking changes in that parameter during heating. Acoustic pulses with relatively high-pressure progres- sively get distorted as they propagate and generate higher harmonics. This effect increases with increasing frequency, source pressure, and focusing gain of the beam at a given propagation distance. 3 Finite-amplitude effects of nonlinear propagation of ultrasound waves are used in various diagnos- tic and therapeutic applications of ultrasound. 4,5 Tissue Harmonic Imaging is an imaging technique in which a pulse with a center frequency of f 0 is transmitted and the signal containing the second harmonic (2 f 0 ) is received to form an image. 4,5 Superharmonic imaging uses the combination of the third, fourth, and fifth harmonics of the received signal to image. 6 It has been shown that imag- ing with these harmonics improves the spatial resolution and reduces the aberration and reverberation artifacts of the image. 4–6 Acoustic nonlinearity parameter imaging has been applied for tissue characterization. The value of the acoustic nonlinearity parameter (B/A) of fatty tissues is typically twice that of non-fatty tissues. 7 Zhang et al. 7 showed that B/A can provide information about the composition of the tissue. They generated B/A images of biological specimens such as porcine normal and fatty liver tissues, and porcine fat tissue. Studies have shown that B/A is temperature dependent and it could be considered as a basis for an ultrasound-based method for noninvasive temperature estimation. 8,9 The B/A is about 4 times more temperature sensitive compared to the speed of sound and thermal expansion in water. 8 van Dongen and Verweij simulated the nonlinear propagation of acoustic waves in glycerol using the lossless form of the Burgers equation. 8 They showed that the harmonic pressure amplitudes are temperature dependent and could potentially be considered as suitable parameters for noninvasive ultra- sound thermometry. However, the lossless form of Burgers a) Also at: Institute for Biomedical Engineering, Science and Technology (iBEST), Keenan Research Centre for Biomedical Science, St. Michael’s Hospital, Toronto, Ontario, M5B 1W8, Canada. b) Electronic mail: [email protected] J. Acoust. Soc. Am. 139 (5), May 2016 V C 2016 Acoustical Society of America 2475 0001-4966/2016/139(5)/2475/7/$30.00 Redistribution subject to ASA license or copyright; see http://acousticalsociety.org/content/terms. Download to IP: 141.117.24.131 On: Sun, 08 May 2016 20:37:48
Transcript of Temperature dependence of acoustic ... - physics… · Temperature dependence of acoustic harmonics...
Temperature dependence of acoustic harmonics generatedby nonlinear ultrasound wave propagation in waterat various frequencies
Borna MaraghechiDepartment of Physics, Ryerson University, 350 Victoria Street, Toronto, Ontario M5B 2K3, Canada
Mojtaba H. HasaniDepartment of Biomedical Engineering, Amirkabir University of Technology, 424 Hafez Avenue, Tehran, Iran
Michael C. Koliosa) and Jahan Tavakkolia),b)
Department of Physics, Ryerson University, 350 Victoria Street, Toronto, Ontario M5B 2K3, Canada
(Received 28 May 2015; revised 13 January 2016; accepted 1 April 2016; published online 6 May2016)
Ultrasound-based thermometry requires a temperature-sensitive acoustic parameter that can be used
to estimate the temperature by tracking changes in that parameter during heating. The objective of
this study is to investigate the temperature dependence of acoustic harmonics generated by nonlinear
ultrasound wave propagation in water at various pulse transmit frequencies from 1 to 20 MHz.
Simulations were conducted using an expanded form of the Khokhlov–Zabolotskaya–Kuznetsov non-
linear acoustic wave propagation model in which temperature dependence of the medium parameters
was included. Measurements were performed using single-element transducers at two different trans-
mit frequencies of 3.3 and 13 MHz which are within the range of frequencies simulated. The acoustic
pressure signals were measured by a calibrated needle hydrophone along the axes of the transducers.
The water temperature was uniformly increased from 26 �C to 46 �C in increments of 5 �C. The
results show that the temperature dependence of the harmonic generation is different at various fre-
quencies which is due to the interplay between the mechanisms of absorption, nonlinearity, and fo-
cusing gain. At the transmit frequencies of 1 and 3.3 MHz, the harmonic amplitudes decrease with
increasing the temperature, while the opposite temperature dependence is observed at 13 and
20 MHz. VC 2016 Acoustical Society of America. [http://dx.doi.org/10.1121/1.4946898]
[OAS] Pages: 2475–2481
I. INTRODUCTION
Noninvasive thermometry is needed to monitor the tem-
perature change in the heated region during thermal treatments
in order to improve the treatment efficacy and safety.
Ultrasound is an attractive option for temperature mapping
since it is non-ionizing, portable, and is inexpensive. Several
ultrasonic techniques have been proposed for noninvasive tis-
sue thermometry.1,2 In order to noninvasively estimate the
temperature using ultrasound, a temperature sensitive acoustic
parameter is required. The temperature could be estimated by
knowing the temperature dependence of the parameter and
tracking changes in that parameter during heating.
Acoustic pulses with relatively high-pressure progres-
sively get distorted as they propagate and generate higher
harmonics. This effect increases with increasing frequency,
source pressure, and focusing gain of the beam at a given
propagation distance.3 Finite-amplitude effects of nonlinear
propagation of ultrasound waves are used in various diagnos-
tic and therapeutic applications of ultrasound.4,5
Tissue Harmonic Imaging is an imaging technique in
which a pulse with a center frequency of f0 is transmitted
and the signal containing the second harmonic (2� f0) is
received to form an image.4,5 Superharmonic imaging uses
the combination of the third, fourth, and fifth harmonics of
the received signal to image.6 It has been shown that imag-
ing with these harmonics improves the spatial resolution and
reduces the aberration and reverberation artifacts of the
image.4–6
Acoustic nonlinearity parameter imaging has been
applied for tissue characterization. The value of the acoustic
nonlinearity parameter (B/A) of fatty tissues is typically
twice that of non-fatty tissues.7 Zhang et al.7 showed that
B/A can provide information about the composition of the
tissue. They generated B/A images of biological specimens
such as porcine normal and fatty liver tissues, and porcine
fat tissue.
Studies have shown that B/A is temperature dependent
and it could be considered as a basis for an ultrasound-based
method for noninvasive temperature estimation.8,9 The B/A
is about 4 times more temperature sensitive compared to
the speed of sound and thermal expansion in water.8 van
Dongen and Verweij simulated the nonlinear propagation of
acoustic waves in glycerol using the lossless form of the
Burgers equation.8 They showed that the harmonic pressure
amplitudes are temperature dependent and could potentially
be considered as suitable parameters for noninvasive ultra-
sound thermometry. However, the lossless form of Burgers
a)Also at: Institute for Biomedical Engineering, Science and Technology
(iBEST), Keenan Research Centre for Biomedical Science, St. Michael’s
Hospital, Toronto, Ontario, M5B 1W8, Canada.b)Electronic mail: [email protected]
J. Acoust. Soc. Am. 139 (5), May 2016 VC 2016 Acoustical Society of America 24750001-4966/2016/139(5)/2475/7/$30.00
Redistribution subject to ASA license or copyright; see http://acousticalsociety.org/content/terms. Download to IP: 141.117.24.131 On: Sun, 08 May 2016 20:37:48
equation is the simplest model that describes only the effect
of nonlinearity for acoustic plane waves of finite amplitude.
Both10 simulated an acoustic plane wave propagating in
water in order to study the temperature dependence of har-
monics. The simulations were performed using two different
solutions of Burgers equation known as Keck-Beyer and
Fubini for lossy and lossless media, respectively.3,10 A
monochromatic 1 MHz source with a pressure of 1 MPa was
used in the study. The author showed that the harmonics are
weakly sensitive to temperature and a minimum in the har-
monic pressure value occurs at around 45 �C. It is worth not-
ing that neither of the simulation studies mentioned did take
into account the combined effects of diffraction, absorption,
and nonlinearity—all of which change the harmonics ampli-
tude of the propagating waves.
We have recently shown that the pressure amplitude and
the energy content of the backscattered fundamental fre-
quency, the second and the third harmonics generated by
nonlinear ultrasound propagation in tissue-mimicking gel
phantoms, and ex vivo bovine muscle tissues are highly
sensitive to temperature, when the acoustic harmonics were
generated by transmitting a 13-MHz pulse using a high-
frequency ultrasound imaging scanner.11 It was also demon-
strated that higher harmonics have a higher sensitivity to
temperature.
The Khokhlov–Zabolotskaya–Kuznetsov (KZK) nonlin-
ear wave equation is a well-established model for finite-
amplitude wave propagation.3,12–14 The KZK equation is a
parabolic approximation of the Westervelt nonlinear wave
equation that consists of terms to account for diffraction,
absorption, and nonlinearity.3 The diffraction term accounts
for the finite dimensions of the source and the attenuation
term considers the heat conduction and viscosity of the me-
dium. The nonlinear term accounts for the nonlinear propa-
gation of the finite-amplitude wave.
In this study, the temperature dependence of harmonic
amplitudes generated by nonlinear ultrasound wave propa-
gation in water is examined at various pulse transmit
frequencies from 1 to 20 MHz using the KZK wave equa-
tion. Nonlinear ultrasound wave propagation simulations
were performed using a time-domain numerical solution of
a modified KZK nonlinear wave equation that accounts for
temperature dependent medium parameters. The simulation
results are compared with measurements. Measurements
were performed using two single element transducers at fre-
quencies of 3.3 and 13 MHz.
The main objective of this study is to investigate and
understand the mechanisms of action of harmonics genera-
tion as a function of temperature at various frequencies in
water which is a simple, homogeneous, and more controlled
medium compared to tissue. Soft tissues exhibit additional
complexities such as significant structural heterogeneity that
change as a function of time (tissue decay) and temperature.
Moreover, water was chosen in experiments and simulations
because the values for acoustic parameters (attenuation
coefficient, speed of sound, density, and B/A) of water were
available as a function of temperature in the literature.
Currently, there are limited amount of information on the
temperature dependence of these acoustic parameters for
soft tissue which we need as inputs to our simulation
model.9,15,16
II. MATERIALS AND METHODS
A. Temperature dependent nonlinear ultrasound wavepropagation model
Nonlinear ultrasound wave propagation simulations
were performed using a time-domain numerical solution of a
modified KZK nonlinear wave equation in which tempera-
ture dependence of the medium parameters was included.
The dimensionless form of the temperature-dependent KZK
equation for focused sources could be given as13
@P
@r¼ 1
4G Tð Þ
ðs
�1
b
a
@2P
@X2þ a
b
@2P
@Y2
� �ds0 þ A Tð Þ @
2P
@s2
þ N Tð Þ P@P
@s
� �; (1)
where P is the transformed source pressure amplitude
defined as P¼ (p/p0) which p is the sound pressure in the
Cartesian coordinates and p0 is the source pressure ampli-
tude. r¼ z/d is the dimensionless z axis (axial distance di-
vided by the focal length d) for a source with characteristic
sizes of a and b in the x and y directions with an angular fre-
quency of x0. X and Y are the transformed transverse coordi-
nates (X¼ x/a, Y¼ y/b) and T is the temperature. G(T) is the
focusing gain defined as
G Tð Þ ¼ z0 Tð Þd¼ pf0ab
c0 Tð Þd; (2)
where z0 is the Rayleigh distance. A(T) is the absorption pa-
rameter defined as
AðTÞ ¼ aðTÞd ¼ a0ðTÞf 20 d; (3)
where a0 is the pressure absorption coefficient. N(T) is the
nonlinear parameter defined as
N Tð Þ ¼ d
�z Tð Þ ¼b Tð Þ2pf0p0
q0 Tð Þc30 Tð Þ d; (4)
where �z is the plane wave shock formation distance. c0 and q0
are the small signal speed of sound and the medium density,
respectively. s is the transformed retarded time defined as
s¼x0t0 where t0 is the retarded time (t0 ¼ t � z/c0). The terms
on the right-hand side of Eq. (1) account for diffraction, nonli-
nearity, and thermoviscous absorption, respectively.13
The source boundary condition was defined as p¼ p0 f(tþ x2/2c0dxþ y2/2c0dy) g(x, y) n(x, y), z¼ 0, where f(t),g(x, y), and n(x, y) are the source temporal excitation, the
source spatial aperture function, and the source apodization
function, respectively. By using the variable transformations
and dimensionless variables, the source boundary condition
could be rewritten as P¼ f(sþGxX2þGyY
2) g(X, Y) n(X, Y),
r¼ 0, where Gx¼G bd/adx and Gy¼G ad/bdy are the
directional focusing gains in the x and y directions,
respectively.
2476 J. Acoust. Soc. Am. 139 (5), May 2016 Maraghechi et al.
Redistribution subject to ASA license or copyright; see http://acousticalsociety.org/content/terms. Download to IP: 141.117.24.131 On: Sun, 08 May 2016 20:37:48
For a circular source, the function g(X, Y) can be written
as
gðX; YÞ ¼ 1 X2 þ Y2 � 1;0 otherwise:
�(5)
In the selection of boundary values, the extent of spatial
domains, Xmax and Ymax, were chosen large enough to mini-
mize reflections due to artificial boundary conditions. The
time window was also large enough to encompass the entire
waveform, including delayed edge waves.13
Nonlinear propagation of 9 and 7 cycle pulses at 3.3 and
13 MHz in water with source pressure amplitudes of 0.26 and
0.05 MPa, respectively, and for the same transducer geome-
tries used in our experiments were simulated. The source
pressure amplitudes used in simulations were selected in order
to achieve similar pressure and a similar degree of nonlinear
waveform distortion as to that obtained in the experiments at
the transducer focus and along the acoustic axes when water
was at the baseline temperature of 26 �C. Simulations for the
1 and 20 MHz pulses were performed using the same parame-
ters as those at 3.3 and 13 MHz, respectively. The source pres-
sure waveform was a Gaussian envelope pulse given as
P ¼ exp � snp
� �2" #
sin s; (6)
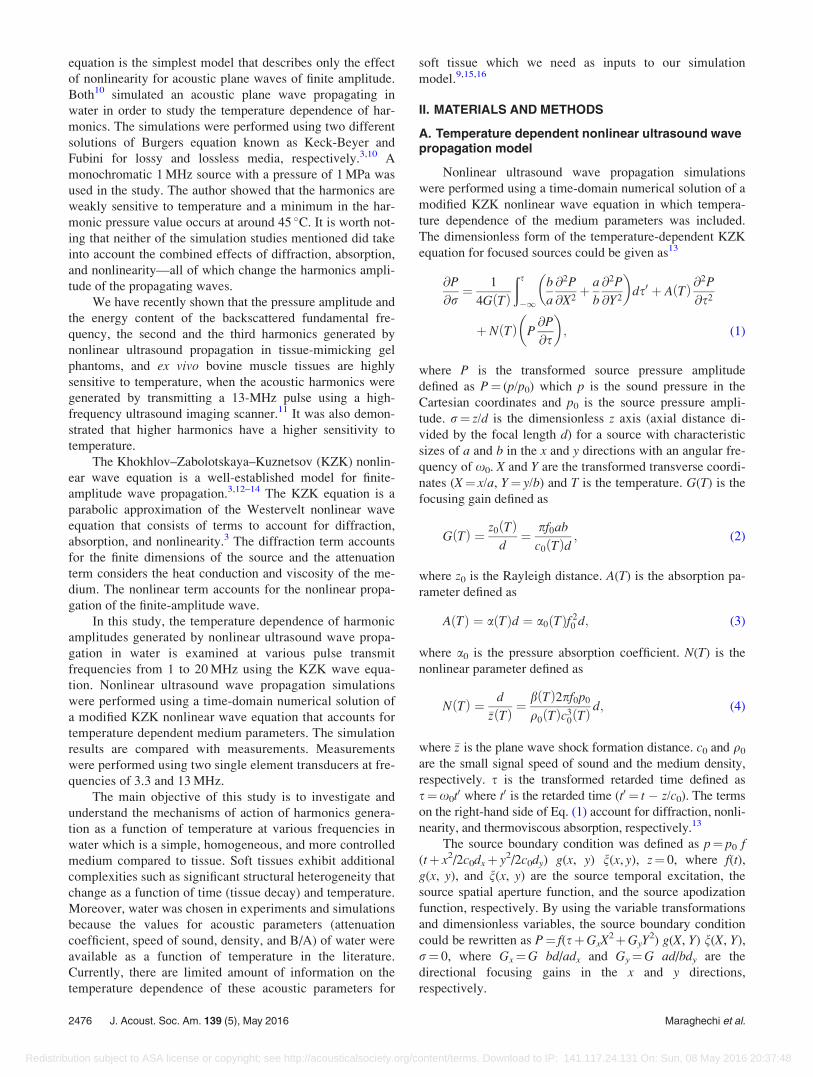
where n is the number of cycles. In order to replicate the
effects induced by raising the temperature of water from
26 �C to 46 �C, the empirical temperature dependent values
of four acoustic medium parameters at each temperature
were used as an input to the simulation. The values of sound
speed, medium’s density, absorption coefficient, and the B/A
as a function of temperature in water were obtained from
published data8,14,17 and are shown in Fig. 1.
In order to take into account the spatial averaging effect
of the hydrophone, harmonics were averaged over a circular
area corresponding to virtual area of the hydrophone used in
the experiments.18,19 The change in the peak pressure
amplitudes of the harmonics and their ratios were analyzed
at each simulated water temperature from 26 �C to 46 �C in
increments of 5 �C.
B. Experiments
A broadband single-element transducer with center fre-
quency of 5 MHz (Matec, Northborough, MA) was used to
generate pulses at 3.3 MHz. The transducer had a diameter of
6 mm and a focal length of 3 cm. The transducer was driven by
an arbitrary function generator (Model AFG3101; Tektronix,
Beaverton, OR) through a class-A broadband radio frequency
power amplifier (Model 325LA; E&I, Rochester, NY), with
a frequency range of 250 kHz to 150 MHz and a nominal
gain of 50 dB. A high-frequency ultrasound imaging scanner
(VevoVR
770, Visualsonics Inc., Toronto, ON, Canada) with a
25 MHz center frequency wide-band single-element transducer
(RMV-710B, 7.1 mm diameter, 15 mm focal length) was used
to generate pulses at 13 MHz. Acoustic harmonics were gener-
ated by transmitting pulse trains of 15-cycle length at 3.3 and
13 MHz with focal positive peak pressures of approximately
0.6 and 0.9 MPa, respectively, in water at 26 �C. The purpose
of choosing these pressures was to have reasonable signal-to-
noise ratio values for the first, second, and third harmonics.
The acoustic pressure signals were measured along the
axes of the transducers by a calibrated needle hydrophone with
an active element diameter of 400 lm (Model HNA-0400;
ONDA Corporation, Sunnyvale, CA). Water was placed in a
2.5 cm diameter cylindrical container with a transparent win-
dow at the bottom. Water temperature was uniformly elevated
from 26 �C to 46 �C in increments of 5 �C by the flow of hot
water around the container. Hot water was pumped from a con-
trolled circulating water bath (Haake DC10, Thermo Electron
Corp., Newington, NH) using a peristaltic pump (MasterflexVR
L/SVR
, Cole Parmer, Chicago, IL). The 5 MHz transducer was
immersed in a water tank for coupling with the container. The
RMV-710B transducer was coupled with the container using
acoustic gel. A schematic of the experimental setup is shown in
Fig. 2. The received signal detected by the hydrophone was
recorded with a 350 MHz digital oscilloscope (Model 7032A;
FIG. 1. The (a) attenuation coefficient (Ref. 14), (b) speed of sound (Ref. 14),
(c) density (Ref. 8), and (d) B/A (Ref. 17) as empirical functions of tempera-
ture in water. FIG. 2. (Color online) Schematic of the experimental setup at 3.3 MHz.
J. Acoust. Soc. Am. 139 (5), May 2016 Maraghechi et al. 2477
Redistribution subject to ASA license or copyright; see http://acousticalsociety.org/content/terms. Download to IP: 141.117.24.131 On: Sun, 08 May 2016 20:37:48
Agilent Technologies, Santa Clara, CA) and analyzed offline.
The pressure amplitudes of the fundamental frequency (p1),
and its harmonics [second (p2), third (p3)] generated by nonlin-
ear ultrasound propagation were obtained by calculating the
frequency spectrum of the measured acoustic pressure signals.
The peak pressure harmonic amplitudes and their ratios (p2/p1
and p3/p1) were analyzed as a function of water temperature
and transducers transmit frequencies. The experiments were
repeated 12 times at each transmit frequency and temperature.
III. RESULTS
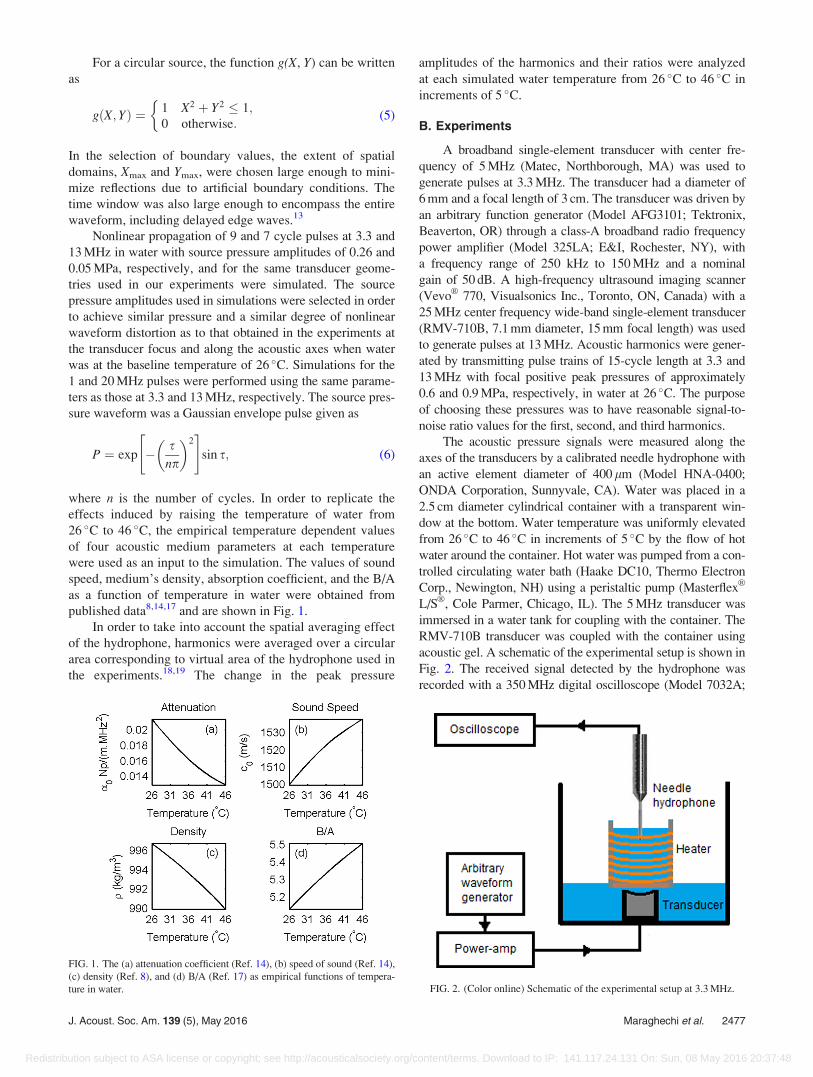
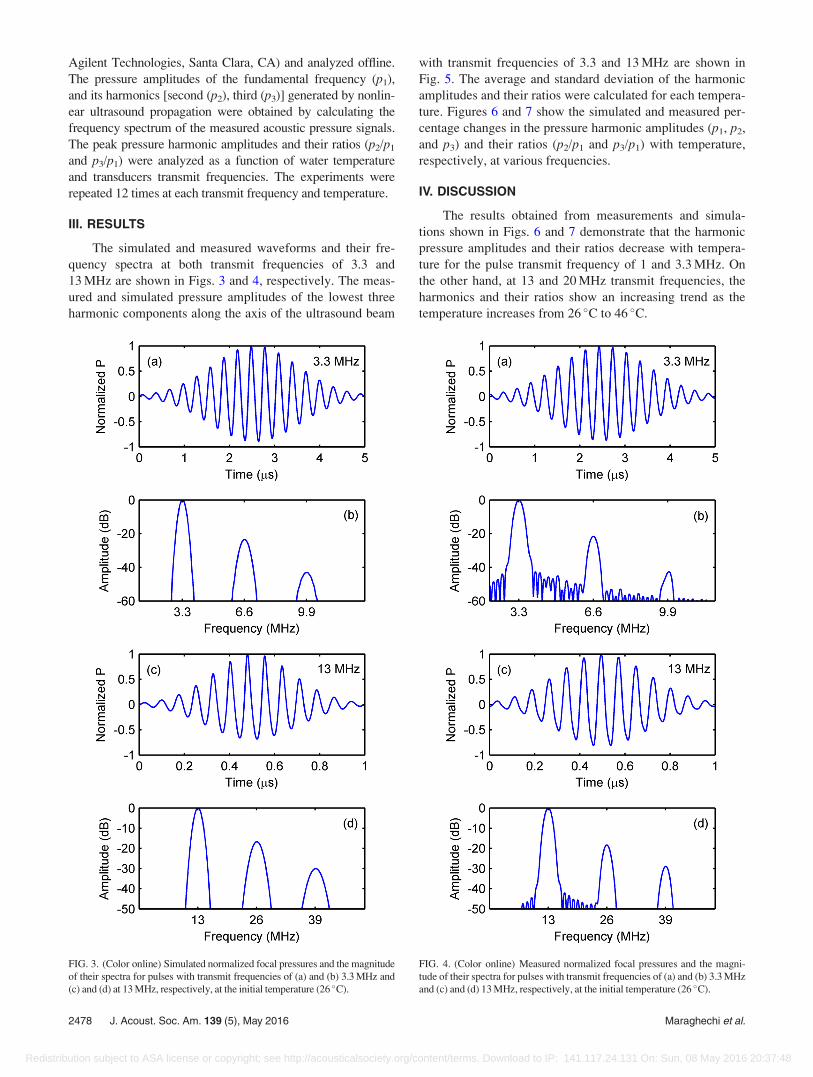
The simulated and measured waveforms and their fre-
quency spectra at both transmit frequencies of 3.3 and
13 MHz are shown in Figs. 3 and 4, respectively. The meas-
ured and simulated pressure amplitudes of the lowest three
harmonic components along the axis of the ultrasound beam
with transmit frequencies of 3.3 and 13 MHz are shown in
Fig. 5. The average and standard deviation of the harmonic
amplitudes and their ratios were calculated for each tempera-
ture. Figures 6 and 7 show the simulated and measured per-
centage changes in the pressure harmonic amplitudes (p1, p2,
and p3) and their ratios (p2/p1 and p3/p1) with temperature,
respectively, at various frequencies.
IV. DISCUSSION
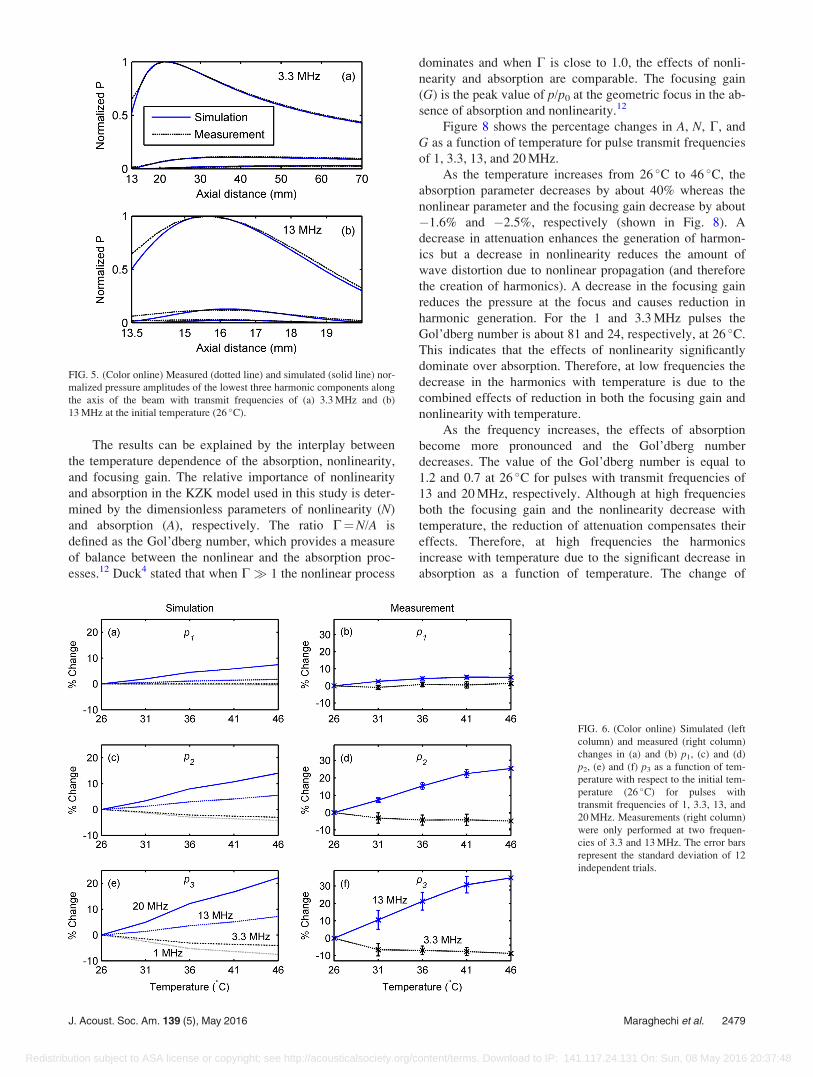
The results obtained from measurements and simula-
tions shown in Figs. 6 and 7 demonstrate that the harmonic
pressure amplitudes and their ratios decrease with tempera-
ture for the pulse transmit frequency of 1 and 3.3 MHz. On
the other hand, at 13 and 20 MHz transmit frequencies, the
harmonics and their ratios show an increasing trend as the
temperature increases from 26 �C to 46 �C.
FIG. 3. (Color online) Simulated normalized focal pressures and the magnitude
of their spectra for pulses with transmit frequencies of (a) and (b) 3.3 MHz and
(c) and (d) at 13 MHz, respectively, at the initial temperature (26 �C).
FIG. 4. (Color online) Measured normalized focal pressures and the magni-
tude of their spectra for pulses with transmit frequencies of (a) and (b) 3.3 MHz
and (c) and (d) 13 MHz, respectively, at the initial temperature (26 �C).
2478 J. Acoust. Soc. Am. 139 (5), May 2016 Maraghechi et al.
Redistribution subject to ASA license or copyright; see http://acousticalsociety.org/content/terms. Download to IP: 141.117.24.131 On: Sun, 08 May 2016 20:37:48
The results can be explained by the interplay between
the temperature dependence of the absorption, nonlinearity,
and focusing gain. The relative importance of nonlinearity
and absorption in the KZK model used in this study is deter-
mined by the dimensionless parameters of nonlinearity (N)
and absorption (A), respectively. The ratio C¼N/A is
defined as the Gol’dberg number, which provides a measure
of balance between the nonlinear and the absorption proc-
esses.12 Duck4 stated that when C� 1 the nonlinear process
dominates and when C is close to 1.0, the effects of nonli-
nearity and absorption are comparable. The focusing gain
(G) is the peak value of p/p0 at the geometric focus in the ab-
sence of absorption and nonlinearity.12
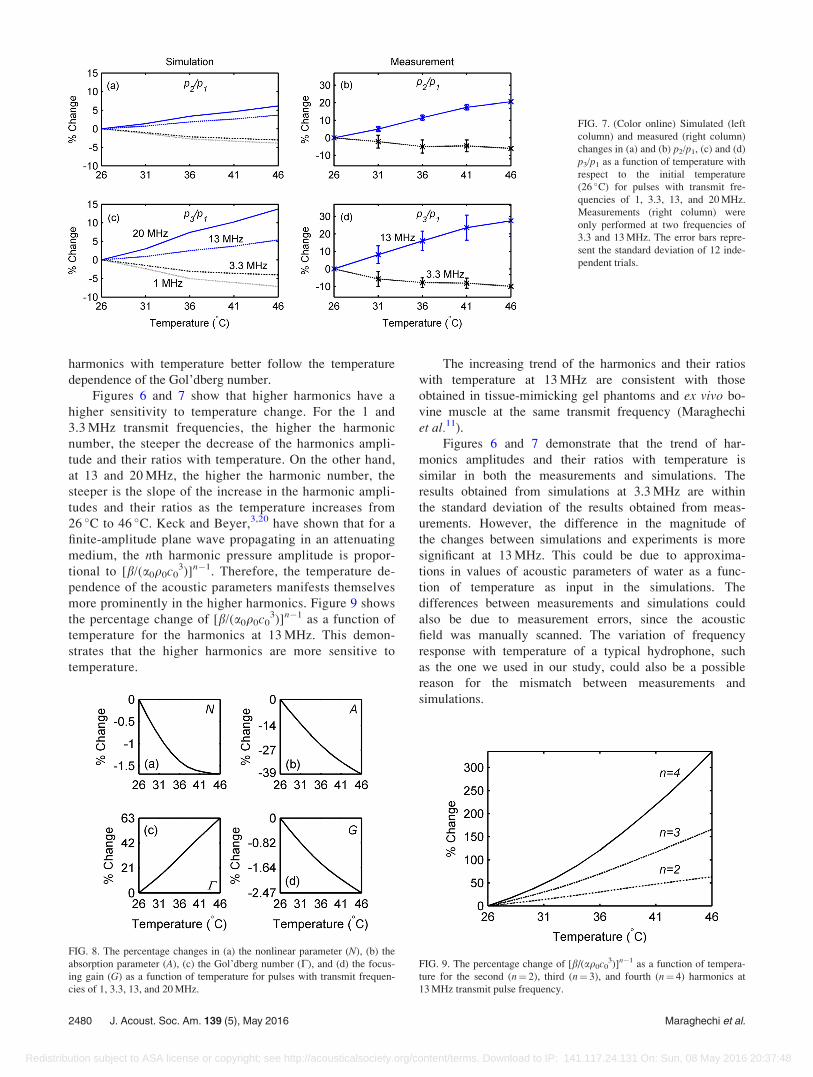
Figure 8 shows the percentage changes in A, N, C, and
G as a function of temperature for pulse transmit frequencies
of 1, 3.3, 13, and 20 MHz.
As the temperature increases from 26 �C to 46 �C, the
absorption parameter decreases by about 40% whereas the
nonlinear parameter and the focusing gain decrease by about
�1.6% and �2.5%, respectively (shown in Fig. 8). A
decrease in attenuation enhances the generation of harmon-
ics but a decrease in nonlinearity reduces the amount of
wave distortion due to nonlinear propagation (and therefore
the creation of harmonics). A decrease in the focusing gain
reduces the pressure at the focus and causes reduction in
harmonic generation. For the 1 and 3.3 MHz pulses the
Gol’dberg number is about 81 and 24, respectively, at 26 �C.
This indicates that the effects of nonlinearity significantly
dominate over absorption. Therefore, at low frequencies the
decrease in the harmonics with temperature is due to the
combined effects of reduction in both the focusing gain and
nonlinearity with temperature.
As the frequency increases, the effects of absorption
become more pronounced and the Gol’dberg number
decreases. The value of the Gol’dberg number is equal to
1.2 and 0.7 at 26 �C for pulses with transmit frequencies of
13 and 20 MHz, respectively. Although at high frequencies
both the focusing gain and the nonlinearity decrease with
temperature, the reduction of attenuation compensates their
effects. Therefore, at high frequencies the harmonics
increase with temperature due to the significant decrease in
absorption as a function of temperature. The change of
FIG. 5. (Color online) Measured (dotted line) and simulated (solid line) nor-
malized pressure amplitudes of the lowest three harmonic components along
the axis of the beam with transmit frequencies of (a) 3.3 MHz and (b)
13 MHz at the initial temperature (26 �C).
FIG. 6. (Color online) Simulated (left
column) and measured (right column)
changes in (a) and (b) p1, (c) and (d)
p2, (e) and (f) p3 as a function of tem-
perature with respect to the initial tem-
perature (26 �C) for pulses with
transmit frequencies of 1, 3.3, 13, and
20 MHz. Measurements (right column)
were only performed at two frequen-
cies of 3.3 and 13 MHz. The error bars
represent the standard deviation of 12
independent trials.
J. Acoust. Soc. Am. 139 (5), May 2016 Maraghechi et al. 2479
Redistribution subject to ASA license or copyright; see http://acousticalsociety.org/content/terms. Download to IP: 141.117.24.131 On: Sun, 08 May 2016 20:37:48
harmonics with temperature better follow the temperature
dependence of the Gol’dberg number.
Figures 6 and 7 show that higher harmonics have a
higher sensitivity to temperature change. For the 1 and
3.3 MHz transmit frequencies, the higher the harmonic
number, the steeper the decrease of the harmonics ampli-
tude and their ratios with temperature. On the other hand,
at 13 and 20 MHz, the higher the harmonic number, the
steeper is the slope of the increase in the harmonic ampli-
tudes and their ratios as the temperature increases from
26 �C to 46 �C. Keck and Beyer,3,20 have shown that for a
finite-amplitude plane wave propagating in an attenuating
medium, the nth harmonic pressure amplitude is propor-
tional to [b/(a0q0c03)]n�1. Therefore, the temperature de-
pendence of the acoustic parameters manifests themselves
more prominently in the higher harmonics. Figure 9 shows
the percentage change of [b/(a0q0c03)]n�1 as a function of
temperature for the harmonics at 13 MHz. This demon-
strates that the higher harmonics are more sensitive to
temperature.
The increasing trend of the harmonics and their ratios
with temperature at 13 MHz are consistent with those
obtained in tissue-mimicking gel phantoms and ex vivo bo-
vine muscle at the same transmit frequency (Maraghechi
et al.11).
Figures 6 and 7 demonstrate that the trend of har-
monics amplitudes and their ratios with temperature is
similar in both the measurements and simulations. The
results obtained from simulations at 3.3 MHz are within
the standard deviation of the results obtained from meas-
urements. However, the difference in the magnitude of
the changes between simulations and experiments is more
significant at 13 MHz. This could be due to approxima-
tions in values of acoustic parameters of water as a func-
tion of temperature as input in the simulations. The
differences between measurements and simulations could
also be due to measurement errors, since the acoustic
field was manually scanned. The variation of frequency
response with temperature of a typical hydrophone, such
as the one we used in our study, could also be a possible
reason for the mismatch between measurements and
simulations.
FIG. 7. (Color online) Simulated (left
column) and measured (right column)
changes in (a) and (b) p2/p1, (c) and (d)
p3/p1 as a function of temperature with
respect to the initial temperature
(26 �C) for pulses with transmit fre-
quencies of 1, 3.3, 13, and 20 MHz.
Measurements (right column) were
only performed at two frequencies of
3.3 and 13 MHz. The error bars repre-
sent the standard deviation of 12 inde-
pendent trials.
FIG. 8. The percentage changes in (a) the nonlinear parameter (N), (b) the
absorption parameter (A), (c) the Gol’dberg number (C), and (d) the focus-
ing gain (G) as a function of temperature for pulses with transmit frequen-
cies of 1, 3.3, 13, and 20 MHz.
FIG. 9. The percentage change of [b/(aq0c03)]n�1 as a function of tempera-
ture for the second (n¼ 2), third (n¼ 3), and fourth (n¼ 4) harmonics at
13 MHz transmit pulse frequency.
2480 J. Acoust. Soc. Am. 139 (5), May 2016 Maraghechi et al.
Redistribution subject to ASA license or copyright; see http://acousticalsociety.org/content/terms. Download to IP: 141.117.24.131 On: Sun, 08 May 2016 20:37:48
V. CONCLUSION
In this work, the temperature dependence of acoustic
harmonics generated by nonlinear ultrasound wave propaga-
tion was investigated in water for a range of pulse transmit
frequencies from 1 to 20 MHz. Measurements were con-
ducted using two single element transducers to transmit the
acoustic pressure signals and a calibrated hydrophone to
receive them. The temperature-dependent KZK nonlinear
ultrasound beam simulations were performed for the same
experimental geometry. Several conclusions can be drawn
from the results obtained in this study:
(1) The harmonics generated by nonlinear ultrasound wave
propagation in water are temperature dependent.
(2) The temperature dependence of the harmonics genera-
tion is different for various transmit pulse frequencies.
The temperature dependence of harmonics generated
by nonlinear ultrasound wave propagation decreases
with increasing temperature at 1 and 3.3 MHz while
the opposite temperature dependence is observed at
13 and 20 MHz. The harmonics and the harmonic ratios
at 1 and 20 MHz are more sensitive to temperature
change compared to those at 3.3 and 13 MHz.
(3) The temperature dependence of harmonics depends on
absorption, nonlinearity, and focusing gain.
(4) For a given transmit frequency, the higher the harmonic
number, the higher is its sensitivity to temperature.
(5) The change in the harmonic generation as a function of
temperature shows similar trends in both simulations and
experiments at 3.3 and 13 MHz. However, there is a dis-
crepancy between simulation and measurement results at
13 MHz.
It should be noted that the conclusions mentioned above
depend strongly on the source parameters (transducer geom-
etry, source pressure amplitude, and frequency) used in this
study. In particular, characteristics of a nonlinear field
depend on the source pressure amplitude. Varying the source
pressure amplitude could therefore lead to some changes in
the reported results. An extension of this work to investigate
the effect of source pressure amplitude on harmonics genera-
tion with varying temperature will be the topic of the next
project in this study.
ACKNOWLEDGMENTS
The authors wish to acknowledge technical assistance
from Arthur Worthington from the Department of Physics,
Ryerson University, Toronto, Canada. This work was
partially supported by the Ontario Ministry of Research and
Innovation Research Fund-Research Excellence (ORF-RE)
grant, and the Natural Sciences and Engineering Research
Council of Canada (NSERC Discovery grants) that were
awarded to J.T. and M.C.K. Funding to purchase the
equipment was provided by the Canada Foundation for
Innovation, Canada Research Chairs program, and Ryerson
University.
1R. M. Arthur, W. L. Straube, J. W. Trobaugh, and E. G. Moros, “Non-
invasive estimation of hyperthermia temperatures with ultrasound,” Int. J.
Hyperthermia 21, 589–600 (2005).2M. A. Lewis, R. M. Staruch, and R. Chopra, “Thermometry and ablation
monitoring with ultrasound,” Int. J. Hyperthermia 31, 163–181 (2015).3M. F. Hamilton and D. T. Blackstock, Nonlinear Acoustics (Academic
Press, San Diego, CA, 1998), pp. 54–139.4F. A. Duck, “Nonlinear acoustics in diagnostic ultrasound,” Ultrasound
Med. Biol. 28, 1–18 (2002).5T. L. Szabo, Diagnostic Ultrasound Imaging: Inside Out (Academic Press,
Oxford, 2014), Chap. 12, pp. 501–546.6A. Bouakaz and N. de Jong, “Native tissue imaging at superharmonic
frequencies,” IEEE Trans. Ultrason. Ferroelectr. Freq. Control 50,
496–506 (2003).7D. Zhang, X. F. Gong, and X. Chen, “Experimental imaging of the acous-
tic nonlinearity parameter B/A for biological tissues via a parametric
array,” Ultrasound Med. Biol. 27, 1359–1365 (2001).8K. W. A. van Dongen and M. D. Verweij, “A feasibility study for non-
invasive thermometry using non-linear ultrasound,” Int. J. Hyperthermia
27, 612–624 (2011).9X. Liu, X. Gong, C. Yin, J. Li, and D. Zhang, “Noninvasive estimation of
temperature elevations in biological tissues using acoustic nonlinearity pa-
rameter imaging,” Ultrasound Med. Biol. 34, 414–424 (2008).10E. A. Both, “Feasibility study of temperature estimation based on nonlin-
ear acoustics,” M.Sc. dissertation, Delft University of Technology, 2010.11B. Maraghechi, M. C. Kolios, and J. Tavakkoli, “Temperature dependence
of nonlinear acoustic harmonics in ex vivo tissue and tissue-mimicking
phantom,” Int. J. Hyperthermia 31, 666–673 (2015).12Y. S. Lee and M. F. Hamilton, “Time-domain modeling of pulsed finite
amplitude sound beams,” J. Acoust. Soc. Am. 97, 906–917 (1995).13M. H. Hasani, S. Gharibzadeh, Y. Farjami, and J. Tavakkoli,
“Unmitigated numerical solution to the diffraction term in the parabolic
nonlinear ultrasound wave equation,” J. Acoust. Soc. Am. 134, 1775–1790
(2013).14R. S. C. Cobbold, Foundation of Biomedical Ultrasound (Oxford
University Press, New York, 2007), Chap. 1, pp. 12–74.15M. J. Choi, S. R. Guntur, J. M. Lee, D. G. Paeng, K. I. L. Lee, and A.
Coleman, “Changes in ultrasonic properties of liver tissue in vitro during
heating-cooling cycle concomitant with thermal coagulation,” Ultrasound
Med. Biol. 37, 2000–2012 (2011).16E. J. Jackson, C.-C. Coussios, and R. O. Cleveland, “Nonlinear acoustic
properties of ex vivo bovine liver and the effects of temperature and
denaturation,” Phys. Med. Biol. 59, 3223–3238 (2014).17R. T. Beyer, “Parameter of nonlinearity in fluids,” J. Acoust. Soc. Am. 32,
719–721 (1960).18B. Zeqiri and A. D. Bond, “The influence of wave-form distortion on
hydrophone spatial-averaging corrections—Theory and measurement,”
J. Acoust. Soc. Am. 92, 1809–1821 (1992).19M. S. Canney, M. R. Bailey, L. A. Crum, V. A. Khokhlova, and O. A.
Sapozhnikov, “Acoustic characterization of high intensity focused ultra-
sound fields: A combined measurement and modeling approach,”
J. Acoust. Soc. Am. 124, 2406–2420 (2008).20W. Keck and R. T. Beyer, “Frequency spectrum of finite amplitude ultra-
sonic waves in liquids,” Phys. Fluids 3, 346–352 (1960).
J. Acoust. Soc. Am. 139 (5), May 2016 Maraghechi et al. 2481
Redistribution subject to ASA license or copyright; see http://acousticalsociety.org/content/terms. Download to IP: 141.117.24.131 On: Sun, 08 May 2016 20:37:48