Temididiscussione - Banca d'Italia
71
Temi di discussione del Servizio Studi Style, Fees and Performance of Italian Equity Funds by Riccardo Cesari and Fabio Panetta Number 325 - January 1998
Transcript of Temididiscussione - Banca d'Italia

Temididiscussionedel Servizio Studi
Style, Fees and Performance of Italian Equity Funds
by Riccardo Cesari and Fabio Panetta
Number 325 -- January 1998

The purpose of the “Temi didiscussione” series is to promote the circulation of workingpapers prepared within the Bank of Italy or presented in Bank seminars by outsideeconomists with the aim of stimulating comments and suggestions.
The views expressed in the articles are those of the authors and do not involve theresponsibility of the Bank.
Editorial Board:MASSIMO ROCCAS, GIOVANNI FERRI, GIUSEPPE PARIGI, ROBERTO RINALDI, DANIELE TERLIZZESE,
ORESTE TRISTANI; SILIA MIGLIARUCCI (Editorial Assistant).

Style, Fees and Performance of Italian Equity Funds
by Riccardo Cesari and Fabio Panetta
Number 325 - January 1998

STYLE, FEES AND PERFORMANCE 0F ITALIAN EQUITY FUNDS
by Riccardo Cesari (*) and Fabio Panetta (**)
Abstract
Using a clustering procedure, we classify Italian fundsex-post on the basis of the composition of their portfolios andfind that the optimal number of clusters is equal to 4. Thefour groups which result from the statistical classificationclosely match the 4-level aggregation of the 20 ex-antecategories used by the Italian mutual funds association.
We then estimate the risk-adjusted performance ofItalian equity funds, using both net and gross returns andemploying both one-factor CAPM benchmarks and multi-factorbenchmarks. In addition to the standard Jensen's a, we measurerisk-adjusted performance using the Positive Period Weightingmeasure (PPW), which is not influenced by managers' market-timing strategy. Using net returns (calculated after managementfees and taxes but before load fees) the Italian equity funds'performance is not significantly different from zero. However,when the funds' performance is evaluated on the basis of grossreturns (i.e. returns computed adding back management fees paideach year by the funds), the performance of the Italian equityfunds is always positive. In particular, when both a 2-indexbenchmark that takes account of the funds' investments ingovernment bonds and a 5-factor APT benchmark are considered,performance is positive and significant using both Jensen's aand the PPW. This result supports Grossman and Stiglitz's(1980) view of market efficiency, suggesting that informedinvestors (investment funds) are compensated for theirinformation gathering.
(*) University of Bologna, Department of Economics.(**) Bank of Italy, Research Department.

Contents
1. Introduction and main results.......................P. 92. Review of the literature.............................~. 12
2.1 Methodological issues............................~. 122.2 Empirical issues.................................p. 14
3. Classifications of mutual funds......................~. 174. Costs and returns of Italian mutual funds............~. 20
4.1 The computation of gross returns.................~. 204.2 Cost dynamics and cost differences among funds..p. 24
5. Risk-adjusted performance measurement and results....p. 33Appendix 1: The classification of mutual funds..........~. 56Appendix 2: The computation of gross returns............~. 62Appendix 3: Data sources and the estimation of the
factor scores...............................~. 65References..............................................~. 68

1. Introduction and main results1
Recent empirical work has challenged the traditional
view on mutual funds' performance put forward by Jensen (1968).
In his paper Jensen concluded that the risk-adjusted
performance of mutual funds was inferior, after expenses, to
the performance of the benchmark portfolio, and that, before
expenses, mutual funds' performance was scattered randomly
around the CAPM market line. Therefore, Jensen concluded that
mutual fund managers have no private information. A different
conclusion was reached by Ippolito (1989), who found that
funds' risk-adjusted returns were positive after accounting for
transaction costs and expenses. Furthermore, Ippolito found no
evidence that higher management fees, expenses and turnover
were associated with inferior net returns. These two
contrasting views on mutual funds' performance are still widely
debated in the literature and the issue of performance is still
open, together with several related questions concerning the
choice of benchmarks, the appropriate performance measure, the
stability of the funds' risk profiles and objectives, the
effect of managers' market-timing activity, and the effect of
survivorship bias.
The analysis presented in this paper differs from
previous work in several respects. First of all, we provide the
first comprehensive study of the performance of Italian equity
funds.2 Second, our performance results are free of
1 We thank Richard Brealey and Evi Kaplanis for their helpful comments.We also benefited from the comments of the participants in the 1996conference of the Association for Mathematical Applications in Socialand Economic Sciences (AMASES). Gianni Zamboni, Roberto Gentili eStefano Viaggi supplied useful information. Antonio Di Clemente andCristina Ortenzi provided assistance in managing the data base.
2 Owing to data limitations, the previous studies of Italian funds -see for example Panetta and Zautzik (1991), Ferretti and Murgia(1991) - analysed a small number of funds of different categories,focusing on short periods.

10
survivorship bias, since no fund disappeared from the Italian
market, and our data set includes returns on all the equity
funds in existence in Italy from 1984 to 1995. We analyse the
risk-adjusted performance using both net returns (i.e. returns
calculated after management fees and taxes but before load
fees) and gross returns (i.e. returns computed adding back to
funds' net returns the management fees paid each year by the
funds) and using both CAPM benchmarks and multifactor
benchmarks. Managers' market-timing ability is taken into
account in two ways: first, we estimate the Treynor and Mazuy
(1966) and Henriksson and Merton (1981) measures of market
timing; second, we estimate the Positive Period Weighting (PPW)
measure suggested by Grinblatt and Titman (1989b), which is not
influenced by managers' attempts to time the market. Our main
empirical results can be summarised as follows.
(a) Using a cluster technique, we classify Italian mutual funds
ex-post on the basis of their portfolio holdings from 1986
to 1994. We find that the optimal number of different
categories is four. Our ex-post statistical classification
closely matches the 4-level aggregation of the 20 ex-ante
categories used by Assogestioni (the Italian mutual funds
association). We identify the four statistical categories as
Italian equity funds, Italian bond funds, international
equity funds and international bond funds.
(b) As a proportion of Net Asset Value (NAV), the total
expenses paid by the Italian funds increased from 1.55 to
1.61 per cent between 1987 and 1995. The increase was
entirely due to the rise in management fees (the largest
component of total expenses) from 1.08 to 1.33 per cent for
the industry as a whole and from 1.20 to 1.44 for Italian
equity funds.

11
(c) Using net returns, we found that Jensen's alpha for Italian
equity funds is approximately equal to zero and not
statistically significant. However, when performance is
evaluated on the basis of gross returns, the risk-adjusted
performance of Italian equity funds is always positive; when
both a 2-index benchmark that takes account of fund
investments in government bonds and a 5-factor APT benchmark
are considered, performance is positive and significant
using both Jensen's a and the PPW. This result is consistent
with that of Ippolito (1989) for US funds, and supports
Grossman and Stiglitz's (1980) view of market efficiency,
suggesting that informed investors are compensated for their
information gathering.
(d) The timing coefficients are rarely positive and
significant, suggesting that fund managers do not
successfully anticipate market-wide movements for both the
bond market and the equity market.
(e) Grinblatt and Titman's performance measure (the PPW)
broadly confirms the results obtained using Jensen's alpha.
Using the same benchmark, the cross-fund correlation between
the alpha and the PPW is approximately equal to 90 per cent.
Using the same performance measure but different benchmarks,
the (simple and rank) correlation coefficient between the
estimates is still high, ranging between 85 and 94 per cent,
thus confirming only in part the results obtained by
Grinblatt and Titman (1994) for US funds.
The organisation of the paper is as follows: in Section
2 we review the main contributions of the literature on funds'
performance; in Section 3 we describe the cluster technique
used to classify funds; in Section 4 we describe the method
used to compute funds' gross returns and the evolution of the

12
expenses for the whole sector; in Section 5 we estimate the
risk-adjusted performance of equity funds. In the three
appendices we discuss the details of the cluster analysis, the
computation of gross returns and the sources of the data.
2. Review of the literature
Thirty years of research on the performance of mutual
funds has resulted in the accumulation of several theoretical
issues and a large body of conflicting evidence. A complete
review of the subject would require a separate paper;3
therefore, in this section we shall consider only the main
contributions on mutual funds' performance, proposing an
interpretation of the literature in terms of (i) methodological
problems and (ii) empirical results and their explanation.
2.1 Methodological issues
From a methodological point of view, since the path-
breaking papers by Treynor (1965), Sharpe (1966) and Jensen
(1968), the CAPM has become the standard framework for
performance measurement.4 Jensen suggested the alpha
parametrization to measure funds' risk-adjusted performance.5
3 A survey of the literature on the performance of mutual funds can befound in Shukla and Trzcinka (1992) and Ippolito (1993).
4 Alternative methodologies, making use of portfolio composition, havebeen suggested by Cornell (1979), Grinblatt and Titman (1989a, 1993),Elton and Gruber (1991).
5 With respect to the Treynor measure and Sharpe's "reward-to-volatility" ratio, Jensen's alpha has the advantage of exploitingregression estimation and testing procedures. However, Shukla andTrzcinka (1992) show that all three measures are highly correlated interms of fund ranking.

13
Treynor and Mazuy (1966) raised the issue of the
consequences of a short-term tactical adjustment of a fund's
risk profile according to its managers' expectations of bull
and bear markets and suggested a quadratic regression framework
to take account of managers' timing strategies. Fama (1972)
decomposed total performance into two components: selectivity
(i.e. the ability to choose the best-performing shares) and
market timing (i.e. the ability to forecast the performance of
the entire market). Grant (1977) showed that ignoring managers'
timing strategies would bias mutual funds' performance measures
downward. Merton (1981) and Henriksson and Merton (1981)
provided an alternative measure of market timing, based on
managers' ability to forecast the sign (not the magnitude) of
the market's excess return. The models of Treynor and Mazuy
(1966) and Henriksson and Merton (1981) have been generalised
by Admati, Bhattacharya, Pfleiderer and Ross (1986) and
Jagannathan and Korajczyk (1986), respectively. The latter show
that continuous trading (dynamic hedging) and investment in
option-like assets (such as equities of highly levered
companies) could create artificial (negative) market-timing and
non-information-based beta changes. Grinblatt and Titman
(198933) suggested an alternative measure - the Positive Period
Weighting measure (PPW) - which is not influenced by managers'
timing behaviour.
Merton's (1973) extension of the CAPM to an
intertemporal setting resulted in the inclusion of additional
hedging components in the equilibrium equation. The inclusion
of other risk factors in addition to the market portfolio stems
from the empirical work of Black, Jensen and Scholes (1972),
Blume and Friend (1973), Fama and MacBeth (1973). The issue of
defining the market portfolio and choosing an efficient
benchmark was raised by Roll (1977, 1978) in the context of
CAPM tests and promptly spread into the performance literature

14
along with the diffusion of Ross's (1976) arbitrage pricing
theory.
Using both CAPM and APT, Lehmann and Modest (1987) and
Grinblatt and Titman (1994) showed that different performance
measures yield similar inferences when the same benchmark is
used; on the other hand, inferences differ considerably when
different benchmarks are used, even when the performance
measure is the same. Therefore, a positive performance could
simply reflect the inefficiency of the chosen benchmark, rather
than managers' skill (see also Roll, 1977; Dybvig and Ross,
1985b). Grinblatt and Titman (1989a, 1989b) restated the
problem and showed that in order to detect superior ability of
fund managers, the benchmark portfolio has to be mean-variance
efficient only with respect to uninformed investors. In other
words, the benchmark portfolio should result in a zero alpha
for other passive market portfolios in order to provide
unbiased performance measures. This solution, however, is no
longer valid if managers have market-timing ability with
respect to the uninformed observer. This, in fact, would induce
skewness in the distribution of portfolio returns and apparent
inefficiency with any mean-variance approach (Dybvig and Ross,
1985a).
2.2 Empirical issues
Gross/Net performance. Earlier empirical work on mutual
funds' performance was conducted under the embarrassing
alternative of irrational investors wasting money by investing
in funds with significantly negative performance on the one
hand and inefficient capital markets dominated by managers
systematically beating the market portfolio on the other.
Jensen's (1968) result was in favour of the first alternative:

15
the risk-adjusted annual performance of a sample of 115 US
mutual funds appeared inferior, after deducting expenses, to
the performance of the benchmark portfolio, whilst before
expenses it was statistically equal to zero. Mains (1977)
reversed Jensen's results using monthly data, instead of annual
returns. In a subsequent paper, Ippolito (1989) found that the
risk-adjusted net performance (i.e. net of fees and expenses)
of a sample of 143 US mutual funds was comparable to that of
the chosen benchmark, so that managers were compensated for
their information gathering, in accordance with Grossman and
Stiglitz's (1980) definition of market efficiency with costly
information. In other words, mutual funds beat the market
before expenses but not after management costs and turnover
costs had been deducted from returns. Superior ability
requires, on average, greater expenses. Similar results were
obtained by Grinblatt and Titman (1989a) and Droms and Walker
(1996). Elton, Gruber, Das and Hlavka (1993) argue that
Ippolito's conclusions are due to the choice of an inefficient
benchmark and that, after taking account of mutual funds'
holdings of non-S&P500 securities, Ippolito's conclusions are
reversed. A similar result of underperformance (both gross and
net of expenses) was obtained by Malkiel (1995) using a sample
of US equity funds.
Market timing and selectivity. Treynor and Mazuy (1966)
found that the managers of a sample of 57 funds had no
significant timing ability. Kon and Jen (1979), using switching
regressions for 49 mutual funds, detected multiple levels of
the funds' betas, and therefore indirect evidence of timing
activity. However, managers' attempts to time the market appear
to have no significant effects on funds' performance - see, for
example, Treynor and Mazuy (1966), Kon (1983), Chang and
Lewellen (1984), Henriksson (1984). In fact, most managers seem
to follow a perverse timing strategy (i.e. have a negative

16
market timing) as in Chen and Stockum (1986), Cumby and Glen
(1990), Chen, Lee, Rahman and Chan (1992).
Henriksson (1984), Breen, Jagannathan and Offer (1986)
and Lee and Rahman (1990) show that ignoring the
heteroskedasticity of the error term induced by managers'
timing strategy would bias the market-timing measure toward
significant negative results. This implies that WLS, GLS or
some other heteroskedasticity-consistent estimation method
(White, 1980) is required. Alternatively, bootstrap t-ratios
should be used (Cumby and Glen, 1990). A negative correlation
is generally found between market timing and selectivity,
implying a trade-off between different skills or,
alternatively, a case for artificial market timing. Connor and
Korajczyk (1991) find evidence of spurious market timing
induced by option features in funds' portfolios (costly puts
and dynamic hedging) changing the beta without any active
timing or selection ability on the part of managers.
Survivorship bias. Brown, Goetzmann, Ibbotson and Ross
(1992) have shown that if only superior performers survive
(i.e. if low performers are abandoned by investors and pushed
out of the market) then performance measures are upward biased.
Interest in data-sets which are free from survivorship bias has
increased recently - see for example Carhart (1995), Malkiel
(1995), Elton, Gruber and Blake (1995), Gruber (1996). However,
the bias could actually be negligible, since the selection
mechanism would not operate fully: in fact, Sirri and Tufano
(1992) find that investors reward funds that perform well, but
do not penalise those that perform poorly. Moreover, they show
that investors' entry/exit decisions depend on raw rather than
risk-adjusted performance.

17
3. Classifications of mutual funds
Our data-set includes all the Italian mutual funds in
operation from June 1984 to June 1995.6 In total, 410 funds are
considered. For each fund the basic information includes the
fund's name, the investment objective and the management
company. We also collected data on each fund's portfolio
composition, Net Asset Value (NAV), dividend distributions and
distribution dates.
In order to make meaningful comparisons, funds must be
classified into homogeneous categories. Two classifications are
used in Italy: the Bank of Italy's classification and the
classification used by Assogestioni (the Italian mutual funds
association). However, neither can be used a-priori for our
objective. In fact, the Bank of Italy groups mutual funds into
three main institutional categories (bond funds, balanced funds
and equity funds) according to the funds' investment objectives
stated in the prospectus, but does not distinguish funds which
invest primarily in Italian securities from those which invest
mainly in foreign securities, a distinction that has become
increasingly important since the 1990 liberalisation of capital
flows. The Assogestioni classification includes 20 different
categories and distinguishes between Italian and international
funds; however, this classification has been introduced only
recently, and has been changed several times, to include 7, 14
and finally 20 groups. Furthermore, both classifications are
only indicative, as managers can change a fund's investment
policy. Therefore, we selected funds with similar investment
objectives using a clustering procedure, in order to group
6 Mutual funds were introduced in the Italian financial system in 1984.Since then the number of operating funds and the volume of managedassets have grown very rapidly: at the end of 1995 in Italy there were459 mutual funds with a combined Net Asset Value of 127 billion lire(approximately 7.2 per cent of GDP).

18
funds ex-post, on the basis of the asset composition of each
fund at the end of each month from January 1986 to June 1995.
The results of the cluster analysis suggest that the optimal
number of clusters is four and that the categories which result
from the analysis closely match the 4-level aggregation of the
20 Assogestioni categories into Italian equity funds, Italian
bond funds, international equity funds and international bond
funds.7 However, given the close matching between the ex-ante
Assogestioni classification and the ex-post statistical
classification* (see Table A.2 in Appendix l), in the empirical
analysis of the following sections we chose to use the
Assogestioni categories, since their public availability
ensures that our results can be replicated.
In Table 1 we report summary statistics for each of the
four categories of mutual funds obtained using the cluster
technique: the number of funds, the NAV (in billions of lire)
and total expenses, whose largest component is management fees,
i.e. the fees paid each year by the fund to the asset
management company (Società di gestione). The table shows the
dramatic increase of the number of funds in the period under
examination (from 41 in 1985 to 409 in 1995). Since 1990, the
number of international equity funds has shown the largest
increase; however, this category of funds recorded a less
dynamic increase in terms of NAV, since it includes many small
specialised funds with the highest level of total expenses as a
percentage of NAV. The Italian bond funds have the largest
average size (the average NAV was 640 billion lire in
7 The selection procedure and the results of the cluster analysis arediscussed in detail in Appendix 1.
R A similar result was obtained by McDonald (1974) and Chen, Lee,Rahman and Chan (1992) by comparing the beta and stated investmentobjectives of mutual funds. The advantage of clustering is that theoptimal number of categories can be tested empirically.


20
1994) and the lowest expenses in
points in 1995). The Italian equi
relation to NAV (114 basis
ty funds are about half the
size of the bond funds, while their expenses have been 60 to 70
basis points higher in recent years. The expenses of (both
Italian and international) equity funds have shown a tendency
to increase, while those of the Italian bond funds have
declined.
4. Costs and returns of Italian mutual funds
4.1 The computation of gross returns
In order to analyse performance correctly, funds'
returns must be made comparable with those of the benchmarks.
The first factor one has to consider is the effect of taxes: in
fact, in Italy mutual funds receive bond coupons and equity
dividends net of withholding taxes (12.5 per cent on coupons
and 10 per cent on dividends). Therefore, in order to measure
the returns on mutual funds and those on the benchmarks
homogeneously, we estimated the funds' net performance using
the returns on equity and bond benchmarks net of withholding
taxes (see Appendix 3).
The second factor that we have considered is the effect
of funds' expenses, in order to compute funds' net and gross
performance. The returns computed on the basis of the funds'
unit values are net of the expenses paid each year by the
funds. These expenses are of three different types:
(a) bank fees i.e. the fees paid to the bank which acts as
custodian of the fund's assets and which takes care of all
the operations related to the fund's portfolio (e.g. coupon
and dividend payments);

21
(b) management fees, i.e. the fees paid every year to the
management company as a percentage of the fund's NAV. This
item includes incentive fees, i.e. the extra fees that some
of the funds pay to the management company if the return of
the fund's portfolio exceeds a given benchmark;
(c) trading costs: this category includes stamp duty, bid-ask
spreads and brokerage fees. The first component is included
in the fund's annual report (the item "other expenses"),
while the others are considered as a capital item and
included in securities' prices (thus influencing
performance directly), so that they cannot be isolated.
Since the available benchmarks' total returns are gross
of custody and administration fees,g we calculated the monthly
net returns of funds by adding back to their published
returns" the bank fees described under (a) above, according to
the methodology described in Appendix 2.
Net returns, however, include both "output" and "price"
components of the asset management service, since they are
computed net of management fees. Therefore, in order to
distinguish each component of the asset management service and
evaluate managers' ability to obtain a positive performance
before expenses, we calculated the gross returns of funds (the
service "output") adding back to their net returns defined
above the management fees described under (b) .I1 In order to
focus on the effect of funds' expenses, we decided to ignore
9 The total returns on the benchmarks are also gross of the tradingcosts due to the initial purchase of the benchmark and any subsequenttrade. This implies a small bias against mutual funds in performancecomparisons.
10 I.e. returns corrected to take account of dividend payments.
11 The methodology which has been used to compute monthly gross returns isdescribed in detail in Appendix 2.

22
the effect of the extra taxes paid by Italian mutual funds as a
percentage of their Net Asset Value (NAV), thus biasing our
performance results against mutual funds.12
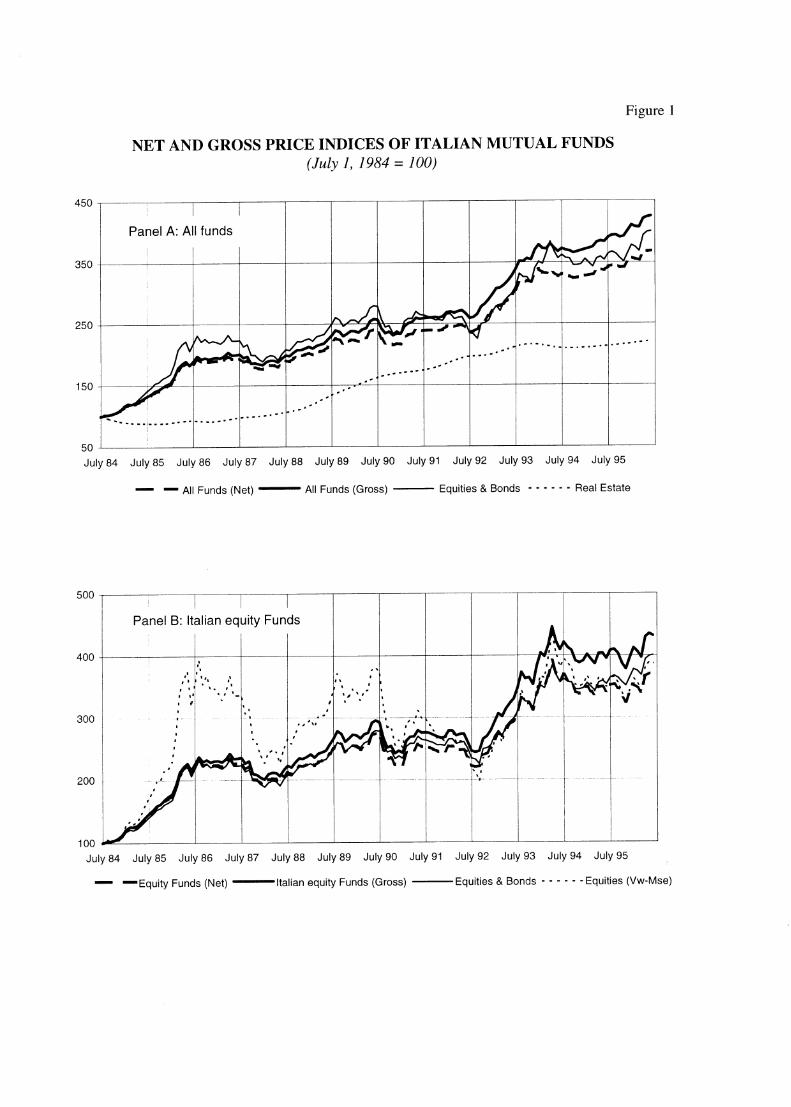
In order to appreciate the importance of the corrections
described above, in this section and in Section 4.2 we briefly
describe the magnitude of funds' expenses. Figure 1 (Panel A)
compares for the period July 1984-June 1996 the index of the
unit value of all the Italian mutual funds computed using gross
returns (henceforth the "gross index") with alternative
indices. First, we included the "net index" of Italian mutual
funds. Second, we included an index representing the value of a
portfolio formed in equal proportions by Italian equities and
Italian government bonds.13 Finally, we included a real-estate
index computed by Nucci (1996). In June 1996 the value of 100
lire invested in mutual funds in 1984 was 368 lire, less than
the value of 100 lire invested in the equity-government bond
portfolio (approximately 400 lire) . However, when management
fees are added back, the gross index had reached a value (425
lire) which was higher than that of the equity-government bond
portfolio. In Panel B of Figure 1 we show the net and gross
indices for the Italian equity funds, together with the value
weighted index of all equities listed on the Milan Stock
Exchange (Vw-Mse) and that of the equity-government bond
benchmark. The evidence is very similar to that of Panel A: the
12 Although in Italy the income received from mutual funds (bothdividends and capital gains) is tax exempt for households, the latterpay a tax on the capital gains obtained from their investments inItalian funds indirectly. In fact, the funds pay a tax which isproportional to their NAV and equals 0.05 per cent of the value ofgovernment securities, bank deposits and bonds held in theirportfolios, 0.10 per cent of the value of convertible bonds andshares issued by Italian manufacturing firms and 0.25 per cent of thevalue of all the remaining assets. On the contrary, no tax is paid byhouseholds on capital gains on bonds and equities held directly.
13 The equity component of the portfolio is the value-weighted index ofall the shares listed on the Milan Stock Exchange; for governmentbonds we used the Bank of Italy's BTP and CCT indices (see Appendix3).

24
final value of the net index of equity funds (367 lire) is
below that of equities (387 lire) and of the equity-government
bond portfolio (400 lire); however, when management fees are
added back, the gross index of equity funds outperforms the
alternative indices, reaching a value of 432 at the end of June
1996.
Table 2 reports the continuously compounded gross and
net yearly returns for each of the four statistical categories
of Italian mutual funds. The table shows the large swings
recorded by each category during the last thirteen years. In
particular, for the equity funds the high variability of
returns is influenced by the two world wide stock market crises
of 1987 and 1990. For the bond funds the negative returns
recorded in 1994 are mainly due to the monetary tightening
which took place in the major economies: in that year, yields
on American and German bonds jumped by more than 200 basis
points, and those on Italian and Spanish bonds by as much as
400 basis points. In Figure 2 we report the holding period
returns for 1 and 3-year horizons for the entire sector of
Italian funds and for Italian equity funds only.
4.2 Cost dynamics and cost differences among funds
At an aggregate level, the main components of the costs
paid each year by the Italian funds (bank fees, management fees
and taxes) have shown different time patterns during the last
decade (see Figure 3, Panel A): bank fees and taxes decreased,
respectively, from 0.23 and 0.24 per cent of NAV in 1987 to
0.16 and 0.12 per cent in 1995.14 Vice-versa, management fees
rose steadily (from 1.08 per cent of NAV in
14The reduction in tax payments was due mainlyintroduced in 1992.
to the new regime


28
Italian bond funds remained approximately constant (0.97 per
cent of NAV), so that their total costs fell from 1.42 per
cent in 1987 to 1.14 per cent in 1995. For the entire sector,
the standard deviation of the ratio of management fees to NAV
increased from 0.29 in 1987 to 0.41 in 1995.15
The rise of management fees for the entire sector
between 1987 and 1995 was influenced both by the revision of
the fees charged by the funds which were operating in 1987 and
by the pricing strategy and the characteristics of the new
entrants. In order to separate these two effects, in Figure 4
we have compared the distribution of management fees in 1987
and in 1995, considering for the latter year both the entire
sector (409 funds) and the subgroup which includes only the 72
funds which were operating in 1987. The distribution of the
ratio of management fees to NAV in 1987 averaged 1.08 per cent
(see Panel A) and had two modal values at 1 per cent (about
half of the sample) and 1.22 per cent (18 per cent of the
sample). The standard deviation was 0.29 per cent. In 1995 the
management fees for the 72 funds were equal to 1.16 per cent
of NAV, with a first mode at 1 per cent and an increased
frequency at the second mode of 1.25 per cent; the standard
deviation fell to 0.27 per cent, along with the total range,
owing to the smaller number of outliers. Therefore, the
increase of management fees is also confirmed for the group of
72 funds. As a proportion of total costs the growth of the
management fees of the 72 funds is even more pronounced (from
71.3 per cent in 1987 to 82.4 per cent in 1995, a figure
similar to that of the entire industry; see Figure 4, Panel
I.5 As a percentage of total costs, bank fees decreased from 9.9 to 9.5per cent between 1987 and 1995, while tax payments fell from 18.9 to7.8 per cent. Consequently, the weight of management fees increased,reaching 82.6 per cent of mutual funds' total expenses in 1995.

29
B) . In this case both the standard deviation and the range
halved.16
In order to explain the differences across funds, we
analysed the relationship between the ratio of management fees
to NAV and the characteristics of mutual funds. Each fund was
classified according to 13 criteria, and simple "dummy" models
for the analysis of variance between sub-groups were tested
for significance. In Table 3 we describe the 13 classification
criteria and report the results of the statistical tests on
the significance of the association between each pair. The
analysis of the differences in management fees inside each
subgroup is reported in Table 4.
As expected, the classification of the funds
(determined on both the statistical and the Bank of Italy
criteria) is associated with different management fees (see
Table 4). In particular, the fees are higher for equity funds
and for international funds, compared to bond and domestic
funds. The distinction between the funds which distribute
dividends and those which do not is also significant, although
the latter are dominated by bond funds and the relation could
be spurious. However, if cross-effects are considered, the
management fees of the bond funds which do not distribute
dividends are significantly higher than the fees of the
remaining funds (1.08 as against 0.87 per cent on average). In
terms of absolute and relative size, large funds are
significantly less expensive than small funds. The former,
however, are more often bond funds than equity funds (see
Table 3), so that the significance is reduced if style is
taken into account. The classification in terms of relative
age (with respect to the annual median) is also significant,
16 Note that the panel distribution in 1995 does not adequately
represent the universe of mutual funds if the ratio of managementfees to NAV is considered, but it is similar (apart from more
frequent outliers in the universe) if the ratio to total expenses isused.


33
paired with lower management fees (1.20 as against 1.37 per
cent of NAV) and lower bank fees (0.13 as against 0.18 per
cent). The result is still true when allowance is made for
fund style. The existence of accumulation plans is correlated
with non-banking channels and its significance is due entirely
to the channel type. The case of incentive fees is related, as
expected, to the risk of the portfolio and it represents a
significant factor in explaining differences in management
fees. As in the case of distribution method, if a bank
controls the management company of a fund there is a sizeable
reduction in management fees (1.24 as against 1.38 per cent),
possibly due to scope and scale economies inside the financial
group. Bank fees are lower as well (0.15 as against 0.27 per
cent).
5. Risk-adjusted performance measurement and results
The analysis of mutual funds' performance is based on
the choice of the measure of performance and the risk
adjustment model. In this work we use two measures of
performance First, the standard Jensen (1968, 1969) a
coefficient, which measures funds' risk-adjusted performance
using the security market line. As is well known, Jensen's a is
an unbiased measure of performance when the fund's manager has
security-specific information but no timing information. Vice-
versa, when the manager follows a successful timing strategy,
Jensen's measure is usually downward biased and can be
negative. Therefore, we also measure performance using
Grinblatt and Titman's (1989b), 1994) Positive Period Weighting
measure (PPW), which is not influenced by the manager's timing
strategy.


35
only in part invested in equities, while a substantial
proportion of the portfolio was invested in Italian government
bonds: for example, in our sample period (from 1984 to 1995)
the average monthly proportion of Italian equities for the
whole portfolio was approximately equal to 60 per cent, while
the proportion of Italian government bonds was 26 per cent.17
In this study we control for the effect of non-equity
securities in two ways: first, we employ government bond
indices in addition to the standard equity benchmarks used in
performance evaluation. Further checks have been performed to
verify whether our results are influenced by funds' holdings of
foreign stocks. In fact, although such investments are quite
small, their variance might nonetheless influence the
performance estimates. Second, we computed performance using a
5-factor model, where the factors should include non-equity
variables.
The first model adopted to estimate a was the CAPM,
using both the value-weighted return on all the stocks listed
on the Milan Stock Exchange (Vw-Mse) - which is theoretically
implied by the CAPM - and the equally-weighted return on all
stocks listed on the Milan Stock Exchange (Ew-Mse). This choice
was made because, owing to data limitations, our benchmark
portfolio includes only risky financial securities, as is
standard in the finance empirical literature, so that we have
no guarantee that the chosen portfolio is ex-post mean-variance
efficient-l8 A wider set of benchmarks therefore provides
information on the robustness of the results.
17 The remaining 14 per cent of mutual funds' portfolio consistedlargely of Italian corporate bonds, foreign securities and cash.
18 To verify that benchmarks are not inefficient with respect to the
uninformed investor (unconditional distribution), we calculated the c(of the value-weighted index with respect to the equally-weighted Mseindex and vice-versa, both with and without market-timingcoefficients. In no case was the alpha statistically significant.


44
statistics have been obtained using White's (1980)
heteroskedasticity-consistent standard errors procedure.
Table 6 shows the results for the funds' alpha estimated
using equations (1) to (3); all the values are expressed as
yearly continuously-compounded returns. For the entire sample,
using net returns, the estimated alpha is always positive
(between 7 and 109 basis points) although never significant.
The results obtained by estimating the CAPM on the value-
weighted and equally-weighted equity indices of the Milan Stock
Exchange (Ew-Mse and Vw-Mse) are similar, both when only the
stock market benchmarks are used and when government bonds are
added to the regressions. The inclusion of the government bond
index worsens the alpha by approximately 80 to 100 basis
points, reflecting the fact that in our sample period the
Italian bond market outperformed the equity market. A positive
value for the aggregate alpha is also obtained using the 5-
factor APT model (0.90 per cent cn an annual basis); however,
even this result is not statistically significant. As far as
the single funds are concerned, with multiple benchmarks more
than half the funds had a negative performance, although the
alphas are rarely significant (2 to 8 negative and significant,
7 to 18 positive and significant).
When gross excess returns are used, the performance of
the whole sample of funds becomes always significant, except
when the cx is estimated using the two-index model with the Ew-
Mse. The results obtained using the value and equally-weighted
equity indices are similar: 223 and 241 basis points,
respectively, using only the equity benchmarks, and
approximately 140 basis points using the equity and government
bond benchmarks. The performance of the 5-factor model (222
basis points on a yearly basis) is very similar to that
obtained using only the equity benchmarks; this result might be


46
due to the dominance of the equity factors in the estimation of
the factor scores. The proportion of funds with negative alphas
decreases to 25 per cent approximately; about 20 per cent of
the funds display a significant positive performance, while the
negative values are rarely significant.
As previously mentioned, foreign holdings account for a
very small proportion of the Italian equity funds' portfolio;
however, the high volatility of returns on foreign stocks
expressed in Italian lire might influence our performance
results. Therefore, we made two checks: first, we repeated our
regressions adding to our two-index model the return on a world
stock index;28 second, we calculated the (simple and rank)
correlation between our APT intercepts and the foreign holdings
in the funds' portfolios. The results of our tests suggest that
foreign holdings have only a marginal influence on our
estimates.2g
Table 7 shows the timing coefficients estimated using
gross returns and the regressions specified in equations (4)
and (5). For the whole sample, the value of gamma relative to
the equity indices is negative and not significant.30 The
28 In the regressions we employed the returns on the Morgan StanleyCapital International World stock index. Similar results wereobtained using the Morgan Stanley Europe index.
29 When the returns on the world stock index are added to our two-index
regressions, the average a decreases only slightly (by approximately15 basis points). The simple correlation between the APT interceptsand the proportion of foreign assets in the funds' portfolios isapproximately equal to 6 per cent and is not significant. A similarresult is obtained using the rank correlation.
30 If discretely compounded returns are a linear function of the p, theuse of continuously compounded returns could create a spurious
impression of timing ability. Therefore, in order to check whetherthe estimates of the coefficient of the square term in equation (4)are influenced by the use of logarithmic returns, the market-timingregressions which will be discussed below were replicated usingdiscrete compounding. However, no difference was found, as one wouldexpect since, over short horizons (one month), logarithmic andpercentage returns are approximately equal.


48
estimates of the single funds show that l0-15 per cent of the
funds have a negative and significant timing coefficient with
respect to the equity returns, implying that managers engage in
timing activities but have no superior ability to forecast
market-wide movements.31 The estimates of the timing
coefficient relative to the bond market suggest a similar
picture: the value of the gamma relative to the government bond
index are in general not significant, implying that managers
cannot successfully forecast bonds' excess returns.
Table 8 shows the results obtained by estimating the
selectivity parameter alpha using both the Treynor and Mazuy
quadratic regression and the Henriksson and Merton regressions.
For the (equally or value-weighted) equity benchmarks and the
5-factor APT benchmark, the inclusion of the market-timing term
improves the estimated alpha, in line with the results obtained
in earlier studies.32 However, when we include the government
bond benchmark, the timing-adjusted alphas become smaller (by
more than 100 basis points), but still positive and, when the
Vw-Mse is used, significant at the 5 per cent each tail. Using
gross returns, managers' selection ability results in a risk-
adjusted extra return ranging from 150 to 350 basis points;
such values are generally statistically significant at the
usual confidence level.
In Table 9 we show the results of the funds' total
performance, estimated as the sum of the terms which represent
managers' market-timing and selectivity abilities, estimated
31 Jagannathan and Korajczyk (1986) show that spurious evidence ofperverse timing ability might arise as a consequence of non-linearities in returns originated by the option component of thefunds' portfolios; however, the proportion of options in theportfolio of Italian equity funds is very small. Alternatively, ourevidence of perverse timing might reflect the fact that funds engagein dynamic trading strategies (e.g. portfolio insurance) or invest inhighly levered stocks.
32 See for example Henriksson (1984), Connor and Korajczyk (1991).


APPENDIX 1
The classification of mutual funds
In Italy mutual funds are classified in two different
ways: by the Bank of Italy and by Assogestioni (the Italian
mutual funds association). The Bank of Italy classifies them in
three main institutional categories (bond funds, balanced funds
and equity funds) according to the funds' investment objectives
stated in the prospectus, but does not distinguish funds which
invest in Italian securities from those which invest mainly in
foreign securities. The classification used by Assogestioni
distinguishes between Italian and international funds and
groups funds into 20 different categories (see Table A.l);
however, this classification was introduced only recently (in
1995), and different grouping criteria have been used during
the last ten years. Moreover, both classifications are only
indicative, as managers can significantly modify the fund's
investment policy ex-post. It is thus not clear ex-ante which
funds should be used in the analysis in order to form groups of
funds with a homogeneous investment policy. In this work we
have therefore classified funds using cluster analysis, on the
basis of the similarity of their portfolio holdings.36
The analysis has been conducted using the SAS Cluster
Procedure, which minimises the differences inside each cluster
and maximises the differences between different clusters. In
order to estimate the optimal number of clusters, for each fund
we calculated the percentages of the following categories of
assets in its portfolio:
1) Italian government securities2) Italian corporate bonds3) Italian convertible bonds
36 Sharpe (1992) distinguishes between "internal" methods of styledetermination, based on portfolio shares and "external" methods basedon returns. See also Christopherson (1995) and Trzcinka (1995).

57
4) Foreign bonds5) Italian equities6) Foreign equities7) Liquid assets (CDs, bank deposits, etc.)8) Other financial assets.
Using the eight classes of assets, the number of
clusters has been estimated on the basis of the test suggested
by Sarle (1983), which reaches a maximum in correspondence with
the optimal number of clusters.37 The analysis has been
performed on the basis of the average proportion in the funds'
portfolio of the 8 asset categories in the whole period 1986-
1995 and in two subperiods (1986-1989 and 1990-1995). For the
entire period and for the second subperiod the test statistic
indicates that the optimal number of clusters is equal to 4 (in
both cases the maximum value of the test between 1 and 50
clusters is obtained when the number of groups is equal to 4;
see Figure A.l). The classification of the single funds is
highly stable (only 1 fund changes category from the entire
period to the second subperiod). However, in the first
subperiod there is no evidence of an optimal number of
clusters: the test hits a local maximum when the number of
clusters is equal to 7 and reaches higher and increasing values
when the number of clusters is higher than 15.
The four groups which have been identified by the
cluster analysis closely match a 4-level aggregation of the ex-
ante classification used by the Assogestioni: the first
37 The test of Sarle (1983) compares the expected value of the ratio (R2)between the variance inside each cluster and the total variance underthe hypothesis that the data represent random drawings from a singlek-dimensional uniform distribution (null hypothesis), where k is thenumber of variables considered in the analysis (in our case 7, theproportion of the 7 categories of assets in each fund's portfolio)with the actual value of the same ratio for the sample underconsideration. Positive values of the test indicate the possiblepresence of clusters, i.e. sampling from a mixture of a k-dimensionalnormal distribution with equal variances and equal samplingprobabilities. For a Monte Carlo analysis on the performance of thetest in selecting the optimal number of clusters see Sarle (1983).


APPENDIX 3
Data sources and the estimation of the factor scores
In this Appendix we describe the sources of the data and
the methods used to construct the variables employed in the
paper
Stock price indices. Two stock price indices were used
in the analysis, the equally-weighted and value-weighted
indices of all the shares listed on the Milan Stock Exchange
(Ew-Mse and Vw-Mse). Returns were calculated as the monthly
logarithmic change in prices, adjusted for dividend payments
and for changes in the capital structure due to script issues
and rights issues, etc. The data were drawn from the Bank of
Italy share price database.
Government bond price index. The returns on Italian
government bonds have been computed as the simple average of
the returns on the most important categories of Italian
government bonds - CCTs (Certificati di Credito del Tesoro,
long-term index-linked bonds) and BTPs (Buoni Poliennali de1
Tesoro, long-term fixed-coupon bonds) - net of withholding tax.
The data were collected from the monthly statistics published
by the Bank of Italy in the Supplement0 al Bollettino
Statistico, I 1 Mercato Finanziario. Returns have been
calculated as the monthly logarithmic changes in the total
return index (which is adjusted for coupon payments).
Real estate index. The real estate index is the index of
the unit market value of houses in Italy, provided since 1965
by Il Consulente Immobiliare and elaborated by Nucci (1996).
The data are semi-annual and have been transformed to monthly
frequency using a cubic spline. The index includes only changes


67
Data on mutual funds. The data on mutual fund unit
values, the value of dividends, distribution dates and fund
portfolio holdings have been drawn from the Bank of Italy
mutual funds database and were cross checked with the data
reported by I1 Sole 24-Ore. Data on bank fees (the fees paid
by the fund to the bank which acts as a custodian of the fund's
assets), management fees (the fees that each fund pays every
year to the management company, including incentive fees), the
taxes paid by the fund, and the residual item "other expenses"
have been drawn from the Bank of Italy's data base and from the
funds' annual reports (rendiconto annuale).

References
Admati, A. R., S. Bhattacharya, P. Pfleiderer and S. A.Ross (1986), "On Timing and Selectivity", Journal ofBusiness, Vol. 59, No. 1, pp. l-26.
Alonso, A., G. Rubio and F. Tusell (1990), "Asset Pricing andRisk Aversion in the Spanish Stock Market", Journal ofBanking and Finance, Vol. 14, No. 2-3, pp. 351-69.
Black, F., M. C. Jensen andAsset Pricing Model:Jensen (ed. ), StudiesNew York, Praeger.
M. Scholes (1972), "The CapitalSome Empirical Tests", in M. C.in the Theory of Capital Markets,
Blake, C. R., E. J. Elton and M. J. Gruber (1993), "ThePerformance of Bond Mutual Funds", Journal of Business,Vol. 66, No. 3, pp. 371-403.
Blume, M. E. and I. Friend (1973), "A New Look at the CapitalAsset Pricing Model", Journal of Finance, Vol. 28, No.1, pp. 19-33.
Breen, W., R. Jagannathan and A. R. Offer (1986), "Correctingfor Heteroscedasticity in Tests for Market TimingAbility", Journal of Business, Vol. 59, No. 4, pp. 585-98.
Brown, S., W. Goetzmann, R. Ibbotson and S. Ross (1992),"Survivorship Bias in Performance Studies", Review ofFinancial Studies, Vol. 5, No. 4, pp. 553-80.
Carhart, M . (1995), ‘ " On Persistence in Mutual FundPerformance", University of Chicago, mimeo.
Chang, E. C. and W. G. Lewellen (1984), "Market Timing andMutual Fund Investment Performance", Journal of BusinessFinance and Accounting, Vol. 11, No. 1, pp. 57-72.
Chen, C. R., C. F. Lee, S. Rahman and A. Chan (1992), "A Cross-Sectional Analysis of Mutual Funds' Market Timing andSecurity Selection Skill", Journal of Business Financeand Accounting, Vol. 19, No. 5, pp. 659-75.
and S. Stockum (1986), "Selectivity, Market Timingand Random Beta Behaviour of Mutual Funds: A GeneralisedModel", Journal of Financial Research, Vol. 9, No. 1,PP. 15-30.

69
Christopherson, J. A. (1995), "Equity Style Classifications",
Connor,
Journal of Portfolio Management, Vol. 21, Spring, PP.32-43.
G. and R. Korajczyk (1991), "The Attributes, Behaviour,and Performance of US Mutual Funds", Review ofQuantitative Finance and Accounting, No. 1, pp. 5-26.
Cornell, B. (1979) I "Asymmetric Information and PortfolioPerformance Measurement", Journal of FinancialEconomics, Vol. 7, No. 4, pp. 381-90.
Cumby, R. E. and J. D. Glen (1990), "Evaluating the Performance_of International Mutual45, No. 2, pp. 497-521.
Droms, W. G. and D. A. WalkerPerformance", Quarterly
Funds", Journal of Finance, Vol.
(1996), "Mutual Fund InvestmentReview of Economics and Finance,
Vol. 36, No. 3, pp. 347-63.
Dybvig, P. H. and S. A. Ross (1985a), "Differential Informationand Performance Measurement Using a Security MarketLine", Journal of Finance, Vol. 40, No. 2, pp. 383-99.
(1985b), "The Analytics ofPerformance Measurement Using a Security Market Line",Journal of Finance, Vol. 40, No. 2, pp. 401-16.
Elton, E. J. and M. J. Gruber (1991), "Differential Informationand Timing Ability", Journal of Banking and Finance,Vol. 15, No. 1, pp. 117-31.
and C. R. Blake (1995),"Fundamental Economic Variables, Expected Returns, andBond Fund Performance", Journal of Finance, Vol. 50, No.4, PP. 1229-56.
S. Das and M."Efficiency with Costly Information:
Hlavka (1993),A Reinterpretation
of Evidence from Managed Portfolios", Review ofFinancial Studies, Vol. 6, No. 1, pp. l-22.
Fama, E. F. (1972), "Components of Investment Performance",Journal of Finance, Vol. 27, No. 3, pp. 551-67.
and J. MacBeth (1973), "Risk, Return, andEquilibrium: Empirical Tests", Journal of PoliticalEconomy, Vol. 81, No. 3, pp. 607-36.
Ferretti, R. and M. Murgia (1991), "Fondi comuni diinvestimento: costi di gestione e performance", in A.

70
Penati (ed.), Il rischio azionario e la borsa, Milano,EGEA.
Grant, D. (1977), "Portfolio Performance and the 'Cost' ofTiming Decision", Journal of Finance, Vol. 32, No. 3,PP. 837-46.
Grinblatt, M. and S. Titman (1989a), "Mutual Fund Performance:An Analysis of Quarterly Portfolio Holdings", Journal ofBusiness, Vol. 62, No. 3, pp. 393-416.
(1989b), "Portfolio PerformanceEvaluation: Old Issues, New Insights", Review ofFinancial Studies, Vol. 2, No. 3, pp. 393-421.
(1993) I "Performance Measurementwithout Benchmarks: An Examination of Mutual FundReturns", Journal of Business, Vol. 66, No. 1, pp. 47-68.
(1994) I "A Study of Monthly MutualFunds Returns and Performance Evaluation Techniques",Journal of Financial and Quantitative Analysis, Vol. 29,No. 3, PP. 419-44.
Grossman, S. and J. Stiglitz (1980), "On the Impossibility ofInformationally Efficient Markets", American EconomicReview, Vol. 70, No. 3, pp. 393-408.
Gruber, M. J. (1996), "Another Puzzle: The Growth in ActivelyManaged Mutual Funds", Journal of Finance, Vol. 51, No.3, PP. 783-810.
Henriksson, R. (1984), "Market Timing and Mutual FundPerformance: An Empirical Investigation", Journal ofBusiness, Vol. 57, No. 1, pp. 73-96.
and R. Merton (1981), "On Market Timing andInvestment Performance II: Statistical Procedures forEvaluating Forecasting Skill", Journal of Business, Vol.54, No. 3, pp. 513-33.
Ippolito, R. A. (1989), "Efficiency with Costly Information: AStudy of Mutual Fund Performance, 1965-1984", QuarterlyJournal of Economics, Vol. 104, No. 1, pp. l-23.
(1993) I ‘1 On Studies of Mutual FundPerformance, 1962-1991", Financial Analysts Journal,Vol. 49, No. 1, pp. 42-50.

71
Jagannathan, R. and R. A. Korajczyk (1986), "Assessing theMarket Timing Performance of Managed Portfolios",Journal of Business, Vol. 59, No. 2, pp. 217-35.
Jensen, M. (1968), "The Performance of Mutual Funds in thePeriod 1945-1964", Journal of Finance, Vol. 23, No. 1,PP. 389-416.
(1969), "Risk, the Pricing of Capital Assets, andthe Evaluation of Investment Portfolios", Journal ofBusiness, Vol. 42, No. 1, pp. 167-247.
Kon, S. J. (1983), "The Market-Timing Performance of MutualFund Managers", Journal of Business, Vol. 56, No. 3, pp.323-47.
and F. C. Jen (1979), "The Investment Performance ofMutual Funds: An Empirical Investigation of Timing,Selectivity and Market Efficiency", Journal of Business,Vol. 52, No. 2, pp. 263-89.
Lee, C. F. and S. Rahman (1990), "Market Timing, Selectivity,and Mutual Fund Performance: An EmpiricalInvestigation", Journal of Business, Vol. 63, No. 2, pp.261-78.
Lehmann, B. and D. Modest (1987), "Mutual Fund Performance: AComparison of Benchmarks and Benchmarks Comparisons",Journal of Finance, Vol. 42, No. 2, pp. 233-65.
(1988), "The Empirical Foundationsof The Arbitrage Pricing Theory", Journal of FinancialEconomics, Vol. 21, No. 2, pp. 213-54.
Mains, N. (1977), "Risk, The Pricing of Capital Assets, and theEvaluation of Investment Portfolios: Comment", Journalof Business, Vol. 50, No. 3, pp. 371-84.
Malkiel, B. (1995), "Returns from Investing in Equity MutualFunds 1971 to 1991", Journal of Finance, Vol. 50, No. 2,PP. 549-72.
McDonald, J. G. (1974), "Objectives and Performance of MutualFunds, 1960-1969", Journal of Financial and QuantitativeAnalysis, Vol. 9, No. 3, pp. 311-33.
Merton, R. (1973), "An Intertemporal Capital Asset PricingModel", Econometrica, Vol. 41, No. 5, pp. 867-80.

72
(19811, "On Market Timing and Investment PerformanceI: An Equilibrium Theory of Value and Market Forecasts",Journal of Business, Vol. 54, No. 3, pp. 363-406.
Nucci, F. (1996), "Il mercato delle abitazioni. Un tentativo dicostruzione di misure de1 prezzo e valutazione dellostock immobiliare", Universita di Roma "La Sapienza",Dipartimento di contabilita nazionale e analisi deiprocessi sociali, mimeo.
Panetta, F. (1996), "The Factor Structure of the Italian StockMarket", London Business School, Ph. D. Dissertation,Ch. 2.
and R. Violi (1995), "Risk Premia, Consumption andFinancial Structure from the Unification of Italy toToday", Banca d'Italia, Lavoro preparatorio per laRelazione sul 1994.
and E. Zautzik (1991), "Evoluzione e performance deifondi comuni mobiliari italiani", in A. Penati (ed.), I1rischio azionario e la borsa, Milano, EGEA.
Roll, R. (1977), "A Critique of the Asset Pricing Theories'Tests, Part I: On Past and Potential Testability of theTheory", Journal of Financial Economics, Vol. 4, No. 2,PP. 129-76.
(1978) r "Ambiguity When Performance Is Measured by theSecurities Market Line", Journal of Finance, Vol. 33,No. 4, PP- 1051-69.
Ross, S. A. (1976), "The Arbitrage Theory of Capital AssetPricing", Journal of Economic Theory, Vol. 13, No. 3,PP. 341-60.
Sarle, W. S. (1983), "Cubic Clustering Criterion", Cary (NC),SAS Institute, SAS Technical Report A-108.
Scharfstein, D. S. and J. C. Stein (1990), "Herd Behavior andInvestment", American Economic Review, Vol. 80, No. 3,pp. 465-79.
Sharpe, W. (1966), "Mutual Funds Performance", Journal ofBusiness, Vol. 39, No. 1, pp. 119-38.
(1992) I "Asset Allocation: Management Style andPerformance Measurement", Journal of PortfolioManagement, Vol. 18, Winter, pp. 7-19.

73
Shukla, R. and C. Trzcinka (1992), "Performance Measurement of
Sirri,
Managed Portfolios", Financial Markets, Institutions &Instruments, Vol. 1, No. 4, pp. l-58.
E. R. and P. Tufano (1992), "Buying and Selling MutualFunds: Flows, Performance, Fees, and Services", HarvardBusiness School, mimeo.
Treynor, J. L. (1965), "How to Rate Management of InvestmentFunds", Harvard Business Review, Vol. 43, No. 1, pp. 63-75.
and K. Mazuy (1966), "Can Mutual Funds Outguess theMarket?", Harvard Business Review, Vol. 44, No. 4, pp.131-36.
Trzcinka, C. (1995), "Equity Style Classifications: Comment",Journal of Portfolio Management, Vol. 21, Spring, pp.44-46.
White, H. (1980), "A Heteroscedasticity-Consistent CovarianceMatrix and a Direct Test of Heteroscedasticity",Econometrica, Vol. 48, No. 4, pp. 817-38.

RECENTLY PUBLISHED “TEMI” (*)
No. 301 —Comportamento strategico sul mercato primario e secondario dei titoli di Stato: ilruolo dell’informazione asimmetrica,by F. DRUDI and M. MASSA (March 1997).
No. 302 — Tecniche BVAR per la costruzione di modelli previsivi mensili e trimestrali, byG. AMISANO, M. SERATI and C. GIANNINI (April 1997).
No. 303 —Bidder Profitability under Uniform Price Auctions and Systematic Reopenings: TheCase of Italian Treasury Bonds, by A. SCALIA (April 1997).
No. 304 —Determinazione decentrata di salario e condizioni lavorative: un confronto tramodelli di contrattazione e di salari di efficienza, by R. TORRINI (April 1997).
No. 305 —The Role of the Different Central Bank Rates in the Transmission of Monetary Policy,by L. BUTTIGLIONE, P. DEL GIOVANE and E. GAIOTTI (April 1997).
No. 306 —Monetary Policy Actions and the Term Structure of Interest Rates: A Cross--CountryAnalysis, by L. BUTTIGLIONE, P. DEL GIOVANE and O. TRISTANI (April 1997).
No. 307 —The Penalties of Unemployment, by A. SEN (June 1997).
No. 308 —Mobilità territoriale e costo delle abitazioni: un’analisi empirica per l’Italia,byL. CANNARI, F. NUCCI and P. SESTITO (June 1997).
No. 309 — The Effects of Technology Shocks on Output Fluctuations: An Impulse ResponseAnalysis for the G7 Countries, by S. FABIANI (June 1997).
No. 310 —Inflation and Monetary Policy in Italy: Some Recent Evidence, by E. GAIOTTI,A. GAVOSTO and G. GRANDE (July 1997).
No. 311 —Struttura per scadenza, premi per il rischio e tassi attesi: evidenza empirica dalmercato dell’eurolira, by F. DRUDI and R. VIOLI (July 1997).
No. 312 — Credibility without Rules? Monetary Frameworks in the Post--Bretton Woods Era, byC. COTTARELLI and C. GIANNINI (August 1997).
No. 313 —The Seasonality of the Italian Cost--of--Living Index, by G. CUBADDA andR. SABBATINI (August 1997).
No. 314 —Strozzature settoriali, limiti alla crescita e pressioni inflazionistiche, byP. CIPOLLONE and D. J. MARCHETTI (August 1997).
No. 315 —Tassi bancari attivi e struttura finanziaria in Italia: un’analisi empirica, byC. COTTARELLI, G. FERRI and A. GENERALE (September 1997).
No. 316 — I canali di trasmissione della politica monetaria nel modello econometricotrimestrale della Banca d’Italia, by S. NICOLETTI ALTIMARI, R. RINALDI, S. SIVIERO
and D. TERLIZZESE (September 1997).
No. 317 — Sensitivity of VaR Measures to Different Risk Models, by F. DRUDI, A. GENERALE
and G. MAJNONI (September 1997).
No. 318 —Previsione delle insolvenze delle imprese e qualità del credito bancario: un’analisistatistica,by S. LAVIOLA and M. TRAPANESE (September 1997).
No. 319 — Da che cosa dipendono i tassi di interesse sui prestiti nelle province?, byR. DE BONIS and A. FERRANDO (September 1997).
No. 320 —Wherein Do the European and American Models Differ?, by P. A. SAMUELSON
(November 1997).
No. 321 —Finance, Human Capital and Infrastructure: An Empirical Investigation of Post--WarItalian Growth, by G. FERRI and F. MATTESINI (November 1997).
No. 322 —Long--Term Interest Rate Convergence in Europe and the Probability of EMU, byI. ANGELONI and R. VIOLI (November 1997).
No. 323 —Education, Infrastructure, Geography and Growth: An Empirical Analysisof the Development of Italian Provinces, by S. FABIANI and G. PELLEGRINI
(November 1997).
No. 324 —Properties of the Monetary Conditions Index, by G. GRANDE (December 1997).
� � 5HTXHVWV IRU FRSLHV VKRXOG EH VHQW WR�%DQFD G·,WDOLD �� 6HUYL]LR 6WXGL �� 'LYLVLRQH %LEOLRWHFD H SXEEOLFD]LRQL �� 9LD 1D]LRQDOH� �� �� ����� 5RPH�ID[ �� � ���������