Telstra Annual Report 2014 · 16 per cent of total sales revenue, whereas, ... 4 Telstra Annual...
208
TELSTRA ANNUAL REPORT 2014
Transcript of Telstra Annual Report 2014 · 16 per cent of total sales revenue, whereas, ... 4 Telstra Annual...

TELSTRA ANNUAL REPORT 2014

OUR BUSINESS
INDUSTRY CONTEXT Our Industry is Experiencing Rapid Change
The telecommunications industry is
experiencing enormous growth in demand
for services. In Australia, IP traffic grew by
38 per cent and mobile data traffic by 41
per cent in 2013. (ii)
Digital technology is changing our world.
Telstra is at the heart of this change – our
ambition is to help make it happen by
connecting everything to everyone.
OUR PURPOSETo Create a Brilliant Connected Future
for Everyone
To create is our responsibility. The brilliant
connected future won’t happen on its own,
it has to be delivered and Telstra can bring
together all the parts to create it.
A brilliant connected future is our
aspiration. It’s what we need to build
for every one of our customers. It’s our
responsibility to the nation and to every
market we work in.
For everyone is crucial. We serve everyone.
Change doesn’t happen if only a chosen few
benefit. Transformation happens when the
technologies that create social, economic
and cultural change reach enough people.
This all adds up to why we do what we do.
WHO WE ARE Every Day We Help Millions of Customers
Connect to the People and Things That
Matter Most to Them
Telstra is Australia’s leading
telecommunications and information
services company, offering a full range of
communications services and competing
in all telecommunications markets. We
employ close to 32,000 people directly(i),
facilitate access to more than 1,900 points
of presence across the globe and have one
of Australia’s largest shareholder bases,
with 1.4 million shareholders.
We have a diverse range of customers,
including consumers, small business,
large enterprises and government
organisations, and we strive to put
them at the centre of everything we do.
In Australia, our services are offered
through 362 Telstra branded retail stores,
90 Telstra Business Centres, 127 Telstra
business and enterprise partners and are
distributed by over 15,000 retail points of
presence managed by our partners.
In Australia, we provide 16 million mobile
services, 7.5 million fixed voice services
and 3.7 million fixed data services. Telstra’s
international businesses include Telstra’s
global networks and managed services
business and Telstra’s China-based search
and advertising business, Autohome Inc.
We understand our customers want
technology and content solutions that
are simple and easy to use – that’s why
we have built networks like Australia’s
largest fully integrated internet protocol
(IP) network and Australia’s largest and
most reliable national mobile network.
CONTENTS
The sections of our Annual Report
titled Our Business, Key Highlights,
Chairman and CEO Message,
Strategy and Performance and
Full Year Results and Operations
Review comprise our operating and
financial review (OFR) and form part
of the Directors’ Report. Information
about governance at Telstra is also
provided in this Annual Report
and a copy of our full corporate
governance statement is
available on our website at
www.telstra.com/governance.
Telstra Corporation Limited
ABN 33 051 775 556
(i) Full Time Equivalent employees.
(ii) Source – Cisco Visual Networking Index –
Australia – 2013 Year in Review – www.cisco.com.
Our Business IFC
Key Highlights 2
Chairman and CEO Message 4
NBN Renegotiation 6
Strategy and Performance 7
Improve customer advocacy 8
Drive value from the core 10
Build new growth businesses 11
Outlook 12
Managing our risks 13
Full Year Results and
Operations Review 15
Sustainability 22
Our approach 22
Customer experience 23
Responsible business 24
Our people 25
Community impact 28
Environmental stewardship 30
Board of Directors 32
Senior Management Team 34
Governance at Telstra 35
Directors’ Report 39
Remuneration Report 44
Financial Report 65
Directors’ Declaration 194
Shareholder Information 196
Reference Tables 198
Glossary 200
Index 201
OUR VALUESExpress What We Stand For and Guide
the Way We Do Things
Here at Telstra, we have five core values:
1. Show you care
2. Better together
3. Trust each other to deliver
4. Make the complex simple
5. Find your courage

Telstra Annual Report 1
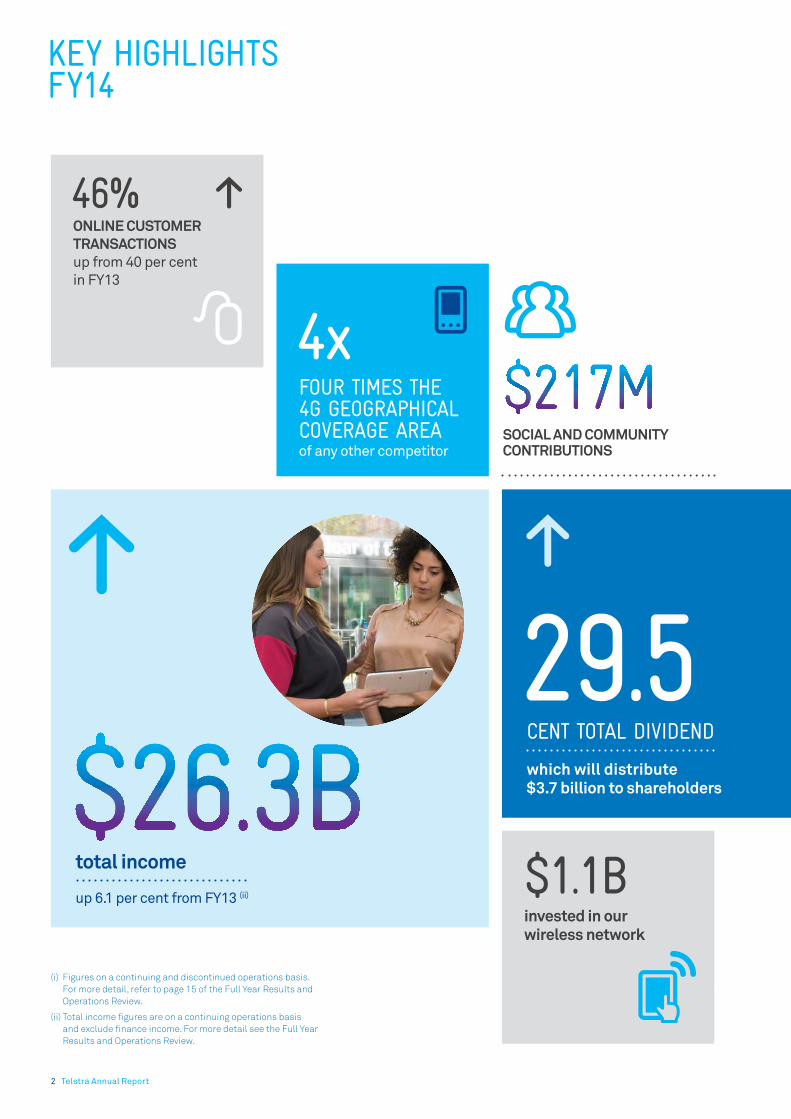
CENT TOTAL DIVIDEND
29.5 which will distribute $3.7 billion to shareholders
4xFOUR TIMES THE 4G GEOGRAPHICAL COVERAGE AREA of any other competitor
SOCIAL AND COMMUNITY CONTRIBUTIONS
total income
up 6.1 per cent from FY13 (ii) $1.1Binvested in our wireless network
(i) Figures on a continuing and discontinued operations basis.
For more detail, refer to page 15 of the Full Year Results and
Operations Review.
(ii) Total income figures are on a continuing operations basis
and exclude finance income. For more detail see the Full Year
Results and Operations Review.
KEY HIGHLIGHTS FY14
ONLINE CUSTOMER
TRANSACTIONS
up from 40 per cent
in FY13
46%
2 Telstra Annual Report

increase in
NET PROMOTER SYSTEM SCORE
REDUCTION IN CARBON EMISSIONS INTENSITY
30%
EMPLOYEE
ENGAGEMENT SCORE
five percentage points
above the Australian
National Norm
82%
CUSTOMERS ON A BUNDLED PLAN
DOMESTIC RETAIL MOBILE SERVICES
net profit after tax
up 14.6 per cent from FY13 (i)
3PT
Telstra Annual Report 3

CHAIRMAN AND CEO MESSAGE
Dear Shareholders,
We are pleased to present this review of
Telstra’s progress in the 2014 financial year
where consistent earnings growth delivered
increased shareholder returns.
This was a year of accelerating momentum
for our company, one in which we saw
continued growth in revenue, profit and
customer numbers, and demonstrated
the value being created by our focus
on improving customer advocacy, while
investing in our core and growth businesses.
Our customers remain our highest priority.
Throughout the year, and right across the
company, we worked to find ways to build
advocacy, by improving how we interact
with our customers every day, and to have
a positive impact on their lives with our
products and services.
Telstra operates in a dynamic and
competitive environment; ongoing
changes in mobile, broadband and
other technologies are transforming the
communications industry and the world we
all live in. Competing in this environment
requires a commitment to customer service
excellence and innovation, areas where we
continuously strive to improve.
We are pleased to have again delivered on
our financial commitments and to have
delivered a 29.5 cent fully franked dividend
for the 2014 financial year, distributing $3.7
billion to shareholders. After considering
our capital management options, we have
also announced an off-market share buy-
back of up to approximately $1 billion of
Telstra shares. A buy-back was considered
the most effective and appropriate way
to deploy surplus capital from ongoing
performance and key divestitures.
Shareholders will receive detailed
information about this offer shortly.
Our 2014 results reflect the fundamental
financial strength of our business. Total
income (excluding finance income) totalled
$26.3 billion, up 6.1 per cent; EBITDA
(Earnings Before Interest Tax Depreciation
and Amortisation) totalled $11.1 billion, up
9.5 per cent; and our Net Profit after Tax
was $4.3 billion, up 14.6 per cent.(i)
Our Strategy
During the year we announced refinements
to our long term strategy supported by
business unit changes aligning senior
leaders to growth opportunities in Australia
and overseas. Our strategy focuses Telstra
on the three pillars of improving customer
advocacy, driving value from the core and
building new growth businesses. It makes
our ambitions clear and also shows where
you can expect us to continue building value.
Improve customer advocacy
Throughout the year we remained
committed to improving the services,
products and experiences we provide to our
customers. Much of this work is informed
by our Net Promoter System (NPS) program
where we actively seek feedback and
measure our progress. Through the year we
introduced many initiatives to improve the
customer experience.
Our overall NPS score improved by three
points over the 2014 financial year, building
on the improvements we saw last year,
but we still have a lot of work to do to
consistently deliver our customers a great
service experience.
Drive value from the core
Our products and services mix continues
to change, illustrating how fundamentally
our business has been redefined by
mobility, connectivity and data demand.
Fixed voice revenue now accounts for only
16 per cent of total sales revenue, whereas,
mobiles now account for 38 per cent of
sales revenue.
Much of Telstra’s reputation and core
strength is built on the foundation of
providing customers with outstanding
mobile service in cities and in regional
and remote Australia. We are committed
to maintaining our network leadership
and this year we invested $1.1 billion
in our mobile network, including
significant expansion of our 4G mobile
coverage, to now reach 87 per cent of the
Australian population – with four times the
geographical coverage area of any other 4G
network. Our 3G service provides coverage
to 99.3 per cent of the population.
During the year we added 937,000 new
domestic retail mobile customer services.
We now have 16 million domestic retail
mobile customer services. As a part of
our strategy to provide customers with
flexibility and choice in connection, we
recently started designing Australia’s
largest national public Wi-Fi access
network, in a five year $100 million project
which will deliver 13 million Wi-Fi hot
spots around the world within five years.
Throughout the year we continued to
transform our internal business processes
to streamline how we work and remove
internal barriers that impede productivity,
collaboration, innovation and better
customer service. The total value of benefits
from our FY14 productivity program, which
includes $550 million of expense benefits
as well as revenue, capital expenditure
and avoided costs, is $1 billion. We have
reinvested these benefits in the business to
support our customer advocacy initiatives,
growth in our customer base and building
new growth businesses.
Build new growth businesses
We continue to execute our growth
strategy in Network Applications and
Services, extending our application
service offerings into Asia, and launching
Global Managed Network Services and
Global Infrastructure as a Service.
Our strategy is supported by the
establishment of a new business unit,
Global Enterprise and Services. This is an
industry-based services and solutions
business operating at a global scale
to deliver innovation, integration and
service for our customers locally and
around the globe.
Growth in Asia continues to be a key focus.
Our international team offers customers
connectivity solutions, including managed
(i) Total income and EBITDA figures are on a continuing operations basis and net profit figure is on a
continuing and discontinued operations basis.4 Telstra Annual Report

network services, international data, voice
and satellite solutions and they also
manage our submarine cable networks
and assets. We continue to leverage these
assets for growth. We also made further
changes to our international business,
creating Country Managers in each market.
In China, we have a 63.2 per cent stake
in Autohome Inc., the country’s leading
online destination for car buyers, which
was listed on the New York Stock
Exchange on 11 December 2013.
Other emerging opportunities include
Telstra Health, which continued to work
towards its objective of establishing a
connected health IT ecosystem capable
of creating transformative change in the
healthcare sector.
We also announced that we would
increase our ownership in Ooyala to 98 per
cent. Ooyala is a leader in video streaming
and analytics, and is the first investment
for our Global Applications & Platforms
(GAP) group.
Portfolio Management
We continued to be active and disciplined in
our approach to portfolio management this
year, with announcements of the sale of our
76.4 per cent stake in the Hong Kong mobile
business CSL New World Mobility Limited
(“CSL”), and the sale of a 70 per cent interest
in our Sensis directories business.
We understand the need to be innovative
in our investments for the future as we
explore new opportunities. This thinking
was reflected in the investments we made
during the year in new growth areas for
the business, as well as our proposed
joint venture with Telkom Indonesia, a
proposed arrangement for the provision
of network applications and services,
primarily in Indonesia.
National Broadband Network (NBN)
We have provided a separate update on
our renegotiation of the NBN Definitive
Agreements on the next page (which forms
part of this Chairman and CEO Message).
Part of the Community
Telstra is committed to helping build
better communities and showing that we
care in the way we respond to important
economic, social and environmental
challenges. Our sustainability strategy
details how we believe we can create the
most value. Part of this strategy lies in
providing opportunities for our employees
to be involved in the community and in
issues that matter to them.
We believe that all Australians should
enjoy the benefits of being connected to
modern communications technologies,
regardless of age, income, ability or
location. We want everyone to have the
confidence and skills to participate safely
in the digital world and we partner with
experts in the field to offer wide ranging
training courses and information. As a
company, we also remain committed to
reducing our environmental impact and to
helping our customers and suppliers to do
the same. These initiatives are not just the
right thing to do; they are part of who we are.
We continue to place the highest priority
on the safety of our employees and the
wider community. During the year, we
implemented improvements to our
asbestos management procedures
after a number of incidents involving
subcontractors carrying out pit remediation
work in our network. This included requiring
all contractors to complete new training
before they can work on our network, the
appointment of additional supervisors to
monitor worksites and co-operating with
Comcare in its investigation into the matter,
which investigation is now closed.
Looking Ahead
We have a clear strategy and our focus for
the year ahead will be on improving our
customer service, investing to maintain
our network advantage and investing in
future capability to build a foundation for
sustainable long term growth.
Our network advantage is significant. As
more and more devices are connected
to networks our investment in spectrum,
greater network intelligence and machine
to machine technologies will help
maintain this leadership position.
Just as importantly, as software solutions
dramatically change how other industries
operate, we will continue to build our
capability in software solutions and
platforms that run over our networks,
building on the good progress made in the
areas of eHealth, Global Enterprise and
Services and GAP.
We will also continue to pursue opportunities
to expand our business in Asia.
In 2015 Telstra expects continued low
single-digit income and EBITDA growth to
offset the absence of CSL 2014 operating
revenue and EBITDA. As a result, and after
excluding the $561 million profit on sale of
CSL in 2014, Telstra’s income and EBITDA
guidance for 2015 is broadly flat.
Telstra expects 2015 free cashflow of
between $4.6 billion and $5.1 billion and
capital expenditure to be around 14 per
cent of sales.
This guidance assumes wholesale product
price stability and no impairments to
investments, and excludes any proceeds
on the sale of businesses, the cost of
acquisitions and spectrum purchases.
We would like to thank the leadership
team and all of our employees for their
commitment, effort and initiative this
year. We also thank you for your loyalty
as a shareholder and we welcome
your comments and feedback via
Catherine Livingstone AO Chairman
David Thodey Chief Executive Officer
We are pleased to have met
our full year guidance and
to have delivered a 29.5
cent fully franked dividend
for the 2014 financial year.
Telstra Annual Report 5
David Thodey

Update on NBN Renegotiation
On 23 June 2011 Telstra entered into
agreements with NBN Co and the
Commonwealth (referred to as the
“Definitive Agreements”) for Telstra’s
participation in the rollout of the National
Broadband Network (NBN). The Definitive
Agreements became unconditional
following Telstra shareholder approval
gained at the Annual General Meeting in
November 2011 and ACCC acceptance of
Telstra’s structural separation undertaking
in March 2012. The Definitive Agreements,
together with the regulatory undertakings
given to the ACCC and associated
Government policy commitments,
established the framework for Telstra’s
participation in the rollout of the NBN.
Under the Definitive Agreements Telstra
agreed to progressively disconnect services
on its copper network and broadband
services on its HFC network in NBN fibre
areas as the new network was rolled out.
Following the Federal Election in September
2013, the newly elected Government
determined the design of the NBN would
be modified to use a range of technologies,
including a copper based fibre to the node
network and HFC, instead of the previous
Government’s predominantly fibre to
the premises approach. As a result, the
Government is currently engaged with
Telstra and NBN Co in a renegotiation of
some aspects of the Definitive Agreements
to enable this multi-technology model.
The renegotiation of the Definitive
Agreements is progressing well within
an agreed, but non-binding, Commercial
Framework, but the complexity of the
arrangements and the need to consider
all of the elements of the Definitive
Agreements means the renegotiations are
still incomplete. Telstra continues to work
with the Government in the best interests
of Telstra shareholders, and shares the
Government’s aim of finalising the revised
arrangements as soon as possible.
In participating in the renegotiations,
Telstra’s objective is that it must be “kept
whole” – meaning that Telstra should
not be materially worse off under any
renegotiated arrangements than under
the current Definitive Agreements. The
Commercial Framework within which the
parties are negotiating acknowledges this
objective, but final agreement is yet to be
reached so there is no guarantee that this
objective will be realised.
This Commercial Framework anticipates
a change in the approach taken in respect
of the copper and HFC network assets,
from staged decommissioning, to NBN
Co owning some or all of such assets
progressively as the NBN is rolled out.
As the current arrangements already
provide that Telstra is progressively
restricted in its ability to use the copper
and HFC network assets, the Commercial
Framework does not contemplate any
incremental value to be received by Telstra
for the transfer of ownership.
Telstra’s continued ownership of these
assets did provide Telstra with some
protection in respect of future changes
in the NBN project. As part of the current
renegotiations, Telstra is seeking to agree
other contractual mechanisms which are
designed to protect Telstra against future
changes in the project. These matters
will be part of Telstra’s assessment as to
whether it is kept whole. If ownership of
the assets is transferred from Telstra to
NBN Co, Telstra does not expect there will
be any impact on its continued access
to the HFC network to supply Foxtel
services, consistent with the current
Definitive Agreements.
Telstra and NBN Co are also negotiating
in respect of the provision of design,
construction and maintenance services
by Telstra to NBN Co on commercial terms,
which may potentially deliver additional
revenues to Telstra.
It should be noted that any renegotiated
arrangements between Telstra, NBN
Co and the Government will need to be
reviewed by relevant regulators (including
the ACCC) who may seek to impose further
regulatory measures. These would be
taken into account in assessing the extent
to which Telstra’s objective to be kept
whole has been met.
We will keep shareholders informed of the
renegotiation process.
Chairman and CEO Message
NBN RENEGOTIATION UPDATE
6 Telstra Annual Report

Strategy and PerformanceWe refined our long term strategy to drive our growth towards 2020 and beyond.
Our strategy makes our ambitions clear. It shows where you can expect us to focus our efforts towards building value. The strategy now has been consolidated into three pillars.
Our Strategic Priorities
Improve Customer Advocacy
Drive Value from the Core
Build New Growth Businesses
Telstra Annual Report 7

Improving customer advocacy is our number
one priority. Over the past 12 months,
Telstra has worked hard to transform the
experience for our customers from one
of service, to one with a higher level of
customer care. We have also continued our
cultural change program, which puts the
customer at the centre of everything we do.
While we have made many changes, we
still have more to do on our journey to move
from satisfying and retaining customers to
creating customer advocates. Advocates
stay with us longer, spend more and
recommend us more often.
Net Promoter System (NPS)
We have been listening closely to what our
customers are telling us and track and
monitor a number of different NPS metrics.
We measure NPS at two levels – our
customers’ overall perception of Telstra,
measured through an external third party
and our customers’ experience in dealing
with Telstra directly, measured through
internal surveys.
Our overall NPS score has improved
by three points over the last twelve
months. We have also seen consistent
improvement in our internal measures of
our customers’ experience in dealing with
us across all areas. We remain committed
to focusing on improving the customer
experience in the coming year.
Product Differentiation
Customers have told us that while
technology is an essential part of their
lives keeping track of usage levels can be
complicated. To address this and to give
customers greater peace of mind over
data usage, we introduced a number of
improvements during the year including:
reduced excess data charges with our
current Mobile Accelerate mobile plans
from 10 cents per megabyte to just
3 cents per megabyte
reduced our international roaming
pay as you go data prices by 80 per
cent, introduced SMS usage alerts for
roaming data and increased the data
allowance in our international roaming
data packs fivefold at no extra cost
implemented a $130 excess voice safety
net, which ensures that customers on
Mobile Accelerate plans will pay no
more than $130 per month in domestic
voice and MMS charges to standard
Australian numbers
introduced Telstra Broadband Assistant,
a software application that provides
customers with immediate online help
with common connectivity, email and
password issues
launched the free Telstra Wi-Fi
Maximiser™ App which enables
customers to better understand the
performance of the wireless network
in their home and measure the signal
strength on devices connected to
their gateway.
Our commitment to caring for our
customers is also focused on providing
them with a better experience with
our world class products on Australia’s
leading mobile network. During the year we
launched New Phone Feeling, which gives
participating customers the option, after the
first 12 months of their plan, to purchase
a new smartphone as an add on with
selected handsets across our new 24 month
consumer plans. Telstra was the first carrier
in Australia to make this offer available to
consumers across a range of plans.
We also launched Telstra Platinum, a
premium service that offers customers
end to end technical support across
access, devices and applications.
To help customers get back online quickly
if anything happens to their mobile
device, we launched our “swap, replace
and restore” service called Telstra
StayConnected.
Since the launch, over 305,000 customers
have taken up this service. StayConnected
is a market leading service available only
to Telstra customers.
Process Focus
One of our key commitments to improving
customer advocacy is to provide our
customers with a more personalised
service. In our contact centres, we now
give customers the name and contact
details of the person they spoke to after
each call. This means that if customers
need to get back in touch with us they can
contact the person they last spoke with.
In our stores, new post-paid mobile
customers receive, within 48 hours of
their purchase, a call from the consultant
who served them to check that they are
satisfied. We also give every store customer
personalised business cards with direct
staff phone numbers. When installing new
services or fixing existing services, our
communications technicians now provide
customers with cards listing their name
and contact number so customers can
follow up directly with the technician.
Our Philippines based operations
continue to demonstrate their growing
capability at delivering positive
experiences for our customers. During the
year we opened, in conjunction with our
partners, our second customer operations
centre in the Philippines, providing our
team with an environment designed
from the ground up to foster customer
advocacy. We also made significant
improvements to the training, tools and
processes provided to our people.
Our NPS score improved by three points over FY14.
Strategy and Performance
IMPROVE CUSTOMER ADVOCACY
8 Telstra Annual Report
Providing more personalised service is
also about making sure customers can
choose how they engage with Telstra.
For a growing number of customers,
this is about connecting with us online.
Customers are choosing to do business
with us online more than ever, as
evidenced by the following statistics:
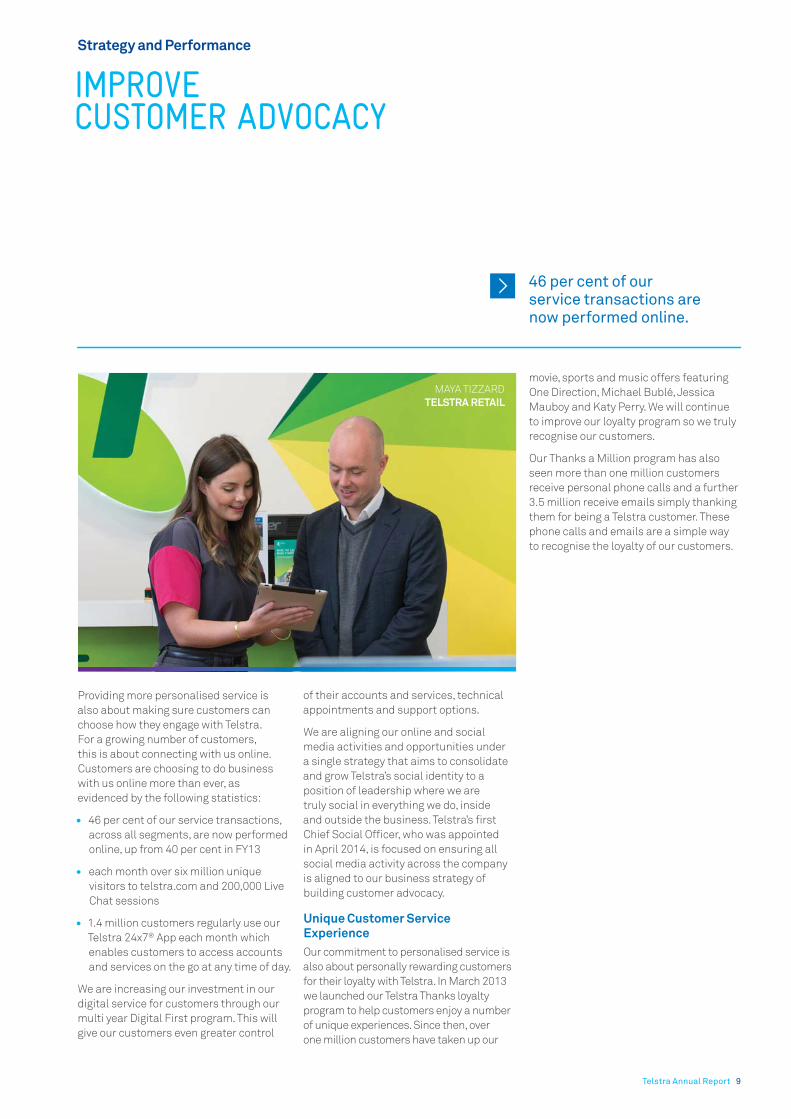
46 per cent of our service transactions,
across all segments, are now performed
online, up from 40 per cent in FY13
each month over six million unique
visitors to telstra.com and 200,000 Live
Chat sessions
1.4 million customers regularly use our
Telstra 24x7® App each month which
enables customers to access accounts
and services on the go at any time of day.
We are increasing our investment in our
digital service for customers through our
multi year Digital First program. This will
give our customers even greater control
of their accounts and services, technical
appointments and support options.
We are aligning our online and social
media activities and opportunities under
a single strategy that aims to consolidate
and grow Telstra’s social identity to a
position of leadership where we are
truly social in everything we do, inside
and outside the business. Telstra’s first
Chief Social Officer, who was appointed
in April 2014, is focused on ensuring all
social media activity across the company
is aligned to our business strategy of
building customer advocacy.
Our commitment to personalised service is
also about personally rewarding customers
for their loyalty with Telstra. In March 2013
we launched our Telstra Thanks loyalty
program to help customers enjoy a number
of unique experiences. Since then, over
one million customers have taken up our
movie, sports and music offers featuring
One Direction, Michael Bublé, Jessica
Mauboy and Katy Perry. We will continue
to improve our loyalty program so we truly
recognise our customers.
Our Thanks a Million program has also
seen more than one million customers
receive personal phone calls and a further
3.5 million receive emails simply thanking
them for being a Telstra customer. These
phone calls and emails are a simple way
to recognise the loyalty of our customers.
46 per cent of our service transactions are now performed online.
IMPROVE CUSTOMER ADVOCACY
MAYA TIZZARD
Telstra Annual Report 9

Driving value from the core concentrates
on customer and revenue growth, network
leadership and driving productivity by
simplifying the business.
Customer and Revenue Growth
Our mobiles portfolio had another strong
year, with continued growth in revenue
and customer services.
Extended 4G coverage helped us increase
the penetration of 4G devices. We now
have more than 5.2 million 4G devices
on our network, comprising 3.8 million
handsets, 500,000 tablets, 400,000
dongles and 550,000 Wi-Fi hotspots.
While in our fixed business there was a
decline in the number of households with
a fixed voice service, this is consistent
with global trends. Nevertheless the
revenue decline for fixed voice services
was the lowest in four years. Our fixed
data business continued to grow, driven
by customers choosing bundled plans,
such as our popular Entertainer bundles,
which include Foxtel through T-Box®. We
now have 1.9 million retail customers on
a bundled plan. You can read more detail
on this topic in the Full Year Results and
Operations Review.
Network Leadership
Telstra has delivered world class mobile
networks for Australia since 1987 and
today we have Australia’s leading mobile
network based on a range of coverage,
performance and reliability measures.
The Telstra mobile network is the nation’s
largest, covering more than 2.3 million
square kilometres of the Australian
landmass and 99.3 per cent of the
population. This reflects our commitment
to providing customers with outstanding
mobile service in cities and in regional and
remote Australia.
We have invested more than $5.5 billion in
our mobile network since the launch of our
3G service in 2006, including $1.1 billion
this past financial year.
Mobile data on our network continues
to grow at a rapid rate. We will continue
to meet this demand by exploring new
capacity and broadcast technologies,
including spectrum aggregation
techniques, LTE-Broadcast and use of
small network cells.
Additionally, in September 2014 we will
pay the $1.3 billion we committed in the
2013 financial year to secure an important
holding of 700MHz and 2.5GHz spectrum
in Australia. This spectrum will provide
additional mobile coverage and capacity
in the future. The 2.5GHz licence will
commence on 1 October 2014 (except
for parts of Western Australia which
commence from 2016), while the 700MHz
licence will commence 1 January 2015.
We recently started designing Australia’s
largest national public Wi-Fi access
network as part of a five year $100 million
project. It is anticipated that this Wi-Fi
network, as part of an Australian exclusive
agreement with global Wi-Fi provider Fon,
will give Australians access to two million
hotspots across Australia and a further
13 million hotspots around the world
within five years.
Drive Productivity through Simplifying the Business
We rebalanced our portfolio to reflect
the changing nature of Telstra’s business
as well as promoting innovation through
investments in emerging businesses.
We also realigned our structure to provide
increased focus and resources to
growth areas.
Simplifying the business remains a
critical part of our strategy. The total value
of benefits from our FY14 productivity
program, which includes $550 million of
expense benefits as well as revenue, capital
expenditure and avoided costs, is $1 billion.
These benefits were reinvested in the
business to support growth in our customer
base, customer service initiatives and the
development of new growth businesses.
During the year we introduced a range
of initiatives and improved feedback
channels between our frontline staff and
senior management that helped improve
processes, reduce complexity and improve
customer service.
Our approach to process and service
improvement is to:
review the performance of each process
using agreed metrics, then prioritise
improvement areas
analyse data to understand factors
behind poor performance
simplify the process to remove problem
root causes, while providing customers
with a more seamless experience
use technology to automate processes,
so employees can help customers
more effectively.
We recently started designing Australia’s largest national public Wi-Fi access network as part of a five year $100 million project.
Strategy and Performance
DRIVE VALUE FROM THE CORE
GARY TANG
TELSTRA OPERATIONS
10 Telstra Annual Report
Build new growth businesses focuses on
Network Applications and Services (NAS),
Asian expansion and longer term growth
opportunities such as Telstra Health,
Telstra Media and Global Applications
and Platforms (GAP).
We have a clear strategy in place designed
to realise the opportunities that exist
in these portfolios and pursue growth
opportunities that focus on leveraging
our current strengths.
Network Applications and Services
The NAS portfolio provides business
and government customers of all sizes
with an extensive range of network
based information and communication
technologies products and services.
Telstra made two acquisitions during the
year – NSC Group and O2 Networks – to
expand our capabilities in contact centre
services and consulting domestically. A
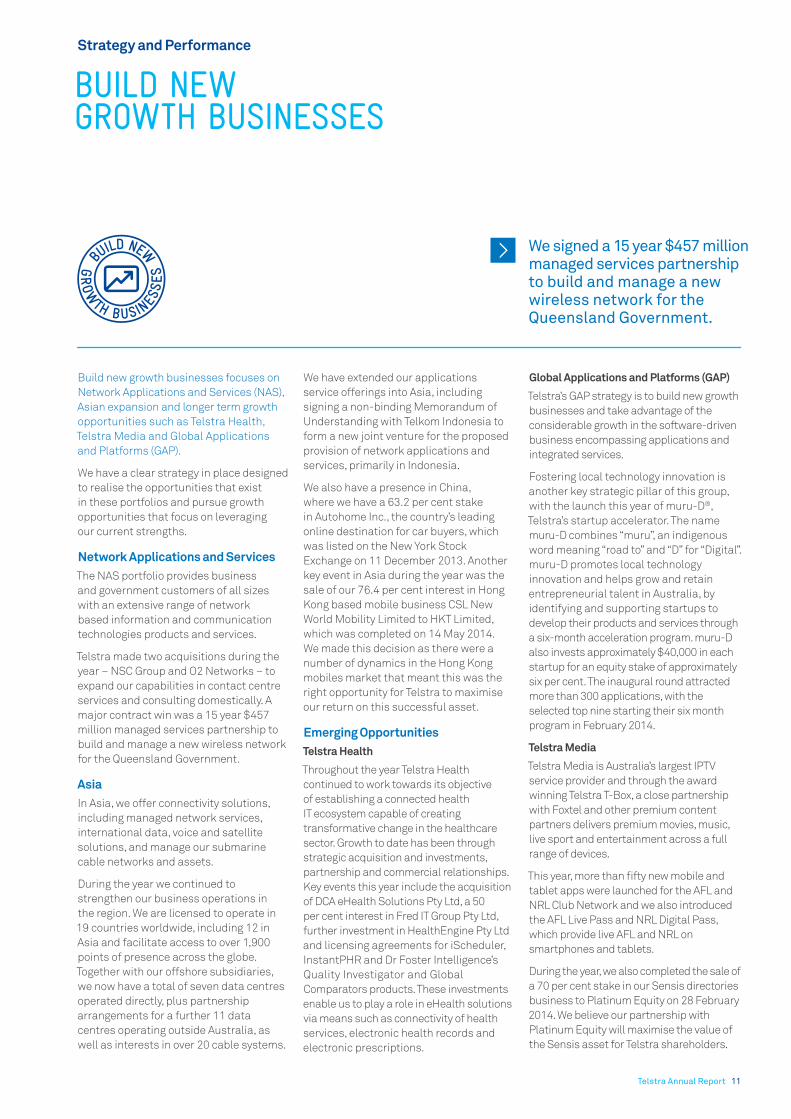
major contract win was a 15 year $457
million managed services partnership to
build and manage a new wireless network
for the Queensland Government.
Asia
In Asia, we offer connectivity solutions,
including managed network services,
international data, voice and satellite
solutions, and manage our submarine
cable networks and assets.
During the year we continued to
strengthen our business operations in
the region. We are licensed to operate in
19 countries worldwide, including 12 in
Asia and facilitate access to over 1,900
points of presence across the globe.
Together with our offshore subsidiaries,
we now have a total of seven data centres
operated directly, plus partnership
arrangements for a further 11 data
centres operating outside Australia, as
well as interests in over 20 cable systems.
We have extended our applications
service offerings into Asia, including
signing a non-binding Memorandum of
Understanding with Telkom Indonesia to
form a new joint venture for the proposed
provision of network applications and
services, primarily in Indonesia.
We also have a presence in China,
where we have a 63.2 per cent stake
in Autohome Inc., the country’s leading
online destination for car buyers, which
was listed on the New York Stock
Exchange on 11 December 2013. Another
key event in Asia during the year was the
sale of our 76.4 per cent interest in Hong
Kong based mobile business CSL New
World Mobility Limited to HKT Limited,
which was completed on 14 May 2014.
We made this decision as there were a
number of dynamics in the Hong Kong
mobiles market that meant this was the
right opportunity for Telstra to maximise
our return on this successful asset.
Emerging Opportunities
Telstra Health
Throughout the year Telstra Health
continued to work towards its objective
of establishing a connected health
IT ecosystem capable of creating
transformative change in the healthcare
sector. Growth to date has been through
strategic acquisition and investments,
partnership and commercial relationships.
Key events this year include the acquisition
of DCA eHealth Solutions Pty Ltd, a 50
per cent interest in Fred IT Group Pty Ltd,
further investment in HealthEngine Pty Ltd
and licensing agreements for iScheduler,
InstantPHR and Dr Foster Intelligence’s
Quality Investigator and Global
Comparators products. These investments
enable us to play a role in eHealth solutions
via means such as connectivity of health
services, electronic health records and
electronic prescriptions.
Global Applications and Platforms (GAP)
Telstra’s GAP strategy is to build new growth
businesses and take advantage of the
considerable growth in the software-driven
business encompassing applications and
integrated services.
Fostering local technology innovation is
another key strategic pillar of this group,
with the launch this year of muru-D®,
Telstra’s startup accelerator. The name
muru-D combines “muru”, an indigenous
word meaning “road to” and “D” for “Digital”.
muru-D promotes local technology
innovation and helps grow and retain
entrepreneurial talent in Australia, by
identifying and supporting startups to
develop their products and services through
a six-month acceleration program. muru-D
also invests approximately $40,000 in each
startup for an equity stake of approximately
six per cent. The inaugural round attracted
more than 300 applications, with the
selected top nine starting their six month
program in February 2014.
Telstra Media
Telstra Media is Australia’s largest IPTV
service provider and through the award
winning Telstra T-Box, a close partnership
with Foxtel and other premium content
partners delivers premium movies, music,
live sport and entertainment across a full
range of devices.
This year, more than fifty new mobile and
tablet apps were launched for the AFL and
NRL Club Network and we also introduced
the AFL Live Pass and NRL Digital Pass,
which provide live AFL and NRL on
smartphones and tablets.
During the year, we also completed the sale of
a 70 per cent stake in our Sensis directories
business to Platinum Equity on 28 February
2014. We believe our partnership with
Platinum Equity will maximise the value of
the Sensis asset for Telstra shareholders.
We signed a 15 year $457 million managed services partnership to build and manage a new wireless network for the Queensland Government.
Strategy and Performance
BUILD NEW GROWTH BUSINESSES
Telstra Annual Report 11

Strategy and Performance
OUTLOOK
We have a clear and consistent strategy
to improve customer advocacy, drive
value from the core and build new growth
businesses.
We will continue to focus on delivering
a differentiated and quality customer
service experience for all of our customers
to build advocacy. While we are seeing
promising results in this area there is
more to do in the year ahead.
In our core businesses, we will continue to
drive innovation and maintain our network
leadership. Our fixed data network
differentiation will be enhanced by the
implementation of Australia’s largest
national public Wi-Fi access network.
As the NBN rolls out to more communities
around Australia, we will be focused on
bringing customers the benefits of Telstra
services on the NBN. We will continue our
negotiations with NBN Co and the Federal
Government on potential changes to the
current agreements that may result from
the government’s intention to move to a
multi-technology NBN roll out.
Our network leadership in mobiles will be
enhanced in 2015 through the roll out of
4G services on 700MHz and 2.5GHz. This
will enable our customers to have access
to higher speeds and better capacity in
more places when using mobile phones,
tablets and mobile broadband devices.
We will also continue to drive for efficiency
in our core business, simplifying both the
way we operate and the way we interact
with our customers, making it easier for
our customers to do business with us.
Like other Australian companies, Telstra
has aspirations to grow our business in
Asia. For us, this means leveraging our
core network capabilities in the region,
building our Global Enterprise and
Services business and looking for other
growth opportunities.
Additional information on our outlook
can be found in the Chairman and CEO
Message on pages 4 to 6.
12 Telstra Annual Report

Strategy and Performance
MANAGING OUR RISKS
Identifying and managing risks with the
potential to affect our objectives is an
essential part of our governance framework.
Our Risk Management Approach
Our risk management approach facilitates
appropriate identification, assessment
and control of risks to our operations
and corporate strategy. It provides the
framework for various activities to enhance
our ability to achieve our financial, customer
and people goals and meet our legal and
compliance responsibilities so as to protect
and enhance value for our shareholders.
Throughout the year we continued to mature
and refine our risk management approach.
Recent activities included the continued
clarification and enhancement of our
risk accountabilities. This was facilitated
through our Three Lines of Defence model
and the formation of the Management
Risk Committee – management’s peak
governance committee for risk management
across the Telstra Group.
Risks are regularly reviewed and monitored,
especially those internal and external risks
that could have a material impact on our
objectives. These Material Business Risks
are also regularly reported to the Board,
along with their controls and mitigation
treatments. We conduct an Enterprise Risk
Maturity Assessment on a regular basis
to track and focus on the development
of the Risk Management Framework. We
report the results of this assessment to
the Audit & Risk Committee. The Audit &
Risk Committee has reviewed Telstra’s risk
management framework and satisfied itself
that the Framework continues to be sound.
Material Business Risks
There are a number of risks, both specific
to Telstra and of a more general nature,
that individually or together could have an
adverse effect on achieving our objectives.
The following section summarises those
material business risks that could
adversely affect our financial performance
and growth potential for future years,
including any material exposure to
economic, environmental or social
sustainability risks and how we seek to
mitigate or manage them.
Business disruption
A high dependency on technology and
increased integration of customer services
means outages can significantly impact
the continuity of our business operations
and delivery of services to our customers.
We also have a vast geographical spread,
which increases our exposure to natural
disasters that can disrupt our operations.
We have a response capability to
address business disruption events, with
incident management and emergency
management capability. We continually
review and improve this capability, via
assessments that consider our business’
core activities while taking into account
relevant external factors, such as supplier
impacts and customer expectations.
Information security
Protecting the security and privacy of
our customer data and company data is
a critical focus for us and remains a key
driver of customer advocacy. In order to
counter cyber security risks and improve
the protection of our networks and
information from external threats, we have
developed numerous security controls
for our networks that are based on our
understanding of known threats and best
practice industry knowledge. We continually
reassess these controls to verify that they
are appropriate given the evolving nature
of such threats. We also have programs
in place to raise awareness, and support
employee and vendor compliance with our
information security and privacy standards.
Third parties
Third party contractors, suppliers and
strategic partners are critical to our
capability to derive value from our core
businesses and deliver on our growth
strategy. Support and delivery of core
business functions and customer service
by these third parties mean that supply
chain incidents, issues and single points of
failure can also cause significant impacts
to our customers. We manage this risk
centrally through our Procurement and
Enterprise Services Group by undertaking
a due diligence process for new third
parties, assessing their compliance with
our business continuity requirements,
and conducting training on key Telstra
Business Units
/ Operational
Management
Responsible for
identifying and
managing risks
First Line
of Defence
Chief Risk Office
Responsible for
enterprise-wide
risk frameworks
Second Line
of Defence
Group
Internal Audit
Responsible for
independent
assurance
Third Line
of Defence
Three Lines of Defence
Telstra Annual Report 13

policies, while the day to day relationship is
conducted and managed within the relevant
business units. We have also introduced
a Supplier Code of Conduct outlining our
expectations of suppliers in terms of labour
and human rights, environment, ethical
practices and diversity, and have engaged
with suppliers to help them understand
how to meet our requirements.
Innovation and agility
Effective innovation is fundamental in
securing revenue streams and withstanding
challenges from a changing competitor and
industry landscape. Our capacity and ability
to respond to the innovation challenge are
related to the agility of our internal process
and the capability and flexibility of our
people. To manage this risk we are focused
on enhancing the skills of our people and
engaging with strategic partners to identify
innovative products and services that could
deliver long term, predictable earnings
growth. We are also actively simplifying our
processes, IT and network infrastructure as
we aim to deliver them profitably and can
respond quickly to disruptive innovations
on a global scale.
Regulatory environment
We operate in a highly regulated
environment. The Australian Government
and its regulatory agencies have broad
powers to impose obligations on certain
parts of our business. This regulation
includes the Australian Competition and
Consumer Commission’s (ACCC’s) powers
to regulate the price and non-price
terms on which we provide access to our
infrastructure and core services on our
network to our Australian competitors.
As we consider investment opportunities
in offshore markets we also face exposure
to regulation and regulatory bodies in
those jurisdictions.
We work actively with government,
regulators, industry and the community
to minimise and mitigate the risk of
inefficient or poorly targeted regulation,
and to proactively seek to have removed
unnecessary regulation that affects
our cost of doing business. In terms of
new and emerging risks domestically
and internationally, we are monitoring
proposed changes in relevant laws or
regulations and responding to various
policy and regulatory reviews where
appropriate. In an Australian context
these include a review of competition
policy, the NBN, ACCC pricing reviews for
core network services and a review of the
regulatory framework for spectrum.
NBN execution
Our Chairman and CEO’s message in
this report includes an update on our
negotiations on potential changes
to our agreements with NBN Co and
the Commonwealth to adapt to the
current Australian Government’s multi-
technology policy for the NBN. In our
day to day operations, the introduction
of the NBN and the change to the
industry structure is likely to expose us
to increased fixed line competition, and
also presents operational challenges as
we migrate our customers off our copper
and HFC networks. We are focused on
developing efficient processes and
systems within Telstra to support the
transition of our customers to the NBN,
while also improving customer advocacy.
This also necessitates establishing an
effective access seeker relationship with
NBN Co to support delivery of a quality
service experience for our customers.
We closely monitor customer experience,
operational performance, costs and
competitor activity so we can identify
improvement opportunities. We will also
continue to evolve our offerings as the
NBN roll out grows, including adapting to
NBN Co’s multi-technology approach to
its network roll out.
People
The skills and experience of our people
have an influence on our ability to deliver
against our growth strategy. One factor
that influences our exposure to this risk is
our high demand for a limited number of
technical, sales and leadership capability
skills within key growth and international
areas. Key mitigation strategies intended to
further enhance our people capability and
competitive advantage include: succession
planning, recruitment processes and
capability frameworks focused on building
expertise in our growth areas, and targeted
learning and development programs and
retention strategies. We are building a
strategic workforce planning practice that
looks five to ten years out for critical skills.
We are also looking at more flexible and
diverse practices in reward and recognition.
Reputation and communication
We focus on protecting and promoting
Telstra’s reputation and being a good
corporate citizen in the countries in which
we operate. There are clear connections
between how Telstra is perceived in the
community and customer advocacy and,
ultimately, the financial performance of
the business. Every risk giving rise to an
incident can harm our reputation and
customer advocacy. While the short term
negative impact from such events cannot
be fully protected against, such incidents
are managed through scenario analysis,
planning and preparation, and stakeholder
management. Reputational robustness and
stakeholder support helps improve recovery
times from any such impacts. Social
media plays an ever increasing part in
representing the organisation and engaging
openly with issues that can impact our
reputation. It also assists, as does our
sustainability approach, with engaging
customers, investors, key influencers,
government, business, employees and
the broader public.
Strategy and Performance
MANAGING OUR RISKS
14 Telstra Annual Report

Reported Results
During financial year 2014 there were two
significant divestments. In February we
completed the sale of a 70 per cent stake
in our Sensis directories business and in
May we completed the sale of our 76.4
per cent shareholding in the Hong Kong-
based mobiles business, CSL New World
Mobility Limited (“CSL”). In accordance
with accounting standards, the Sensis
directories business is disclosed as a
discontinued operation. CSL does not
meet the criteria to be classified as a
discontinued operation as we continue to
operate a mobiles business in Australia.
The numbers and commentary in the
product and expense performance
sections have been prepared on a
continuing operations basis and aligns
with the statutory financial statements.
The segment performance and financial
position sections have been prepared on
a continuing and discontinued operations
basis (that is, includes the results of
the Sensis directories business) unless
otherwise noted.
Our results highlight consistent earnings
growth and increased shareholder returns
while investment in innovation, networks
and improving the customer experience
FULL YEAR RESULTS AND OPERATIONS REVIEW
Summary Financial Results
FY14
$m
Restated(i)
FY13 $m
Change
%
Sales revenue 25,119 24,298 3.4
Total income (excluding finance income) 26,296 24,776 6.1
Operating expenses 15,185 14,607 4.0
EBITDA 11,135 10,168 9.5
Share of net profit/(loss) from joint ventures
and associated entities
24 (1) n/m
Depreciation and amortisation 3,950 4,078 (3.1)
EBIT 7,185 6,090 18.0
Net finance costs 957 933 2.6
Tax 1,679 1,517 10.7
Profit for the period from continuing operations 4,549 3,640 25.0
(Loss)/profit for the period from
discontinued operation
(204) 151 (235.1)
Profit for the period from continuing and
discontinued operations
4,345 3,791 14.6
Profit attributable to equity holders of Telstra 4,275 3,739 14.3
Capex(ii) 3,661 3,689 (0.8)
Free cashflow from continuing and
discontinued operations
7,483 5,024 48.9
Earnings per share (cents) 34.4 30.1 14.3
(i) Restatement due to the retrospective adoption of AASB 119: Employee Entitlements
(refer note 2.1(e) of the Financial Report for details).
(ii) Capex is defined as additions to property, equipment and intangible assets including capital
lease additions, measured on an accrued basis.
Results on a Guidance Basis(ii)
FY14 FY14 guidance
Total income
growth(iii)3.5%
Low single digit
growth
EBITDA
growth4.7%
Low single digit
growth
Capex/sales
ratio14.6% ~ 15% of sales
Free
cashflow
$5.1
billion
$4.6 - $5.1
billion
Guidance Versus Reported Results(ii)
FY14 FY14 FY14 FY13
Reported
results $m
Adjustments
$m
Guidance
basis $m
Guidance
basis $m
Total income(iii) 26,296 (662) 25,634 24,776
EBITDA 11,135 (491) 10,644 10,168
Free cashflow 7,483 (2,356) 5,127 5,024
(ii) Adjusted for the sale proceeds from CSL and 70 per cent of our Sensis directories business, M&A activity,
Octave foreign currency reserve loss, Sequel Media impairment and 30% equity share of Sensis directories
business. Please refer to the guidance versus reported results reconciliation on page 199. This reconciliation
forms part of the Full Year Results and Operations Review, and has been reviewed by our auditors.
(iii) Excludes finance income.
Telstra Annual Report 15

has set the foundation for future growth.
Our strategy is to improve customer
advocacy, drive value from the core and
build new growth businesses.
On 14 August 2014, the Directors of
Telstra resolved to pay a fully franked
final dividend of 15 cents per share.
Shares will trade excluding entitlement
to the dividend on 27 August 2014 with
payment on 26 September 2014. We
have also announced an off-market
share buy-back of up to approximately
$1 billion of Telstra shares. Detailed
process information regarding the buy-
back will be released to shareholders
on 27 August 2014.
Product Performance
Fixed
Telstra’s fixed portfolio comprises fixed
voice, fixed data and other fixed revenue
(which includes inter carrier services,
customer premises equipment and
infrastructure access revenue from the
NBN agreements).
Revenue from our fixed business decreased
by 0.8 per cent to $7,245 million, although
there was growth in fixed data and
increased infrastructure access revenue
from the NBN agreements. Customers
moving onto bundled plans and retention
strategies led to the lowest rate of decline in
our fixed voice business for five years, with
a revenue decrease of 7.5 per cent to $4,034
million and a loss of 232,000 customer
services. Retail customer services declined
by 278,000 and wholesale customer
services increased by 46,000. There are
now 7.5 million fixed voice services.
Fixed data revenue increased by 6.3 per
cent to $2,218 million. We again saw strong
growth in retail fixed data, with revenue
increasing by 7.5 per cent to $1,889 million.
This was driven by growth in bundled plans
with 259,000 new bundled customers. The
total number of customers on a bundled
plan is 1.9 million, or 63 per cent of the retail
fixed data customer base. Retail fixed data
average revenue per user (ARPU) increased
by 0.8 per cent to $54.98.
Other fixed revenue increased by 15.6 per
cent to $993 million, driven by increased
infrastructure access revenue from the
NBN agreements.
Fixed voice EBITDA margins decreased
to 60 per cent driven by revenue decline,
while fixed data EBITDA margins increased
to 44 per cent due to revenue growth and
reduced service delivery costs.
Mobile
Our strong performance in mobiles
continued with revenue growth of 5.1 per
cent, or $468 million to $9,668 million.
FULL YEAR RESULTS AND OPERATIONS REVIEW
Key Product Revenue
FY14
$m
FY13
$m
Change
%
Fixed 7,245 7,305 (0.8)
Mobile 9,668 9,200 5.1
Data
and IP2,968 3,041 (2.4)
NAS 1,896 1,484 27.8
Product Profitability EBITDA Margins(i)
FY14 FY13 2H14 1H14 2H13
Mobile 40% 38% 41% 39% 39%
Fixed voice(ii) 60% 62% 59% 61% 63%
Fixed data(ii) 44% 41% 46% 42% 43%
Data and IP 65% 65% 66% 65% 64%
Telstra Group 42%(iii) 42% 42%(iii) 42% 43%
(i) The data in this table includes minor adjustments to historic numbers to reflect changes in product hierarchy.
(ii) Margins exclude NBN voice and data products.
(iii) Profit on the sale of CSL has been excluded from these figures.
Product Sales Revenue Breakdown
Other 5%Fixed 29%
Mobile 38%
CSL 4%
Media 4%
NAS 8%
Data & IP
12%
PRODUCT SALES REVENUE
BREAKDOWN
16 Telstra Annual Report

Retail mobile services revenue grew 6.7
per cent with growth across major product
categories. Domestic retail customer
services increased by 937,000, bringing
the total number to 16.0 million. EBITDA
margins increased to 40 per cent.
Post-paid handheld revenue grew 4.2 per
cent to $5,006 million. ARPU, excluding
the impact of mobile repayment options
(MRO), increased 0.7 per cent to $65.80
as customers used more data. The annual
post-paid handheld deactivation rate
improved 0.5 percentage points to 10.3 per
cent, and remains at world leading levels.
Pre-paid handheld revenue increased
20.9 per cent to $879 million with an
increase of 249,000 unique pre-paid
handheld users. Growth was driven by
a full year’s contribution from the Boost
retail partnership and the continuing
popularity of our Cap Encore plans. ARPU
grew by 11.4 per cent due to increased
data usage.
We added 109,000 customer services in
the mobile broadband category. Revenue
grew by 7.6 per cent to $1,287 million.
ARPU declined slightly to $29.59. Machine
to machine (M2M) services experienced
revenue growth of 12.2 per cent to $101
million, adding 291,000 services.
We continue to invest in our 4G network,
which is four times the geographical
coverage area of any other 4G network
in Australia. This has helped us grow
penetration of 4G devices with 34 per cent
of our handheld customers on 4G. We have
more than 5.2 million 4G devices on our
network, comprising 3.8 million handsets,
500,000 tablets, 400,000 dongles and
550,000 Wi-Fi hotspots.
Data and IP
Data and IP includes revenue from IP
access, ISDN services and other data and
calling products. There was growth in IP
Access revenue which grew by 3.3 per cent
to $1,166 million. IP MAN services growth
continued, with a 6.8 per cent increase
bringing the total number of services to
32,679. However, overall revenue in this
portfolio declined by 2.4 per cent or $73
million to $2,968 million resulting from the
continued decline in ISDN and other legacy
products. Data and IP EBITDA margins
remained steady at 65 per cent.
Network Applications and Services (NAS)
We continue to build momentum in the
NAS domestic portfolio. NAS builds
on the value which our IP network
delivers to enterprise, government and
business customers by providing unified
communications, cloud, managed
networks and security services. During
the year we made acquisitions to
complement our capability. NSC
Group is a leading provider of unified
communications solutions in Australia
and has strengthened our contact centre
technology services, while O2 Networks
is a leader in network and security
consultation and integration services.
There was revenue growth in the domestic
portfolio of 27.8 per cent to $1,896 million.
This growth was driven by revenue from
contracts signed in previous years, such as
the six year Department of Defence contract.
Major NAS categories had strong
revenue growth, with managed network
services increasing by 55.7 per cent with
a significant portion of this increase
attributable to the Department of Defence
contract, unified communications
increasing by 21.1 per cent and cloud
services increasing by 32.2 per cent.
Media
Media product portfolio revenue declined
by 0.5 per cent or $5 million to $982 million.
This portfolio previously included our Sensis
directories business, of which 70 per cent
FULL YEAR RESULTS AND OPERATIONS REVIEW
Fixed Voice Fixed Data Mobile
Domestic Retail Customer Services (millions)
FY10 FY11 FY12 FY13 FY14
10.612.2 13.8 15.1 16.0
2.22.4
2.62.8
3.07.47.2
6.9 6.56.2
Mobile Revenue ($b)
FY10 FY11 FY12 FY13 FY14
7.3
8.0
8.7
9.2
9.7
NAS Revenue ($b)
FY10 FY11 FY12 FY13 FY14
1.0
1.1
1.3
1.5
1.9
Telstra Annual Report 17

was sold in February for $454 million. TV
revenue increased by 5.0 per cent to $699
million with growth in both Premium Pay
TV and Foxtel on T-Box® ‘paylite’ services.
This was offset by a decline in Sensis voice
and advertising services of 22.0 per cent.
CSL New World Mobility
In May 2014 we announced the sale of our
76.4 per cent stake in CSL to HKT Limited,
and received US$1.99 billion in proceeds
(A$2.11 billion gross cash proceeds
which are subject to completion audit).
Our results include ten months of CSL’s
results. In that period revenue grew by
3.4 per cent to $1,045 million driven by
strong post-paid handheld revenue and
favourable foreign exchange movements.
Other
Global Connectivity and NAS offshore
revenue grew by 19.8 per cent to $678
million. In our China digital media portfolio,
revenue increased by 71.6 per cent. This
includes Autohome which holds a strong
position in digital marketing in the rapidly
growing Chinese auto market. On 11
December 2013, Autohome Inc. was listed
on the New York Stock Exchange. Our
ownership interest in Autohome Inc.
is 63.2 per cent.
Expense Performance
Labour performance
Total labour expenses increased by 4.5 per
cent or $205 million to $4,732 million. Full
time staff and equivalents decreased by
107 to 31,931. This decrease was driven
by the acceleration of restructuring
programs across Telstra Operations and
the divestment of CSL, offset in part by
expenses supporting NAS and NBN-
related activity. Salary and associated
costs increased by 3.2 per cent or $106
million to $3,399 million. This included
the impact of salary and wage increases
and unfavourable bond rate movements
impacting long service leave and workers
compensation provisions which contributed
$58 million. Redundancy expenses
increased by 32.8 per cent or $62 million to
$251 million due to continued restructuring
to support a changing product and service
mix, and simplification of our business.
Goods and services purchased
Goods and services purchased increased
by 3.5 per cent or $218 million to $6,465
million. Cost of goods sold (COGS) increased
marginally by 0.9 per cent or $25 million
to $2,906 million. The main driver was an
increase in NAS COGS supporting revenue
growth and CSL mobile COGS impacted
by higher smartphone unit rates and the
translation of a weaker Australian Dollar,
offset by lower domestic post-paid mobile
COGS. Other goods and services purchased
increased by 7.7 per cent or $130 million to
$1,828 million to support growth in some
large NAS contracts. Network outpayments
increased by 3.8 per cent or $63 million to
$1,731 million, driven by increased voice
usage in line with revenue growth in CSL.
A reduction in the mobile terminating
access (MTA) rate resulted in continued
savings. This was offset by increased SMS/
MMS costs due to higher volumes, however
this also had a favourable revenue impact.
Other expenses
Total other expenses increased by 4.0
per cent or $155 million to $3,988 million.
Service contracts and agreements
increased 7.4 per cent or $101 million to
$1,468 million, driven mainly in support of
GES revenue growth. The remaining other
expenses increased $78 million to $2,260
million, driven by an increase in light and
power costs resulting from our 4G roll
out, higher property rental costs across
our network and data sites and a write off
of $98 million from the foreign currency
translation reserve for our Octave
investment in China. The prior year also
included a loss recognised on the sale of
TelstraClear of $127 million.
Finance costs
Net finance costs increased year on year by
2.6 per cent or $24 million, which comprised
a reduction in net borrowing costs of $54
million offset by a reduction in capitalised
interest of $38 million, and an increase in
other finance costs of $40 million.
The reduction in net borrowing costs was
predominantly due to a reduction in the
net average interest cost. The average
net interest yield for the year was 6.2 per
cent compared to 6.4 per cent in the prior
year. The reduction in yield arose through
a combination of a reduction in market
base rates (resulting in lower costs on
the floating rate debt component of our
debt portfolio), and from refinancing at
lower rates.
The primary driver for the increase of
$40 million in other finance costs was a
decrease in other interest revenue of $61
million relating to interest on tax refunds
FULL YEAR RESULTS AND OPERATIONS REVIEW
Operating Expenses
FY14 $m FY13 $m Change %
Labour 4,732 4,527 4.5
Goods and services purchased 6,465 6,247 3.5
Other expenses 3,988 3,833 4.0
Total operating expenses 15,185 14,607 4.0
18 Telstra Annual Report

(prior year included $64 million interest on
tax refunds). This increase was partially
offset by a reduction in the net interest
charge relating to defined benefit plans
and a reduction in valuation impacts.
Segment Performance
We report segment information on the
same basis as our internal management
reporting structure as at reporting
date. Segment comparatives reflect
organisational changes that have
occurred since the prior reporting period
to present a like for like view. Commentary
on the performance of our business
segments follows.
Telstra Retail
Telstra Retail brings together our key
retail facing businesses including
Telstra Consumer, Telstra Business,
Telstra Media Group and Telstra Health.
Telstra Retail provides the full range of
telecommunications products, services
and solutions to consumer customers
and to Australia’s small to medium sized
enterprises, as well as the provision of
Foxtel and digital content services. Income
in this segment grew by 3.6 per cent to
$16,350 million and EBITDA increased by
3.8 per cent to $9,307 million. Income in
our Consumer business unit grew by 4.6
per cent with strong growth in mobiles
of 10.6 per cent, driven by increased data
usage, as well as a 7.2 per cent increase
in fixed data revenue offset by an 8.2 per
cent decline in fixed voice revenue. Telstra
Business income grew by 0.8 per cent,
with continued strong growth in the NAS
portfolio, which increased 44.2 per cent.
A 6.3 per cent growth in fixed data was
offset by an 8.5 per cent decline in fixed
voice revenue. Telstra Health contributed
income of $40 million in its first year.
Commentary on the performance of Telstra
Media Group is provided within the Media
product performance section on page 17.
Global Enterprise and Services
Global Enterprise and Services (GES)
is responsible for sales and contract
management support for business and
government customers in Australia
and globally. It also provides product
management for advanced technology
solutions including Data and IP networks,
and NAS products such as managed
network, unified communications, cloud,
industry solutions and integrated services.
Technical delivery for NAS customers in
Australia and globally is also provided
by GES. Income for GES increased by 4.1
per cent to $5,284 million, driven by NAS
domestic and global connectivity, offset by
declines from Australian enterprise and
government customers for fixed telephony,
mobiles and data connectivity. Investment
to support growth in NAS contracts and
GES global customers resulted in an
increase in operating expenses of 21.9 per
cent, leading to an EBITDA decline of 9.1
per cent. This decline moderated in the
second half.
Telstra Wholesale
Wholesale income grew by 10.1 per
cent to $2,328 million. This was largely
driven by revenue growth from the NBN
Infrastructure Service Agreement, partly
offset by one off reductions to fixed and
mobile roaming revenues from customer
exits during FY13. We also saw an increase
in unconditioned local loop (ULL) services
of 160,000. External expenses increased
by 16.8 per cent largely due to higher bad
debts from customer insolvencies and
increased network outpayments from
Telstra International. EBITDA contribution
increased by 9.5 per cent to $2,127 million.
FULL YEAR RESULTS AND OPERATIONS REVIEW
Segment Income
FY14
$m
FY13
$m
Change
%
Telstra Retail 16,350 15,784 3.6
Global Enterprise and
Services
5,284 5,074 4.1
Telstra Wholesale 2,328 2,115 10.1
Telstra
International Group
1,887 1,163 62.3
Telstra Operations 161 156 3.2
Other 838 1,688 (50.4)
Total Telstra segments 26,848 25,980 3.3
Telstra Retail 61%
Other 2%
Telstra International Group 7%
Telstra Operations 1%
Telstra Wholesale 9%
Global Enterprise and Services 20%
SEGMENT INCOME
Telstra Annual Report 19

Telstra International Group
The Telstra International Group income
grew by 62.3 per cent to $1,887 million
and EBITDA contribution grew by 156.9
per cent to $817 million. This segment
comprises our China digital media portfolio
and CSL . During the year Telstra ceased
operations in the Octave investment in
China and commenced liquidation of
the legal entities in the Octave Group. A
write off of $98 million from the foreign
currency translation reserve associated
with this investment was recorded during
the year. CSL was also sold in May 2014
and we recognised $561 million profit
on sale. Refer to note 20 in the financial
statements for further details.
Further commentary on the performance
of these businesses is provided within the
product performance section on page 17.
Telstra Operations Group
Telstra Operations is primarily a service
delivery centre supporting the revenue
generating activities of other segments.
The underlying EBITDA contribution
improved 1.6 per cent on the prior year
with reductions in labour expenses,
partially offset by higher network
accommodation costs.
Other
Our Other category includes the costs
of corporate centre functions, payments
received under certain NBN agreements,
impairments, adjustments to employee
provisions for bond rate movements and
short term incentives, and redundancy
expenses for the parent entity. The
results of our New Zealand subsidiary
TelstraClear, sold in October 2012, and the
70 per cent stake of our Sensis directories
business, sold in February 2014, are also
included in this category. The declining
revenues in the Sensis directories business
and the associated impairment charges
represent the major movement for the
year in this segment compared with the
prior period.
Financial Position
Capital expenditure and cash flow
Capital expenditure decreased by 0.8
per cent to $3,661 million (excluding
expenditure in relation to the Sensis
directories business) and is in line with our
capex to sales guidance of around 15 per
cent. This investment has enabled us to
meet ongoing customer demand from the
growth in our customer base, support the
accelerated roll out of 4G and internet and
content delivery infrastructure platforms,
as well as meet ongoing NBN commitments.
Free cashflow generated from operating
and investing activities was $7,483 million,
which increased 48.9 per cent. Included in
free cashflow were gross cash proceeds
from the sale of CSL of $2,107 million
(subject to completion audit) and $454
million from the sale of our 70 per cent
shareholding in the Sensis directories
business. The prior year included cash
proceeds from the sale of TelstraClear
of $669 million. Cash from operating
activities increased by $254 million or
3.0 per cent due to the continued strong
performance of our mobility products
combined with a program to reduce
inventory levels. This was partially offset
by an increase in income taxes paid
due to legislative changes requiring
income tax instalments be remitted
monthly rather than quarterly, resulting
in additional instalments being paid in
the current year. Cash outflows from
investing activities decreased as a result
of lower payments for spectrum licence
purchases, offset partially by an increase
in mergers and acquisitions activities.
Debt position
Our gross debt position increased by $420
million to $16,048 million. This increase
included short term debt issuance of
$252 million, finance lease additions of
$121 million and revaluation impacts on
our debt portfolio of $204 million, partially
offset by finance lease repayments of $91
million and a net reduction in long term
debt of $67 million. The reduction in long
term debt comprised debt maturities of
$565 million offset by a domestic bond
issue with net proceeds of $498 million.
FULL YEAR RESULTS AND OPERATIONS REVIEW
Summary Statement of Cash Flows
FY14 $m FY13 $m Change %
Net cash provided by operating activities 8,613 8,359 3.0
Total capital expenditure
(including investments)
(4,018) (4,545) (11.6)
Sale of shares in controlled entities
(net of cash disposed)
2,397 693 245.9
Other investing activities cash flows 491 517 (5.0)
Net cash used in investing activities (1,130) (3,335) (66.1)
Free cashflow 7,483 5,024 48.9
Net cash used in financing activities (4,430) (6,526) (32.1)
Net increase in cash and cash equivalents 3,053 (1,502) 303.3
20 Telstra Annual Report

The domestic bond issue was used to
refinance maturing domestic debt.
Net debt decreased by $2,628 million
to $10,521 million. This movement
comprises the increase in gross debt of
$420 million offset by an increase in cash
and cash equivalents of $3,048 million.
The higher liquidity reflects proceeds
from divestments of shareholdings in the
Sensis directories business and CSL. The
impact of the higher liquidity is reflected
in the reduction in our net debt gearing
ratio (net debt to capitalisation) from
50.5 per cent at 30 June 2013 to 43.0 per
cent at 30 June 2014 and also our debt
servicing ratio. Liquidity will be reduced
in the first quarter of financial year 2015
to fund planned cash outflows such as
spectrum licence payments and
dividend payments.
Statement of Financial Position
Our balance sheet remains in a strong
position with net assets of $13,960 million.
Current assets increased by 32.1 per cent
to $10,438 million. An increase in cash
and cash equivalents and a decline in
trade and other receivables was mainly
due to divestments of CSL and 70 per cent
of our Sensis directories business.
Tax receivables decreased due to the
receipt of tax amendment refunds.
Non current assets decreased by 5.6 per
cent to $28,922 million. Property, plant
and equipment declined as ongoing
depreciation and retirements exceeded
the level of additions. Intangible assets
decreased largely due to the Sensis
and CSL divestments and a portion
of Sensis goodwill recognised as an
impairment loss. This was partially offset
by acquisitions made during the period.
The increase in derivative assets is
primarily attributable to net foreign
currency and other valuation impacts
arising from measuring to fair value.
Current liabilities increased by 15.4
per cent to $8,684 million. There was
an increase in current borrowings
and derivative liabilities reflecting
transactions that will mature within the
next 12 months and higher refinancing
demands during the financial year 2015.
Trade and other payables decreased
primarily as a result of lower capital
and labour accruals due to the Sensis
divestment. It also included a decline in
trade creditors driven by payments in
June to a large volume of vendors with a
July clearing date. Current tax payables
decreased largely due to increased tax
instalments paid on transition from a
quarterly to monthly instalment regime.
Non current liabilities decreased by 7.8
per cent to $16,716 million. The decrease
in non current borrowings was due to
a reclassification of debt into current
borrowings, partially offset by a domestic
bond issue during the year, foreign
currency movements and other valuation
impacts. The decrease in derivative
liabilities was due to reclassification to
current for maturities within the next
12 months, and also included foreign
currency and other valuation impacts
arising from measuring to fair value.
Return on average assets and return
on average equity improved primarily
due to the increase in profit. The return
on average equity was partly offset by
a favourable movement in the foreign
currency translation reserve, with the
translation differences transferred to the
income statement.
FULL YEAR RESULTS AND OPERATIONS REVIEW
Financial Settings
FY14
Actual
Target
Zone
Debt
servicing(i)
0.9x 1.3 – 1.8x
Gearing(ii) 43% 50% to 70%
Interest
cover(iii)
13.8x >7x
(i) Debt servicing ratio equals net debt to EBITDA.
(ii) Gearing ratio equals net debt to net debt plus
total equity.
(iii) Interest cover equals EBITDA to net interest.
Summary Statement of Financial Position
FY14 $m FY13 $m Change %
Current assets 10,438 7,903 32.1
Non current assets 28,922 30,624 (5.6)
Total assets 39,360 38,527 2.2
Current liabilities 8,684 7,522 15.4
Non current liabilities 16,716 18,130 (7.8)
Total liabilities 25,400 25,652 (1.0)
Net assets 13,960 12,875 8.4
Total equity 13,960 12,875 8.4
Return on average assets (%) 20.4 17.9 2.5pp
Return on average equity (%) 32.3 31.0 1.3pp
Telstra Annual Report 21
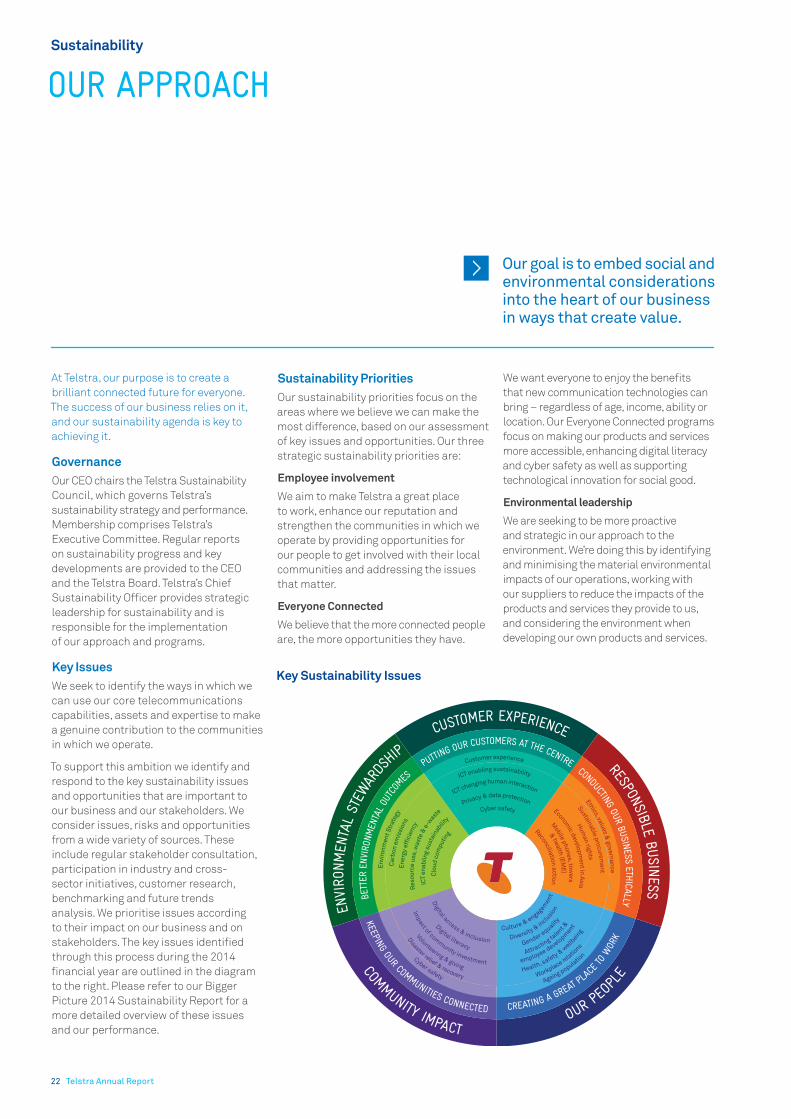
Sustainability
OUR APPROACH
At Telstra, our purpose is to create a
brilliant connected future for everyone.
The success of our business relies on it,
and our sustainability agenda is key to
achieving it.
Governance
Our CEO chairs the Telstra Sustainability
Council, which governs Telstra’s
sustainability strategy and performance.
Membership comprises Telstra’s
Executive Committee. Regular reports
on sustainability progress and key
developments are provided to the CEO
and the Telstra Board. Telstra’s Chief
Sustainability Officer provides strategic
leadership for sustainability and is
responsible for the implementation
of our approach and programs.
Key Issues
We seek to identify the ways in which we
can use our core telecommunications
capabilities, assets and expertise to make
a genuine contribution to the communities
in which we operate.
To support this ambition we identify and
respond to the key sustainability issues
and opportunities that are important to
our business and our stakeholders. We
consider issues, risks and opportunities
from a wide variety of sources. These
include regular stakeholder consultation,
participation in industry and cross-
sector initiatives, customer research,
benchmarking and future trends
analysis. We prioritise issues according
to their impact on our business and on
stakeholders. The key issues identified
through this process during the 2014
financial year are outlined in the diagram
to the right. Please refer to our Bigger
Picture 2014 Sustainability Report for a
more detailed overview of these issues
and our performance.
Sustainability Priorities
Our sustainability priorities focus on the
areas where we believe we can make the
most difference, based on our assessment
of key issues and opportunities. Our three
strategic sustainability priorities are:
Employee involvement
We aim to make Telstra a great place
to work, enhance our reputation and
strengthen the communities in which we
operate by providing opportunities for
our people to get involved with their local
communities and addressing the issues
that matter.
Everyone Connected
We believe that the more connected people
are, the more opportunities they have.
We want everyone to enjoy the benefits
that new communication technologies can
bring – regardless of age, income, ability or
location. Our Everyone Connected programs
focus on making our products and services
more accessible, enhancing digital literacy
and cyber safety as well as supporting
technological innovation for social good.
Environmental leadership
We are seeking to be more proactive
and strategic in our approach to the
environment. We’re doing this by identifying
and minimising the material environmental
impacts of our operations, working with
our suppliers to reduce the impacts of the
products and services they provide to us,
and considering the environment when
developing our own products and services.
Our goal is to embed social and environmental considerations into the heart of our business in ways that create value.
Key Sustainability Issues
22 Telstra Annual Report

Customers Experiencing Disadvantage
Our Access for Everyone program is
designed to help people on low incomes
or facing hardship stay connected. Since
2002, this program has provided benefits
to the value of more than $2 billion. We
work with over 2,000 community agencies
across Australia to deliver the program
that includes benefits such as discounts
on fixed line home phone services for
around 980,000 pensioners, home phone
line rental relief for 76,000 households and
distribution of around 113,000 calling cards.
Customers with Disability
For more than 25 years we have been
committed to ensuring our products
are accessible for customers with
communication challenges. Telstra’s
sixth Disability Action Plan (2013–2016)
recognises the benefits that modern
communications technologies bring
to people with disability and extends
Telstra’s commitment to improving the
accessibility and affordability of our
products and services.
Privacy and Data Protection
Millions of people trust us with their
personal information and we continue
to work diligently every day to honour
this trust. We take customer privacy
and data security very seriously. Our
priority is making sure we keep personal
information safe and secure at all times.
We continue to invest in controls to protect
the privacy of our customers and to be
transparent in the way we manage this
information. In March 2014, we published
our new Privacy Statement in response
to the introduction of the new Australian
Privacy Principles. This statement
reaffirms our commitment to protecting
the personal information of our customers.
In March 2014, the Privacy Commissioner
and the Australian Communications and
Media Authority found us in breach for an
incident that was identified in May 2013,
where some of our customer details were
available online. As soon as possible after
we learnt about the issue, we disabled all
public access to the data and apologised
to the people affected. We have since
made significant investments into more
stringent controls around our systems.
Cyber Safety
Cyber safety is an important social issue.
We play an active role as a member of
the Australian Government’s Online
Safety Consultative Working Group
and as co-chair of the Technology and
Wellbeing Roundtable with ReachOut.
com by Inspire Foundation. Telstra is
the only Australasian member of the
Family Online Safety Institute (FOSI), an
international, non-profit organisation
that convenes industry, government and
the non-profit sectors to collaborate and
innovate in the area of cyber safety.
This year, we partnered with the
Queensland Department of Education,
Training and Employment to develop “Meet
the Creeps”, a cyber safety quiz designed
to help students make the most of their
digital opportunities while remaining safe
online. We also distributed around 65,000
cyber safety kits across Australia during
the year, providing practical information
on areas such as protecting personal
information, cyberbullying and protecting
against scams and phishing.
We want to ensure that everyone enjoys the benefits of being connected to modern communications technologies.
MEET THE CREEPS
A CYBER SAFETY INITIATIVE OF TELSTRA
AND THE QUEENSLAND GOVERNMENT
Sustainability
CUSTOMER EXPERIENCE
Telstra Annual Report 23

United Nations Global Compact
We have been a signatory to the United
Nations Global Compact since 2011 and are
committed to supporting its principles – on
human rights, labour rights, environment
and anti-corruption – wherever we operate.
We implement our commitment through a
range of policies, strategies, management
systems and initiatives that reflect the
diverse range of conditions in which our
businesses operate.
Supply Chain
This year, the Telstra Group purchased
$6.5 billion in goods and services from
around 4,800 suppliers. Our spend can
be leveraged to positively influence the
behaviour and actions of our suppliers
and, in turn, benefit the environment
and communities. To help realise this
we developed a three year sustainable
procurement strategy, with a focus on
identifying key social and environmental
risks, embedding consideration of these
risks into our processes and working to
monitor compliance. We also refined our
Supplier Code of Conduct to clarify the
expectations we have of our suppliers.
As part of the process, we held a forum for
key suppliers, representing around
$3 billion in annual spend, on the proposed
changes and to obtain consensus on our
implementation approach.
A more thoughtful approach to supply
chain management has resulted in
initiatives such as our Supported
Workforce program which contracts
non-profit groups to conduct grounds
maintenance at around 4,000 of our
network sites. These groups currently
employ 413 people with disability or
who are experiencing disadvantage.
This year, we established a similar pilot
program for Indigenous people in
remote locations.
Mobile Phones, Towers and Health
We acknowledge that some people are
genuinely concerned about possible
health effects from electromagnetic
energy (EME), and we are committed to
addressing these concerns responsibly.
We are proactive, transparent and fact
based in our communication regarding
EME and comply with the standards
set by regulators. We rely on the expert
advice of national and international
health authorities including the Australian
Radiation Protection and Nuclear
Safety Agency (ARPANSA) and the World
Health Organisation (WHO) and actively
contribute to scientific research in EME
and health.
Helping our customers and the
community keep abreast of the latest
information is important to us. We provide
information on EME on our website
at www.telstra.com/eme and invite
customers to go directly to the WHO,
ARPANSA and EMF Explained websites for
further information. We have a dedicated
EME help desk and team that proactively
reviews new site proposals, develops
community consultation plans and
works with the community to determine
acceptable sites for new base stations. This
year, we continued our mobile safety SMS
campaign, sending out more than eleven
million messages referring customers
to www.telstra.com/mobiletips, our
information site for safe and responsible
phone use. In addition, all new mobile
customers receive information on EME in
their welcome pack.
Transparency Report
This year we released our first Transparency
Report to keep our customers informed
of the requests we receive for access to
information from national security and
law enforcement agencies in Australia and
overseas. The aim of the report is to raise
awareness about the various reasons an
agency may request assistance, such as
enforcing criminal law, protecting public
revenue and safeguarding national security.
We also provide assistance to emergency
services agencies in response to life
threatening situations and Triple Zero
emergency calls.
We are committed to responsible business practice, wherever we operate.
Sustainability
RESPONSIBLE BUSINESS
24 Telstra Annual Report

Employee Engagement
We are committed to making Telstra a
great place to work and seeking employee
feedback is an important part of the process.
Over April and May 2014, we conducted a
pulse employee engagement survey, with an
84 per cent response rate. We achieved an
engagement score of 82 per cent, putting us
five percentage points above the Australian
National Norm and within two percentage
points of the Global High Performing Norm.
The largest improvements were seen in
the areas of ethics and integrity (four per
cent improvement on 2013 survey), health
and wellbeing (two per cent improvement)
and diversity and inclusion (two per
cent improvement).
Health and Safety
The health and safety of our people
is paramount to us and is critical to
the success of our business. We have
governance structures at Board and
executive levels to guide and monitor health
and safety performance and have continued
to focus on identifying and controlling
workplace health and safety hazards and
risks. This year, Telstra categorised its
workforce into 12 main workgroups that
cover our main work activities and the risks
likely to face our employees. This approach
allows us to implement risk management
programs that address risks and reduce the
incidence and severity of workplace injuries
and illness with a particular focus in FY14
on driver safety, contractor management,
the management of asbestos, employee
wellbeing and musculoskeletal injuries.
We have managed the risk of asbestos in
our network for many years and place the
highest priority on the health and safety of
employees, contractors and members of the
public. This financial year we introduced a
number of stringent measures to improve
asbestos handling practices within Telstra
after several incidents in FY13 involving
contractors failing to meet our minimum
standards. We also implemented stronger
community engagement guidelines
to better inform the community about
work in their neighbourhoods, including
longer notification periods and improved
signage at worksites alerting residents to
asbestos-related works.
Diversity and Inclusion
Diversity and inclusion help us improve
business results, enhance our reputation,
and attract, engage and retain talented
people. Our people value working in
an organisation where differences are
respected. In addition, having a diverse
range of employees better enables us to
provide the best service to our customers.
At Telstra, the focus on diversity and
inclusion relates to differences in gender,
age, ethnicity, race, cultural background,
disability, religion and sexual orientation.
It also includes differences in background
and life experience, communication styles,
interpersonal skills, education, functional
expertise and problem solving skills.
Employee diversity and inclusion is led
by our Diversity Council, which is chaired
by the CEO and comprises the entire CEO
Leadership Team. Through this forum,
as well as performance planning and
development processes, we reinforce our
expectations of all leaders to lead in an
inclusive way and to value difference.
Our diversity policies provide the framework
for the Board to set our measurable
objectives for achieving diversity and to
assess annually our progress in achieving
them. The table on the following page
summarises, as at the end of the 2014
financial year, our measurable objectives for
achieving gender diversity set by the Board
and our progress towards achieving them.
We are working to attract and retain employees with the skills and passion to best serve our markets.
Sustainability
OUR PEOPLE
Employee Engagement (i)
(i) Telstra Group. 2013 results adjusted to exclude CSL
and Sensis Group (79% was previously reported).
FY12
77
%
FY13
80
%
FY14
82
%
FY12
1.3
2
FY13
1.3
6
FY14
1.1
2
Lost Time Injury Frequency Rate (LTIFR)(ii)
(ii) LTIFR is the reported number of accepted workers’
compensation claims for work-related injury or
disease that incur lost time for each million hours
worked. This data relates to Telstra Corporation
Limited only and does not include subsidiaries
or contractors.
EMPLOYEE ENGAGEMENT SCORE OF
ABOVE THE AUSTRALIAN NATIONAL NORM
Telstra Annual Report 25

Gender Equality
Overall female representation across the Telstra Group remained flat this year at 30.2 per cent. While we made good progress in the first half,
the result was adversely affected by the sale of our Sensis directories business which saw a reduction of 1,320 women. Last year, we reported
an over representation of women among departures from Telstra. We took local action to retain women in our business with a focus on
flexibility and career development. We have started to see a closing of the gap with female commencements now exceeding female departures.
Sustainability
OUR PEOPLE
Diversity Targets and Performance
MeasureObjective and Progress/Result
in respect of FY14 (or as otherwise stated)
Objective in respect of FY15 (or as otherwise stated)
Women on
the Board
Objective – There will be 3 women on the Board, representing a female
gender representation among non-executive Directors of at least 30%
Progress – As at 30 June 2014, there were 3 female Directors on the
Board (including the Chairman of the Board), representing a female
gender representation among non-executive Directors of 33.3%.
There will be at least 3 women
on the Board, representing a
female gender representation
among non-executive Directors
of at least 30%.
Female
representation
in graduate
intake
Objective – 45% female representation in graduate intake selected
in 2015, with an aspiration of 50% female representation by 2020
Progress – 41% female representation in graduate intake selected
in 2014.
45% female representation
in graduate intake selected in
2015, with an aspiration of 50%
female representation by 2020.
Promotion rates
for women
Objective – To exceed their representation at Business Unit level
Result – Achieved in Telstra overall and in 6 out of 9 Business Units.
To exceed their representation at
Business Unit level.
Engagement
of identified
groups(i)
Objective – Equal to or greater than Telstra-wide engagement score,
with any negative differences not statistically significant
Result – Engagement of all identified groups exceeded Telstra-wide
engagement score, except for Indigenous employees and employees
with a disability. The negative difference for employees with a disability
was statistically significant, but the score for this group was stable
compared to 2013. All other groups were more engaged than in 2013.
Equal to or greater than Telstra–
wide engagement score, with
any negative differences not
statistically significant.
Female
representation(ii)
at 30 June
Objective – FY15 – 32% (Telstra Total) and 30% (Executive
Management)
Progress – 30.1% (Telstra Total) and 25.9% (Executive Management).
FY15 – 32% (Telstra Total) and
30% (Executive Management)
FY20 – 35% (Telstra Total) and
40% (Executive Management).
(i) Identified groups are female employees, Indigenous employees, culturally and linguistically diverse employees, employees with a disability, and, gay,
lesbian, bisexual, transgender and intersex (GLBTI) employees. FY14 result does not include Chief Entertainment Pty Ltd, 02 Networks Pty Ltd and DCA
Direct Health Pty Ltd, as they did not participate in the 2014 Employee Engagement Survey.
(ii) Full time and part time staff in Telstra Corporation Limited and its wholly owned subsidiaries, excluding casual and agency staff.
We know that diversity and inclusion helps us to improve business results, enhance our reputation, and attract, engage and retain talented people.
26 Telstra Annual Report

Telstra is required by the Workplace
Gender Equality Act 2012 to report our
workforce gender profile as at 31 March
each year. Our 2014 report was lodged
with the Workplace Gender Equality
Agency on 27 May 2014 and is provided in
the corporate governance section of our
website at www.telstra.com/diversity.
Board Diversity
Information on the initiatives the
Board has in place to meet its strategic
imperative of ensuring the Company
has a diverse Board and to achieve its
Board diversity measurable objective
can be found in the Board Composition
and Director Appointment section of our
Corporate Governance Statement, which
is available on our website.
Employee Diversity and Inclusion
During the year our initiatives to enhance
diversity and inclusion at Telstra
included:
Gender equality – our CEO continued
his involvement in the Male Champions
of Change group which models
effective leadership by male executives
in relation to gender equality. Key
initiatives this year included the
“panel pledge” to increase female
representation in conference panels
and speaking opportunities and the
Plus One initiative, which encourages
managers to add at least one woman
to their teams as roles arise.
All Roles Flex – this is a company-
wide approach whereby flexibility is
now considered the starting point
for all roles. We are the first large
company in Australia to implement
such an initiative, and are committed
to ensuring our employees are
able to balance work with other
responsibilities.
Pay equity – the Board reviewed
Telstra’s remuneration philosophy and
principles to ensure they remained
aligned to our strategy and values.
A new principle was added that
specifically highlights diversity and
acknowledges Telstra’s commitment to
providing equitable and fair pay.
White Ribbon – we received formal
accreditation as a White Ribbon
Workplace recognising our work,
since 2009, in helping to stop violence
against women.
Employee Volunteering and Giving
Our employees want the opportunity to
contribute to the communities in which
they live and work. This year Telstra
people contributed more than 5,000 days
volunteering their time and expertise to a
range of community organisations across
Australia and beyond. This year our dollar
for dollar matched payroll giving resulted
in a total contribution of more than $1.4
million in donations to over 300 charities.
Representation of Women in Telstra as at 30 June 2014
Role Number Percentage
Board (i) 3 33.3%
Executive management*(ii)
CEO
CEO-1 (Band A)
CEO-2 (Band B)
CEO-3 (Band C)
68
0
3
14
51
25.9%
0%
23.1%
19.7%
28.7%
Middle management*(iii) 2,567 27.2%
Operational*(iv) 6,970 31.4%
Telstra Total* 9,605 30.1%
Telstra Group Total** 10,302 30.2%
* Includes full time, part time and casual staff in Telstra Corporation Limited and its wholly owned
subsidiaries, excluding contractors. It does not include staff in any other controlled entities within
the Telstra Group.
** Includes full time, part time and casual staff in controlled entities within the Telstra Group, excluding
contractors and agency staff.
For a list of the entities in the Telstra Group, please refer to Note 25 to the Financial Statements.
Notes:
(i) Number and percentage relate to non-executive Directors.
(ii) Executive management comprises persons holding roles within Telstra designated as Band A, B or C,
or equivalent.
(iii) Middle management comprises persons holding roles within Telstra designated as Band 1 or 2, or
equivalent.
(iv) Operational comprises persons holding roles within Telstra designated as Bands 3 or 4, or equivalent.
Sustainability
OUR PEOPLE
At Telstra, flexibility is the starting point for all roles.
Telstra Annual Report 27

Telstra Foundation
The Telstra Foundation’s social innovation
program works in partnership with
community organisations. We invest
in “tech for good” collaborations across
Australia and look to the power of smart
devices, social media, platforms and
apps to champion social change and
community connection.
This year we committed $1.1 million to four
new social innovation grants, including
the Independent Living Centre NSW
(pictured) where we explored how mobile
and tablet technologies can be used
to improve connectedness for people
with severe or profound communication
disability. According to census data this
affects 280,000 people in Australia. The
project was delivered across metropolitan,
regional and rural New South Wales in early
2014. It involved hands on workshops for
people with communication challenges
and the development of online resources to
increase awareness of assistive technologies,
including mainstream mobile and tablet
technologies, accessories and accessibility
options. Young people (aged 12 to 25) and
adults who attended the workshops were
able to trial a range of technologies including
tablets, smart phones, software and apps –
many for the first time.
This year our Executive Committee
approved a new framework to guide our
community investment approach in our
international operations. Consistent with
this, we established Telstra Foundation
Philippines to deliver on Telstra’s local
community relations responsibilities. This
is an important signal of our commitment
to expand and maintain our market
presence long term.
Digital Literacy
Being confident and literate with
technology is an essential skill in the
digital age. This year, our Everyone
Connected digital literacy programs
reached more than 143,000 people.
Our most significant digital literacy
program this year, the Tech Savvy Seniors
partnership with the New South Wales
(NSW) Government, delivered training
to around 17,000 seniors through 92
community colleges and local libraries,
particularly in regional and remote areas
of NSW. To extend the program’s reach to
as many seniors as possible, self-help
DVDs were distributed to libraries and key
community agencies. They cover subjects
such as getting started with smartphones
and tablets, social networking, and online
banking and shopping.
We use our technology, expertise, scale and presence to make a positive contribution to the community.
Sustainability
COMMUNITY IMPACT
WE REACHED
THROUGH OUR EVERYONE CONNECTED DIGITAL LITERACY PROGRAMS
SEV AND SHIRL
AMBASSADORS FOR THE ILC NSW'S EVERYONE CONNECTS WORKSHOPS
28 Telstra Annual Report

eSmart Libraries
In August 2012, we launched eSmart
Libraries, a multi year, $8 million
partnership between the Telstra
Foundation and The Alannah and
Madeline Foundation. This world-leading
cyber safety program is designed to better
equip Australia’s 1,500 public libraries to
support library users with the skills they
need for smart, safe and responsible
use of technology. To date, more than a
third of public libraries across Australia
(approximately 500 libraries) have started
the eSmart journey, exceeding our FY14
target of 260.
Indigenous Communities
This year, we announced a new $5 million,
multi year partnership with the National
Centre of Indigenous Excellence (NCIE) to
create an Indigenous Digital Excellence
Initiative to develop platforms, apps,
programs and events to improve community
wellbeing. The partnership will support
Aboriginal and Torres Strait Islander peoples
to take their next digital step – whether
it’s enjoying the strength of connections
through purpose built online networks and
apps or running an online business.
Disaster Relief and Recovery
In times of natural disaster, our
technicians are often among the first
to enter affected areas. Our priorities
include assisting emergency and
essential services organisations with
their telecommunications requirements
and restoring services to our customers.
Along with technical support, we provide
telecommunications services such as
temporary internet access and loan
handsets to evacuation centres. We
also support affected residential and
small business customers through relief
assistance packages.
In FY14, Telstra provided assistance
following four natural disasters across
Australia. We also improved the Emergency
Alert System, the first of its kind in the
world, to enable disaster warning messages
to be sent to Telstra 4G handsets in areas
covered by our 4G network. Since its
introduction, location-based emergency
alerts have been used almost 320 times,
and the system has successfully issued
more than 1.3 million messages.
This year we also assisted almost 17,000
customers wishing to check on family and
friends affected by Typhoon Haiyan in the
Philippines. For two weeks, voice calls and
SMS were provided free to the Philippines
for Telstra fixed line and post-paid mobile
customers and pre-paid customers were
reimbursed. Telstra was the first telco
worldwide to respond with an offer of
this kind.
We invested $217 million in the community in FY14.
Everyone Connected 89.7%
$194.2MCustomer and community digital
inclusion programs focused on
access, digital literacy, cyber
safety and digital innovation.
Disaster relief 0.6%
$1.3MCustomer and community
measures, including disaster
relief credits and free
payphones for use in disaster
affected areas.Employee volunteering
and giving 2.0%
$4.3MValue of employee volunteering,
matched payroll giving (regular
and disaster relief), fundraising
and Telstra Kids Fund.
Sponsorship 7.7%
$16.7MHigh profile national and other
local community sponsorships.
Breakdown of Social and Community Investment in FY14
$217 MILLION INVESTED
Sustainability
COMMUNITY IMPACT
Telstra Annual Report 29

Environment Strategy
Telstra’s new Environment Strategy
signals an important step change in our
approach to environmental management.
It builds on and extends our existing
programs to manage and minimise the
environmental impacts across our value
chain. It is focused on addressing the
environmental issues that matter most
to our stakeholders, and is aligned to
Telstra’s purpose and values. Specifically
it focuses on:
Operational Excellence – actively
identifying and minimising material
environmental impacts and operating
costs.
Sustainable Supply Chain – working
with and influencing suppliers to
manage and reduce the environmental
and social impacts of their operations
and of the products and services they
provide to Telstra.
Environmental Customer Value
Proposition (ECVP) – embedding
environmental considerations into the
development of products and services.
The strategy was informed by a detailed
identification and assessment of the
material environmental risks and impacts
of our operations, our products and
services, and our supply chain.
Energy Efficiency and Carbon Emissions
Energy use in our networks is our
most material environmental impact,
accounting for around 86 per cent of our
total carbon emissions (Scope 1, 2 and
3) in FY14. Large amounts of energy are
required to power our network equipment
and keep it at an optimum operating
temperature. In FY14, Telstra used almost
six million gigajoules of energy.
As data volumes continue to increase – 39
per cent in the 2014 financial year – we
are improving the utilisation and efficiency
of our network equipment. This year we
achieved a 30 per cent decrease in carbon
emissions intensity (tCO2e per terabyte of
data) from the previous year, surpassing our
15 per cent reduction target.
Consistent with our aspiration to become
an Australian environmental leader, we
have set a longer term target to reduce our
carbon emissions intensity by 55 per cent
over the three year period from FY15 to
FY17, from a baseline year of FY14.
Total emissions (Scope 1, 2 and 3) have
decreased 2.5 per cent over the reporting
period as a result of a program of works to
improve our carbon and energy efficiency
as well as reduced emission factors
published by the Federal Government.
Emission factors were reduced due to
changes in Australia’s electricity generation
mix, such as increased generation from
renewable energy sources. The change in
emission factors between FY13 and FY14
led to a decrease in our reported emissions
of approximately 36,000 tCO2e.
We are three years into a five year, $41.3
million capital investment program
aimed at improving energy efficiency
and reducing the carbon intensity of our
network and data centre facilities.
Telstra’s new Environment Strategy signals an important step change in our approach to environmental management.
Sustainability
ENVIRONMENTAL STEWARDSHIP
Total Carbon Emissions(i) (Scope 1, 2 & 3)
Tonnes of carbon dioxide equivalent (tCO
2e)
(i) Australian operations for Telstra Corporation
Limited. This includes relevant Australian
subsidiaries, joint ventures and partnerships.
Sensis Group has been included from
1 July 2013 until 28 February 2014.
1,6
76
,92
5
FY12
1,6
33
,71
2
FY13
1,5
92
,37
6
FY14
Carbon Emissions Intensity (ii)
Tonnes of carbon dioxide equivalent per terabyte (tCO
2e/TB)
(ii) Australian operations for Telstra Corporation
Limited. This includes relevant Australian
subsidiaries, joint ventures and partnerships.
Sensis Group has been included from
1 July 2013 until 28 February 2014.
FY12
1.2
4
FY13
0.8
3
FY14
0.5
8
WE ACHIEVED A REDUCTION OF
IN CARBON EMISSIONS INTENSITY
30 Telstra Annual Report

We have spent $29 million to date,
including $6 million in FY14, on initiatives
that will deliver positive net present
value outcomes. Projects are focused on
delivering energy efficient air conditioning
solutions, decommissioning old and
redundant equipment and integrating
energy efficiency measures into existing
capital work projects. A further $6 million
is committed for next financial year.
Collectively, the initiatives completed in
FY14 have reduced carbon emissions by
36,824 tCO2e and saved over 35,000MWh
of electricity consumption in FY14.
Thought Leadership
We believe that the information and
communications technology (ICT)
sector is in an ideal position to support
government, businesses and consumers
to reduce their energy consumption,
leading to considerable cost savings
and reduced greenhouse gas emissions.
To explore this potential, this year we
released a report, Connecting with a Low
Carbon Future, that examines the role of
technology in unlocking the benefits of a
low carbon economy.
Building on the findings from our 2007
Climate Risk report, Connecting with
a Low Carbon Future found that if ICT
opportunities such as remote appliance
power management, decentralised
working and real time fleet management
are realised, they could help Australians to
achieve cost savings of almost $8.1 billion
per year while cutting national carbon
emissions by 4.7 per cent.
Paper Use – Directories
Yellow Pages* and White Pages* (print
and online) have received carbon neutral
certification through Low Carbon Australia
since February 2010. We offset our FY13
emissions by purchasing, in December
2013, 54,009 tonnes of offsets from three
carbon reduction projects located in India
and China.
In February 2014, we sold a 70 per cent
stake in our Sensis directories business.
Sensis will continue to produce and
distribute the White Pages for Telstra.
Office, Billing and Printing Paper
We reduced our total paper usage by
more than 15 per cent this year due
to our focus on producing online and
digital content. Paper used to print bills
continues to reduce as more customers
opt for online billing and a greater
proportion of online advertising has
reduced our need to print information
flyers and brochures. Our “follow me”
printing initiative continues to be rolled
out across our largest corporate offices.
This initiative enables employees to
print from almost any device, using their
building access cards to activate printing
and has led to a 12 per cent reduction in
office paper use.
E-waste
E-waste is an important element of
Telstra’s Environment Strategy. We
collected 1,978 tonnes of e-waste this
year, including 15 tonnes from a waste
management initiative in our commercial
offices and buildings. We also assist
our customers to deal more effectively
with e-waste. Throughout FY14 we
collected 15.3 tonnes of mobile phones
and accessories from Telstra retail stores,
offices and repair centres through the
MobileMuster program, a nine per cent
increase in collections for the year.
Sustainability
ENVIRONMENTAL STEWARDSHIP
GAVIN KNIGHT AND ANTHONY QUAYLE, TELSTRA OPERATIONS
GREENSBOROUGH EXCHANGE, MELBOURNE
We are committed to minimising our environmental impacts and working with our customers to achieve better environmental outcomes.
Telstra Annual Report 31

Ms Livingstone has been a non-executive Director since
November 2000, was appointed as Chairman in May
2009 and was last re-elected in 2011. She is Chairman
of the Nomination Committee and a member of the
Audit & Risk Committee and the Remuneration
Committee. Ms Livingstone is a Chartered Accountant
and has held several finance and general management
roles primarily in the medical devices sector.
Ms Livingstone was the Chief Executive of Cochlear
Limited from 1994 to 2000. She was Chairman of CSIRO
from 2001 to 2006 and has also served on the boards of
Goodman Fielder Limited and Rural Press Limited. In
2008, Ms Livingstone was appointed an Officer of the
Order of Australia for service to the development of
Australian science, technology and innovation policies
to the business sector. In 2014, Ms Livingstone was
appointed President of the Business Council of Australia.
Other listed company directorships in the past
three years:
Director, WorleyParsons Limited (from 2007), Macquarie
Bank Limited (2003-2013) and Macquarie Group Limited
(2007-2013).
Other directorships/appointments :
President, Business Council of Australia (from 2014) and
President, Australian Museum Trust (from 2012); Member,
Advisory Board for the John Grill Centre for Project
Leadership at University of Sydney (from 2013); Director,
The George Institute for Global Health (from 2012) and
Saluda Medical Pty Ltd (from 2013).
Catherine B Livingstone AO BA (Hons), Hon DBus (Macquarie), Hon DSc (Murdoch), FCA, FTSE, FAICD, FAA
David I Thodey BA, FAICD
Geoffrey A Cousins AM
Mr Cousins has been a non-executive Director since
November 2006 and was last re-elected in 2012.
He is a member of the Nomination Committee and the
Remuneration Committee. Mr Cousins has more than
26 years’ experience as a company director. Previously
Chairman of George Patterson Australia, he is also
a former Director of Publishing and Broadcasting
Limited, the Seven Network, Hoyts Cinemas group and
NM Rothschild & Sons Limited. He was the first Chief
Executive of Optus Vision and before that held a number
of executive positions at George Patterson, including
Chief Executive of George Patterson Australia.
In 2014, Mr Cousins was appointed a Member of
the Order of Australia for significant services to the
community and to the visual and performing arts.
Mr Cousins was previously a consultant to the
Prime Minister. He was also Chairman of Cure
Cancer Australia and has served on the boards of the
Insurance Australia Group Ltd, Globe International
Limited and a number of cultural institutions and not
for profit foundations.
Other directorships/appointments:
Chairman, St James Ethics Foundation (from 2010).
Russell A Higgins AO BEc, FAICD
Mr Higgins has been a non-executive Director since
September 2009 and was last re-elected in 2012. He
is a member of the Audit & Risk Committee. Mr Higgins
is an experienced company director who has worked
at very senior levels of both government and private
sectors. He has served on the boards of a wide range
of listed companies, private companies, government
business enterprises and international organisations,
including as Chairman of the Snowy Mountains Hydro
Electric Scheme and the Global Carbon Capture and
Storage Institute. From 2003 to 2004, he was Chairman
of the then Prime Minister’s Energy Task Force and prior
to that he was Secretary of the Department of Industry,
Science and Resources.
Other listed company directorships in the past
three years:
Director, APA Group (from 2004), Argo Investments
Limited (from 2011), Leighton Holdings Limited (2013-
2014) and Ricegrowers Limited (SunRice) (2005-2012).
Other directorships/appointments:
Director, St. James Ethics Foundation (from 2010).
Chin Hu LimB Applied Science, Dip EEE
Mr Lim was appointed as a non-executive Director on
9 August 2013 and elected in October 2013.
Mr Lim is an experienced company director and has
almost 30 years of experience in the technology
sector across the Asia Pacific Region. He is the
Managing Partner of Stream Global Pte Ltd, a venture
fund providing seed funding for technology start
ups. He was CEO of Frontline Technologies Corp
Inc., a Singapore Exchange listed company, from
2000 to 2008 and BT South East Asia from 2010 to
2011. Previously he was Managing Director for Sun
Microsystems in Singapore and country director
for Sun in Thailand, Indonesia, the Philippines and
Vietnam during the 1990s, after a career in Hewlett
Packard in the 1980s.
Other listed company directorships in the past
three years:
Kulicke & Soffa Industries Inc (NASDAQ: KLIC) (from
2011).
Other directorships/appointments:
Director, Heliconia Capital Management Pte Ltd
(from 2014), Citibank Singapore Ltd (from 2013),
G-Able (Thailand) Ltd (from 2011) and Changi General
Hospital & Integrated Health Information Systems
(from 2009); Fellow and Council member of Singapore
Institute of Directors (from 2012) and Infocomm
Development Authority – Personal Data Protection
Advisory Committee (from 2013).
BOARD OF DIRECTORS
Mr Thodey became Chief Executive Officer and an
executive Director in May 2009.
Mr Thodey joined Telstra in April 2001 as Group
Managing Director of Telstra Mobiles and in December
2002 was appointed as Group Managing Director Telstra
Enterprise and Government where he was responsible
for the Company's corporate, government and large
business customers in Australia, TelstraClear in New
Zealand and Telstra's International sales division. Before
joining Telstra, Mr Thodey was Chief Executive Officer of
IBM Australia/New Zealand and previously held several
senior executive positions in marketing and sales with
IBM across the Asia Pacific. Mr Thodey holds a Bachelor
of Arts in Anthropology and English from Victoria
University in New Zealand and attended the Kellogg
Post-Graduate School General Management Program
at Northwestern University in Chicago.
In January 2013, Mr Thodey joined the Board of the GSM
Association, the global body made up of carriers and
related companies that supports the standardisation
and deployment of mobile technology around the world.
He is also co-chair of the Infrastructure and Investment
Taskforce of the Australian B20 leadership group – the
business advisory forum of the G20.
32 Telstra Annual Report

BOARD OF DIRECTORS
John P Mullen
Mr Mullen has been a non-executive Director since July
2008 and was last re-elected in 2011. He is Chairman of
the Remuneration Committee and a member of the
Nomination Committee.
Mr Mullen is the Managing Director and Chief Executive
Officer of Asciano Ltd and has served in that role since
2011. He has worked for over two decades in a multitude
of senior positions with different multinationals including
10 years with the TNT Group, two years of those as its Chief
Operating Officer. From 1991 to 1994, he held the position
of Chief Executive Officer of TNT Express Worldwide. Mr
Mullen joined Deutsche Post World Net (DPWN) as an
Advisor in 1994, becoming Chief Executive Officer of DHL
Express Asia Pacific in 2002 and Joint Chief Executive
Officer, DHL Express, in 2005. Mr Mullen was Global
Chief Executive Officer, DHL Express, from 2006 to 2009.
Other listed company directorships in the past
three years:
Director, Asciano Ltd (from 2011), Brambles Limited
(2009-2011), Embarq Corporation USA (2006-2009)
and MAp Airports Limited (2010-2011).
Other directorships/appointments:
Member, Australian Graduate School of Management
(from 2005).
Nora L Scheinkestel LLB(Hons), PhD, FAICD
Ms Seale was appointed as a non-executive Director in
May 2012 and subsequently elected in October 2012.
She is a member of the Audit & Risk Committee.
Ms Seale has over 20 years experience in senior
executive roles in Australia and overseas, including
in global publishing and the transition of traditional
business models to adapt and thrive in a digital
environment, as well as sales and marketing. Most
recently she was Managing Director of Random House,
Australia (with managerial responsibility for Random
House New Zealand) and President, Asia Development
for Random House Inc, the global company. Previously,
she was Chief Executive Officer for The Macquarie
Dictionary and Lansdowne Publishing, from 1997 to
1999. Ms Seale was the Chief Executive Officer of the
Juvenile Diabetes Research Foundation from 1994 to
1997. She also served on the boards of the Australian
Publishers Association and the Powerhouse Museum,
and on the Council of Chief Executive Women, chairing
its Scholarship Committee from 2011 to 2012.
Other listed company directorships in the past
three years:
Director, Bank of Queensland Limited (from 2014).
Other directorships/appointments:
Director, Random House Australia, New Zealand
(from 2001) .
Margaret L SealeBA, FAICD
Steven M Vamos BEng (Hons)
Mr Vamos joined the Telstra Board as a non-executive
Director in September 2009 and was last re-elected
in 2012. He is a member of the Nomination Committee
and the Remuneration Committee.
Mr Vamos has over 30 years experience in the
information technology, internet and online media
industry. He led Microsoft Australia and New Zealand
from 2003 to January 2007 before moving to the United
States to become the company’s online business
head of worldwide sales and international operations.
Previously, he was Chief Executive Officer of ninemsn.
Mr Vamos also worked for Apple Computer in the
1990s after spending 14 years in senior management
roles at IBM Australia. He is the founding President
of the Society for Knowledge Economics (SKE), a not-
for-profit think tank that encourages new and better
practices in leadership and management.
Other listed company directorships in the past
three years:
Director, David Jones (2012-2014).
Other directorships/appointments:
President, Society for Knowledge Economics (from
2005); Director, Reading Room, Inc (from 2013), BDB
Soti Pty Ltd (from 2012) and eGeneration Investments
Pty Limited (from 1999). Former-Director, Medibank
Private Limited (2011-2014).
John D Zeglis BSc Finance, JD Law
Mr Zeglis has been a non-executive Director since May
2006 and was last re-elected in 2012.
Mr Zeglis has had a long and distinguished career in the
US telecommunications sector. He joined AT&T in 1984,
and was elected its President in 1998 and Chairman
and Chief Executive Officer of the AT&T Wireless Group
in 1999. He continued as CEO of AT&T Wireless until
retiring in November 2004 following the company’s sale
to Cingular Wireless. He has also served on the boards
of Georgia Pacific Corporation, Illinois Power Company
and Sara Lee Corporation.
Mr Zeglis has a legal background and became
partner with the law firm Sidley & Austin in 1978.
He was General Counsel of AT&T from 1986 to 1998.
His qualifications include a BSc in Finance from the
University of Illinois, and a JD in Law from Harvard.
Other listed company directorships in the past
three years:
Director, Helmerich & Payne Corporation (from 1989).
Other directorships/appointments:
Director, The Duchossois Group (from 2011) and State
Farm Automobile Insurance (from 2004).
Dr Scheinkestel has been a non-executive Director
since August 2010 and was last re-elected in 2013.
She is Chairman of the Audit & Risk Committee.
Dr Scheinkestel is an experienced company director
with a background as a senior banking executive in
international and project financing. She currently
consults to government, corporate and institutional
clients in areas such as corporate governance, strategy
and finance. She is also an Associate Professor in the
Melbourne Business School at Melbourne University
and is a member of the Takeovers Panel. Dr Scheinkestel
has held a number of roles in the utility sector, including
Chairman and non-executive director of Victorian and
national water and energy companies. She has also
served on a range of public and private sector boards
including, more recently, AMP Limited and its funds
management and banking subsidiaries, Mayne Group
Limited and Mayne Pharma Limited, Medical Benefits
Fund of Australia Ltd, Newcrest Mining Limited and
North Limited. In 2003, Dr Scheinkestel was awarded
a centenary medal for services to Australian society in
business leadership.
Other listed company directorships in the past
three years:
Director, Insurance Australia Group Limited (from 2013),
Orica Limited (from 2006), Pacific Brands Limited (2009-
2013) and AMP Limited (2003-2013).
Telstra Annual Report 33

David I Thodey
Chief Executive Officer
Mr Thodey became Chief Executive Officer in May 2009.
Tony Warren Group Executive, Corporate Affairs
Corporate Affairs is responsible for Telstra’s communications, government relations, regulatory affairs, sustainability (including the Telstra Foundation) and negotiating changes to Telstra’s agreements with NBN Co and the Commonwealth as a result of changes to government policy.
Gordon Ballantyne Group Executive, Telstra Retail
Telstra Retail brings together Telstra’s core domestic activities, covering consumer, business, sales and marketing, fixed and mobiles, our National Broadband Network and media products, and our eHealth function.
Carmel Mulhern Group General Counsel, Telstra Legal Services
Telstra Legal Services provides operational and strategic legal support and advice to the Board and across the company, including on corporate governance and compliance, contracts, consumer law, mergers and acquisitions, regulatory issues and dispute resolution.
Robert Nason Group Executive, Business Support and Improvement
Business Support and Improvement is responsible for driving change that improves the customer experience and delivering Telstra-wide productivity improvements, as well as for credit management, billing and procurement.
Tracey Gavegan Group Executive, Human Resources
Human Resources is responsible for organisational effectiveness and capability; talent, leadership and succession management; people and culture initiatives; health, safety and environment, workplace relations and all employment and remuneration policies and practices that work towards making Telstra a great place to work and its people a source of competitive advantage.
Andrew Penn Chief Financial Officer and Group Executive, International
Finance and Strategy is responsible for corporate planning and strategy, accounting and administration, treasury, risk management and assurance, corporate security, investor relations, and mergers and acquisitions. International is responsible for development of Telstra operations and activities outside of Australia.
Stuart Lee Group Executive, Telstra Wholesale
Telstra Wholesale is responsible for the provision of a wide range of products and services delivered over Telstra networks to non Telstra branded service providers and NBN Co. Telstra Wholesale also buys services from NBN Co and other carriers on behalf of the company.
Brendon Riley Group Executive, Global Enterprise and Services
Global Enterprise and Services brings together a number of rapidly growing portfolio areas and operates as a global-scale, industry-based services and solutions business.
Kate McKenzie Chief Operations Officer, Telstra Operations
Telstra Operations is responsible for the planning, design, engineering, construction, operation, maintenance and restoration of Telstra’s networks. The group is also responsible for information technology and the company’s innovation portfolio.
Timothy Chen President, Telstra International
Mr Chen’s role is focused on key relationships and identifying significant growth opportunities throughout Asia, with a particular emphasis on Greater China.
SENIOR MANAGEMENT TEAM
34 Telstra Annual Report

Telstra Board
Audit & Risk Committee
Remuneration Committee
Nomination Committee
We are committed to excellence in
corporate governance, transparency and
accountability. This is essential for the
long term performance and sustainability
of our Company, and to protect and
enhance the interests of our shareholders
and other stakeholders.
Our governance framework plays an
integral role in supporting our business
and helping us deliver on our strategy. It
provides the structure through which our
strategy and business objectives are set,
our performance is monitored, and the
risks we face are managed. It includes a
clear framework for decision making and
accountability across our business and
provides guidance on the standards of
behaviour we expect of our people.
We regularly review our governance
arrangements as well as developments
in market practice, expectations and
regulation. We have decided to early-
adopt the third edition of the ASX
Corporate Governance Principles and
Recommendations and have reviewed and
updated our governance and reporting
practices to reflect this.
This section outlines some of the more
significant aspects of governance at Telstra.
Our full corporate governance statement
is available on our website at www.telstra.
com/governance. We discuss our approach
to risk management and assurance at
Telstra in the Strategy and Performance
(Managing our risks) section of this Annual
Report, and diversity and inclusion in the
Sustainability (Our people) section.
GOVERNANCE AT TELSTRA
Chief Executive Officer
Our People
ShareholdersOur governance framework includes:
Open, clear and timely communications
with our shareholders
A skilled, experienced, diverse and
independent Board, with a Board
Committee structure suited to our
needs
Clear delegation, decision making and
accountability frameworks
Robust systems of risk management
and assurance
Telstra Values, Code of Conduct and
policy framework providing guidance on
the standards of behaviour we expect
of our people, to help us deliver on our
purpose and achieve our strategy.
Telstra Annual Report 35

Engaging with our Shareholders
We are committed to open, clear and
timely communications with our
shareholders and investors about matters
affecting the value of their investment in
Telstra. We also recognise the importance
of meeting our continuous disclosure and
other legal obligations to the market.
We value a direct, two-way dialogue
with shareholders and investors. We
believe it is important not only to provide
relevant information as quickly and
efficiently as possible, but also to listen
to and understand their perspectives and
respond to their feedback.
We have implemented a program to
promote effective communication
with our shareholders and investors,
and to encourage participation at our
shareholder meetings. We webcast
important events such as our financial
results briefings, our annual general
meeting and other investor events
discussing the performance and strategy
for different parts of our business. We also
host, around Australia, a series of retail
shareholder information briefings with the
CEO and/or CFO prior to our AGM.
The Board
The Board is responsible for managing
Telstra’s business, and is accountable
to shareholders in performing that role.
The Board’s key responsibilities include
approving our strategy and corporate plan
and monitoring the implementation of
our strategy and performance against the
corporate plan. The Board also monitors
and influences our culture, reputation,
ethical standards and legal compliance.
Decision making authority on a number
of significant matters is reserved to
the Board. Outside of those areas, the
CEO is responsible for the day-to-
day management of Telstra. The CEO,
together with the senior management
team, is responsible to the Board for the
development and implementation of our
strategy and the overall management and
performance of our Company.
The Board actively seeks to ensure that
it has an appropriate mix of diversity
(including gender diversity), skills,
experience and expertise to enable
it to discharge its responsibilities
effectively and to be well equipped to
help our Company navigate the range of
opportunities and challenges we face.
Our process for the selection, nomination
and appointment of Directors involves
a formal selection process undertaken
by the Board, and an executive search
firm is generally engaged to assist in
the process. As part of this process, the
Board establishes criteria about the
general qualifications and experience, as
well as the specific qualifications, that
a candidate should possess. We also
undertake appropriate checks on any
potential candidates before a person is
appointed by the Board or put forward to
shareholders as a candidate for election
as a Director.
A recommendation to re-elect a Director
at the end of their term is not automatic.
Before each AGM, the Board determines if
it will recommend that shareholders vote
in favour of the re-election of the Directors
standing for re-election. This decision is
made by the Board, having regard to the
outcome of the annual Board performance
review and any other matters it considers
relevant.
The Board also recognises the important
contribution that independent Directors
make to good corporate governance.
The Board intends that the CEO is the
only executive Director and that all
non-executive Directors should also
be independent Directors. All Directors,
whether independent or not, are required
to act in the best interests of Telstra and
to exercise unfettered and independent
judgement.
There are currently ten Directors on the
Board, comprising nine non-executive
Directors and the CEO. With the exception
of the CEO, all Directors are non-executive
Directors and have been determined by
the Board to be independent. Details of
the Directors can be found in the Board of
Directors section of this report.
During FY14, one new non-executive
Director, Mr Chin Hu Lim, was appointed
to the Board. The Board determined
that it would benefit from additional
deep experience in Asia, and in network
applications. Following an extensive
formal search process, Mr Lim was
identified as a candidate with the required
skills and experience. He was appointed to
the Board in August 2013 and was elected
by shareholders at our 2013 AGM.
GOVERNANCE AT TELSTRA
36 Telstra Annual Report
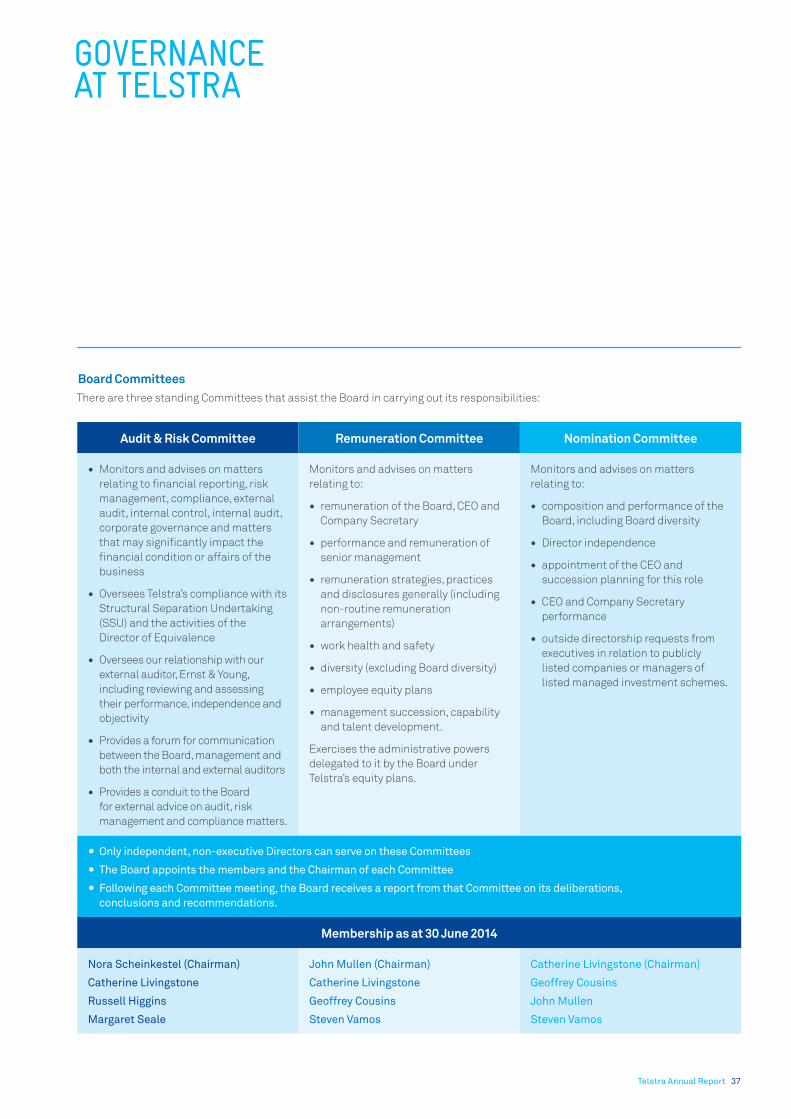
Board Committees
There are three standing Committees that assist the Board in carrying out its responsibilities:
GOVERNANCE AT TELSTRA
Audit & Risk Committee Remuneration Committee Nomination Committee
Monitors and advises on matters
relating to financial reporting, risk
management, compliance, external
audit, internal control, internal audit,
corporate governance and matters
that may significantly impact the
financial condition or affairs of the
business
Oversees Telstra’s compliance with its
Structural Separation Undertaking
(SSU) and the activities of the
Director of Equivalence
Oversees our relationship with our
external auditor, Ernst & Young,
including reviewing and assessing
their performance, independence and
objectivity
Provides a forum for communication
between the Board, management and
both the internal and external auditors
Provides a conduit to the Board
for external advice on audit, risk
management and compliance matters.
Monitors and advises on matters
relating to:
remuneration of the Board, CEO and
Company Secretary
performance and remuneration of
senior management
remuneration strategies, practices
and disclosures generally (including
non-routine remuneration
arrangements)
work health and safety
diversity (excluding Board diversity)
employee equity plans
management succession, capability
and talent development.
Exercises the administrative powers
delegated to it by the Board under
Telstra’s equity plans.
Monitors and advises on matters
relating to:
composition and performance of the
Board, including Board diversity
Director independence
appointment of the CEO and
succession planning for this role
CEO and Company Secretary
performance
outside directorship requests from
executives in relation to publicly
listed companies or managers of
listed managed investment schemes.
Only independent, non-executive Directors can serve on these Committees
The Board appoints the members and the Chairman of each Committee
Following each Committee meeting, the Board receives a report from that Committee on its deliberations,
conclusions and recommendations.
Membership as at 30 June 2014
Nora Scheinkestel (Chairman)
Catherine Livingstone
Russell Higgins
Margaret Seale
John Mullen (Chairman)
Catherine Livingstone
Geoffrey Cousins
Steven Vamos
Catherine Livingstone (Chairman)
Geoffrey Cousins
John Mullen
Steven Vamos
Telstra Annual Report 37

GOVERNANCE AT TELSTRA
Our Strategy Where we are going What we are going to do
Our Values What we stand for How we do things
Our Purpose Why we exist
Acting Ethically and Responsibly
Our purpose is to create a brilliant
connected future for everyone. Our Telstra
Values, together with our Telstra Group
Code of Conduct and policy framework,
define the standards of behaviour we
expect of our people and will help us deliver
on our purpose and achieve our strategy.
Our Telstra Values
At Telstra, we have five core values.
1. Show you care
2. Better together
3. Trust each other to deliver
4. Make the complex simple
5. Find your courage
Our values express what we stand for and
guide the way we do things. Our values
are core to our business and we align
everything we do with them.
Our Code of Conduct and
Policy Framework
Our Code of Conduct and policy
framework underpin our Telstra Values.
Together they set out, in more detail, the
standards of behaviour we expect of our
people. They define our commitment to
good corporate governance, responsible
business practice, our customers, our
workforce, the communities in which
we operate and the environment.
They also provide the structure through
which we maintain compliance with our
legal obligations.
Our governance framework includes
elements that address the following
key areas, which are central to how
we promote ethical and responsible
behaviour:
Our People and Our Community
Health and Safety – recognising our
commitment to the health, safety and
wellbeing of our staff, contractors
and community. This highlights the
importance of workplace health
and safety and sets out the priority,
accountability, measurement and our
commitment to compliance for health
and safety at Telstra.
Diversity – setting out our strategy
and principles in relation to diversity.
This provides the framework for the
establishment of our diversity measurable
objectives, and monitoring and reporting
on diversity matters across Telstra.
Discrimination and Bullying – aiming
to ensure that we have a workplace free
of all forms of unlawful discrimination,
harassment, bullying and victimisation.
Sustainability – seeking to manage our
business to produce an overall positive
impact on our customers, employees,
shareholders, the wider community and
other stakeholders, while minimising our
environmental impacts.
Our Customers
Privacy – setting out our commitment to
the protection of our customers’ personal
information. This outlines how we protect
customer personal information, how and
why we collect it, how we may use and
disclose it, how we keep it secure and
accurate, and how customers may access
their personal information.
Good corporate governance and
responsible business practice
Anti-Bribery and Anti-Corruption – aiming
to ensure we comply with applicable
anti-bribery and anti-corruption laws.
We also seek to ensure that gifts, prizes
and hospitality are not accepted in
inappropriate circumstances, including
where acceptance may (or may be
perceived to) compromise independence
or be construed as a bribe.
Conflicts of Interest and Outside
Activities – assisting our employees
and contractors to understand what we
consider to be a conflict of interest and
how to avoid actual, potential or apparent
conflicts of interest.
Whistleblowing – providing an avenue
for anyone to report suspected unethical,
illegal or improper behaviour. Our
whistleblowing process is supported by
an independent service provider and all
disclosures are treated confidentially and
can be made anonymously.
Securities Trading – setting out the rules
and restrictions relating to buying, selling
and otherwise dealing in Telstra securities
by our Directors, CEO, senior management,
specified other employees and their
closely related parties, through a trading
windows approach.
Market Disclosure – outlining
responsibilities and the process for the
approval of our ASX announcements,
including where Board approval is
required, as well as the role of our
CEO, CFO and Continuous Disclosure
Committee in relation to disclosure
matters. We aim to ensure that we provide
our shareholders, investors and the
financial community with appropriate and
timely information while ensuring that we
fulfil our statutory reporting obligations
under the Corporations Act and the ASX
Listing Rules.
Telstra's 3Rs of Social Media Engagement
(Representation, Responsibility and
Respect) – providing guidance to
employees and contractors who use social
media, either as part of their job or in a
personal capacity, about our expectations
when they talk online about us, our
products and services, our people, our
competitors and/or other business related
individuals or organisations.
38 Telstra Annual Report

DIRECTORS'REPORT
Telstra Corporation Limited and controlled entitiesTelstra Annual Report 39
In accordance with a resolution of the Board, the Directors present
their report on the consolidated entity (Telstra Group) consisting
of Telstra Corporation Limited (Telstra) and the entities it
controlled at the end of, or during the year ended, 30 June 2014.
Financial comparisons used in this report are of results for the
year ended 30 June 2014 compared with the year ended 30 June
2013.
The historical financial information included in this Directors’
Report has been extracted from the audited Financial Report on
pages 65 to 195 of the Annual Report accompanying this Directors’
Report.
Principal activity
Our principal activity during the financial year was to provide
telecommunications and information services for domestic and
international customers. There has been no significant change in
the nature of this activity during the year.
Review and results of operations
Information on the operations and financial position for the
Telstra Group is set out in our Operating and Financial Review
(OFR), consisting of Our Business, Key Highlights, Chairman and
CEO Message, Strategy and Performance and Full Year Results
and Operations Review from the inside cover to page 21 of this
Annual Report.
Dividends
On 14 August 2014, the Directors resolved to pay a final fully
franked dividend of 15.0 cents per ordinary share ($1,866 million),
bringing dividends per share for financial year 2014 to 29.5 cents
per share. The record date for the final dividend will be 29 August
2014, with payment being made on 26 September 2014. Shares
will trade excluding entitlement to the dividend on 27 August
2014.
Dividends paid during the year were as follows:
Capital management
On 14 August 2014, our Board resolved to undertake an off market
share buy-back of up to approximately $1 billion. The share buy-
back will be available to eligible shareholders and implemented by
way of a tender process and at a discount to market price. The
shares bought back will be cancelled by the Company, reducing
the number of shares the Company has on issue. The buy-back will
be funded by accumulated cash surplus in the Company and will
be made up of a capital and a dividend component. The dividend
component will be fully franked and our estimate of the decrease
in franking credits is $243 million, based on the assumption of
Testra’s ASX listed share price of $5.30, buy-back discount of 10%
and a non-resident shareholding of 21.8%.
Significant changes in the state of affairs
There were no significant changes in the state of affairs of our
company during the financial year ended 30 June 2014.
DividendDate
resolved
Date
paid
Fully
franked
dividend
per share
Total
dividend
($ million)
Final dividend for
the year ended
30 June 2013
8 Aug
2013
20 Sep
201314 cents 1,742
Interim dividend
for the year ended
30 June 2014
13 Feb
2014
28 March
201414.5 cents 1,803

DIRECTORS’ REPORT
Telstra Corporation Limited and controlled entities40 Telstra Annual Report
Business strategies, prospects and likely developments
The OFR sets out information on the business strategies and
prospects for future financial years, and refers to likely
developments in Telstra's operations and the expected results of
those operations in future financial years (see Our Business, Key
Highlights, Chairman and CEO Message, Strategy and
Performance and Full Year Results and Operations Review from
the inside cover to page 21 of this Annual Report). Information in
the OFR is provided to enable shareholders to make informed
assessment about the business strategies and prospects for
future financial years of the Telstra Group. Detail that could give
rise to likely material detriment to Telstra (for example,
information that is commercially sensitive, is confidential or could
give a third party a commercial advantage) has not been included.
Other than the information set out in the OFR, information about
other likely developments in Telstra's operations and the expected
results of these operations in future financial years has not been
included.
Events occurring after the end of the financial year
Apart from the final dividend for financial year 2014 and the share
buy-back, the Directors are not aware of any matter or
circumstance that has arisen since the end of the financial year,
that, in their opinion, has significantly affected, or may
significantly affect in future years, Telstra’s operations, the
results of those operations or the state of Telstra’s affairs.
Details of Directors and executives
The only change to the Directors of Telstra Corporation Limited
during the financial year and up to the date of this report was:
• Chin Hu Lim was appointed as a non-executive Director
effective 9 August 2013.
With effect from 15 August 2014 Peter Hearl will be appointed as
a non-executive Director. Mr Hearl will stand for election at
Telstra’s Annual General Meeting in Brisbane on 14 October 2014.
Information about our Directors and senior executives is provided
as follows:
• names of our current Directors and details of their
qualifications, experience, special responsibilities and
directorships of other listed companies are given in Board of
Directors on pages 32 to 33 of this Annual Report
• details of Director and senior executive remuneration are set
out in the Remuneration Report on pages 44 to 63 and forms
part of this Directors’ Report.
Details of Directors’ shareholdings in Telstra are shown in the
table below.
Directors’ shareholdings in Telstra
As at 14 August 2014:
(1) The number of shares held refers to shares held either directly or indirectly by Directors as at 14 August 2014. Shares in which the Director does not have a relevant interest, including shares held by the Directors’ related parties (including relatives), are excluded. Refer to the Remuneration Report (Table 5.8) for total shares held by Directors, representing those shares held directly, indirectly and beneficially as at 30 June 2014.
Director Number of shares held (1)
Catherine B Livingstone 160,000
David I Thodey 3,318,603
Geoffrey A Cousins 101,765
Russell A Higgins 88,404
Chin Hu Lim -
John P Mullen 26,159
Nora L Scheinkestel 71,765
Margaret L Seale 30,000
Steven M Vamos 40,000
John D Zeglis 103,993

Telstra Corporation Limited and controlled entitiesTelstra Annual Report 41
DIRECTORS’ REPORTBoard and Committee meeting attendance
Details of the number of meetings held by the Board and its Committees during financial year 2014, and attendance by Board members,
are set out below:
Column a: number of meetings held while a member.Column b: number of meetings attended.(1) Committee meetings are open to all Directors to attend. Where a Director has attended a meeting of a Committee of which he or she was not a member, this is
indicated by ( ).(2) Appointed as non-executive Director effective 9 August 2013.
Company Secretary
Damien Coleman B Ec, LLB (Hons), FCIS
Damien Coleman was appointed Company Secretary of Telstra
Corporation Limited effective 1 January 2012.
Mr Coleman joined Telstra in 1998 and has served in senior legal
roles across the company, including in Sensis, Mergers and
Acquisitions and Telstra Operations. Most recently, he was
General Counsel, Finance and Administration, Office of the
Company Secretary and National Broadband Network (NBN). In
that role he was responsible for Telstra’s continuous disclosure
compliance and all legal aspects of the Annual Report preparation
and Annual General Meeting, as well as annual financial results
announcements. Mr Coleman also played a key role in the
negotiation of the Definitive Agreements for Telstra’s participation
in the roll out of the NBN. Before joining Telstra, Mr Coleman was
a senior lawyer at a leading Australian law firm. He holds a
Bachelor of Economics and a Bachelor of Laws (Hons) from the
Australian National University.
Directors’ and officers’ indemnity
Constitution
Telstra’s constitution provides for it to indemnify each officer, to
the maximum extent permitted by law, for any liability and legal
costs incurred as an officer of Telstra or a related body corporate.
If one of Telstra’s officers or employees is asked by Telstra to be a
director or other officer of a company which is not related to it,
Telstra’s constitution provides for it to indemnify the officer or
employee for any liability he or she incurs. This indemnity applies
only if the liability was incurred in the officer’s or employee’s
capacity as an officer of that other company. This indemnity is to
the maximum extent permitted by law, as if that liability had been
incurred in the capacity as an officer of Telstra. Telstra’s
constitution also allows it to indemnify employees and outside
officers in some circumstances. The terms "officer", "employee"
and "outside officer" are defined in Telstra’s constitution.
Board Committees (1)
Audit and Risk Nomination Remuneration
a b a b a b a b
C B Livingstone................................................... 14 14 6 6 7 7 6 6
D I Thodey ........................................................... 14 14 - (6) - - - (6)
G A Cousins ........................................................ 14 14 - - 7 7 6 6
R A Higgins ......................................................... 14 14 6 6 - (6) - -
C H Lim(2) ............................................................ 12 11 - - - (4) - -
J P Mullen........................................................... 14 14 - - 7 7 6 6
N L Scheinkestel................................................. 14 14 6 6 - (6) - -
M L Seale............................................................ 14 14 6 6 - (6) - -
S M Vamos.......................................................... 14 14 - (1) 7 6 6 5
J D Zeglis ............................................................ 14 14 - (1) - (6) - -
Total number of meetings held during the year 14 6 7 6

DIRECTORS’ REPORT
Telstra Corporation Limited and controlled entities42 Telstra Annual Report
Deeds of indemnity in favour of directors, officers and employees
Telstra has also executed deeds of indemnity in favour of
(amongst others):
• Directors of Telstra (including past Directors)
• secretaries and senior managers of Telstra, secretaries and
senior managers of Telstra’s wholly owned subsidiaries (other
than Telstra Super Pty Ltd)
• directors, secretaries and senior managers of a related body
corporate of Telstra (other than a wholly owned subsidiary)
while the director, secretary or senior manager was also an
employee of Telstra or a director or employee of a wholly owned
subsidiary of Telstra (other than Telstra Super Pty Ltd)
• the officers listed above (other than Telstra Directors) and
certain employees of Telstra or a related body corporate of
Telstra who are appointed as directors or secretaries of a
company which is not a related body corporate of Telstra, at the
request of Telstra
• certain employees of non-wholly owned subsidiaries of Telstra
who are appointed as directors of such non-wholly owned
subsidiaries at the request of Telstra.
Each of these deeds provides an indemnity as permitted under
Telstra’s constitution and the Corporations Act 2001. The term
“senior manager” is defined in the Corporations Act 2001. The
deeds in favour of Directors of Telstra also give Directors certain
rights of access to Telstra’s books and require it to maintain
insurance cover for the Directors.
Additionally, Telstra has executed an indemnity in favour of
employees (including officers other than Directors) in respect of
certain liabilities incurred in the formulation of, or entering into or
carrying out, of a Telstra Sale Scheme (as defined in the Telstra
Corporation Act 1991 (Cth)). This indemnity is provided as
permitted under Telstra’s constitution and the Corporations Act
2001. Although all Telstra Sale Schemes conducted by the
Commonwealth Government have been completed, the indemnity
will remain in place while it is possible for claims to arise under a
Telstra Sale Scheme.
Telstra has also executed a deed of indemnity in favour of certain
employees (including certain officers) in respect of liabilities and
legal costs that may be incurred as part of the NBN transaction.
The indemnity is to the maximum extent permitted by law and is
subject to the employee performing his or her duties, such as
acting in good faith and complying with all applicable laws.
Directors’ and officers’ insurance
Telstra maintains directors' and officers' insurance policies that,
subject to some exceptions, provide worldwide insurance cover to
past, present and future directors, secretaries and officers and
certain employees of Telstra and its subsidiaries. Telstra has paid
the premiums for the policies. The directors' and officers'
insurance policies prohibit disclosure of the premiums payable
under the policies and the nature of the liabilities insured.
Environmental regulation and performance
Information on Telstra's environmental and sustainability
performance is included in the Sustainability section on pages 22
to 31 of this Annual Report and on the Telstra website.
Telstra, as a minimum, seeks to be compliant with all applicable
environmental laws and regulatory permissions relevant to its
operations. Where instances of non-compliance may occur,
Telstra has procedures requiring that internal investigations are
conducted to determine the cause of the non-compliance and to
ensure that any risk of recurrence is minimised. Telstra
procedures further require that the relevant governmental
authorities are notified of any environmental incidents (where
applicable) in compliance with statutory requirements.
Telstra has not been prosecuted for, or convicted of, any
significant breaches of environmental regulation during the
financial year. During 2013, Telstra received several prohibition
and improvement notices from Comcare in relation to issues
arising from Telstra's management of asbestos after a number of
incidents involving subcontractors failing to meet Telstra's
minimum standards. In response, we implemented improvements
to our asbestos management procedures, including requiring all
contractors to complete new training before they can work on our
network, the appointment of additional supervisors to monitor
worksites, and co-operating with Comcare in its investigation into
the matter, which investigation is now closed.
In Australia, Telstra is subject to the reporting requirements of
both the Energy Efficiency Opportunities Act 2006 and the
National Greenhouse and Energy Reporting Act 2007.
The National Greenhouse and Energy Reporting Act 2007 requires
Telstra to report its annual Australian greenhouse gas emissions,
energy consumption and energy production. Telstra has
implemented systems and processes for the collection and
reporting of data and has, in accordance with our obligations,
reported to the Clean Energy Regulator on an annual basis. The
next report is due on 31 October 2014 and will again be supported
with an independent assurance audit to a reasonable assurance
standard.
The Energy Efficiency Opportunities Act 2006 requires Telstra to
assess its energy usage in Australia, including the identification,
investigation and evaluation of energy-saving opportunities, and
to report publicly the outcomes of all implementation decisions.
Telstra completed its first five year cycle in 2011, and has
transitioned into the second five year cycle with the Assessment
and Reporting Schedule approved in June 2013. Telstra's 2013
Energy Efficiency Opportunities Report was made available to the
public in December 2013 and is available on our website.

Telstra Corporation Limited and controlled entitiesTelstra Annual Report 43
DIRECTORS’ REPORTNon-audit services
During financial year 2014, Telstra’s auditor, Ernst & Young (EY),
has been employed on assignments additional to its statutory
audit duties. Details of the amounts paid or payable to EY for audit
and non-audit services provided during the year are detailed in
note 8 to the financial statements.
The Directors are satisfied that the provision of non-audit services
during financial year 2014 is consistent with the general standard
of independence for auditors imposed by the Corporations Act
2001 (the Act) and that the nature and scope of each type of non-
audit service provided did not compromise the auditor
independence requirements of the Act for the following reasons:
• all recurring audit engagements are approved by the Audit and
Risk Committee each year through the Audit and Risk
Committee’s approval of the annual audit plan
• additional audit and non-audit services up to $100,000 require
approval from the Chief Financial Officer
• additional audit and non-audit services between $100,000 and
$250,000 require approval from the Chairman of the Audit and
Risk Committee and services greater than $250,000 require
approval from the Audit and Risk Committee
• where the nature or scope of an external engagement changes
such that the prior approval obtained is insufficient,
subsequent approval from the Chief Financial Officer must be
obtained for the revised engagement as shown in the table
below. Where the change is not covered in the following table,
approval of the revised engagement must be obtained in
accordance with the approval levels described above.
• all additional engagements approved as per the above points
are reported to the Audit and Risk Committee at the next
meeting
• fees earned from non-audit work undertaken by EY are capped
at 1.0 times the total audit and audit related fees
• the provision of non-audit services by EY is monitored by the
Audit and Risk Committee via periodic reporting to the Audit
and Risk Committee.
EY is specifically prohibited from performing any of the following
services:
• bookkeeping services and other services related to preparing
our accounting records or financial statements
• financial information system design and implementation
services
• operation or supervision of IT systems
• appraisal or valuation services, fairness opinions or
contribution in kind reports
• actuarial services
• internal audit services
• management or human resources functions, including the
provision of advice and benchmarking services in relation to
executive remuneration
• temporary staff assignments
• broker or dealer, investment advisor or investment banking
services
• legal services or expert services unrelated to the audit
• tax planning and strategy services
• receiver/liquidation services.
A copy of the auditor’s independence declaration is set out in the
Auditor’s Independence Declaration to the Directors of Telstra
Corporation Limited on page 64 and forms part of this report.
Type of Service Type of Change
Additional audit work related
to the half-year review and full
year audit
Scope and / or fee variations
Other audit services Scope increases of up to 10 per
cent in total of the pre-approved
fee
Other assurance services Scope increases of up to 10 per
cent in total of the pre-approved
fee

REMUNERATIONREPORT
44 Telstra Annual Report Telstra Corporation Limited and controlled entities
This report sets out the remuneration arrangements for Directors and other Key Management Personnel (KMP) of the Telstra Group for the year ended 30 June 2014 (FY14), and is prepared in accordance with section 300A of the Corporations Act 2001 (Corporations Act). The information in this report has been audited as required by section 308(3C) of the Corporations Act.
The report is presented in five sections:
Section What it covers Page
1. Remuneration snapshot
1.1 Key points Provides a summary of the remuneration outcomes for FY14. 45
1.2 Changes during FY14 Details the key remuneration changes in FY14. 45
1.3 Key Management Personnel Lists the names and roles of the KMP whose remuneration details are disclosed in this report.
46
1.4 Actual pay and benefits which crystallised in FY14
Lists the actual crystallised pay and benefits received by Senior Executives in FY14.
46
1.5 Looking forward Provides an overview of remuneration changes proposed for FY15. 47
2. Setting senior executive remuneration
2.1 Remuneration policy, strategy and governance
Explains Telstra’s remuneration policy and strategy, and how the Board and Remuneration Committee make decisions, including the use of external consultants.
47
2.2 Remuneration components Shows how executive remuneration is structured to support business objectives and how it aligns with company performance, and explains the FY14 Short Term Incentive (STI) Plan and Long Term Incentive (LTI) grants made in FY14.
48
2.3 Policy and practice Provides examples of how we implement our policy in practice, explaining the executive remuneration mix as well as our shareholding, trading and hedging policies.
50
3. Executive remuneration outcomes
3.1 Financial performance Provides a breakdown of our performance, share price, and dividends over the past five years.
51
3.2 Short Term Incentive outcomes Details the STI outcomes, including payments as a percentage of the maximum opportunity, achievement by key performance indicators (KPI) and a comparison of payments to the previous year.
51
3.3 Long Term Incentive outcomes Details the LTI outcomes for plans with a performance test at 30 June 2014.
52
3.4 Senior Executive contract details Lists the key contract terms governing the employment of Senior Executives (including termination entitlements where relevant).
53
4. Non-executive Director remuneration
4.1 Remuneration structure Provides details of the fee structure for Board and Committee roles. 53
4.2 Remuneration policy and strategy Provides a summary of our approach to non-executive Director fees, together with a summary of our shareholding guidelines for non-executive Directors.
53
4.3 Remuneration components Describes how non-executive Directors can allocate their remuneration between cash and superannuation components.
53
5. Remuneration tables and glossary
5.1 – 5.8 Remuneration tables Provides the remuneration disclosures required by the Corporations Act and the relevant Australian Accounting Standards.
54
5.9 Glossary Explains abbreviations and key terms used in the Report. 63

REMUNERATIONREPORT
Telstra Corporation Limited and controlled entitiesTelstra Annual Report 45
1. REMUNERATION SNAPSHOT
1.1 Key points
Telstra performed strongly again in FY14, delivering growth in financial results and achieving a Total Shareholder Return (TSR) of approximately 15.2 per cent, following two consecutive years with TSR growth of approximately 37%. These results were underpinned by progress against our key strategic priorities, including continued growth in customer numbers and improvements in customer service and productivity, and serve to reinforce Telstra’s position as a leading telecommunications and technology company.
Remuneration outcomes in FY14 were consistent with the company’s positive performance against financial objectives and although we did not achieve the customer advocacy targets we set, we still improved in a number of areas. The governance of these outcomes remains a key focus of the Board and Remuneration Committee, and we regularly review our policies to ensure that remuneration for our executives continues to be aligned with company performance.
The structure and layout of this year’s report is similar to the FY13 report.
Highlights for the FY14 year include:
1.2 Changes during FY14
The overall structure and philosophy of Telstra’s approach to remuneration remained consistent throughout FY14, however there were some changes to the organisation structure and Senior Executive roles. We made some position title changes during the year, a number of roles that were previously referred to as Group Managing Directors (GMD) are now Group Executives (GE). We have also made some adjustments to aspects of our remuneration framework and practices to further align with company strategy and enhance remuneration governance. These changes were:
Structural changes
GE Global Enterprise & Services (GES): Brendon Riley was appointed as GE on 28 October 2013 of a newly created business unit that operates a global, industry-based services and solutions business to support the rapid growth in key portfolio areas in the global market that is part of Telstra’s strategy. This business unit incorporates Network Applications and Services (NAS), Telstra Enterprise and Government (TEG) and Telstra Global (TG).
Chief Operations Officer (COO): Kate McKenzie was appointed as COO on 28 October 2013. The COO portfolio now includes the Chief Technology Office and innovation portfolios to better integrate technology development and implementation. Telstra Operations will lead Telstra’s ongoing technical excellence across fixed and mobile networks. As a result of Ms McKenzie’s appointment, her fixed remuneration was increased from $1,040,000 to $1,200,000 effective 1 March 2014 to reflect the increase in scope.
GE Telstra Retail: Gordon Ballantyne’s position of Chief Customer Officer (CCO) changed to GE Telstra Retail effective 28 October 2013. His portfolio no longer contains TEG but incorporates the Products, Marketing and Media portfolios.
Chief Financial Officer (CFO) and GE International: Andrew Penn’s portfolio was expanded effective 7 May 2014 to assume responsibility for our International operations to further support Telstra’s strategy for growth in Asia.
Sale of the Sensis advertising and directories business: following the completion of the sale of our 70 per cent interest in the Sensis advertising and directories business to Platinum Equity Group, the responsibilities of the GE Telstra Media were significantly reduced and the role is no longer part of our structure. Rick Ellis left Telstra on completion of the sale as the role became redundant.
Total Shareholder Return of 15.2% Telstra’s share price continued to rise in FY14, and with a full year dividend payment of 28.5c we
delivered a total shareholder return of 15.2 per cent over the financial year.
Chief Executive Officer (CEO)
Remuneration
The CEO’s Fixed Remuneration (FR) was not increased during FY14 as his FR of $2,650,000 is close to the median of the ASX20 CEO positions. Total reported remuneration for the CEO in Table 5.1 decreased from $8.8m to $8.2m, primarily due to a lower STI outcome in FY14.
Short Term Incentive Outcomes The STI outcome for Senior Executives was an average of 53.6 per cent of the maximum opportunity based on the assessment of financial, customer and individual performance. This outcome reflects Telstra’s strong financial performance but also that we did not achieve our customer advocacy targets.
Long Term Incentive Outcomes For the FY12 LTI Plan, 78.15 per cent of Performance Rights vested in the form of Restricted Shares as a result of top quartile performance in TSR relative to a peer group of global competitors and above target performance on Free Cashflow Return On Investment (FCF ROI) measured over the three year performance period. These shares are subject to a further Restriction Period ending August 2015.
Non-executive Director
Remuneration
There was no increase in Board or Committee fees in FY14.

REMUNERATIONREPORT
Telstra Corporation Limited and controlled entities46 Telstra Annual Report
Remuneration Policy enhancements
Diversity and values: the Board reviewed Telstra’s remuneration philosophy and principles to ensure they remained aligned to our strategy and our values. We decided to include a principle that specifically highlights diversity and acknowledges Telstra’s commitment to providing equitable and fair pay. Section 2.1 provides detail on Telstra’s Remuneration Policy, Strategy and Governance.
Clawback mechanisms: clawback provisions have been included in the terms for LTI grants with effect from FY14 to provide the Board with discretion to clawback Performance Rights or Restricted Shares if a clawback event occurs. These mechanisms are now consistent with the STI Deferral Plan. The scenarios in which the Board could consider applying a clawback mechanism have also been broadened to include where the behaviour of a Senior Executive brings Telstra into disrepute or may impact on Telstra’s long term financial strength.
LTI and STI Restricted Shares: grants are now structured so that the Restriction Periods end on 30 June to better align with disclosure of executive remuneration outcomes for the relevant performance periods.
CEO LTI allocation: we sought and obtained shareholder approval for David Thodey’s FY14 LTI allocation at our 2013 AGM and intend to continue this practice.
1.3 Key Management Personnel
KMP comprise the Directors of the company and Senior Executives. The term “Senior Executives” refers to the CEO and those executives with authority and responsibility for planning, directing and controlling the activities of the Company and the Group, directly or indirectly. Our Senior Executive KMP group has not changed from FY13, but during the year some of their respective portfolios were reallocated as discussed in section 1.2.
The Senior Executives disclosed in this report are:
1.4 Actual pay and benefits which crystallised in FY14
The table in this section details actual pay and benefits for Senior Executives who were employed as at 30 June 2014. This is a voluntary disclosure and we have continued to include this table in our Remuneration Report. We believe it is helpful to assist shareholders in understanding the cash and other benefits actually received by Senior Executives (from the various components of their remuneration) during FY14.
As a general principle, the Australian Accounting Standards require the value of share based payments to be calculated at the time of grant and accrued over the performance period and Restriction Period. This may not reflect what Senior Executives actually receive or become entitled to during FY14.
Some of the figures in this table have not been prepared in accordance with the Australian Accounting Standards. Those figures are indicated by an asterisk (*) in the table header. They provide additional and different disclosures to Table 5.1 (which provides a breakdown of Senior Executive remuneration in accordance with statutory obligations and the Australian Accounting Standards).
The amounts shown in this table include Fixed Remuneration, STI payable as cash under the FY14 STI Plan, as well as any restricted STI or LTI that has been earned as a result of performance in previous financial years but was subject to a Restriction Period during FY14 ending June 2014 or August 2014.
We believe that including amounts in this table, even though they may not be paid (or the relevant Restriction Period for equity may not end) until early FY15, is an effective way of showing the link between executive remuneration outcomes and the relevant performance year. It is also consistent with changes we have made to the structure of STI Deferral and LTI plans from FY14 so that the Restriction Period ends on 30 June to better align disclosure of executive remuneration outcomes with the relevant performance periods.
Our sustained share price growth over the past three years has driven much of the value in the table below. Telstra uses the volume weighted average share price (VWAP) of Telstra shares for the five days following the annual results announcements for calculating the number of Performance Rights and Restricted Shares to be allocated. The VWAP value for the FY11 LTI Plan was $2.95 and the Telstra share price as at 30 June 2014 was $5.21. This increase of 76.6 per cent is reflected in the value of the equity that became unrestricted, demonstrating the link between executive remuneration and shareholder returns.
Name and most recent KMP title Prior positions held in FY14
David Thodey
CEO-
Gordon Ballantyne
GE Telstra Retail
from 28 October 2013
CCO until 27 Oct 2013
Stuart Lee
GE Telstra Wholesale-
Kate McKenzie
COO from 28 October 2013
GMD TIPM until 27 Oct 2013
Robert Nason
GE Business Support and
Improvement
-
Andrew Penn
CFO and from 7 May 2014, CFO and
GE International
-
Brendon Riley
GE Global Enterprise and Services
from 28 October 2013
COO until 27 Oct 2013
Rick Ellis
GE Telstra Media (to 31 March
2014)
-

REMUNERATIONREPORT
Telstra Corporation Limited and controlled entitiesTelstra Annual Report 47
(1) The sum of Salary and Fees and Superannuation as detailed in Table 5.1.
(2) Includes the value of personal home security services provided by Telstra, provision of car parking and in the case of Gordon Ballantyne, return flight benefits to the United Kingdom as per the terms of his service agreement.
(3) Amount relates to the cash component (75 per cent) of STI earned for FY14, which will be paid in September 2014. The remaining 25 per cent will be provided as Restricted Shares. The Restriction Period for half of the shares will end on 30 June 2015 and the other half on 30 June 2016.
(4) Amount relates to the value of STI earned in prior financial years which was provided as Restricted Shares and the Restriction Period in respect of which ends on 30 June 2014 (in relation to FY13 awards) or in August 2014 (in relation to FY12 awards). These represent 50 per cent of the Restricted Shares relating to the FY12 and FY13 performance periods respectively. Equity has been valued based on the Telstra closing share price on 30 June 2014 of $5.21.
(5) Amount relates to Performance Rights with a final test date of 30 June 2013 which vested as Restricted Shares under the FY11 LTI Plan and the Restriction Period in respect of which ends in August 2014. Equity has been valued based on the Telstra closing share price on 30 June 2014 of $5.21. Table 5.1 displays the value of Equity Settled Share-based Payments in accordance with the Australian Accounting Standards.
(6) As disclosed in the 2013 Remuneration Report, the LTI cash value of $4,579,548 for Gordon Ballantyne was for the FY11 LTI Plan where stretch levels of FCF ROI and RTSR were achieved in FY13. Payment was made on 30 June 2014. Due to Gordon Ballantyne’s original engagement on a fixed term contract, his maximum opportunity for the FY11 LTI Plan included amounts representing the pro rata value of the maximum opportunity under the FY12 and FY13 LTI Plans. He received no Performance Rights under the FY12 and FY13 LTI Plans.
(7) The LTI value for Andrew Penn represents 48,250 shares vesting on 14 December 2013 from his total allocation of 96,500 Performance Shares. Equity has been valued based on the Telstra closing share price on 30 June 2014 of $5.21. Andrew Penn did not participate in the FY11 LTI Plan as he had not commenced at Telstra at the date of allocation.
(8) Brendon Riley did not participate in the FY11 LTI Plan as he had not commenced with Telstra at the date of allocation.
1.5 Looking forward
For FY15, no changes are anticipated in our approach to Senior Executive remuneration. There will be no changes to the STI and LTI opportunities as a percentage of Fixed Remuneration for the CEO and Senior Executives.
The Board also determined that there will be no Fixed Remuneration increase for the CEO as he is appropriately positioned against the market and performance is being rewarded through the STI and LTI plans.
2. SETTING SENIOR EXECUTIVE REMUNERATION
2.1 Remuneration policy, strategy and governance
Our remuneration policy is designed to:
• support the business strategy and reinforce our culture and
values
• link financial rewards directly to employee contributions and
company performance
• provide market competitive remuneration to attract, motivate
and retain highly skilled employees
• achieve remuneration outcomes of internal consistency to
ensure employees performing at similar levels in similar roles
are remunerated within a broadly similar range
• ensure that all reward decisions are made free from bias and
support diversity within Telstra
• obtain outcomes that reflect commercially responsible pay
decisions.
Our governance framework for determining Senior Executive remuneration includes the aspects outlined below.
The Remuneration Committee
The Remuneration Committee monitors and advises the Board on remuneration matters, and consists only of independent non-executive Directors. It assists the Board in its responsibilities by monitoring and advising on Board, CEO and Senior Executive remuneration, giving due consideration to the law and corporate governance principles.
The Remuneration Committee also reviews and makes recommendations to the Board on Telstra’s overall remuneration strategy, policies and practices, and monitors the effectiveness of Telstra’s overall remuneration framework in achieving Telstra’s remuneration strategy.
Annual remuneration review
The Remuneration Committee reviews CEO and Senior Executive remuneration packages annually to ensure there is a balance between fixed and at risk pay, and that they reflect both short and long-term performance objectives aligned to Telstra’s strategy.
The Board reviews the CEO’s remuneration based on market practice, performance against agreed measures and other relevant factors, while the CEO undertakes a similar exercise in relation to Senior Executives. The results of the CEO's annual review of Senior Executives performance and remuneration are reviewed and subject to Board approval.
Name
Fixed
Remuneration
($) (1)
Non-monetary
benefits ($)
(2)
Short Term Incentive
payable as cash ($)
(3)
Value of STI
Restricted Shares
that became unre-
stricted ($)
(4) *
Value of LTI that
became
unrestricted ($)
(5) (6) (7) (8) *
FY14
Total ($) *
David Thodey 2,650,000 8,286 2,112,713 1,000,432 7,064,406 12,835,837
Gordon Ballantyne 1,324,795 57,754 1,005,413 490,756 4,579,548 7,458,266
Stuart Lee 1,029,918 12,452 930,150 305,230 1,621,289 3,899,039
Kate McKenzie 1,083,397 11,557 956,700 381,145 1,576,254 4,009,053
Robert Nason 1,072,438 17,544 804,330 407,495 1,531,219 3,833,026
Andrew Penn 1,437,397 6,480 1,156,013 372,442 251,383 3,223,715
Brendon Riley 1,337,397 8,172 754,059 498,930 - 2,598,558

REMUNERATIONREPORT
Telstra Corporation Limited and controlled entities48 Telstra Annual Report
Incentive design and performance assessment
The Remuneration Committee oversees the process of setting robust performance measures and targets that encourage strong Senior Executive performance and ethical behaviour. STI and LTI performance measures are set at the beginning of each year. If performance targets are achieved we pay 50 per cent of the total maximum potential. The maximum level is only paid if there is significant over achievement of annual targets. There will be no payment unless a threshold level of performance is achieved. At the end of each financial year, the Board reviews the company’s audited financial results and the results of the other non-financial measures. The Board then assesses performance against each measure to determine the percentage outcome of the STI and LTI plans. The Board considers that it is best positioned to assess whether the applicable measures have been met.
Each performance measure in the STI Plan, and over the longer term, LTI plan, has been selected in the context of achieving our business strategy and increasing shareholder value.
Engagement with consultants
External consultants are required to engage directly with the Remuneration Committee Chairman as the first point of contact whenever market data for Senior Executive positions is supplied to Telstra. To assess market competitiveness in FY14, the Committee engaged Guerdon Associates for the provision of ASX20 market data but did not require a remuneration recommendation. As a result, no disclosures are required under the Corporations Act.
2.2 Remuneration components
Our remuneration structure (detailed below) is designed to support our remuneration strategy and is consistent between the CEO and other Senior Executives in the KMP group. Some tailoring may occur to take into account unique circumstances of an individual role. Where this has occurred, we have specifically
disclosed it in this Report.
Section 2.2 provides a summary of the STI plan and LTI plan structures including clawback provisions. Section 2.3 summarises the percentage mix of fixed and at-risk components.
2.2.1 FY14 STI Plan
For FY14, all of our Senior Executives participated in the same STI Plan with the exception of the GE Telstra Wholesale (for regulatory reasons as explained below). The performance measures of this Plan were Free Cashflow, EBITDA, Total Income, Net Promoter Score (NPS) and individual performance objectives. The Board selected these performance measures as it believes they are a critical link between achieving the outcomes of Telstra’s business strategy and increasing shareholder value. In relation to these performance measures:
• the financial measures were set in accordance with our FY14
financial plan and strategy
• the NPS supports the shift in Telstra’s strategy from the goal of
delivering outstanding customer satisfaction to creating
customer advocates. An explanation of the way in which NPS is
calculated is included in section 3.2.2
• the individual performance objectives were set at the beginning
of FY14 and were based on each Senior Executive’s expected
individual contribution to the achievement of our strategy.
Attract, motivate and retain
highly skilled people
Reinforce values and
cultural priorities
Reward achievement of
financial and strategic
objectives
Align to long term
shareholder value creation
FIXED AT RISK
Fixed Remuneration Short Term Incentive Long Term Incentive
CASH EQUITY
• Base salary plus
superannuation.
• Set based on market and
internal relativities,
performance,
qualifications and
experience.
• 75% of STI outcome paid in
September after the
financial year end.
• STI outcome based on
Telstra's financial,
customer and individual
performance.
• 25% of the STI outcome is
deferred as Restricted
Shares.
• Half of the shares are
restricted for 1 year and
the other half for 2 years.
• The shares are subject to
clawback at the Board's
discretion. The shares are
forfeited if employment
ends unless for a
Permitted Reason (STI).
• Performance Rights
subject to performance
conditions.
• 50% subject to RTSR.
• 50% subject to FCF ROI.
• Performance is measured
over 3 years with an
additional 1 year
Restriction Period.
• Performance Rights are
subject to clawback at the
Board's discretion and
lapse if employment ends
unless for a Permitted
Reason (LTI).
Base reward market
competitive
Encourages sustainable performance in the medium to longer term
and provides a retention element.

REMUNERATIONREPORT
Telstra Corporation Limited and controlled entitiesTelstra Annual Report 49
The performance measures of the STI plan operate independently of each other. Each measure has a threshold, target and stretch level of performance. Where threshold performance is not achieved, there is no payment for that component of the incentive. Depending on the role they perform, each Senior Executive has a maximum STI opportunity ranging from 150 per cent to 200 per cent of their Fixed Remuneration where stretch targets are met.
A Senior Executive will earn an STI payment of 50 per cent of the maximum opportunity if performance targets are achieved but not exceeded.
The FY14 STI Plan for the GE Telstra Wholesale must comply with the Structural Separation Undertaking (SSU) as part of the NBN Transaction. This provides that the GE Telstra Wholesale may only participate in incentive plans that reflect solely the objectives and performance of the Wholesale business unit. As a result, the performance measures applicable to his FY14 STI Plan were different. The performance measures for the FY14 STI Plan applicable to the GE Telstra Wholesale were Wholesale Total Income, Wholesale EBITDA, Wholesale NPS and individual performance.
Details of the STI outcomes for Senior Executives for FY14 are provided in section 3.2.
2.2.2 STI deferral
Twenty five per cent of Senior Executives’ actual STI payment is provided as Restricted Shares. Half of the shares are restricted for one year and the other half are restricted for two years.
During the Restriction Period, Senior Executives are entitled to earn dividends on and vote on their Restricted Shares as all performance hurdles of the STI Plan have been met. They are, however, restricted from dealing with the shares during this period.
If a Senior Executive leaves Telstra for any reason, other than a Permitted Reason (STI), before the end of the relevant Restriction Period, the Restricted Shares are forfeited.
Restricted Shares may also be forfeited if a clawback event occurs during the Restriction Period. A clawback event includes circumstances where a Senior Executive has engaged in fraud, dishonesty or gross misconduct, or where the financial results that led to the Restricted Shares being granted are subsequently shown to be materially misstated, and also situations where the behaviour of a Senior Executive brings Telstra into disrepute or may impact on Telstra’s long term financial strength.
2.2.3 FY14 LTI Plan
Participation
All of our Senior Executives participated in the same FY14 LTI Plan, with the exception of the GE Telstra Wholesale (as explained below).
Performance Rights form the basis of the reward under the LTI plan. Senior Executives are not required to pay for the Performance Rights. However, for any Performance Rights to vest as Restricted Shares, a minimum threshold performance against the relevant measure must be satisfied.
The LTI plan has two separate performance measures, being Relative Total Shareholder Return (RTSR) and Free Cashflow Return On Investment (FCF ROI).
Details of the Performance Rights granted to Senior Executives in relation to the FY14 LTI Plan are provided in section 5.
Plan structure
Relative Total Shareholder Return
RTSR measures the performance of an ordinary Telstra share (including the value of any cash dividends and other shareholder benefits paid during the period) relative to the other companies in the comparator group over the same period.
The Board believes that RTSR is an appropriate performance hurdle because it links executive reward to Telstra’s share price performance relative to its global peers.
The comparator group for the FY14 LTI Plan included the following large market capitalisation telecommunication firms: AT&T Inc; Belgacom Group; Bell Canada Enterprises Inc; BT Group plc; Deutsche Telekom AG; Orange SA; Koninklijke KPN N.V.; KT Corporation; Nippon Telegraph & Telephone Corp; NTT DoCoMo Inc; Portugal Telecom SGPS SA; Singapore Telecommunications Ltd; SK Telecom Co Ltd; Sprint Nextel Corporation; Swisscom AG; Telekom Austria AG; Telecom Italia Sp.A.; Telecom Corporation of New Zealand Ltd; Telefonica S.A.; Telenor ASA; TeliaSonera AB; Verizon Communications Inc and Vodafone Group Plc.
The Board has discretion to change members of the comparator group under the LTI plan terms.
No amendments were made to the comparator group in FY14.
Free Cashflow Return On Investment
FCF ROI as determined by the Board is calculated by dividing the average annual Free Cashflow (less finance costs) over the three year performance period by Telstra’s average investment over the same period.
The Board selected the FCF ROI measure as an absolute LTI target on the basis that cash generation by the business is central to the creation of shareholder value.
Vesting of Performance Rights as Restricted Shares
At the end of FY16, the Board will review Telstra’s audited financial results for FCF ROI and RTSR to determine the percentage of Performance Rights that vest as Restricted Shares under the FY14 LTI Plan.
Plan component Detail
Performance Measure
Weighting
50% to RTSR
50% to FCF ROI
Performance Period 1 July 2013 to
30 June 2016
Restriction Period End Date 30 June 2017
Minimum Threshold for RTSR
Vesting50th percentile of peer group
RTSR Vesting Schedule 25% vests at 50th percentile,
straight-line vesting to 75th
percentile where 100% vests
Minimum Threshold for FCF
ROI Vesting
15.1%
FCF ROI Vesting Schedule 50% vests at target of 15.1%,
straight line vesting to stretch of
16.7% where 100% vests
Retesting No

REMUNERATIONREPORT
Telstra Corporation Limited and controlled entities50 Telstra Annual Report
Until the Performance Rights vest as Restricted Shares, a Senior Executive has no legal or beneficial interest in Telstra shares, no entitlement to receive dividends and no voting rights in relation to any securities granted under the FY14 LTI Plan.
If a Senior Executive leaves Telstra for any reason other than a Permitted Reason (LTI), any unvested Performance Rights lapse. If they leave Telstra for a Permitted Reason (LTI), a pro rata number of Performance Rights will lapse based on the proportion of time remaining until 30 June 2017. The pro rata portion relating to the Senior Executive’s completed service may still vest as Restricted Shares subject to achieving the performance measures of the FY14 LTI Plan at the end of the applicable performance period. The Board has a discretion to determine that any unvested Performance Rights do not lapse on cessation of employment and continue to be eligible to vest in accordance with their terms.
In certain limited circumstances, such as a takeover event where 50 per cent or more of all issued fully paid shares are acquired, the Board may exercise discretion to vest Performance Rights that have not lapsed as Restricted Shares.
Any Restricted Shares that are allocated based on the vesting of Performance Rights are subject to a Restriction Period expiring on 30 June 2017. If a Senior Executive leaves Telstra for any reason other than a Permitted Reason (LTI) before the end of the Restriction Period, the Restricted Shares are forfeited, unless the Board exercises its discretion to determine otherwise.
The Performance Rights may lapse and Restricted Shares may be forfeited if a clawback event occurs during the performance period or Restriction Period. A clawback event includes circumstances where a Senior Executive has engaged in fraud, dishonesty or gross misconduct, or where the financial results that led to the equity being awarded are subsequently shown to be materially misstated and also where the behaviour of a Senior Executive brings Telstra into disrepute or may impact on Telstra’s long term financial strength.
The Restricted Shares are transferred to the Senior Executive on the first day after the end of the Restriction Period that the Senior Executive is able to deal in shares under Telstra’s Securities Trading Policy.
Group Executive Telstra Wholesale
Due to SSU requirements the GE Telstra Wholesale participated in a separate equity plan in lieu of the FY13 LTI Plan for other Senior Executives.
In FY14, the GE Telstra Wholesale was allocated 133,595 Restricted Shares based on performance against the FY13 STI measures. They are subject to a Restriction Period that will end on 30 June 2016, during which time the GE Telstra Wholesale is entitled to earn dividends on, and exercise votes attached to, the Restricted Shares.
If the GE Telstra Wholesale leaves Telstra before the end of the three year Restriction Period for any reason, other than a Permitted Reason (STI), the Restricted Shares will be forfeited. If he leaves for a Permitted Reason (STI) he will retain the Restricted Shares.
This Plan contains the same clawback provisions as the FY14 STI Deferral Plan for other Senior Executives.
In lieu of participation in the Senior Executive FY14 LTI Plan the GE Telstra Wholesale will be allocated Restricted Shares based on his performance against his FY14 STI Plan measures, namely Wholesale Total Income, Wholesale EBITDA, Wholesale NPS and individual performance. Clawback provisions relating to these Restricted Shares will be aligned with the STI Deferral Plan for other Senior Executives.
2.3 Policy and practice
2.3.1 Remuneration mix of senior executives
The graph below shows the FY14 remuneration mix for Senior Executives as at 30 June 2014. The variable components of STI (including any potential Restricted Shares) and LTI are expressed at 50 per cent of the maximum opportunity which is representative of the outcome if we achieve our target performance measures. The variable components would only pay at maximum if targets are significantly exceeded. The STI and LTI plans will only provide a reward to a Senior Executive if the threshold performance measures of the relevant plans are met.
2.3.2 Plan variation guidelines
The Board may, in its absolute discretion, amend the terms of the STI and LTI plan or the targets of the STI plan where an event occurs that means the targets of the relevant plan are no longer appropriate. Situations where this discretion can be applied include:
• material change of the strategic business plan
• material regulatory or legislative change
• significant out of plan business development such as
acquisitions and divestments.
In these circumstances the Board may also exercise its discretion in determining the outcomes under the STI plan and LTI plan for similar reasons.
During FY14 no plan terms were amended, however the Board did exercise its discretion in determining outcomes under each of the plans as outlined below.

REMUNERATIONREPORT
Telstra Corporation Limited and controlled entitiesTelstra Annual Report 51
2.3.3 NBN and remuneration
From FY13 the NBN Transaction was incorporated into Telstra’s established corporate planning processes and Senior Executives continue to be accountable for achieving planned outcomes, including NBN cash flows. The value of the NBN Transaction to be received over the next 30 years is subject to a range of dependencies and assumptions.
Performance measures for future STI and LTI plans will continue to be developed using the most up to date forecasts for the financial impacts of the NBN Transaction.
The Board may use its discretion as outlined in 2.3.2 if, due to external factors, the NBN roll-out does not proceed according to NBN Co’s published business plan at the time the measures are developed to avoid windfall gains and losses.
NBN adjustments made in determining the outcomes for the STI plan and the LTI plan are outlined in 3.2.2 and 3.3 respectively.
2.3.4 Executive share ownership policy
The intent of Telstra’s Executive Share Ownership Policy is to align a significant portion of executive remuneration to the creation of longer term shareholder value. Under the policy, Senior Executives are required to hold Telstra shares to the value of 100 per cent of their Fixed Remuneration by the later of 30 June 2015, or within five years of first appointment to Senior Executive level.
Any Restricted Shares held by Senior Executives are included in calculating their shareholding for the purposes of this policy. Senior Executives must obtain Board, or, in certain circumstances CEO or Chairman approval before they sell shares if they have not yet met their share ownership requirements under the policy.
Progress is monitored by the Board on an ongoing basis and Senior Executives are tracking well against this requirement.
2.3.5 Restrictions and governance
All KMP must comply with Telstra’s Securities Trading Policy and shares can only be traded during specified trading windows.
KMP are prohibited from using Telstra shares as collateral in any financial transaction (including margin loan arrangements) or any stock lending arrangement.
They are also prohibited from entering into arrangements which limit the economic risk of their security holdings allocated under Telstra’s equity plans prior to vesting or exercise of those securities or during the Restriction Period. This ensures that KMP are not permitted to hedge against participation in Telstra’s equity plans.
KMP are also required to confirm on an annual basis that they comply with these policy restrictions, which enables Telstra to monitor and enforce our policy.
3. EXECUTIVE REMUNERATION OUTCOMES
The table in section 3.1 provides a summary of the key financial results for Telstra over the past five financial years. The tables in sections 3.2 and 3.3 provide a summary of how those results have been reflected in the remuneration outcomes for Senior Executives.
3.1 Financial performance
Details of Telstra’s performance, share price, and dividends over
the past five years are summarised in the table below:
(1) For FY13 Total Income, EBITDA and Net Profit were restated due to the Sensis divestiture (i.e. now we are reporting continuing operations only for FY13 and FY14, Sensis is excluded from these amounts, refer to note 12 to the financial statements). Also contributing to the EBITDA and Net Profit adjustments was a change in the Australian Accounting Standards (AASB 119) which required retrospective application, therefore FY13 expenses were restated which resulted in the additional adjustments to EBITDA and Net Profit. Refer to note 12 to the financial statements for further details.
(2) Net profit attributable to equity holders of the Telstra entity.
(3) Share prices are as at 30 June for the respective year. The closing share price for FY09 was $3.39.
3.2 Short Term Incentive outcomes
3.2.1 Average STI payment as a percentage of STI opportunity
The average STI payment for Senior Executives as a percentage of the maximum potential payout is shown in the following table:
3.2.2 Overall FY14 STI Plan outcomes
At the end of FY14, the Board reviewed Telstra’s audited financial results and the results of other performance measures. The Board has assessed performance against each measure and determined the percentage of STI that was payable, of which 25 per cent will be provided through Restricted Shares.
The Board determined the outcomes of the financial measures to ensure there were no windfall gains or losses due to the timing of the NBN roll out, spectrum purchases as well as acquisitions and divestments including CSL and the Sensis advertising and directories business.
Performance
measures
FY14
$mFY13 (1)
$m
FY12
$m
FY11
$m
FY10
$m
Earnings
Total Income 26,296 24,776 25,503 25,304 25,029
EBITDA 11,135 10,168 10,234 10,151 10,847
Net Profit (2) 4,275 3,739 3,405 3,231 3,883
Shareholder value
Share price ($) (3) 5.21 4.77 3.69 2.89 3.25
Total dividends
paid per share
(cents)
28.5 28 28 28 28
Performance year FY14 FY13 FY12 FY11 FY10
STI received as %
of maximum
53.6% 66.0% 65.6% 48.4% 22.7%

REMUNERATIONREPORT
Telstra Corporation Limited and controlled entities52 Telstra Annual Report
For the calculation of the NPS measure, NPS is based on asking Telstra’s customers to rate their likelihood of recommending Telstra, out of a score of 10. The overall NPS result for Telstra is the weighted average of the surveys from Telstra’s Consumer (50 per cent), Business (25 per cent), and Enterprise and Government (25 per cent) customers. The surveys are undertaken by third party research companies. The measurement period for the FY14 results is based on the three month average across 1 April 2014 to 30 June 2014 for Consumer and Business, and the six month consolidated result from 1 January 2014 to 30 June 2014 for Enterprise and Government. The final result was audited by Telstra’s Group Internal Audit team.
For determining the Wholesale NPS measure that applies to the GE Telstra Wholesale, its calculation is based on a survey of Wholesale customers only, undertaken by a third party research company undertaken from 28 April 2014 through to 16 May 2014.
The Board believes the methods of calculating the financial and NPS outcomes are appropriate and provided a rigorous assessment of Telstra’s performance.
Senior Executive STI (excluding Group Executive Telstra
Wholesale)
Group Executive Telstra Wholesale STI
Section 3.2.3 provides a summary of STI payments as a percentage of the maximum opportunity for each Senior Executive.
Definitions for the STI financial measures of Total Income, EBITDA and Free Cashflow are provided in the Glossary at the end of the Remuneration Report.
3.2.3 FY14 STI Plan payment results
The table below displays FY14 STI payments as a percentage of Fixed Remuneration and also as a percentage of the maximum opportunity for both FY14 and FY13 STI plans for current Senior Executives:
The graph below shows how STI payments as a percentage of the maximum opportunity have tracked closely to Total Revenue growth over four of the past five years. Telstra’s incentive plans measure performance against a range of financial and non-financial metrics with varied weightings. Accordingly, the pay for performance relationship is based on the performance against these metrics as a whole and may not always align with revenue growth, as is the case for FY14, where the lower STI payment reflects that we did not achieve our customer advocacy target.
3.3 Long Term Incentive outcomes
The performance period for the FY12 LTI Plan concluded on 30 June 2014.
The results of Telstra’s RTSR was calculated by an external provider and audited by Telstra’s Group Internal Audit team. The RTSR vesting result was based on Telstra ranking at the 95th percentile of the global peer group.
Consistent with prior years the Board determined the FCF ROI outcome to ensure there are no windfall gains or losses due to the timing of the NBN roll out. The Board also excluded spectrum purchases as well as acquisitions and divestments including CSL, the Sensis advertising and directories business and TelstraClear. The result was reviewed by Telstra’s Group Internal Audit team and our external auditor Ernst & Young.
The Board has determined that the vesting outcomes are in accordance with the results and the LTI plan rules.
Vesting outcomes for both the RTSR and the FCF ROI performance measures for the FY12 LTI Plan can be found in 3.3.1.
3.3.1 FY12 LTI Plan testing as at 30 June 2014
The vesting table for the FY12 LTI Plan is detailed below, reflecting performance up to 30 June 2014 against the two performance measures of RTSR and FCF ROI.
Upon vesting, each participant was allocated Restricted Shares which are subject to a Restriction Period (concluding August 2015), during which Senior Executives are not permitted to trade those shares.
MeasureOutcome
(% of maximum)
Total Income 100.0%
EBITDA 98.3%
Free Cashflow 100.0%
NPS 0.0%
MeasureOutcome
(% of maximum)
Wholesale Total Income 100.0%
Wholesale EBITDA 100.0%
Wholesale NPS 75.0%
NameFY14 %
of FR
FY14 %
of max
FY13 %
of max
David Thodey 106.3% 53.2% 66.4%
Gordon Ballantyne 99.3% 49.7% 63.9%
Stuart Lee 119.3% 79.5% 85.0%
Kate McKenzie 106.3% 53.2% 63.9%
Robert Nason 99.3% 49.7% 66.4%
Andrew Penn 106.3% 53.2% 66.4%
Brendon Riley 74.5% 37.2% 63.9%
KMP Average: 101.6% 53.6% 66.0%
Test date Performance measure% of total plan
vested
30 June 2014 RTSR (100% vesting) 50.00%
FCF ROI (56.3% vesting) 28.15%
Total: 78.15%

REMUNERATIONREPORT
Telstra Corporation Limited and controlled entitiesTelstra Annual Report 53
3.3.2 Historical LTI plan performance relative to Telstra share
price
The following chart compares Telstra’s LTI plan vesting results for the past five LTI plans as a percentage of plan maximum opportunity to the share price history during the same performance period:
In FY12 Telstra had two LTI plans with a final performance test as the FY09 LTI was the last LTI plan format where performance testing was done in years 2, 3 and 4. This was different to the current format of a 3 year performance period plus 1 year Restriction Period.
3.4 Senior Executive contract details
The key terms and conditions of service contracts for current Senior Executives are summarised in the table below.
The service contracts for current Senior Executives are ongoing subject to their individual terms and conditions.
Upon notice being given, Telstra can require a Senior Executive to work through the notice period or may terminate employment immediately by providing payment in lieu of notice. Any termination payment is calculated based on the Senior Executive’s Fixed Remuneration as at the date of termination.
There will be no payment if termination is a result of serious misconduct, or redundancy in those cases where Telstra’s redundancy policy overrides the termination provisions of a Senior Executive’s service contract.
Separation payments for Mr Rick Ellis are detailed in Table 5.1 and have been paid in accordance with his employment contract and Part 2.D of the Corporations Act 2001.
(1) In relation to David Thodey’s contract, if the Board forms the view that the CEO is not performing to the standard required of a CEO, Telstra may terminate him by providing four months’ written notice.
4. NON-EXECUTIVE DIRECTOR REMUNERATION
4.1 Remuneration structure
The Telstra Board and Committee fee structure (inclusive of
superannuation) during FY14 was:
The Chairman of the Board does not receive Committee fees in respect of her role as a Chair or a member of any Board Committee.
There was no increase in Board or Committee fees in FY14.
Telstra’s non-executive Directors are remunerated in accordance with Telstra’s Constitution, which provides for an aggregate fee pool which is set and varied only by approval of a resolution of shareholders at the annual general meeting (AGM). The current annual fee pool of $3.5 million was approved by shareholders at Telstra’s 2012 AGM.
The total of Board and Committee fees, including superannuation, paid to non-executive Directors in FY14 remained within the approved fee pool.
4.2 Remuneration policy and strategy
Telstra’s non-executive Directors are remunerated with set fees and do not receive any performance based pay. This enables non-executive Directors to maintain independence and impartiality when making decisions affecting the future direction of the company.
To align the non-executive Directors’ interests with the interests of our shareholders, the Board has established guidelines to encourage non-executive Directors to hold Telstra shares equivalent to at least 50 per cent of their annual fees. Such shares are to be acquired over a five year period from the later of 1 July 2009 or the date of appointment.
Progress is monitored on an ongoing basis and non-executive Directors are tracking well against the guidelines. Details of non-executive Directors’ (and their related parties) interests in Telstra shares as at 30 June 2014 are set out in Table 5.8 of this report.
4.3 Remuneration components
Superannuation contributions, in accordance with the ASX Listing Rules and Telstra policy, are included within each non-executive Director’s Total Remuneration. Non-executive Directors may choose to increase the proportion of their remuneration taken as superannuation, subject to legislative requirements.
Telstra does not provide retirement benefits for non-executive Directors other than the superannuation contributions noted above.
Table 5.7 provides full details of non-executive Director remuneration for FY14.
Section 2.3.5 of this Report provides details on the Telstra securities trading restrictions which apply to all KMP, including non-executive Directors.
Name
Fixed
Remuneration
at the end of
FY14
Notice
period
Termination
payment
David Thodey 2,650,000 6 months 12 months (1)
Gordon Ballantyne 1,350,000 6 months 6 months
Stuart Lee 1,040,000 6 months 12 months
Kate McKenzie 1,200,000 6 months 6 months
Robert Nason 1,080,000 6 months 6 months
Andrew Penn 1,450,000 6 months 6 months
Brendon Riley 1,350,000 6 months 12 months
Board fees ChairmanNon-executive
Director
Board 705,000 235,000
Committee feesCommittee
Chair
Committee
member
Audit and Risk Committee 70,000 35,000
Remuneration Committee 50,000 25,000
Nomination Committee - 7,000
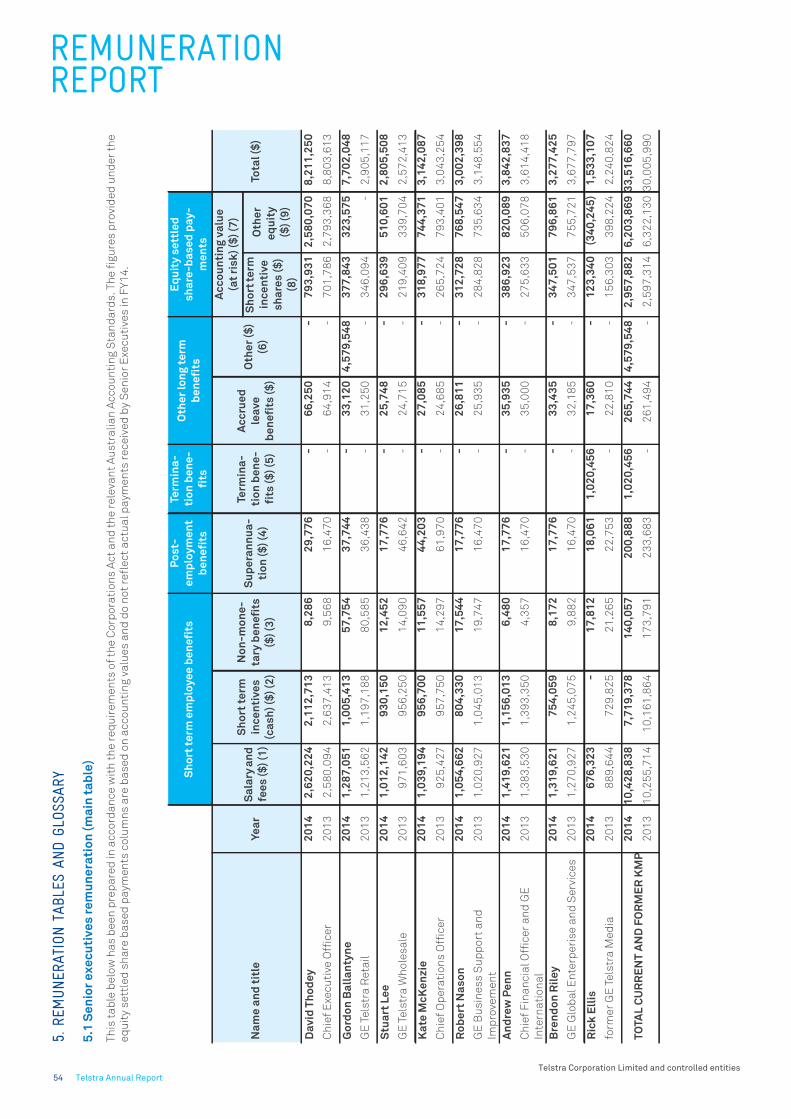
REMUNERATIONREPORT
Telstra Corporation Limited and controlled entities54 Telstra Annual Report
5. R
EMUNER
ATIO
N T
ABLE
S AN
D GL
OSSA
RY
5.1
Se
nio
r e
xe
cu
tiv
es
re
mu
ne
rati
on
(m
ain
ta
ble
)
Th
is t
ab
le b
elo
w h
as
be
en
pre
pa
red
in a
cc
ord
an
ce
wit
h t
he
re
qu
ire
me
nts
of
the
Co
rpo
rati
on
s A
ct
an
d t
he
re
leva
nt
Au
str
ali
an
Ac
co
un
tin
g S
tan
da
rds
. Th
e f
igu
res
pro
vid
ed
un
de
r th
e
eq
uit
y s
ett
led
sh
are
ba
se
d p
aym
en
ts c
olu
mn
s a
re b
as
ed
on
ac
co
un
tin
g v
alu
es
an
d d
o n
ot
refl
ec
t a
ctu
al
pa
yme
nts
re
ce
ive
d b
y S
en
ior
Exe
cu
tive
s in
FY
14
.
Sh
ort
te
rm e
mp
loy
ee
be
ne
fits
Po
st-
em
plo
ym
en
t
be
ne
fits
Term
ina
-
tio
n b
en
e-
fits
Oth
er
lon
g t
erm
be
ne
fits
Eq
uit
y s
ett
led
sh
are
-ba
se
d p
ay
-
me
nts
Na
me
an
d t
itle
Ye
ar
Sa
lary
an
d
fee
s (
$)
(1)
Sh
ort
te
rm
inc
en
tiv
es
(ca
sh
) ($
) (2
)
No
n-m
on
e-
tary
be
ne
fits
($)
(3)
Su
pe
ran
nu
a-
tio
n (
$)
(4)
Term
ina
-
tio
n b
en
e-
fits
($
) (5
)
Ac
cru
ed
lea
ve
be
ne
fits
($
)
Oth
er
($)
(6)
Ac
co
un
tin
g v
alu
e
(at
ris
k)
($)
(7)
Tota
l ($
)S
ho
rt t
erm
inc
en
tiv
e
sh
are
s (
$)
(8)
Oth
er
eq
uit
y
($)
(9)
Da
vid
Th
od
ey
20
14
2,6
20
,22
4 2
,11
2,7
13
8,2
86
29
,77
6 -
66
,25
0 -
79
3,9
31
2,5
80
,07
0 8
,21
1,2
50
Ch
ief
Exe
cu
tive
Off
ice
r2
01
3 2
,58
0,0
94
2,6
37
,41
3 9
,56
8 1
6,4
70
- 6
4,9
14
- 7
01
,78
6 2
,79
3,3
68
8,8
03
,61
3
Go
rdo
n B
all
an
tyn
e2
01
4 1
,28
7,0
51
1,0
05
,41
3 5
7,7
54
37
,74
4 -
33
,12
0 4
,57
9,5
48
37
7,8
43
32
3,5
75
7,7
02
,04
8
GE
Te
lstr
a R
eta
il2
01
3 1
,21
3,5
62
1,1
97
,18
8 8
0,5
85
36
,43
8 -
31
,25
0 -
34
6,0
94
- 2
,90
5,1
17
Stu
art
Le
e2
01
4 1
,01
2,1
42
93
0,1
50
12
,45
2 1
7,7
76
- 2
5,7
48
- 2
96
,63
9 5
10
,60
1 2
,80
5,5
08
GE
Te
lstr
a W
ho
les
ale
20
13
97
1,6
03
95
6,2
50
14
,09
0 4
6,6
42
- 2
4,7
15
- 2
19
,40
93
39
,70
4 2
,57
2,4
13
Ka
te M
cK
en
zie
20
14
1,0
39
,19
4 9
56
,70
0 1
1,5
57
44
,20
3 -
27
,08
5 -
31
8,9
77
74
4,3
71
3,1
42
,08
7
Ch
ief
Op
era
tio
ns
Off
ice
r2
01
3 9
25
,42
7 9
57
,75
0 1
4,2
97
61
,97
0 -
24
,68
5 -
26
5,7
24
79
3,4
01
3,0
43
,25
4
Ro
be
rt N
as
on
2
01
4 1
,05
4,6
62
80
4,3
30
17
,54
4 1
7,7
76
- 2
6,8
11
- 3
12
,72
8 7
68
,54
7 3
,00
2,3
98
GE
Bu
sin
es
s S
up
po
rt a
nd
Imp
rove
me
nt
20
13
1,0
20
,92
71
,04
5,0
13
19
,74
7 1
6,4
70
- 2
5,9
35
- 2
84
,82
87
35
,63
4 3
,14
8,5
54
An
dre
w P
en
n2
01
41
,41
9,6
21
1,1
56
,01
3 6
,48
0 1
7,7
76
- 3
5,9
35
- 3
86
,92
3 8
20
,08
9 3
,84
2,8
37
Ch
ief
Fin
an
cia
l O
ffic
er
an
d G
E
Inte
rna
tio
na
l
20
13
1,3
83
,53
0 1
,39
3,3
50
4,3
57
16
,47
0 -
35
,00
0 -
27
5,6
33
50
6,0
78
3,6
14
,41
8
Bre
nd
on
Ril
ey
20
14
1,3
19
,62
1 7
54
,05
9 8
,17
2 1
7,7
76
- 3
3,4
35
- 3
47
,50
1 7
96
,86
1 3
,27
7,4
25
GE
Glo
ba
l E
nte
rpe
ris
e a
nd
Se
rvic
es
2
01
3 1
,27
0,9
27
1,2
45
,07
5 9
,88
2 1
6,4
70
- 3
2,1
85
- 3
47
,53
7 7
55
,72
1 3
,67
7,7
97
Ric
k E
llis
20
14
67
6,3
23
- 1
7,8
12
18
,06
1 1
,02
0,4
56
17
,36
0 -
12
3,3
40
(3
40
,24
5)
1,5
33
,10
7
form
er
GE
Te
lstr
a M
ed
ia2
01
3 8
89
,64
4 7
29
,82
5 2
1,2
65
22
,75
3 -
22
,81
0 -
15
6,3
03
39
8,2
24
2,2
40
,82
4
TO
TA
L C
UR
RE
NT
AN
D F
OR
ME
R K
MP
20
14
10
,42
8,8
38
7,7
19
,37
8 1
40
,05
7 2
00
,88
8 1
,02
0,4
56
26
5,7
44
4,5
79
,54
8 2
,95
7,8
82
6,2
03
,86
93
3,5
16
,66
0
20
13
10
,25
5,7
14
10
,16
1,8
64
17
3,7
91
23
3,6
83
- 2
61
,49
4 -
2,5
97
,31
4 6
,32
2,1
30
30
,00
5,9
90

REMUNERATIONREPORT
Telstra Corporation Limited and controlled entitiesTelstra Annual Report 55
Fo
otn
ote
s t
o T
ab
le 5
.1:
If t
he
fo
rme
r G
E T
els
tra
Me
dia
Ric
k E
llis
is r
em
ove
d f
rom
bo
th t
he
FY
13
an
d F
Y1
4 t
ota
ls, t
he
FY
14
to
tal i
s $
31
,98
3,5
53
co
mp
are
d t
o F
Y1
3 o
f $
27
,76
5,1
66
, an
inc
rea
se
of
15
.2 p
er
ce
nt
co
mp
are
d t
o F
Y1
3. T
his
inc
rea
se
is d
ue
to
th
e c
as
h L
TI
pa
yme
nt
for
Go
rdo
n B
all
an
tyn
e o
utl
ine
d in
fo
otn
ote
(6
).
(1)
Inc
lud
es
sa
lary
, s
ala
ry s
ac
rifi
ce
be
ne
fits
(e
xclu
din
g s
ala
ry s
ac
rifi
ce
su
pe
ran
nu
ati
on
wh
ich
is in
clu
de
d u
nd
er
Su
pe
ran
nu
ati
on
) a
nd
fri
ng
e b
en
efi
ts t
ax.
(2)
Sh
ort
te
rm in
ce
nti
ves
(c
as
h)
rela
tes
to
pe
rfo
rma
nc
e in
FY
13
an
d F
Y1
4 r
es
pe
cti
vely
an
d is
ba
se
d o
n a
ctu
al
pe
rfo
rma
nc
e f
or
Te
lstr
a a
nd
th
e in
div
idu
al.
(3)
Inc
lud
es
th
e v
alu
e o
f p
ers
on
al
ho
me
se
cu
rity
se
rvic
es
pro
vid
ed
by
Te
lstr
a,
pro
vis
ion
of
ca
r p
ark
ing
an
d in
th
e c
as
e o
f G
ord
on
Ba
lla
nty
ne
, re
turn
fli
gh
t b
en
efi
ts t
o t
he
Un
ite
d K
ing
do
m a
s p
er
the
te
rms
of
his
se
rvic
e a
gre
em
en
t. A
lso
in
clu
de
s t
he
va
lue
of
no
n r
ec
ou
rse
lo
an
s u
nd
er
TE
SO
P 9
9 (
wh
ich
ha
ve n
ot
be
en
exp
en
se
d a
s t
he
y w
ere
iss
ue
d p
rio
r to
7 N
ove
mb
er
20
02
an
d w
ere
th
ere
fore
inc
lud
ed
in t
he
exe
mp
tio
n p
erm
itte
d u
nd
er
AA
SB
1 “
Fir
st-
tim
e A
do
pti
on
of
Au
str
ali
an
Eq
uiv
ale
nc
e t
o I
nte
rna
tio
na
l F
ina
nc
ial
Re
po
rtin
g S
tan
da
rds
”).
(4)
Re
pre
se
nts
co
mp
an
y c
on
trib
uti
on
s t
o s
up
era
nn
ua
tio
n a
s w
ell
as
an
y a
dd
itio
na
l s
up
era
nn
ua
tio
n c
on
trib
uti
on
s m
ad
e t
hro
ug
h s
ala
ry s
ac
rifi
ce
by
Se
nio
r E
xec
uti
ves
.
(5)
Te
rmin
ati
on
Be
ne
fits
fo
r R
ick
Ell
is o
f $
1,0
20
,45
6 is
co
mp
ris
ed
of
$4
62
,50
0 p
aym
en
t in
lie
u o
f n
oti
ce
as
pe
r h
is s
erv
ice
ag
ree
me
nt
plu
s $
45
1,5
18
pro
ra
ta a
t ta
rge
t F
Y1
4 S
TI a
s p
er
Te
lstr
a S
TI P
oli
cy
an
d $
10
6,4
38
re
du
nd
an
cy
pa
yme
nt.
(6)
Go
rdo
n B
all
an
tyn
e d
id n
ot
pa
rtic
ipa
te in
an
y L
TI
for
FY
12
an
d F
Y1
3 d
ue
to
th
e f
ixe
d t
erm
na
ture
(fo
ur
yea
rs)
of
his
init
ial
em
plo
yme
nt
co
ntr
ac
t. H
e p
art
icip
ate
d in
a c
as
h b
as
ed
LT
I b
eg
inn
ing
7 M
arc
h 2
01
1 (
de
tail
s o
f w
hic
h a
re
inc
lud
ed
in T
els
tra
’s 2
01
1 R
em
un
era
tio
n R
ep
ort
) a
nd
his
ma
xim
um
op
po
rtu
nit
y fo
r th
e F
Y1
1 L
TI
Pla
n in
clu
de
d a
mo
un
ts r
ep
res
en
tin
g t
he
pro
ra
ta v
alu
e o
f th
e m
axi
mu
m o
pp
ort
un
ity
un
de
r th
e F
Y1
2 a
nd
FY
13
LT
I P
lan
s. T
he
str
etc
h
leve
ls o
f F
CF
RO
I a
nd
RT
SR
we
re a
ch
ieve
d in
FY
13
an
d t
he
str
etc
h a
mo
un
t o
f $
4,5
79
,54
8 w
as
pa
id t
o G
ord
on
Ba
lla
nty
ne
on
30
Ju
ne
20
14
.
(7)
In a
cc
ord
an
ce
wit
h A
AS
B 2
, th
e a
cc
ou
nti
ng
va
lue
re
pre
se
nts
a p
ort
ion
of
the
fa
ir v
alu
e o
f P
erf
orm
an
ce
Rig
hts
, R
es
tric
ted
Sh
are
s a
nd
Pe
rfo
rma
nc
e S
ha
res
th
at
ha
d n
ot
yet
full
y ve
ste
d a
s a
t th
e c
om
me
nc
em
en
t o
f th
e f
ina
nc
ial
yea
r.
Th
is v
alu
e in
clu
de
s a
n a
ss
um
pti
on
th
at
Pe
rfo
rma
nc
e R
igh
ts,
Re
str
icte
d S
ha
res
an
d P
erf
orm
an
ce
Sh
are
s w
ill
ves
t a
t th
e e
nd
of
the
ve
sti
ng
pe
rio
d. T
he
am
ou
nt
inc
lud
ed
as
re
mu
ne
rati
on
is n
ot
rela
ted
to
, n
or
ind
ica
tive
of
the
be
ne
fit
(if
an
y) t
ha
t m
ay
ult
ima
tely
be
re
ali
se
d b
y e
ac
h S
en
ior
Exe
cu
tive
sh
ou
ld t
he
Pe
rfo
rma
nc
e R
igh
ts,
Re
str
icte
d S
ha
res
an
d P
erf
orm
an
ce
Sh
are
s v
es
t. R
efe
r to
fo
otn
ote
(9
) a
nd
Ta
ble
5.4
fo
r fu
rth
er
info
rma
tio
n.
(8)
Th
is in
clu
de
s t
he
am
ort
ise
d v
alu
e o
f R
es
tric
ted
Sh
are
s a
llo
ca
ted
un
de
r th
e F
Y1
1 (
on
ly a
pp
lic
ab
le t
o F
Y1
3 c
om
pa
rati
ves
), F
Y1
2,
FY
13
an
d F
Y1
4 S
TI
pla
ns
wh
ere
by
25
pe
r c
en
t o
f th
e S
TI
pa
yme
nt
wa
s p
rovi
de
d a
s R
es
tric
ted
Sh
are
s
wh
ich
are
su
bje
ct
to a
Re
str
icti
on
Pe
rio
d,
ha
lf f
or
on
e y
ea
r a
nd
ha
lf f
or
two
ye
ars
, s
ub
jec
t to
th
e S
en
ior
Exe
cu
tive
’s c
on
tin
ue
d e
mp
loym
en
t.
(9)
As
re
qu
ire
d u
nd
er
AA
SB
2,
ac
co
un
tin
g e
xpe
ns
e t
ha
t w
as
pre
vio
us
ly r
ec
og
nis
ed
as
re
mu
ne
rati
on
ha
s b
ee
n r
eve
rse
d in
FY
14
. Fo
r F
Y1
4,
this
oc
cu
rre
d f
or
a p
ort
ion
of
the
FY
12
LT
I P
lan
th
at
fail
ed
to
sa
tis
fy t
he
FC
F R
OI
pe
rfo
rma
nc
e
targ
et
at
30
Ju
ne
20
14
, a
no
n-m
ark
et
(i.e
. no
n-R
TS
R)
me
as
ure
, re
su
ltin
g in
eq
uit
y in
str
um
en
ts l
ap
sin
g. F
or
Ric
k E
llis
, a
cc
ou
nti
ng
exp
en
se
th
at
wa
s p
revi
ou
sly
re
co
gn
ise
d a
s r
em
un
era
tio
n h
as
be
en
re
vers
ed
in F
Y1
4 f
or
the
FY
14
, F
Y1
3 a
nd
FY
12
LT
I P
lan
s d
ue
to
his
de
pa
rtu
re. T
he
re w
as
no
ac
co
un
tin
g e
xpe
ns
e t
ha
t w
as
re
vers
ed
in F
Y1
3. R
efe
r to
se
cti
on
3.3
on
LT
I o
utc
om
es
fo
r F
Y1
4 f
or
furt
he
r in
form
ati
on
.

REMUNERATIONREPORT
Telstra Corporation Limited and controlled entities56 Telstra Annual Report
5.2 STI Payments (cash and shares)
(1) Represents the maximum potential STI specific to FY14 and FY13 respectively, where the Senior Executive was a KMP, adjusted for any variation in Fixed Remuneration throughout FY14 and FY13 that impacts the maximum potential STI available. If the minimum threshold performance is not met, the minimum possible STI payment is nil.
(2) The STI for FY14 and FY13 was approved by the Board on 13 August 2014 and 7 August 2013 respectively.
(3) The grant date for the equity component of the FY14 STI will be subsequent to the date of this Remuneration Report.
(4) The Restricted Shares are subject to a Restriction Period, half for one year, half for two years ending 30 June 2015 and 30 June 2016 respectively, subject to the Senior Executive’s continued employment. Refer to section 2.2.2 for further details.
(5) Rick Ellis did not receive an STI payment for FY14 due to his position becoming redundant on 31 March 2014. Refer to footnote (5) to Table 5.1 for a breakdown of his termination payment.
Name Year
Maximum
potential STI
opportunity
($) (1)
Current year grant of STI ($)
(2) % of the
maximum
potential
opportunity
% forfeitedTotal grant of
STI ($)75% cash
component
25% deferred
shares compo-
nent (3) (4)
David Thodey2014 5,300,000 2,112,713 704,237 53.2% 46.8% 2,816,950
2013 5,300,000 2,637,413 879,137 66.4% 33.6% 3,516,550
Gordon Ballantyne2014 2,700,000 1,005,413 335,137 49.7% 50.3% 1,340,550
2013 2,500,000 1,197,188 399,062 63.9% 36.1% 1,596,250
Stuart Lee2014 1,560,000 930,150 310,050 79.5% 20.5% 1,240,200
2013 1,500,000 956,250 318,750 85.0% 15.0% 1,275,000
Kate McKenzie2014 2,400,000 956,700 318,900 53.2% 46.8% 1,275,600
2013 2,000,000 957,750 319,250 63.9% 36.1% 1,277,000
Robert Nason2014 2,160,000 804,330 268,110 49.7% 50.3% 1,072,440
2013 2,100,000 1,045,013 348,337 66.4% 33.6% 1,393,350
Andrew Penn2014 2,900,000 1,156,013 385,337 53.2% 46.8% 1,541,350
2013 2,800,000 1,393,350 464,450 66.4% 33.6% 1,857,800
Brendon Riley2014 2,700,000 754,059 251,354 37.2% 62.8% 1,005,413
2013 2,600,000 1,245,075 415,025 63.9% 36.1% 1,660,100
Rick Ellis (5)2014 1,850,000 n/a n/a n/a n/a n/a
2013 1,850,000 729,825 243,275 52.6% 47.4% 973,100

REMUNERATIONREPORT
Telstra Corporation Limited and controlled entitiesTelstra Annual Report 57
5.3 Summary of LTI plans and other equity plans as at 30 June 2014 (*)
(1) End Date refers to end of the Restriction Period for Performance Rights and Restricted Shares and the date that Performance Shares vest.
(2) Represents the percentage of the grant that expired as performance criteria was not satisfied in the financial year. Not applicable (n/a) relates to LTI and other equity plans that either will be performance tested in future financial years or have met the relevant performance hurdles but are subject to a Restriction Period.
(3) The values included in the table above have been calculated by applying valuation methodologies as described in note 27 to the financial statements.
(4) The FY14 Restricted Shares grant to Stuart Lee was made in lieu of participation in the FY13 LTI Plan. See section 2.2.3 for more information
(5) As part of his Service Agreement negotiated upon appointment, Andrew Penn was allocated 96,500 Performance Shares in FY12. The first tranche of 48,250 vested on 14 December 2013. The second tranche is scheduled to vest on 14 December 2014 subject to Andrew Penn’s continued employment and satisfactory performance.
(*) As Rick Ellis ceased to be a KMP as at 31 March 2014, he has been excluded from the table above.
Name Plan
Type of
instrument
granted
Performance periodEnd
date (1)
% of total
plan
tested at
30 June
2014
% of grant
expired in
current year
(2)
Future
financial
dates in
which
grants
may
Vest
Accounting value
yet to vest (3)
Min
($)Max ($)
David Thodey
FY11Performance
Rights1/07/2010 - 30/06/2013 20/08/14 n/a - n/a nil -
FY12Performance
Rights1/07/2011 - 30/06/2014 19/08/15 100 21.85% 30/06/15 nil 711,183
FY13Performance
Rights1/07/2012 - 30/06/2015 17/08/16 n/a n/a 30/06/16 nil 1,884,908
FY14Performance
Rights1/07/2013 - 30/06/2016 30/06/17 n/a n/a 30/06/17 nil 2,381,873
Gordon Ballantyne FY14Performance
Rights1/07/2013 - 30/06/2016 30/06/17 n/a n/a 30/06/17 nil 970,724
Stuart Lee (4)
FY11Performance
Rights1/07/2010 - 30/06/2013 20/08/14 n/a - n/a nil -
FY13Restricted
Sharesn/a 17/08/15 n/a n/a 17/08/15 nil 148,179
FY14Restricted
Sharesn/a 01/07/16 n/a n/a 01/07/16 nil 453,332
Kate McKenzie
FY11Performance
Rights1/07/2010 - 30/06/2013 20/08/14 n/a - n/a nil -
FY12Performance
Rights1/07/2011 - 30/06/2014 19/08/15 100 21.85% 30/06/15 nil 221,698
FY13Performance
Rights1/07/2012 - 30/06/2015 17/08/16 n/a n/a 30/06/16 nil 569,030
FY14Performance
Rights1/07/2013 - 30/06/2016 30/06/17 n/a n/a 30/06/17 nil 747,820
Robert Nason
FY11Performance
Rights1/07/2010 - 30/06/2013 20/08/14 n/a - n/a nil -
FY12Performance
Rights1/07/2011 - 30/06/2014 19/08/15 100 21.85% 30/06/15 nil 233,365
FY13Performance
Rights1/07/2012 - 30/06/2015 17/08/16 n/a n/a 30/06/16 nil 597,479
FY14Performance
Rights1/07/2013 - 30/06/2016 30/06/17 n/a n/a 30/06/17 nil 776,579
Andrew Penn (5)
FY12Performance
Shares14/12/2011 - 14/12/2014 14/12/14 n/a n/a 14/12/14 nil 20,345
FY13Performance
Rights1/07/2012 - 30/06/2015 17/08/16 n/a n/a 30/06/16 nil 796,640
FY14Performance
Rights1/07/2013 - 30/06/2016 30/06/17 n/a n/a 30/06/17 nil 1,042,633
Brendon Riley
FY12Performance
Rights1/07/2011 - 30/06/2014 19/08/15 100 21.85% 30/06/15 nil 291,707
FY13Performance
Rights1/07/2012 - 30/06/2015 17/08/16 n/a n/a 30/06/16 nil 739,738
FY14Performance
Rights1/07/2013 - 30/06/2016 30/06/17 n/a n/a 30/06/17 nil 970,724
Total nil 13,557,957
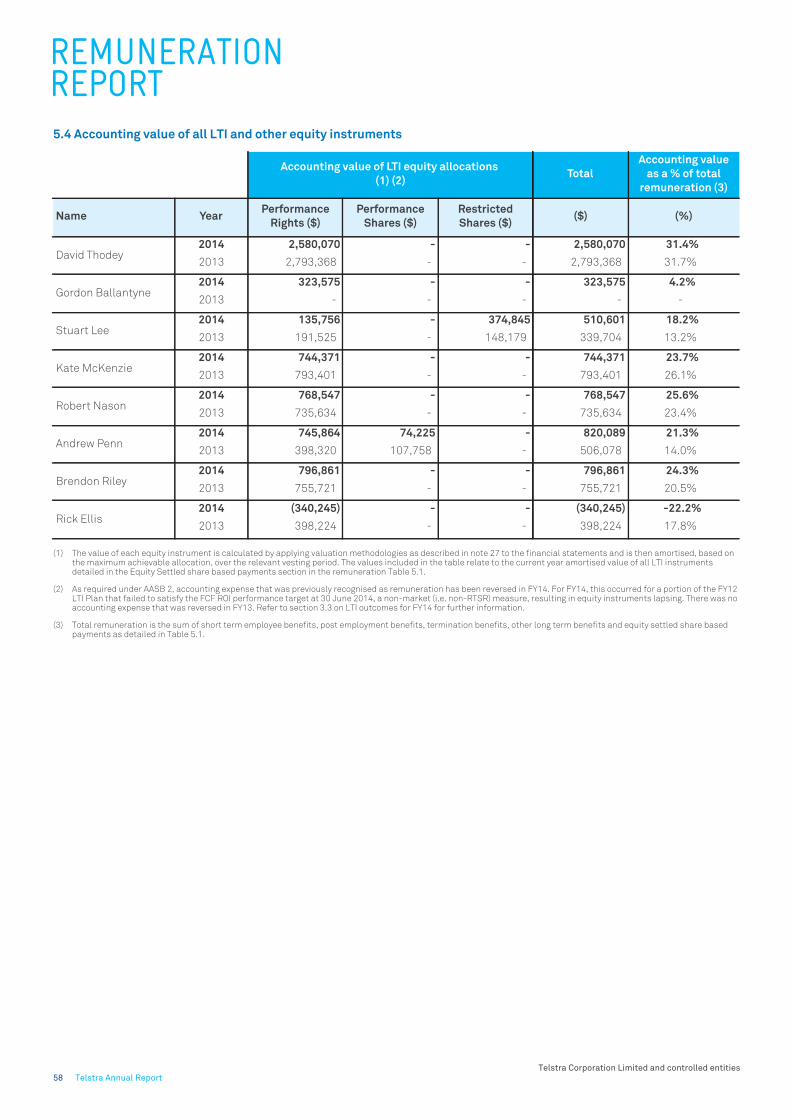
REMUNERATIONREPORT
Telstra Corporation Limited and controlled entities58 Telstra Annual Report
5.4 Accounting value of all LTI and other equity instruments
(1) The value of each equity instrument is calculated by applying valuation methodologies as described in note 27 to the financial statements and is then amortised, based on the maximum achievable allocation, over the relevant vesting period. The values included in the table relate to the current year amortised value of all LTI instruments detailed in the Equity Settled share based payments section in the remuneration Table 5.1.
(2) As required under AASB 2, accounting expense that was previously recognised as remuneration has been reversed in FY14. For FY14, this occurred for a portion of the FY12 LTI Plan that failed to satisfy the FCF ROI performance target at 30 June 2014, a non-market (i.e. non-RTSR) measure, resulting in equity instruments lapsing. There was no accounting expense that was reversed in FY13. Refer to section 3.3 on LTI outcomes for FY14 for further information.
(3) Total remuneration is the sum of short term employee benefits, post employment benefits, termination benefits, other long term benefits and equity settled share based payments as detailed in Table 5.1.
Accounting value of LTI equity allocations
(1) (2)Total
Accounting value
as a % of total
remuneration (3)
Name YearPerformance
Rights ($)
Performance
Shares ($)
Restricted
Shares ($)($) (%)
David Thodey 2014 2,580,070 - - 2,580,070 31.4%
2013 2,793,368 - - 2,793,368 31.7%
Gordon Ballantyne2014 323,575 - - 323,575 4.2%
2013 - - - - -
Stuart Lee2014 135,756 - 374,845 510,601 18.2%
2013 191,525 - 148,179 339,704 13.2%
Kate McKenzie2014 744,371 - - 744,371 23.7%
2013 793,401 - - 793,401 26.1%
Robert Nason2014 768,547 - - 768,547 25.6%
2013 735,634 - - 735,634 23.4%
Andrew Penn2014 745,864 74,225 - 820,089 21.3%
2013 398,320 107,758 - 506,078 14.0%
Brendon Riley2014 796,861 - - 796,861 24.3%
2013 755,721 - - 755,721 20.5%
Rick Ellis2014 (340,245) - - (340,245) -22.2%
2013 398,224 - - 398,224 17.8%

REMUNERATIONREPORT
Telstra Corporation Limited and controlled entitiesTelstra Annual Report 59
5.5
Nu
mb
er
of
eq
uit
y i
ns
tru
me
nts
gra
nte
d,
ve
ste
d a
nd
ex
erc
ise
d d
uri
ng
FY
14
(L
TI
an
d o
the
r e
qu
ity
)
In t
he
ta
ble
ab
ove
, ve
st
ha
s t
he
me
an
ing
de
fin
ed
in t
he
Au
str
ali
an
Ac
co
un
tin
g S
tan
da
rds
. A P
erf
orm
an
ce
Rig
ht
ves
ts w
he
n it
ha
s b
ee
n p
erf
orm
an
ce
te
ste
d a
nd
th
e r
es
ult
an
t R
es
tric
ted
Sh
are
ha
s b
ee
n r
ele
as
ed
fro
m r
es
tric
tio
n a
nd
pro
vid
ed
to
th
e e
xec
uti
ve. T
ab
le 5
.8 in
clu
de
s d
eta
ils
of
su
ch
Re
str
icte
d S
ha
res
all
oc
ate
d d
uri
ng
FY
14
.
All
se
rvic
e a
nd
pe
rfo
rma
nc
e c
on
dit
ion
s f
or
ea
ch
of
the
op
tio
ns
or
rig
hts
gra
nte
d in
pre
vio
us
fin
an
cia
l ye
ars
an
d t
ha
t h
ave
ve
ste
d o
r b
ee
n e
xerc
ise
d in
FY
14
are
su
mm
ari
se
d in
th
e R
em
un
era
tio
n R
ep
ort
fo
r e
ac
h r
ele
van
t ye
ar
of
gra
nt.
Ea
ch
e
qu
ity
ins
tru
me
nt
gra
nte
d,
ves
ted
or
exe
rcis
ed
in F
Y1
4 (
wh
ere
ap
pli
ca
ble
) in
th
e t
ab
le a
bo
ve w
as
iss
ue
d b
y T
els
tra
an
d r
es
ult
ed
or
wil
l re
su
lt in
on
e o
rdin
ary
Te
lstr
a s
ha
re p
er
eq
uit
y in
str
um
en
t g
ran
ted
, ve
ste
d o
r e
xerc
ise
d.
(1
) P
erf
orm
an
ce
Rig
hts
gra
nte
d o
n 1
6 O
cto
be
r 2
01
3 r
ela
te t
o t
he
FY
14
LT
I P
lan
. Th
e F
Y1
4 R
es
tric
ted
Sh
are
s g
ran
t to
Stu
art
Le
e o
n 1
5 A
ug
us
t 2
01
3 w
as
ma
de
in l
ieu
of
pa
rtic
ipa
tio
n in
th
e F
Y1
3 L
TI
Pla
n. S
ee
se
cti
on
2.2
.3 f
or
mo
re
info
rma
tio
n.
(2
)R
ela
tes
to
op
tio
ns
exe
rcis
ed
du
rin
g t
he
ye
ar
or
Pe
rfo
rma
nc
e R
igh
ts c
om
ing
ou
t o
f re
str
icti
on
or
Pe
rfo
rma
nc
e S
ha
res
be
ing
pro
vid
ed
as
sh
are
s. O
pti
on
s e
xerc
ise
d d
uri
ng
FY
14
re
late
to
th
e F
Y0
9 L
TI
Pla
n. P
erf
orm
an
ce
Rig
hts
ve
ste
d
du
rin
g F
Y1
4 r
ela
te t
o t
he
FY
10
LT
I P
lan
. Pe
rfo
rma
nc
e S
ha
res
ve
ste
d in
FY
14
are
th
e f
irs
t tr
an
ch
e o
f th
e P
erf
orm
an
ce
Sh
are
s a
llo
ca
ted
in F
Y1
2 f
or
An
dre
w P
en
n,
se
e f
oo
tno
te (
5)
in T
ab
le 5
.3. F
or
mo
re in
form
ati
on
on
ou
r K
MP
s’
inte
res
ts in
Te
lstr
a S
ha
res
re
fer
to T
ab
le 5
.8.
(3)
Re
late
s t
o P
erf
orm
an
ce
Rig
hts
la
ps
ing
or
be
ing
fo
rfe
ite
d d
ue
to
th
e s
pe
cif
ied
pe
rfo
rma
nc
e h
urd
les
no
t b
ein
g a
ch
ieve
d o
r K
MP
de
pa
rtin
g d
uri
ng
th
e y
ea
r.
(4)
Re
late
s t
o in
str
um
en
ts t
ha
t h
ave
be
en
pe
rfo
rma
nc
e t
es
ted
fo
r th
e p
erf
orm
an
ce
pe
rio
d e
nd
ing
on
30
Ju
ne
20
14
an
d m
et
the
sp
ec
ifie
d p
erf
orm
an
ce
hu
rdle
s. P
erf
orm
an
ce
Rig
hts
in t
his
co
lum
n r
ela
te t
o t
he
FY
12
LT
I P
lan
an
d w
ill
be
p
rovi
de
d a
s R
es
tric
ted
Sh
are
s e
arl
y in
FY
15
.
(5)
Re
late
s t
o in
str
um
en
ts t
ha
t h
ave
me
t th
e s
pe
cif
ied
pe
rfo
rma
nc
e h
urd
les
as
at
30
Ju
ne
20
14
. Pe
rfo
rma
nc
e R
igh
ts in
th
is c
olu
mn
inc
lud
e t
he
FY
12
LT
I Pla
n t
ha
t w
as
pe
rfo
rma
nc
e t
es
ted
at
the
en
d o
f F
Y1
4 a
s w
ell
as
th
e F
Y1
1 L
TI P
lan
th
at
wa
s p
erf
orm
an
ce
te
ste
d a
t th
e e
nd
of
FY
13
an
d h
ave
be
en
pro
vid
ed
as
Re
str
icte
d S
ha
res
du
rin
g F
Y1
4. T
he
FY
12
LT
I P
lan
wil
l b
e p
rovi
de
d a
s R
es
tric
ted
Sh
are
s in
th
e n
ext
fin
an
cia
l ye
ar.
Fo
r m
ore
info
rma
tio
n o
n o
ur
KM
Ps
’ in
tere
sts
in T
els
tra
Sh
are
s r
efe
r to
Ta
ble
5.8
.
(^
) T
he
re a
re n
o P
erf
orm
an
ce
Rig
hts
or
op
tio
ns
he
ld in
dir
ec
tly
or
be
ne
fic
iall
y b
y o
ur
KM
P o
r th
eir
re
late
d p
art
ies
.
(*
)A
s a
t 3
0 J
un
e 2
01
4,
the
re w
ere
no
op
tio
ns
or
Pe
rfo
rma
nc
e R
igh
ts v
es
ted
, ve
ste
d a
nd
exe
rcis
ab
le o
r ve
ste
d a
nd
un
exe
rcis
ab
le.
Eq
uit
y m
ov
em
en
tsE
qu
ity
ou
tco
me
s
Na
me
Ins
tru
me
nt
Tota
l h
eld
at
30
Ju
ne
20
13
(^
)
Gra
nte
d d
uri
ng
FY
14
(1
)
Ve
ste
d /
ex
erc
ise
d
du
rin
g F
Y1
4 (
2)
Oth
er
ch
an
ge
s
(3)
Tota
l h
eld
at
30
Ju
ne
20
14
(^
)(*
)
Ac
hie
ve
d
pe
rfo
rma
nc
e
targ
et
du
rin
g
FY
14
(4)
Ac
hie
ve
d
pe
rfo
rma
nc
e
targ
et
as
at
30
Ju
ne
20
14
(5)
Da
vid
Th
od
ey
Op
tio
ns
38
9,5
47
-(3
89
,54
7)
--
--
Pe
rfo
rma
nc
e R
igh
ts5
,04
0,1
28
1,0
41
,25
6(7
25
,27
4)
(34
2,5
74
)5
,01
3,5
36
1,2
25
,27
22
,58
1,2
04
Go
rdo
n B
all
an
tyn
eP
erf
orm
an
ce
Rig
hts
-4
24
,36
0-
-4
24
,36
0-
-
Stu
art
Le
e
Op
tio
ns
81
,55
5-
(81
,55
5)
--
--
Pe
rfo
rma
nc
e R
igh
ts4
38
,11
1-
(12
6,9
23
)-
31
1,1
88
-3
11
,18
8
Re
str
icte
d S
ha
res
11
6,3
71
13
3,5
95
--
24
9,9
66
--
TE
SO
P9
94
00
--
-4
00
--
Ka
te M
cK
en
zie
Op
tio
ns
14
8,7
20
-(1
48
,72
0)
--
--
Pe
rfo
rma
nc
e R
igh
ts1
,40
1,6
23
32
6,9
16
(19
0,3
85
)(1
06
,79
1)
1,4
31
,36
33
81
,95
56
84
,49
9
Ro
be
rt N
as
on
Pe
rfo
rma
nc
e R
igh
ts1
,34
1,7
85
33
9,4
88
(92
,47
3)
(11
2,4
11
)1
,47
6,3
89
40
2,0
57
69
5,9
57
An
dre
w P
en
nP
erf
orm
an
ce
Rig
hts
58
7,9
26
45
5,7
96
--
1,0
43
,72
2-
-
Pe
rfo
rma
nc
e S
ha
res
96
,50
0-
(48
,25
0)
-4
8,2
50
--
Bre
nd
on
Ril
ey
Pe
rfo
rma
nc
e R
igh
ts1
,18
9,0
18
42
4,3
60
-(1
40
,51
4)
1,4
72
,86
45
02
,57
25
02
,57
2
Ric
k E
llis
Pe
rfo
rma
nc
e R
igh
ts6
13
,53
22
90
,76
6-
(78
3,3
67
)1
20
,93
11
20
,93
11
20
,93
1

REMUNERATIONREPORT
Telstra Corporation Limited and controlled entities60 Telstra Annual Report
5.6 Value of LTI and other equity instruments granted, exercised and expired/forfeited in FY14
(1) The grant date of the FY14 LTI Plan was 16 October 2013. The fair value of the RTSR and FCF ROI Performance Rights granted in FY14 at the grant date is $1.97 and $4.13 respectively. The fair value reflects the valuation approach required by AASB 2 using an option pricing model, as explained in note 27 to the financial statements.
(2) The FY14 Restricted Share grant to Stuart Lee was made in lieu of participation in the FY13 LTI Plan. See section 2.2.3 for more information. The fair value of Restricted Shares granted on 15 August 2013 was $5.09 and is based on the market value of Telstra shares on allocation.
(3) The value of the equity instruments exercised reflects the market value at the date of exercise after deducting any exercise price paid. The exercise price for options exercised was $4.36 for the FY09 LTI Plan.
(4) The value of equity instruments that have lapsed during the year represents the value foregone and is calculated at the date the equity instruments lapsed using valuation methodologies as described in note 27 to the financial statements.
Granted during period ($)
(1) (2)
Vested/exercised ($)
(3)
Expired/forfeited
($) (4)
NamePerformance
Rights
Restricted
Shares
Performance
RightsOptions
Performance
Shares
Performance
Rights
David Thodey 3,175,831 - 3,568,348 296,056 - 1,658,202
Gordon Ballantyne 1,294,298 - - - - -
Stuart Lee - 679,999 624,461 66,875 - -
Kate McKenzie 997,094 - 936,694 135,335 - 516,910
Robert Nason 1,035,438 - 454,967 - - 544,117
Andrew Penn 1,390,178 - - - 239,803 -
Brendon Riley 1,294,298 - - - - 680,145
Rick Ellis 886,836 - - - - 3,582,761

REMUNERATIONREPORT
Telstra Corporation Limited and controlled entitiesTelstra Annual Report 61
5.7 Non-executive Director remuneration
(1) Includes fees for membership on Board Committees.
(2) For FY14, Telstra has applied the exemption for transactions with KMP that are not remuneration and are trivial or domestic in nature (Corporations Regulation 2M.3.03 (3B)) such as Foxtel or the provision of phones or computers. The non-monetary value of $4,425 for FY14 is the value of a car parking benefit.
(3) Due to an administrative error, we made insufficient superannuation contributions for Geoffrey Cousins of $13,331. Salary and fees were overpaid by $4,444 in FY14. The amounts actually paid are included in the table above. The overpayment and the under contribution of superannuation will be rectified in FY15.
(4) Chin Hu Lim was appointed as a non-executive Director on 9 August 2013 and the amount included in the table above is for the period 9 August 2013 to 30 June 2014. Due to an administrative error, excess superannuation contributions of $2,274 were made. The amounts actually paid are included in the table above, The excess contribution will be rectified in FY15.
(5) In the 2013 Remuneration Report, Steven Vamos’ Superannuation Component was overstated by $7,898 and his Salary and Fees was understated by the same amount. However the overall total of $272,546 as disclosed in the 2013 Remuneration Report is correct. These amounts have been restated in the table above.
(6) In the 2013 Remuneration Report the Total Remuneration for Non-executive Directors was $2,775,713. The above table show a 2013 total of $2,621,999. The difference is represented by $71,753 for Timothy Y Chen and $81,961 for John W Stocker who were not KMP for any part of FY14.
(7) As Chin Hu Lim and John Zeglis are overseas residents, their superannuation contributions for FY14 are less than the contributions for Australian resident non-executive Directors.
Short term employee benefitsPost-employment
benefits
Name YearSalary and fees ($)
(1)
Non-monetary
benefits ($) (2)Superannuation ($) Total ($)
Catherine B Livingstone 2014 687,225 4,425 17,775 709,425
Chairman 2013 688,530 5,952 16,470 710,952
Geoffrey A Cousins (3) 2014 267,000 - 4,444 271,444
Director 2013 250,530 - 16,470 267,000
Russell A Higgins 2014 252,225 - 17,775 270,000
Director 2013 253,530 388 16,470 270,388
Chin Hu Lim (4) (7) 2014 199,033 - 5,701 204,734
Director 2013 - - - -
John P Mullen 2014 274,225 - 17,775 292,000
Director 2013 275,530 1,013 16,470 293,013
Nora L Scheinkestel 2014 287,225 - 17,775 305,000
Director 2013 288,530 - 16,470 305,000
Margaret L Seale 2014 252,225 - 17,775 270,000
Director 2013 243,366 - 16,470 259,836
Steven M Vamos (5) 2014 249,225 - 17,775 267,000
Director 2013 251,153 1,902 19,491 272,546
John D Zeglis (7) 2014 230,672 - 4,328 235,000
Director 2013 225,204 1,590 16,470 243,264
Total (6)2014 2,699,055 4,425 121,123 2,824,603
2013 2,476,373 10,845 134,781 2,621,999

REMUNERATIONREPORT
Telstra Corporation Limited and controlled entities62 Telstra Annual Report
5.8 KMP interests in shares of the Telstra entity
During FY14, our KMP and their related parties held share capital of the Telstra Entity directly, indirectly or beneficially as follows:
Each equity instrument exercised or granted in FY14 (where applicable) in the table above, was issued by Telstra and resulted or will result in one ordinary Telstra share per equity instrument exercised or granted.
(1) Total shareholdings include shares held by our KMP and their related parties. Unless related to our employee share plans, shares acquired or disposed by our KMP during FY14 were on an arm’s length basis at market price.
(2) STI Restricted Shares granted during FY14 relate to the FY13 STI Plan which were allocated on 1 July 2013. However, the allocation of Restricted Shares under the FY14 STI Plan will be made subsequent to the reporting date of 30 June 2014, therefore they have not been included in the table above.
(3) This column relates to those equity instruments that have been performance tested last financial year and have been provided as Restricted Shares during this financial year. For FY14, this relates to the FY11 LTI Plan.
(4) For Nora Scheinkestel, refers to a shareholding in which she has no beneficial interest and which no longer meets the requisite criteria for a related party shareholding. For all others, refers to shares acquired or disposed of by other means.
(5) Nominally refers to shares held either indirectly or beneficially, including (for non-executive Directors) those acquired under Directshare, as well as (for Senior Executives) certain Restricted Shares. These shares are subject to a Restriction Period, such that the non-executive Director or Senior Executive is restricted from dealing with the shares until the Restriction Period ends. Refer to note 27 to the financial statements for further details.
(6) For Rick Ellis who left Telstra during the year, the quantity represents shares held as at the date of cessation as a KMP.
(*) The opening balance has been adjusted to include those instruments that were performance tested and became Restricted Shares during prior periods, due to regulatory changes and a change in the way we have treated these instruments for disclosure purposes. An additional adjustment was also made to Stuart Lee’s opening balance due to a restatement of a related party’s opening balance.
Total shares
held at
30 June 2013
(1)
Equity instru-
ments vested/
exercised
STI Restricted
Shares
granted (2)
LTI Restricted
Shares
received
during FY14
(3)
Net shares
acquired or
disposed of
and other
changes (4)
Total shares
held at
30 June 2014
(1)
Shares held
nominally at
30 June 2014
(5)
Non-Executive Directors
Catherine B Livingstone 175,816 - - - 10,000 185,816 181,922
Geoffrey A Cousins 81,765 - - - 20,000 101,765 21,765
Russell A Higgins 88,404 - - - - 88,404 83,084
Chin Hu Lim - - - - - - -
John P Mullen 26,159 - - - - 26,159 26,159
Nora L Scheinkestel 87,297 - - - (13,182) 74,115 74,115
Margaret L Seale 235,755 - - - 4,886 240,641 240,641
Steven M Vamos 40,000 - - - - 40,000 40,000
John D Zeglis 103,993 - - - - 103,993 37,493
Total 839,189 - - - 21,704 860,893 705,179
Senior Executives
David Thodey (*) 1,735,326 389,547 172,718 1,355,932 (334,520) 3,319,003 3,319,003
Gordon Ballantyne 196,558 - 78,400 - - 274,958 133,395
Stuart Lee (*) 563,276 81,555 62,622 444,783 (69,375) 1,082,861 746,118
Kate McKenzie (*) 441,676 148,720 62,720 302,544 (148,720) 806,940 407,061
Robert Nason (*) 259,251 - 68,436 293,900 - 621,587 431,332
Andrew Penn 138,909 48,250 91,248 - - 278,407 175,910
Brendon Riley 293,407 - 81,537 - 8,365 383,309 296,602
Rick Ellis (6) 56,607 - 47,794 - - 104,401 73,098
Total 3,685,010 668,072 665,475 2,397,159 (544,250) 6,871,466 5,582,519
4,524,199 668,072 665,475 2,397,159 (522,546) 7,732,359 6,287,698

REMUNERATIONREPORT
Telstra Corporation Limited and controlled entitiesTelstra Annual Report 63
5.9 Glossary
Average Investment for LTI Average investment over the period is the average of the sum of net debt and shareholders’ funds over the entire three year performance period
EBITDA Earnings Before Interest, Tax, Depreciation and Amortisation
EBITDA for STI Earnings Before Interest, Tax, Depreciation and Amortisation (excluding profit/loss on Land & Building disposals)
FCF for LTI FCF for these purposes is annual Free Cashflow less interest paid and adjusting for non-recurring factors such as spectrum purchases, acquisitions and gains on the sale of assets
FCF ROI for LTI A ratio of the average annual Free Cashflow over the entire three year performance period by Telstra’s average investment over the same period
FCF for STI Free Cashflow (excluding CAPEX for Investment and Spectrum; and proceeds from Land & Building disposals)
Fixed Remuneration Base salary plus company and private salary sacrificed superannuation contributions. Specifically defined as Total Fixed Remuneration in the CEO’s contract
Free Cashflow (FCF) Cashflow from operating and investing activities
GE Group Executive
GMD Group Managing Director
KMP Key Management Personnel
LTI Long Term Incentive
NBN National Broadband Network
NBN Transaction Agreements with NBN Co and the Government in relation to Telstra’s participation in the rollout of the NBN
NPS Net Promoter Score. A non financial measure in Telstra’s STI Plan. Refer to section 2.2.1 for further information
Performance Right A right to a Restricted Share at the end of a performance period, subject to the satisfaction of certain performance measures
Permitted Reason (LTI) Death, total and permanent disablement, redundancy, separation by mutual agreement or retirement where notice of retirement is given six months after the actual date of allocation.
Permitted Reason (STI) Death, total and permanent disablement or redundancy or retirement or fixed-term contract expiry where that notice of retirement is given, or fixed term contract expiry occurs, more than six months after the actual allocation date
Performance Share A right to a Telstra share at the end of a performance period, subject to the satisfaction of certain performance measures
Restricted Share A Telstra share that is subject to a Restriction Period
Restriction Period A period during which a Telstra share is subject to a service condition and cannot be traded. Once the Restriction Period ends, the shares are still subject to the Telstra Securities Trading Policy.
RTSR Relative Total Shareholder Return
Senior Executive Refers to the Chief Executive Officer and those executives with authority and responsibility for planning, directing and controlling the activities of the company and Group, directly or indirectly
Service Agreement A Senior Executive’s contract of employment
SSU Structural Separation Undertaking
STI Short Term Incentive
STI Deferral Plan A plan under which Senior Executives are provided with a percentage of their actual STI payment in the form of Restricted Shares
Straight-line Vesting Describes the vesting calculation between target and stretch of an LTI plan, where the payout between two levels is based on equal increments determined by performance
Total Income Total Telstra Income excluding profit/loss on Land & Building disposals
Total Remuneration The sum of all the fixed and variable components of remuneration as detailed in Table 5.1 for Senior Executives, and all the remuneration components as detailed in Table 5.7 for non-executive Directors

DIRECTORS'REPORT
Ernst & Young680 George Street Sydney NSW 2000 AustraliaGPO Box 2646 Sydney NSW 2001Tel: +61 2 9248 5555Fax: +61 2 9248 5959ey.com/au
Telstra Corporation Limited and controlled entities64 Telstra Annual Report
Rounding of amounts
The Telstra Entity is a company of the kind referred to in the
Australian Securities and Investments Commission Class Order
98/100, dated 10 July 1998 and issued pursuant to section 341(1)
of the Corporations Act 2001. As a result, amounts in this
Directors’ Report and the accompanying financial report have
been rounded to the nearest million dollars ($m), except where
otherwise indicated.
This report is made on 14 August 2014 in accordance with a
resolution of the Directors.
Catherine B Livingstone AO
Chairman
14 August 2014
David I Thodey
Chief Executive Officer and Executive Director
14 August 2014
Auditor’s Independence Declaration to the Directors of
Telstra Corporation Limited
In relation to our audit of the financial report of Telstra
Corporation Limited for the financial year ended 30 June 2014, to
the best of my knowledge and belief, there have been no
contraventions of the auditor independence requirements of the
Corporations Act 2001 or any applicable code of professional
conduct.
Ernst & Young
SJ Ferguson
Partner
Sydney
14 August 2014
A member firm of Ernst & Young Global Limited Liability limited by a scheme approved under Professional Standards Legislation

Telstra Corporation Limited and controlled entitiesTelstra Annual Report 65
Financial ReportTELSTRA CORPORATION LIMITED AND CONTROLLED ENTITIESAustralian Business Number (ABN): 33 051 775 556
FINANCIAL REPORTas at 30 June 2014
Page
number
Financial Statements
Income Statement ....................................................................................................................................................................................... 66
Statement of Comprehensive Income........................................................................................................................................................ 67
Statement of Financial Position ................................................................................................................................................................. 68
Statement of Cash Flows ............................................................................................................................................................................ 69
Statement of Changes in Equity ................................................................................................................................................................. 70
Notes to the Financial Statements
Note 1 - Basis of preparation ............................................................................................................................................................. 71
Note 2 - Summary of significant accounting policies, estimates, assumptions and judgements............................................... 72
Note 3 - Earnings per share ............................................................................................................................................................... 90
Note 4 - Dividends............................................................................................................................................................................... 91
Note 5 - Segment information............................................................................................................................................................ 92
Note 6 - Income ................................................................................................................................................................................... 97
Note 7 - Expenses ............................................................................................................................................................................... 98
Note 8 - Remuneration of auditors .................................................................................................................................................... 100
Note 9 - Income taxes ......................................................................................................................................................................... 101
Note 10 - Trade and other receivables................................................................................................................................................. 103
Note 11 - Inventories............................................................................................................................................................................. 106
Note 12 - Non current assets held for sale and discontinued operation ......................................................................................... 107
Note 13 - Property, plant and equipment............................................................................................................................................ 110
Note 14 - Intangible assets .................................................................................................................................................................. 112
Note 15 - Trade and other payables..................................................................................................................................................... 115
Note 16 - Provisions .............................................................................................................................................................................. 116
Note 17 - Capital management and financial instruments ............................................................................................................... 118
Note 18 - Financial risk management ................................................................................................................................................. 128
Note 19 - Share capital ......................................................................................................................................................................... 144
Note 20 - Notes to the statement of cash flows ................................................................................................................................. 145
Note 21 - Impairment............................................................................................................................................................................ 149
Note 22 - Expenditure commitments .................................................................................................................................................. 151
Note 23 - Contingent liabilities and contingent assets...................................................................................................................... 153
Note 24 - Post employment benefits ................................................................................................................................................... 154
Note 25 - Investments in controlled entities....................................................................................................................................... 160
Note 26 - Investments in joint ventures and associated entities...................................................................................................... 169
Note 27 - Employee share plans .......................................................................................................................................................... 174
Note 28 - Key management personnel compensation....................................................................................................................... 187
Note 29 - Related party disclosures .................................................................................................................................................... 188
Note 30 - Parent entity information..................................................................................................................................................... 191
Note 31 - Events after reporting date.................................................................................................................................................. 193
Directors’ Declaration................................................................................................................................................................................. 194
Independent Auditor’s Report................................................................................................................................................................... 195

Telstra Corporation Limited and controlled entities66 Telstra Annual Report
The notes following the financial statements form part of the financial report.
INCOME STATEMENTFor the year ended 30 June 2014
Telstra Group
Year ended 30 June
Restated
2014 2013
Note $m $m
Continuing operations
Income
Revenue (excluding finance income).................................................................................................................. 6 25,320 24,474
Other income........................................................................................................................................................ 6 976 302
26,296 24,776
Expenses
Labour..................................................................................................................................................................... 4,732 4,527
Goods and services purchased............................................................................................................................. 6,465 6,247
Other expenses .................................................................................................................................................... 7 3,988 3,833
15,185 14,607
Share of net profit/(loss) from joint ventures and associated entities ......................................................... 26 24 (1)
15,161 14,608
Earnings before interest, income tax expense, depreciation and amortisation (EBITDA)............................... 11,135 10,168
Depreciation and amortisation........................................................................................................................... 7 3,950 4,078
Earnings before interest and income tax expense (EBIT)................................................................................... 7,185 6,090
Finance income.................................................................................................................................................... 6 156 219
Finance costs ....................................................................................................................................................... 7 1,113 1,152
Net finance costs................................................................................................................................................... 957 933
Profit before income tax expense....................................................................................................................... 6,228 5,157
Income tax expense ............................................................................................................................................. 9 1,679 1,517
Profit for the year from continuing operations ................................................................................................. 4,549 3,640
Discontinued operation
(Loss)/profit for the year from discontinued operation .................................................................................. 12 (204) 151
Profit for the year from continuing and discontinued operations ................................................................. 4,345 3,791
Attributable to
Equity holders of Telstra Entity............................................................................................................................. 4,275 3,739
Non-controlling interests...................................................................................................................................... 70 52
4,345 3,791
Earnings per share from continuing operations (cents per share) cents cents
Basic ..................................................................................................................................................................... 3 36.1 28.9
Diluted .................................................................................................................................................................. 3 36.0 28.8
Earnings per share (cents per share)
Basic ..................................................................................................................................................................... 3 34.4 30.1
Diluted .................................................................................................................................................................. 3 34.3 30.0
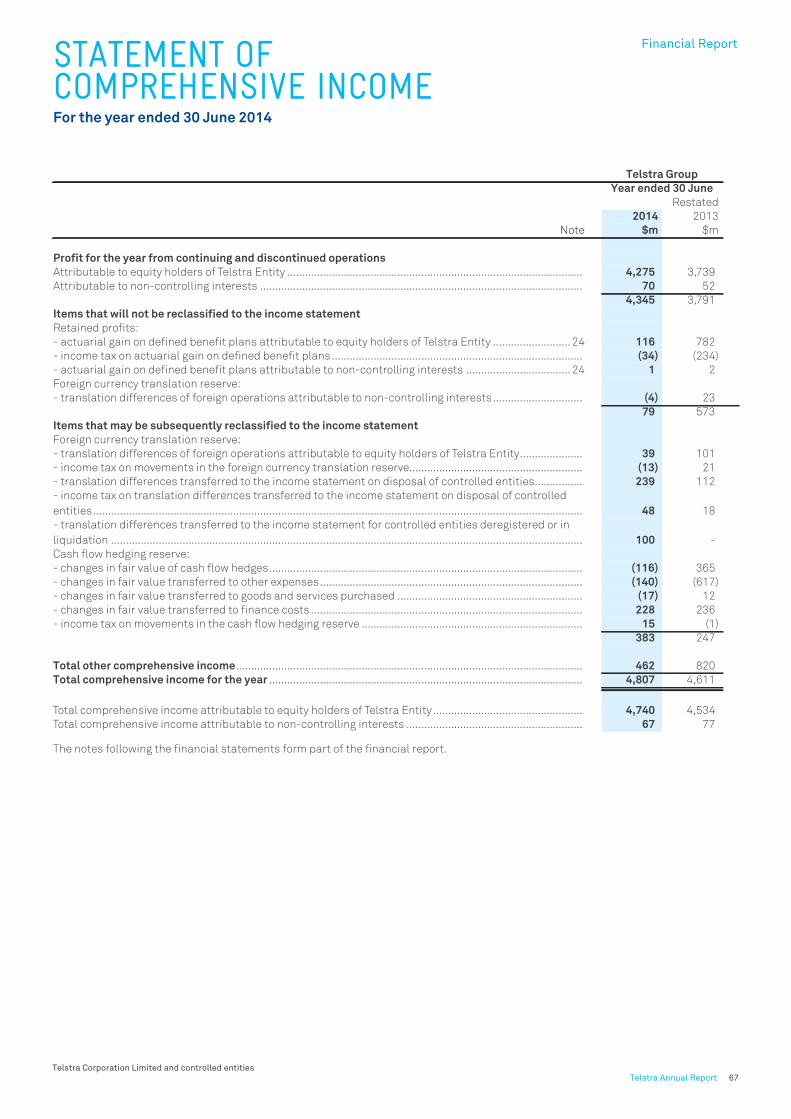
Telstra Corporation Limited and controlled entitiesTelstra Annual Report 67
Financial Report
The notes following the financial statements form part of the financial report.
STATEMENT OF COMPREHENSIVE INCOMEFor the year ended 30 June 2014
Telstra Group
Year ended 30 June
Restated
2014 2013
Note $m $m
Profit for the year from continuing and discontinued operations
Attributable to equity holders of Telstra Entity ................................................................................................... 4,275 3,739
Attributable to non-controlling interests ............................................................................................................ 70 52
4,345 3,791
Items that will not be reclassified to the income statement
Retained profits:
- actuarial gain on defined benefit plans attributable to equity holders of Telstra Entity .......................... 24 116 782
- income tax on actuarial gain on defined benefit plans .................................................................................... (34) (234)
- actuarial gain on defined benefit plans attributable to non-controlling interests ................................... 24 1 2
Foreign currency translation reserve:
- translation differences of foreign operations attributable to non-controlling interests.............................. (4) 23
79 573
Items that may be subsequently reclassified to the income statement
Foreign currency translation reserve:
- translation differences of foreign operations attributable to equity holders of Telstra Entity..................... 39 101
- income tax on movements in the foreign currency translation reserve.......................................................... (13) 21
- translation differences transferred to the income statement on disposal of controlled entities................ 239 112
- income tax on translation differences transferred to the income statement on disposal of controlled
entities.................................................................................................................................................................... 48 18
- translation differences transferred to the income statement for controlled entities deregistered or in
liquidation .............................................................................................................................................................. 100 -
Cash flow hedging reserve:
- changes in fair value of cash flow hedges......................................................................................................... (116) 365
- changes in fair value transferred to other expenses........................................................................................ (140) (617)
- changes in fair value transferred to goods and services purchased .............................................................. (17) 12
- changes in fair value transferred to finance costs ........................................................................................... 228 236
- income tax on movements in the cash flow hedging reserve .......................................................................... 15 (1)
383 247
Total other comprehensive income.................................................................................................................... 462 820
Total comprehensive income for the year ......................................................................................................... 4,807 4,611
Total comprehensive income attributable to equity holders of Telstra Entity .................................................. 4,740 4,534
Total comprehensive income attributable to non-controlling interests ........................................................... 67 77

Telstra Corporation Limited and controlled entities68 Telstra Annual Report
The notes following the financial statements form part of the financial report.
STATEMENT OF FINANCIAL POSITIONAs at 30 June 2014
Telstra Group
As at 30 June
2014 2013
Note $m $m
Current assets
Cash and cash equivalents ............................................................................................................................... 20 5,527 2,479
Trade and other receivables.............................................................................................................................. 10 4,172 4,557
Inventories.......................................................................................................................................................... 11 362 431
Derivative financial assets............................................................................................................................ 17(f) 23 43
Current tax receivables ......................................................................................................................................... 2 79
Prepayments .......................................................................................................................................................... 329 314
Assets classified as held for sale ..................................................................................................................... 12 23 -
Total current assets ............................................................................................................................................... 10,438 7,903
Non current assets
Trade and other receivables.............................................................................................................................. 10 973 943
Inventories.......................................................................................................................................................... 11 29 27
Investments - accounted for using the equity method .................................................................................. 26 196 18
Investments - other ............................................................................................................................................... 127 38
Property, plant and equipment......................................................................................................................... 13 19,842 20,326
Intangible assets ............................................................................................................................................... 14 6,382 8,202
Derivative financial assets............................................................................................................................ 17(f) 1,322 1,062
Deferred tax assets.............................................................................................................................................. 9 7 5
Defined benefit asset ........................................................................................................................................ 24 44 3
Total non current assets........................................................................................................................................ 28,922 30,624
Total assets ........................................................................................................................................................... 39,360 38,527
Current liabilities
Trade and other payables.................................................................................................................................. 15 3,834 4,241
Provisions ........................................................................................................................................................... 16 932 918
Borrowings .....................................................................................................................................................17(a) 2,277 751
Derivative financial liabilities ....................................................................................................................... 17(f) 400 44
Current tax payables ............................................................................................................................................. 296 444
Revenue received in advance................................................................................................................................ 926 1,124
Liabilities classified as held for sale ................................................................................................................ 12 19 -
Total current liabilities........................................................................................................................................... 8,684 7,522
Non current liabilities
Other payables ................................................................................................................................................... 15 66 163
Provisions ........................................................................................................................................................... 16 261 276
Borrowings .....................................................................................................................................................17(a) 13,547 14,313
Derivative financial liabilities ....................................................................................................................... 17(f) 1,169 1,625
Deferred tax liabilities ......................................................................................................................................... 9 1,286 1,330
Defined benefit liability ..................................................................................................................................... 24 - 42
Revenue received in advance................................................................................................................................ 387 381
Total non current liabilities ................................................................................................................................... 16,716 18,130
Total liabilities ...................................................................................................................................................... 25,400 25,652
Net assets .............................................................................................................................................................. 13,960 12,875
Equity
Share capital ...................................................................................................................................................... 19 5,719 5,711
Reserves ................................................................................................................................................................. (228) (619)
Retained profits ..................................................................................................................................................... 8,331 7,519
Equity available to Telstra Entity shareholders................................................................................................... 13,822 12,611
Non-controlling interests...................................................................................................................................... 138 264
Total equity............................................................................................................................................................ 13,960 12,875

Telstra Corporation Limited and controlled entitiesTelstra Annual Report 69
Financial Report
The notes following the financial statements form part of the financial report.
STATEMENT OF CASH FLOWSFor the year ended 30 June 2014
Telstra Group
Year ended 30 June
2014 2013
Note $m $m
Cash flows from operating activities
Receipts from customers (inclusive of goods and services tax (GST)) .............................................................. 28,950 28,585
Payments to suppliers and to employees (inclusive of GST).............................................................................. (18,710) (18,803)
Government grants received................................................................................................................................. 147 77
Net cash generated by operations ....................................................................................................................... 10,387 9,859
Income taxes paid.................................................................................................................................................. (1,774) (1,500)
Net cash provided by operating activities.................................................................................................20(a) 8,613 8,359
Cash flows from investing activities
Payments for:
- property, plant and equipment .......................................................................................................................... (2,868) (2,818)
- intangible assets ................................................................................................................................................. (894) (1,691)
Capital expenditure (before investments) ........................................................................................................... (3,762) (4,509)
- shares in controlled entities (net of cash acquired).................................................................................20(c) (165) (9)
- payments for joint ventures and associated entities............................................................................... 26(f) (3) (8)
- payments for other investments........................................................................................................................ (88) (19)
Total capital expenditure (including investments).............................................................................................. (4,018) (4,545)
Proceeds from:
- sale of property, plant and equipment .............................................................................................................. 94 57
- sale of intangible assets..................................................................................................................................... - 12
- sale of shares in controlled entities (net of cash disposed) ....................................................................20(d) 2,397 693
- sale of businesses (net of cash disposed) ........................................................................................................ - 4
Proceeds from finance lease principal amounts ................................................................................................ 98 64
Loans to joint ventures and associated entities ................................................................................................. - (1)
Interest received .................................................................................................................................................... 150 236
Settlement of hedges in net investments............................................................................................................ (21) (11)
Investments in financial instruments .................................................................................................................. 4 -
Dividends received................................................................................................................................................. 1 1
Distributions received from Foxtel Partnership ................................................................................................ 6 165 155
Net cash used in investing activities ................................................................................................................. (1,130) (3,335)
Operating cash flows less investing cash flows ............................................................................................... 7,483 5,024
Cash flows from financing activities
Proceeds from borrowings .................................................................................................................................... 1,572 2,074
Repayment of borrowings ..................................................................................................................................... (1,387) (4,042)
Repayment of finance lease principal amounts ................................................................................................. (91) (97)
Proceeds from sale and finance lease back transactions ................................................................................. - 52
Staff repayments of share loans .......................................................................................................................... 3 4
Purchase of shares for employee share plans .................................................................................................... (61) -
Proceeds received from exercise of equity instruments .................................................................................... 29 29
Finance costs paid................................................................................................................................................. (947) (1,037)
Issue of equity by controlled entities ...........................................................................................................20(c) 160 -
Payment for share buy-back of non-controlling interests .........................................................................20(c) (149) (1)
Proceeds from sale of controlled entity shares on behalf of non-controlling interests .................................. 8 -
Dividends paid to equity holders of Telstra Entity............................................................................................. 4 (3,545) (3,480)
Dividends paid to non-controlling interests ........................................................................................................ (22) (28)
Net cash used in financing activities ................................................................................................................. (4,430) (6,526)
Net increase/(decrease) in cash and cash equivalents ................................................................................... 3,053 (1,502)
Cash and cash equivalents at the beginning of the year.................................................................................... 2,479 3,945
Effects of exchange rate changes on cash and cash equivalents ..................................................................... (5) 36
Cash and cash equivalents at the end of the year ....................................................................................20(b) 5,527 2,479

Telstra Corporation Limited and controlled entities70 Telstra Annual Report
STATEMENT OF CHANGES IN EQUITYFor the year ended 30 June 2014
Telstra Group
Reserves
Foreign
currency Non-
transla- Cash flow General control-
Share tion hedging reserve Retained ling Total
capital (a) (b) (c) profits Total interests equity
$m $m $m $m $m $m $m $m
Balance at 1 July 2012....................... 5,635 (751) (87) (29) 6,712 11,480 209 11,689
Profit for the year (restated)............... - - - - 3,739 3,739 52 3,791
Other comprehensive income (restated) - 252 (5) - 548 795 25 820
Total comprehensive income for the
year ...................................................... - 252 (5) - 4,287 4,534 77 4,611
Dividends ............................................. - - - - (3,480) (3,480) (28) (3,508)
Transactions with non-controlling
interests............................................... - - - 1 - 1 - 1
Amounts repaid on share loans
provided to employees........................ 47 - - - - 47 - 47
Additional shares purchased............. (42) - - - - (42) - (42)
Exercise of employee share options.. 29 - - - - 29 - 29
Share-based payments...................... 42 - - - - 42 6 48
Balance at 30 June 2013 ................... 5,711 (499) (92) (28) 7,519 12,611 264 12,875
Profit for the year ................................ - - - - 4,275 4,275 70 4,345
Other comprehensive income............ - 413 (30) - 82 465 (3) 462
Total comprehensive income for the
year ...................................................... - 413 (30) - 4,357 4,740 67 4,807
Dividends ............................................. - - - - (3,545) (3,545) (22) (3,567)
Non-controlling interests on
acqusitions.......................................... - - - - - - 6 6
Non-controlling interests on disposals - - - - - - (198) (198)
Transactions with non-controlling
interests (d) ......................................... - - - 8 - 8 13 21
Amounts repaid on share loans
provided to employees........................ 3 - - - - 3 - 3
Additional shares purchased............. (61) - - - - (61) - (61)
Exercise of employee share options.. 29 - - - - 29 - 29
Share-based payments...................... 37 - - - - 37 8 45
Balance at 30 June 2014 ................... 5,719 (86) (122) (20) 8,331 13,822 138 13,960
The notes following the financial statements form part of the financial report.
(a) The foreign currency translation reserve is used to record
exchange differences arising from the conversion of the non-
Australian controlled entities’ financial statements into
Australian dollars. This reserve is also used to record our
percentage share of exchange differences arising from equity
accounting our non-Australian investments in joint ventures and
associated entities.
(b) The cash flow hedging reserve represents the effective portion
of gains or losses on remeasuring the fair value of the hedge
instrument, where a hedge qualifies for hedge accounting. These
gains or losses are transferred to the income statement when the
hedged item affects income or, in the case of forecast
transactions, is included in the measurement of the initial cost of
property, plant and equipment or inventory.
(c) The general reserve represents other items we have taken
directly to equity.
(d) During the year we decreased our ownership of Autohome Inc.
from 66.0 per cent at 30 June 2013 to 63.2 per cent at 30 June 2014
via share buy-back, subsequent initial public offering and employee
share issues. We also acquired the non-controlling interests of the
Octave Group. Neither of these transactions resulted in a change of
control. Changes in valuation of non-controlling interests resulting
from these transactions are recorded in the general reserve. Refer to
note 20 for further details.

NOTES TO THE FINANCIAL STATEMENTS
Financial Report
Telstra Corporation Limited and controlled entitiesTelstra Annual Report 71
In this financial report, we, us, our, Telstra, the Telstra Group and
the Group all mean Telstra Corporation Limited, an Australian
corporation and its controlled entities as a whole. Telstra Entity is
the legal entity, Telstra Corporation Limited. Telstra Entity, the
Company, is a company limited by shares incorporated in
Australia whose shares are publicly traded on the Australian
Securities Exchange.
Our financial year ends on 30 June. Unless we state differently the
following applies:
• year or financial year means the year ended 30 June
• reporting date means the date 30 June
• 2014 means financial year 2014 and similarly for other
financial years.
The financial report of the Telstra Group for the year ended 30
June 2014 was authorised for issue in accordance with a
resolution of the Telstra Board of Directors on 14 August 2014. The
Directors have the power to amend and reissue the financial
report.
The principal accounting policies used in preparing the financial
report of the Telstra Group are set out in note 2 to our financial
statements.
1.1 Basis of preparation of the financial report
This financial report is a general purpose financial report,
prepared by a for-profit entity, in accordance with the
requirements of the Australian Corporations Act 2001, Accounting
Standards applicable in Australia and other authoritative
pronouncements of the Australian Accounting Standards Board
(AASB). This financial report also complies with International
Financial Reporting Standards (IFRS) and Interpretations
published by the International Accounting Standards Board
(IASB).
Both the functional and presentation currency of the Telstra Entity
and its Australian controlled entities is Australian dollars. The
functional currency of certain non Australian controlled entities is
not Australian dollars. As a result, the results of these entities are
translated into Australian dollars for presentation in the Telstra
Group financial report.
This financial report is prepared in accordance with historical
cost, except for some categories of investments and some
financial instruments, which are recorded at fair value; and assets
held for sale, which are measured at fair value less costs to sell.
Cost is the fair value of the consideration given in exchange for net
assets acquired.
In preparing this financial report, we are required to make
judgements and estimates that affect:
• income and expenses for the year
• the reported amounts of assets and liabilities
• the disclosure of off-balance sheet arrangements, including
contingent assets and contingent liabilities.
We continually evaluate our judgements and estimates. We base
our judgements and estimates on historical experience, various
other assumptions we believe to be reasonable under the
circumstances and, where appropriate, practices adopted by
international telecommunications companies. Actual results may
differ from our estimates.
1.2 Clarification of terminology used in our income statement
Under the requirements of AASB 101: “Presentation of Financial
Statements“, we must classify all of our expenses (apart from any
finance costs and our share of net profit/loss from joint ventures
and associated entities) according to either the nature (type) of
the expense or the function (activity to which the expense relates).
We have chosen to classify our expenses using the nature
classification as it more accurately reflects the type of operations
we undertake.
Earnings before interest, income tax expense, depreciation and
amortisation (EBITDA) reflects our profit for the year prior to
including the effect of net finance costs, income taxes,
depreciation and amortisation. Depreciation and amortisation are
calculated in accordance with AASB 116: “Property, Plant and
Equipment” and AASB 138: “Intangible Assets” respectively. We
believe that EBITDA is a relevant and useful financial measure
used by management to measure the Company’s operating
performance.
Our management uses EBITDA and earnings before interest and
income tax expense (EBIT), in combination with other financial
measures, primarily to evaluate the Company’s operating
performance before financing, income tax and non-cash capital
related expenses. In addition, we believe EBITDA is useful to
investors because analysts and other members of the investment
community largely view EBITDA as a key and widely recognised
measure of operating performance.
EBIT is a similar measure to EBITDA, but it takes into account
depreciation and amortisation.
1.3 Rounding
All dollar amounts in this financial report (except where indicated)
have been rounded to the nearest million dollars ($m) for
presentation. This has been done in accordance with Australian
Securities and Investments Commission (ASIC) Class Order
98/100, dated 10 July 1998, issued under section 341(1) of the
Corporations Act 2001. Telstra is an entity to which this class
order applies.
1. BASIS OF PREPARATION

NOTES TO THE FINANCIAL STATEMENTS(Continued)
Telstra Corporation Limited and controlled entities72 Telstra Annual Report
2.1 Changes in accounting policies
The following accounting policy changes occurred during the year
ended 30 June 2014:
(a) Consolidated Financial Statements and Separate
Financial Statements
AASB 10: “Consolidated Financial Statements” revises the
definition of control and related application guidance so that a
single control model can be applied to all entities. The Group
controls an entity when it is exposed to, or has rights to, variable
returns from its involvement with the entity and has the ability to
affect those returns through its power to direct the activities of the
entity.
We adopted AASB 10 on a retrospective basis from 1 July 2013,
along with the entire suite of consolidation and related standards.
We have reviewed our investments in other entities to assess
whether the conclusion to consolidate is different under AASB 10
than under the previous accounting standard AASB 127:
“Consolidated and Separate Financial Statements”. No material
differences were found and therefore no adjustments are required
as a result of the adoption of AASB 10. Investments accounted for
as subsidiaries under AASB 127 continue to meet the revised
definition of control under AASB 10 and therefore continue to be
consolidated in the Group's financial statements. Investments
accounted for as associates under the previous accounting
standard AASB 128: “Investments in Associates” have been
assessed against the revised control definition and there are no
material changes in the accounting treatment for these
investments.
We also adopted revised AASB 127: “Separate Financial
Statements” from 1 July 2013. However, there is no impact to the
Group as we already comply with the requirements in this
standard. AASB 127 only applies to the separate financial
statements of Telstra Entity and some of the Group's subsidiaries.
(b) Joint Arrangements and Investments in Associates and
Joint Ventures
AASB 11: “Joint Arrangements” has revised the definition types of
joint arrangements, focusing on the rights and obligations of the
arrangement, rather than its legal form.
The definition types have been consolidated into joint ventures
(previously referred to as jointly controlled entities) and joint
operations (previously referred to as jointly controlled assets and
jointly controlled operations). Furthermore, the accounting
treatment options for joint venture arrangements have been
removed to eliminate inconsistent treatments. Equity accounting
is mandatory for joint ventures and proportionate consolidation
can no longer be used.
We adopted this standard on a retrospective basis from 1 July
2013, along with the entire suite of consolidation and related
standards.
We have reviewed our joint arrangements to assess whether the
revised definition types under AASB 11 change the way we
account for these compared to the previous standard AASB 131:
“Interests in Joint Ventures”. No differences were found and
therefore no adjustments to any of the carrying amounts in the
financial statements are required as a result of the adoption of
AASB 11.
The assessment of our previously classified jointly controlled
entities shows that none give us direct rights over assets or
obligations to settle liabilities, such that they should be classified
as joint operations. Therefore, all of these jointly controlled
entities have been classified as joint ventures and, given that our
accounting policy under AASB 131 for jointly controlled entities
was to use the equity accounting method, we have continued to
equity account these joint ventures under AASB 11.
On adoption, we did not have any jointly controlled assets or jointly
controlled operations, now referred to as joint operations. Overall,
there has been no impact on the measurement of any of our joint
arrangements.
We also adopted AASB 128: “Investments in Associates and Joint
Ventures” from 1 July 2013. There has been no impact to our
financial results as a result of this new standard.
(c) Disclosure of Interests in Other Entities
AASB 12: “Disclosure of Interests in Other Entities” is a new
standard on disclosure requirements for all forms of interests in
investments, including subsidiaries, associates, joint
arrangements and consolidated and unconsolidated structured
entities.
We also adopted AASB 12 on a retrospective basis from 1 July
2013, along with the entire suite of consolidation and related
standards. We have assessed the disclosure requirements under
AASB 12 and additional disclosures for material joint ventures are
included in our financial report. Refer to note 26 for further details.
There are no measurement impacts from the adoption of this
standard.
(d) Fair Value Measurement
We adopted AASB 13: “Fair Value Measurement” from 1 July 2013
on a prospective basis. It is a new standard providing a single
source of guidance for all fair value measurements and a precise
definition of fair value. AASB 13 replaces all fair value
measurement guidance in Australian Accounting Standards and
Interpretations (with some exceptions, including share-based
payments and leases) but does not replace existing standard
requirements on when fair values should be used.
We have assessed the new guidance and definition of fair value
against our previous fair value measurements of assets and
liabilities and there is no change to how we measure fair value. We
use exit prices and, where possible, observable market-based
inputs to determine fair value.
2. SUMMARY OF SIGNIFICANT ACCOUNTING POLICIES, ESTIMATES, ASSUMPTIONS AND JUDGEMENTS
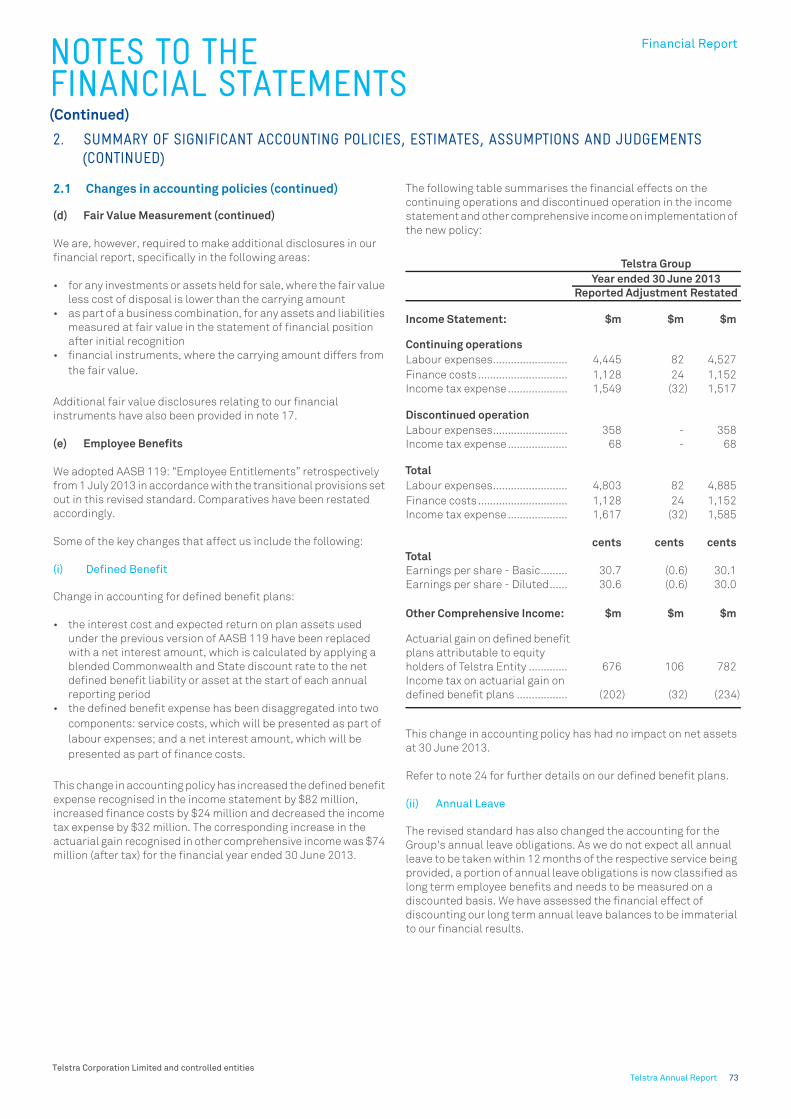
NOTES TO THE FINANCIAL STATEMENTS(Continued)
Financial Report
Telstra Corporation Limited and controlled entitiesTelstra Annual Report 73
2.1 Changes in accounting policies (continued)
(d) Fair Value Measurement (continued)
We are, however, required to make additional disclosures in our
financial report, specifically in the following areas:
• for any investments or assets held for sale, where the fair value
less cost of disposal is lower than the carrying amount
• as part of a business combination, for any assets and liabilities
measured at fair value in the statement of financial position
after initial recognition
• financial instruments, where the carrying amount differs from
the fair value.
Additional fair value disclosures relating to our financial
instruments have also been provided in note 17.
(e) Employee Benefits
We adopted AASB 119: “Employee Entitlements” retrospectively
from 1 July 2013 in accordance with the transitional provisions set
out in this revised standard. Comparatives have been restated
accordingly.
Some of the key changes that affect us include the following:
(i) Defined Benefit
Change in accounting for defined benefit plans:
• the interest cost and expected return on plan assets used
under the previous version of AASB 119 have been replaced
with a net interest amount, which is calculated by applying a
blended Commonwealth and State discount rate to the net
defined benefit liability or asset at the start of each annual
reporting period
• the defined benefit expense has been disaggregated into two
components: service costs, which will be presented as part of
labour expenses; and a net interest amount, which will be
presented as part of finance costs.
This change in accounting policy has increased the defined benefit
expense recognised in the income statement by $82 million,
increased finance costs by $24 million and decreased the income
tax expense by $32 million. The corresponding increase in the
actuarial gain recognised in other comprehensive income was $74
million (after tax) for the financial year ended 30 June 2013.
The following table summarises the financial effects on the
continuing operations and discontinued operation in the income
statement and other comprehensive income on implementation of
the new policy:
This change in accounting policy has had no impact on net assets
at 30 June 2013.
Refer to note 24 for further details on our defined benefit plans.
(ii) Annual Leave
The revised standard has also changed the accounting for the
Group's annual leave obligations. As we do not expect all annual
leave to be taken within 12 months of the respective service being
provided, a portion of annual leave obligations is now classified as
long term employee benefits and needs to be measured on a
discounted basis. We have assessed the financial effect of
discounting our long term annual leave balances to be immaterial
to our financial results.
2. SUMMARY OF SIGNIFICANT ACCOUNTING POLICIES, ESTIMATES, ASSUMPTIONS AND JUDGEMENTS (CONTINUED)
Telstra Group
Year ended 30 June 2013
Reported Adjustment Restated
Income Statement: $m $m $m
Continuing operations
Labour expenses......................... 4,445 82 4,527
Finance costs .............................. 1,128 24 1,152
Income tax expense .................... 1,549 (32) 1,517
Discontinued operation
Labour expenses......................... 358 - 358
Income tax expense .................... 68 - 68
Total
Labour expenses......................... 4,803 82 4,885
Finance costs .............................. 1,128 24 1,152
Income tax expense .................... 1,617 (32) 1,585
cents cents cents
Total
Earnings per share - Basic......... 30.7 (0.6) 30.1
Earnings per share - Diluted...... 30.6 (0.6) 30.0
Other Comprehensive Income: $m $m $m
Actuarial gain on defined benefit
plans attributable to equity
holders of Telstra Entity ............. 676 106 782
Income tax on actuarial gain on
defined benefit plans ................. (202) (32) (234)
NOTES TO THE FINANCIAL STATEMENTS(Continued)
Telstra Corporation Limited and controlled entities74 Telstra Annual Report
2.1 Changes in accounting policies (continued)
(f) Disclosures - Offsetting Financial Assets and Financial
Liabilities
On 1 July 2013, we adopted AASB 2012-2: “Disclosures -
Offsetting Financial Assets and Financial Liabilities”
retrospectively. AASB 2012-2 amends the disclosure
requirements in AASB 7: “Financial Instruments: Disclosures” so
that more extensive disclosures are required. The disclosures
focus on quantitative information about recognised financial
instruments that are offset in the statement of financial position,
as well as those recognised financial instruments that are subject
to master netting or similar arrangements irrespective of whether
they are offset.
We have assessed the new disclosure requirements under AASB
2012-2 and added additional disclosures in our financial report,
including the following:
• our bilateral international roaming agreements, that have
unconditional rights of set-off and are offset in the statement
of financial position
• our International Swaps and Derivative Association
agreements and Telstra Wholesale Customer Relationship
Agreements that have conditional rights of set-off and are not
offset in the statement of financial position.
There are no measurement impacts from the adoption of this
standard.
Refer to note 17(h) for further details on offsetting disclosures.
(g) Recoverable Amount Disclosures for Non-financial Assets
On 1 July 2013, we early adopted AASB 2013-3: “Amendments to
AASB 136 - Recoverable Amount Disclosures for Non-financial
Assets”. The intention of this amendment is to harmonise the
disclosure requirements for fair value less costs of disposal and
value in use when present value techniques are used to measure
the recoverable amount of impaired assets. We have assessed the
disclosure requirements under the amended AASB 136 and no
additional material disclosures are required in our financial
report.
(h) Other
In addition to the above changes in accounting policy, we note the
following new accounting standards that are applicable to us from
1 July 2013:
• AASB 2011-4: “Amendments to Australian Accounting
Standards to Remove Individual Key Management Personnel
Disclosure Requirements”
• AASB 2011-7: “Amendments to Australian Standards Arising
from the Consolidation and Joint Arrangement Standards”
• AASB 2011-8: “Amendments to Australian Accounting
Standards arising from AASB 13”
• AASB 2011-10: “Amendments to Australian Accounting
Standards Arising from AASB 119”
• AASB 2012-5: “Amendments to Australian Accounting
Standards arising from Annual Improvements 2009-2011
Cycle”
• AASB 2012-10: “Amendments to Australian Accounting
Standards - Transition Guidance and other Amendments”
• AASB CF 2013-1: “Amendments to the Australian Conceptual
Framework”.
These new accounting standards do not have any material impact
on our financial results.
2.2 Principles of consolidation
The consolidated financial report includes the assets and
liabilities of the Telstra Entity and its controlled entities as a whole
as at the end of the year and the consolidated results and cash
flows for the year. The effect of all intra-group transactions and
balances are eliminated in full from our consolidated financial
statements.
An entity is considered to be a controlled entity where we are
exposed, or have rights, to variable returns from our involvement
with the entity and have the ability to affect those returns through
our power to direct the activities of the entity.
Where we do not control an entity for the entire year, results and
cash flows for those entities are only included from the date on
which control commences, or up until the date on which there is a
loss of control.
Non-controlling interests in the results and equity of controlled
entities are shown separately in our income statement, statement
of comprehensive income and statement of financial position.
We account for the acquisition of our controlled entities using the
acquisition method of accounting. This involves recognising the
acquiree’s identifiable assets, liabilities and contingent liabilities
at their fair value at the date of acquisition. Any excess of the fair
value of consideration over our interest in the fair value of the
acquiree’s identifiable assets, liabilities and contingent liabilities
is recognised as goodwill.
The financial statements of controlled entities are prepared for
the same reporting period as the Telstra Entity, using consistent
accounting policies. Adjustments are made to bring into line any
dissimilar accounting policies.
2. SUMMARY OF SIGNIFICANT ACCOUNTING POLICIES, ESTIMATES, ASSUMPTIONS AND JUDGEMENTS (CONTINUED)

NOTES TO THE FINANCIAL STATEMENTS(Continued)
Financial Report
Telstra Corporation Limited and controlled entitiesTelstra Annual Report 75
2.3 Foreign currency translation
(a) Transactions and balances
Foreign currency transactions are converted into the relevant
functional currency at market exchange rates applicable at the
date of each transaction. Amounts payable or receivable in foreign
currencies at reporting date are converted into the relevant
functional currency at market exchange rates at reporting date.
Any currency translation gains and losses that arise are included
in our income statement. Where we enter into a hedge for a
specific expenditure commitment or for the construction of an
asset, hedging gains and losses are accumulated in other
comprehensive income over the period of the hedge and are
transferred to the carrying value of the asset upon completion, or
included in the income statement at the same time as the
discharge of the expenditure commitment.
The consolidated financial statements are presented in Australian
dollars, which is the functional and presentation currency of
Telstra Corporation Limited.
(b) Financial reports of foreign operations that have a
functional currency that is not Australian dollars
Our operations include subsidiaries, associates and joint
ventures, whose activities and operations are in an economic
environment where the functional currency is not Australian
dollars. The financial statements of these entities are translated
into Australian dollars (our presentation currency) using the
following method:
• assets and liabilities are translated into Australian dollars
using market exchange rates at reporting date
• equity at the date of investment is translated into Australian
dollars at the exchange rate current at that date. Movements
post-acquisition (other than retained profits/accumulated
losses) are translated at the exchange rates current at the
dates of those movements
• income statements are translated into Australian dollars at
average exchange rates for the year, unless there are
significant identifiable transactions, which are translated at
the exchange rate that existed on the date of the transaction
• currency translation gains and losses are recorded in other
comprehensive income.
Refer to note 2.22(c) for details regarding our accounting policy for
derivative financial instrument items that are used to hedge our
net investment in entities whose functional currency is not
Australian dollars.
2.4 Cash and cash equivalents
Cash and cash equivalents include cash at bank and on hand,
bank deposits, negotiable certificates of deposit and bills of
exchange that are held for the purposes of meeting short term
cash commitments rather than investment purposes.
Bank deposits are recorded at amounts to be received. Negotiable
certificates of deposit and bills of exchange are classified as
available-for-sale financial assets and are held at fair value. The
carrying amount of these assets approximates their fair value due
to the short term to maturity.
2.5 Trade and other receivables
Trade and other receivables are considered financial assets. They
are initially recorded at the fair value of the amounts to be received
and are subsequently measured at amortised cost using the
effective interest method. These financial assets are
derecognised when the rights to receive cash flows from the
financial assets have expired or have been transferred and we
have transferred substantially all the risks and rewards of
ownership.
An allowance for doubtful debts is raised to reduce the carrying
amount of trade receivables, based on a review of outstanding
amounts at reporting date. The allowance for doubtful debts is
based on historical trends and management's assessment of
general economic conditions. An allowance for doubtful debts is
raised when management considers there is a credit risk, an
insolvency risk or an incapacity to pay a legally recoverable debt.
Bad debts specifically provided for in previous years are
eliminated against the allowance for doubtful debts. In all other
cases, bad debts are eliminated directly against the carrying
amount and written off as an expense in the income statement.
2.6 Inventories
Our finished goods include goods available for sale and material
and spare parts to be used for less than one year in constructing
and maintaining the telecommunications network. We value
inventories at the lower of cost and net realisable value.
For the majority of inventory items, we assign cost using the
weighted average cost basis. For materials used in the production
of directories, the “first in, first out” basis is used for assigning
cost.
Net realisable value of items expected to be sold is the estimated
selling price in the ordinary course of business less estimated
costs of completion and the estimated costs incurred in
marketing, selling and distribution. It approximates fair value less
cost of disposal. We calculate net realisable value of inventories
by making certain price assumptions to project selling prices into
the future and assumptions about technologies at reporting date.
Net realisable value of items expected to be consumed, for
example, used in the construction of another asset, is the net
value expected to be earned through future use.
2. SUMMARY OF SIGNIFICANT ACCOUNTING POLICIES, ESTIMATES, ASSUMPTIONS AND JUDGEMENTS (CONTINUED)

NOTES TO THE FINANCIAL STATEMENTS(Continued)
Telstra Corporation Limited and controlled entities76 Telstra Annual Report
2.7 Construction contracts
(a) Valuation
We record construction contracts in progress at cost, include any
profits recognised less progress billings and any provision for
foreseeable losses. Cost includes:
• both variable and fixed costs directly related to specific
contracts
• amounts that are attributable to contract activity in general
and can be allocated to specific contracts on a reasonable
basis
• costs expected to be incurred under penalty clauses, warranty
provisions and other variances.
Where a significant loss is estimated to be made on completion, a
provision for foreseeable losses is brought to account and
recorded against the gross amount of construction work in
progress.
(b) Recognition of revenue and profit
Revenue and profit is recognised on an individual project basis
using the percentage of completion method. The percentage of
completion is calculated based on estimated costs of completion.
Refer to note 2.17(d) for further details.
Profits are recognised when:
• the stage of contract completion can be reliably determined
• costs to date can be clearly identified
• total contract revenues to be received and costs to complete
can be reliably estimated.
(c) Disclosure
The construction work in progress balance is recorded in current
inventories after deducting progress billings. Where progress
billings exceed the balance of construction work in progress, the
net amount is shown as a current liability within trade and other
payables.
2.8 Investments
(a) Joint arrangements
A joint arrangement is a contractual arrangement whereby two or
more parties have joint control. Joint control involves the
contractually agreed sharing of control over an arrangement
where decisions about the relevant activities require the
unanimous consent of the parties sharing control. The
classification of a joint arrangement as a joint operation or joint
venture depends on the rights and obligations of the parties to the
arrangement.
(i) Joint ventures
A joint venture is a joint arrangement whereby the parties that
have joint control of the arrangement have rights to the net assets
of the arrangement. In the Telstra Group financial statements our
interests in joint ventures are accounted for using the equity
method of accounting.
Under the equity method of accounting, we adjust the initial
recorded amount of the investment for our share of:
• profits or losses after tax for the year since the date of
investment
• reserve movements since the date of investment
• unrealised profits or losses
• dividends or distributions received
• deferred profit brought to account.
Where the equity accounted amount of our investment in an entity
falls below zero, we suspend the equity method of accounting and
record the investment at zero. When this occurs, the equity
method of accounting does not recommence until our share of
profits and reserves exceeds the cumulative prior years’ share of
losses and reserve reductions. Where we have long term assets
that in substance form part of our investment in equity accounted
interests and the equity accounted amount of the investment falls
below zero, we reduce the value of these long term assets in
proportion to our cumulative losses.
(ii) Joint operations
A joint operation is a joint arrangement whereby the parties that
have joint control of the arrangement have rights to the assets and
obligations for the liabilities relating to the arrangement. We
recognise our own, and our share of any jointly held or incurred,
assets, liabilities, revenue and expenses under the appropriate
headings. We are not party to any joint operations at present.
(b) Associated entities
Where we hold an interest in the equity of an entity, generally of
between 20 per cent and 50 per cent, and are able to significantly
influence the decisions of the entity, that entity is an associated
entity. In the Telstra Group financial statements associated
entities are accounted for using the equity method of accounting.
2. SUMMARY OF SIGNIFICANT ACCOUNTING POLICIES, ESTIMATES, ASSUMPTIONS AND JUDGEMENTS (CONTINUED)

NOTES TO THE FINANCIAL STATEMENTS(Continued)
Financial Report
Telstra Corporation Limited and controlled entitiesTelstra Annual Report 77
2.8 Investments (continued)
(c) Listed securities and investments in other corporations
Our investments in listed securities and other corporations, where
we do not have control, joint control or significant influence, are
classified as available-for-sale financial assets and are measured
at fair value at each reporting date.
Fair values are calculated on the following basis:
• for listed securities traded in an active market, we use the
current quoted market bid price at reporting date
• for investments in unlisted entities whose securities are not
traded in an active market, we establish fair value by using
other valuation techniques, including reference to discounted
cash flows and fair values of recent orderly transactions
between market participants involving instruments that are
substantially the same, maximising the use of observable
(market) inputs and minimising the use of unobservable (non-
market) inputs.
We remeasure the fair value of our investments in listed securities
and other corporations at each reporting date. Any gains or losses
are recognised in other comprehensive income until we dispose of
the investment or we determine it to be impaired, at which time we
transfer cumulative gains and losses to the income statement.
Purchases and sales of investments are recognised on settlement
date, being the date on which we receive or deliver an asset.
2.9 Impairment
(a) Non-financial assets
Our tangible and intangible assets (excluding inventories, assets
arising from construction contracts, current and deferred tax
assets, defined benefit assets and financial assets) are measured
using the cost basis and are written down to recoverable amount
where their carrying value exceeds recoverable amount.
Assets with an indefinite useful life are not subject to amortisation
and are tested for impairment on an annual basis, or whenever an
indication of impairment exists. Assets that are subject to
amortisation are reviewed for impairment whenever events or
changes in circumstances indicate that the carrying amount may
not be recoverable.
The recoverable amount of an asset is the higher of its fair value
less cost of disposal and its value in use. Value in use represents
the present value of the future amount expected to be recovered
through the cash inflows and outflows arising from the asset’s
continued use and subsequent disposal. We recognise any
reduction in the carrying value as an expense in the income
statement in the reporting period in which the impairment loss
occurs.
Fair value less cost of disposal is measured with reference to
quoted market prices in an active market. In determining value in
use, we apply management judgement in establishing forecasts of
future operating performance, as well as the selection of growth
rates, terminal rates and discount rates. These judgements are
applied based on our understanding of historical information and
expectations of future performance.
The expected net cash flows included in determining recoverable
amounts of our assets are discounted to present values using a
market determined, risk adjusted discount rate. When
determining an appropriate discount rate, we use the weighted
average cost of capital (WACC) as an initial point of reference,
adjusted for specific risks associated with each different category
of assets assessed.
For assets that do not generate largely independent cash inflows,
the recoverable amount is determined for the cash generating unit
(CGU) to which that asset belongs. In addition, when goodwill is
allocated to a CGU, the unit cannot be larger than an operating
segment. Our CGUs are determined according to the lowest level
of aggregation for which an active market exists and the assets
involved generate largely independent cash inflows.
We apply management judgement to establish our CGUs. We have
determined that assets forming part of our ubiquitous
telecommunications network work together to generate net cash
inflows. No one item of telecommunications equipment is of any
value without the other assets to which it is connected in order to
achieve the delivery of products and services. As a result, we have
determined that the ubiquitous telecommunications network is a
single CGU. In our financial report we have referred to this CGU as
the Telstra Entity CGU.
The Telstra Entity CGU excludes the hybrid fibre coaxial (HFC)
cable network, which we consider not to be integrated with the
rest of our telecommunications network. Refer to note 21 for
further details.
(b) Financial assets
At each reporting date we assess whether there is objective
evidence to suggest that any of our financial assets are impaired.
For listed securities and investments in other corporations, we
consider the financial asset to be impaired when there has been a
significant or prolonged decline in the fair value of the financial
asset below its acquisition cost. At this time, all revaluation losses
in relation to impaired financial assets that have been
accumulated within other comprehensive income are recognised
in the income statement.
For financial assets held at cost or amortised cost, we consider
the financial asset to be impaired when there is objective
evidence, as a result of one or more events, that the present value
of estimated discounted future cash flows is lower than the
carrying value. Any impairment losses are recognised immediately
in the income statement.
2. SUMMARY OF SIGNIFICANT ACCOUNTING POLICIES, ESTIMATES, ASSUMPTIONS AND JUDGEMENTS (CONTINUED)

NOTES TO THE FINANCIAL STATEMENTS(Continued)
Telstra Corporation Limited and controlled entities78 Telstra Annual Report
2.10 Property, plant and equipment
(a) Acquisition
Items of property, plant and equipment are recorded at cost and
depreciated as described in note 2.10(b) below. The cost of our
constructed property, plant and equipment is directly attributable
in bringing the asset to the location and condition necessary for its
intended use and includes:
• the cost of material and direct labour
• an appropriate proportion of direct and indirect overheads
• where we have an obligation for removal of the asset or
restoration of the site, an estimate of the cost of restoration or
removal if that cost can be reliably estimated.
Management judgement is required in the assessment of the
types of costs that are directly attributable to the construction of
our property, plant and equipment. Satisfying the directly
attributable criteria requires an assessment of those unavoidable
costs that, if not incurred, would result in the property, plant and
equipment not being constructed. We capitalise borrowing costs
that are directly attributable to the acquisition, construction or
production of a qualifying asset.
We review our property, plant and equipment assets and property,
plant and equipment under construction on a regular basis to
ensure that the assets are still in use and that the projects are still
expected to be completed. Refer to note 7 for details of
impairment losses recognised on our property, plant and
equipment.
Where settlement of any part of the cash consideration is
deferred, the amounts payable in the future are discounted to
their present value as at the date of acquisition. The unwinding of
this discount is recorded within finance costs.
We account for our assets individually where this is practical,
feasible and in line with commercial practice. Where it is not
practical and feasible to do so, we account for assets in groups.
Group assets are automatically removed from our financial
statements on reaching the group life. Therefore, any individual
asset may be physically retired before or after the group life is
attained. This is the case for certain communication assets as we
assess our technologies to be replaced by a certain date.
(b) Depreciation
Items of property, plant and equipment, including buildings and
leasehold property but excluding freehold land, are depreciated
on a straight line basis to the income statement over their
estimated service lives. We start depreciating assets when they
are installed and ready for use. The service lives of our significant
items of property, plant and equipment are as follows:
The service lives and residual values of our assets are reviewed
each year. We apply management judgement in determining the
service lives of our assets. This assessment includes a
comparison with international trends for telecommunications
companies and, in relation to communication assets, includes a
determination of when the asset may be superseded
technologically or made obsolete.
The net effect of the assessment of service lives for financial year
2014 was a decrease in depreciation expense of $200 million
(2013: $224 million) for the Telstra Group.
Our major repairs and maintenance expenses relate to
maintaining our exchange equipment and the customer access
network. We charge to operating expenses the cost of repairs and
maintenance, including the cost of replacing minor items that are
not substantial improvements.
2. SUMMARY OF SIGNIFICANT ACCOUNTING POLICIES, ESTIMATES, ASSUMPTIONS AND JUDGEMENTS (CONTINUED)
Telstra Group
As at 30 June
2014 2013
Property, plant and equipment
Service life
(years)
Service life
(years)
Buildings
Buildings........................................... 32 - 52 52
Fitouts............................................... 10 - 20 10 - 20
Leasehold improvements................ 4 - 40 4 - 40
Communication assets
Network land and buildings............ 10 - 58 10 - 58
Network support infrastructure ..... 3 - 51 3 - 53
Access fixed ..................................... 4 - 30 4 - 30
Access mobile .................................. 3 - 16 4 - 16
Content/IP products - core ............. 3 - 10 4 - 8
Core network - data ......................... 4 - 10 3 - 10
Core network - switch...................... 3 - 18 3 - 26
Core network - transport................. 3 - 30 5 - 30
Specialised premise equipment..... 3 - 7 3 - 8
International connect...................... 9 - 21 9 - 21
Managed service.............................. 4 - 12 4 - 13
Network control layer ...................... 2 - 13 2 - 13
Network product .............................. 4 - 7 3 - 7
Other plant and equipment
IT equipment .................................... 3 - 7 3 - 7
Motor vehicles/trailer/caravan/huts 5 - 15 5 - 15
Other plant and equipment ............ 8 - 20 3 - 20

NOTES TO THE FINANCIAL STATEMENTS(Continued)
Financial Report
Telstra Corporation Limited and controlled entitiesTelstra Annual Report 79
2.11 Leased plant and equipment
We distinguish between finance leases, which effectively transfer
substantially all the risks and benefits incidental to ownership of
the leased asset from the lessor to the lessee, and operating
leases under which the lessor effectively retains substantially all
such risks and benefits. The determination of whether an
arrangement is, or contains, a lease is based on the substance of
the arrangement at inception date, whether fulfilment of the
arrangement is dependent on the use of a specific asset or assets
and the arrangement conveys a right to use the asset, even if that
right is not explicitly specified in an arrangement.
(a) Telstra as a lessee
Where we acquire non current assets via a finance lease, the lower
of the fair value of the asset and the present value of future
minimum lease payments is capitalised as equipment under
finance leases at the beginning of the lease term. Capitalised
lease assets are depreciated on a straight line basis over the
shorter of the lease term or the expected useful life of the assets.
A corresponding liability is also established and each lease
payment is allocated between the liability and finance charges.
Operating lease payments are charged to the income statement
on a straight line basis over the term of the lease.
Where we lease properties, costs of improvements to these
properties are capitalised as leasehold improvements and
amortised over the shorter of the useful life of the improvements
and the term of the lease.
(b) Telstra as a lessor
Where we lease non current assets via a finance lease, a lease
receivable equal to the present value of the minimum lease
payments receivable plus the present value of any unguaranteed
residual value expected to accrue at the end of the lease term is
recognised at the beginning of the lease term. Finance lease
receipts are allocated between finance income and a reduction of
the lease receivable over the term of the lease in order to reflect a
constant periodic rate of return on the net investment outstanding
in respect of the lease.
Rental income from operating leases is recognised on a straight
line basis over the term of the relevant lease.
2.12 Intangible assets
Intangible assets are assets that have value but do not have
physical substance. In order to be recognised, an intangible asset
must be either separable or arise from contractual or other legal
rights.
(a) Goodwill
On the acquisition of investments in controlled entities, joint
ventures and associated entities, when we pay an amount greater
than the fair value of the net identifiable assets of the entity, this
excess is considered to be goodwill. We calculate the amount of
goodwill as at the date of purchasing our ownership interest in the
entity.
When we purchase an entity that we will control, the amount of
goodwill is recorded in intangible assets. When we acquire a joint
venture or associated entity, the goodwill amount is included as
part of the cost of the investment.
Goodwill is not amortised but is tested for impairment on an
annual basis or when an indication of impairment exists in
accordance with note 2.9(a).
(b) Internally generated intangible assets
Research costs are recorded as an expense as incurred.
Management judgement is required to determine whether to
capitalise development costs. Development costs are capitalised
if the project is technically and commercially feasible, we are able
to use or sell the asset and we have sufficient resources and intent
to complete the development.
(i) Software assets
We record direct costs associated with the development of
business software for internal use as software assets if the
development costs satisfy the criteria for capitalisation described
above.
Costs included in software assets developed for internal use are:
• external direct costs of materials and services consumed
• payroll and direct payroll-related costs for employees
(including contractors) directly associated with the project.
We capitalise borrowing costs that are directly attributable to the
acquisition, construction or production of a qualifying asset.
We review our software assets and software assets under
development on a regular basis to ensure the assets are still in use
and projects are still expected to be completed. Refer to note 7 for
details of impairment losses recognised on our intangible assets.
Software assets developed for internal use have a finite life and
are amortised on a straight line basis over their useful lives to us.
Amortisation commences once the software is ready for use.
2. SUMMARY OF SIGNIFICANT ACCOUNTING POLICIES, ESTIMATES, ASSUMPTIONS AND JUDGEMENTS (CONTINUED)

NOTES TO THE FINANCIAL STATEMENTS(Continued)
Telstra Corporation Limited and controlled entities80 Telstra Annual Report
2.12 Intangible assets (continued)
(c) Acquired intangible assets
We acquire other intangible assets either as part of a business
combination or through separate acquisition. Intangible assets
acquired in a business combination are recorded at their fair value
at the date of acquisition and recognised separately from
goodwill. Intangible assets acquired through specific acquisition
are recorded at cost. We apply management judgement to
determine the appropriate fair value of identifiable intangible
assets.
Intangible assets that are considered to have a finite life are
amortised on a straight line basis over the period of expected
benefit. Intangible assets that are considered to have an indefinite
life are not amortised but tested for impairment on an annual
basis or when an indication of impairment exists in accordance
with note 2.9(a).
(d) Deferred expenditure
Deferred expenditure mainly includes costs incurred for basic
access installation and connection fees, for existing and new
services, as well as direct incremental costs of establishing a
customer contract.
Significant items of expenditure are deferred to the extent that
they are recoverable from future revenue and will contribute to our
future earning capacity. Any costs in excess of future revenue are
recognised immediately in the income statement. Handset
subsidies are considered to be separate units of accounting and
are expensed as incurred.
We amortise deferred expenditure over the average period in
which the related benefits are expected to be realised.
(e) Amortisation
The weighted average amortisation periods of our identifiable
intangible assets are as follows:
The service lives of our identifiable intangible assets are reviewed
each year. Any reassessment of service lives in a particular year
will affect the amortisation expense through to the end of the
reassessed useful life for both that current year and future years.
The net effect of the reassessment for financial year 2014 was a
decrease in our amortisation expense of $72 million (2013: $34
million) for the Telstra Group.
In relation to acquired intangible assets, we apply management
judgement to determine the amortisation period based on the
expected useful lives of the respective assets. In some cases, the
useful lives of certain acquired intangible assets are supported by
external valuation advice on acquisition. In addition, we apply
management judgement to assess annually the indefinite useful
life assumption applied to certain acquired intangible assets.
2.13 Trade and other payables
Trade and other payables, including accruals, are recorded when
we are required to make future payments as a result of purchases
of assets or services. Trade and other payables are carried at
amortised cost.
2.14 Provisions
Provisions are recognised when:
• the Group has a present legal or constructive obligation to
make a future sacrifice of economic benefits as a result of past
transactions or events
• it is probable that a future sacrifice of economic benefits will
arise
• a reliable estimate can be made of the amount of the
obligation.
(a) Employee benefits
We accrue liabilities for employee benefits relating to wages and
salaries, annual leave and other current employee benefits at
their nominal amounts. These are calculated based on
remuneration rates expected to be current at the date of
settlement and include related costs.
Certain employees who have been employed by Telstra for at least
10 years are entitled to long service leave of three months (or more
depending on the actual length of employment), which is included
in our employee benefits provision.
We accrue liabilities for other employee benefits not expected to
be paid or settled within 12 months of reporting date, including
long service leave, at the present values of future amounts
expected to be paid. This is based on projected increases in wage
and salary rates over an average of 10 years, experience of
employee departures and periods of service.
We calculate present values using rates based on government
guaranteed securities with due dates similar to those of our
liabilities.
2. SUMMARY OF SIGNIFICANT ACCOUNTING POLICIES, ESTIMATES, ASSUMPTIONS AND JUDGEMENTS (CONTINUED)
Telstra Group
As at 30 June
2014 2013
Identifiable intangible assets
Expected
benefit
(years)
Expected
benefit
(years)
Software assets ............................... 9 9
Patents and trademarks ................. 5 5
Mastheads........................................ 5 5
Licences............................................ 15 15
Brand names .................................... 14 17
Customer bases ............................... 8 6
Deferred expenditure....................... 4 3

NOTES TO THE FINANCIAL STATEMENTS(Continued)
Financial Report
Telstra Corporation Limited and controlled entitiesTelstra Annual Report 81
2.14 Provisions (continued)
(a) Employee benefits (continued)
We apply management judgement in estimating the following key
assumptions used in the calculation of our long service leave
provision at reporting date:
• weighted average projected increases in salaries
• discount rate (determined by reference to a State and
Commonwealth blended 10-year Australian government bond
rate).
Refer to note 16 for further details on the key management
judgements used in the calculation of our long service leave
provision.
(b) Workers’ compensation
We self insure our workers’ compensation liabilities. We take up a
provision for the present value of these estimated liabilities,
based on an actuarial review of the liability. This review includes
assessing actual accidents and estimating claims incurred but
not reported. Present values are calculated using appropriate
rates (determined by reference to a State and Commonwealth
blended 10-year Australian government bond rate) based on the
risks specific to the liability with a similar due date.
Certain controlled entities do not self insure but pay annual
premiums to third party insurance companies for their workers’
compensation liabilities. Refer to note 16 for further details.
(c) Redundancy and restructuring costs
We recognise a provision for redundancy costs when a detailed
formal plan for the redundancies has been developed and a valid
expectation has been created that the redundancies will be
carried out in respect of those employees likely to be affected.
We recognise a provision for restructuring when a detailed formal
plan has been approved and we have raised a valid expectation in
those affected by the restructuring that it will be carried out.
2.15 Borrowings
Borrowings are included as non current liabilities except for those
with maturities less than 12 months from the reporting date,
which are classified as current liabilities.
Borrowing costs that are directly attributable to the acquisition,
construction or production of a qualifying asset form part of the
cost of that asset. All other borrowing costs are recognised as an
expense in our income statement when incurred.
We recognise borrowings initially on the trade date, which is the
date on which we become a party to the contractual provisions of
the instrument. We derecognise borrowings when our contractual
obligations are discharged or cancelled or expire.
Our borrowings fall into two categories: borrowings in a
designated hedging relationship and borrowings not in a
designated hedging relationship.
(a) Borrowings in a designated hedging relationship
Our offshore borrowings that are designated as hedged items are
either in fair value or cash flow hedges. The method by which they
are hedged determines their accounting treatment.
Borrowings subject to fair value hedges are recognised initially at
fair value. The carrying amount of our borrowings in fair value
hedges is adjusted for fair value movements attributable to the
hedged risk (being changes in value due to interest rate and
currency movements).
Fair value is calculated using valuation techniques that utilise
data from observable markets. Assumptions are based on market
conditions existing at each reporting date. The fair value is
calculated as the present value of the estimated future cash flows
using an appropriate market based yield curve that is
independently derived and representative of Telstra’s cost of
borrowing. These borrowings are remeasured each reporting
period and the gains or losses are recognised in the income
statement along with the associated gains or losses on the
hedging instrument.
Borrowings subject to cash flow hedges are recognised initially at
fair value plus any transaction costs that are directly attributable
to the issue of the borrowing. These borrowings are subsequently
carried at amortised cost and translated at the applicable spot
exchange rate at reporting date. Any difference between the final
amount paid to discharge the borrowing and the initial borrowing
proceeds (including transaction costs) is recognised in the income
statement over the borrowing period using the effective interest
method.
When currency gains or losses on the borrowings are recognised in
the income statement, the associated gains or losses on the
hedging instrument are also transferred from the cash flow
hedging reserve to the income statement.
(b) Borrowings not in a designated hedging relationship
Borrowings not in a designated hedging relationship include
offshore loans, Telstra bonds and domestic loans.
All such instruments are initially recognised at fair value plus any
transaction costs that are directly attributable to the issue of the
instruments and are subsequently measured at amortised cost.
Any difference between the final amount paid to discharge the
borrowing and the initial borrowing proceeds (including
transaction costs) is recognised in the income statement over the
borrowing period using the effective interest method.
2. SUMMARY OF SIGNIFICANT ACCOUNTING POLICIES, ESTIMATES, ASSUMPTIONS AND JUDGEMENTS (CONTINUED)

NOTES TO THE FINANCIAL STATEMENTS(Continued)
Telstra Corporation Limited and controlled entities82 Telstra Annual Report
2.15 Borrowings (continued)
(c) Statement of cash flows presentation
Where our short term borrowings are held for the purposes of
meeting short term cash commitments, we report the cash
receipts and subsequent repayments on a net basis in the
statement of cash flows.
2.16 Share capital
Issued and paid up capital is recognised at the fair value of the
consideration received by the Telstra Entity.
Any transaction costs arising on the issue of ordinary shares are
recognised directly in equity, net of tax, as a reduction of the share
proceeds received.
Where we undertake a share buy-back, contributed equity is
reduced in accordance with the structure of the buy-back
arrangement. Costs associated with the buy-back, net of tax, are
also deducted from contributed equity. We also record the
purchase of Telstra Entity shares by our employee share plan
trusts as a reduction in share capital.
Share-based remuneration associated with our employee share
plans is recognised as additional share capital. Non-recourse
loans provided to employees to participate in these employee
share plans are recorded as a reduction in share capital.
Refer to note 2.21 for further details on our accounting for
employee share plans.
2.17 Revenue recognition
Our categories of sales revenue are recorded after deducting sales
returns, trade allowances, discounts, sales incentives, duties and
taxes.
(a) Rendering of services
Revenue from the provision of our telecommunications services
includes telephone calls and other services and facilities
provided, such as internet and data.
We record revenue earned from:
• telephone calls on completion of the call
• other services generally at completion, or on a straight line
basis over the period of service provided, unless another
method better represents the stage of completion.
Installation and connection fee revenues that are not considered
to be separate units of accounting are deferred and recognised
over the average estimated customer life. Incremental costs
directly related to these revenues are also deferred and amortised
over the customer contract life in accordance with note 2.12(d). In
relation to basic access installation and connection revenue, we
apply management judgement to determine the estimated
customer contract life.
Based on our reviews of historical information and customer
trends, we have determined that our average estimated customer
life is 5 years (2013: 5 years).
(b) Sale of goods
Our revenue from the sale of goods includes revenue from the sale
of customer equipment and similar goods. This revenue is
recorded on delivery of the goods sold.
(c) Rent of network facilities
We earn rent mainly from access to retail and wholesale fixed and
mobile networks and from the rent of dedicated lines, customer
equipment, property, plant and equipment and other facilities.
The revenue from providing access to the network is recorded on
an accrual basis over the rental period.
(d) Construction contracts
We record construction revenue and profit on a percentage of
contract completion basis. The percentage of completion is
calculated based on estimated costs to complete the contract.
Our construction contracts are classified according to their type.
There are two types of construction contracts: material intensive
and short duration. Revenue and profit are recognised on a
percentage of completion basis using the appropriate measures
as follows:
• for material intensive projects: (actual costs divided by
planned costs) multiplied by planned revenue, including profit
• for short duration projects (those that are expected to be
completed within a month): revenues, profit and costs are
recognised on completion.
(e) Advertising and directory services
Classified advertisements and display advertisements are
published on a daily, weekly and monthly basis and revenues are
recognised when the advertisement is published.
All of our Yellow Pages® and White Pages® directory print
revenues are recognised on delivery of the published directories to
customers’ premises. Revenue from online directories is
recognised over the life of service agreements, which is on average
one year. Voice directory revenues are recognised at the time of
providing the service to customers.
On 28 February 2014, we divested 70 per cent of our directories
business via disposal of our 100 per cent shareholding in Sensis
Pty Ltd and its controlled entities (Sensis Group) and acquisition
of 30 per cent of Project Sunshine I Pty Ltd, the new holding
company of the Sensis Group. The sale excluded the voice services
business. As a result, the Sensis Group advertising and directory
services have been disclosed as discontinued operation. Refer to
note 12 for further details.
2. SUMMARY OF SIGNIFICANT ACCOUNTING POLICIES, ESTIMATES, ASSUMPTIONS AND JUDGEMENTS (CONTINUED)

NOTES TO THE FINANCIAL STATEMENTS(Continued)
Financial Report
Telstra Corporation Limited and controlled entitiesTelstra Annual Report 83
2.17 Revenue recognition (continued)
(f) Royalties
Royalty revenue is recognised on an accrual basis in accordance
with the substance of the relevant agreements.
(g) Interest revenue
We record interest revenue on an accruals basis. For financial
assets, interest revenue is determined by the effective yield on the
instrument.
(h) Revenue arrangements with multiple deliverables
Where two or more revenue-generating activities or deliverables
are sold under a single arrangement, each deliverable that is
considered to be a separate unit of accounting is accounted for
separately. When the deliverables in a multiple deliverable
arrangement are not considered to be separate units of
accounting, the arrangement is accounted for as a single unit.
A separate unit of accounting exists where the deliverable has
value to the customer on a stand-alone basis and any undelivered
items cannot be terminated by the customer without incurring
penalties if the delivered item was returned.
We allocate the consideration from the revenue arrangement to its
separate units based on the relative selling prices of each unit. If
there is neither vendor specific objective evidence nor third party
evidence for the selling price, then the item is measured based on
the best estimate of the selling price of that unit. When allocating
revenue to the separate units within an arrangement, the amount
allocated to a delivered item is limited to the amount that is not
contingent upon the delivery of additional items or meeting other
specified performance conditions (non-contingent amount). The
non-contingent revenue allocated to each unit is then recognised
in accordance with our revenue recognition policies described
above.
(i) Principal versus agency relationship (gross versus net
revenue recognition)
Generally we record the full gross amount of sales proceeds as
revenue. However, if we are acting as an agent, revenue is
recorded on a net basis (being the gross amount billed less the
amount paid to the supplier acting as a principal in the
arrangement). We review the facts and circumstances of each
sales arrangement to determine if we are acting as an agent or as
a principal. Indicators supporting that we are the principal
include:
• Telstra is primarily responsible for the fulfilment of the
customer order
• Telstra has risks of ownership of the product or delivery of the
services
• Telstra is involved in price setting
• Telstra is involved in determining the product or service
specifications
• Telstra bears the credit risk.
(j) Sales incentives
Sales incentives are provided by Telstra to customers in the form
of either cash consideration or non-cash consideration and are
accrued for up to the point where it is probable that the customer
will earn the incentives.
A cash consideration (for example, cash payment, credit or rebate)
provided to a customer is generally recorded as a reduction in
revenue.
A sales incentive provided to a customer in the form of non-cash
consideration (for example, in the form of a free product or service
or a gift voucher) is considered to be a separate deliverable in a
multiple deliverable arrangement, regardless of whether it is
provided to customers at the commencement of a contract or is an
amount that can be used to purchase future products and
services. A portion of the total revenue under the arrangement is
allocated to the non-cash consideration in accordance with note
2.17(h). The sales revenue allocated to the incentive is recognised
when the customer redeems or utilises the award (i.e. when
Telstra provides the product or service).
Cash sales incentives are generally paid to customers in cases
where Telstra provides a number of different products and
services to the customer under a single arrangement. If this is the
case then the reduction in revenue must be allocated to each
product/service that contributed towards the customer earning
the incentive. The allocation should be based on the relative
amounts of revenue earned for each product and service, unless a
more appropriate methodology is available.
(k) Government grants
Grants from the government are recognised at their fair value
where there is a reasonable assurance that the grant will be
received and Telstra will comply with all attached conditions.
Government grants relating to costs are deferred and recognised
in the income statement over the period necessary to match them
with the costs that they are intended to compensate.
Government grants relating to the purchase of property, plant and
equipment are included in non current liabilities as deferred
income and are credited to the income statement on a straight line
basis over the expected lives of the related assets.
The benefit of a government loan at a below-market rate of
interest is treated as a government grant. The loan is measured at
amortised cost. The benefit of the below-market rate of interest is
measured as the difference between the initial carrying value of
the loan, which is measured at amortised cost, and the actual
proceeds received. The benefit is accounted for in accordance
with our accounting policy for government grants described
above.
2. SUMMARY OF SIGNIFICANT ACCOUNTING POLICIES, ESTIMATES, ASSUMPTIONS AND JUDGEMENTS (CONTINUED)

NOTES TO THE FINANCIAL STATEMENTS(Continued)
Telstra Corporation Limited and controlled entities84 Telstra Annual Report
2.18 Taxation
(a) Income taxes
Our income tax expense represents the sum of current tax and
deferred tax. Current tax is calculated on accounting profit after
allowing for non-taxable and non-deductible items based on the
amount expected to be paid to taxation authorities on taxable
profit for the period. Deferred tax is calculated at the tax rates that
are expected to apply to the period in which the asset is realised or
the liability is settled. Both our current tax and deferred tax are
calculated using tax rates that have been enacted or substantively
enacted at reporting date.
Our current and deferred tax is recognised as an expense in the
income statement, except when it relates to items directly debited
or credited to other comprehensive income or equity, in which
case our current and deferred tax is also recognised directly in
other comprehensive income or equity.
We apply the balance sheet method for calculating our deferred
tax. Deferred tax is the expected tax payable or recoverable on all
taxable and deductible temporary differences determined with
reference to the tax bases of assets and liabilities and their
carrying amount for financial reporting purposes as at the
reporting date.
We generally recognise deferred tax liabilities for all taxable
temporary differences, except to the extent that the deferred tax
liability arises from:
• the initial recognition of goodwill
• the initial recognition of an asset or liability in a transaction
that is not a business combination and affects neither our
accounting profit nor our taxable income at the time of the
transaction.
In respect of our investments in subsidiaries, joint ventures and
associated entities, we recognise deferred tax liabilities for all
taxable temporary differences, except where we are able to
control the timing of our temporary difference reversal and it is
probable that the temporary difference will not reverse in the
foreseeable future.
Management judgement is required to determine the amount of
deferred tax assets that can be recognised. Deferred tax assets
are recognised to the extent that it is probable that taxable profit
will be available against which the deductible temporary
differences, and the carry forward of unused tax losses and tax
credits, can be utilised.
The carrying amount of our deferred tax asset is reviewed at each
reporting date. We reduce the carrying amount to the extent that it
is no longer probable that sufficient taxable profit will be available
to allow the benefit of part or all of the deferred tax asset to be
utilised. At each reporting date, we subsequently reassess our
unrecognised deferred tax assets to determine whether it has
become probable that future taxable profit will allow this deferred
tax asset to be recovered.
The Telstra Entity and its Australian resident wholly owned
entities have formed a tax consolidated group. The Telstra Entity
is the head entity and recognises, in addition to its transactions,
the current tax liabilities and the deferred tax assets arising from
unused tax losses and tax credits for all entities in the tax
consolidated group. The Telstra Entity and the entities in the tax
consolidated group account for their own current tax expense and
deferred tax amounts arising from temporary differences. These
tax amounts are measured as if each entity in the tax consolidated
group continues to be a separate taxpayer.
We offset deferred tax assets and deferred tax liabilities in the
statement of financial position where they relate to income taxes
levied by the same taxation authority and to the extent that we
intend to settle our current tax assets and liabilities on a net basis.
Our deferred tax assets and deferred tax liabilities are netted
within the tax consolidated group, as these deferred tax balances
relate to the same taxation authority. We do not net deferred tax
balances between controlled entities unless they are within the
tax consolidated group.
(b) Goods and Services Tax (GST) (including other value added
taxes)
We record our revenue, expenses and assets net of any applicable
GST, except where the amount of GST incurred is not recoverable
from the Australian Taxation Office (ATO). In these circumstances
the GST is recognised as part of the cost of acquisition of the asset
or as part of the expense item.
Receivables and payables balances include GST where we have
either included GST in our price charged to customers or a supplier
has included GST in their price charged to us. The net amount of
GST due to the ATO but not paid is included under payables.
2.19 Earnings per share
Basic earnings per share is determined by dividing the profit
attributable to ordinary shareholders after tax, excluding any
costs of servicing equity other than ordinary shares, by the
weighted average number of ordinary shares outstanding during
the period.
Diluted earnings per share is calculated by dividing the profit
attributable to ordinary shareholders after tax by the weighted
average number of ordinary shares outstanding during the period
(adjusted for the effects of the instruments in the Telstra
Growthshare Trust and the Telstra Employee Share Ownership
Plans).
2. SUMMARY OF SIGNIFICANT ACCOUNTING POLICIES, ESTIMATES, ASSUMPTIONS AND JUDGEMENTS (CONTINUED)

NOTES TO THE FINANCIAL STATEMENTS(Continued)
Financial Report
Telstra Corporation Limited and controlled entitiesTelstra Annual Report 85
2.20 Post employment benefits
(a) Defined contribution plans
Our commitment to defined contribution plans is limited to
making contributions in accordance with our minimum statutory
requirements. We do not have any legal or constructive obligation
to pay further contributions if the fund does not hold sufficient
assets to pay all employee benefits relating to current and past
employee services.
Contributions to defined contribution plans are recorded as an
expense in the income statement as the contributions become
payable. We recognise a liability when we are required to make
future payments as a result of employee services provided.
(b) Defined benefit plans
We currently sponsor a post employment benefit plan. As this plan
has elements of both defined contribution and defined benefit, it
is treated as defined benefit plan.
At reporting date, where the fair value of the plan assets is less
than the present value of the defined benefit obligations, the net
deficit is recognised as a liability. If the fair value of the plan assets
exceeds the present value of the defined benefit obligations, the
net surplus is recognised as an asset. We recognise the asset as
we have the ability to control this surplus to generate future funds
that will be available to us in the form of reductions in future
contributions or as a cash refund. Fair value is used to determine
the value of the plan assets at reporting date and is calculated by
reference to the net market values of the plan assets.
Defined benefit obligations are based on the expected future
payments required to settle the obligations arising from current
and past employee services. These obligations are influenced by
many factors, including final salaries and employee turnover. We
engage qualified actuaries to calculate the present value of the
defined benefit obligations which are measured gross of tax.
The actuaries use the projected unit credit method to determine
the present value of the defined benefit obligations of the plan.
This method determines each year of service as giving rise to an
additional unit of benefit entitlement. Each unit is measured
separately to calculate the final obligation. The present value is
determined by discounting the estimated future cash outflows
using rates based on government guaranteed securities with
similar due dates to these expected cash flows.
We recognise all our defined benefit costs in the income
statement, with the exception of actuarial gains and losses that
are recognised directly in other comprehensive income.
Components of defined benefit costs include current and past
service cost, interest cost and return on assets. Past service cost
is recognised immediately.
Actuarial gains and losses are based on an actuarial valuation of
each defined benefit plan at reporting date. Actuarial gains and
losses represent the differences between previous actuarial
assumptions of future outcomes and the actual outcome, in
addition to the effect of changes in actuarial assumptions.
We apply judgement in estimating the following key assumptions
used in the calculation of our defined benefit liabilities and assets
at reporting date:
• discount rates (determined by reference to a State and
Commonwealth blended 10-year Australian government bond
rate)
• salary inflation rate.
The estimates applied in the actuarial calculation have a
significant impact on the reported amount of our defined benefit
plan liabilities and assets. If the estimates prove to be incorrect,
the carrying value may be materially affected in the next reporting
period. Additional volatility may also potentially be recorded in
other comprehensive income to reflect differences between
actuarial assumptions of future outcomes applied at the current
reporting date and the actual outcome in the next annual
reporting period.
On 28 February 2014, we divested 70 per cent of our directories
business via disposal of our 100 per cent shareholding in Sensis
Pty Ltd and its controlled entities (Sensis Group) and acquisition
of 30 per cent of Project Sunshine I Pty Ltd, the new holding
company of the Sensis Group.
Following the disposal of the Sensis Group we account for our
proportionate share of assets, liabilities and costs of our defined
benefit divisions and continue to account for our contributions to
the defined contribution divisions.
Refer to note 24 for details on the key management judgements
used in the calculation of our defined benefit liabilities and assets.
2.21 Employee Share Plans
We own 100 per cent of the equity of Telstra ESOP Trustee Pty Ltd,
the corporate trustee for the Telstra Employee Share Ownership
Plan Trust (TESOP97) and Telstra Employee Share Ownership Plan
Trust II (TESOP99). We consolidate the results, position and cash
flows of TESOP97 and TESOP99.
2. SUMMARY OF SIGNIFICANT ACCOUNTING POLICIES, ESTIMATES, ASSUMPTIONS AND JUDGEMENTS (CONTINUED)

NOTES TO THE FINANCIAL STATEMENTS(Continued)
Telstra Corporation Limited and controlled entities86 Telstra Annual Report
2.21 Employee Share Plans (continued)
The Telstra Growthshare Trust (Growthshare) was established to
allocate equity based instruments as required. Current equity
based instruments include options, performance rights,
restricted shares, incentive shares and Ownshare instruments.
Restricted shares and incentive shares are subject to a specified
period of service. Options and performance rights can be subject
to performance hurdles or a specified period of service.
We own 100 per cent of the equity of Telstra Growthshare Pty Ltd,
the corporate trustee for Growthshare. We also consolidate the
results, position and cash flows of Growthshare.
We recognise an expense for all share-based remuneration
determined with reference to the fair value at grant date of the
equity instruments issued. The fair value of our equity instruments
is calculated using a valuation technique that is consistent with
the Black-Scholes methodology and utilises Monte Carlo
simulations. The fair value is recognised in the income statement
over the relevant vesting periods, adjusted to reflect actual and
expected levels of vesting.
2.22 Derivative financial instruments
We use derivative financial instruments such as forward exchange
contracts, cross currency swaps and interest rate swaps to hedge
risks associated with foreign currency and interest rate
fluctuations.
The use of hedging instruments is governed by the guidelines set
by our Board of Directors.
Derivative financial instruments are included as non current
assets or liabilities except for those with maturities less than 12
months from the reporting date, which are classified as current
assets or liabilities.
Derivatives are initially recognised at fair value on the date on
which a derivative contract is entered into and are subsequently
remeasured to fair value. Refer to note 17 for details on the basis
used to estimate fair value. The method of recognising the
resulting remeasurement gain or loss depends on whether the
derivative is designated as a hedging instrument, and, if so, the
nature of the item being hedged. Where we hold derivative
financial instruments that are not designated as hedges, they are
categorised as “held for trading” financial instruments. All of our
derivative financial instruments are stated at fair value.
Derivative assets are derecognised when the rights to receive cash
flows from the derivative assets have expired or have been
transferred and we have transferred substantially all the risks and
rewards of ownership. Derivative liabilities are derecognised when
the contractual obligations are discharged, are cancelled or
expire.
The carrying value of our cross currency and interest rate swaps
refers to the fair value of our receivable or payable under the swap
contract. We do not offset the receivable or payable with the
underlying financial asset or financial liability being hedged, as
the transactions are usually with different counterparties and are
not generally settled on a net basis.
Where we have a legally recognised right to offset the derivative
asset and the derivative liability, and we intend to settle on a net
basis or simultaneously, we record this position on a net basis in
our statement of financial position. Where we enter into master
netting arrangements relating to a number of financial
instruments, have a legal right of set-off, and intend to exercise
that right, we also include this position on a net basis in our
statement of financial position.
Our derivative financial instruments that are held to hedge
exposures can be classified into three different types, according
to the reason we are holding them: fair value hedges, cash flow
hedges and hedges of a net investment in a foreign operation.
Hedge accounting can only be utilised where effectiveness tests
are met on both a prospective and retrospective basis. For all of
our hedging instruments, any gains or losses on remeasuring to
fair value any portion of the instrument not considered to be
effective are recognised directly in the income statement in the
period in which they occur. The extent to which gains or losses on
the hedged item and the hedge instrument do not offset
represents ineffectiveness, which will create volatility in the
income statement.
We formally designate and document at the inception of a
transaction the relationship between hedging instruments and
hedged items, as well as our risk management objective and
strategy for undertaking various hedge transactions, together
with the methods that will be used to assess the effectiveness of
the hedge relationship. We also document, both at hedge
inception and on an ongoing basis, our assessment of whether the
hedging instruments that are used in hedging transactions have
been, and will continue to be, highly effective in offsetting changes
in fair values or cash flows of hedged items.
Purchases and sales of derivative financial instruments are
recognised on the date on which we commit to purchase or sell an
asset or liability.
(a) Fair value hedges
We use fair value hedges to mitigate the risk of changes in the fair
value of our foreign currency borrowings from foreign currency
and interest rate fluctuations over the hedging period.
Where a fair value hedge qualifies for hedge accounting, gains or
losses from remeasuring the fair value of the hedging instrument
are recognised within finance costs in the income statement,
together with gains and losses in relation to the hedged item
where those gains or losses relate to the risks intended to be
hedged.
2. SUMMARY OF SIGNIFICANT ACCOUNTING POLICIES, ESTIMATES, ASSUMPTIONS AND JUDGEMENTS (CONTINUED)

NOTES TO THE FINANCIAL STATEMENTS(Continued)
Financial Report
Telstra Corporation Limited and controlled entitiesTelstra Annual Report 87
2.22 Derivative financial instruments (continued)
(b) Cash flow hedges
We use cash flow hedges to mitigate the risk of variability of future
cash flows attributable to foreign currency fluctuations over the
hedging period associated with our foreign currency borrowings
and our ongoing business activities, predominantly where we have
highly probable purchase or settlement commitments in foreign
currencies. We also use cash flow hedges to hedge variability in
cash flows due to interest rate movements associated with some
of our domestic borrowings.
Where a cash flow hedge qualifies for hedge accounting, the
effective portion of gains or losses on remeasuring the fair value of
the hedging instrument is recognised directly in other
comprehensive income in the cash flow hedging reserve until such
time as the hedged item affects profit or loss, and then the gains
or losses are transferred to the income statement. However, in our
hedges of forecast transactions, when the forecast transaction
that is hedged results in the recognition of a non-financial asset
(for example, property, plant and equipment), the gains and losses
previously deferred in other comprehensive income are
transferred from other comprehensive income and included in the
measurement of the initial cost or carrying amount of the asset.
Gains or losses on any portion of the hedge determined to be
ineffective are recognised immediately in the income statement.
The application of hedge accounting will create volatility in equity
reserve balances.
When a hedging instrument expires or is sold or terminated, or
when a hedge no longer meets the criteria for hedge accounting,
any cumulative gains or losses existing in other comprehensive
income at that time remain in other comprehensive income and
are recognised when the hedged item is ultimately recognised in
the income statement.
If a forecast hedged transaction is no longer expected to occur, the
cumulative gains or losses on the hedging instrument that were
reported in other comprehensive income are transferred
immediately to the income statement.
(c) Hedges of a net investment in a foreign operation
Our investments in foreign operations are exposed to foreign
currency risk, which arises when we translate the net assets of our
foreign investments from their functional currency to Australian
dollars. We hedge our net investments to mitigate exposure to this
risk by using forward foreign currency contracts, cross currency
swaps and/or borrowings in the relevant currency of the
investment.
Gains and losses on remeasurement of our derivative instruments
designated as hedges of foreign investments are recognised in the
foreign currency translation reserve in equity to the extent that
they are considered to be effective.
The cumulative amount of the recognised gains or losses included
in equity is transferred to the income statement when the foreign
operation is sold.
(d) Derivatives and borrowings that are de-designated from
fair value hedge relationships or not in a designated
hedging relationship
Derivatives associated with borrowings de-designated from fair
value hedge relationships or not in a designated hedge
relationship for hedge accounting purposes are classified as “held
for trading”.
For borrowings de-designated from fair value hedge relationships,
from the date of de-designation the derivatives continue to be
recognised at fair value and the borrowings are accounted for on
an amortised cost basis consistent with a revised effective
interest rate as at the de-designation date. The gains or losses on
both the borrowings and derivatives are included within finance
costs on the basis that the net result primarily reflects the impact
of movements in interest rates and the discounting impact of
future cash flows on the derivatives. The cumulative gains or
losses previously recognised from the remeasurement of these
borrowings as at the date of de-designation are unwound and
amortised to the income statement over the remaining life of the
borrowing. This amortisation expense is also included within
finance costs.
For borrowings not in designated hedge relationships for hedge
accounting purposes, the derivatives are recognised at fair value
and the borrowings are accounted for on an amortised cost basis.
The gains or losses on both the borrowings and derivatives are
included within finance costs on the basis that the net result
primarily reflects the impact of movements in interest rates and
the discounting impact of future cash flows on the derivatives.
Any gains or losses on remeasuring to fair value forward exchange
contracts that are not in a designated hedging relationship are
recognised directly in the income statement in the period in which
they occur within other expenses or other income.
(e) Embedded derivatives
Derivatives embedded in other financial instruments or other host
contracts are treated as separate derivatives when their risks and
characteristics are not closely related to those of the host
contracts and the host contracts are not measured at fair value
through profit or loss.
2.23 Contingent liabilities
A contingent liability is a liability of sufficient uncertainty that it
does not qualify for recognition as a liability, or a liability whose
existence will be confirmed only by the occurrence or non-
occurrence of one or more uncertain future events not wholly
within the control of Telstra. In addition, the term contingent
liability is used for liabilities that do not meet the recognition
criteria.
We first determine whether an obligation should be recorded as a
liability or a contingent liability. This requires management to
assess the probability that Telstra will be required to make
payment as well as an estimate of that payment.
2. SUMMARY OF SIGNIFICANT ACCOUNTING POLICIES, ESTIMATES, ASSUMPTIONS AND JUDGEMENTS (CONTINUED)

NOTES TO THE FINANCIAL STATEMENTS(Continued)
Telstra Corporation Limited and controlled entities88 Telstra Annual Report
2.23 Contingent liabilities (continued)
This assessment is made based on the facts and circumstances,
factoring in past experience and, in some cases, reports from
independent experts. The evidence considered includes any
additional evidence provided by events after the reporting date.
Refer to notes 23, 26 and 30 for further details on contingent
liabilities.
2.24 Non current assets (or disposal groups) held for sale and discontinued operations
Non current assets (or disposal groups) are classified as held for
sale if their carrying amount will be recovered principally through
a sale transaction, rather than through continuing use, and a sale
is considered highly probable. They are measured at the lower of
their carrying amount and fair value less costs to sell, except for
assets such as deferred tax assets, assets arising from employee
benefits and financial assets that are carried at fair value.
An impairment loss is recognised for any initial or subsequent
write-down of the asset (or disposal group) to fair value less costs
to sell. A gain is recognised for any subsequent increases in fair
value less costs to sell of an asset (or disposal group), but not in
excess of any cumulative impairment loss previously recognised.
A gain or loss not previously recognised by the date of the sale of
the non current asset (or disposal group) is recognised at the date
of derecognition.
Non current assets (including those that are part of a disposal
group) are not depreciated or amortised while they are classified
as held for sale. Interest and other expenses attributable to the
liabilities of a disposal group classified as held for sale continue to
be recognised.
Non current assets classified as held for sale and the assets of a
disposal group classified as held for sale are presented separately
from other assets in the statement of financial position. The
liabilities of a disposal group classified as held for sale are
presented separately from other liabilities in the statement of
financial position.
A discontinued operation is a component of the entity that has
been disposed of or is classified as held for sale and that
represents a separate major line of business or geographical area
of operations, is part of a single coordinated plan to dispose of
such a line of business or area of operations, or is a subsidiary
acquired exclusively with a view to resale. The results of
discontinued operations are presented separately in the income
statement.
Refer to note 12 for further details.
2.25 New accounting standards to be applied in future reporting periods
The accounting standards that have not been early adopted for the
year ended 30 June 2014 but will be applicable to the Telstra
Group in future reporting periods are detailed below.
Apart from these standards, we have considered other accounting
standards that will be applicable in future periods but are
considered insignificant to Telstra.
(a) Financial Instruments
In December 2013, the AASB issued AASB 2013-9: “Amendments
to Australian Accounting Standards - Conceptual Framework,
Materiality and Financial Instruments” which completed a series
of amendments to AASB 9: “Financial Instruments” (AASB 9
(2013)). AASB 9 (2013) currently applies to annual reporting
periods beginning on or after 1 January 2017 (i.e. from 1 July 2017
for Telstra), with early adoption permitted. We resolved to early
adopt the current version of AASB 9 (2013), i.e. sections regarding
classification and measurement of financial assets and financial
liabilities and hedge accounting, from 1 July 2014.
In regards to classification and measurement of financial assets
and financial liabilities AASB 9 (2013) will replace AASB 139:
“Financial instruments: Recognition and measurement”. We have
assessed that there will be no material impact to our financial
statements resulting from the amended requirements and we do
not expect any retrospective restatement of comparatives. Under
AASB 9 (2013) financial assets are classified and measured based
on the business model in which they are held and the
characteristics of their contractual cash flows. The objective of
our business model is to hold financial assets in order to collect
contractual cash flows. Accordingly, our non-derivative financial
assets will continue to be measured at amortised cost. Derivatives
will continue to be measured at fair value consistent with current
accounting requirements. For liabilities, AASB 9 (2013) retains
most of the AASB 139 requirements and there are no significant
implications with respect to classification and measurement.
There will be some changes relating to measurement of financial
liabilities associated with changes to hedge accounting discussed
below.
We expect that the early adoption of the new hedge accounting
rules will result in reduced volatility in the income statement as a
consequence of the revised hedge effectiveness requirements
and changed accounting treatment associated with costs of
hedging relating to currency basis spreads. We will redefine our
hedge relationships relating to the portion of our offshore
borrowing portfolio in fair value hedges which is also expected to
reduce volatility in the income statement. All changes to the hedge
accounting model will be applied prospectively with no
restatement of comparatives required.
2. SUMMARY OF SIGNIFICANT ACCOUNTING POLICIES, ESTIMATES, ASSUMPTIONS AND JUDGEMENTS (CONTINUED)

NOTES TO THE FINANCIAL STATEMENTS(Continued)
Financial Report
Telstra Corporation Limited and controlled entitiesTelstra Annual Report 89
2.25 New accounting standards to be applied in future reporting periods (continued)
(a) Financial Instruments (continued)
On 24 July 2014, the IASB issued the final component of IFRS 9:
“Financial Instruments” on impairment. It applies to annual
reporting periods beginning on or after 1 January 2018 (i.e. from 1
July 2018 for Telstra), with early adoption permitted. The
transitional provisions allow for early adoption of the current
standard before February 2015 without the requirement to early
adopt the impairment requirements. We anticipate that the AASB
will replicate the transitional provisions of the IASB. We are
currently assessing the impact of the impairment requirements.
(b) Revenue from Contracts with Customers
In May 2014, the IASB issued IFRS 15 “Revenue from Contracts
with Customers”. IFRS 15 establishes principles for reporting the
nature, amount, timing and uncertainty of revenue and cash flows
arising from an entity’s contracts with customers. The new
revenue standard is applicable to Telstra from 1 July 2017. We are
currently assessing the impact of IFRS 15 on our financial results.
(c) Other
In addition to the above recently issued accounting standards that
are applicable in future years, we note the following new
accounting standards that are applicable in future years:
• AASB 1031: “Materiality”
• AASB 2013-9: “Amendments to Australian Accounting
Standards – Conceptual Framework, Materiality and Financial
Instruments”
• AASB 2014-1 “Australian Accounting Standards – Part A:
Annual Improvements 2010 - 2012 and 2011-2013 Cycles, Part
B: “Defined Benefit Plans: Employee Contributions
(Amendments to AASB 119)”
• Amendments to IFRS 11 “Accounting for Acquisitions of
Interests in Joint Operations”
• Amendments to IAS 16 and IAS 38 “Clarification of acceptable
methods of depreciation and amortisation”.
We do not expect these accounting standards, upon adoption, will
have any material impact on our financial results.
2. SUMMARY OF SIGNIFICANT ACCOUNTING POLICIES, ESTIMATES, ASSUMPTIONS AND JUDGEMENTS (CONTINUED)

NOTES TO THE FINANCIAL STATEMENTS(Continued)
Telstra Corporation Limited and controlled entities90 Telstra Annual Report
(a) In order to underpin the equity instruments issued under the
Growthshare plan, the Telstra Growthshare Trust purchases
Telstra shares already on issue. These shares are not considered
to be outstanding for the purposes of calculating basic and diluted
earnings per share.
(b) Share options issued under the Telstra Employee Share
Ownership Plan Trust I (TESOP97) and II (TESOP99) are not
considered outstanding for the purposes of calculating basic and
diluted earnings per share.
(c) The following equity instruments are considered dilutive to
earnings per share:
• certain restricted shares granted under the Growthshare short
term incentive (STI) scheme
• certain performance rights and restricted shares granted
under the Growthshare long term incentive (LTI) scheme
• share options issued under TESOP99.
Certain performance rights and restricted shares issued under the
Growthshare STI and LTI schemes are not considered dilutive to
earnings per share.
Refer to note 27 for details of equity instruments issued under the
Growthshare and TESOP share plans.
3. EARNINGS PER SHARE
Telstra Group
Year ended 30 June
Restated
2014 2013
cents cents
Earnings per share from continuing operations
Basic ....................................................................................................................................................................... 36.1 28.9
Diluted .................................................................................................................................................................... 36.0 28.8
$m $m
Earnings used in the calculation of basic and diluted earnings per share
Profit for the year from continuing operations attributable to equity holders of Telstra Entity...................... 4,479 3,588
Earnings per share cents cents
Basic ....................................................................................................................................................................... 34.4 30.1
Diluted .................................................................................................................................................................... 34.3 30.0
$m $m
Earnings used in the calculation of basic and diluted earnings per share
Profit for the year attributable to equity holders of Telstra Entity..................................................................... 4,275 3,739
Number of shares
millions
Weighted average number of ordinary shares
Weighted average number of ordinary shares on issue...................................................................................... 12,443 12,443
Effect of shares held by employee share plan trusts (a)(b) ................................................................................ (25) (37)
Weighted average number of ordinary shares used in the calculation of basic earnings per share .............. 12,418 12,406
Effect of dilutive employee share instruments (c) .............................................................................................. 27 38
Weighted average number of ordinary shares used in the calculation of diluted earnings per share ........... 12,445 12,444

NOTES TO THE FINANCIAL STATEMENTS(Continued)
Financial Report
Telstra Corporation Limited and controlled entitiesTelstra Annual Report 91
Dividends paid are fully franked at a tax rate of 30 per cent.
Dividends per share in respect of each financial year are detailed
below.
(a) As the final dividend for financial year 2014 was not determined
or publicly recommended by the Board as at 30 June 2014, no
provision for dividend has been raised in the statement of
financial position. The final dividend has been reported as an
event subsequent to reporting date. Refer to note 31 for further
details.
(b) Franking credits that will arise from the payment of income tax
are expressed at the 30 per cent tax rate on a tax paid basis.
We believe that our current balance in the franking account,
combined with the franking credits that will arise on tax
instalments expected to be paid, will be sufficient to fully frank our
final 2014 dividend.
4. DIVIDENDS
Telstra Entity
Year ended 30 June
2014 2013
$m $m
Dividends paid
Previous year final dividend paid.......................................................................................................................... 1,742 1,739
Interim dividend paid............................................................................................................................................. 1,803 1,741
Total dividends paid............................................................................................................................................... 3,545 3,480
Dividends paid per ordinary share cents cents
Previous year final dividend paid.......................................................................................................................... 14.0 14.0
Interim dividend paid............................................................................................................................................. 14.5 14.0
Total dividends paid............................................................................................................................................... 28.5 28.0
Telstra Entity
Year ended 30 June
2014 2013
cents cents
Dividends per ordinary share
Interim dividend paid............................................................................................................................................. 14.5 14.0
Final dividend to be paid (a) .................................................................................................................................. 15.0 14.0
Total dividends ....................................................................................................................................................... 29.5 28.0
Telstra Entity
2014 2013
$m $m
Franking credits available for use in subsequent reporting periods
Franking account balance .................................................................................................................................... 111 (85)
Franking credits that will arise from the payment of income tax payable as at 30 June (b) ........................... 253 368
364 283
NOTES TO THE FINANCIAL STATEMENTS(Continued)
Telstra Corporation Limited and controlled entities92 Telstra Annual Report
Operating segments
We report segment information on the same basis as our internal
management reporting structure, which determines how our
Company is organised and managed.
Segment results are reported according to the internal
management reporting structure at the reporting date. Segment
comparatives reflect the organisational changes that have
occurred since the prior reporting period to present a like-for-like
view.
During the year ended 30 June 2014, the following changes were
made to our operating segments:
• a new business unit “Global Enterprise and Services” (GES) was
created that operates as a global scale, industry-based
services and solutions business. GES is a separate reportable
segment which includes mainly Telstra Enterprise and
Government (previously a separate reportable segment),
Network Applications and Services (NAS) (previously in the
Telstra Operations segment), Telstra Global (previously in the
Telstra International Group segment), as well as Telstra
Ventures Group and Global Applications and Platforms (both
previously in the “All Other” category)
• Telstra Customer Sales and Services business unit changed its
name to Telstra Retail (TR), now reported as a separate
segment and, following the creation of GES, it includes Telstra
Consumer (TC), Telstra Business (TB), Telstra Health (TH) and
TR head office function
• On 28 February 2014, we divested 70 per cent of our directories
business via disposal of our 100 per cent shareholding in
Sensis Pty Ltd and its controlled entities (Sensis Group) and
acquisition of 30 per cent of Project Sunshine I Pty Ltd, the new
holding company of the Sensis Group. The Sensis Group
results, previously reported within the Telstra Media Group
(TMG) segment, have been included in the “All Other” category.
The remaining parts of the TMG segment are now reported
within the TR segment.
For the financial year 2014 the Telstra Group is organised for
internal management reporting purposes into the following
reportable segments:
Telstra Retail (TR) is responsible for:
• supporting consumer customers and small to medium
enterprises in Australia
• providing a full range of telecommunication products, services
and solutions across mobiles, fixed and mobile broadband,
telephony and Pay TV
• the operation of inbound and outbound call centres, Telstra
shops (owned and licensed) and the Telstra dealership network
• delivering for Telstra customers self-care capabilities, across
all phases of the customer experience, from browsing to
buying, billing and service requests
• the supply of Hybrid Fibre Coaxial (HFC) cable services to our
Foxtel joint venture and the distribution of Foxtel products
• providing a connected health IT ecosystem and delivering
transformative change in the healthcare sector.
Global Enterprise and Services (GES) is responsible for:
• sales and contract management support for business and
government customers in Australia and globally
• product management for advanced technology solutions,
including data and Internet Protocol (IP) networks, and NAS
such as managed network, unified communications, cloud,
industry solutions and integrated services
• technology delivery for NAS customers in Australia and
globally.
Telstra Operations (TOps) is responsible for:
• overall planning, design, engineering and architecture of
Telstra networks, technology and information technology
• construction of infrastructure for our fixed, mobile, IP and data
networks
• delivery of customer services across these networks
• operation, assurance and maintenance (including activation
and restoration of these networks)
• supply and delivery of information technology solutions to
support our products, services, customer support functions
and our internal needs.
Telstra Wholesale (TW) is responsible for:
• the provision of a wide range of telecommunication products
and services delivered over Telstra networks and associated
support systems to non-Telstra branded carriers, carriage
service providers and internet service providers.
Telstra International Group (TIG) is responsible for managing the
following assets outside Australia:
• Telstra China, our mainland China business providing digital
media services in auto, IT and consumer electronics (this
includes the Autohome and Sequel Media businesses)
• CSL New World Mobility Limited (CSL), our 76.4 per cent owned
subsidiary in Hong Kong, responsible for providing to the Hong
Kong market full mobile services, including handset and device
sales, mobile voice, and mobile data products. In May 2014, we
disposed of our entire 76.4 per cent shareholding in CSL and its
controlled entities (CSL Group). Refer to note 20 for further
details.
In our segment results, the “All Other” category consists of various
business units that do not qualify as reportable segments in their
own right and includes the Sensis Group results.
5. SEGMENT INFORMATION

NOTES TO THE FINANCIAL STATEMENTS(Continued)
Financial Report
Telstra Corporation Limited and controlled entitiesTelstra Annual Report 93
Segment results
The measurement of segment results is in line with information
presented to management for internal management reporting
purposes. The result of each segment is measured based on its
“earnings before interest, income tax expense, depreciation and
amortisation (EBITDA) contribution”. EBITDA contribution
excludes the effects of all inter-segment balances and
transactions (with the exception of transactions referred to in
footnote (v) below). Therefore, only transactions external to the
Telstra Group are reported.
We have no reconciling items between segment results and
Telstra Group’s reported EBITDA. The reconciliation of segment
results to Telstra Group’s reported EBIT and profit before income
tax expense in the financial statements includes only depreciation
and amortisation expenses and net finance costs.
Certain items of income and expense are recorded by our
corporate areas, rather than being allocated to each segment.
These items include:
• the adjustment to defer our basic access installation and
connection fee revenues and costs in accordance with our
accounting policy (our reportable segments record these
amounts upfront)
• the majority of redundancy expenses for the Telstra Entity.
In addition, the following narrative further explains how some
items are allocated and managed and, as a result, how they are
reflected in our segment results:
• revenue associated with mobile handsets sold via dealers for
the GES segment is allocated to the TR segment along with the
associated costs of goods and services purchased, as the TR
segment manages our suppliers, delivery and dealership
arrangements. Ongoing prepaid and postpaid mobile revenues
derived from our mobile usage services are recorded in the TR
and GES segments depending on the type of customer segment
serviced
• NAS costs associated with revenue from the TB customers,
included in the TR segment, are reported in the GES segment
• the TOps segment result includes network service delivery
costs for the TR, GES and TW customers
• the TOps segment recognises costs related to NAS revenue
reported in the GES segment, mainly for commercial
recoverable works, where customers contribute to the
extension of our networks
• the TOps segment recognises certain expenses in relation to
the installation and running of the HFC cable network
• domestic promotion and advertising expenses for the Telstra
Entity are recorded centrally in the TR head office function
• call centre costs associated with the GES segment are included
in the TR segment.
5. SEGMENT INFORMATION (CONTINUED)
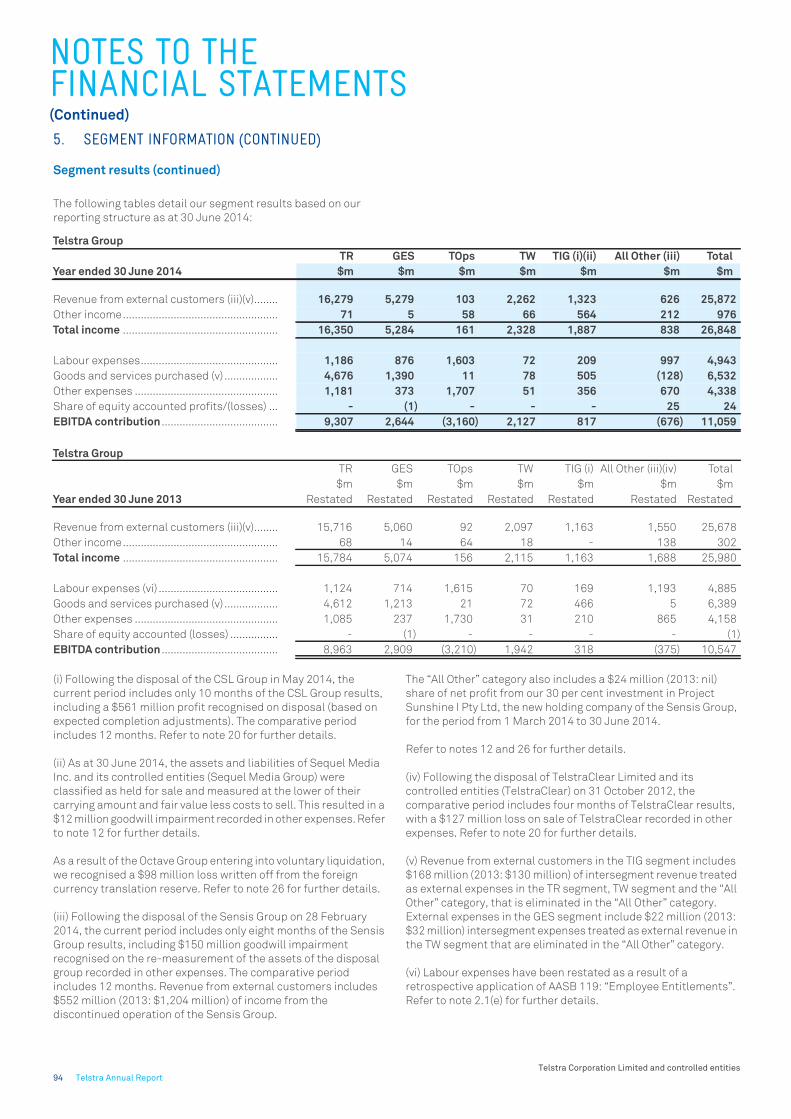
NOTES TO THE FINANCIAL STATEMENTS(Continued)
Telstra Corporation Limited and controlled entities94 Telstra Annual Report
Segment results (continued)
The following tables detail our segment results based on our
reporting structure as at 30 June 2014:
(i) Following the disposal of the CSL Group in May 2014, the
current period includes only 10 months of the CSL Group results,
including a $561 million profit recognised on disposal (based on
expected completion adjustments). The comparative period
includes 12 months. Refer to note 20 for further details.
(ii) As at 30 June 2014, the assets and liabilities of Sequel Media
Inc. and its controlled entities (Sequel Media Group) were
classified as held for sale and measured at the lower of their
carrying amount and fair value less costs to sell. This resulted in a
$12 million goodwill impairment recorded in other expenses. Refer
to note 12 for further details.
As a result of the Octave Group entering into voluntary liquidation,
we recognised a $98 million loss written off from the foreign
currency translation reserve. Refer to note 26 for further details.
(iii) Following the disposal of the Sensis Group on 28 February
2014, the current period includes only eight months of the Sensis
Group results, including $150 million goodwill impairment
recognised on the re-measurement of the assets of the disposal
group recorded in other expenses. The comparative period
includes 12 months. Revenue from external customers includes
$552 million (2013: $1,204 million) of income from the
discontinued operation of the Sensis Group.
The “All Other” category also includes a $24 million (2013: nil)
share of net profit from our 30 per cent investment in Project
Sunshine I Pty Ltd, the new holding company of the Sensis Group,
for the period from 1 March 2014 to 30 June 2014.
Refer to notes 12 and 26 for further details.
(iv) Following the disposal of TelstraClear Limited and its
controlled entities (TelstraClear) on 31 October 2012, the
comparative period includes four months of TelstraClear results,
with a $127 million loss on sale of TelstraClear recorded in other
expenses. Refer to note 20 for further details.
(v) Revenue from external customers in the TIG segment includes
$168 million (2013: $130 million) of intersegment revenue treated
as external expenses in the TR segment, TW segment and the “All
Other” category, that is eliminated in the “All Other” category.
External expenses in the GES segment include $22 million (2013:
$32 million) intersegment expenses treated as external revenue in
the TW segment that are eliminated in the “All Other” category.
(vi) Labour expenses have been restated as a result of a
retrospective application of AASB 119: “Employee Entitlements”.
Refer to note 2.1(e) for further details.
5. SEGMENT INFORMATION (CONTINUED)
Telstra Group
TR GES TOps TW TIG (i)(ii) All Other (iii) Total
Year ended 30 June 2014 $m $m $m $m $m $m $m
Revenue from external customers (iii)(v)........ 16,279 5,279 103 2,262 1,323 626 25,872
Other income.................................................... 71 5 58 66 564 212 976
Total income .................................................... 16,350 5,284 161 2,328 1,887 838 26,848
Labour expenses.............................................. 1,186 876 1,603 72 209 997 4,943
Goods and services purchased (v) .................. 4,676 1,390 11 78 505 (128) 6,532
Other expenses ................................................ 1,181 373 1,707 51 356 670 4,338
Share of equity accounted profits/(losses) ... - (1) - - - 25 24
EBITDA contribution ....................................... 9,307 2,644 (3,160) 2,127 817 (676) 11,059
Telstra Group
TR GES TOps TW TIG (i) All Other (iii)(iv) Total
Year ended 30 June 2013
$m $m $m $m $m $m $m
Restated Restated Restated Restated Restated Restated Restated
Revenue from external customers (iii)(v)........ 15,716 5,060 92 2,097 1,163 1,550 25,678
Other income.................................................... 68 14 64 18 - 138 302
Total income .................................................... 15,784 5,074 156 2,115 1,163 1,688 25,980
Labour expenses (vi) ........................................ 1,124 714 1,615 70 169 1,193 4,885
Goods and services purchased (v) .................. 4,612 1,213 21 72 466 5 6,389
Other expenses ................................................ 1,085 237 1,730 31 210 865 4,158
Share of equity accounted (losses) ................ - (1) - - - - (1)
EBITDA contribution ....................................... 8,963 2,909 (3,210) 1,942 318 (375) 10,547

NOTES TO THE FINANCIAL STATEMENTS(Continued)
Financial Report
Telstra Corporation Limited and controlled entitiesTelstra Annual Report 95
Segment results (continued)
A reconciliation of EBITDA contribution for reportable segments to
Telstra Group’s EBITDA, EBIT and profit before income tax expense
is provided below:
Telstra Group profit before income tax expense, including:
(vii) Our geographical operations are split between our Australian
and offshore operations. Our offshore operations include the CSL
Group (Hong Kong) up to the date of disposal, Autohome Inc.
(China), Sequel Media (China), Telstra Limited (United Kingdom),
Telstra International Limited (Hong Kong), Telstra Inc. (United
States) and TelstraClear (New Zealand) up to the date of disposal
in the last financial year. No individual geographical area, other
than our Australian operations, forms a significant part of our
operations.
(viii) The carrying amount of our segment non current assets
excludes derivative assets, defined benefit assets and deferred
tax assets.
5. SEGMENT INFORMATION (CONTINUED)
Telstra Group
Year ended 30 June
2014
Restated
2013
$m $m
EBITDA contribution .............................................................................................................................................. 11,735 10,922
All other .................................................................................................................................................................. (676) (375)
Telstra Group EBITDA from continuing and discontinued operations ........................................................... 11,059 10,547
Depreciation and amortisation............................................................................................................................. (4,042) (4,238)
Telstra Group EBIT from continuing and discontinued operations ................................................................ 7,017 6,309
Net finance costs................................................................................................................................................... (957) (933)
Telstra Group profit before income tax expense............................................................................................... 6,060 5,376
Profit before income tax expense from continuing operations.......................................................................... 6,228 5,157
(Loss)/profit before income tax expense from discontinued operation ............................................................ (168) 219
Telstra Group profit before income tax expense............................................................................................... 6,060 5,376
Telstra Group
Year ended 30 June
2014 2013
$m $m
Information about our geographic operations (vii)
Revenue from external customers
Australian customers ............................................................................................................................................ 23,860 23,774
Offshore customers ............................................................................................................................................... 2,012 1,904
25,872 25,678
Carrying amount of non current assets (viii)
Located in Australia............................................................................................................................................... 26,916 27,896
Located offshore .................................................................................................................................................... 633 1,658
27,549 29,554

NOTES TO THE FINANCIAL STATEMENTS(Continued)
Telstra Corporation Limited and controlled entities96 Telstra Annual Report
Segment results (continued)
(ix) Other sales revenue includes revenue for the build of the
National Broadband Network (NBN) related infrastructure of $87
million (2013: $168 million) and late payment and miscellaneous
fee revenue.
(x) Other revenue primarily consists of distributions from our
Foxtel Partnership and rental income.
5. SEGMENT INFORMATION (CONTINUED)
Telstra Group
Year ended 30 June
Restated
2014 2013
Note $m $m
Income from our products and services
Fixed........................................................................................................................................................................ 7,245 7,305
Mobile ..................................................................................................................................................................... 9,668 9,200
Data and IP ............................................................................................................................................................. 2,968 3,041
Network applications and services ...................................................................................................................... 1,896 1,484
Media ...................................................................................................................................................................... 982 987
CSL Group............................................................................................................................................................... 1,045 1,011
China digital media................................................................................................................................................ 278 162
Global connectivity and NAS................................................................................................................................. 678 566
TelstraClear ............................................................................................................................................................ - 164
Other sales revenue (ix) ......................................................................................................................................... 359 378
Other revenue (x) .................................................................................................................................................. 6 201 176
Other income........................................................................................................................................................ 6 976 302
Sensis Group ...................................................................................................................................................... 12 552 1,204
Total income (excluding finance income)........................................................................................................ 6 26,848 25,980

NOTES TO THE FINANCIAL STATEMENTS(Continued)
Financial Report
Telstra Corporation Limited and controlled entitiesTelstra Annual Report 97
(a) Net gain on disposal of investments relates to the $561 million
net gain on disposal of the CSL Group. Refer to note 20 for further
details.
(b) During the financial year the following government grants were
recognised as other income:
• $157 million (2013: $124 million) under the
Telecommunications Universal Services and Management
Agency National Broadband Network (NBN) Definitive
Agreement, which replaced the Universal Services Obligation
(USO)
• $14 million (2013: $11 million) under the Retraining Fund Deed
NBN Definitive Agreement. The grant, received in financial year
2012, is being used to retrain certain employees over a period
of eight to ten years
• $4 million (2013: $11 million) related to other contracts
accounted for as government grants
• $ nil (2013: $6 million) related to the Australia Communications
and Media Authority’s (ACMA) USO.
There are no unfulfilled conditions or other contingencies
attached to these grants.
6. INCOME
Telstra Group
Year ended 30 June
Restated
2014 2013
Note $m $m
Continuing operations
Sales revenue
Rendering of services ............................................................................................................................................ 10,417 10,850
Sale of goods .......................................................................................................................................................... 2,358 2,197
Rent of network facilities and access .................................................................................................................. 11,701 10,709
Construction contracts ......................................................................................................................................... 264 249
Advertising.............................................................................................................................................................. 379 293
25,119 24,298
Other revenue (excluding finance income)
Distribution from Foxtel Partnership ................................................................................................................... 165 155
Rent from property ................................................................................................................................................ 36 21
201 176
Total revenue (excluding finance income)......................................................................................................... 25,320 24,474
Other income
Net gain on disposal of:
- property, plant and equipment and intangibles ............................................................................................... 76 66
- investments (a) ................................................................................................................................................ 20 561 -
Net gain on de-recognition of finance leases.................................................................................................. 22 - 8
Net foreign currency translation gains ................................................................................................................ - 7
Government grants (b)........................................................................................................................................... 175 152
NBN disconnection fees........................................................................................................................................ 66 7
Other miscellaneous income ................................................................................................................................ 98 62
976 302
Total income (excluding finance income).......................................................................................................... 26,296 24,776
Finance income
Interest on cash and cash equivalents ........................................................................................................17(e) 85 91
Interest on finance lease receivables ..........................................................................................................17(e) 14 11
Interest on loans to joint ventures and associated entities.......................................................................17(e) 54 53
Interest on other receivables ................................................................................................................................ 3 64
156 219
Total income from continuing operations ......................................................................................................... 26,452 24,995
Total income from discontinued operation ................................................................................................... 12 552 1,204
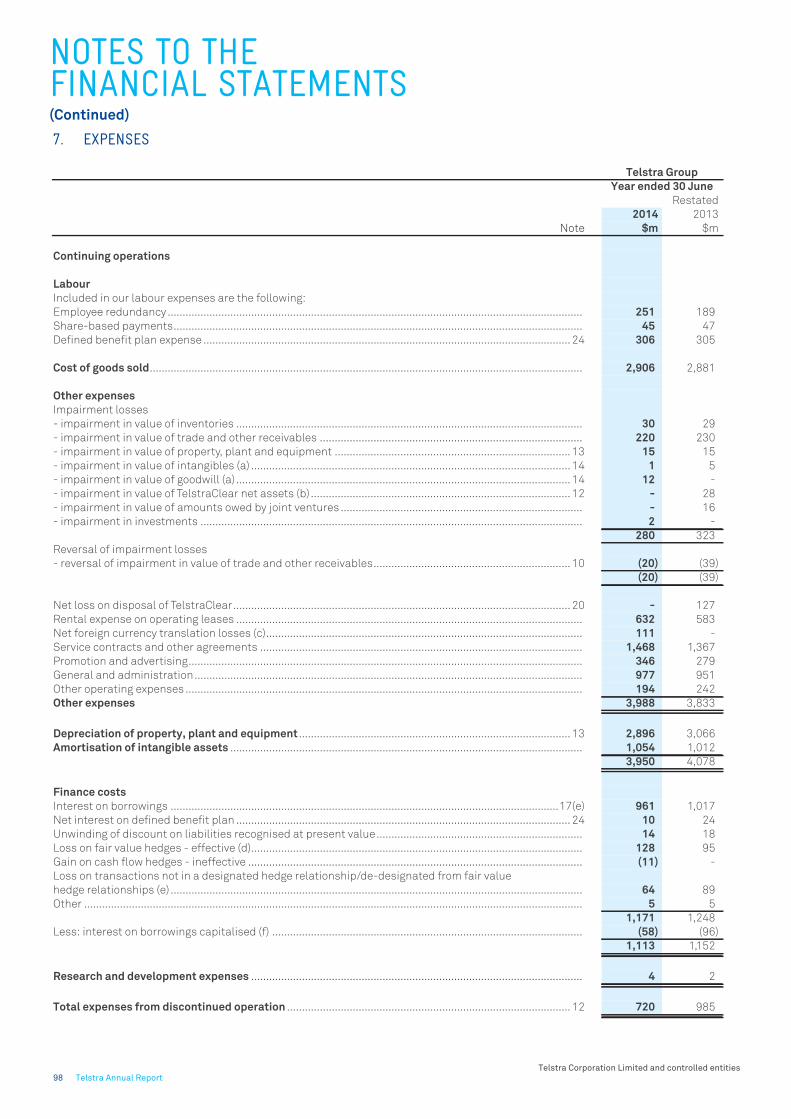
NOTES TO THE FINANCIAL STATEMENTS(Continued)
Telstra Corporation Limited and controlled entities98 Telstra Annual Report
7. EXPENSES
Telstra Group
Year ended 30 June
Restated
2014 2013
Note $m $m
Continuing operations
Labour
Included in our labour expenses are the following:
Employee redundancy ........................................................................................................................................... 251 189
Share-based payments......................................................................................................................................... 45 47
Defined benefit plan expense ........................................................................................................................... 24 306 305
Cost of goods sold................................................................................................................................................. 2,906 2,881
Other expenses
Impairment losses
- impairment in value of inventories .................................................................................................................... 30 29
- impairment in value of trade and other receivables ........................................................................................ 220 230
- impairment in value of property, plant and equipment ............................................................................... 13 15 15
- impairment in value of intangibles (a) ........................................................................................................... 14 1 5
- impairment in value of goodwill (a) ................................................................................................................ 14 12 -
- impairment in value of TelstraClear net assets (b) ....................................................................................... 12 - 28
- impairment in value of amounts owed by joint ventures ................................................................................. - 16
- impairment in investments ................................................................................................................................ 2 -
280 323
Reversal of impairment losses
- reversal of impairment in value of trade and other receivables.................................................................. 10 (20) (39)
(20) (39)
Net loss on disposal of TelstraClear................................................................................................................. 20 - 127
Rental expense on operating leases .................................................................................................................... 632 583
Net foreign currency translation losses (c).......................................................................................................... 111 -
Service contracts and other agreements ............................................................................................................ 1,468 1,367
Promotion and advertising.................................................................................................................................... 346 279
General and administration.................................................................................................................................. 977 951
Other operating expenses ..................................................................................................................................... 194 242
Other expenses 3,988 3,833
Depreciation of property, plant and equipment ........................................................................................... 13 2,896 3,066
Amortisation of intangible assets ...................................................................................................................... 1,054 1,012
3,950 4,078
Finance costs
Interest on borrowings ..................................................................................................................................17(e) 961 1,017
Net interest on defined benefit plan ................................................................................................................ 24 10 24
Unwinding of discount on liabilities recognised at present value..................................................................... 14 18
Loss on fair value hedges - effective (d)............................................................................................................... 128 95
Gain on cash flow hedges - ineffective ................................................................................................................ (11) -
Loss on transactions not in a designated hedge relationship/de-designated from fair value
hedge relationships (e) .......................................................................................................................................... 64 89
Other ....................................................................................................................................................................... 5 5
1,171 1,248
Less: interest on borrowings capitalised (f) ........................................................................................................ (58) (96)
1,113 1,152
Research and development expenses ............................................................................................................... 4 2
Total expenses from discontinued operation ............................................................................................... 12 720 985

NOTES TO THE FINANCIAL STATEMENTS(Continued)
Financial Report
Telstra Corporation Limited and controlled entitiesTelstra Annual Report 99
(a) We have recognised an impairment loss of $13 million (2013: $5
million) relating to impairment of goodwill and other intangible
assets. Refer to note 14 for further details.
(b) During the financial year 2013, we recognised an impairment
loss of $28 million relating to the impairment of TelstraClear net
assets. This was due to the operating results of TelstraClear
increasing the net assets at the date of disposal, which were not
recoverable through the disposal of TelstraClear. Refer to note 12
for further details.
(c) During the financial year, we recognised $111 million net
foreign currency translation losses (2013: $7 million net foreign
currency translation gains), which included a $98 million loss
written off from the foreign currency translation reserve as a
result of the Octave Group entering into voluntary liquidation.
Refer to note 25 for further details.
(d) We use our cross currency and interest rate swaps as fair value
hedges to convert our foreign currency borrowings into Australian
dollar floating rate borrowings.
The $128 million (2013: $95 million) unrealised loss reflects the
following valuation impacts:
• movement in base market rates and our borrowing margins
between valuation dates
• reduction in the number of future interest flows as we
approach maturity of the financial instruments
• discount factor unwinding as borrowings move closer to
maturity.
In general it is our intention to hold our borrowings and associated
derivative instruments to maturity. Accordingly, unrealised
revaluation gains and losses will be recognised in our finance
costs over the life of the financial instrument and for each
transaction will progressively unwind to nil at maturity.
Refer to note 18 for further details regarding our hedging
strategies.
(e) A combination of the following factors has resulted in a net
unrealised loss of $64 million (2013: $89 million) associated with
financial instruments that are either not in a designated hedge
relationship or were previously designated in a hedge relationship
and no longer qualify for hedge accounting:
• the valuation impacts described at (e) above for fair value
hedges
• the different measurement bases of the borrowings (measured
at amortised cost) and the associated derivatives (measured at
fair value)
• a net loss of $21 million (2013: $21 million) for the amortisation
impact of unwinding previously recognised unrealised gains on
those borrowings.
Although these borrowings and the related derivative instruments
do not satisfy the requirements for hedge accounting, they are in
effective economic relationships based on contractual face value
amounts and cash flows over the life of the transaction.
(f) Interest on borrowings has been capitalised using a
capitalisation rate of 6.2 per cent (2013: 6.4 per cent).
7. EXPENSES (CONTINUED)

NOTES TO THE FINANCIAL STATEMENTS(Continued)
Telstra Corporation Limited and controlled entities100 Telstra Annual Report
Other services
Other services comprise audit related fees and non-audit
services.
(a) Audit related fees charged by EY are for services that are
reasonably related to the performance of the audit or review of our
financial statements and other assurance engagements. These
services include assurance services over debt raising
prospectuses, additional control assessments, various
accounting advice and additional audit services related to our
controlled entities.
(b) Non-audit services comprise:
• tax fees charged by EY that mainly related to income tax return
services
• other services that relate to all additional services performed
by EY, other than those disclosed as auditing and reviewing the
financial reports, audit related and tax. These services include
various reviews and non assurance services across the Group,
including risk assessments and IT related projects.
We have processes in place to maintain the independence of the
external auditor, including the level of expenditure on non-audit
services. EY also has specific internal processes in place to ensure
auditor independence.
The Audit and Risk Committee approves the recurring audit and
non-audit fees. The provision of additional audit and non-audit
services by EY must be approved by either the Chief Financial
Officer, the Chairman of the Audit and Risk Committee or the Audit
and Risk Committee, depending upon the fees involved, if not
covered by the Audit and Risk Committee pre-approval, subject to
confirmation by both management and EY that the provision of
these services does not compromise auditor independence. Our
auditor independence guidelines clearly identify prohibited
services. All additional approved EY engagements are reported to
the Audit and Risk Committee at the next meeting.
8. REMUNERATION OF AUDITORS
Telstra Group
Year ended 30 June
2014 2013
$m $m
Audit fees
Ernst & Young (EY) has charged the following amounts for auditing and reviewing the financial reports .... 7.556 7.796
Other services
Audit related (a)...................................................................................................................................................... 1.162 1.374
Non-audit services (b) ........................................................................................................................................... 0.111 0.454
Total other services provided by EY ................................................................................................................... 1.273 1.828
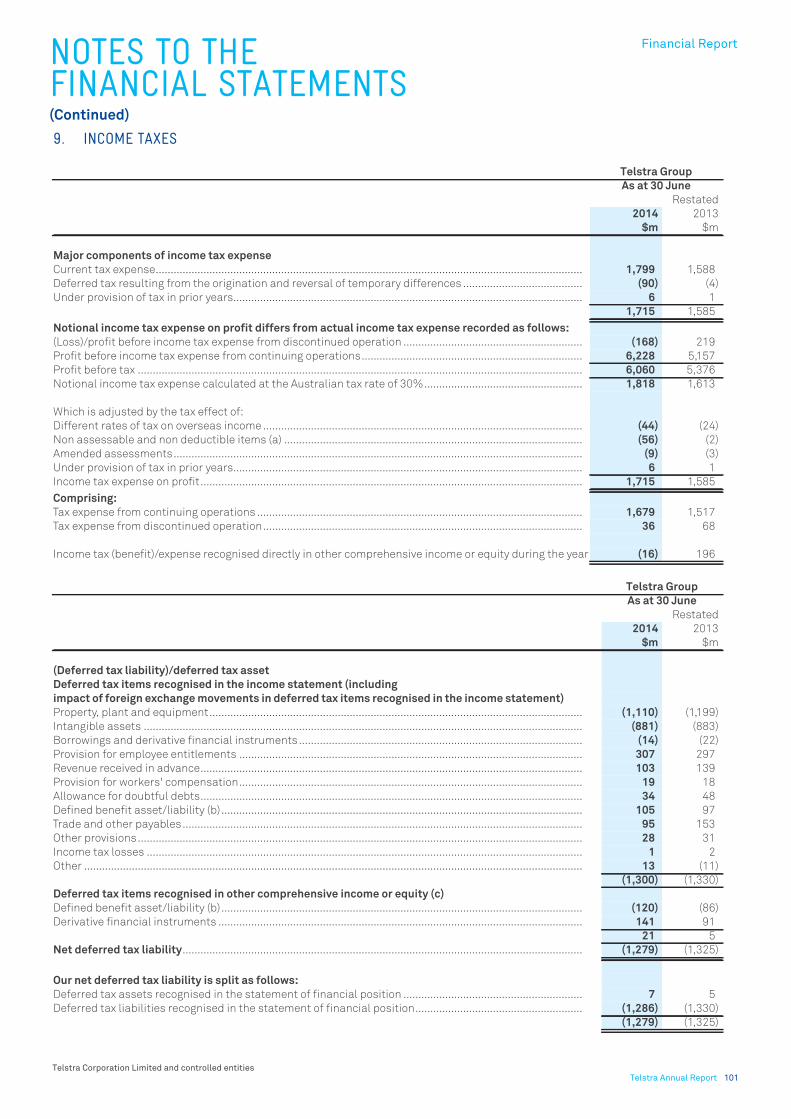
NOTES TO THE FINANCIAL STATEMENTS(Continued)
Financial Report
Telstra Corporation Limited and controlled entitiesTelstra Annual Report 101
9. INCOME TAXES
Telstra Group
As at 30 June
Restated
2014 2013
$m $m
Major components of income tax expense
Current tax expense............................................................................................................................................... 1,799 1,588
Deferred tax resulting from the origination and reversal of temporary differences ........................................ (90) (4)
Under provision of tax in prior years..................................................................................................................... 6 1
1,715 1,585
Notional income tax expense on profit differs from actual income tax expense recorded as follows:
(Loss)/profit before income tax expense from discontinued operation ............................................................ (168) 219
Profit before income tax expense from continuing operations.......................................................................... 6,228 5,157
Profit before tax ..................................................................................................................................................... 6,060 5,376
Notional income tax expense calculated at the Australian tax rate of 30%..................................................... 1,818 1,613
Which is adjusted by the tax effect of:
Different rates of tax on overseas income ........................................................................................................... (44) (24)
Non assessable and non deductible items (a) .................................................................................................... (56) (2)
Amended assessments......................................................................................................................................... (9) (3)
Under provision of tax in prior years..................................................................................................................... 6 1
Income tax expense on profit................................................................................................................................ 1,715 1,585
Comprising:
Tax expense from continuing operations ............................................................................................................. 1,679 1,517
Tax expense from discontinued operation........................................................................................................... 36 68
Income tax (benefit)/expense recognised directly in other comprehensive income or equity during the year (16) 196
Telstra Group
As at 30 June
Restated
2014 2013
$m $m
(Deferred tax liability)/deferred tax asset
Deferred tax items recognised in the income statement (including
impact of foreign exchange movements in deferred tax items recognised in the income statement)
Property, plant and equipment............................................................................................................................. (1,110) (1,199)
Intangible assets ................................................................................................................................................... (881) (883)
Borrowings and derivative financial instruments ............................................................................................... (14) (22)
Provision for employee entitlements ................................................................................................................... 307 297
Revenue received in advance................................................................................................................................ 103 139
Provision for workers' compensation................................................................................................................... 19 18
Allowance for doubtful debts................................................................................................................................ 34 48
Defined benefit asset/liability (b)......................................................................................................................... 105 97
Trade and other payables...................................................................................................................................... 95 153
Other provisions..................................................................................................................................................... 28 31
Income tax losses .................................................................................................................................................. 1 2
Other ....................................................................................................................................................................... 13 (11)
(1,300) (1,330)
Deferred tax items recognised in other comprehensive income or equity (c)
Defined benefit asset/liability (b)......................................................................................................................... (120) (86)
Derivative financial instruments .......................................................................................................................... 141 91
21 5
Net deferred tax liability...................................................................................................................................... (1,279) (1,325)
Our net deferred tax liability is split as follows:
Deferred tax assets recognised in the statement of financial position ............................................................ 7 5
Deferred tax liabilities recognised in the statement of financial position........................................................ (1,286) (1,330)
(1,279) (1,325)
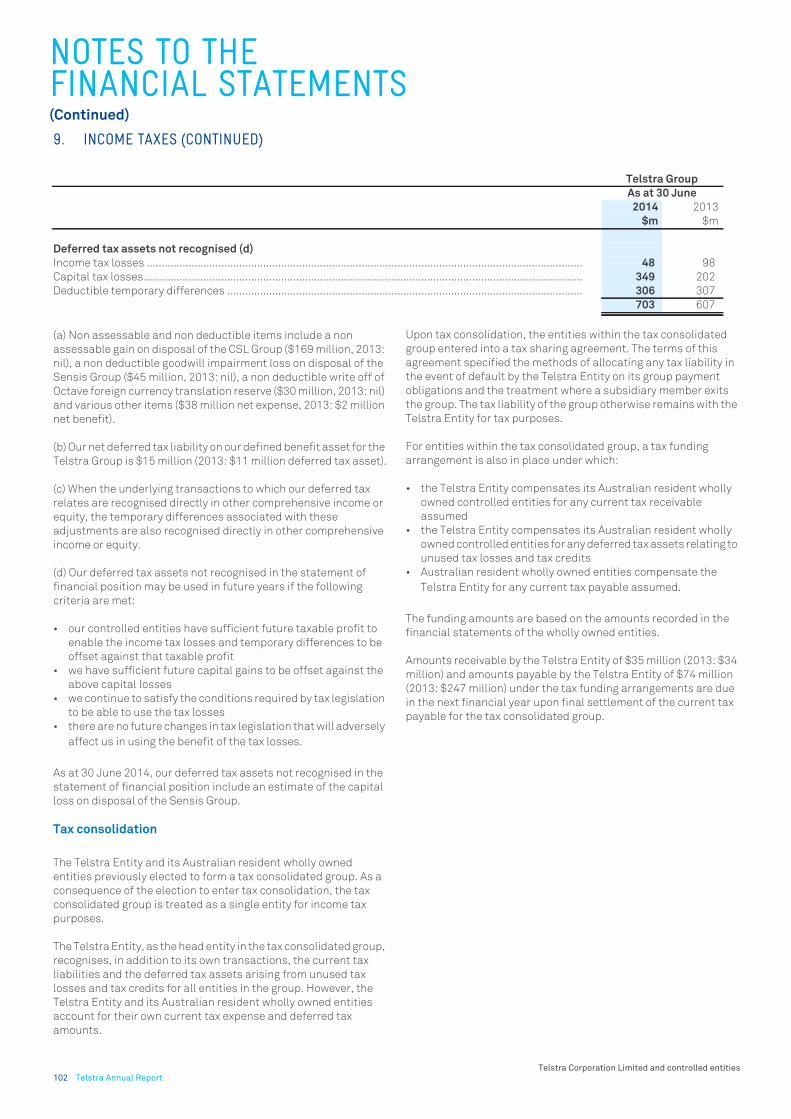
NOTES TO THE FINANCIAL STATEMENTS(Continued)
Telstra Corporation Limited and controlled entities102 Telstra Annual Report
(a) Non assessable and non deductible items include a non
assessable gain on disposal of the CSL Group ($169 million, 2013:
nil), a non deductible goodwill impairment loss on disposal of the
Sensis Group ($45 million, 2013: nil), a non deductible write off of
Octave foreign currency translation reserve ($30 million, 2013: nil)
and various other items ($38 million net expense, 2013: $2 million
net benefit).
(b) Our net deferred tax liability on our defined benefit asset for the
Telstra Group is $15 million (2013: $11 million deferred tax asset).
(c) When the underlying transactions to which our deferred tax
relates are recognised directly in other comprehensive income or
equity, the temporary differences associated with these
adjustments are also recognised directly in other comprehensive
income or equity.
(d) Our deferred tax assets not recognised in the statement of
financial position may be used in future years if the following
criteria are met:
• our controlled entities have sufficient future taxable profit to
enable the income tax losses and temporary differences to be
offset against that taxable profit
• we have sufficient future capital gains to be offset against the
above capital losses
• we continue to satisfy the conditions required by tax legislation
to be able to use the tax losses
• there are no future changes in tax legislation that will adversely
affect us in using the benefit of the tax losses.
As at 30 June 2014, our deferred tax assets not recognised in the
statement of financial position include an estimate of the capital
loss on disposal of the Sensis Group.
Tax consolidation
The Telstra Entity and its Australian resident wholly owned
entities previously elected to form a tax consolidated group. As a
consequence of the election to enter tax consolidation, the tax
consolidated group is treated as a single entity for income tax
purposes.
The Telstra Entity, as the head entity in the tax consolidated group,
recognises, in addition to its own transactions, the current tax
liabilities and the deferred tax assets arising from unused tax
losses and tax credits for all entities in the group. However, the
Telstra Entity and its Australian resident wholly owned entities
account for their own current tax expense and deferred tax
amounts.
Upon tax consolidation, the entities within the tax consolidated
group entered into a tax sharing agreement. The terms of this
agreement specified the methods of allocating any tax liability in
the event of default by the Telstra Entity on its group payment
obligations and the treatment where a subsidiary member exits
the group. The tax liability of the group otherwise remains with the
Telstra Entity for tax purposes.
For entities within the tax consolidated group, a tax funding
arrangement is also in place under which:
• the Telstra Entity compensates its Australian resident wholly
owned controlled entities for any current tax receivable
assumed
• the Telstra Entity compensates its Australian resident wholly
owned controlled entities for any deferred tax assets relating to
unused tax losses and tax credits
• Australian resident wholly owned entities compensate the
Telstra Entity for any current tax payable assumed.
The funding amounts are based on the amounts recorded in the
financial statements of the wholly owned entities.
Amounts receivable by the Telstra Entity of $35 million (2013: $34
million) and amounts payable by the Telstra Entity of $74 million
(2013: $247 million) under the tax funding arrangements are due
in the next financial year upon final settlement of the current tax
payable for the tax consolidated group.
9. INCOME TAXES (CONTINUED)
Telstra Group
As at 30 June
2014 2013
$m $m
Deferred tax assets not recognised (d)
Income tax losses .................................................................................................................................................. 48 98
Capital tax losses................................................................................................................................................... 349 202
Deductible temporary differences ....................................................................................................................... 306 307
703 607

NOTES TO THE FINANCIAL STATEMENTS(Continued)
Financial Report
Telstra Corporation Limited and controlled entitiesTelstra Annual Report 103
(a) Trade receivables and allowance for doubtful debts
The ageing of current and non current trade receivables is detailed
below.
10. TRADE AND OTHER RECEIVABLES
Telstra Group
As at 30 June
2014 2013
Note $m $m
Current
Trade receivables (a) .............................................................................................................................................. 2,950 3,515
Allowance for doubtful debts (a) .......................................................................................................................... (120) (180)
2,830 3,335
Finance lease receivable (b) ................................................................................................................................. 93 66
Accrued revenue .................................................................................................................................................... 1,155 1,093
Other receivables................................................................................................................................................... 94 63
1,342 1,222
4,172 4,557
Non current
Trade receivables (a) .............................................................................................................................................. 317 321
Amounts owed by joint ventures and associated entities.............................................................................. 29 457 457
Allowance for amounts owed by joint ventures and associated entities - loans ......................................... 29 (6) (6)
451 451
Finance lease receivable (b) ................................................................................................................................. 184 148
Other receivables................................................................................................................................................... 21 23
205 171
973 943
Telstra Group
As at 30 June
2014 2013
Gross Allowance Gross Allowance
$m $m $m $m
Not past due................................................................................................................... 2,297 (25) 2,817 (13)
Past due 0 - 30 days ...................................................................................................... 631 (12) 598 (32)
Past due 31 - 60 days .................................................................................................... 135 (8) 176 (16)
Past due 61 - 90 days .................................................................................................... 62 (12) 72 (16)
Past due 91 - 120 days .................................................................................................. 49 (10) 49 (14)
Past 120 days ................................................................................................................. 93 (53) 124 (89)
3,267 (120) 3,836 (180)
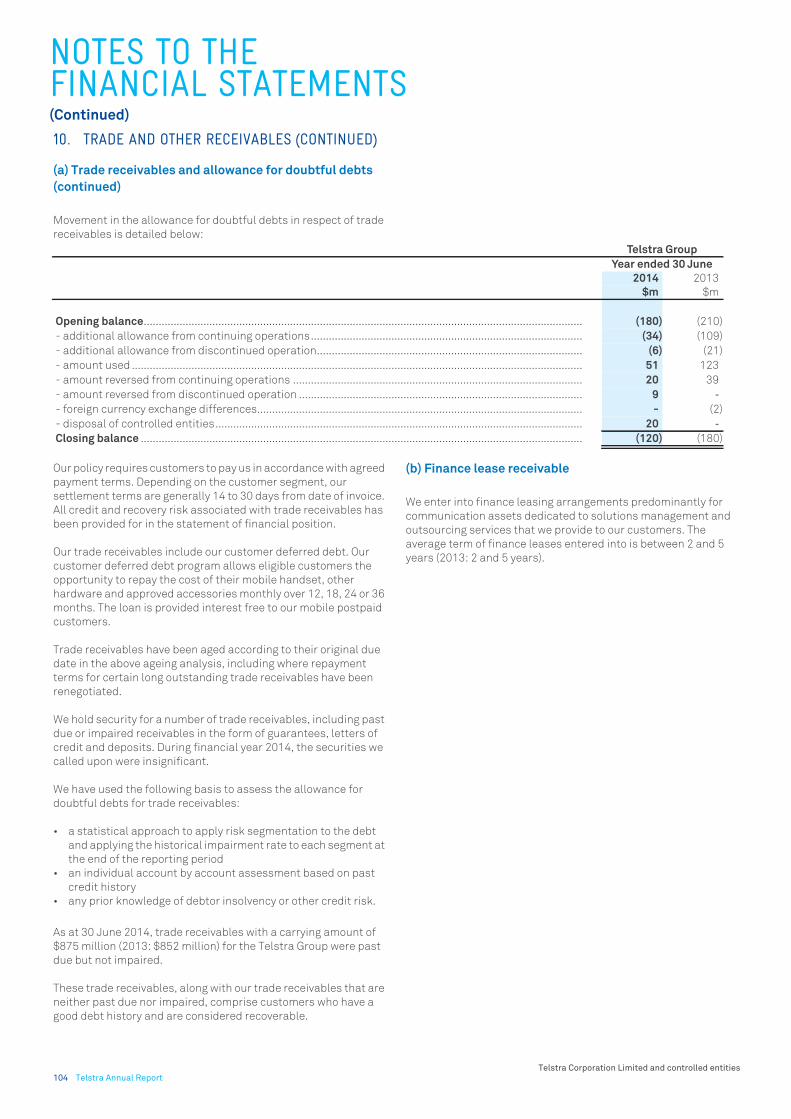
NOTES TO THE FINANCIAL STATEMENTS(Continued)
Telstra Corporation Limited and controlled entities104 Telstra Annual Report
(a) Trade receivables and allowance for doubtful debts
(continued)
Movement in the allowance for doubtful debts in respect of trade
receivables is detailed below:
Our policy requires customers to pay us in accordance with agreed
payment terms. Depending on the customer segment, our
settlement terms are generally 14 to 30 days from date of invoice.
All credit and recovery risk associated with trade receivables has
been provided for in the statement of financial position.
Our trade receivables include our customer deferred debt. Our
customer deferred debt program allows eligible customers the
opportunity to repay the cost of their mobile handset, other
hardware and approved accessories monthly over 12, 18, 24 or 36
months. The loan is provided interest free to our mobile postpaid
customers.
Trade receivables have been aged according to their original due
date in the above ageing analysis, including where repayment
terms for certain long outstanding trade receivables have been
renegotiated.
We hold security for a number of trade receivables, including past
due or impaired receivables in the form of guarantees, letters of
credit and deposits. During financial year 2014, the securities we
called upon were insignificant.
We have used the following basis to assess the allowance for
doubtful debts for trade receivables:
• a statistical approach to apply risk segmentation to the debt
and applying the historical impairment rate to each segment at
the end of the reporting period
• an individual account by account assessment based on past
credit history
• any prior knowledge of debtor insolvency or other credit risk.
As at 30 June 2014, trade receivables with a carrying amount of
$875 million (2013: $852 million) for the Telstra Group were past
due but not impaired.
These trade receivables, along with our trade receivables that are
neither past due nor impaired, comprise customers who have a
good debt history and are considered recoverable.
(b) Finance lease receivable
We enter into finance leasing arrangements predominantly for
communication assets dedicated to solutions management and
outsourcing services that we provide to our customers. The
average term of finance leases entered into is between 2 and 5
years (2013: 2 and 5 years).
10. TRADE AND OTHER RECEIVABLES (CONTINUED)
Telstra Group
Year ended 30 June
2014 2013
$m $m
Opening balance................................................................................................................................................... (180) (210)
- additional allowance from continuing operations........................................................................................... (34) (109)
- additional allowance from discontinued operation......................................................................................... (6) (21)
- amount used ....................................................................................................................................................... 51 123
- amount reversed from continuing operations ................................................................................................. 20 39
- amount reversed from discontinued operation ............................................................................................... 9 - - foreign currency exchange differences............................................................................................................. - (2)
- disposal of controlled entities........................................................................................................................... 20 - Closing balance .................................................................................................................................................... (120) (180)

NOTES TO THE FINANCIAL STATEMENTS(Continued)
Financial Report
Telstra Corporation Limited and controlled entitiesTelstra Annual Report 105
(b) Finance lease receivable (continued)
The interest rate inherent in the leases is fixed at the contract date
for the entire lease term. The average effective interest rate
contracted is 6.1 per cent (2013: 7.7 per cent) per annum.
10. TRADE AND OTHER RECEIVABLES (CONTINUED)
Telstra Group
As at 30 June
2014 2013
$m $m
Amounts receivable under finance leases
Within 1 year................................................................................................................................................................. 106 77
Within 1 to 5 years........................................................................................................................................................ 178 152
After 5 years ................................................................................................................................................................. 30 8
Total minimum lease receivables ............................................................................................................................... 314 237
Less unearned finance income................................................................................................................................... (37) (23)
Present value of minimum lease receivables............................................................................................................ 277 214
Included in the financial statements as
Current finance lease receivables.............................................................................................................................. 93 66
Non current finance lease receivables ...................................................................................................................... 184 148
277 214

NOTES TO THE FINANCIAL STATEMENTS(Continued)
Telstra Corporation Limited and controlled entities106 Telstra Annual Report
11. INVENTORIES
Telstra Group
As at 30 June
2014 2013
$m $m
Current
Finished goods recorded at cost .......................................................................................................................... 201 276
Finished goods recorded at net realisable value ................................................................................................ 78 64
Total finished goods............................................................................................................................................... 279 340
Raw materials and stores recorded at cost......................................................................................................... 11 11
Construction contracts (a) .................................................................................................................................... 72 80
362 431
Non current
Finished goods recorded at net realisable value ................................................................................................ 29 27
29 27
(a) Construction contract disclosures are shown as follows:
Contract costs incurred and recognised profits ................................................................................................. 589 592
Progress billings .................................................................................................................................................... (517) (512)
72 80

NOTES TO THE FINANCIAL STATEMENTS(Continued)
Financial Report
Telstra Corporation Limited and controlled entitiesTelstra Annual Report 107
Current Year
Sensis disposal group and discontinued operation
On 17 December 2013, the Directors approved the divestment of
70 per cent of our directories business and on 13 January 2014 a
sale agreement was signed.
The sale excludes voice services business and includes economic
benefits to us from services we will continue to provide to Sensis
Pty Ltd and its controlled entities (Sensis Group). Voice services,
including the 1234 and 12456 services, are a part of our core
telecommunication offering and will continue to be operated by
us.
The Sensis Group represents a separate major line of business
and is responsible for management of the domestic directories
and advertising business, including print and digital directories,
digital mapping and satellite navigation, digital display and
business information services. This includes management of
information brands such as Yellow Pages®, White Pages®,
Whereis®, Citysearch®, Mediasmart® and Quotify®.
In accordance with AASB 5: “Non current Assets Held for Sale and
Discontinued Operations”, the Sensis Group was disclosed as a
discontinued operation and the carrying value of assets and
liabilities of the Sensis Group, with the exception of the cash
balances which were excluded from the sale agreement, were
classified as held for sale as at 31 December 2013 and measured
at the lower of carrying amount and fair value less costs to sell
prior to their disposal.
The sale was completed on 28 February 2014 via disposal of our
100 per cent shareholding in the Sensis Group for a total cash
consideration of $454 million and acquisition of 30 per cent
shareholding in Project Sunshine I Pty Ltd, the new holding
company of the Sensis Group.
On completion we deconsolidated 100 per cent of the balance
sheet of the Sensis Group and recorded, at fair value of $157
million, our 30 per cent interest in Project Sunshine I Pty Ltd. Our
investment in the associate is based on a Level 3 fair value derived
from a discounted cash flow model incorporating the impacts of
debt in the business and certain preferential rights for the
subordination of distributions to equity holders in favour of the
purchaser. The discount rate applied was 11.5 per cent with a nil
terminal growth rate. The investment in the associate is equity
accounted from 1 March 2014, which means that we record our 30
per cent share of the associate’s net profit after tax as part of our
continuing operations.
The Sensis Group results are reported in the “All Other” category in
our segment disclosures in note 5 and include eight months (2013:
12 months) of consolidated results to the date of disposal and a
$24 million (2013: nil) share of net profit from our 30 per cent
investment in the new holding company of the Sensis Group.
Financial information related to the discontinued operation is set
out below. Financial year 2014 includes eight months of the Sensis
Group results, compared with 12 months for financial year 2013.
12. NON CURRENT ASSETS HELD FOR SALE AND DISCONTINUED OPERATION
Sensis Group
Year ended 30 June
2014 2013
$m $m
Revenue .................................................................................................................................................................. 552 1,204
Expenses ................................................................................................................................................................ 570 985
(Loss)/profit before income tax expense........................................................................................................... (18) 219
Income tax expense ............................................................................................................................................... 36 68
(Loss)/profit after income tax expense from discontinued operation .......................................................... (54) 151
(Loss) on disposal of discontinued operation (a) ................................................................................................ (150) -
Income tax expense ............................................................................................................................................... - -
(Loss) after tax on disposal of discontinued operation ................................................................................... (150) -
(Loss)/profit for the year from discontinued operation .................................................................................. (204) 151
Net cash provided by operating activities............................................................................................................ 339 607
Net cash provided by/(used in) investing activities (includes proceeds from sale) ......................................... 414 (107)
Net cash (used in)/provided by financing activities ............................................................................................ (2) 1
Net increase in cash and cash equivalents ....................................................................................................... 751 501
Earnings per share for (loss)/profit from discontinued operation (cents per share) cents cents
Basic ....................................................................................................................................................................... (1.6) 1.2
Diluted .................................................................................................................................................................... (1.6) 1.2

NOTES TO THE FINANCIAL STATEMENTS(Continued)
Telstra Corporation Limited and controlled entities108 Telstra Annual Report
Sensis disposal group and discontinued operation (continued)
The effect of the disposal of the Sensis Group is detailed below:
(a) Based on the sale price of $454 million, $157 million fair value
of the 30 per cent shareholding in Project Sunshine I Pty Ltd, and
final completion adjustments, on the re-measurement of assets
and liabilities of the disposal group the carrying value of the
Sensis Group goodwill was impaired by $150 million and
recognised in the loss for the year from the discontinued
operation.
Sequel Media disposal group
On 2 July 2014 we signed a binding term sheet to dispose of our
entire 55 per cent shareholding in Sequel Media Inc. and its
controlled entities (Sequel Media Group) for total consideration of
$3 million subject to completion adjustments.
In accordance with AASB 5, the carrying value of assets and
liabilities of the Sequel Media Group, with the exception of cash
balances which will be recovered via completion adjustments,
were classified as held for sale as at 30 June 2014 and measured
at the lower of the carrying amount and fair value less costs to sell.
Based on the agreed sale price, subject to completion
adjustments, the carrying value of the Sequel Media Group
goodwill was impaired by $12 million.
If the conditions precedent are satisfied and the disposal of the
Sequel Media Group occurs, the foreign currency translation
reserve calculated at the completion date will be reclassified to
our income statement increasing our loss on disposal. The foreign
currency translation reserve balance at 30 June 2014 was $3
million.
The Sequel Media Group is included in the TIG reportable segment
in our segment disclosures in note 5.
12. NON CURRENT ASSETS HELD FOR SALE AND DISCONTINUED OPERATION (CONTINUED)
Sensis Group
Year ended
30 June 2014
Note $m
Consideration on disposal
Cash consideration on disposal .......................... 454
Fair value of investment in the associate .......26 157
Total consideration on disposal ......................... 611
Assets/(liabilities) at disposal date
Assets classified as held for sale ........................ 1,002
Liabilities classified as held for sale................... (391)
Net assets classified as held for sale ................. 611
Loss on disposal after impairment (a) .............. -
Telstra Entity
Year ended
2014 2013
$m $m
Profit/(loss) attributable to equity holders of Telstra Entity
Profit for the year from continuing operations .................................................................................................... 4,479 3,588
(Loss)/profit for the year from discontinued operation ...................................................................................... (204) 151
4,275 3,739

NOTES TO THE FINANCIAL STATEMENTS(Continued)
Financial Report
Telstra Corporation Limited and controlled entitiesTelstra Annual Report 109
Sequel Media disposal group (continued)
Prior Year
TelstraClear disposal group
On 12 July 2012 we signed an agreement to dispose of our 100 per
cent shareholding in TelstraClear Limited and its controlled entity
(TelstraClear) and on 31 October 2012 disposed of it following
regulatory approval. Refer to note 20 for further details.
In accordance with AASB 5, the carrying value of assets and
liabilities of TelstraClear, with the exception of cash balances
which were excluded from the sale agreement, were classified as
held for sale up to the date of sale. On completion of the sale,
included in our disposal values was $11 million of cash, which was
recovered through additional proceeds on sale.
During financial year 2013, we impaired $28 million of our
TelstraClear net assets which increased due to the operating
results of TelstraClear but were not recoverable through the
disposal of TelstraClear.
TelstraClear is included in the “All Other” category in our segment
information disclosures in note 5.
12. NON CURRENT ASSETS HELD FOR SALE AND DISCONTINUED OPERATION (CONTINUED)
Sequel Media Group
As at 30 June
2014 2013
$m $m
Current assets
Trade and other receivables.................................................................................................................................. 13 -
Total current assets ............................................................................................................................................... 13 -
Non current assets
Property, plant and equipment............................................................................................................................. 1 -
Intangible assets ................................................................................................................................................... 6 -
Deferred tax assets................................................................................................................................................ 3 -
Total non current assets........................................................................................................................................ 10 -
Total assets ........................................................................................................................................................... 23 -
Current liabilities
Trade and other payables...................................................................................................................................... 14 -
Current tax payable ............................................................................................................................................... 2 -
Revenue received in advance................................................................................................................................ 1 -
Total current liabilities........................................................................................................................................... 17 -
Non current liabilities
Deferred tax liabilities ........................................................................................................................................... 2 -
Total non current liabilities ................................................................................................................................... 2 -
Total liabilities ...................................................................................................................................................... 19 -
Net assets .............................................................................................................................................................. 4 -
Sequel Media Group
As at 30 June
2014 2013
$m $m
Cumulative income or expense recognised in other comprehensive income relating to non current
assets classified as held for sale
Foreign currency translation reserve attributable to equity holders of Telstra Entity..................................... 3 -
Foreign currency translation reserve attributable to non-controlling interests .............................................. (1) -
2 -
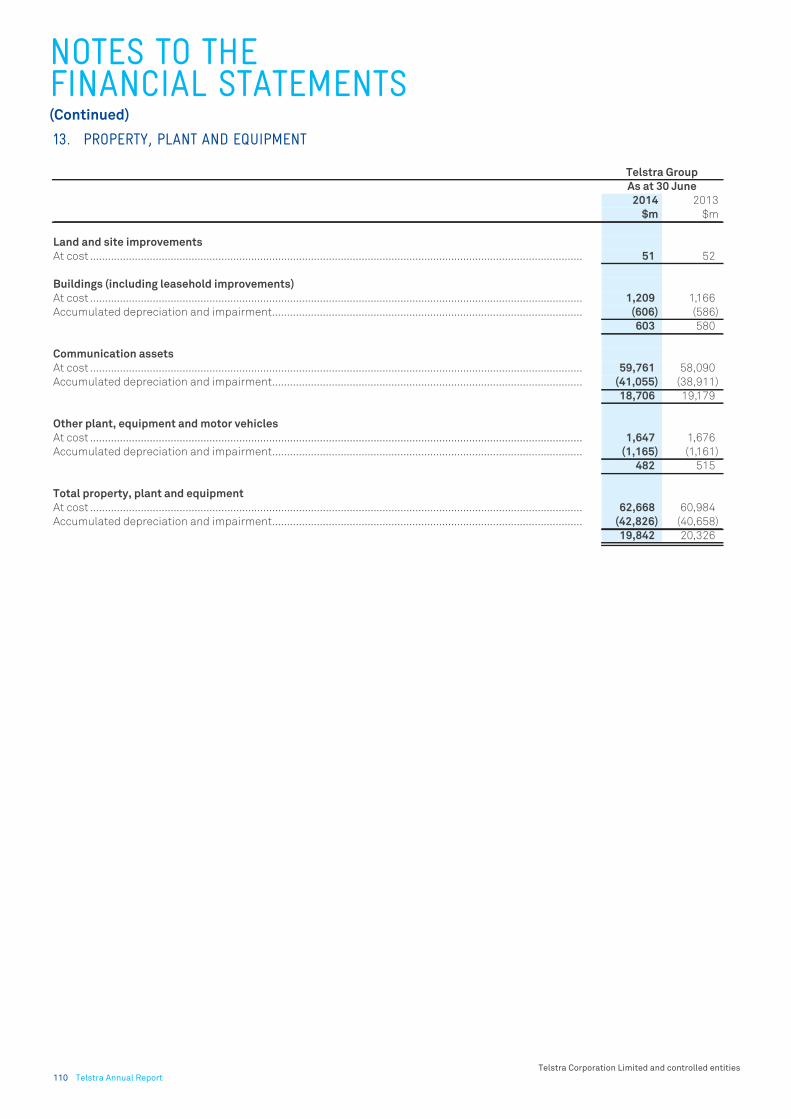
NOTES TO THE FINANCIAL STATEMENTS(Continued)
Telstra Corporation Limited and controlled entities110 Telstra Annual Report
13. PROPERTY, PLANT AND EQUIPMENT
Telstra Group
As at 30 June
2014 2013
$m $m
Land and site improvements
At cost ..................................................................................................................................................................... 51 52
Buildings (including leasehold improvements)
At cost ..................................................................................................................................................................... 1,209 1,166
Accumulated depreciation and impairment........................................................................................................ (606) (586)
603 580
Communication assets
At cost ..................................................................................................................................................................... 59,761 58,090
Accumulated depreciation and impairment........................................................................................................ (41,055) (38,911)
18,706 19,179
Other plant, equipment and motor vehicles
At cost ..................................................................................................................................................................... 1,647 1,676
Accumulated depreciation and impairment........................................................................................................ (1,165) (1,161)
482 515
Total property, plant and equipment
At cost ..................................................................................................................................................................... 62,668 60,984
Accumulated depreciation and impairment........................................................................................................ (42,826) (40,658)
19,842 20,326

NOTES TO THE FINANCIAL STATEMENTS(Continued)
Financial Report
Telstra Corporation Limited and controlled entitiesTelstra Annual Report 111
(a) Includes leasehold improvements and the $53 million net book
value of buildings under finance lease.
(b) Includes certain network land and buildings which are
essential to the operation of our communication assets.
(c) Includes $39 million (2013: $60 million) of capitalised
borrowing costs directly attributable to qualifying assets.
(d) $40 million is the net result of refinancing a property under a
finance lease owned by Telstra Europe Limited, during financial
year 2013. Refer to note 22 for further details.
Work in progress
As at 30 June 2014, the Telstra Group has property, plant and
equipment under construction amounting to $564 million (2013:
$637 million). As the assets are not installed and ready for use,
there is no depreciation being charged on these amounts.
13. PROPERTY, PLANT AND EQUIPMENT (CONTINUED)
Telstra Group
Total property,
Land and Comm- Other plant, plant,
site unication equipment and
improve- Buildings assets and motor equipment
ments (a) (b) vehicles (c)
$m $m $m $m $m
Written down value at 1 July 2012 .................................. 38 541 19,441 484 20,504
- additions ......................................................................... 14 119 2,625 140 2,898
- disposals ........................................................................ - (52) (24) (3) (79)
- impairment losses from continuing operations .......... - - (11) (4) (15)
- depreciation expenses from continuing operations ... - (74) (2,892) (100) (3,066)
- depreciation expenses from discontinued operation . - - - (7) (7)
- net foreign currency exchange differences .................. - 6 40 5 51
- other (d) ........................................................................... - 40 - - 40
Written down value at 30 June 2013 .............................. 52 580 19,179 515 20,326
- additions ......................................................................... - 106 2,584 159 2,849
- additions due to acquisitions of controlled entities.... - 1 1 5 7
- disposals ........................................................................ (1) (7) (12) (20) (40)
- disposals through the sale of controlled entities ....... - (9) (334) (47) (390)
- impairment losses from continuing operations .......... - - (14) (1) (15)
- depreciation expenses from continuing operations.... - (73) (2,696) (127) (2,896)
- depreciation expenses from discontinued operation . - - - (3) (3)
- transfer to non current asset held for sale .................. - - - (1) (1)
- net foreign currency exchange differences .................. - 5 (2) 2 5
Written down value at 30 June 2014 .............................. 51 603 18,706 482 19,842

NOTES TO THE FINANCIAL STATEMENTS(Continued)
Telstra Corporation Limited and controlled entities112 Telstra Annual Report
14. INTANGIBLE ASSETS
Telstra Group
As at 30 June
2014 2013
$m $m
Goodwill
At cost ..................................................................................................................................................................... 489 1,650
Accumulated impairment ..................................................................................................................................... (94) (268)
395 1,382
Internally generated intangible assets
Software assets developed for internal use........................................................................................................ 8,733 8,882
Accumulated amortisation and impairment ....................................................................................................... (4,468) (4,142)
4,265 4,740
Acquired intangible assets
Mastheads.............................................................................................................................................................. 447 447
Accumulated amortisation and impairment ....................................................................................................... (447) (380)
- 67
Patents and trademarks ....................................................................................................................................... 12 30
Accumulated amortisation and impairment ....................................................................................................... - (12)
12 18
Licences.................................................................................................................................................................. 1,168 1,426
Accumulated amortisation and impairment ....................................................................................................... (352) (373)
816 1,053
Customer bases ..................................................................................................................................................... 129 107
Accumulated amortisation and impairment ....................................................................................................... (87) (96)
42 11
Brand names .......................................................................................................................................................... 14 179
Accumulated amortisation and impairment ....................................................................................................... (5) (103)
9 76
Total acquired intangible assets ........................................................................................................................ 879 1,225
Deferred expenditure
Deferred expenditure............................................................................................................................................. 1,667 1,450
Accumulated amortisation and impairment ....................................................................................................... (824) (595)
843 855
Total intangible assets
At cost ..................................................................................................................................................................... 12,659 14,171
Accumulated amortisation and impairment ....................................................................................................... (6,277) (5,969)
6,382 8,202
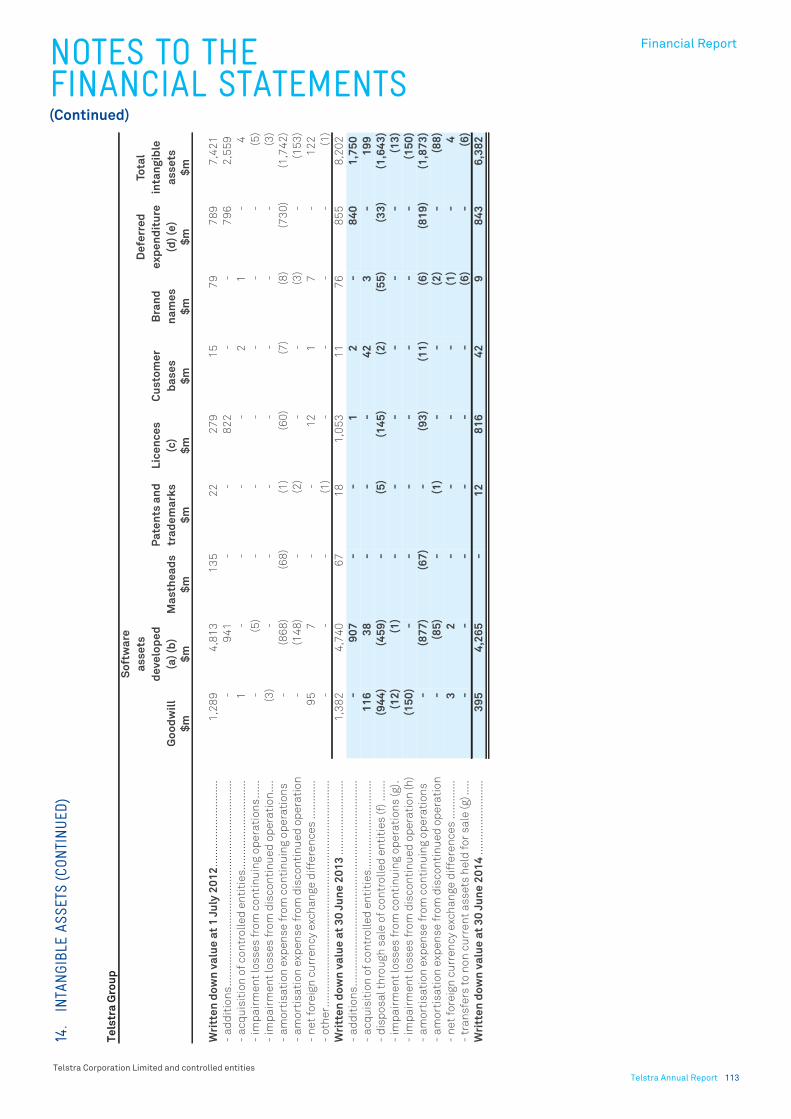
NOTES TO THE FINANCIAL STATEMENTS(Continued)
Financial Report
Telstra Corporation Limited and controlled entitiesTelstra Annual Report 113
14.
INTA
NGIB
LE A
SSET
S (C
ONTI
NUED
)
Te
lstr
a G
rou
p
Go
od
wil
l
So
ftw
are
as
se
ts
de
ve
lop
ed
(a)
(b)
Ma
sth
ea
ds
Pa
ten
ts a
nd
tra
de
ma
rks
Lic
en
ce
s
(c)
Cu
sto
me
r
ba
se
s
Bra
nd
na
me
s
De
ferr
ed
ex
pe
nd
itu
re
(d)
(e)
Tota
l
inta
ng
ible
as
se
ts
$m
$m
$m
$m
$m
$m
$m
$m
$m
Wri
tte
n d
ow
n v
alu
e a
t 1
Ju
ly 2
01
2..
....
....
....
....
....
....
...
1,2
89
4,8
13
13
52
22
79
15
79
78
97
,42
1
- a
dd
itio
ns
....
....
....
....
....
....
....
....
....
....
....
....
....
....
....
....
....
.-
94
1-
-8
22
--
79
62
,55
9
- a
cq
uis
itio
n o
f c
on
tro
lle
d e
nti
tie
s..
....
....
....
....
....
....
....
1-
--
-2
1-
4
- im
pa
irm
en
t lo
ss
es
fro
m c
on
tin
uin
g o
pe
rati
on
s..
....
-(5
)-
--
--
-(5
)
- im
pa
irm
en
t lo
ss
es
fro
m d
isc
on
tin
ue
d o
pe
rati
on
....
(3)
--
--
--
-(3
)
- a
mo
rtis
ati
on
exp
en
se
fro
m c
on
tin
uin
g o
pe
rati
on
s-
(86
8)
(68
)(1
)(6
0)
(7)
(8)
(73
0)
(1,7
42
)
- a
mo
rtis
ati
on
exp
en
se
fro
m d
isc
on
tin
ue
d o
pe
rati
on
-(1
48
)-
(2)
--
(3)
-(1
53
)
- n
et
fore
ign
cu
rre
nc
y e
xch
an
ge
dif
fere
nc
es
....
....
....
.9
57
--
12
17
-1
22
- o
the
r...
....
....
....
....
....
....
....
....
....
....
....
....
....
....
....
....
....
....
.-
--
(1)
--
--
(1)
Wri
tte
n d
ow
n v
alu
e a
t 3
0 J
un
e 2
01
3..
....
....
....
....
....
...
1,3
82
4,7
40
67
18
1,0
53
11
76
85
58
,20
2
- a
dd
itio
ns
....
....
....
....
....
....
....
....
....
....
....
....
....
....
....
....
....
.-
90
7-
-1
2-
84
01
,75
0
- a
cq
uis
itio
n o
f c
on
tro
lle
d e
nti
tie
s..
....
....
....
....
....
....
....
11
63
8-
--
42
3-
19
9
- d
isp
os
al
thro
ug
h s
ale
of
co
ntr
oll
ed
en
titi
es
(f)
....
...
(94
4)
(45
9)
-(5
)(1
45
)(2
)(5
5)
(33
)(1
,64
3)
- im
pa
irm
en
t lo
ss
es
fro
m c
on
tin
uin
g o
pe
rati
on
s (
g).
(12
)(1
)-
--
--
-(1
3)
- im
pa
irm
en
t lo
ss
es
fro
m d
isc
on
tin
ue
d o
pe
rati
on
(h
)(1
50
)-
--
--
--
(15
0)
- a
mo
rtis
ati
on
exp
en
se
fro
m c
on
tin
uin
g o
pe
rati
on
s-
(87
7)
(67
)-
(93
)(1
1)
(6)
(81
9)
(1,8
73
)
- a
mo
rtis
ati
on
exp
en
se
fro
m d
isc
on
tin
ue
d o
pe
rati
on
-(8
5)
-(1
)-
-(2
)-
(88
)
- n
et
fore
ign
cu
rre
nc
y e
xch
an
ge
dif
fere
nc
es
....
....
....
.3
2-
--
-(1
)-
4
- tr
an
sfe
rs t
o n
on
cu
rre
nt
as
se
ts h
eld
fo
r s
ale
(g
)...
..-
--
--
-(6
)-
(6)
Wri
tte
n d
ow
n v
alu
e a
t 3
0 J
un
e 2
01
4..
....
....
....
....
....
...
39
54
,26
5-
12
81
64
29
84
36
,38
2

NOTES TO THE FINANCIAL STATEMENTS(Continued)
Telstra Corporation Limited and controlled entities114 Telstra Annual Report
(a) As at 30 June 2014, we had software assets under development
amounting to $214 million (2013: $345 million). As these assets
were not installed and ready for use, there is no amortisation
being charged on the amounts.
(b) Includes $19 million (2013: $36 million) of capitalised
borrowing costs directly attributable to software assets.
(c) During financial year 2013, we renewed our existing 800Mhz
and 1800Mhz spectrum licences for $779 million.
(d) During financial year 2005, we entered into an arrangement
with our joint venture, Reach Ltd (Reach), and our co-shareholder
PCCW, whereby Reach's international cable capacity was
allocated between us and PCCW under an indefeasible right of use
(IRU) agreement, including committed capital expenditure for the
period until 2018.
The IRU is amortised over the contract periods for the capacity on
the various international cable systems, which range from 5 to 22
years. The IRU is deemed to be an extension of our investment in
Reach. The IRU has a carrying value of nil in the consolidated
financial statements due to the recognition of equity accounted
losses in Reach.
(e) The majority of the deferred expenditure relates to the deferral
of direct incremental costs of establishing a customer contract,
which are amortised to goods and services purchased in the
income statement. In addition, the deferred expenditure includes
basic access installation and connection fees for in place and new
services.
(f) During financial year 2014, we disposed of our interests in the
Sensis Group and the CSL Group. Refer to notes 12 and 20 for
further details.
(g) As at 30 June 2014, Sequel Media Group’s assets and liabilities
were classified as held for sale. Impairment loss of $12 million was
recognised against goodwill for the Sequel Media cash generating
units (CGU). Refer to notes 12 and 21 for further details.
(h) During financial year 2014, and following its classification as
assets and liabilities held for sale at 31 December 2013 and
subsequent disposal on 28 February 2014, we recognised an
impairment charge of $150 million against goodwill for the Sensis
Group and Location Navigation CGUs. Refer to notes 12 and 21 for
further details.
14. INTANGIBLE ASSETS (CONTINUED)

NOTES TO THE FINANCIAL STATEMENTS(Continued)
Financial Report
Telstra Corporation Limited and controlled entitiesTelstra Annual Report 115
(a) Trade creditors and other creditors are non-interest bearing
liabilities. We generally process trade creditor payments once
they have reached 30 days for electronic funds transfer payments,
or 30 days from the end of the month of invoice for other
payments.
15. TRADE AND OTHER PAYABLES
Telstra Group
As at 30 June
2014 2013
$m $m
Current
Trade creditors (a) .................................................................................................................................................. 1,164 1,297
Accrued expenses.................................................................................................................................................. 1,519 1,690
Accrued capital expenditure................................................................................................................................. 257 400
Accrued interest..................................................................................................................................................... 386 365
Deferred consideration for capital expenditure .................................................................................................. 10 30
Other creditors (a) .................................................................................................................................................. 498 459
3,834 4,241
Non current
Deferred consideration for capital expenditure .................................................................................................. - 104
Other creditors ....................................................................................................................................................... 66 59
66 163

NOTES TO THE FINANCIAL STATEMENTS(Continued)
Telstra Corporation Limited and controlled entities116 Telstra Annual Report
(a) Aggregate employee benefits
(*) Accrued labour and related on-costs are included within our
current trade and other payables (note 15).
Provision for employee benefits consist of amounts for annual
leave and long service leave accrued by employees. For long
service leave these amounts cover all unconditional entitlements
where employees have completed the required period of service
and also those where employees are entitled to pro-rata
payments in certain circumstances.
The amounts are presented as current, since we do not have an
unconditional right to defer settlement for any of these
obligations. However, based on past experience, we do not expect
all employees to take the full amount of accrued leave or require
payment within the next 12 months. The following amounts have
been determined in accordance with an actuarial assessment and
reflect leave that is not expected to be taken or paid within the
next 12 months:
Employee benefits are measured at their present value. Refer to
note 2.14 for further details. The following assumptions were
adopted in measuring this amount.
16. PROVISIONS
Telstra Group
As at 30 June
2014 2013
$m $m
Current
Employee benefits (a) ............................................................................................................................................ 838 853
Workers' compensation (b) ................................................................................................................................... 22 23
Redundancy (b) ...................................................................................................................................................... 40 6
Other (b) .................................................................................................................................................................. 32 36
932 918
Non current
Employee benefits (a) ............................................................................................................................................ 135 131
Workers' compensation (b) ................................................................................................................................... 121 126
Other (b) .................................................................................................................................................................. 5 19
261 276
Telstra Group
As at 30 June
2014 2013
$m $m
Current provision for employee benefits.............................................................................................................. 838 853
Non current provision for employee benefits ...................................................................................................... 135 131
Current provision for redundancy......................................................................................................................... 40 6
Accrued labour and on-costs (*) .......................................................................................................................... 440 555
1,453 1,545
Telstra Group
As at 30 June
2014 2013
$m $m
Leave obligations expected to be settled after 12 months ................................................................................ 521 507
Telstra Group
As at 30 June
2014 2013
Weighted average projected increase in salaries, wages and associated on-costs........................................ 4.8% 4.7%
Discount rates........................................................................................................................................................ 3.7% 4.2%
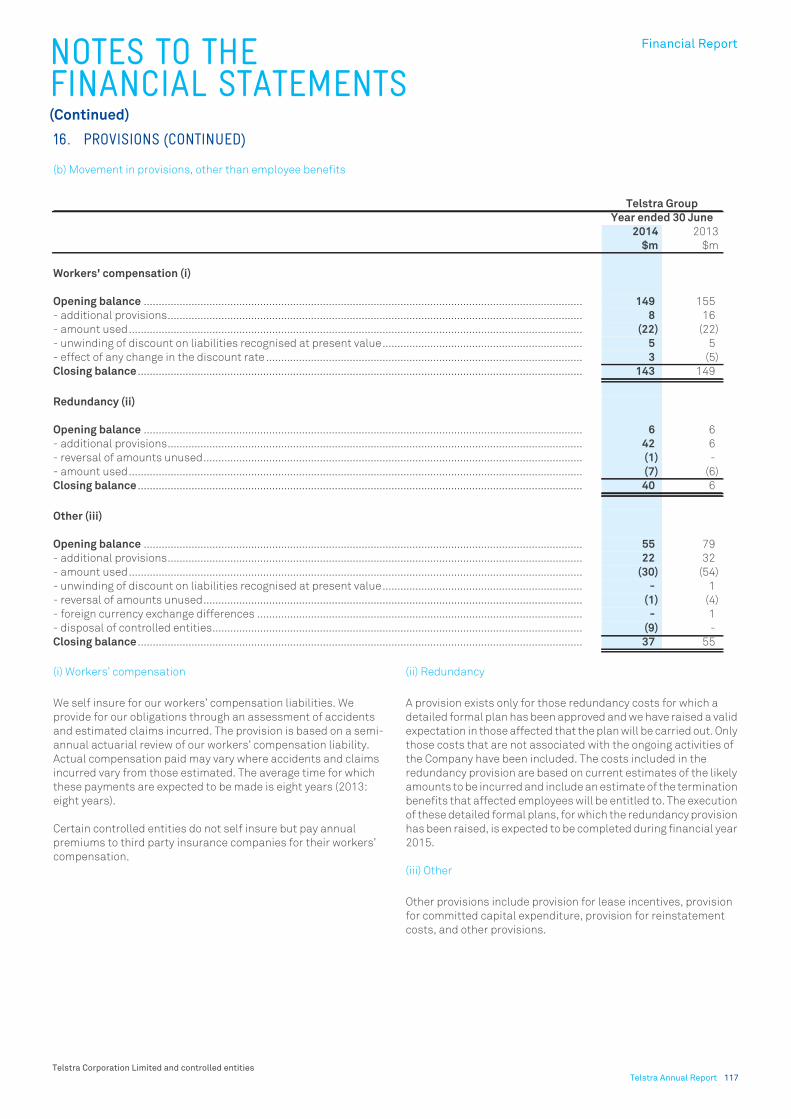
NOTES TO THE FINANCIAL STATEMENTS(Continued)
Financial Report
Telstra Corporation Limited and controlled entitiesTelstra Annual Report 117
(b) Movement in provisions, other than employee benefits
(i) Workers’ compensation
We self insure for our workers’ compensation liabilities. We
provide for our obligations through an assessment of accidents
and estimated claims incurred. The provision is based on a semi-
annual actuarial review of our workers’ compensation liability.
Actual compensation paid may vary where accidents and claims
incurred vary from those estimated. The average time for which
these payments are expected to be made is eight years (2013:
eight years).
Certain controlled entities do not self insure but pay annual
premiums to third party insurance companies for their workers’
compensation.
(ii) Redundancy
A provision exists only for those redundancy costs for which a
detailed formal plan has been approved and we have raised a valid
expectation in those affected that the plan will be carried out. Only
those costs that are not associated with the ongoing activities of
the Company have been included. The costs included in the
redundancy provision are based on current estimates of the likely
amounts to be incurred and include an estimate of the termination
benefits that affected employees will be entitled to. The execution
of these detailed formal plans, for which the redundancy provision
has been raised, is expected to be completed during financial year
2015.
(iii) Other
Other provisions include provision for lease incentives, provision
for committed capital expenditure, provision for reinstatement
costs, and other provisions.
16. PROVISIONS (CONTINUED)
Telstra Group
Year ended 30 June
2014 2013
$m $m
Workers' compensation (i)
Opening balance ................................................................................................................................................... 149 155
- additional provisions........................................................................................................................................... 8 16
- amount used........................................................................................................................................................ (22) (22)
- unwinding of discount on liabilities recognised at present value................................................................... 5 5
- effect of any change in the discount rate .......................................................................................................... 3 (5)
Closing balance ..................................................................................................................................................... 143 149
Redundancy (ii)
Opening balance ................................................................................................................................................... 6 6
- additional provisions........................................................................................................................................... 42 6
- reversal of amounts unused............................................................................................................................... (1) -
- amount used........................................................................................................................................................ (7) (6)
Closing balance ..................................................................................................................................................... 40 6
Other (iii)
Opening balance ................................................................................................................................................... 55 79
- additional provisions........................................................................................................................................... 22 32
- amount used........................................................................................................................................................ (30) (54)
- unwinding of discount on liabilities recognised at present value................................................................... - 1
- reversal of amounts unused............................................................................................................................... (1) (4)
- foreign currency exchange differences ............................................................................................................. - 1
- disposal of controlled entities............................................................................................................................ (9) -
Closing balance ..................................................................................................................................................... 37 55

NOTES TO THE FINANCIAL STATEMENTS(Continued)
Telstra Corporation Limited and controlled entities118 Telstra Annual Report
This note provides information on our capital structure and our
underlying economic positions as represented by the carrying
values, fair values and contractual face values of our financial
instruments.
Section (a) includes details on our gearing.
Section (b) sets out the carrying values, fair values and contractual
face values of our financial instruments. The amounts provided in
this section are prior to netting offsetting risk positions.
Section (c) provides information on our net debt position based on
contractual face values and after netting offsetting risks. We
consider this view of net debt based on our net contractual
obligations to be useful additional information to investors on our
underlying economic position, as it portrays our residual risks
after hedging and excludes the effect of fair value measurements.
This is relevant on the basis that we generally hold our borrowings
and associated derivatives to maturity and hence revaluation
gains and losses will generally not be realised.
Section (d) includes a reconciliation of movements in gross and
net debt positions.
Section (e) includes details on our interest expense and interest
rate yields.
Section (f) provides further details on our derivative financial
instruments.
Section (g) provides information on the method for estimating fair
value of our financial instruments.
Section (h) shows financial instruments subject to offsetting or
netting arrangements.
Details regarding interest rate, foreign exchange and liquidity risk
are disclosed in note 18.
(a) Capital management
Our objectives when managing capital are to safeguard our ability
to continue as a going concern, to continue to provide returns for
shareholders and benefits for other stakeholders and to maintain
an optimal capital structure to reduce the cost of capital.
In order to maintain or adjust the capital structure, we may adjust
the amount of dividends paid to shareholders, return capital to
shareholders or issue new shares.
During financial year 2014, we paid dividends of $3,545 million
(2013: $3,480 million). Refer to note 4 for further details.
Agreement with lenders
During the current and prior years there were no defaults or
breaches on any of our agreements with our lenders.
Gearing and net debt
We monitor capital on the basis of the gearing ratio. This ratio is
calculated as net debt divided by total capital. Net debt is
calculated as total interest bearing financial liabilities and
derivative financial instruments, less cash and cash equivalents.
Total capital is calculated as equity, as shown in the statement of
financial position, plus net debt.
Our target zone for the net debt gearing ratio is currently 50 to 70
per cent (2013: 50 to 70 per cent). The gearing ratios and carrying
value of our net debt are shown in Table A. The impact of the higher
liquidity is reflected in the reduction in our net debt gearing ratio
from 50.5 per cent at 30 June 2013 to 43.0 per cent at 30 June
2014.
17. CAPITAL MANAGEMENT AND FINANCIAL INSTRUMENTS
Table A Telstra Group
As at 30 June
2014 2013
Note $m $m
Current
Short term debt
Promissory notes ............................................. 365 125
365 125
Long term debt-current portion
Offshore borrowings (i) .................................... 1,334 55
Telstra bonds and domestic loans (ii) ............ 500 505
Finance leases ............................................. 22 78 66
1,912 626
2,277 751
Non current
Long term debt
Offshore borrowings (i) .................................... 11,023 11,836
Telstra bonds and domestic
borrowings (ii)................................................... 2,293 2,263
Finance leases ............................................. 22 231 214
13,547 14,313
15,824 15,064
Short term debt................................................ 365 125
Long term debt (including
current portion)................................................ 15,459 14,939
Total debt......................................................... 15,824 15,064
Net derivative financial liability...............17(f) 224 564
Gross debt........................................................ 16,048 15,628
Cash and cash equivalents......................... 20 (5,527) (2,479)
Net debt ........................................................... 10,521 13,149
Total equity...................................................... 13,960 12,875
Total capital..................................................... 24,481 26,024
% %
Gearing ratio.................................................... 43.0 50.5

NOTES TO THE FINANCIAL STATEMENTS(Continued)
Financial Report
Telstra Corporation Limited and controlled entitiesTelstra Annual Report 119
(a) Capital management (continued)
Gearing and net debt (continued)
Net debt included in Table A is based on the carrying values of our
financial instruments, which are provided in Table C in the
following section (b). For interest bearing financial instruments we
adopt a ‘clean price’ whereby the reported balance of our
derivative instruments and borrowings excludes accrued interest.
Accrued interest is recorded in current “trade and other
receivables” and current “trade and other payables” in the
statement of financial position.
Our borrowings are unsecured, except for finance leases, which
are secured, as the rights to the leased asset transfer to the lessor
in the event of a default by us. No assets are pledged as security
for our borrowings. All our borrowings are interest bearing, except
for some loans from wholly owned controlled entities. Details of
interest rates and maturity profiles are included in note 18.
We are not subject to any externally imposed capital
requirements.
(i) Offshore borrowings
Offshore borrowings comprise debt raised overseas. The carrying
amounts of offshore borrowings are denominated in the
currencies in Table B. Our policy is to swap foreign currency
borrowings into Australian dollars, except where they are held to
hedge translation foreign exchange risk associated with our
offshore investments. Refer to Table D for the net contractual face
values of our borrowings on a post hedge basis.
Refer to Table E for details on debt issuance and maturities.
(ii) Telstra bonds and domestic borrowings
Telstra bonds currently on issue total $233 million, mature up
until the year 2020, and are issued to wholesale investors.
Domestic borrowings as at 30 June 2014 total $2,560 million, with
various maturity dates up until the year 2020. Refer to Table E for
details on debt issuance and maturities.
17. CAPITAL MANAGEMENT AND FINANCIAL INSTRUMENTS (CONTINUED)
Table B Telstra Group
As at 30 June
2014 2013
$m $m
Australian dollar ...................................... 190 190
Euro........................................................... 9,533 9,054
United States dollar................................. 1,210 1,225
British pound sterling.............................. 361 329
Japanese yen............................................ 494 566
New Zealand dollar.................................. 236 214
Swiss franc ............................................... 282 262
Hong Kong dollar...................................... 47 47
Indian rupee ............................................. 4 4
12,357 11,891

NOTES TO THE FINANCIAL STATEMENTS(Continued)
Telstra Corporation Limited and controlled entities120 Telstra Annual Report
(b) Financial instruments
The carrying amounts, fair values and face values of each category
of our financial instruments are shown in Table C. The amounts
disclosed are prior to netting offsetting risk positions of financial
instruments in a hedge relationship.
We also have potential financial liabilities, not included in the
tables below, which may arise from certain contingencies
disclosed in note 23 and note 30.
(i) For financial assets and financial liabilities with a short term to
maturity, the carrying amount is considered to approximate fair
value.
(ii) These borrowings are in fair value hedges. The carrying amount
is adjusted for fair value movements attributable to the hedged
risk.
(iii) Investments in unlisted securities are measured at historical
cost. Fair value for these securities cannot be reliably measured.
Refer to section (g) for further details.
17. CAPITAL MANAGEMENT AND FINANCIAL INSTRUMENTS (CONTINUED)
Table C Telstra Group
As at 30 June 2014 As at 30 June 2013
Carrying
amountFair value Face value
Carrying
amountFair value Face value
Receivable/(Payable) Receivable/(Payable)
$m $m $m $m $m $m
Financial instruments included in net debt
Cash at bank and on hand ................................................... 305 305 305 295 295 295
Available-for-sale - at fair value
Bank deposits, bills of exchange and promissory notes (i) 5,222 5,222 5,252 2,184 2,184 2,195
In designated hedge relationships - at fair value
Net derivative liability - hedging instrument...................... 1 1 (53) (382) (382) (327)
Promissory notes - hedged item (ii)..................................... (265) (265) (265) (125) (126) (126)
Offshore borrowings - hedged item (ii)................................ (4,211) (4,211) (3,774) (3,950) (3,950) (3,732)
Telstra bonds and domestic borrowings - hedged item (ii) (964) (964) (950) (735) (735) (750)
In designated hedge relationships - at amortised
cost
Offshore borrowings - hedged item..................................... (6,072) (6,634) (6,105) (6,504) (6,948) (6,547)
Telstra bonds and domestic borrowings - hedged item .... (274) (275) (275) (275) (271) (275)
De-designated or not in designated hedge
relationship - at fair value
Net derivative liability........................................................... (225) (225) (254) (182) (182) (261)
De-designated from hedge relationship - at
amortised cost
Offshore borrowings ............................................................. (1,880) (1,982) (1,904) (1,243) (1,365) (1,289)
Other financial liabilities - at amortised cost
Finance lease payable.......................................................... (309) (309) (444) (280) (280) (392)
Promissory notes .................................................................. (100) (100) (100) - - -
Offshore borrowings ............................................................. (194) (214) (194) (194) (202) (194)
Telstra bonds and domestic borrowings............................. (1,555) (1,713) (1,568) (1,758) (1,906) (1,772)
Telstra Group net debt ........................................................ (10,521) (11,364) (10,329) (13,149) (13,868) (13,175)
Other financial instruments
Interest bearing financial assets
Finance lease receivable...................................................... 277 277 314 214 214 237
Amounts owed by joint ventures and associated entities. 451 451 451 451 451 451
Other receivables (i) .............................................................. 3 3 3 7 7 7
Net interest bearing financial liabilities........................... (9,790) (10,633) (9,561) (12,477) (13,196) (12,480)
Equity investments classified as available-for-sale
Unlisted securities (iii).......................................................... 127 n/a 127 38 38 38
Loans and receivables at amortised cost
Trade/other receivables and accrued revenue (i) ............... 4,414 4,414 4,534 4,828 4,828 5,008
Amounts owed by joint ventures and associated entities. - - 6 - - 6
Financial liabilities at amortised cost
Trade/other creditors and accrued expenses (i)................. (3,890) (3,890) (3,890) (4,270) (4,270) (4,270)
Deferred consideration for capital expenditure ................. (10) (10) (10) (134) (134) (187)
Net financial liabilities........................................................ (9,149) (10,119) (8,794) (12,015) (12,734) (11,885)
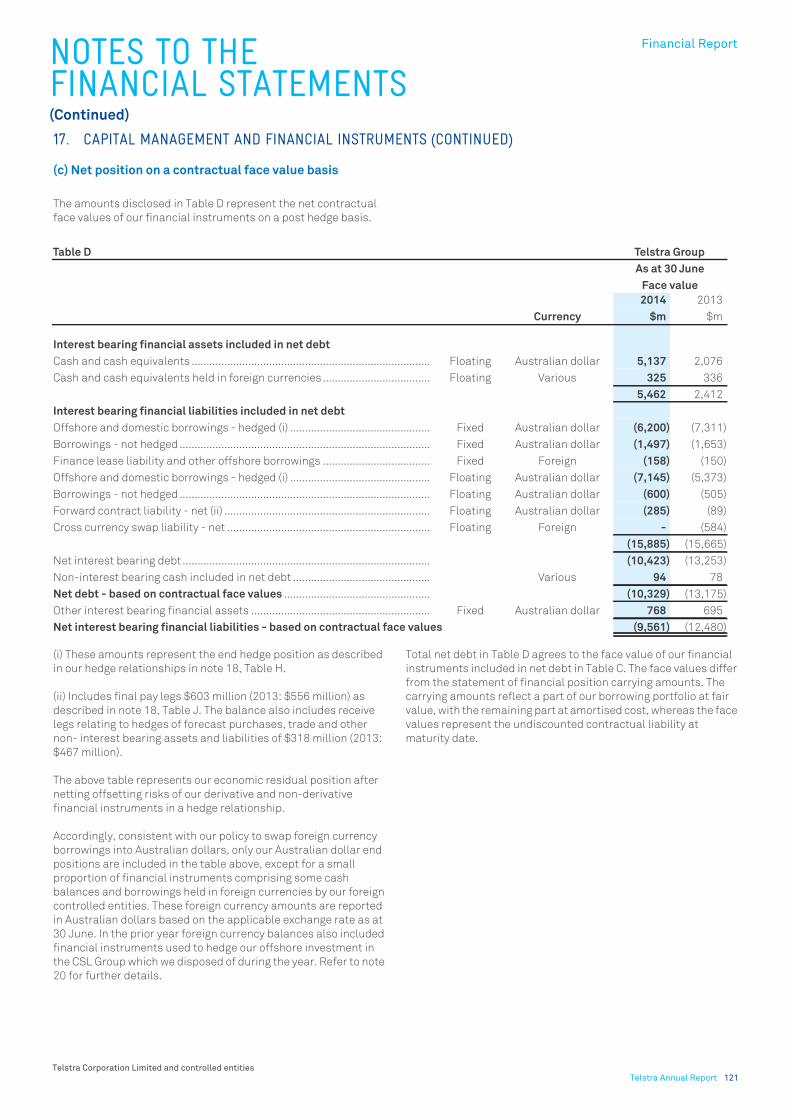
NOTES TO THE FINANCIAL STATEMENTS(Continued)
Financial Report
Telstra Corporation Limited and controlled entitiesTelstra Annual Report 121
(c) Net position on a contractual face value basis
The amounts disclosed in Table D represent the net contractual
face values of our financial instruments on a post hedge basis.
(i) These amounts represent the end hedge position as described
in our hedge relationships in note 18, Table H.
(ii) Includes final pay legs $603 million (2013: $556 million) as
described in note 18, Table J. The balance also includes receive
legs relating to hedges of forecast purchases, trade and other
non- interest bearing assets and liabilities of $318 million (2013:
$467 million).
The above table represents our economic residual position after
netting offsetting risks of our derivative and non-derivative
financial instruments in a hedge relationship.
Accordingly, consistent with our policy to swap foreign currency
borrowings into Australian dollars, only our Australian dollar end
positions are included in the table above, except for a small
proportion of financial instruments comprising some cash
balances and borrowings held in foreign currencies by our foreign
controlled entities. These foreign currency amounts are reported
in Australian dollars based on the applicable exchange rate as at
30 June. In the prior year foreign currency balances also included
financial instruments used to hedge our offshore investment in
the CSL Group which we disposed of during the year. Refer to note
20 for further details.
Total net debt in Table D agrees to the face value of our financial
instruments included in net debt in Table C. The face values differ
from the statement of financial position carrying amounts. The
carrying amounts reflect a part of our borrowing portfolio at fair
value, with the remaining part at amortised cost, whereas the face
values represent the undiscounted contractual liability at
maturity date.
17. CAPITAL MANAGEMENT AND FINANCIAL INSTRUMENTS (CONTINUED)
Table D Telstra Group
As at 30 June
Face value
2014 2013
Currency $m $m
Interest bearing financial assets included in net debt
Cash and cash equivalents ................................................................................ Floating Australian dollar 5,137 2,076
Cash and cash equivalents held in foreign currencies .................................... Floating Various 325 336
5,462 2,412
Interest bearing financial liabilities included in net debt
Offshore and domestic borrowings - hedged (i) ............................................... Fixed Australian dollar (6,200) (7,311)
Borrowings - not hedged .................................................................................... Fixed Australian dollar (1,497) (1,653)
Finance lease liability and other offshore borrowings .................................... Fixed Foreign (158) (150)
Offshore and domestic borrowings - hedged (i) ............................................... Floating Australian dollar (7,145) (5,373)
Borrowings - not hedged .................................................................................... Floating Australian dollar (600) (505)
Forward contract liability - net (ii) ..................................................................... Floating Australian dollar (285) (89)
Cross currency swap liability - net .................................................................... Floating Foreign - (584)
(15,885) (15,665)
Net interest bearing debt ................................................................................... (10,423) (13,253)
Non-interest bearing cash included in net debt .............................................. Various 94 78
Net debt - based on contractual face values ................................................. (10,329) (13,175)
Other interest bearing financial assets ............................................................ Fixed Australian dollar 768 695
Net interest bearing financial liabilities - based on contractual face values (9,561) (12,480)

NOTES TO THE FINANCIAL STATEMENTS(Continued)
Telstra Corporation Limited and controlled entities122 Telstra Annual Report
(d) Movements in net debt
The decrease in the carrying amount (including net cash
movements) of our net debt during the year of $2,628 million for
the Telstra Group (2013: decrease of $128 million) is represented
by the movements shown in Table E below.
(i) The net revaluation loss of $200 million (2013: loss of $188
million) includes:
• loss of $182 million (2013: $185 million) affecting other finance
costs, comprising a loss of $128 million (2013: $95 million) from
fair value hedges; a loss of $64 million (2013: $89 million) from
transactions either not designated or de-designated from fair
value hedge relationships; and a gain of $10 million (2013: loss
of $1 million) relating to other hedge accounting adjustments
• loss of $18 million (2013: $3 million) affecting interest on
borrowings, comprising a gain of $1 million (2013: $15 million)
relating to interest and cross currency swap proceeds on new
borrowings, which will be amortised to interest in the income
statement over the life of the borrowing; and a loss of $19
million (2013: $18 million) comprising the amortisation of
discounts.
During the year we issued a domestic public bond with proceeds of
$498 million (face value $500 million), maturing on 13 November
2018.
Our unsecured promissory notes are used principally to support
working capital and short term liquidity. These unsecured
promissory notes will continue to be supported by liquid financial
assets and ongoing credit standby lines.
We repaid the following long term debt during the year (Australian
dollar equivalent):
• $5 million Telstra bonds relating to wholesale investors,
matured 15 July 2013
• $59 million offshore Japanese yen private placement matured
30 September 2013
• $500 million domestic public bond, matured 15 November
2013
• $1m other subsidiary loan repayments.
Long term debt of $2,191 million will mature during financial year
2015. This represents the contractual face value amount after
hedging. Included in this amount are offshore borrowings that
were swapped into Australian dollars at inception of the borrowing
through to maturity through the use of cross currency and interest
rate swaps, creating synthetic Australian dollar obligations.
The amount of $2,191 million is different to the carrying amount of
$1,834 million that is included in current borrowings (along with
promissory notes of $365 million and finance leases of $78
million) in the statement of financial position. The carrying amount
reflects the amount of our borrowings due to mature within 12
months prior to netting offsetting risk positions of associated
derivative financial instruments hedging these borrowings. The
carrying amount reflects a mixed measurement basis, with part of
the borrowing portfolio recorded at fair value and the remaining
part at amortised cost which is compliant with the requirements
under the Australian Accounting Standards.
17. CAPITAL MANAGEMENT AND FINANCIAL INSTRUMENTS (CONTINUED)
Table E Telstra Group
Year ended
30 June
2014 2013
$m $m
Debt issuance - offshore and domestic
borrowings ..................................................... 498 2,074
Net short term borrowings............................ 252 (442)
Repayment of offshore and domestic
borrowings...................................................... (565) (3,600)
Finance lease repayments............................ (91) (97)
Net cash inflow/(outflow) ............................ 94 (2,065)
Non-cash movements in gross debt before
tax
Revaluation losses affecting cash flow
hedging reserve.............................................. 45 4
Revaluation (gains)/losses affecting foreign
currency translation reserve......................... (64) 57
Revaluation losses/(gains) affecting other
expenses in the income statement .............. 23 (15)
Revaluation losses/affecting finance costs
in the income statement (i) ........................... 200 188
Borrowings on acquisition of domestic
controlled entity............................................. 1 -
Finance lease additions ................................ 121 237
326 471
Total increase/(decrease) in gross debt..... 420 (1,594)
Net (increase)/decrease in cash and cash
equivalents (including foreign currency
exchange differences) ................................... (3,048) 1,466
Total decrease in net debt............................ (2,628) (128)

NOTES TO THE FINANCIAL STATEMENTS(Continued)
Financial Report
Telstra Corporation Limited and controlled entitiesTelstra Annual Report 123
(e) Interest and yields
The net interest on borrowings is shown in Table F below. Where
applicable, finance costs are assigned to categories on the basis
of the hedged item.
(i) The interest expense as shown in Table F above is categorised
based on the classification of financial instruments applicable as
at 30 June.
(ii) Interest expense is a net amount after offsetting interest
income and interest expense on associated derivative
instruments.
The year-on-year decrease in net interest is due to a reduction in
the average volume of our net interest bearing liabilities and a
reduction in the net average interest yield. The net average
interest yield during the year was 6.2 per cent (2013: 6.4 per cent)
for the Telstra Group. The reduction in yield arose through a
combination of a reduction in short term market base rates year
on year, resulting in lower costs on the floating rate debt
component of our debt portfolio and from re-financing at lower
rates.
Other finance costs are included within note 7.
17. CAPITAL MANAGEMENT AND FINANCIAL INSTRUMENTS (CONTINUED)
Table F Telstra Group
As at 30 June
2014 2013
Note $m $m
Interest on borrowings (i)
Financial instruments in hedge relationships (ii)
Domestic borrowings in cash flow and fair value hedges .................................................................................. 51 37
Offshore borrowings in cash flow hedges............................................................................................................ 465 452
Offshore borrowings in fair value hedges ............................................................................................................ 168 207
Promissory notes in fair value hedges ................................................................................................................. 21 9
Derivatives hedging net foreign investments ...................................................................................................... (9) (15)
Other financial instruments
Promissory notes .................................................................................................................................................. 7 5
Offshore borrowings not in a hedge relationship or de-designated from fair value hedge relationships (ii) 117 150
Telstra bonds and domestic borrowings............................................................................................................. 114 153
Finance leases ...................................................................................................................................................... 20 12
Other ...................................................................................................................................................................... 7 7
Total interest on borrowings.............................................................................................................................7 961 1,017
Finance income on net debt
Interest on cash and cash equivalents ............................................................................................................. 6 85 91
Interest on finance lease receivables ............................................................................................................... 6 14 11
Interest on loans to joint ventures and associated entities............................................................................ 6 54 53
Net interest on interest bearing financial liabilities ....................................................................................... 808 862

NOTES TO THE FINANCIAL STATEMENTS(Continued)
Telstra Corporation Limited and controlled entities124 Telstra Annual Report
(f) Derivative financial instruments
All of our derivatives are in designated hedge relationships which
satisfy the requirements for hedge accounting, except for a
number of derivatives classified as held for trading which are in
economic relationships but not in a designated hedge relationship
for hedge accounting purposes. Refer to note 18 for details on
hedging relationships.
Derivative financial instruments for the Telstra Group as at 30
June are shown in Table G and Table H below. For these derivative
instruments the fair value equates to the carrying amounts in the
statement of financial position, which differs from the face values
that are also provided in other tables within this note.
(i) Gains or losses recognised in the cash flow hedging reserve on
cross currency swap and interest rate swap contracts will be
continuously released to the income statement until the
underlying borrowings are repaid. Gains or losses recognised in
the cash flow hedging reserve on forward exchange contracts will
be released to the income statement when the underlying forecast
transaction occurs and affects profit or loss. However, where the
underlying forecast transaction is a purchase of a non-financial
asset (for example property, plant and equipment) the gain or loss
in the cash flow hedging reserve will be transferred and included
in the measurement of the initial cost of the asset at the date on
which the asset is recognised.
17. CAPITAL MANAGEMENT AND FINANCIAL INSTRUMENTS (CONTINUED)
Table G Telstra Group
As at 30 June 2014
Cross currency swaps Interest rate swaps Forward contracts Total Total Total
Asset Liability Asset Liability Asset Liability Asset Liability Net$m $m $m $m $m $m $m $m $m
Current
Fair value hedge........................ - - - - - (12) - (12) (12)
Cash flow hedge (i) .................... 20 (238) 1 (2) - (5) 21 (245) (224)
Held for trading (ii) .................... - (141) 1 - 1 (2) 2 (143) (141)
20 (379) 2 (2) 1 (19) 23 (400) (377)Non current
Fair value hedge........................ 272 (18) 294 - - - 566 (18) 548
Cash flow hedge (i) .................... 250 (431) 414 (545) - - 664 (976) (312)
Held for trading (ii) .................... 36 (140) 56 (35) - - 92 (175) (83)
558 (589) 764 (580) - - 1,322 (1,169) 153
578 (968) 766 (582) 1 (19) 1,345 (1,569) (224)
Table H Telstra Group
As at 30 June 2013
Cross currency swaps Interest rate swaps Forward contracts Total Total Total
Asset Liability Asset Liability Asset Liability Asset Liability Net$m $m $m $m $m $m $m $m $m
Current
Fair value hedge........................ - (4) - - 3 - 3 (4) (1)
Cash flow hedge (i) .................... - - - - 18 - 18 - 18
Hedge of net investment in
foreign operation....................... - (37) - - - - - (37) (37)
Held for trading (ii) .................... - - - - 22 (3) 22 (3) 19
- (41) - - 43 (3) 43 (44) (1)Non current
Fair value hedge........................ 237 (13) 120 (7) - - 357 (20) 337
Cash flow hedge (i) .................... 183 (737) 463 (580) - - 646 (1,317) (671)
Hedge of net investment in
foreign operation....................... - (27) - - - - - (27) (27)
Held for trading (ii) .................... - (261) 59 - - - 59 (261) (202)
420 (1,038) 642 (587) - - 1,062 (1,625) (563)
420 (1,079) 642 (587) 43 (3) 1,105 (1,669) (564)

NOTES TO THE FINANCIAL STATEMENTS(Continued)
Financial Report
Telstra Corporation Limited and controlled entitiesTelstra Annual Report 125
(f) Derivative financial instruments (continued)
(ii) Derivatives that are classified as held for trading are in
economic relationships but are not in designated hedge
relationships for hedge accounting purposes. Refer to note 18 for
details on our hedging strategies. Although these held for trading
derivatives did not satisfy the requirements for hedge accounting,
these relationships are in effective economic relationships based
on contractual amounts and cash flows over the life of the
transaction.
(g) Fair value hierarchy
We use various methods to estimate the fair value of our financial
instruments:
• Level 1: the fair value is calculated using quoted prices
(unadjusted) in active markets for identical assets or liabilities
• Level 2: the fair value is estimated using inputs other than
quoted prices included in Level 1 that are observable for the
asset or liability, either directly (as prices) or indirectly (derived
from prices)
• Level 3: the fair value is estimated using inputs for the asset or
liability that are not based on observable market data
(unobservable inputs).
The level in the fair value hierarchy within which the fair value
measurement is categorised in its entirety has been determined
on the basis of the lowest level input that is significant to the fair
value measurement in its entirety. An unobservable valuation
input is considered significant if stressing the unobservable input
to the valuation model would result in a greater than 10 per cent
change in the overall fair value of the instruments.
The fair value of the financial instruments and the classification
within the fair value hierarchy are summarised in Tables I, J and K
below, followed by a description of the methods used to estimate
the fair value.
17. CAPITAL MANAGEMENT AND FINANCIAL INSTRUMENTS (CONTINUED)
Table I Telstra Group
As at 30 June 2014
Level 1 Level 2 Level 3 Total$m $m $m $m
Assets and liabilities for
which fair value is
disclosed
Domestic and offshore
borrowings....................... - (15,993) - (15,993)
Promissory notes ............ - (365) - (365)
- (16,358) - (16,358)
Assets and liabilities
measured at fair value
Derivative assets
Cross currency swaps .... - 578 - 578
Interest rate swaps......... - 766 - 766
Forward contracts .......... - 1 - 1
- 1,345 - 1,345Derivative liabilities
Cross currency swaps .... - (968) - (968)
Interest rate swaps......... - (582) - (582)
Forward contracts .......... - (19) - (19)
- (1,569) - (1,569)
- (224) - (224)
Table J Telstra Group
As at 30 June 2013
Level 1 Level 2 Level 3 Total$m $m $m $m
Assets and liabilities for
which fair value is
disclosed
Domestic and offshore
borrowings....................... - (15,377) - (15,377)
Promissory notes ............ - (126) - (126)
- (15,503) - (15,503)
Assets and liabilities
measured at fair value
Available-for-sale
investments
Unlisted securities.......... - - 19 19
Derivative assets
Cross currency swaps .... - 420 - 420
Interest rate swaps......... - 642 - 642
Forward contracts .......... - 43 - 43
- 1,105 19 1,124Derivative liabilities
Cross currency swaps .... - (1,079) - (1,079)
Interest rate swaps......... - (587) - (587)
Forward contracts .......... - (3) - (3)
- (1,669) - (1,669)
- (564) 19 (545)
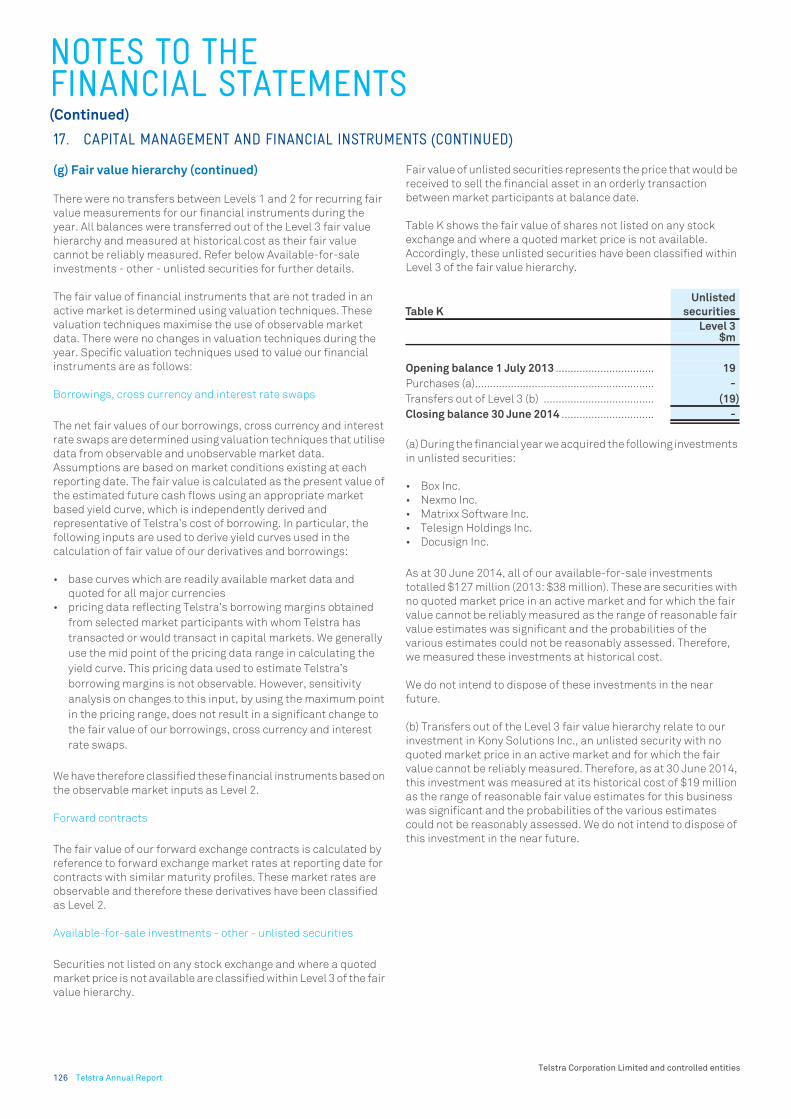
NOTES TO THE FINANCIAL STATEMENTS(Continued)
Telstra Corporation Limited and controlled entities126 Telstra Annual Report
(g) Fair value hierarchy (continued)
There were no transfers between Levels 1 and 2 for recurring fair
value measurements for our financial instruments during the
year. All balances were transferred out of the Level 3 fair value
hierarchy and measured at historical cost as their fair value
cannot be reliably measured. Refer below Available-for-sale
investments - other - unlisted securities for further details.
The fair value of financial instruments that are not traded in an
active market is determined using valuation techniques. These
valuation techniques maximise the use of observable market
data. There were no changes in valuation techniques during the
year. Specific valuation techniques used to value our financial
instruments are as follows:
Borrowings, cross currency and interest rate swaps
The net fair values of our borrowings, cross currency and interest
rate swaps are determined using valuation techniques that utilise
data from observable and unobservable market data.
Assumptions are based on market conditions existing at each
reporting date. The fair value is calculated as the present value of
the estimated future cash flows using an appropriate market
based yield curve, which is independently derived and
representative of Telstra’s cost of borrowing. In particular, the
following inputs are used to derive yield curves used in the
calculation of fair value of our derivatives and borrowings:
• base curves which are readily available market data and
quoted for all major currencies
• pricing data reflecting Telstra’s borrowing margins obtained
from selected market participants with whom Telstra has
transacted or would transact in capital markets. We generally
use the mid point of the pricing data range in calculating the
yield curve. This pricing data used to estimate Telstra’s
borrowing margins is not observable. However, sensitivity
analysis on changes to this input, by using the maximum point
in the pricing range, does not result in a significant change to
the fair value of our borrowings, cross currency and interest
rate swaps.
We have therefore classified these financial instruments based on
the observable market inputs as Level 2.
Forward contracts
The fair value of our forward exchange contracts is calculated by
reference to forward exchange market rates at reporting date for
contracts with similar maturity profiles. These market rates are
observable and therefore these derivatives have been classified
as Level 2.
Available-for-sale investments - other - unlisted securities
Securities not listed on any stock exchange and where a quoted
market price is not available are classified within Level 3 of the fair
value hierarchy.
Fair value of unlisted securities represents the price that would be
received to sell the financial asset in an orderly transaction
between market participants at balance date.
Table K shows the fair value of shares not listed on any stock
exchange and where a quoted market price is not available.
Accordingly, these unlisted securities have been classified within
Level 3 of the fair value hierarchy.
(a) During the financial year we acquired the following investments
in unlisted securities:
• Box Inc.
• Nexmo Inc.
• Matrixx Software Inc.
• Telesign Holdings Inc.
• Docusign Inc.
As at 30 June 2014, all of our available-for-sale investments
totalled $127 million (2013: $38 million). These are securities with
no quoted market price in an active market and for which the fair
value cannot be reliably measured as the range of reasonable fair
value estimates was significant and the probabilities of the
various estimates could not be reasonably assessed. Therefore,
we measured these investments at historical cost.
We do not intend to dispose of these investments in the near
future.
(b) Transfers out of the Level 3 fair value hierarchy relate to our
investment in Kony Solutions Inc., an unlisted security with no
quoted market price in an active market and for which the fair
value cannot be reliably measured. Therefore, as at 30 June 2014,
this investment was measured at its historical cost of $19 million
as the range of reasonable fair value estimates for this business
was significant and the probabilities of the various estimates
could not be reasonably assessed. We do not intend to dispose of
this investment in the near future.
17. CAPITAL MANAGEMENT AND FINANCIAL INSTRUMENTS (CONTINUED)
Table K
Unlisted
securities
Level 3$m
Opening balance 1 July 2013 ................................. 19
Purchases (a)............................................................ -
Transfers out of Level 3 (b) ..................................... (19)
Closing balance 30 June 2014 ............................... -

NOTES TO THE FINANCIAL STATEMENTS(Continued)
Financial Report
Telstra Corporation Limited and controlled entitiesTelstra Annual Report 127
(h) Offsetting and netting arrangements
The following tables present our financial assets and financial
liabilities subject to offsetting, enforceable master netting
arrangements or similar agreements:
(i) Reflects amounts subject to conditional offsetting
arrangements.
(ii) Below is a description of our material rights of set-off that are
not otherwise included in column (b) in Tables L and M above:
• for our inter operative tariff arrangements with some of our
international roaming partners, we have executed agreements
that allow the netting of amounts payable and receivable by us
on cessation of the contract
• for our wholesale customers we have executed Customer
Relationship Agreements which allow for the netting of
amounts payable and receivable by us in certain
circumstances where there is a right to suspend the supply of
services or on the expiration or termination of the agreement
• for all our derivative financial instruments, we have executed
master netting arrangements under our International Swaps
and Derivatives Association agreements. These arrangements
allow for the netting of amounts payable and receivable by us or
the counterparty in the event of default or a credit event. In line
with contractual provisions, in the event of insolvency all
derivatives with a positive or negative fair value that exist with
the respective counterparty are offset against each other,
leaving a net receivable or liability.
17. CAPITAL MANAGEMENT AND FINANCIAL INSTRUMENTS (CONTINUED)
Table L Telstra Group
Financial Instruments As at 30 June 2014
Gross amounts
of recognised
financial
instruments
Amounts that
are offset in the
statement of
financial
position
Net amounts of
financial
instruments
presented in
the statement
of financial
position
Gross amounts not offset
in the statement of
financial position (i) Net amounts
that are not
subject to
offsetting
arrangements
Financial
instruments (ii)
Collateral
received or
pledged
$m $m $m $m $m $m
(a) (b) (c) = (a) - (b) (d) (d) (e) = (c) - (d)
Trade and other receivables....... 500 73 427 156 3 268
Trade and other payables........... (463) (73) (390) (156) - (234)
Derivative financial assets......... 1,345 - 1,345 748 - 597
Derivative financial liabilities .... (1,569) - (1,569) (748) - (821)
Total ............................................. (187) - (187) - 3 (190)
Table M Telstra Group
Financial Instruments As at 30 June 2013
Gross amounts
of recognised
financial
instruments
Amounts that
are offset in
the statement
of financial
position
Net amounts of
financial
instruments
presented in
the statement
of financial
position
Gross amounts not offset
in the statement of
financial position (i) Net amounts
that are not
subject to
offsetting
arrangements
Financial
instruments (ii)
Collateral
received or
pledged
$m $m $m $m $m $m
(a) (b) (c) = (a) - (b) (d) (d) (e) = (c) - (d)
Trade and other receivables....... 592 67 525 207 4 314
Trade and other payables........... (444) (67) (377) (207) - (170)
Derivative financial assets......... 1,105 - 1,105 726 - 379
Derivative financial liabilities .... (1,669) - (1,669) (726) - (943)
Total ............................................. (416) - (416) - 4 (420)

NOTES TO THE FINANCIAL STATEMENTS(Continued)
Telstra Corporation Limited and controlled entities128 Telstra Annual Report
We undertake transactions using a range of financial instruments,
including:
• cash assets
• receivables
• payables
• negotiable certificates of deposits
• bank deposits
• bills of exchange and promissory notes
• listed investments and investments in other corporations
• various forms of borrowings, including medium term notes,
promissory notes, bank loans and private placements
• derivatives.
Our activities result in exposure to operational risk and a number
of financial risks, including market risk (interest rate risk and
foreign currency risk), credit risk and liquidity risk.
Our overall risk management program seeks to mitigate these
risks and reduce volatility on our financial performance and
support the delivery of our financial targets. We manage our risks
with a view to the outcomes of both our financial results and the
underlying economic position. Financial risk management is
carried out centrally by our Treasury department, which is part of
our corporate areas, under policies approved by the Board. The
Board approves written principles for overall risk management
such as foreign exchange risk, interest rate risk, credit risk, use of
derivative financial instruments and liquidity management.
We enter into derivative transactions in accordance with Board
approved policies to manage our exposure to market risks and
volatility of financial outcomes that arise as part of our normal
business operations. These derivative instruments create an
obligation or right that effectively transfers one or more of the
risks associated with an underlying financial instrument, asset or
obligation. Derivative financial instruments that we use to hedge
risks such as interest rate and foreign currency movements
include:
• cross currency swaps
• interest rate swaps
• forward foreign exchange contracts.
We do not speculatively trade in derivative financial instruments.
Our derivative transactions are entered into to hedge the risks
relating to underlying physical positions arising from our business
activities.
Section (a) of this note sets out the key financial risk factors that
arise from our activities, including our policies for managing these
risks.
Sections (b) and (c) provide details of our hedging strategies and
hedge relationships that are used for financial risk management.
In particular, these sections give context to our hedge
transactions and the resulting economic and risk positions.
(a) Risk and mitigation
The risks associated with our main financial instruments and our
policies for minimising these risks are detailed below. These risks
comprise market risk, credit risk and liquidity risk.
Market risk
Market risk is the risk that the fair value or future cash flows of our
financial instruments will fluctuate because of changes in market
prices. Components of market risk to which we are exposed are
discussed below.
(i) Interest rate risk
Interest rate risk refers to the risk that the value of a financial
instrument or cash flows associated with the instrument will
fluctuate due to changes in market interest rates.
Interest rate risk arises from interest bearing financial assets and
liabilities. Our interest rate liability risk arises primarily from long
term foreign debt issued at fixed rates, which exposes us to fair
value interest rate risk. Our borrowings, which have a variable
interest rate attached, give rise to cash flow interest rate risk.
Our debt is sourced from a number of financial markets covering
domestic and offshore, short term and long term funding. The
majority of our debt consists of foreign currency denominated
borrowings. We manage our debt in accordance with targeted
currency, interest rate, liquidity, and debt portfolio maturity
profiles. Specifically, we manage these risks on our net debt
portfolio by:
• adjusting to our target ratio the ratio of fixed interest debt to
variable interest debt, as required by our debt management
policy
• ensuring access to diverse sources of funding
• reducing risks of refinancing by establishing and managing in
accordance with target maturity profiles
• undertaking hedging activities through the use of derivative
financial instruments.
Under our interest rate swaps we agree with other parties to
exchange, at specified intervals (mainly quarterly), the difference
between fixed contract interest rates and floating rate interest
amounts calculated by reference to the agreed notional principal
amounts. Refer to note 17, Table D, for our residual post hedge
fixed and floating interest positions on a contractual face value
basis.
18. FINANCIAL RISK MANAGEMENT
NOTES TO THE FINANCIAL STATEMENTS(Continued)
Financial Report
Telstra Corporation Limited and controlled entitiesTelstra Annual Report 129
(a) Risk and mitigation (continued)
Market risk (continued)
(i) Interest rate risk (continued)
We hedge interest rate and currency risk on most of our foreign
currency borrowings by entering into cross currency principal
swaps and interest rate swaps. “Hedging strategies” and “Hedge
relationships” contained in sections (b) and (c) of this note
provides further information.
The weighted average interest rates on our fixed and floating rate
financial instruments as at 30 June, which do not have offsetting
risk positions, and the principal/notional amounts on which
interest is calculated, are shown in Table A. Interest rate positions
on our foreign cross currency and foreign interest rate swaps and
on the majority of our foreign borrowings are fully offset.
Accordingly, the majority of our instruments in Table A represent
Australian dollar interest positions. Principal/notional amounts
shown are net of discounts and therefore differ from the face
value disclosed in note 17 (Tables C and D).
18. FINANCIAL RISK MANAGEMENT (CONTINUED)

NOTES TO THE FINANCIAL STATEMENTS(Continued)
Telstra Corporation Limited and controlled entities130 Telstra Annual Report
(a) Risk and mitigation (continued)
Market risk (continued)
(i) Interest rate risk (continued)
(*) The average rate is calculated as the weighted average (based
on principal/notional value) effective interest rate, as at reporting
date.
(^) Rates on cash and cash equivalents represent average rates
earned on net positive cash balances after taking into account
bank set-off arrangements.
(#) In the prior year we had cross currency swaps in place to hedge
our offshore investment in the CSL Group which was disposed of
during the year.
18. FINANCIAL RISK MANAGEMENT (CONTINUED)
Table A Telstra Group
As at 30 June 2014 As at 30 June 2013
Principal/
notional
receivable/
(payable)
Weighted
average
Principal/
notional
receivable/
(payable)
Weighted
average
$m % (*) $m % (*)
Fixed rate instruments - Australian interest rate
Cross currency and interest rate swap payable ........................................................ (6,200) 5.76 (7,311) 5.88
Finance lease payable................................................................................................. (250) 6.14 (226) 6.55
Telstra bonds and domestic borrowings.................................................................... (1,056) 7.14 (1,253) 7.47
Offshore borrowings .................................................................................................... (140) 6.10 (140) 6.10
Fixed rate instruments - foreign interest rates
Finance lease payable................................................................................................. (59) 9.41 (54) 9.38
Offshore borrowings ................................................................................................... (4) 11.06 (4) 12.0
(7,709) (8,988)
Variable rate instruments - Australian interest rates
Contractual repricing or maturity 3 months or less
Cash and cash equivalents (^) .................................................................................... 5,108 3.15 2,065 3.22
Cross currency swap receivable (#) .......................................................................... - - 520 2.82
Cross currency and interest rate swap payable ........................................................ (6,960) 4.48 (5,893) 4.37
Telstra bonds and domestic borrowings.................................................................... - (5) 12.58
Promissory notes ......................................................................................................... (100) 2.84 - -
Contractual repricing or maturity 3 to 12 months
Telstra bonds and domestic borrowings.................................................................... (499) 6.50 (500) 6.48
Forward contract liability - net ................................................................................... (285) 2.41 (89) 2.08
Cross currency and interest rate swap payable ........................................................ (185) 8.18 - -
Variable rate instruments - foreign interest rates
Contractual repricing or maturity 6 months or less
Cash and cash equivalents (^) .................................................................................... 325 1.84 336 0.92
Cross currency swap payable (#) ............................................................................... - - (584) 0.15
(2,596) (4,150)
Net interest bearing debt........................................................................................... (10,305) (13,138)
Other interest bearing financial assets
Fixed rate instruments - Australian interest rates
Finance lease receivable............................................................................................. 277 6.13 214 7.72
Amounts owed by joint ventures entities................................................................... 451 12.00 451 12.00
Floating rate instruments - foreign interest rate
Other receivables......................................................................................................... 3 2.86 7 3.30
Net interest bearing financial liabilities.................................................................. (9,574) (12,466)

NOTES TO THE FINANCIAL STATEMENTS(Continued)
Financial Report
Telstra Corporation Limited and controlled entitiesTelstra Annual Report 131
(a) Risk and mitigation (continued)
Market risk (continued)
(ii) Sensitivity analysis - interest rate risk
The sensitivity analysis included in this section is based on the
interest rate risk exposures on our net debt portfolio as at
reporting date.
A sensitivity of plus or minus 10 per cent has been selected as this
is considered reasonable given the current level of both short term
and long term Australian dollar interest rates. For example, a 10
per cent increase would move short term interest rates (cash) at
30 June 2014 from 2.50 per cent (2013: 2.75 per cent) to 2.75 per
cent (2013: 3.03 per cent), representing a 25 (2013: 28) basis point
shift. This basis point shift is considered reasonable taking into
account the absolute rates as at 30 June and current market
conditions.
This sensitivity analysis assumes a parallel shift in interest rates
across all currencies. The results reflect the net impact on a
hedged basis, which will be primarily reflecting the Australian
dollar floating or Australian dollar fixed position from our cross
currency and interest rate swap hedges. Therefore, the movement
in the Australian dollar interest rates is a significant assumption
in this sensitivity analysis.
Based on the sensitivity analysis, equity would be affected by the
revaluation of our derivatives associated with borrowings
designated in a cash flow hedge relationship and finance costs
would be affected by:
• the impact on interest expense being incurred on our net
floating rate Australian dollar positions during the year
• the revaluation of our derivatives associated with borrowings
de-designated from a fair value hedge relationship or not in a
hedge relationship
• the ineffectiveness resulting from the change in fair value of
both our derivatives and our borrowings that are designated in
a fair value hedge.
The carrying value of borrowings de-designated from fair value
hedge relationships or not in a hedge relationship is not adjusted
for fair value movements attributable to interest rate risk.
Accordingly, the revaluation gain or loss on our foreign currency
derivatives associated with these borrowings will not have an
offsetting gain or loss attributable to interest rate movements on
the underlying borrowing.
The impact of the sensitivity analysis comprises:
• the revaluation impact on our derivatives and borrowings from
a 10 per cent movement in interest rates based on the net debt
balances as at reporting date
• the effect on interest expense on our floating rate borrowings
from a 10 per cent movement in interest rates at each reset
date during the year.
18. FINANCIAL RISK MANAGEMENT (CONTINUED)
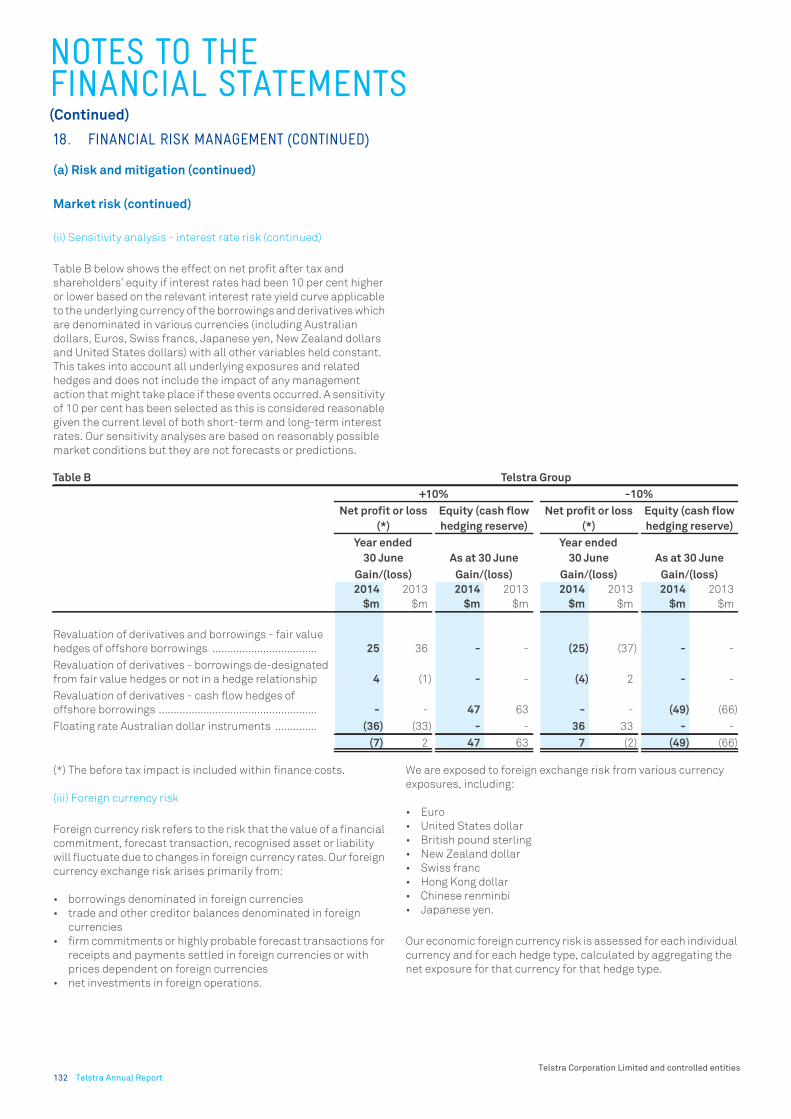
NOTES TO THE FINANCIAL STATEMENTS(Continued)
Telstra Corporation Limited and controlled entities132 Telstra Annual Report
(a) Risk and mitigation (continued)
Market risk (continued)
(ii) Sensitivity analysis - interest rate risk (continued)
Table B below shows the effect on net profit after tax and
shareholders’ equity if interest rates had been 10 per cent higher
or lower based on the relevant interest rate yield curve applicable
to the underlying currency of the borrowings and derivatives which
are denominated in various currencies (including Australian
dollars, Euros, Swiss francs, Japanese yen, New Zealand dollars
and United States dollars) with all other variables held constant.
This takes into account all underlying exposures and related
hedges and does not include the impact of any management
action that might take place if these events occurred. A sensitivity
of 10 per cent has been selected as this is considered reasonable
given the current level of both short-term and long-term interest
rates. Our sensitivity analyses are based on reasonably possible
market conditions but they are not forecasts or predictions.
(*) The before tax impact is included within finance costs.
(iii) Foreign currency risk
Foreign currency risk refers to the risk that the value of a financial
commitment, forecast transaction, recognised asset or liability
will fluctuate due to changes in foreign currency rates. Our foreign
currency exchange risk arises primarily from:
• borrowings denominated in foreign currencies
• trade and other creditor balances denominated in foreign
currencies
• firm commitments or highly probable forecast transactions for
receipts and payments settled in foreign currencies or with
prices dependent on foreign currencies
• net investments in foreign operations.
We are exposed to foreign exchange risk from various currency
exposures, including:
• Euro
• United States dollar
• British pound sterling
• New Zealand dollar
• Swiss franc
• Hong Kong dollar
• Chinese renminbi
• Japanese yen.
Our economic foreign currency risk is assessed for each individual
currency and for each hedge type, calculated by aggregating the
net exposure for that currency for that hedge type.
18. FINANCIAL RISK MANAGEMENT (CONTINUED)
Table B Telstra Group
+10% -10%
Net profit or loss
(*)
Equity (cash flow
hedging reserve)
Net profit or loss
(*)
Equity (cash flow
hedging reserve)
Year ended
30 June As at 30 June
Year ended
30 June As at 30 June
Gain/(loss) Gain/(loss) Gain/(loss) Gain/(loss)
2014 2013 2014 2013 2014 2013 2014 2013
$m $m $m $m $m $m $m $m
Revaluation of derivatives and borrowings - fair value
hedges of offshore borrowings ................................... 25 36 - - (25) (37) - -
Revaluation of derivatives - borrowings de-designated
from fair value hedges or not in a hedge relationship 4 (1) - - (4) 2 - -
Revaluation of derivatives - cash flow hedges of
offshore borrowings ..................................................... - - 47 63 - - (49) (66)
Floating rate Australian dollar instruments .............. (36) (33) - - 36 33 - -
(7) 2 47 63 7 (2) (49) (66)

NOTES TO THE FINANCIAL STATEMENTS(Continued)
Financial Report
Telstra Corporation Limited and controlled entitiesTelstra Annual Report 133
(a) Risk and mitigation (continued)
Market risk (continued)
(iii) Foreign currency risk (continued)
We minimise our exposure to foreign currency risk by initially
seeking contracts effectively denominated in Australian dollars
where possible and economically favourable to do so. Where this
is not possible we manage our exposure as follows.
Cash flow foreign currency risk arises primarily from foreign
currency overseas borrowings. We hedge this risk on the major
part of our foreign currency denominated borrowings by entering
into a combination of interest rate and cross currency swaps at
inception to maturity, effectively converting them to Australian
dollar borrowings. Foreign currency borrowings are not swapped
into Australian dollars where they are used as hedges for foreign
exchange exposure such as translation foreign exchange risk from
our offshore investments. Refer to note 17, Table D, for our
residual post hedge currency exposures on a contractual face
value basis.
Foreign exchange risk that arises from transactional exposures
such as firm commitments or highly probable transactions settled
in a foreign currency (primarily United States dollars) are
managed principally through the use of forward foreign currency
derivatives. We hedge a proportion of these transactions (such as
property, plant and equipment and inventory purchases settled in
foreign currencies) in accordance with our risk management
policy.
Foreign currency risk also arises on translation of the net assets of
our foreign controlled entities which have a functional currency
other than Australian dollars. The foreign currency gains or losses
arising from this risk are recorded through the foreign currency
translation reserve. Where significant we may choose to manage
this translation foreign exchange risk with forward foreign
currency contracts, cross currency swaps and/or borrowings
denominated in the currency of the entity concerned. Currently we
have no hedges of net investment in foreign controlled entities in
place. During the year we disposed of our shareholding in CSL
Group which were hedged for foreign currency translation risk.
Refer to note 20 for further details.
In addition, our controlled entities may hedge foreign exchange
transactions such as exposures from asset/liability balances or
forecast sales/purchases in currencies other than their functional
currency. Where this occurs, external foreign exchange contracts
are designated at the group level as hedges of foreign exchange
risk on the specific asset/liability balance or forecast transaction.
We also economically hedge a proportion of foreign currency risk
associated with trade and other liability and asset balances using
forward foreign currency contracts.
Refer to section (b) “Hedging strategies” and section (c) “Hedge
relationships” in this note for further information.
(iv) Sensitivity analysis - foreign currency risk
The sensitivity analysis included in this section is based on foreign
currency risk exposures on our financial instruments and net
foreign investment balances as at reporting date.
The translation of our investments in foreign operations from their
functional currency to Australian dollars represents a translation
risk rather than a financial risk. Nevertheless, in this sensitivity
analysis we have included the translation impact on our foreign
currency translation reserve from movements in the exchange
rate.
Adverse versus favourable movements are determined relative to
the underlying exposure. An adverse movement in exchange rates
implies an increase in our foreign currency risk exposure and a
worsening of our financial position. A favourable movement in
exchange rates implies a reduction in our foreign currency risk
exposure and an improvement of our financial position.
A sensitivity of 10 per cent has been selected as this is considered
reasonable taking into account the current level of exchange rates
and the volatility observed both on an historical basis and on
market expectations for future movements. For example,
comparing the Australian dollar exchange rate against the Euro,
the year end rate of 0.6906 (2013: 0.7096) would generate a 10 per
cent favourable position of 0.7597 (2013: 0.7806) and an adverse
position of 0.6215 (2013: 0.6386). This range is considered
reasonable given the volatility that has been observed.
Foreign currency risk exposure from recognised assets and
liabilities arises primarily from our long term borrowings
denominated in foreign currencies. There is no significant impact
on profit or loss from foreign currency movements associated with
these borrowings as they are effectively hedged.
There is some volatility in profit or loss from exchange rate
movements associated with our borrowings de-designated or not
in hedge relationships and with our forecast transactions
denominated in a foreign currency.
We are exposed to equity impacts from foreign currency
movements associated with our offshore investments and our
derivatives in cash flow hedges of offshore borrowings. This
foreign currency risk is spread over a number of currencies and
accordingly we have disclosed the sensitivity analysis on a total
portfolio basis and not separately by currency. Our foreign
currency exposure associated with cash flow hedge derivatives is
predominantly in Euros and our offshore investments, mainly in
British pounds sterling and Chinese renminbi (relating to our
investments in Telstra Limited, Autohome Inc. and Sequel Media
Inc.).
18. FINANCIAL RISK MANAGEMENT (CONTINUED)

NOTES TO THE FINANCIAL STATEMENTS(Continued)
Telstra Corporation Limited and controlled entities134 Telstra Annual Report
(a) Risk and mitigation (continued)
Market risk (continued)
(iv) Sensitivity analysis - foreign currency risk (continued)
Table C below shows the effect on net profit after tax and
shareholders' equity from a 10 per cent adverse/favourable
movement in foreign exchange rates based on balances at
reporting date had the Australia dollar moved against all
applicable currencies (including Euros, Swiss francs, Japanese
yen, New Zealand dollars and United States dollars) with all other
variables held constant and taking into account all underlying
exposures and related hedges. This does not include the impact of
any management action that might take place if these events
occurred. A sensitivity of 10 per cent has been selected as this is
considered reasonable. Our sensitivity analyses are based on
reasonably possible market conditions but they are not forecasts
or predictions.
(*) The impact of some of our borrowings de-designated from fair
value hedge relationships or not in a hedge relationship has
resulted in some volatility to profit or loss. The revaluation impact
attributable to foreign exchange movements will largely offset
between the derivatives and the borrowings. However, there will
be some profit or loss impact due to the fact that the derivatives
are recorded at fair value and hence the foreign exchange
movements are recognised at present value. The borrowings,
which are accounted for on an amortised cost basis, will reflect
revaluation movements for changes in the spot exchange rate that
are not discounted. Therefore, the impact on profit or loss is
primarily attributable to the discounting effect of the foreign
exchange gains and losses on the hedging derivatives.
(^) Represents the impact relating to the unhedged portion of
forecast transactions that would affect profit or loss.
(**) Relates to the translation of the net assets of our foreign
controlled entities. The lower sensitivity in the current year
reflects the sale of our net investment in the CSL Group during the
year. As at 30 June 2014 no hedges of net investments in foreign
controlled entities were in place and accordingly the net gain or
loss in the sensitivity analysis represents the impact relating to
unhedged net assets of our foreign controlled entities.
18. FINANCIAL RISK MANAGEMENT (CONTINUED)
Table C Telstra Group
10% adverse movement 10% favourable movement
Net profit or
loss
Equity (foreign
currency
translation
reserve)
Equity (cash
flow hedging
reserve)
Net profit or
loss
Equity (foreign
currency
translation
reserve)
Equity (cash
flow hedging
reserve)
Year ended
30 June As at 30 June As at 30 June
Year ended
30 June As at 30 June As at 30 June
Gain/(loss) Gain/(loss) Gain/(loss) Gain/(loss) Gain/(loss) Gain/(loss)
2014 2013 2014 2013 2014 2013 2014 2013 2014 2013 2014 2013
$m $m $m $m $m $m $m $m $m $m $m $m
Revaluation of derivatives
and borrowings -
de-designated from fair
value hedges or not in a
hedge relationship (*) ......... (9) (8) - - - - 11 10 - - - -
Revaluation of derivatives
and underlying exposure -
cash flow hedges of forecast
transactions (^) ................... (12) (19) - - - - 10 15 - - - -
Revaluation of derivatives -
cash flow hedges of offshore
borrowings........................... - - - - (41) (33) - - - - 50 41
Net foreign investments (**) - - (38) (72) - - - - 46 88 - -
(21) (27) (38) (72) (41) (33) 21 25 46 88 50 41
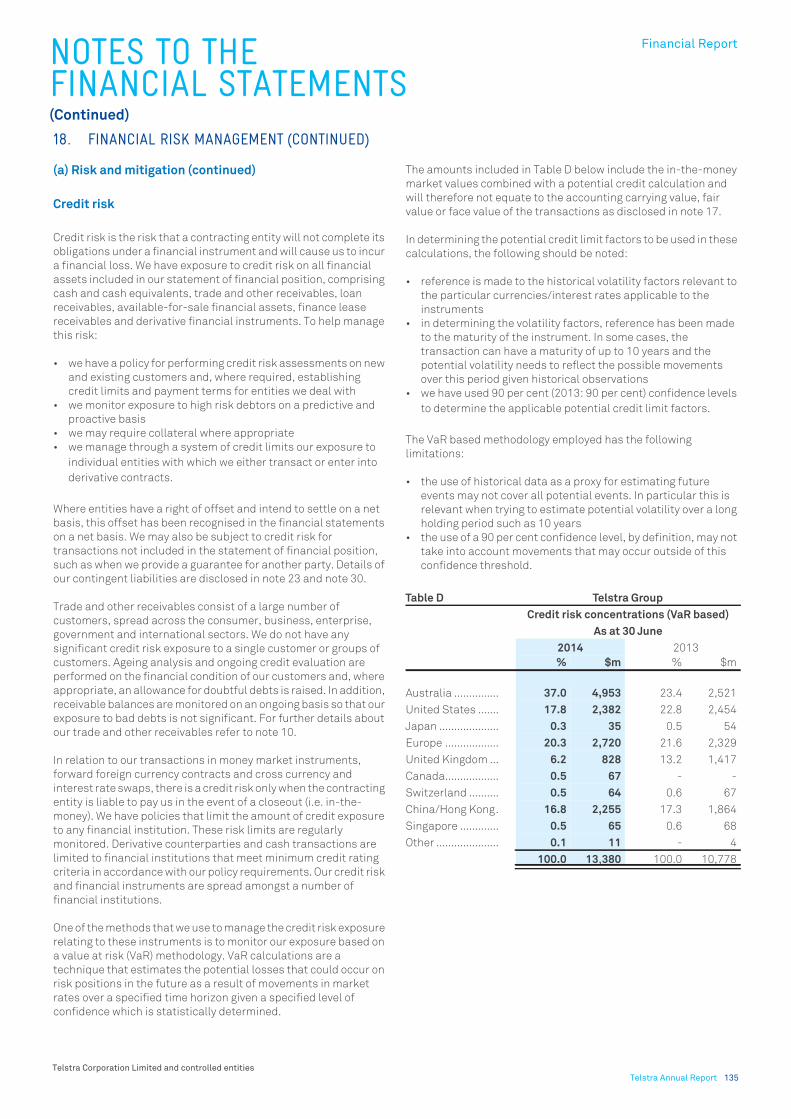
NOTES TO THE FINANCIAL STATEMENTS(Continued)
Financial Report
Telstra Corporation Limited and controlled entitiesTelstra Annual Report 135
(a) Risk and mitigation (continued)
Credit risk
Credit risk is the risk that a contracting entity will not complete its
obligations under a financial instrument and will cause us to incur
a financial loss. We have exposure to credit risk on all financial
assets included in our statement of financial position, comprising
cash and cash equivalents, trade and other receivables, loan
receivables, available-for-sale financial assets, finance lease
receivables and derivative financial instruments. To help manage
this risk:
• we have a policy for performing credit risk assessments on new
and existing customers and, where required, establishing
credit limits and payment terms for entities we deal with
• we monitor exposure to high risk debtors on a predictive and
proactive basis
• we may require collateral where appropriate
• we manage through a system of credit limits our exposure to
individual entities with which we either transact or enter into
derivative contracts.
Where entities have a right of offset and intend to settle on a net
basis, this offset has been recognised in the financial statements
on a net basis. We may also be subject to credit risk for
transactions not included in the statement of financial position,
such as when we provide a guarantee for another party. Details of
our contingent liabilities are disclosed in note 23 and note 30.
Trade and other receivables consist of a large number of
customers, spread across the consumer, business, enterprise,
government and international sectors. We do not have any
significant credit risk exposure to a single customer or groups of
customers. Ageing analysis and ongoing credit evaluation are
performed on the financial condition of our customers and, where
appropriate, an allowance for doubtful debts is raised. In addition,
receivable balances are monitored on an ongoing basis so that our
exposure to bad debts is not significant. For further details about
our trade and other receivables refer to note 10.
In relation to our transactions in money market instruments,
forward foreign currency contracts and cross currency and
interest rate swaps, there is a credit risk only when the contracting
entity is liable to pay us in the event of a closeout (i.e. in-the-
money). We have policies that limit the amount of credit exposure
to any financial institution. These risk limits are regularly
monitored. Derivative counterparties and cash transactions are
limited to financial institutions that meet minimum credit rating
criteria in accordance with our policy requirements. Our credit risk
and financial instruments are spread amongst a number of
financial institutions.
One of the methods that we use to manage the credit risk exposure
relating to these instruments is to monitor our exposure based on
a value at risk (VaR) methodology. VaR calculations are a
technique that estimates the potential losses that could occur on
risk positions in the future as a result of movements in market
rates over a specified time horizon given a specified level of
confidence which is statistically determined.
The amounts included in Table D below include the in-the-money
market values combined with a potential credit calculation and
will therefore not equate to the accounting carrying value, fair
value or face value of the transactions as disclosed in note 17.
In determining the potential credit limit factors to be used in these
calculations, the following should be noted:
• reference is made to the historical volatility factors relevant to
the particular currencies/interest rates applicable to the
instruments
• in determining the volatility factors, reference has been made
to the maturity of the instrument. In some cases, the
transaction can have a maturity of up to 10 years and the
potential volatility needs to reflect the possible movements
over this period given historical observations
• we have used 90 per cent (2013: 90 per cent) confidence levels
to determine the applicable potential credit limit factors.
The VaR based methodology employed has the following
limitations:
• the use of historical data as a proxy for estimating future
events may not cover all potential events. In particular this is
relevant when trying to estimate potential volatility over a long
holding period such as 10 years
• the use of a 90 per cent confidence level, by definition, may not
take into account movements that may occur outside of this
confidence threshold.
18. FINANCIAL RISK MANAGEMENT (CONTINUED)
Table D Telstra Group
Credit risk concentrations (VaR based)
As at 30 June
2014 2013
% $m % $m
Australia ............... 37.0 4,953 23.4 2,521
United States ....... 17.8 2,382 22.8 2,454
Japan .................... 0.3 35 0.5 54
Europe .................. 20.3 2,720 21.6 2,329
United Kingdom ... 6.2 828 13.2 1,417
Canada.................. 0.5 67 - -
Switzerland .......... 0.5 64 0.6 67
China/Hong Kong. 16.8 2,255 17.3 1,864
Singapore ............. 0.5 65 0.6 68
Other ..................... 0.1 11 - 4
100.0 13,380 100.0 10,778

NOTES TO THE FINANCIAL STATEMENTS(Continued)
Telstra Corporation Limited and controlled entities136 Telstra Annual Report
(a) Risk and mitigation (continued)
Credit risk (continued)
Liquidity risk
Liquidity risk includes the risk that, as a result of our operational
liquidity requirements:
• we will not have sufficient funds to settle a transaction on the
due date
• we will be forced to sell financial assets at a value that is less
than what they are worth or
• we may be unable to settle a financial liability or recover a
financial asset at all.
To help reduce these risks we:
• have a liquidity policy which targets a minimum and average
level of cash and cash equivalents to be maintained
• have readily accessible standby facilities and other funding
arrangements in place
• generally use instruments that are tradeable in highly liquid
markets
• have a liquidity portfolio structure that requires surplus funds
to be invested within various bands of liquid instruments
ranging from ultra liquid to highly liquid and liquid instruments.
We monitor rolling forecasts of liquidity reserves on the basis of
expected cash flow. Our objective is to maintain a balance
between continuity of funding and flexibility through the use of
liquid instruments, borrowings and committed available credit
lines.
At 30 June 2014, based on contractual face values, 15 per cent
(2013: 4 per cent) of our debt (after hedging) comprising offshore
borrowings, Telstra bonds and domestic borrowings and
excluding promissory notes, will mature in less than one year.
The contractual maturity of our fixed and floating rate financial
liabilities and derivatives and the corresponding carrying values
are shown in Table E. The contractual maturity amounts (nominal
cash flows) represent the future undiscounted principal and
interest cash flows and therefore do not equate to the carrying
values. These amounts are reported in Australian dollars based on
the applicable exchange rate as at 30 June. We have also included
derivative financial assets in the following table on the basis that
these assets have a direct relationship with an underlying
financial liability and both the asset and the liability are managed
together.
For floating rate instruments, the amount disclosed is determined
by reference to the current market pricing for interest rates over
the period to maturity.
Also affecting liquidity are cash and cash equivalents, available-
for-sale financial assets and other interest and non-interest
bearing financial assets. Liquidity risk associated with these
financial instruments is represented by the face values as shown
in note 17, Table C.
18. FINANCIAL RISK MANAGEMENT (CONTINUED)

NOTES TO THE FINANCIAL STATEMENTS(Continued)
Financial Report
Telstra Corporation Limited and controlled entitiesTelstra Annual Report 137
(a)
Ris
k a
nd
mit
iga
tio
n (
co
nti
nu
ed
)
Liq
uid
ity
ris
k (
co
nti
nu
ed
)
(i)
Ne
t a
mo
un
ts f
or
inte
res
t ra
te s
wa
ps
fo
r w
hic
h n
et
ca
sh
flo
ws
are
exc
ha
ng
ed
. Cla
ss
ific
ati
on
into
ne
t re
ce
ive
an
d n
et
pa
y p
os
itio
ns
is b
as
ed
on
th
e t
ota
l n
et
ca
sh
flo
ws
ove
r th
e l
ife
of
the
co
ntr
ac
t.
(ii)
Co
ntr
ac
tua
l a
mo
un
ts t
o b
e e
xch
an
ge
d r
ep
res
en
tin
g g
ros
s c
as
h f
low
s t
o b
e e
xch
an
ge
d.
18.
FIN
ANCI
AL R
ISK
MAN
AGEM
ENT
(CON
TINU
ED)
Ta
ble
ETe
lstr
a G
rou
p
As
at
30
Ju
ne
20
14
As
at
30
Ju
ne
20
13
Co
ntr
ac
tua
l m
atu
rity
(n
om
ina
l c
as
h f
low
s)
Co
ntr
ac
tua
l m
atu
rity
(n
om
ina
l c
as
h f
low
s)
Ca
rry
ing
am
ou
nt
Le
ss
th
an
1 y
ea
r
1 t
o 2
ye
ars
2 t
o 5
ye
ars
Ov
er
5
ye
ars
Tota
l
Ca
rry
ing
am
ou
nt
Le
ss
th
an
1 y
ea
r
1 t
o 2
yea
rs
2 t
o 5
yea
rs
Ove
r 5
yea
rsTo
tal
$m
$m
$m
$m
$m
$m
$m
$m
$m
$m
$m
$m
De
riv
ati
ve
fin
an
cia
l in
str
um
en
ts
Ne
t in
tere
st
rate
sw
ap
s p
aya
ble
(i)
....
....
....
....
...
(58
2)
(20
8)
(17
6)
(27
4)
(74
)(7
32
)(5
87
)(1
92
)(1
72
)(2
80
)(9
5)
(73
9)
Cro
ss
cu
rre
nc
y s
wa
ps
pa
yab
le (
ii).
....
....
....
....
....
(12
,46
4)
(2,1
72
)(1
,86
6)
(3,2
94
)(8
,13
6)
(15
,46
8)
(12
,81
8)
(90
0)
(2,4
81
)(4
,69
6)
(8,9
95
)(1
7,0
72
)
Fo
rwa
rd f
ore
ign
cu
rre
nc
y c
on
tra
cts
pa
yab
le (
ii)
(66
0)
(65
1)
--
-(6
51
)(6
45
)(6
45
)-
--
(64
5)
Ne
t in
tere
st
rate
sw
ap
s r
ec
eiv
ab
le (
i)..
....
....
....
.7
66
28
42
29
34
81
09
97
06
42
23
62
28
29
97
88
41
Cro
ss
cu
rre
nc
y r
ec
eiv
ab
le (
ii)
....
....
....
....
....
....
....
12
,07
41
,52
21
,33
82
,37
88
,14
41
3,3
82
12
,15
95
19
1,7
39
3,3
69
8,6
00
14
,22
7
Fo
rwa
rd f
ore
ign
cu
rre
nc
y c
on
tra
cts
re
ce
iva
ble
(ii
) 6
42
63
1-
--
63
16
85
68
2-
--
68
2
No
n-d
eri
va
tiv
e f
ina
nc
ial
lia
bil
itie
s
Tels
tra
bo
nd
s a
nd
do
me
sti
c b
orr
ow
ing
s..
....
....
(2,7
93
)(6
51
)(1
21
)(1
,95
6)
(66
2)
(3,3
90
)(2
,76
8)
(65
0)
(63
0)
(1,4
15
)(7
48
)(3
,44
3)
Tra
de
/oth
er
cre
dit
ors
an
d a
cc
rue
d e
xpe
ns
es
..(3
,89
0)
(3,8
33
)(3
)(2
1)
(33
)(3
,89
0)
(4,2
70
)(4
,21
3)
-(1
8)
(39
)(4
,27
0)
Off
sh
ore
bo
rro
win
gs
....
....
....
....
....
....
....
....
....
....
...
(12
,35
7)
(1,8
10
)(1
,57
4)
(2,7
66
)(8
,48
3)
(14
,63
3)
(11
,89
1)
(50
7)
(1,7
38
)(3
,70
3)
(8,8
69
)(1
4,8
17
)
Fin
an
ce
le
as
es
....
....
....
....
....
....
....
....
....
....
....
....
....
(30
9)
(97
)(8
4)
(11
4)
(15
7)
(45
2)
(28
0)
(76
)(6
9)
(11
2)
(13
5)
(39
2)
Pro
mis
so
ry n
ote
s..
....
....
....
....
....
....
....
....
....
....
....
..(3
65
)(3
65
)-
--
(36
5)
(12
5)
(12
5)
--
-(1
25
)
De
ferr
ed
co
ns
ide
rati
on
fo
r c
ap
ita
l e
xpe
nd
itu
re(1
0)
(10
)-
--
(10
)(1
34
)(3
0)
(31
)(7
9)
(47
)(1
87
)

NOTES TO THE FINANCIAL STATEMENTS(Continued)
Telstra Corporation Limited and controlled entities138 Telstra Annual Report
(a) Risk and mitigation (continued)
Liquidity risk (continued)
Financing arrangements
We have promissory note facilities in place in the United States,
Australia and New Zealand. Under these facilities, in current
market conditions we would expect to be able to nominally issue
up to $4 billion (2013: between $4 billion and $5 billion). As at 30
June 2014, we had on issue $365 million (2013: $125 million)
under these facilities. These facilities are not committed or
underwritten and we have no guaranteed access to the funds.
As at 30 June 2014, our subsidiaries had bank bill acceptance
facilities of nil (2013: $155 million) of which nil was issued (2013:
$84 million). Subsidiary bank facilities in the prior year were held
by CSL Limited. During the year we sold our shareholding in this
subsidiary.
Generally, given that we retain suitable ratings, our facilities are
available, subject to market conditions, unless we default on any
terms applicable under the relevant agreements or become
insolvent. During the current and prior years there were no
defaults or breaches under any of our facility agreements.
(b) Hedging strategies
We hold a number of different financial instruments to hedge risks
relating to underlying transactions. Our major exposure to interest
rate risk and foreign currency risk arises from our long term
borrowings. We also have translation currency risk associated
with our offshore investments and transactional currency
exposures such as purchases in foreign currencies.
We designate certain derivatives as either:
• hedges of the fair value of recognised liabilities (fair value
hedges)
• hedges of foreign currency risk associated with recognised
liabilities or highly probable forecast transactions (cash flow
hedges) or
• hedges of a net investment in a foreign operation.
The terms and conditions in relation to our derivative financial
instruments are similar to the terms and conditions of the
underlying hedged items to maximise hedge effectiveness.
Financial instruments de-designated from fair value hedge
relationships or not in a designated hedge relationship
Our financial instruments de-designated from fair value hedge
relationships or not in designated hedge relationships comprise:
• a number of offshore borrowings denominated in United States
dollars, Euros and British pounds sterling which were in fair
value hedges and were de-designated from the hedge
relationship for hedge accounting purposes as they did not
meet requirements for hedge effectiveness
• an Australian dollar interest rate swap which is not in a
designated hedge relationship for hedge accounting purposes
used to economically hedge changes in fair value attributable
to changes in market interest rates relating to an Australian
dollar private placement bond
• some forward foreign currency contracts that are not in a
designated hedge relationship for hedge accounting purposes,
used to economically hedge fair value movements for changes
in foreign exchange rates associated with trade creditors and
other liability and asset balances denominated in a foreign
currency.
During the year some derivative contracts associated with two
Euro borrowings were novated to another counterparty which
resulted in the discontinuation of the hedge relationship as
required under the current accounting standards. The portion of
the underlying borrowings and associated derivatives relating to
the novation were not re-designated into a new hedge relationship
for hedge accounting purposes. The novation resulted in no
change to the terms of the contract or the underlying cash flows
and the underlying borrowing and hedging derivatives continue to
remain in effective economic relationships. There has been no
adjustments required for changes in counterparty risk.
All our financial liabilities de-designated or not in designated
hedge relationships are in effective economic relationships based
on contractual face value amounts and cash flows over the life of
the transaction.
All other hedge relationships met hedge effectiveness
requirements for hedge accounting purposes at the reporting
date.
18. FINANCIAL RISK MANAGEMENT (CONTINUED)
Table F Telstra Group
As at 30 June
2014 2013
$m $m
We have access to the following lines of credit:
Credit standby arrangements
Unsecured committed cash standby facilities which are subject to annual review............................................. 559 662
Amount of credit unused............................................................................................................................................ 559 662

NOTES TO THE FINANCIAL STATEMENTS(Continued)
Financial Report
Telstra Corporation Limited and controlled entitiesTelstra Annual Report 139
(b) Hedging strategies (continued)
Financial instruments de-designated from fair value hedge
relationships or not in a designated hedge relationship
(continued)
Refer to section (c) for details on our hedge relationships based on
contractual face value amounts and cash flows. Refer to note 7 for
the impact on finance costs relating to borrowings de-designated
or not in hedge relationships.
Fair value hedges
We hold cross currency principal and interest rate swaps to
mitigate our exposure to changes in the fair value of foreign
denominated debt from fluctuations in foreign currency and
interest rates. The hedged items designated are a portion of our
foreign currency denominated borrowings. The changes in the fair
values of the hedged items resulting from movements in exchange
rates and interest rates are offset against the changes in the fair
value of the cross currency and interest rate swaps. The objective
of this hedging is to convert foreign currency borrowings to
floating Australian dollar borrowings.
The net impact on finance costs from remeasuring the fair value of
the hedge instruments together with the gains and losses in
relation to the hedged item where those gains or losses relate to
the hedged risks largely represents ineffectiveness attributable to
movements in Telstra’s borrowing margins.
During the year the remeasurement of the hedged items resulted
in a loss before tax of $331 million (2013: loss of $599 million) and
the changes in the fair value of the hedging instruments resulted
in a gain before tax of $203 million (2013: gain of $504 million).
This results in a net loss before tax of $128 million and a net loss
after tax of $90 million (2013: net loss before tax of $95 million and
net loss after tax of $67 million).
Refer to note 7 for the impact on finance costs relating to
borrowings in fair value hedges.
The effectiveness of the hedging relationship is tested
prospectively, both at inception and in subsequent periods, and
retrospectively by means of statistical methods using a regression
analysis. Regression analysis is used to analyse the relationship
between the derivative financial instruments (the dependent
variable) and the underlying borrowings (the independent
variable). The primary objective is to determine if changes to the
hedged item and derivative are highly correlated and thus
supportive of the assertion that there will be a high degree of
offset in fair values achieved by the hedge.
Refer to note 17, Table G and Table H, for the value of our
derivatives designated as fair value hedges.
Cash flow hedges
Cash flow hedges are predominantly used to hedge exposures
relating to our borrowings and our ongoing business activities
where we have highly probable purchase or settlement
commitments in foreign currencies.
We enter into cross currency and interest rate swaps as cash flow
hedges of future payments denominated in foreign currency
resulting from our long term offshore borrowings. The hedged
items designated are a portion of the outflows associated with
these foreign denominated borrowings. The objective of this
hedging is to hedge foreign currency risks arising from spot rate
changes and thereby mitigate the risk of payment fluctuations as
a result of exchange rate movements.
We also enter into forward exchange contracts as cash flow
hedges to hedge forecast transactions denominated in foreign
currency; these contracts hedge foreign currency risk arising from
spot rate changes. The hedged items comprise a portion of highly
probable forecast payments for operating and capital items
primarily denominated in United States dollars.
The effectiveness of the hedging relationship relating to our
borrowings is tested prospectively, both on inception and in
subsequent periods, and retrospectively by means of statistical
methods where the actual derivative financial instruments are
regressed against a hypothetical derivative. The primary objective
is to determine if changes to the hedged item and derivative are
highly correlated and thus supportive of the assertion that there
will be a high degree of offset in cash flows achieved by the hedge.
The effectiveness of our hedges relating to highly probable
forecast transactions is assessed prospectively based on
matching of critical terms. As both the nominal volumes and
currencies of the hedged item and the hedging instrument are
identical, a highly effective hedging relationship is expected. An
effectiveness test is carried out retrospectively using the
cumulative dollar-offset method. For this, the changes in the fair
values of the hedging instrument and the hedged item
attributable to exchange rate changes are calculated and a ratio is
created. If this ratio is between 80 and 125, the hedge is effective.
In relation to our offshore borrowings, ineffectiveness on our cash
flow hedges is recognised in the income statement to the extent
that the change in the fair value of the hedging derivatives in the
cash flow hedge exceed the change in value of the underlying
borrowings in the cash flow hedge during the hedging period.
During the year, there was no material ineffectiveness
attributable to our cash flow hedges (refer to note 7). Also during
the year, there was no material impact on profit or loss as a result
of discontinuing hedge accounting for forecast transactions no
longer expected to occur.
For hedge gains or losses transferred to and from the cash flow
hedging reserve refer to the statement of comprehensive income.
Refer to note 17, Table G and Table H, for the value of our
derivatives designated as cash flow hedges.
18. FINANCIAL RISK MANAGEMENT (CONTINUED)

NOTES TO THE FINANCIAL STATEMENTS(Continued)
Telstra Corporation Limited and controlled entities140 Telstra Annual Report
(b) Hedging strategies (continued)
Cash flow hedges (continued)
Table G shows the maturities of the payments in our cash flow
hedges (i.e. when the cash flows are expected to occur). These
amounts represent the undiscounted cash flows reported in
Australian dollars based on the applicable exchange rate as at 30
June and represent the identified foreign currency exposures at
reporting date in relation to our cash flow hedges.
(i) These amounts will affect our income statement in the same
period as the period in which the cash flows are expected to occur.
(ii) The impact on our income statement from foreign currency
movements associated with these hedged borrowings will affect
profit or loss over the life of the borrowing, however the impact on
profit or loss is expected to be nil as the borrowings are effectively
hedged.
Hedges of net investments in foreign operations
We have exposure to foreign currency risk as a result of our
investments in offshore activities. This risk is created by the
translation of the net assets of these entities from their functional
currency to Australian dollars. We may choose to hedge a portion
of our investments in foreign operations to mitigate exposure to
this risk using forward foreign currency contracts, cross currency
swaps and/or borrowings in the relevant currency of the
investment.
The effectiveness of the hedging relationship is tested using
prospective and retrospective effectiveness tests. In a
retrospective effectiveness test, the changes in the fair value of
the hedging instruments and the change in the value of the hedged
net investment from spot rate changes are calculated and a ratio
is created. If this ratio is between 80 and 125 per cent, the hedge
is effective. The prospective effectiveness test is performed based
on matching of critical terms. As both the nominal volumes and
currencies of the hedged item and the hedging instrument are
identical, a highly effective hedging relationship is expected.
During the year, there was no material ineffectiveness
attributable to our hedges of net foreign investments.
In the statement of comprehensive income, net gains before tax of
$43 million and after tax of $30 million (2013: losses before tax of
$69 million and after tax of $48 million) on our hedging
instruments were taken directly to equity during the year in the
foreign currency translation reserve.
Following the disposal of the CSL Group on 14 May 2014, as at 30
June 2014 we had no hedges of net investments in foreign
controlled entities in place.
Refer to note 17, Table G and Table H, for the value of our
derivatives designated as hedges of net foreign investments.
(c) Hedge relationships
The following tables give context to our hedge transactions and in
particular describe how we arrive at our economic residual risk
position as a result of the hedges executed. It should be noted that
the economic residual position in each of the tables will not be
equal to the carrying values.
Table H and Table I describe each of our hedge relationships which
use cross currency and interest rate swaps as the hedging
instruments. These comprise effective economic relationships
based on contractual face value amounts and cash flows,
including hedge relationships that have been de-designated for
hedge accounting purposes and borrowings that are not in a
designated hedge relationship for hedge accounting purposes.
These hedging instruments are used to hedge our offshore
borrowings and some domestic borrowings. In the prior year
hedging instruments were also in place to hedge our offshore
investment in the CSL Group which was disposed of during the
year. Outlined in the following tables is the pre hedge underlying
exposure, each leg of our cross currency and interest rate swaps
and the end post hedge position. This post hedge position
represents our net final currency and interest positions and is
represented in our residual economic position as described in
note 17, Table D.
18. FINANCIAL RISK MANAGEMENT (CONTINUED)
Table G Telstra Group
Nominal cash
outflows
As at 30 June
2014 2013
$m $m
Highly probable forecast transactions
Non-capital items (i)
Within 1 year................................................ (306) (431)
Borrowings (ii)
Within 1 year................................................ (1,156) (264)
Within 1 to 5 years ...................................... (2,485) (3,768)
After 5 years ................................................ (4,055) (4,465)
(7,696) (8,497)
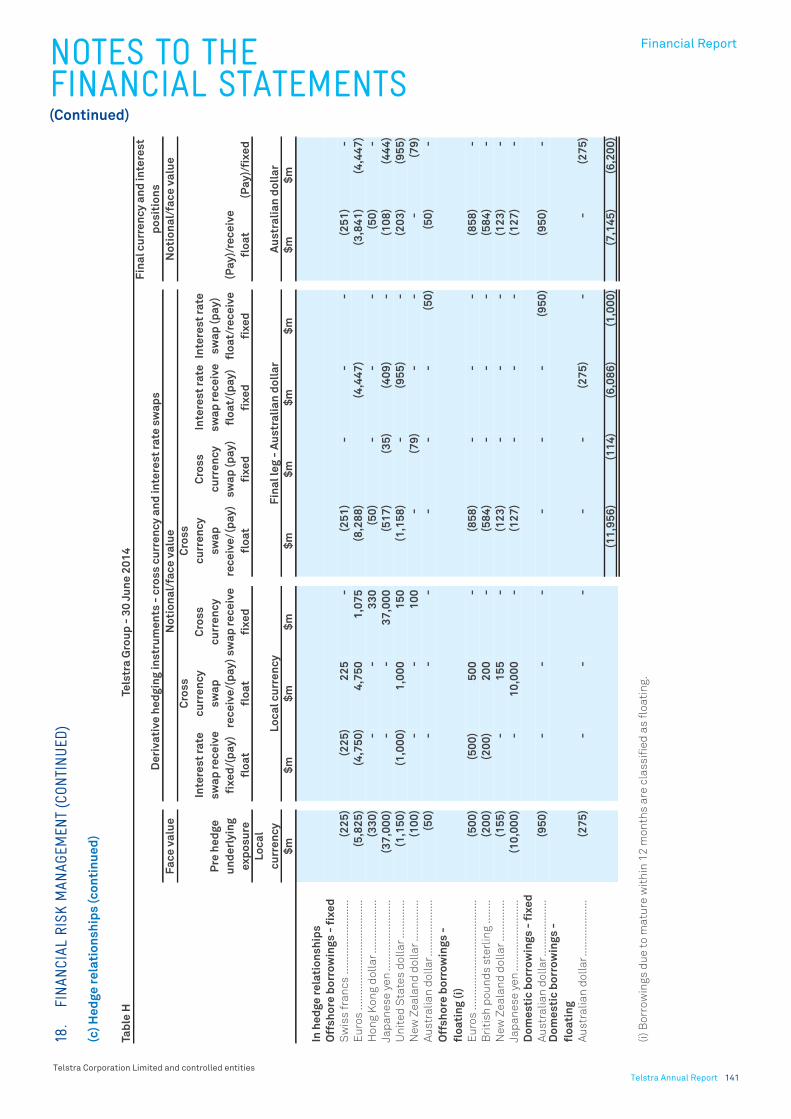
NOTES TO THE FINANCIAL STATEMENTS(Continued)
Financial Report
Telstra Corporation Limited and controlled entitiesTelstra Annual Report 141
(c)
He
dg
e r
ela
tio
ns
hip
s (
co
nti
nu
ed
)
(i)
Bo
rro
win
gs
du
e t
o m
atu
re w
ith
in 1
2 m
on
ths
are
cla
ss
ifie
d a
s f
loa
tin
g.
18.
FIN
ANCI
AL R
ISK
MAN
AGEM
ENT
(CON
TINU
ED)
Ta
ble
HTe
lstr
a G
rou
p -
30
Ju
ne
20
14
De
riv
ati
ve
he
dg
ing
in
str
um
en
ts -
cro
ss
cu
rre
nc
y a
nd
in
tere
st
rate
sw
ap
s
Fin
al
cu
rre
nc
y a
nd
inte
res
t
po
sit
ion
s
Fa
ce
va
lue
No
tio
na
l/fa
ce
va
lue
No
tio
na
l/fa
ce
va
lue
Pre
he
dg
e
un
de
rly
ing
ex
po
su
re
Inte
res
t ra
te
sw
ap
re
ce
ive
fix
ed
/(p
ay
)
flo
at
Cro
ss
cu
rre
nc
y
sw
ap
rec
eiv
e/(
pa
y)
flo
at
Cro
ss
cu
rre
nc
y
sw
ap
re
ce
ive
fix
ed
Cro
ss
cu
rre
nc
y
sw
ap
rec
eiv
e/
(pa
y)
flo
at
Cro
ss
cu
rre
nc
y
sw
ap
(p
ay
)
fix
ed
Inte
res
t ra
te
sw
ap
re
ce
ive
flo
at/
(pa
y)
fix
ed
Inte
res
t ra
te
sw
ap
(p
ay
)
flo
at/
rec
eiv
e
fix
ed
(Pa
y)/
rec
eiv
e
flo
at
(Pa
y)/
fix
ed
Lo
ca
l
cu
rre
nc
yL
oc
al
cu
rre
nc
yF
ina
l le
g -
Au
str
ali
an
do
lla
rA
us
tra
lia
n d
oll
ar
$m
$m
$m
$m
$m
$m
$m
$m
$m
$m
In h
ed
ge
re
lati
on
sh
ips
Off
sh
ore
bo
rro
win
gs
- f
ixe
d
Sw
iss
fra
nc
s..
....
....
....
....
....
...
(22
5)
(22
5)
22
5-
(25
1)
--
-(2
51
)-
Eu
ros
....
....
....
....
....
....
....
....
....
.(5
,82
5)
(4,7
50
)4
,75
01
,07
5(8
,28
8)
(4,4
47
)(3
,84
1)
(4,4
47
)
Ho
ng
Ko
ng
do
lla
r..
....
....
....
....
(33
0)
--
33
0(5
0)
--
-(5
0)
-
Ja
pa
ne
se
ye
n..
....
....
....
....
....
..(3
7,0
00
)-
-3
7,0
00
(51
7)
(35
)(4
09
)-
(10
8)
(44
4)
Un
ite
d S
tate
s d
oll
ar
....
....
....
.(1
,15
0)
(1,0
00
)1
,00
01
50
(1,1
58
)-
(95
5)
-(2
03
)(9
55
)
Ne
w Z
ea
lan
d d
oll
ar
....
....
....
..(1
00
)-
-1
00
-(7
9)
--
-(7
9)
Au
str
ali
an
do
lla
r...
....
....
....
....
(50
)-
--
--
-(5
0)
(50
)-
Off
sh
ore
bo
rro
win
gs
-
flo
ati
ng
(i)
Eu
ros
....
....
....
....
....
....
....
....
....
.(5
00
)(5
00
)5
00
-(8
58
)-
--
(85
8)
-
Bri
tis
h p
ou
nd
s s
terl
ing
....
....
(20
0)
(20
0)
20
0-
(58
4)
--
-(5
84
)-
Ne
w Z
ea
lan
d d
oll
ar
....
....
....
..(1
55
)-
15
5-
(12
3)
--
-(1
23
)-
Ja
pa
ne
se
ye
n..
....
....
....
....
....
..(1
0,0
00
)-
10
,00
0-
(12
7)
--
-(1
27
)-
Do
me
sti
c b
orr
ow
ing
s -
fix
ed
Au
str
ali
an
do
lla
r...
....
....
....
....
(95
0)
--
--
--
(95
0)
(95
0)
-D
om
es
tic
bo
rro
win
gs
-
flo
ati
ng
Au
str
ali
an
do
lla
r...
....
....
....
....
(27
5)
--
--
-(2
75
)-
-(2
75
)
(11
,95
6)
(11
4)
(6,0
86
)(1
,00
0)
(7,1
45
)(6
,20
0)

NOTES TO THE FINANCIAL STATEMENTS(Continued)
Telstra Corporation Limited and controlled entities142 Telstra Annual Report
(c)
He
dg
e r
ela
tio
ns
hip
s (
co
nti
nu
ed
)
(i)
Bo
rro
win
gs
du
e t
o m
atu
re w
ith
in 1
2 m
on
ths
are
cla
ss
ifie
d a
s f
loa
tin
g.
18.
FIN
ANCI
AL R
ISK
MAN
AGEM
ENT
(CON
TINU
ED)
Ta
ble
ITe
lstr
a G
rou
p -
30
Ju
ne
20
13
De
riva
tive
he
dg
ing
in
str
um
en
ts -
cro
ss
cu
rre
nc
y a
nd
in
tere
st
rate
sw
ap
s
Fin
al
cu
rre
nc
y a
nd
in
tere
st
po
sit
ion
s
Fa
ce
va
lue
No
tio
na
l/fa
ce
va
lue
No
tio
na
l/fa
ce
va
lue
Pre
he
dg
e
un
de
rly
ing
exp
os
ure
Inte
res
t ra
te
sw
ap
re
ce
ive
fixe
d/(
pa
y)
flo
at
Cro
ss
cu
rre
nc
y
sw
ap
re
ce
ive
/
(pa
y)
flo
at
Cro
ss
cu
rre
nc
y
sw
ap
re
ce
ive
fixe
d
Cro
ss
cu
rre
nc
y
sw
ap
re
ce
ive
/
(pa
y)
flo
at
Cro
ss
cu
rre
nc
y
sw
ap
(p
ay
)
fixe
d
Inte
res
t ra
te
sw
ap
re
ce
ive
flo
at/
(pa
y)
fixe
d
Inte
res
t ra
te
sw
ap
(p
ay
)
flo
at/
rec
eiv
e
fixe
d
(Pa
y)/
rec
eiv
e
flo
at
(Pa
y)/
fixe
d
Lo
ca
l
cu
rre
nc
yL
oc
al
cu
rre
nc
yF
ina
l le
g -
Au
str
ali
an
do
lla
rA
us
tra
lia
n d
oll
ar
$m
$m
$m
$m
$m
$m
$m
$m
$m
$m
In h
ed
ge
re
lati
on
sh
ips
Off
sh
ore
bo
rro
win
gs
- f
ixe
d
Sw
iss
fra
nc
s..
....
....
....
....
....
...
(22
5)
(22
5)
22
5-
(25
1)
--
-(2
51
)-
Eu
ros
....
....
....
....
....
....
....
....
....
.(6
,32
5)
(5,2
50
)5
,25
01
,07
5(9
,14
5)
-(4
,94
7)
-(4
,19
8)
(4,9
47
)
Bri
tis
h p
ou
nd
s s
terl
ing
....
....
(20
0)
(20
0)
20
0-
(58
4)
-(3
60
)-
(22
4)
(36
0)
Ho
ng
Ko
ng
do
lla
r..
....
....
....
....
(33
0)
--
33
0(5
0)
--
-(5
0)
-
Ja
pa
ne
se
ye
n..
....
....
....
....
....
..(4
7,0
00
)-
-4
7,0
00
(51
7)
(16
3)
(40
9)
-(1
08
)(5
72
)
Un
ite
d S
tate
s d
oll
ar
....
....
....
.(1
,15
0)
(1,0
00
)1
,00
01
50
(1,1
58
)-
(95
5)
-(2
03
)(9
55
)
Ne
w Z
ea
lan
d d
oll
ar
....
....
....
..(2
55
)-
-2
55
-(2
02
)-
--
(20
2)
Au
str
ali
an
do
lla
r...
....
....
....
....
(50
)-
--
--
-(5
0)
(50
)-
Off
sh
ore
bo
rro
win
gs
-
flo
ati
ng
(i)
Ja
pa
ne
se
ye
n..
....
....
....
....
....
..(5
,00
0)
-5
,00
0-
(59
)-
--
(59
)-
Do
me
sti
c b
orr
ow
ing
s -
fix
ed
Au
str
ali
an
do
lla
r...
....
....
....
....
(75
0)
--
--
--
(75
0)
(75
0)
-D
om
es
tic
bo
rro
win
gs
-
flo
ati
ng
Au
str
ali
an
do
lla
r...
....
....
....
....
(27
5)
--
--
-(2
75
)-
-(2
75
)
Ne
t fo
reig
n i
nv
es
tme
nts
Ho
ng
Ko
ng
do
lla
r..
....
....
....
....
8,7
52
-(4
,20
0)
-5
20
--
-5
20
-
(11
,24
4)
(36
5)
(6,9
46
)(8
00
)(5
,37
3)
(7,3
11
)

NOTES TO THE FINANCIAL STATEMENTS(Continued)
Financial Report
Telstra Corporation Limited and controlled entitiesTelstra Annual Report 143
(c) Hedge relationships (continued)
Table J describes each of our hedge relationships, where forward
foreign currency exchange contracts are used as the hedging
instruments. These relationships comprise effective economic
relationships based on contractual face value amounts and cash
flows, including relationships that are not in a designated hedge
relationship for hedge accounting purposes. These hedging
instruments are used to economically hedge our promissory
notes, forecast transactions denominated in foreign currency, and
foreign currency trade and other liabilities.
Outlined in the following table is the pre hedge underlying
exposure, each leg of the forward foreign currency contract and
the end post hedge position. This post hedge position represents
our net final currency positions and is represented in our residual
economic position as described in note 17, Table D.
18. FINANCIAL RISK MANAGEMENT (CONTINUED)
Table J Telstra Group
Derivative hedging instruments
- forward foreign currency contracts
Face value Notional value
Average exchange
rate
Pre hedge
underlying
exposure (payable)/
receive
Forward contract
receive/(pay)
Forward contract
(pay)/receive - final
leg
Local currency Local currency Australian dollars
2014 2013 2014 2013 2014 2013 2014 2013
$m $m $m $m $m $m
Forward contracts hedging interest bearing
debt
Promissory notes
United States dollars - contractual maturity 0-
3 months (2013: nil) ........................................... (250) - 250 - (278) - 0.8998 -
New Zealand dollars - contractual maturity nil
(2013: 0-3 months) ............................................ - (150) - 150 - (124) - 1.2143Loans to and from wholly owned controlled
entities
British pounds sterling - contractual maturity
0-3 months (2013: 0-3 months) ....................... (55) (56) 55 56 (98) (81) 0.5548 0.6839
New Zealand dollars - contractual maturity 0-3
months (2013: 0-3 months) .............................. (1) (1) 1 1 (1) (1) 1.0871 1.1981
United States dollars - contractual maturity 0-
3 months (2013: 0-3 months) ........................... (47) (64) 47 64 (50) (62) 0.9268 1.0323
Hong Kong dollars - contractual maturity 0-3
months (2013: 0-3 months) .............................. (4) 13 4 (13) (1) 1 7.1738 8.8780
Japanese yen - contractual maturity 0-3
months (2013: 0-3 months) .............................. 136 (125) (136) 125 1 (1) 94.59 97.85
Forward contracts hedging forecast payments
and other liabilities
Forecast transactions
United States dollars - contractual maturity 0-
12 months (2013: 0-12 months) ....................... (289) (400) 138 177 (154) (175) 0.8993 1.0114
Other assets and liabilities - non-interest
bearing
Japanese yen - contractual maturity nil (2013: 1
month)................................................................. - (542) - 542 - (6) - 90.08United states dollars - contractual maturity 0-
12 months (2013: nil)......................................... 23 - (23) - 25 - 0.9234 -United states dollars - contractual maturity 0-
12 months (2013: 0-12 months) ....................... (44) (102) 44 102 (47) (107) 0.9353 0.9441
(603) (556)

NOTES TO THE FINANCIAL STATEMENTS(Continued)
Telstra Corporation Limited and controlled entities144 Telstra Annual Report
Contributed equity
Our contributed equity represents our authorised and issued fully
paid ordinary shares. Each of our fully paid ordinary shares carries
the right to one vote at a meeting of the Company. Holders of our
shares also have the right to receive dividends and to participate
in the proceeds from sale of all surplus assets in proportion to the
total shares issued in the event of the Company winding up.
We have 12,443,074,357 (2013: 12,443,074,357) authorised fully
paid ordinary shares on issue.
Share loan to employees
The share loan to employees represents the outstanding balance
of the non recourse loans provided to our employees under the
Telstra Employee Share Ownership Plan (TESOP) Trusts (TESOP97
and TESOP99). Refer to note 27 for further details regarding these
plans.
Shares held by employee share plans
The shares held by employee share plans represent the cost of
shares held by the Telstra Growthshare Trust (Growthshare) in
Telstra Corporation Limited. The purchase of these shares has
been fully funded with contributions and intercompany loans from
Telstra Corporation Limited. As at 30 June 2014, the number of
shares totalled 21,550,102 (2013: 26,774,268). These shares are
excluded from the calculation of basic and diluted earnings per
share. Refer to note 3 for further details.
The total number of shares acquired on market during the
financial year by Growthshare for employee incentive schemes
was 11,838,299 shares. The average price per share at which the
shares were acquired during the financial year was $5.14.
Net services received under employee share plans
The net services received under employee share plans represents
the cumulative value of our options, performance rights,
restricted shares, incentive shares, Directshare and Ownshare
issued under Growthshare. Contributions by Telstra Corporation
Limited to Growthshare are also included in this account.
19. SHARE CAPITAL
Telstra Group
As at 30 June
2014 2013
$m $m
Contributed equity................................................................................................................................................. 5,793 5,793
Share loan to employees ....................................................................................................................................... (17) (20)
Shares held by employee share plans.................................................................................................................. (107) (129)
Net services received under employee share plans ........................................................................................... 50 67
5,719 5,711

NOTES TO THE FINANCIAL STATEMENTS(Continued)
Financial Report
Telstra Corporation Limited and controlled entitiesTelstra Annual Report 145
20. NOTES TO THE STATEMENT OF CASH FLOWS
(a) Reconciliation of profit to net cash provided by operating activities
Telstra Group
Year ended 30 June
Restated
2014 2013Note $m $m
Profit for the year from continuing operations .................................................................................................... 4,549 3,640
(Loss)/profit for the year from discontinued operation ...................................................................................... (204) 151
Profit for the year ................................................................................................................................................... 4,345 3,791
Add/(subtract) the following transactions
Depreciation and amortisation............................................................................................................................. 4,042 4,238
Finance income...................................................................................................................................................... (156) (219)
Finance costs ......................................................................................................................................................... 1,113 1,152
Distribution from Foxtel Partnership ................................................................................................................... (165) (155)
Share-based payments......................................................................................................................................... 45 47
Defined benefit plan expense ............................................................................................................................... 306 305
Consideration in kind............................................................................................................................................. (23) -
Net gain on disposal of property, plant and equipment ..................................................................................... (76) (54)
Net gain on disposal of intangibles...................................................................................................................... - (12)
Net gain on de-recognition of finance leases ................................................................................................22 - (8)
Net (gain)/loss on disposal of controlled entities ............................................................................................... (561) 127
Share of net (profit)/loss from joint ventures and associated entities ............................................................. (24) 1
Impairment losses (excluding inventories and trade and other receivables)................................................... 180 68
Foreign exchange loss/(gain) ................................................................................................................................ 111 (7)
Cash movements in operating assets and liabilities
(net of acquisitions and disposals of controlled entity balances)
Increase in trade and other receivables .............................................................................................................. (164) (249)
Decrease/(increase) in inventories....................................................................................................................... 35 (173)
Increase in prepayments and other assets ......................................................................................................... (49) (162)
Decrease in trade and other payables ................................................................................................................. (391) (301)
Increase/(decrease) in revenue received in advance.......................................................................................... 54 (99)
(Decrease)/increase in net taxes payable............................................................................................................ (59) 84
Increase/(decrease) in provisions ........................................................................................................................ 50 (15)
Net cash provided by operating activities ................................................................................................... 8,613 8,359
(b) Cash and cash equivalents
Telstra Group
Year ended 30 June
Restated
2014 2013$m $m
Cash at bank and on hand .................................................................................................................................... 305 295
Bank deposits, negotiable certificates of deposits and bills of exchange........................................................ 5,222 2,184
Cash and cash equivalents in the statement of cash flows ........................................................................ 5,527 2,479
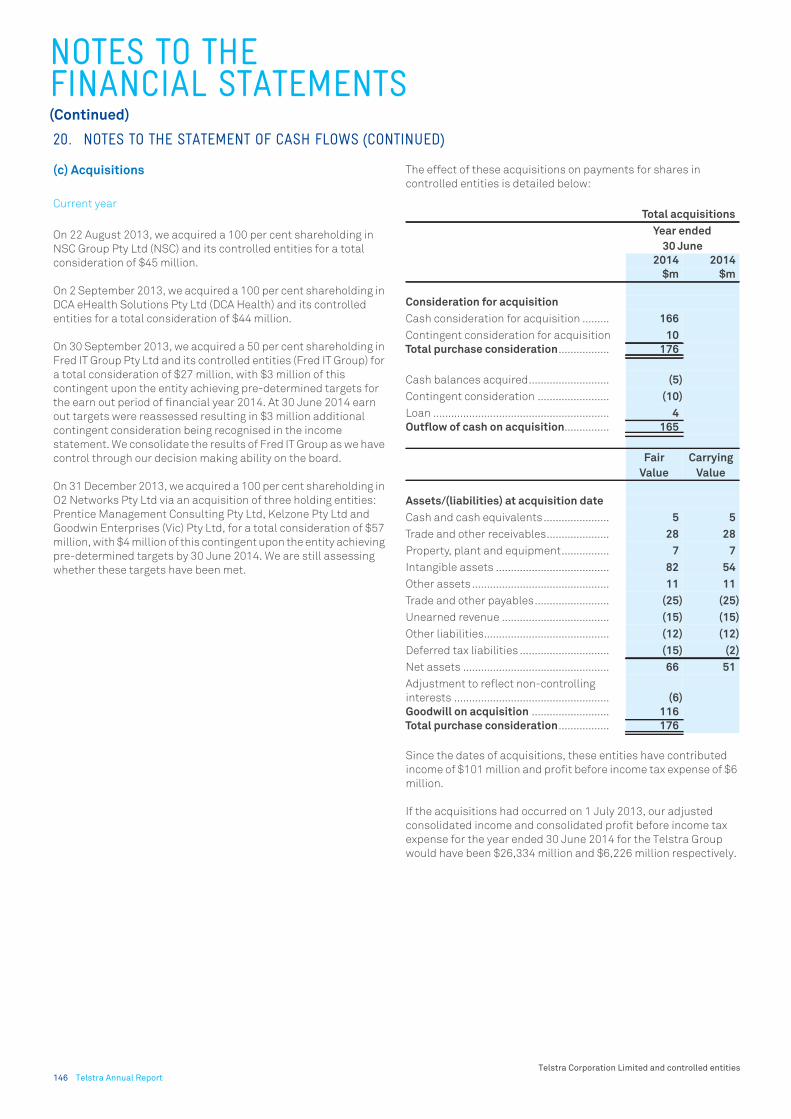
NOTES TO THE FINANCIAL STATEMENTS(Continued)
Telstra Corporation Limited and controlled entities146 Telstra Annual Report
(c) Acquisitions
Current year
On 22 August 2013, we acquired a 100 per cent shareholding in
NSC Group Pty Ltd (NSC) and its controlled entities for a total
consideration of $45 million.
On 2 September 2013, we acquired a 100 per cent shareholding in
DCA eHealth Solutions Pty Ltd (DCA Health) and its controlled
entities for a total consideration of $44 million.
On 30 September 2013, we acquired a 50 per cent shareholding in
Fred IT Group Pty Ltd and its controlled entities (Fred IT Group) for
a total consideration of $27 million, with $3 million of this
contingent upon the entity achieving pre-determined targets for
the earn out period of financial year 2014. At 30 June 2014 earn
out targets were reassessed resulting in $3 million additional
contingent consideration being recognised in the income
statement. We consolidate the results of Fred IT Group as we have
control through our decision making ability on the board.
On 31 December 2013, we acquired a 100 per cent shareholding in
O2 Networks Pty Ltd via an acquisition of three holding entities:
Prentice Management Consulting Pty Ltd, Kelzone Pty Ltd and
Goodwin Enterprises (Vic) Pty Ltd, for a total consideration of $57
million, with $4 million of this contingent upon the entity achieving
pre-determined targets by 30 June 2014. We are still assessing
whether these targets have been met.
The effect of these acquisitions on payments for shares in
controlled entities is detailed below:
Since the dates of acquisitions, these entities have contributed
income of $101 million and profit before income tax expense of $6
million.
If the acquisitions had occurred on 1 July 2013, our adjusted
consolidated income and consolidated profit before income tax
expense for the year ended 30 June 2014 for the Telstra Group
would have been $26,334 million and $6,226 million respectively.
20. NOTES TO THE STATEMENT OF CASH FLOWS (CONTINUED)
Total acquisitions
Year ended
30 June
2014 2014
$m $m
Consideration for acquisition
Cash consideration for acquisition ......... 166
Contingent consideration for acquisition 10
Total purchase consideration................. 176
Cash balances acquired........................... (5)
Contingent consideration ........................ (10)
Loan ........................................................... 4
Outflow of cash on acquisition............... 165
Fair
Value
Carrying
Value
Assets/(liabilities) at acquisition date
Cash and cash equivalents...................... 5 5
Trade and other receivables..................... 28 28
Property, plant and equipment................ 7 7
Intangible assets ...................................... 82 54
Other assets .............................................. 11 11
Trade and other payables......................... (25) (25)
Unearned revenue .................................... (15) (15)
Other liabilities.......................................... (12) (12)
Deferred tax liabilities .............................. (15) (2)
Net assets ................................................. 66 51
Adjustment to reflect non-controlling
interests .................................................... (6)
Goodwill on acquisition .......................... 116
Total purchase consideration................. 176

NOTES TO THE FINANCIAL STATEMENTS(Continued)
Financial Report
Telstra Corporation Limited and controlled entitiesTelstra Annual Report 147
(c) Acquisitions (continued)
The following transactions affected cash flows from financing
activities:
On 4 November 2013, Telstra Holdings Pty Ltd acquired an
additional 2.8 per cent interest in Autohome Inc. from minority
shareholders for total consideration of $60 million. At the same
time Autohome Inc. completed a share buy-back from minority
shareholders for total consideration of $84 million. The combined
effect of the two transactions increased Telstra Holdings Pty Ltd
ownership in Autohome Inc. from 66.0 per cent at 30 June 2013 to
71.5 per cent immediately prior to the initial public offering (IPO).
Following this, on 11 December 2013 Autohome Inc. was listed on
the New York Stock Exchange with gross proceeds to Autohome
Inc. of $160 million (US$142 million). Immediately following the
IPO, our ownership interest decreased from 71.5 per cent to 65.4
per cent. Our ownership interest further decreased to 63.2 per
cent at 30 June 2014 resulting from employee share issues.
On 10 December 2013, Telstra Octave Holdings Limited acquired
the remaining 33 per cent interest in Octave Investments Holdings
Limited for a total consideration of $5 million, including $1 million
of cash disposed, in exchange for selling the net assets of the five
variable interest entities controlled by Sharp Point Group Limited.
Refer to note 25 for further details.
Prior year
iVision
iVision Pty Ltd (iVision) was acquired on 31 March 2011 for a total
consideration of $41 million, with $5 million of this contingent
upon the entity achieving pre-determined integration targets by
31 December 2012.
On 7 September 2012, Telstra Corporation Ltd paid the $5 million
contingent consideration for the successful integration of iVision.
TrueLocal
On 29 April 2013, our controlled entity Sensis Pty Ltd acquired 100
per cent of the issued capital of Australian Local Search Pty Ltd
(TrueLocal) for net consideration of $4 million.
Telstra Technology Services
On 18 June 2013, Telstra Holdings Pty Ltd acquired an additional
25 per cent in Telstra Technology Services (Hong Kong) Limited for
a purchase consideration of $1 million, increasing its ownership
from 75 per cent to 100 per cent.
(d) Disposals
Current year
Sensis Group and CSL Group
On 28 February 2014, we divested 70 per cent of our directories
business via disposal of our 100 per cent shareholding in Sensis
Pty Ltd and its controlled entities (Sensis Group) for total
consideration of $454 million and acquisition of 30 per cent of
Project Sunshine I Pty Ltd, the new holding company of Sensis Pty
Ltd and its controlled entities. The Sensis Group was classified as
a discontinued operation and, on the re-measurement of assets of
the disposal group, the carrying value of its goodwill was impaired
by $150 million. Refer to note 12 for further details and financial
information on the disposal of the Sensis Group.
On 20 December 2013, we signed an agreement with HKT Limited
to dispose of our entire 76.4 per cent shareholding in CSL New
World Mobility Limited and its controlled entities (CSL Group) and,
in accordance with AASB 5: “Non Current Assets Held for Sale and
Discontinued Operations”, the carrying value of assets and
liabilities of the CSL Group, with the exception of the cash
balances (which will be recovered via the completion
adjustments), were classified as held for sale as at 31 December
2013 and measured at the lower of carrying amount and fair value
less costs to sell. Completion occurred on 14 May 2014. The effect
of the disposal, subject to completion audit is detailed below:
Unlike the Sensis Group, the CSL Group does not meet the criteria
of a discontinued operation under AASB 5.
20. NOTES TO THE STATEMENT OF CASH FLOWS (CONTINUED)
CSL Group
Year ended
30 June 2014
$m
Consideration on disposal
Cash consideration on disposal ........................... 2,107
Cash and cash equivalents disposed .................. (164)
Total inflow of cash on disposal .......................... 1,943
Contingent consideration ..................................... 33
Total consideration on disposal .......................... 1,976
Assets/(liabilities) at disposal date
Assets classified as held for sale (including cash
disposed) ................................................................ 1,957
Liabilities classified as held for sale.................... (473)
Net assets classified as held for sale .................. 1,484
Foreign currency translation reserve disposed
(net of income tax) ................................................. 287
Adjustments for non-controlling interests.......... (198)
Other adjustments ................................................ 6
Profit on disposal.................................................. 561

NOTES TO THE FINANCIAL STATEMENTS(Continued)
Telstra Corporation Limited and controlled entities148 Telstra Annual Report
(d) Disposals (continued)
Prior year
TelstraClear
On 31 October 2012, our controlled entity Telstra New Zealand
Holdings Limited sold its 100 per cent shareholding in
TelstraClear Limited and its controlled entity (TelstraClear). The
effect of the disposal is detailed below:
20. NOTES TO THE STATEMENT OF CASH FLOWS (CONTINUED)
TelstraClear
Year ended
30 June 2013
$m
Consideration on disposal
Cash consideration on disposal ............................. 680
Cash and cash equivalents disposed..................... (11)
Total inflow of cash on disposal ............................ 669
Assets/(liabilities) at disposal date
Assets classified as held for sale (including cash
disposed) .................................................................. 772
Liabilities classified as held for sale...................... (98)
Net assets classified as held for sale .................... 674
Foreign currency translation reserve disposed
(net of income tax) ................................................... 130
Other adjustments................................................... 3
Loss on disposal...................................................... (127)

NOTES TO THE FINANCIAL STATEMENTS(Continued)
Financial Report
Telstra Corporation Limited and controlled entitiesTelstra Annual Report 149
Cash generating units
For the purposes of undertaking our impairment testing, we
identify cash generating units (CGUs). Our CGUs are determined
according to the smallest group of assets that generate cash
inflows that are largely independent of the cash inflows from other
assets or groups of assets.
The carrying amount of goodwill has been allocated to the CGUs as
detailed below:
(*) These CGUs operate in overseas locations, therefore the
goodwill allocated to these CGUs will fluctuate in line with
movements in applicable foreign exchange rates during the
period.
(a) Goodwill allocated to the CSL New World Group CGU (included
in the Telstra International Group (TIG) reportable segment) arises
on consolidation of CSL New World Mobility Limited and its
controlled entities (CSL Group). CSL Group was disposed of on 14
May 2014. Refer to note 20 for further details.
(b) Goodwill allocated to the Sensis Group and Location Navigation
CGUs (included in the “All Other” category in our segments) relates
to the Sensis advertising and directories business. On 28 February
2014, we divested 70 per cent of that business via disposal of our
100 per cent shareholding in Sensis Pty Ltd and its controlled
entities (Sensis Group) for total consideration of $454 million and
acquisition of 30 per cent of Project Sunshine I Pty Ltd, the new
holding company of the Sensis Group. The Sensis Group was
classified as a discontinued operation and, on the re-
measurement of assets of the disposal group, the carrying
amount of the Sensis Group goodwill was impaired by $150
million. Refer to note 12 for further details.
(c) As at 30 June 2014, the assets and liabilities of Sequel Media
Inc. and its controlled entities (Sequel Media Group) were
classified as held for sale and measured at the lower of carrying
amount and fair value less costs to sell. This resulted in an
impairment charge of $12 million against goodwill being
recognised in the Telstra Group financial statements. Goodwill
allocated to the Sequel Media CGU (included in the TIG reportable
segment) related to Sequel Media Inc. Refer to note 12 for further
details.
(d) On 31 December 2013, we acquired a 100 per cent
shareholding in O2 Networks Pty Ltd via an acquisition of three
holding entities: Prentice Management Consulting Pty Ltd,
Kelzone Pty Ltd and Goodwin Enterprises (Vic) Pty Ltd (O2
Networks Group). Refer to note 20 for further details.
(e) On 2 September 2013, we acquired a100 per cent shareholding
in DCA eHealth Solutions Pty Ltd and its controlled entities (DCA
Health Group). Refer to note 20 for further details.
(f) On 30 September 2013, we acquired a 50 per cent shareholding
in Fred IT Group Pty Ltd and its controlled entities (Fred IT Group).
Refer to note 20 for further details.
(g) The Telstra Enterprise & Services Group includes goodwill from
past acquisitions integrated into our business. On 22 August 2013,
we acquired a100 per cent shareholding in NSC Group Pty Ltd and
its controlled entities (NSC Group) which is also included in this
CGU. Refer to note 20 for further details.
Ubiquitous telecommunications network and Hybrid Fibre Coaxial
(HFC) cable network
In addition to the aforementioned CGUs, we have two further
significant CGUs that are reviewed for impairment. These are:
• the Telstra Entity CGU, excluding the HFC cable network
• the CGU comprising the HFC cable network.
The Telstra Entity CGU consists of our ubiquitous
telecommunications network in Australia, excluding the HFC
cable network as we consider it not to be integrated with the rest
of our telecommunications network. Assets that form part of the
ubiquitous telecommunications network, comprising the
customer access network and the core network, are considered to
be working together to generate our cash inflows. No one item of
telecommunications equipment is of any value without the other
assets to which it is connected in order to achieve delivery of our
products and services.
Impairment testing
Our impairment testing compares the carrying amount of an
individual asset or CGU with its recoverable amount as
determined using a value in use calculation, with the exception of
Autohome whose recoverable amount was determined using fair
value less cost of disposal as an observable market price is
available for Autohome following its listing on the New York Stock
Exchange.
21. IMPAIRMENT
Goodwill
As at 30 June
2014 2013$m $m
CGUs
CSL New World Group (a) ............................. - 860
Telstra UK Group (*) ...................................... 65 60
Sensis Group (b) ............................................ - 216
Location Navigation (b)................................. - 14
1300 Australia Group.................................... 16 16
Autohome (*) ................................................. 108 108
Sequel Media (c) ........................................... - 13
O2 Networks Group (d) ................................. 47 -
DCA Health Group (e) .................................... 16 -
Fred IT Group (f)............................................. 21 -
Telstra Enterprise & Services Group (g) ...... 122 95
395 1,382

NOTES TO THE FINANCIAL STATEMENTS(Continued)
Telstra Corporation Limited and controlled entities150 Telstra Annual Report
Impairment testing (continued)
Our assumptions for determining the recoverable amount using
value in use of each asset and CGU are based on past experience
and our expectations for the future. Our cash flow projections are
based on a maximum five year management approved forecasts.
These forecasts use management estimates to determine income,
expenses, capital expenditure and cash flows for each asset and
CGU.
We have used the following key assumptions in determining the
recoverable amount of our CGUs to which goodwill or indefinite
useful life intangible assets have been allocated:
(h) Discount rate represents the pre tax discount rate applied to
the cash flow projections. The discount rate reflects the market
determined, risk adjusted discount rate which is adjusted for
specific risks relating to the CGU and the countries in which it
operates.
(i) Terminal value growth rate represents the growth rate applied
to extrapolate our cash flows beyond the five year forecast period.
These growth rates are based on our expectation of the CGUs’ long
term performance in their respective markets.
The value in use calculations are sensitive to changes in discount
rates, earnings and foreign exchange rates varying from the
assumptions and forecast data used in the impairment testing. As
such, sensitivity analysis was undertaken to examine the effect of
a change in a variable on each CGU. The discount rate would need
to increase by 382 basis points (2013: 480 basis points) or the
terminal value growth rate would need to be negative growth of 2.1
per cent (2013: negative 3.5 per cent) before the recoverable
amount of any of the CGUs would be equal to the carrying value.
(j) As at 30 June 2014, following the Autohome Inc. listing on 11
December 2013 (refer to note 20 for further details), the
recoverable amount calculation for this CGU was based on fair
value less cost of disposal measured with reference to quoted
market prices in an active market (Level 1) (2013: recoverable
amount based on value in use). Our assumption for determining
the fair value less cost of disposal for the Autohome CGU was
based on the New York Stock Exchange 30 June 2014 closing
share price of US$34.43, which represented a quoted price in an
active market. Telstra holds 68,788,940 shares valued at
US$2,368 million (A$2,514 million).
Ubiquitous telecommunications network and Hybrid Fibre Coaxial
(HFC) cable network (“the networks”)
Our discounted expected future cash flows more than support the
carrying amount of the networks. This is based on:
• forecast cash flows from continuing to:
- use the core network
- provide Pay TV services via the HFC cable network into the
future
• the consideration we expect to receive under the National
Broadband Network (NBN) Definitive Agreements (DAs) for:
- the progressive disconnection of copper-based Customer
Access Network services and broadband services on our HFC
cable network (excluding Pay TV services on the HFC cable
network) provided to premises in the NBN fibre footprint
- providing access to certain infrastructure, including dark
fibre links, exchange rack spaces and ducts
- the sale of lead-in-conduits.
Given this, the results of our impairment testing for the networks
show that the carrying amounts are recoverable at 30 June 2014.
Although renegotiations have commenced between us and the
Commonwealth Government it is still uncertain as to what the
outcomes of any renegotiations will be. Based on the current
status of these renegotiations we are not aware of any basis under
which we would anticipate any renegotiated agreements would
give rise to any material impairment of our networks.
21. IMPAIRMENT (CONTINUED)
Discount rate
(h)
Terminal value
growth rate (i)
As at 30 June As at 30 June
2014 2013 2014 2013% % % %
CSL New World Group.......... n/a 11.6 n/a 2.0
Telstra UK Group .................. 8.1 8.0 3.0 3.0
Sensis Group ........................ n/a 15.9 n/a 3.0
Location Navigation............. n/a 12.3 n/a 3.0
1300 Australia Group........... 11.7 12.6 3.0 3.0
Autohome (j) ......................... n/a 19.8 n/a 5.0
Sequel Media ....................... n/a 20.0 n/a 5.0
O2 Networks Group.............. 12.4 n/a 3.0 n/a
DCA Health Group ................ 11.7 n/a 3.0 n/a
Fred IT Group........................ 11.5 n/a 3.0 n/a
Telstra Enterprise & Services
Group .................................... 14.3 n/a 3.0 n/a

NOTES TO THE FINANCIAL STATEMENTS(Continued)
Financial Report
Telstra Corporation Limited and controlled entitiesTelstra Annual Report 151
(a) This includes the Telstra Entity capital expenditure
commitments of $847 million (2013: $1,222 million). Refer to note
30 for further details.
(b) This includes commitments of $1,302 million (2013: $1,302
million) for the 700MHz and 2.5GHz spectrum licences won at
auction, with the payments due in financial year 2015.
Description of our operating leases
We have operating leases for the following types of assets:
• rental of land and buildings
• rental of motor vehicles, caravan huts and trailers, mechanical
aids and heavy excavation equipment
• rental of personal computers, laptops, printers and other
related equipment that are used in non communications plant
activities.
The weighted average lease term is:
• 16 years for land and buildings
• 2 years for motor vehicles, 4 to 5 years for light commercial
vehicles, and 7 to 12 years for trucks and mechanical aids and
heavy excavation equipment
• 3 years for personal computers and related equipment.
The majority of our operating leases relate to land and buildings.
We have several subleases with total minimum lease payments of
$39 million (2013: $15 million) for the Telstra Group. Our property
operating leases generally contain escalation clauses, which are
fixed increases generally between 3 and 5 per cent, or increases
subject to the consumer price index or market rate. We do not have
any significant purchase options.
22. EXPENDITURE COMMITMENTS
Telstra Group
As at 30 June
2014 2013
$m $m
Capital expenditure commitments
Total capital expenditure commitments contracted for at balance date but not
recorded in the financial statements:
Property, plant and equipment commitments (a) ............................................................................................ 880 1,272
Intangible assets commitments (b) ................................................................................................................... 1,350 1,524
Operating lease commitments
Future lease payments for non-cancellable operating leases not recorded in the
financial statements:
Within 1 year........................................................................................................................................................... 476 502
Within 1 to 5 years.................................................................................................................................................. 1,273 1,301
After 5 years ........................................................................................................................................................... 1,029 1,175
2,778 2,978
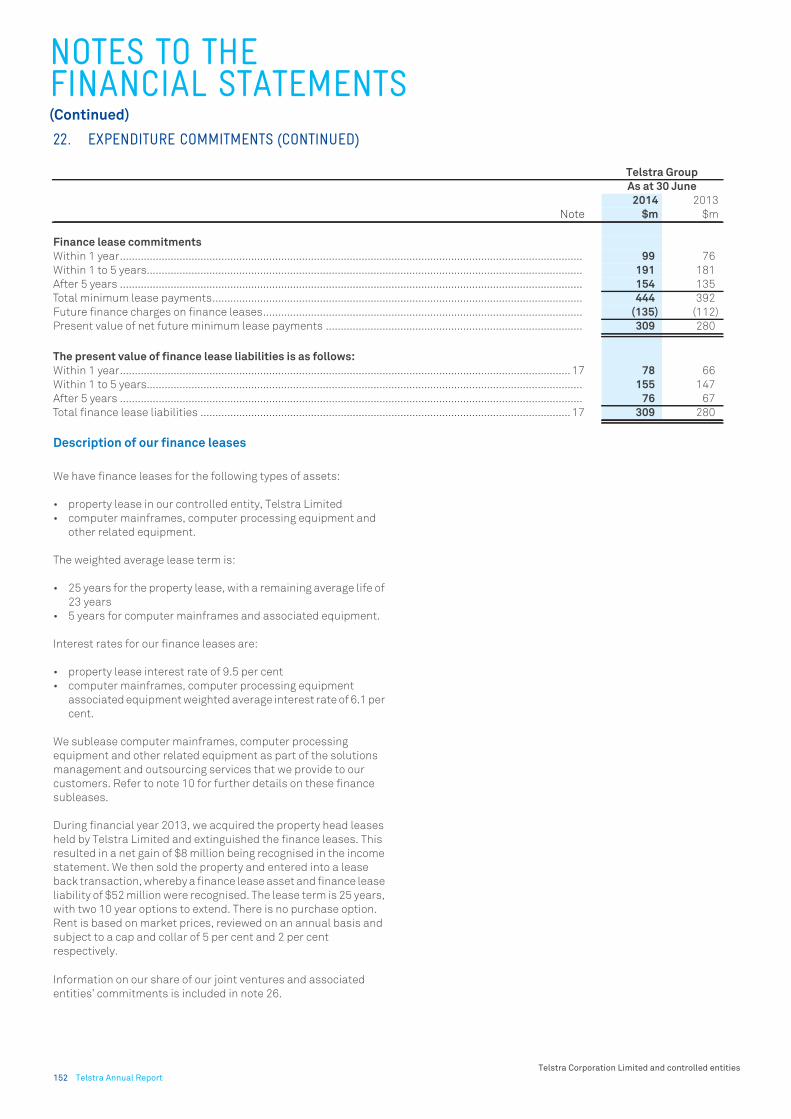
NOTES TO THE FINANCIAL STATEMENTS(Continued)
Telstra Corporation Limited and controlled entities152 Telstra Annual Report
Description of our finance leases
We have finance leases for the following types of assets:
• property lease in our controlled entity, Telstra Limited
• computer mainframes, computer processing equipment and
other related equipment.
The weighted average lease term is:
• 25 years for the property lease, with a remaining average life of
23 years
• 5 years for computer mainframes and associated equipment.
Interest rates for our finance leases are:
• property lease interest rate of 9.5 per cent
• computer mainframes, computer processing equipment
associated equipment weighted average interest rate of 6.1 per
cent.
We sublease computer mainframes, computer processing
equipment and other related equipment as part of the solutions
management and outsourcing services that we provide to our
customers. Refer to note 10 for further details on these finance
subleases.
During financial year 2013, we acquired the property head leases
held by Telstra Limited and extinguished the finance leases. This
resulted in a net gain of $8 million being recognised in the income
statement. We then sold the property and entered into a lease
back transaction, whereby a finance lease asset and finance lease
liability of $52 million were recognised. The lease term is 25 years,
with two 10 year options to extend. There is no purchase option.
Rent is based on market prices, reviewed on an annual basis and
subject to a cap and collar of 5 per cent and 2 per cent
respectively.
Information on our share of our joint ventures and associated
entities’ commitments is included in note 26.
22. EXPENDITURE COMMITMENTS (CONTINUED)
Telstra Group
As at 30 June
2014 2013
Note $m $m
Finance lease commitments
Within 1 year........................................................................................................................................................... 99 76
Within 1 to 5 years.................................................................................................................................................. 191 181
After 5 years ........................................................................................................................................................... 154 135
Total minimum lease payments............................................................................................................................ 444 392
Future finance charges on finance leases........................................................................................................... (135) (112)
Present value of net future minimum lease payments ...................................................................................... 309 280
The present value of finance lease liabilities is as follows:
Within 1 year....................................................................................................................................................... 17 78 66
Within 1 to 5 years.................................................................................................................................................. 155 147
After 5 years ........................................................................................................................................................... 76 67
Total finance lease liabilities ............................................................................................................................ 17 309 280

NOTES TO THE FINANCIAL STATEMENTS(Continued)
Financial Report
Telstra Corporation Limited and controlled entitiesTelstra Annual Report 153
We have no significant contingent assets as at 30 June 2014. The
details and maximum amounts (where reasonable estimates can
be made) are set out below for our contingent liabilities.
Telstra Entity
Refer to note 30 for Telstra Entity contingent liabilities.
Other
Other contingent liabilities identified for the Telstra Group are as
follows:
ASIC deed of cross guarantee
A list of the companies that are part of our deed of cross guarantee
appear in note 25. Each of these companies (except Telstra
Finance Limited) guarantees the payment in full of the debts of the
other named companies in the event of their winding up. Refer to
note 25 for further details.
23. CONTINGENT LIABILITIES AND CONTINGENT ASSETS

NOTES TO THE FINANCIAL STATEMENTS(Continued)
Telstra Corporation Limited and controlled entities154 Telstra Annual Report
We participate in or sponsor defined benefit and defined
contribution schemes. It is our policy to contribute to the schemes
at rates specified in the governing rules for defined contribution
schemes or at rates determined by the actuaries for defined
benefit schemes.
The defined contribution divisions receive fixed contributions and
our legal or constructive obligation is limited to these
contributions.
The present value of our obligations for the defined benefit plans
is calculated by an actuary using the projected unit credit method.
This method determines each year of service as giving rise to an
additional unit of benefit entitlement and measures each unit
separately to calculate the final obligation.
Details of the defined benefit plans we participate in are set out
below.
Telstra Superannuation Scheme (Telstra Super)
The Telstra Entity participates in Telstra Super, a regulated fund in
accordance with Superannuation Industry Supervision Act
governed by the Australian Prudential Regulatory Authority.
Responsibility for governance of the plan, including investment
decisions and plan rules, rests solely with the board of directors of
Telstra Super. Contribution levels are determined by Telstra after
obtaining the advice of the actuary and consulting with the
Trustee. The board of directors comprises of an equal number of
member and employer representatives and an independent chair.
Telstra Super has both defined benefit and defined contribution
divisions. The defined benefit divisions of Telstra Super which are
closed to new members provide benefits based on years of service
and final average salary paid as a lump sum. Post employment
benefits do not include payments for medical costs.
Contribution levels made to the defined benefit divisions are
designed to ensure that benefits accruing to members and
beneficiaries are fully funded as the benefits fall due. The benefits
received by members of each defined benefit division take into
account factors such as each employee’s length of service, final
average salary and employer and employee contributions.
An actuarial investigation of this scheme is carried out at least
every three years.
Telstra Super is exposed to Australia’s inflation, credit risk,
liquidity risk and market risk. Market risk includes interest rate
risk, equity price risk and foreign currency risk. The strategic
investment policy of the fund is to build a diversified portfolio of
assets across equities, alternative investments, fixed interest
securities and cash to generate sufficient growth to match the
projected liabilities of the defined benefit plan while providing
appropriate liquidity to meet the expected timing of such
liabilities, in line with the fund’s actuarial reviews.
On 28 February 2014, we divested 70 per cent of our directories
business via disposal of our 100 per cent shareholding in Sensis
Pty Ltd and its controlled entities (Sensis Group) and acquisition
of 30 per cent of Project Sunshine I Pty Ltd, the new holding
company of the Sensis Group. Employees of the Sensis Group will
remain within Telstra Super following the disposal of the Sensis
Group. Sensis Pty Ltd will continue to contribute to the fund on
behalf of its employees at the rate required under the trust deed in
line with actuarial recommendations. Sensis Pty Ltd has no
interest in the defined benefit asset that may exist in the future
upon wind up of the plan. We have no remaining contributions or
other financial obligations in regards to the Sensis Group
employees who remained in Telstra Super.
Following the disposal of the Sensis Group we account for our
proportionate share of assets, liabilities and costs of our defined
benefit division and continue to account for our contributions to
the defined contribution divisions.
CSL Limited (CSL) Retirement Scheme
On 14 May 2014, we disposed of our entire 76.4 per cent
shareholding in CSL New World Mobility Limited and its controlled
entities (CSL Group), including CSL Limited. Refer to note 20 for
further details.
CSL Limited (CSL) participated in a superannuation scheme
known as the CSL Retirement Scheme. This scheme was
established under the Occupational Retirement Schemes
Ordinance and is administered by an independent trustee. The
scheme had three defined benefit sections and one defined
contribution section. Actuarial assessments were undertaken
annually for this scheme. The benefits received by members of the
defined benefit schemes were based on each employee’s
remuneration and length of service.
Following the disposal of the CSL Group on 14 May 2014, we have
no remaining contributions or other financial obligations to the
CSL Retirement Scheme.
Measurement dates
For Telstra Super, actual membership data as at 30 April was used
to value the defined obligations as at that date. Details of assets,
benefit payments and other cash flows as at 31 May were also
used in relation to Telstra Super. These April and May figures were
then rolled forward to 30 June to allow for changes in the
membership and actual asset return. Contributions as at 30 June
were used in relation to the defined benefit and defined
contribution divisions.
Asset values as at 30 April 2014 (2013: 30 June) were used to
measure the defined benefit asset prior to disposal of the CSL
Retirement Scheme. Details of membership data, contributions,
benefit payments and other cash flows as at 30 April 2014 (2013:
30 June) were also used in the valuation.
The fair value of the defined benefit plan assets and the present
value of the defined benefit obligations are determined by our
actuaries. The details of the defined benefit divisions are set out in
the following pages.
24. POST EMPLOYMENT BENEFITS

NOTES TO THE FINANCIAL STATEMENTS(Continued)
Financial Report
Telstra Corporation Limited and controlled entitiesTelstra Annual Report 155
(a) Net defined benefit plan asset/(liability) - historical
summary
Our net defined benefit plan asset/(liability) recognised in the
statement of financial position for the current and previous
periods is determined as follows:
(b) Reconciliation of changes in fair value of defined
benefit plan assets
The actual return on defined benefit plan assets was 10.6 per cent
(2013: 15.5 per cent) for Telstra Super and 3.7 per cent to the date
of disposal (2013: 10.2 per cent) for the CSL Retirement Scheme.
24. POST EMPLOYMENT BENEFITS (CONTINUED)
Telstra Group
As at 30 June
2014 2013 2012 2011 2010
$m $m $m $m $m
Fair value of defined benefit plan assets (b) .......................................................... 2,953 2,944 2,559 2,599 2,546
Present value of the defined benefit obligation (c) ................................................ 2,909 2,983 3,390 2,793 3,003
Net defined benefit asset/(liability) at 30 June ................................................... 44 (39) (831) (194) (457)
Comprised of:
Net defined benefit asset/(liability) attributable to Telstra Super Scheme ......... 44 (42) (825) (205) (464)
Net defined benefit asset/(liability) attributable to CSL Limited Retirement
Scheme ....................................................................................................................... n/a 3 (6) 11 7
44 (39) (831) (194) (457)
Telstra Group
As at 30 June
Restated
2014 2013
$m $m
Fair value of defined benefit plan assets at beginning of year....................................................................... 2,944 2,559
Employer contributions......................................................................................................................................... 86 145
Member contributions........................................................................................................................................... 44 66
Benefits paid (including contributions tax) (i) ..................................................................................................... (331) (266)
Plan expenses after tax......................................................................................................................................... (19) (23)
Foreign currency exchange differences ............................................................................................................... - 6
Interest income on plan assets ............................................................................................................................ 106 96
Actual asset gain ................................................................................................................................................... 206 361
Disposal through sale of controlled entities ....................................................................................................... (83) -
Fair value of defined benefit plan assets at end of year ................................................................................. 2,953 2,944

NOTES TO THE FINANCIAL STATEMENTS(Continued)
Telstra Corporation Limited and controlled entities156 Telstra Annual Report
(c) Reconciliation of changes in the present value of the
wholly funded defined benefit obligation
(i) Benefits paid include $315 million (2013: $230 million) of
entitlements to existing defined benefit members which have
been retained in Telstra Super and transferred to the defined
contribution scheme. For financial year 2015, total benefit
payments expected to be paid are $344 million (including benefits
retained and transferred to the defined contribution scheme).
(d) Amounts recognised in the income statement and in
other comprehensive income
24. POST EMPLOYMENT BENEFITS (CONTINUED)
Telstra Group
As at 30 June
Restated
2014 2013
$m $m
Present value of defined benefit obligation at beginning of year .................................................................. 2,983 3,390
Current service cost............................................................................................................................................... 131 146
Interest cost ........................................................................................................................................................... 116 120
Member contributions........................................................................................................................................... 15 36
Benefits paid (i) ...................................................................................................................................................... (331) (266)
Actuarial loss/(gain) due to change in financial assumptions........................................................................... 123 (343)
Actuarial loss due to change in demographic assumptions .............................................................................. - 6
Actuarial (gain) due to experience........................................................................................................................ (34) (96)
Curtailment loss .................................................................................................................................................... (14) (17)
Foreign currency exchange differences ............................................................................................................... - 7
Disposal through sale of controlled entities ....................................................................................................... (80) -
Present value of wholly funded defined benefit obligation at end of year ................................................... 2,909 2,983
Telstra Group
Year ended 30 June
Restated
2014 2013
Note $m $m
Components of the defined benefit and defined contribution plans expense recognised in the
income statement within labour expenses from continuing operations
Service cost ............................................................................................................................................................ 107 122
Employer contributions - defined contribution plan .......................................................................................... 199 183
306 305
Net interest on net defined benefit (asset)/liability ......................................................................................... 7 10 24
Total expense from continuing operations recognised in the income statement ....................................... 316 329
Actuarial gain recognised directly in other comprehensive income.................................................................. 117 784
Cumulative actuarial gains/(losses) recognised directly in other comprehensive income............................. 79 (38)

NOTES TO THE FINANCIAL STATEMENTS(Continued)
Financial Report
Telstra Corporation Limited and controlled entitiesTelstra Annual Report 157
(e) Categories of plan assets
The weighted average asset allocation as a percentage of the fair
value of total plan assets for defined benefit divisions as at 30
June is as follows:
(*) These assets have quoted prices in active markets.
Telstra Super’s investments in debt and equity instruments
include bonds issued by, and shares in, Telstra Corporation
Limited. Refer to note 29 for further details.
(f) Principal actuarial assumptions
We used the following major annual assumptions to determine our
defined benefit obligations for the year ended 30 June:
24. POST EMPLOYMENT BENEFITS (CONTINUED)
Telstra Super
CSL Retirement
Scheme
As at 30 June As at 30 June
2014 2013 2014 2013
% % % %
Asset allocations
Equity instruments
Australian equity (*) ............................................................................................... 14 13 n/a -
International equity (*) .......................................................................................... 15 33 n/a 53
Private equity.......................................................................................................... 8 7 n/a -
Debt instruments
Fixed Interest (*)..................................................................................................... 36 2 n/a -
Bonds (*) ................................................................................................................. - - n/a 43
Property .......................................................................................................................... 1 7 n/a -
Cash (*) ........................................................................................................................... 19 28 n/a 3
Infrastructure................................................................................................................. - 1 n/a -
International hedge funds............................................................................................. 5 6 n/a -
Opportunities (*) ............................................................................................................ 2 3 n/a 1
100 100 n/a 100
Telstra Super
CSL Retirement
Scheme
Year ended 30 June Year ended 30 June
2014 2013 2014 2013
% % % %
Discount rate (i) ............................................................................................................. 3.7 4.2 n/a 2.1
Expected rate of increase in future salaries (ii).......................................................... 3.5 3.5 n/a 4.0 - 6.0
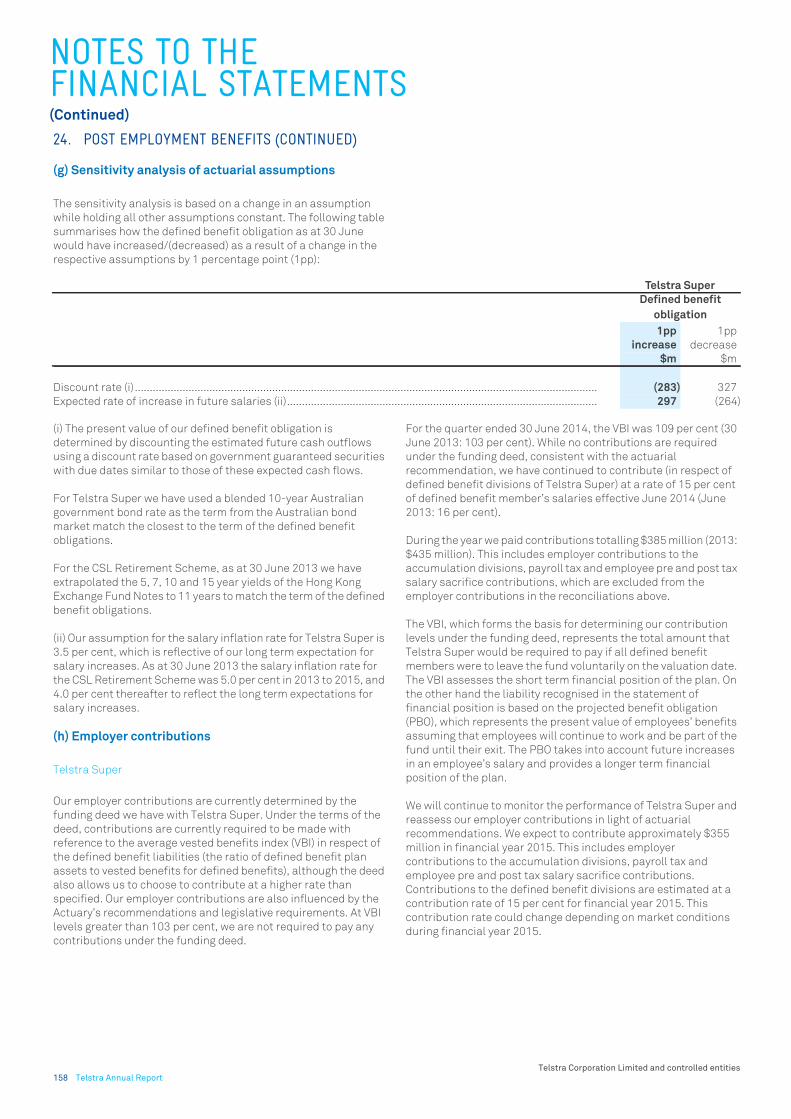
NOTES TO THE FINANCIAL STATEMENTS(Continued)
Telstra Corporation Limited and controlled entities158 Telstra Annual Report
(g) Sensitivity analysis of actuarial assumptions
The sensitivity analysis is based on a change in an assumption
while holding all other assumptions constant. The following table
summarises how the defined benefit obligation as at 30 June
would have increased/(decreased) as a result of a change in the
respective assumptions by 1 percentage point (1pp):
(i) The present value of our defined benefit obligation is
determined by discounting the estimated future cash outflows
using a discount rate based on government guaranteed securities
with due dates similar to those of these expected cash flows.
For Telstra Super we have used a blended 10-year Australian
government bond rate as the term from the Australian bond
market match the closest to the term of the defined benefit
obligations.
For the CSL Retirement Scheme, as at 30 June 2013 we have
extrapolated the 5, 7, 10 and 15 year yields of the Hong Kong
Exchange Fund Notes to 11 years to match the term of the defined
benefit obligations.
(ii) Our assumption for the salary inflation rate for Telstra Super is
3.5 per cent, which is reflective of our long term expectation for
salary increases. As at 30 June 2013 the salary inflation rate for
the CSL Retirement Scheme was 5.0 per cent in 2013 to 2015, and
4.0 per cent thereafter to reflect the long term expectations for
salary increases.
(h) Employer contributions
Telstra Super
Our employer contributions are currently determined by the
funding deed we have with Telstra Super. Under the terms of the
deed, contributions are currently required to be made with
reference to the average vested benefits index (VBI) in respect of
the defined benefit liabilities (the ratio of defined benefit plan
assets to vested benefits for defined benefits), although the deed
also allows us to choose to contribute at a higher rate than
specified. Our employer contributions are also influenced by the
Actuary’s recommendations and legislative requirements. At VBI
levels greater than 103 per cent, we are not required to pay any
contributions under the funding deed.
For the quarter ended 30 June 2014, the VBI was 109 per cent (30
June 2013: 103 per cent). While no contributions are required
under the funding deed, consistent with the actuarial
recommendation, we have continued to contribute (in respect of
defined benefit divisions of Telstra Super) at a rate of 15 per cent
of defined benefit member’s salaries effective June 2014 (June
2013: 16 per cent).
During the year we paid contributions totalling $385 million (2013:
$435 million). This includes employer contributions to the
accumulation divisions, payroll tax and employee pre and post tax
salary sacrifice contributions, which are excluded from the
employer contributions in the reconciliations above.
The VBI, which forms the basis for determining our contribution
levels under the funding deed, represents the total amount that
Telstra Super would be required to pay if all defined benefit
members were to leave the fund voluntarily on the valuation date.
The VBI assesses the short term financial position of the plan. On
the other hand the liability recognised in the statement of
financial position is based on the projected benefit obligation
(PBO), which represents the present value of employees’ benefits
assuming that employees will continue to work and be part of the
fund until their exit. The PBO takes into account future increases
in an employee’s salary and provides a longer term financial
position of the plan.
We will continue to monitor the performance of Telstra Super and
reassess our employer contributions in light of actuarial
recommendations. We expect to contribute approximately $355
million in financial year 2015. This includes employer
contributions to the accumulation divisions, payroll tax and
employee pre and post tax salary sacrifice contributions.
Contributions to the defined benefit divisions are estimated at a
contribution rate of 15 per cent for financial year 2015. This
contribution rate could change depending on market conditions
during financial year 2015.
24. POST EMPLOYMENT BENEFITS (CONTINUED)
Telstra Super
Defined benefit
obligation
1pp
increase
1pp
decrease
$m $m
Discount rate (i) ........................................................................................................................................................... (283) 327
Expected rate of increase in future salaries (ii)........................................................................................................ 297 (264)

NOTES TO THE FINANCIAL STATEMENTS(Continued)
Financial Report
Telstra Corporation Limited and controlled entitiesTelstra Annual Report 159
(h) Employer Contributions (continued)
The following tables shows the expected proportion of benefits
paid from the defined benefit obligation in future years:
The average duration of the defined benefit plan obligation at the
end of the reporting period is 10.1 years (2013: 10.3 years).
CSL Retirement Scheme
The contributions payable to the defined benefit divisions are
determined by the actuary using the attained age normal funding
actuarial valuation method.
(i) Other defined contribution schemes
A number of our controlled entities also participate in defined
contribution schemes that receive employer and employee
contributions based on a percentage of the employees’ salaries.
We made contributions to these schemes of $31 million (2013: $24
million).
24. POST EMPLOYMENT BENEFITS (CONTINUED)
Telstra Super
Year ended 30 June
2014 2013
% %
Less than 1 year ................................ 4 4
Between 2 and 4 years ..................... 16 15
Between 5 and 10 years ................... 23 22
Between 11 and 19 years ................. 45 45
Beyond 20 years................................ 12 14

NOTES TO THE FINANCIAL STATEMENTS(Continued)
Telstra Corporation Limited and controlled entities160 Telstra Annual Report
Below is a list of our investments in controlled entities.
25. INVESTMENTS IN CONTROLLED ENTITIES
Name of entity
Country of
incorporation
Telstra Entity’s
recorded amount of
investment (#)
% of equity held by
immediate parent
As at 30 June As at 30 June
2014 2013 2014 2013
$m $m % %
Parent entity
Telstra Corporation Limited (a) ............................................ Australia
Controlled entities
Chief Entertainment Pty Ltd ................................................ Australia - - 100.0 100.0
Muru-D Pty Ltd (f) ................................................................. Australia 3 - 100.0 -
Research Resources Pty Ltd ................................................ Australia - - 100.0 100.0
Telstra 3G Spectrum Holdings Pty Ltd ................................ Australia 302 302 100.0 100.0
Telstra Business Systems Pty Ltd (b) .................................. Australia - 50 - 100.0
Telstra Communications Limited (a) ................................... Australia 29 29 100.0 100.0
Telstra ESOP Trustee Pty Ltd................................................ Australia - - 100.0 100.0
Telstra Finance Limited (a)................................................... Australia - - 100.0 100.0
Telstra Foundation Limited (i) .............................................. Australia - - 100.0 100.0
Telstra Foundation (Philippines) Inc (f) ............................... Philippines - - 100.0 -
Telstra Growthshare Pty Ltd................................................. Australia - - 100.0 100.0
Telstra International (Aus) Limited (a) ................................. Australia 2 2 100.0 100.0
Telstra Media Pty Ltd ............................................................ Australia 393 393 100.0 100.0
Telstra Multimedia Pty Ltd (a) .............................................. Australia 2,678 2,678 100.0 100.0
Telstra OnAir Holdings Pty Ltd ............................................. Australia 478 478 100.0 100.0
Telstra Pay TV Pty Ltd (a) ...................................................... Australia - - 100.0 100.0
Telstra Plus Pty Ltd ............................................................... Australia - - 100.0 100.0
Telstra Services Solutions Holdings Limited (a) ................. Australia 303 303 100.0 100.0
Telstra Ventures Pty Ltd (a) .................................................. Australia - - 100.0 100.0
1300 Australia Pty Ltd .......................................................... Australia 20 20 85.0 85.0
• Alpha Phone Words Pty Ltd .......................................... Australia - - 100.0 100.0
DCA eHealth Solutions Pty Ltd (a)(f) .................................... Australia 44 - 100.0 -
• Argus Connecting Care Pty Ltd (f) ................................ Australia - - 100.0 -
• Communicare EHealth Solutions Pty Ltd (f) ............... Australia - - 100.0 -
• DCA Direct Health Pty Ltd (a)(f)..................................... Australia - - 100.0 -
• KCS Solutions Pty Ltd (f) ............................................... Australia - - 100.0 -
Goodwin Enterprises (Vic) Pty Ltd (a)(f)............................... Australia 16 - 100.0 -
• O2 Networks Pty Ltd (a)(f) ............................................. Australia - - 31.6 -
Kelzone Pty Ltd (a)(f)............................................................. Australia 16 - 100.0 -
• O2 Networks Pty Ltd (a)(f) ............................................. Australia - - 31.7 -
Prentice Management Consulting Pty Ltd (a)(f) ................. Australia 16 - 100.0 -
• O2 Networks Pty Ltd (a)(f) ............................................. Australia - - 31.7 -
O2 Networks Pty Ltd (a)(f).................................................... Australia 9 - 5.0 -
Network Design and Construction Limited (a) ................... Australia 20 20 100.0 100.0
• NDC Global Holdings Pty Ltd ........................................ Australia - - 100.0 100.0
• NDC Global Services Pty Ltd......................................... Australia - - 100.0 100.0
NSC Group Pty Ltd (a)(f) ........................................................ Australia 45 - 100.0 -
• NSC Enterprise Solutions Pty Ltd (a)(f)........................ Australia - - 100.0 -
• NSC NZ Limited (f).................................................... New Zealand - - 100.0 -
(continued over page)

NOTES TO THE FINANCIAL STATEMENTS(Continued)
Financial Report
Telstra Corporation Limited and controlled entitiesTelstra Annual Report 161
25. INVESTMENTS IN CONTROLLED ENTITIES (CONTINUED)
Name of entity
Country of
incorporation
Telstra Entity’s
recorded amount of
investment (#)
% of equity held by
immediate parent
As at 30 June As at 30 June
2014 2013 2014 2013
Controlled entities (continued) $m $m % %
Fred IT Group Pty Ltd (d)(e)(f) .............................................. Australia 27 - 50.0 -
• ERX Script Exchange Pty Ltd (e)(f)................................ Australia - - 100.0 -
• Fred Health Pty Ltd (e)(f) ............................................... Australia - - 100.0 -
• Fred Retail Pty Ltd (e)(f)................................................. Australia - - 100.0 -
• Pharmacy Research Network Pty Ltd (e)(f).................. Australia - - 100.0 -
Telstra iVision Pty Ltd (a) ...................................................... Australia 41 41 100.0 100.0
• Integrated Vision Pty Ltd .............................................. Australia - - 100.0 100.0
• iVision (QLD) Pty Ltd ..................................................... Australia - - 100.0 100.0
• iVision Investments Pty Ltd ......................................... Australia - - 100.0 100.0
• iVision (Unify) Pty Ltd .............................................. Australia - - 100.0 100.0
• Unify Pty Ltd .................................................................. Australia - - 100.0 100.0
Telstra Holdings Pty Ltd (a) .................................................. Australia 7,474 7,474 100.0 100.0
• Autohome Inc. (c)(d)(g)................................................... Cayman Islands - - 63.2 66.0
• Cheerbright International Holdings Limited (c) ..... British Virgin Islands - - 100.0 100.0
• Beijing Cheerbright Technologies Co. Ltd (c)..... China - - 100.0 100.0
• Autohome (Hong Kong) Limited (c) .................... Hong Kong - - 100.0 100.0
• Autohome Media Limited (c)(f) ...................... Hong Kong - - 100.0 -
• Autohome Shanghai Advertising Co. Ltd
(c)(f) ............................................................ China - - 100.0 -
• Beijing Autohome Software Co. Ltd (c)(f). China - - 100.0 -
• Beijing Autohome Technologies Co. Ltd
(c)(f) ............................................................ China - - 100.0 -
• Beijing Autohome Advertising Co. Ltd
(c)(f) ............................................................ China - - 100.0 -
• Guangzhou Autohome Advertising Co.
Ltd (c)(f) ...................................................... China - - 100.0 -
• Beijing Australia Telecommunications Technical
Consulting Services Co. Ltd .......................................... China - - 100.0 100.0
• Reach Holdings Limited (c) ........................................... Mauritius - - 100.0 100.0
• Reach Network India Private Limited (c) ................ India - - 99.9 99.9
• Reach Data Services India Private Limited (c) ....... India - - 99.9 99.9
• Sequel Media Inc. (c)(d)................................................. Cayman Islands - - 55.0 55.0
• China Topside Limited (c)......................................... British Virgin Islands - - 100.0 100.0
• Beijing Topside Technologies Co. Ltd (c) ............ China - - 100.0 100.0
• Norstar Advertising Media Holdings Limited (c).... Cayman Islands - - 100.0 100.0
• Shengtuo Shidai (Beijing) Information
Technology Co. Ltd (c) .......................................... China - - 100.0 100.0
• Union Tough Advertisement Limited (c)............. Hong Kong - - 100.0 100.0
• Haochen Shidai (Beijing) Advertisement Co.
Ltd (c)(d) .......................................................... China - - 30.0 30.0
• Telstra Asia Holdings Limited (c) .................................. British Virgin Islands - - 100.0 100.0
• Telstra Octave Holdings Limited (b)(c) .................... British Virgin Islands - - 100.0 100.0
• Octave Investments Holdings Limited (b)(c)(g) . British Virgin Islands - - 100.0 67.0
• Sharp Point Group Limited (b)(c)................... British Virgin Islands - - 100.0 100.0
• Beijing Liang Dian Shi Jian Technology
Co. Ltd (b)(c) ............................................... China - - 100.0 100.0
• Telstra Robin Holdings Limited (c) .......................... British Virgin Islands - - 100.0 100.0
(continued over page)

NOTES TO THE FINANCIAL STATEMENTS(Continued)
Telstra Corporation Limited and controlled entities162 Telstra Annual Report
25. INVESTMENTS IN CONTROLLED ENTITIES (CONTINUED)
Name of entity
Country of
incorporation
Telstra Entity’s
recorded amount of
investment (#)
% of equity held by
immediate parent
As at 30 June As at 30 June
2014 2013 2014 2013
Controlled entities (continued) $m $m % %
• Telstra Asia Limited (c) .................................................. British Virgin Islands - - 100.0 100.0
• Telstra SE Asia Holdings Limited (c) ....................... British Virgin Islands - - 100.0 100.0
• PT Reach Network Services Indonesia ............. Indonesia - - 90.0 90.0
• Telstra Asia Regional Holdings Limited (c) ............. British Virgin Islands - - 100.0 100.0
• Telstra Malaysia Sdn. Bhd. ................................ Malaysia - - 51.0 51.0
• Telstra (Thailand) Limited (d).............................. Thailand - - 49.0 49.0
• Telstra Network (Thailand) Limited .............. Thailand - - 68.0 68.0
• Telstra Network (Thailand) Limited.................... Thailand - - 32.0 32.0
• Telstra Philippines Holdings Limited (c) ............ British Virgin Islands - - 100.0 100.0
• Incomgen Holdings Inc.(d) ............................. Philippines - - 40.0 40.0
• Telstra Web Holdings Inc. ......................... Philippines - - 60.0 60.0
• Telstra Philippines Inc.......................... Philippines - - 60.0 60.0
• Telstra Philippines Inc.................................... Philippines - - 40.0 40.0
• Telstra Web Holdings Inc. .............................. Philippines - - 40.0 40.0
• Thai Cyber Web Co Limited (d)............................ Thailand - - 48.8 48.8
• Telstra Global Holdings Limited ................................... British Virgin Islands - - 100.0 100.0
• Telstra International Limited................................... Hong Kong - - 100.0 100.0
• Telstra Global Limited ................................................... United Kingdom - - 100.0 100.0
• PT Telstra Nusantara ............................................... Indonesia - - 100.0 100.0
• Telstra Limited .......................................................... United Kingdom - - 100.0 100.0
• Telstra (Cable Telecom) Limited ......................... United Kingdom - - 100.0 100.0
• Telstra (PSINet)............................................... United Kingdom - - 100.0 100.0
• Telstra (CTE) Limited ........................................... United Kingdom - - 100.0 100.0
• Cable Telecommunications Limited .................. United Kingdom - - 100.0 100.0
• PSINet Datacentre UK Limited........................... United Kingdom - - 100.0 100.0
• Inteligen Communications Limited.................... United Kingdom - - 100.0 100.0
• PSINet Jersey Limited......................................... Jersey - - 100.0 100.0
• PSINet Hosting Centre Limited .......................... Jersey - - 100.0 100.0
• Cordoba Holdings Limited .................................. Jersey - - 100.0 100.0
• London Hosting Centre Limited ......................... Jersey - - 100.0 100.0
• Telstra Holdings (Bermuda) No 1 Limited ................... Bermuda - - 100.0 100.0
• Telstra Holdings (Bermuda) No. 2 Limited................... Bermuda - - 100.0 100.0
• CSL New World Mobility Limited (h)........................ Bermuda - - - 76.4
• New World PCS Holdings Limited (h) ................. Cayman Islands - - - 100.0
• CSL Limited (h) ............................................... Hong Kong - - - 100.0
• Hong Kong CSL Limited (h) ....................... Hong Kong - - - 100.0
• Big Bang Holdings Limited (h) .................. Hong Kong - - - 100.0
• One2Free PersonalCom Limited (h) ......... Hong Kong - - - 100.0
• Integrated Business Systems Limited (h) Hong Kong - - - 100.0
• New World PCS Limited (h)....................... Hong Kong - - - 100.0
• New World Mobility Limited (h) ................ Hong Kong - - - 60.0
• New World 3G Limited (h) .............................. Hong Kong - - - 100.0
(continued over page)

NOTES TO THE FINANCIAL STATEMENTS(Continued)
Financial Report
Telstra Corporation Limited and controlled entitiesTelstra Annual Report 163
25. INVESTMENTS IN CONTROLLED ENTITIES (CONTINUED)
Name of entity
Country of
incorporation
Telstra Entity’s
recorded amount of
investment (#)
% of equity held by
immediate parent
As at 30 June As at 30 June
2014 2013 2014 2013
Controlled entities (continued) $m $m % %
• Telstra Holdings Singapore Pte. Ltd (f) ........................ Singapore - - 100.0 -
• Telstra Inc....................................................................... United States - - 100.0 100.0
• Telstra India (Private) Limited (c).................................. India - - 100.0 100.0
• Telstra International HK Limited .................................. Hong Kong - - 100.0 100.0
• Telstra International Holdings Limited ........................ Bermuda - - 100.0 100.0
• Telstra International Philippines Inc............................ Philippines - - 100.0 100.0
• Telstra International PNG Limited (c) .......................... Papua New Guinea - - 100.0 100.0
• Telstra Japan K. K.......................................................... Japan - - 100.0 100.0
• Telstra Network Services NZ Limited .......................... New Zealand - - 100.0 100.0
• Telstra New Zealand Holdings Limited (b)................... New Zealand - - - 100.0
• Telstra NZ Limited ......................................................... New Zealand - - 100.0 100.0
• Telstra Services Korea Limited..................................... Republic of Korea - - 100.0 100.0
• Telstra Singapore Pte. Ltd............................................. Singapore - - 100.0 100.0
• Telstra Technology Services (Hong Kong) Limited ...... Hong Kong - - 100.0 100.0
• Telstra Telecommunications Private Limited (c) ......... India - - 74.0 74.0
• Willoughby (602) Limited .............................................. United Kingdom - - 100.0 100.0
Sensis Pty Ltd (a)(h) .............................................................. Australia - 851 - 100.0
• Location Navigation Pty Ltd (h) .................................... Australia - - - 100.0
• Life Events Media Pty Ltd (h) ........................................ Australia - - - 100.0
• CitySearch Australia Pty Ltd (h).................................... Australia - - - 100.0
• Australian Local Search Pty Ltd (h) .............................. Australia - - - 100.0
• Sensis Holdings Pty Ltd (a)(h)....................................... Australia - - - 100.0
• Telstra Sensis (Beijing) Co. Ltd (b) ................................ China - - - 100.0
Investment in controlled entities......................................... 11,916 12,641
Allowance for impairment in value...................................... (7,635) (8,190)
Total investment in controlled entities................................ 4,281 4,451
(#) The amounts recorded are before any provision for reduction in value.

NOTES TO THE FINANCIAL STATEMENTS(Continued)
Telstra Corporation Limited and controlled entities164 Telstra Annual Report
(a) ASIC deed of cross guarantee financial information
A deed of cross guarantee, as defined in ASIC Class Order 98/1418
(Class Order), was entered into on 17 May 2010.
The following entities form part of the deed of cross guarantee:
• Telstra Corporation Limited
• Telstra Multimedia Pty Ltd
• Telstra International (Aus) Limited
• Telstra Pay TV Pty Ltd
• Telstra Ventures Pty Ltd
• Telstra iVision Pty Ltd
• Telstra Communications Limited
• Telstra Holdings Pty Ltd
• Network Design and Construction Limited
• Telstra Services Solutions Holdings Limited
• NSC Group Pty Ltd
• NSC Enterprise Solutions Pty Ltd
• DCA eHealth Solutions Pty Ltd
• DCA Direct Health Pty Ltd
• Kelzone Pty Ltd
• Goodwin Enterprises (Vic) Pty Ltd
• Prentice Management Consulting Pty Ltd
• O2 Networks Pty Ltd.
The following entities were added via an assumption deed on 26
June 2014:
• NSC Group Pty Ltd
• NSC Enterprise Solutions Pty Ltd
• DCA eHealth Solutions Pty Ltd
• DCA Direct Health Pty Ltd
• Kelzone Pty Ltd
• Goodwin Enterprises (Vic) Pty Ltd
• Prentice Management Consulting Pty Ltd
• O2 Networks Pty Ltd.
Small proprietary companies, Kelzone Pty Ltd, Goodwin
Enterprises (Vic) Pty Ltd and Prentice Management Consulting Pty
Ltd will not obtain relief under ASIC Class Order, however, as
shareholders of O2 Networks Pty Ltd they are required to enter
into the assumption deed so that O2 Networks Pty Ltd can obtain
the relief under the Class Order.
Telstra Finance Limited is trustee of the closed group. However, it
is not a group entity under the deed.
Sensis Pty Ltd and Sensis Holdings Pty Ltd were sold by the
Telstra Group on 28 February 2014 and ceased to be parties to the
deed by executing a notice of disposal lodged with ASIC on 3 March
2014. The Closed Group statement of comprehensive income
excludes the eight months of the Sensis Pty Ltd and Sensis
Holdings Pty Ltd results in the financial year 2014, however, it
includes their full year results in financial year 2013. Sensis Pty
Ltd and its controlled entities (Sensis Group) is disclosed as a
discontinued operation. Refer to note 12 for further details on the
disposal of the Sensis Group.
The relevant group entities under the deed:
• form a closed group and extended closed group as defined in
the ASIC Class Order 98/1418 (Class Order)
• do not have to prepare and lodge audited financial reports
under the Corporations Act 2001
• guarantee the payment in full of the debts of the other parties
to the deed in the event of their winding up.
25. INVESTMENTS IN CONTROLLED ENTITIES (CONTINUED)

NOTES TO THE FINANCIAL STATEMENTS(Continued)
Financial Report
Telstra Corporation Limited and controlled entitiesTelstra Annual Report 165
(a) ASIC deed of cross guarantee financial information
(continued)
The statement of financial position and statement of
comprehensive income of the closed group are presented
according to the Class Order as follows. This excludes Telstra
Finance Limited. All significant transactions between members of
the closed group have been eliminated.
25. INVESTMENTS IN CONTROLLED ENTITIES (CONTINUED)
Closed group statement of financial position Closed group
As at 30 June
2014 2013
$m $m
Current assets
Cash and cash equivalents ................................................................................................................................... 5,156 2,121
Trade and other receivables.................................................................................................................................. 3,429 4,340
Inventories.............................................................................................................................................................. 361 421
Derivative financial assets.................................................................................................................................... 23 43
Current tax receivables ......................................................................................................................................... 2 79
Prepayments .......................................................................................................................................................... 315 269
Total current assets ............................................................................................................................................... 9,286 7,273
Non current assets
Trade and other receivables.................................................................................................................................. 966 935
Inventories.............................................................................................................................................................. 29 27
Investments - accounted for using the equity method ...................................................................................... 196 15
Investments in controlled entities........................................................................................................................ 1,536 1,970
Investments - other ............................................................................................................................................... 126 38
Property, plant and equipment............................................................................................................................. 19,391 19,558
Intangible assets ................................................................................................................................................... 6,064 6,762
Deferred tax assets................................................................................................................................................ 1 -
Derivative financial assets.................................................................................................................................... 1,322 1,062
Defined benefit asset ............................................................................................................................................ 44 -
Total non current assets........................................................................................................................................ 29,675 30,367
Total assets ........................................................................................................................................................... 38,961 37,640
Current liabilities
Trade and other payables...................................................................................................................................... 3,525 3,687
Provisions ............................................................................................................................................................... 925 911
Borrowings ............................................................................................................................................................. 3,618 1,346
Derivative financial liabilities ............................................................................................................................... 400 44
Current tax payables ............................................................................................................................................. 259 367
Revenue received in advance................................................................................................................................ 852 1,044
Total current liabilities........................................................................................................................................... 9,579 7,399
Non current liabilities
Other payables ....................................................................................................................................................... 63 53
Provisions ............................................................................................................................................................... 259 267
Borrowings ............................................................................................................................................................. 13,484 14,259
Derivative financial liabilities ............................................................................................................................... 1,169 1,625
Deferred tax liabilities ........................................................................................................................................... 1,238 1,277
Defined benefit liability ......................................................................................................................................... - 42
Revenue received in advance................................................................................................................................ 375 369
Total non current liabilities ................................................................................................................................... 16,588 17,892
Total liabilities ...................................................................................................................................................... 26,167 25,291
Net assets .............................................................................................................................................................. 12,794 12,349
Equity
Share capital .......................................................................................................................................................... 5,719 5,711
Reserves ................................................................................................................................................................. (118) (87)
Retained profits ..................................................................................................................................................... 7,193 6,725
Equity available to the closed group .................................................................................................................. 12,794 12,349
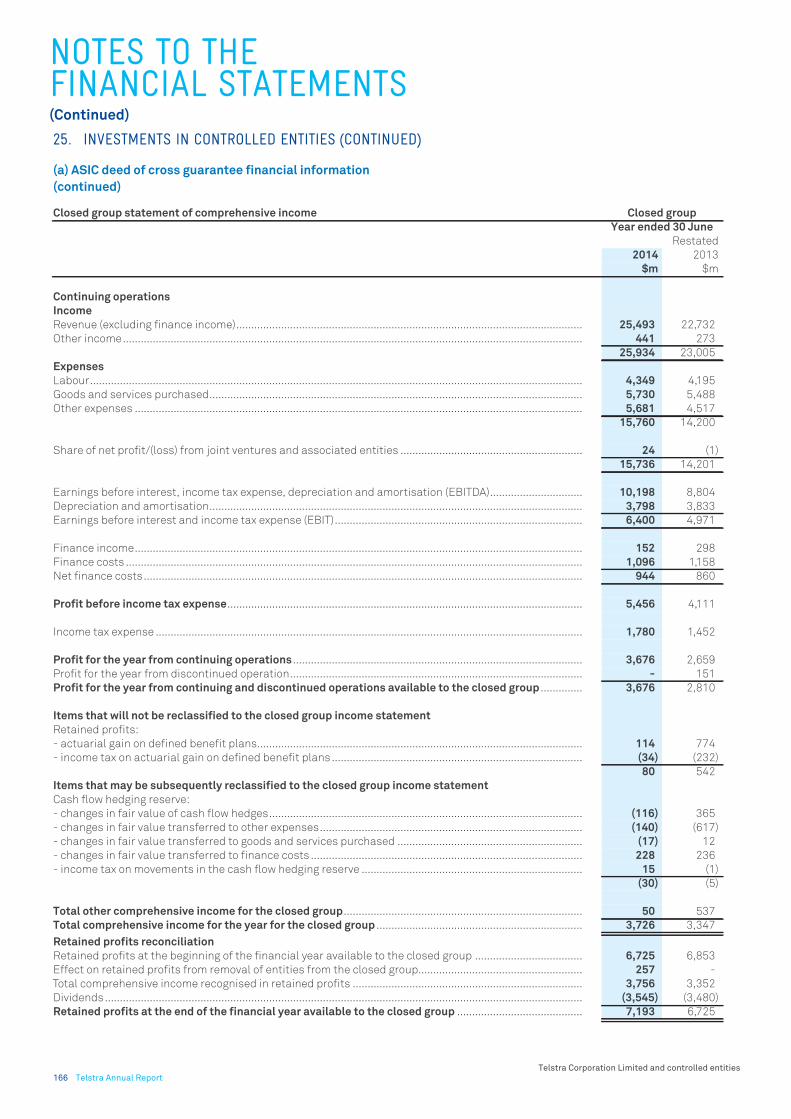
NOTES TO THE FINANCIAL STATEMENTS(Continued)
Telstra Corporation Limited and controlled entities166 Telstra Annual Report
(a) ASIC deed of cross guarantee financial information
(continued)
25. INVESTMENTS IN CONTROLLED ENTITIES (CONTINUED)
Closed group statement of comprehensive income Closed group
Year ended 30 June
Restated
2014 2013
$m $m
Continuing operations
Income
Revenue (excluding finance income).................................................................................................................... 25,493 22,732
Other income.......................................................................................................................................................... 441 273
25,934 23,005
Expenses
Labour..................................................................................................................................................................... 4,349 4,195
Goods and services purchased............................................................................................................................. 5,730 5,488
Other expenses ...................................................................................................................................................... 5,681 4,517
15,760 14,200
Share of net profit/(loss) from joint ventures and associated entities ............................................................. 24 (1)
15,736 14,201
Earnings before interest, income tax expense, depreciation and amortisation (EBITDA)............................... 10,198 8,804
Depreciation and amortisation............................................................................................................................. 3,798 3,833
Earnings before interest and income tax expense (EBIT)................................................................................... 6,400 4,971
Finance income...................................................................................................................................................... 152 298
Finance costs ......................................................................................................................................................... 1,096 1,158
Net finance costs................................................................................................................................................... 944 860
Profit before income tax expense....................................................................................................................... 5,456 4,111
Income tax expense ............................................................................................................................................... 1,780 1,452
Profit for the year from continuing operations ................................................................................................. 3,676 2,659
Profit for the year from discontinued operation.................................................................................................. - 151
Profit for the year from continuing and discontinued operations available to the closed group .............. 3,676 2,810
Items that will not be reclassified to the closed group income statement
Retained profits:
- actuarial gain on defined benefit plans............................................................................................................. 114 774
- income tax on actuarial gain on defined benefit plans .................................................................................... (34) (232)
80 542
Items that may be subsequently reclassified to the closed group income statement
Cash flow hedging reserve:
- changes in fair value of cash flow hedges......................................................................................................... (116) 365
- changes in fair value transferred to other expenses........................................................................................ (140) (617)
- changes in fair value transferred to goods and services purchased .............................................................. (17) 12
- changes in fair value transferred to finance costs ........................................................................................... 228 236
- income tax on movements in the cash flow hedging reserve .......................................................................... 15 (1)
(30) (5)
Total other comprehensive income for the closed group................................................................................ 50 537
Total comprehensive income for the year for the closed group ..................................................................... 3,726 3,347
Retained profits reconciliation
Retained profits at the beginning of the financial year available to the closed group .................................... 6,725 6,853
Effect on retained profits from removal of entities from the closed group....................................................... 257 -
Total comprehensive income recognised in retained profits ............................................................................. 3,756 3,352
Dividends ................................................................................................................................................................ (3,545) (3,480)
Retained profits at the end of the financial year available to the closed group .......................................... 7,193 6,725

NOTES TO THE FINANCIAL STATEMENTS(Continued)
Financial Report
Telstra Corporation Limited and controlled entitiesTelstra Annual Report 167
(b) Liquidations
During the year the following entities were deregistered:
• Telstra New Zealand Holdings Limited
• Telstra Business Systems Pty Ltd.
During the year Telstra Sensis (Beijing) Co. Ltd was liquidated.
During the year we ceased operations of our Octave Group in China
and at 30 June 2014, the following entities were in voluntary
liquidation:
• Telstra Octave Holdings Limited
• Octave Investments Holdings Limited
• Sharp Point Group Limited
• Beijing Liang Dian Shi Jian Technology Co. Ltd.
As a result of the voluntary liquidation and in accordance with the
AASB 121: “The Effect of Changes in Foreign Exchange Rates”, we
have written off to the income statement a $98 million foreign
currency translation reserve associated with the Octave Group
investment.
(c) Controlled entities with different reporting dates
The following companies have reporting dates that differ from our
reporting date of 30 June for the financial year 2014:
31 December:
• Autohome Inc. and its controlled entities
• Sequel Media Inc. and its controlled entities
• Telstra Asia Holdings Limited and its controlled entities
• Telstra Asia Limited
• Telstra SE Asia Holdings Limited
• Telstra Asia Regional Holdings Limited
• Telstra Philippines Holdings Limited
• Telstra International PNG Limited
• Reach Holdings Limited.
31 March:
• Reach Network India Private Limited
• Reach Data Services India Private Limited
• Telstra India (Private) Limited
• Telstra Telecommunications Private Limited.
These entities have different reporting dates due to jurisdictional
requirements. Financial reports prepared as at 30 June are used
for consolidation purposes.
(d) Controlled entities in which our equity ownership is
less than or equal to 50 per cent
We have no direct equity interest in the following entities within
the Autohome Inc. (Autohome) group:
• Beijing Autohome Information Technology Co. Ltd
• Shanghai You Che You Jia Advertising Co. Ltd
• Guangzhou You Che You Jia Advertising Co. Ltd.
The purpose of these entities is to hold the licences and approvals
required to operate Autohome’s internet content provision and
advertising business in China. Laws and regulations in the
People’s Republic of China (PRC) currently limit foreign ownership
of such companies, therefore Autohome’s operations in China are
conducted primarily through contractual agreements between
these entities and Beijing Cheerbright Technologies Co. Ltd. The
contractual arrangements enable Autohome to exercise effective
control over the entities, receive substantially all of the economic
benefits of the entities and have exclusive options to purchase all
of the equity interests in these entities when and to the extent
permitted under PRC law. Based on this we have consolidated the
financial results, financial position and cash flows of these
entities into our Telstra Group financial report.
We have no direct equity interest in the following entities within
the Sequel Media Inc. (Sequel Media) group:
• Beijing Haochen Domain Information Technology Co. Ltd
• Lianhe Shangqing (Beijing) Advertisement Co. Ltd
• Beijing POP Information Technology Co. Ltd
• Shijiazhuang Xinrong Advertising Co. Ltd.
In addition, our controlled entity Union Tough Advertisement
Limited has a 30 per cent direct interest in Haochen Shidai
(Beijing) Advertisement Co. Ltd.
The purpose of these entities is to hold the licences and approvals
required to operate Sequel Media’s internet content provision and
advertising business in China. Laws and regulations in the
People’s Republic of China (PRC) currently limit foreign ownership
of such companies, therefore Sequel Media’s operations in China
are conducted primarily through contractual agreements between
these entities and Beijing Topside Technologies Co. Ltd, Shengtuo
Shidai (Beijing) Information Technology Co. Ltd and Haochen
Shidai (Beijing) Advertisement Co. Ltd. The contractual
arrangements enable Sequel Media to exercise effective control
over the entities, receive substantially all of the economic benefits
of the entities and have exclusive options to purchase all of the
equity interests in these entities when and to the extent permitted
under PRC law. Based on this we have consolidated the financial
results, financial position and cash flows of these entities into our
Telstra Group financial report.
We have effective control over the following entities through
economic dependency and contractual arrangements with the
majority shareholders and have consolidated them into our group:
• Telstra (Thailand) Limited
• Incomgen Holdings Inc.
• Thai Cyber Web Co Limited.
We have control over Fred IT Group Pty Ltd through our decision
making ability on the board.
25. INVESTMENTS IN CONTROLLED ENTITIES (CONTINUED)

NOTES TO THE FINANCIAL STATEMENTS(Continued)
Telstra Corporation Limited and controlled entities168 Telstra Annual Report
(e) Controlled entities not individually audited by EY
These companies are not audited by EY, our Australian statutory
auditor.
(f) New incorporations and business combinations
On 22 August 2013, we acquired 100 per cent of NSC Group Pty Ltd
and its controlled entities. Refer to note 20 for further details.
On 2 September 2013, we acquired 100 per cent of DCA eHealth
Solutions Pty Ltd and its controlled entities. Refer to note 20 for
further details.
On 30 September 2013, we acquired 50 per cent of Fred IT Group
Pty Ltd and its controlled entities. Refer to note 20 for further
details.
On 9 October 2013, we incorporated Muru-D Pty Ltd.
On 18 October 2013, Autohome (Hong Kong) Limited acquired 100
per cent of Autohome Media Limited (formerly Prbrownies
Marketing Limited). During the year Autohome Media Limited
incorporated the following wholly owned subsidiaries:
• Autohome Shanghai Advertising Co. Ltd
• Beijing Autohome Software Co. Ltd
• Beijing Autohome Technologies Co. Ltd
• Beijing Autohome Advertising Co. Ltd
• Guangzhou Autohome Advertising Co. Ltd.
On 31 December 2013, we acquired 100 per cent of O2 Networks
Group. Refer to note 20 for further details.
On 11 March 2014, we incorporated Telstra Foundation
(Philippines) Inc.
On 18 June 2014, we incorporated Telstra Holdings Singapore Pte.
Ltd.
(g) Purchase of additional interest
On 10 December 2013, Telstra Octave Holdings Limited acquired
the remaining 33 per cent interest in Octave Investments Holdings
Limited in exchange for selling the net assets of the five variable
interest entities controlled by Sharp Point Group Limited. As a
result our shareholding in Octave Investments Holding Limited as
at 30 June 2014 is 100 per cent. Subsequent to this acquisition we
ceased operations of the Octave Group and the legal entities in the
Octave Group entered into voluntary liquidation (refer (b) above).
During the year we decreased our ownership of Autohome Inc.
from 66.0 per cent at 30 June 2013 to 63.2 per cent at 30 June
2014, via share buy-back, subsequent initial public offering and
employee share issues. None of these transactions resulted in a
change of control. Changes in valuation of non-controlling
interests resulting from these transactions are recorded in the
general reserve. Refer to note 20 for further details.
(h) Sales and disposals
On 28 February 2014, we divested 70 per cent of our directories
business via disposal of our 100 per cent shareholding in Sensis
Pty Ltd and its controlled entities (Sensis Group) and acquisition
of 30 per cent of Project Sunshine I Pty Ltd, the new holding
company of the Sensis Group. Refer to note 12 for further details
on the disposal. Our 30 per cent associate investment in Project
Sunshine I Pty Ltd is disclosed in note 26.
On 14 May 2014, we sold our entire 76.4 per cent shareholding in
CSL Limited and its controlled entities (CSL Group) for a total
expected cash consideration of $2,140 million subject to
completion audit. Refer to note 20 for further details.
(i) Limited by guarantee
We own 100 per cent of the equity of Telstra Foundation Ltd (TFL).
TFL is limited by guarantee (guaranteed to $100) with Telstra
Corporation Limited being the sole member. We did not contribute
any equity to TFL on incorporation. TFL is the trustee of the Telstra
Foundation Community Development Fund and manager of the
Telstra Kids Fund.
25. INVESTMENTS IN CONTROLLED ENTITIES (CONTINUED)

NOTES TO THE FINANCIAL STATEMENTS(Continued)
Financial Report
Telstra Corporation Limited and controlled entitiesTelstra Annual Report 169
Our investments in joint ventures and associated entities are listed below:
Unless otherwise noted, all investments have a reporting date of
30 June, are incorporated in Australia and our voting power is the
same as our ownership interest.
26. INVESTMENTS IN JOINT VENTURES AND ASSOCIATED ENTITIES
Telstra Group
As at 30 June
2014 2013
$m $m
Investments in joint ventures accounted for using the equity method
Investments in joint ventures ................................................................................................................................... 4 5
Allowance for impairment in value........................................................................................................................... - -
Carrying amount of investments in joint ventures.................................................................................................. 4 5
Investments in associated entities accounted for using the equity method
Investments in associated entities .......................................................................................................................... 216 38
Allowance for impairment in value........................................................................................................................... (24) (25)
Carrying amount of investments in associated entities......................................................................................... 192 13
196 18
Name of Entity Principal activities Ownership interest
As at 30 June
2014 2013
% %
Joint ventures
Foxtel Partnership (f)(g) Pay television 50.0 50.0
Foxtel Television Partnership (f)(g) Pay television 50.0 50.0
Customer Services Pty Ltd (f)(g) Customer service 50.0 50.0
Foxtel Management Pty Ltd (f)(g) Management services 50.0 50.0
Foxtel Cable Television Pty Ltd (a)(f)(g) Pay television 80.0 80.0
Reach Ltd (incorporated in Bermuda) (e)(f)(g) International connectivity services 50.0 50.0
3GIS Pty Ltd (e)(f) Management of former 3GIS Partnership (non-operating) 50.0 50.0
Bridge Mobile Pte Ltd
(incorporated in Singapore) (b)(f) Regional roaming provider - 10.0
HealthEngine Pty Ltd (b)(f) Online healthcare booking 33.3 25.0
Associated entities
Australia-Japan Cable Holdings Limited
(incorporated in Bermuda) (e)(f)(g) Network cable provider 46.9 46.9
Telstra Super Pty Ltd (a)(f)(g) Superannuation trustee 100.0 100.0
Telstra Foundation Ltd (d) Charitable trustee organisation - 100.0
Mandoe Pty Ltd (f) Signage software provider 26.7 25.0
IPscape Pty Ltd (f) Cloud based call centre solution 24.9 31.3
Dimmi Pty Ltd (d)(f) Online restaurant reservation - 23.4
Whispir Limited (c)(f) Software as a solution provider 18.0 18.0
IP Health Pty Ltd (f) Software development 32.1 32.9
Project Sunshine I Pty Ltd (d)(f) Holding entity of Sensis Pty Ltd (directory services) 30.0 -

NOTES TO THE FINANCIAL STATEMENTS(Continued)
Telstra Corporation Limited and controlled entities170 Telstra Annual Report
(a) Joint ventures and associated entities in which we
own more than 50 per cent equity
• We own 80 per cent of the equity of Foxtel Cable Television Pty
Ltd. This entity is disclosed as a joint venture because our
effective voting power is restricted to 50 per cent due to the
participative rights of the other equity shareholder and we have
joint control.
• We own 100 per cent of the equity of Telstra Super Pty Ltd, the
trustee for the Telstra Superannuation Scheme (Telstra Super).
We do not consolidate Telstra Super Pty Ltd as we do not
control the board of directors. The board of directors consists
of an equal number of employer and member representatives
and an independent chairman. Our voting power over the
relevant activities is 44 per cent, which is equivalent to our
representation on the board. The entity is therefore classified
as an associated entity as we have significant influence over
the investee.
(b) Joint ventures in which we own less than or equal to 50
per cent equity
During the year we disposed of our 10 per cent holding of Bridge
Mobile Pte Ltd as part of the CSL Group disposal (refer to note 20
for further details). Previously we had joint control over Bridge
Mobile Pte Ltd through our decision making ability on the board.
We own 33.3 per cent (2013: 25.0 per cent) of HealthEngine Pty Ltd
and we have joint control through our decision making ability on
the board.
(c) Associated entities in which we own less than or equal
to 20 per cent equity
We own 18 per cent of Whispir Limited and we have significant
influence over this entity through our decision making ability on
the board.
(d) Other changes in joint ventures and associated
entities
We own 100% of the equity of Telstra Foundation Limited (TFL).
TFL is the trustee of the Telstra Foundation Community
Development Fund and manager of the Telstra Kids Fund, which
have no material operations. From 1 July 2013, we consolidate on
a prospective basis the TFL results previously accounted for as an
associate, as we meet the criteria for control under AASB 10:
“Consolidated Financial Statements”. Refer to note 25 for further
details.
On 28 February 2014, we divested 70 per cent of our directories
business via disposal of our 100 per cent shareholding in Sensis
Pty Ltd and its controlled entities (Sensis Group) for a total cash
consideration of $454 million and a non-cash acquisition of 30 per
cent shareholding in Project Sunshine I Pty Ltd, the new holding
company of the Sensis Group. As a result, we deconsolidated 100
per cent of the balance sheet of the Sensis Group and recorded, at
fair value of $157 million, our 30 per cent interest in Project
Sunshine I Pty Ltd. From1 March 2014 we have accounted for our
interest in Project Sunshine I Pty Ltd as an associated entity. Refer
to notes 12 and 25 for further details on the disposal and changes
in our controlled entities.
On 14 April 2014, following an equity issuance to other investors
our ownership interest in Dimmi Pty Ltd was diluted from 23.4 per
cent to 15.4 per cent. As a result our ability to exercise significant
influence over the investee was lost, the investment in associate
was reclassified as an available-for-sale investment.
(e) Joint ventures and associated entities with different
reporting dates
Several of our joint ventures and associated entities have
reporting dates that differ from our reporting date of 30 June for
financial year 2014, as follows:
• Reach Ltd - 31 December
• 3GIS Pty Ltd - 31 December
• Australia-Japan Cable Holdings Limited - 31 December.
The differences in reporting dates are due to jurisdictional
requirements. Financial reports prepared as at 30 June are used
for equity accounting purposes. Our ownership interest in joint
ventures and associated entities with different reporting dates is
the same at that reporting date as at 30 June unless otherwise
noted.
26. INVESTMENTS IN JOINT VENTURES AND ASSOCIATED ENTITIES (CONTINUED)

NOTES TO THE FINANCIAL STATEMENTS(Continued)
Financial Report
Telstra Corporation Limited and controlled entitiesTelstra Annual Report 171
(f) Other disclosures for joint ventures and associated
entities
The movements in the consolidated equity accounted amount of
our joint ventures and associated entities are summarised as
follows:
(i) Share of the net profit/(loss) from associated entities includes a
$24 million profit (2013: nil) from our 30 per cent investment in
Project Sunshine I Pty Ltd, the new holding company of the Sensis
Group, for the period from 1 March 2014 to 30 June 2014.
Other commitments
Our joint venture Foxtel has other commitments amounting to
approximately $4,658 million (2013: $3,950 million). The majority
of our 50 per cent share of these commitments relates to
minimum subscriber guarantees (MSG) for pay television
programming agreements. These agreements are for periods of
between one and 25 years and are based on current prices and
costs under agreements entered into between the Foxtel
Partnership and various other parties. These minimum subscriber
payments fluctuate in accordance with price escalation, as well as
foreign currency movements. In addition to our MSG, Foxtel has
other commitments, including obligations for satellite
transponder costs and digital set top box units.
26. INVESTMENTS IN JOINT VENTURES AND ASSOCIATED ENTITIES (CONTINUED)
Telstra Group
Year ended/As at 30 June
Joint ventures Associated entities
2014 2013 2014 2013
$m $m $m $m
Carrying amount of investments at beginning of year............................................. 5 2 13 10
Additional investments made during the year ............................................................ 2 3 158 5
Disposal of investments during the year ..................................................................... (2) - - -
Investment reclassifed to available-for-sale during the year.................................... - - (1) -
Impairment loss recognised in the income statement............................................... - - (2) -
5 5 168 15
Share of net profit/(loss) for the year (i) ....................................................................... (1) - 25 (1)
Dividends received......................................................................................................... - - (1) (1)
Carrying amount of investments at end of year ....................................................... 4 5 192 13
Our share of contingent liabilities of joint ventures and associated entities........... 5 10 - -
Our share of capital commitments contracted for by our joint ventures
and associated entities ................................................................................................. 4 1 - -

NOTES TO THE FINANCIAL STATEMENTS(Continued)
Telstra Corporation Limited and controlled entities172 Telstra Annual Report
(f) Other disclosures for joint ventures and associated
entities (continued)
Our joint venture Foxtel includes Foxtel Partnership and its
controlled entities, Foxtel Television Partnership, Customer
Services Pty Ltd, Foxtel Cable Television Pty Ltd and Foxtel
Management Pty Ltd and its controlled entities. Foxtel is not a
publicly listed entity.
Foxtel is our strategic partner primarily delivering subscription
television services over cable, satellite and broadband to our
customers in Australian regional and metropolitan areas.
Equity accounting of our investment in Foxtel is currently
suspended. Refer to note 26(g) for further details.
Full financial information of the Foxtel Partnership and its
controlled entities is presented in the table below:
(*) Financial liabilities exclude trade and other payables and
provisions
We also have interests in a number of individually immaterial joint
ventures and associated entities. Our share of the aggregate
financial information (including joint ventures and associated
entities where equity accounting has been suspended) is
presented in the table below:
26. INVESTMENTS IN JOINT VENTURES AND ASSOCIATED ENTITIES (CONTINUED)
Foxtel joint venture
Year ended 30 June
2014 2013
$m $m
Current assets.............................................................................................................................................................. 501 485
Non current assets ...................................................................................................................................................... 2,989 3,042
Total assets.................................................................................................................................................................. 3,490 3,527
Current liabilities ......................................................................................................................................................... 816 1,023
Non current liabilities.................................................................................................................................................. 3,068 2,841
Total liabilities............................................................................................................................................................. 3,884 3,864
Net liabilities ............................................................................................................................................................... (394) (337)
Cash and cash equivalents ......................................................................................................................................... 34 34
Current financial liabilities (*) .................................................................................................................................... 37 307
Non current financial liabilities (*) ............................................................................................................................. 3,034 2,821
Revenue ........................................................................................................................................................................ 3,138 3,116
Expenses ...................................................................................................................................................................... 2,162 2,173
Depreciation and amortisation................................................................................................................................... 394 427
Interest income ............................................................................................................................................................ 1 3
Interest expense .......................................................................................................................................................... 236 232
Other finance costs ..................................................................................................................................................... 11 -
Income tax expense ..................................................................................................................................................... 24 30
Profit for the year ........................................................................................................................................................ 312 257
Other comprehensive income..................................................................................................................................... (40) 42
Total comprehensive income for the year................................................................................................................ 272 299
Telstra Group
Year ended 30 June
Joint ventures Associated entities
2014 2013 2014 2013
$m $m $m $m
Profit/(loss) for the year............................................................................................... (2) 2 36 7
Other comprehensive income....................................................................................... 1 (8) 1 (5)
Total comprehensive income....................................................................................... (1) (6) 37 2

NOTES TO THE FINANCIAL STATEMENTS(Continued)
Financial Report
Telstra Corporation Limited and controlled entitiesTelstra Annual Report 173
(g) Suspension of equity accounting
Our unrecognised share of (profits)/losses for the period and
cumulatively, for our entities where equity accounting has ceased
and the investment is recorded at zero due to losses made by
these entities and/or reductions in the equity accounted carrying
amount, is shown below:
Equity accounting has been suspended for Telstra Super Pty Ltd.
There is no significant unrecognised profits/losses in this entity.
A $165 million distribution was received from Foxtel during the
year (2013: $155 million). This has been recorded as revenue in the
income statement. Our share of Foxtel's profit for the year was
$156 million. Excess distribution and our $22 million share of the
cash flow hedging reserve over our share of profit increased our
cumulative share of unrecognised losses in Foxtel.
26. INVESTMENTS IN JOINT VENTURES AND ASSOCIATED ENTITIES (CONTINUED)
Telstra Group
Year ended 30 June
Period Cumulative Period Cumulative
2014 2014 2013 2013
$m $m $m $m
Joint ventures
Foxtel ........................................................................................................................... 31 197 4 166
Reach Ltd..................................................................................................................... - 558 (2) 558
Associated entities
Australia-Japan Cable Holdings Limited.................................................................. (11) 115 (11) 126
20 870 (9) 850
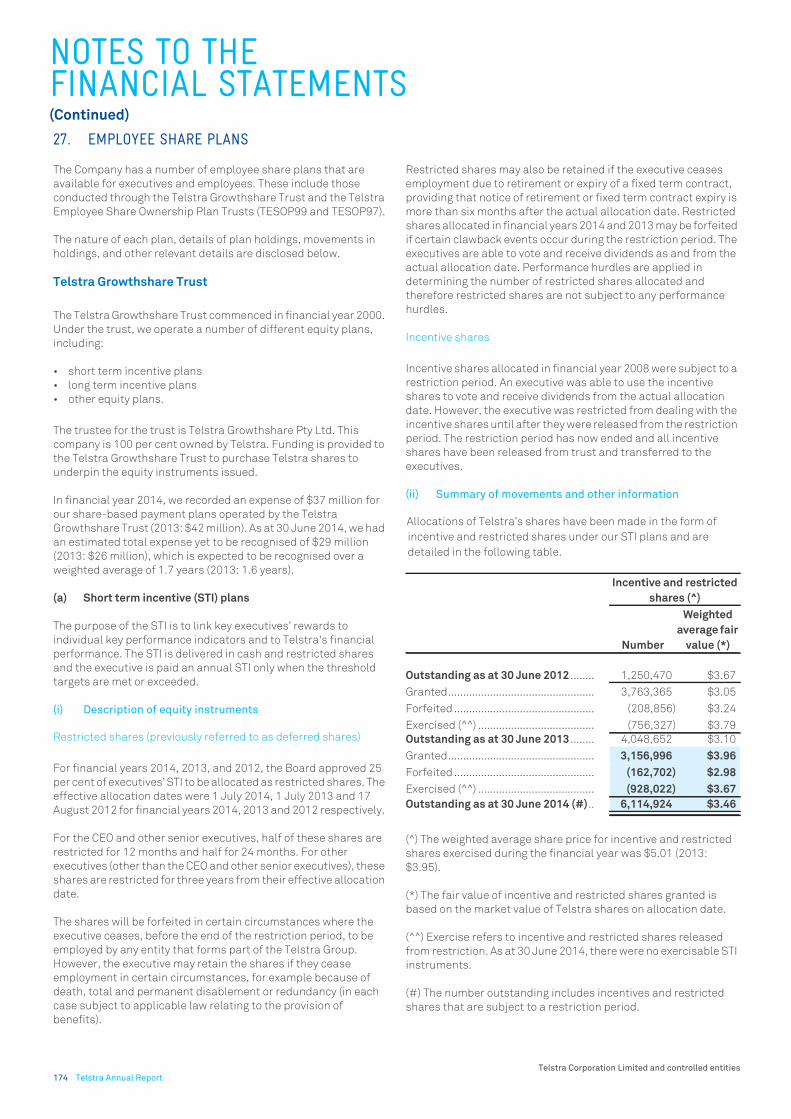
NOTES TO THE FINANCIAL STATEMENTS(Continued)
Telstra Corporation Limited and controlled entities174 Telstra Annual Report
The Company has a number of employee share plans that are
available for executives and employees. These include those
conducted through the Telstra Growthshare Trust and the Telstra
Employee Share Ownership Plan Trusts (TESOP99 and TESOP97).
The nature of each plan, details of plan holdings, movements in
holdings, and other relevant details are disclosed below.
Telstra Growthshare Trust
The Telstra Growthshare Trust commenced in financial year 2000.
Under the trust, we operate a number of different equity plans,
including:
• short term incentive plans
• long term incentive plans
• other equity plans.
The trustee for the trust is Telstra Growthshare Pty Ltd. This
company is 100 per cent owned by Telstra. Funding is provided to
the Telstra Growthshare Trust to purchase Telstra shares to
underpin the equity instruments issued.
In financial year 2014, we recorded an expense of $37 million for
our share-based payment plans operated by the Telstra
Growthshare Trust (2013: $42 million). As at 30 June 2014, we had
an estimated total expense yet to be recognised of $29 million
(2013: $26 million), which is expected to be recognised over a
weighted average of 1.7 years (2013: 1.6 years).
(a) Short term incentive (STI) plans
The purpose of the STI is to link key executives’ rewards to
individual key performance indicators and to Telstra's financial
performance. The STI is delivered in cash and restricted shares
and the executive is paid an annual STI only when the threshold
targets are met or exceeded.
(i) Description of equity instruments
Restricted shares (previously referred to as deferred shares)
For financial years 2014, 2013, and 2012, the Board approved 25
per cent of executives’ STI to be allocated as restricted shares. The
effective allocation dates were 1 July 2014, 1 July 2013 and 17
August 2012 for financial years 2014, 2013 and 2012 respectively.
For the CEO and other senior executives, half of these shares are
restricted for 12 months and half for 24 months. For other
executives (other than the CEO and other senior executives), these
shares are restricted for three years from their effective allocation
date.
The shares will be forfeited in certain circumstances where the
executive ceases, before the end of the restriction period, to be
employed by any entity that forms part of the Telstra Group.
However, the executive may retain the shares if they cease
employment in certain circumstances, for example because of
death, total and permanent disablement or redundancy (in each
case subject to applicable law relating to the provision of
benefits).
Restricted shares may also be retained if the executive ceases
employment due to retirement or expiry of a fixed term contract,
providing that notice of retirement or fixed term contract expiry is
more than six months after the actual allocation date. Restricted
shares allocated in financial years 2014 and 2013 may be forfeited
if certain clawback events occur during the restriction period. The
executives are able to vote and receive dividends as and from the
actual allocation date. Performance hurdles are applied in
determining the number of restricted shares allocated and
therefore restricted shares are not subject to any performance
hurdles.
Incentive shares
Incentive shares allocated in financial year 2008 were subject to a
restriction period. An executive was able to use the incentive
shares to vote and receive dividends from the actual allocation
date. However, the executive was restricted from dealing with the
incentive shares until after they were released from the restriction
period. The restriction period has now ended and all incentive
shares have been released from trust and transferred to the
executives.
(ii) Summary of movements and other information
Allocations of Telstra’s shares have been made in the form of
incentive and restricted shares under our STI plans and are
detailed in the following table.
(^) The weighted average share price for incentive and restricted
shares exercised during the financial year was $5.01 (2013:
$3.95).
(*) The fair value of incentive and restricted shares granted is
based on the market value of Telstra shares on allocation date.
(^^) Exercise refers to incentive and restricted shares released
from restriction. As at 30 June 2014, there were no exercisable STI
instruments.
(#) The number outstanding includes incentives and restricted
shares that are subject to a restriction period.
27. EMPLOYEE SHARE PLANS
Incentive and restricted
shares (^)
Number
Weighted
average fair
value (*)
Outstanding as at 30 June 2012 ........ 1,250,470 $3.67
Granted................................................. 3,763,365 $3.05
Forfeited ............................................... (208,856) $3.24
Exercised (^^) ....................................... (756,327) $3.79
Outstanding as at 30 June 2013 ........ 4,048,652 $3.10
Granted................................................. 3,156,996 $3.96
Forfeited ............................................... (162,702) $2.98
Exercised (^^) ....................................... (928,022) $3.67
Outstanding as at 30 June 2014 (#).. 6,114,924 $3.46
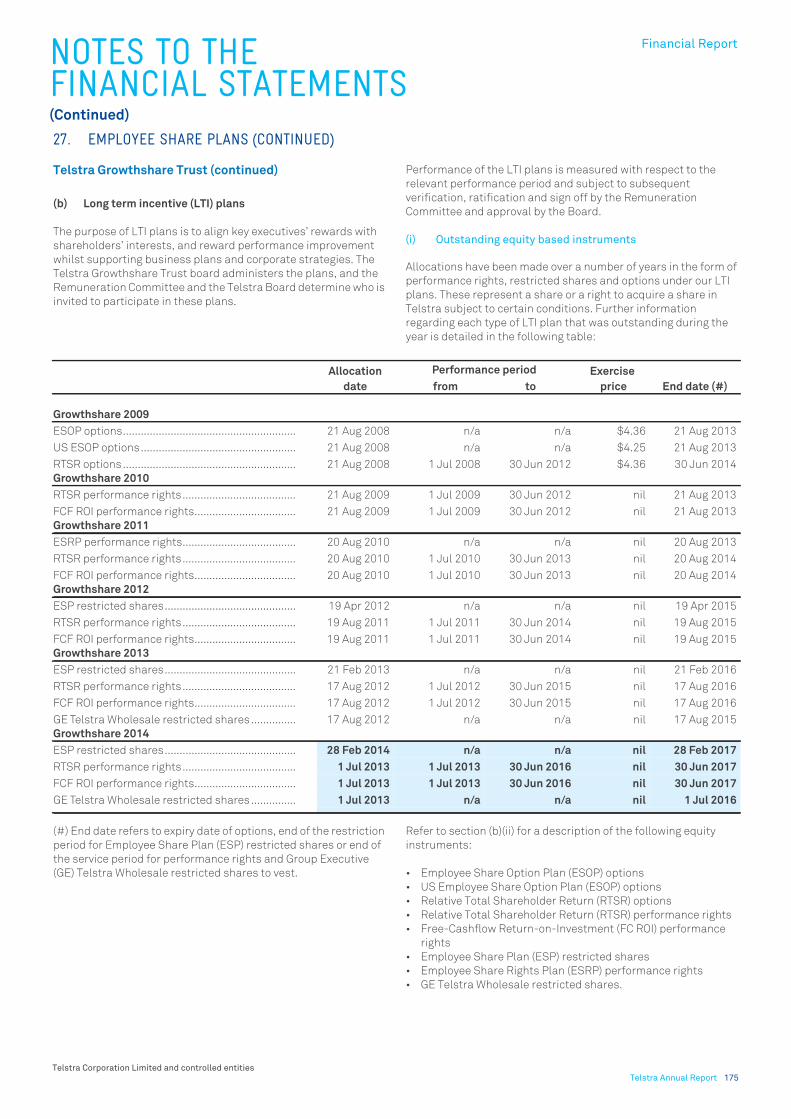
NOTES TO THE FINANCIAL STATEMENTS(Continued)
Financial Report
Telstra Corporation Limited and controlled entitiesTelstra Annual Report 175
Telstra Growthshare Trust (continued)
(b) Long term incentive (LTI) plans
The purpose of LTI plans is to align key executives’ rewards with
shareholders’ interests, and reward performance improvement
whilst supporting business plans and corporate strategies. The
Telstra Growthshare Trust board administers the plans, and the
Remuneration Committee and the Telstra Board determine who is
invited to participate in these plans.
Performance of the LTI plans is measured with respect to the
relevant performance period and subject to subsequent
verification, ratification and sign off by the Remuneration
Committee and approval by the Board.
(i) Outstanding equity based instruments
Allocations have been made over a number of years in the form of
performance rights, restricted shares and options under our LTI
plans. These represent a share or a right to acquire a share in
Telstra subject to certain conditions. Further information
regarding each type of LTI plan that was outstanding during the
year is detailed in the following table:
(#) End date refers to expiry date of options, end of the restriction
period for Employee Share Plan (ESP) restricted shares or end of
the service period for performance rights and Group Executive
(GE) Telstra Wholesale restricted shares to vest.
Refer to section (b)(ii) for a description of the following equity
instruments:
• Employee Share Option Plan (ESOP) options
• US Employee Share Option Plan (ESOP) options
• Relative Total Shareholder Return (RTSR) options
• Relative Total Shareholder Return (RTSR) performance rights
• Free-Cashflow Return-on-Investment (FC ROI) performance
rights
• Employee Share Plan (ESP) restricted shares
• Employee Share Rights Plan (ESRP) performance rights
• GE Telstra Wholesale restricted shares.
27. EMPLOYEE SHARE PLANS (CONTINUED)
Allocation
date
Performance period Exercise
price End date (#)from to
Growthshare 2009
ESOP options.......................................................... 21 Aug 2008 n/a n/a $4.36 21 Aug 2013
US ESOP options.................................................... 21 Aug 2008 n/a n/a $4.25 21 Aug 2013
RTSR options .......................................................... 21 Aug 2008 1 Jul 2008 30 Jun 2012 $4.36 30 Jun 2014
Growthshare 2010
RTSR performance rights...................................... 21 Aug 2009 1 Jul 2009 30 Jun 2012 nil 21 Aug 2013
FCF ROI performance rights.................................. 21 Aug 2009 1 Jul 2009 30 Jun 2012 nil 21 Aug 2013
Growthshare 2011
ESRP performance rights...................................... 20 Aug 2010 n/a n/a nil 20 Aug 2013
RTSR performance rights...................................... 20 Aug 2010 1 Jul 2010 30 Jun 2013 nil 20 Aug 2014
FCF ROI performance rights.................................. 20 Aug 2010 1 Jul 2010 30 Jun 2013 nil 20 Aug 2014
Growthshare 2012
ESP restricted shares............................................ 19 Apr 2012 n/a n/a nil 19 Apr 2015
RTSR performance rights...................................... 19 Aug 2011 1 Jul 2011 30 Jun 2014 nil 19 Aug 2015
FCF ROI performance rights.................................. 19 Aug 2011 1 Jul 2011 30 Jun 2014 nil 19 Aug 2015
Growthshare 2013
ESP restricted shares............................................ 21 Feb 2013 n/a n/a nil 21 Feb 2016
RTSR performance rights...................................... 17 Aug 2012 1 Jul 2012 30 Jun 2015 nil 17 Aug 2016
FCF ROI performance rights.................................. 17 Aug 2012 1 Jul 2012 30 Jun 2015 nil 17 Aug 2016
GE Telstra Wholesale restricted shares ............... 17 Aug 2012 n/a n/a nil 17 Aug 2015
Growthshare 2014
ESP restricted shares............................................ 28 Feb 2014 n/a n/a nil 28 Feb 2017
RTSR performance rights...................................... 1 Jul 2013 1 Jul 2013 30 Jun 2016 nil 30 Jun 2017
FCF ROI performance rights.................................. 1 Jul 2013 1 Jul 2013 30 Jun 2016 nil 30 Jun 2017
GE Telstra Wholesale restricted shares ............... 1 Jul 2013 n/a n/a nil 1 Jul 2016

NOTES TO THE FINANCIAL STATEMENTS(Continued)
Telstra Corporation Limited and controlled entities176 Telstra Annual Report
Telstra Growthshare Trust (continued)
(b) Long term incentive (LTI) plans (continued)
(i) Outstanding equity based instruments (continued)
In relation to these executive LTI plans, the Board may, in its
discretion, reset the hurdles governing the financial year 2014,
2013 and 2012 equity instruments to make them consistent with
the changed circumstances resulting from the occurrence of
certain factors, including:
• a material change in the strategic business plan
• a material regulatory change or
• a significant out-of-plan business development (this could
include a major acquisition outside the current business plan,
resulting in a significant change to the business of Telstra or
the Telstra Group that means (in the reasonable opinion of the
Board) the targets for that class of equity instruments are no
longer appropriate).
In financial year 2014, the Board did not reset the hurdles
governing the equity instruments issued in financial years 2014,
2013 and 2012.
(ii) Description of equity instruments
Performance rights
Executive LTI performance rights
In respect of performance rights, an executive has no legal or
beneficial interest in the underlying shares, no entitlement to
dividends received from the shares and no voting rights in relation
to the shares until the performance rights become restricted
shares.
In relation to performance rights issued, if the performance hurdle
is satisfied during the applicable performance period, a specified
number of performance rights, as determined in accordance with
the trust deed and terms of issue, will become restricted shares.
Although the trustee holds the shares in trust, the executive will
retain beneficial interest (dividends, voting rights, bonuses and
rights issues) in the shares until they vest and are transferred to
them or sold on their behalf, at the end of the restriction period, or,
in the case of performance rights granted in financial year 2014,
on the first day after the end of the restriction period that the
executive is able to deal with the shares under Telstra’s Securities
Trading Policy (unless forfeited).
Employee Share Rights Plan (ESRP) performance rights
For ESRP performance rights allocated in financial year 2011,
there is no exercise price payable. Once the performance rights
have vested, the rights will be automatically exercised and Telstra
shares will be transferred to the employee. Until this time, the
employee cannot use the performance rights to vote or receive
dividends.
A description of each type of performance right that existed in
financial year 2014 follows:
Executive LTI performance rights:
• Relative Total Shareholder Return (RTSR) performance rights -
the performance hurdle for these rights is based on growth in
Telstra's total shareholder return relative to the growth in total
shareholder return of the companies in a peer group
• Free-Cashflow Return-on-Investment (FCF ROI) performance
rights - the performance hurdle for these rights is based on
Telstra’s annual free-cashflow (less finance costs) over the
performance period divided by the average investment over the
performance period.
Employee performance rights:
• Employee Share Rights Plan (ESRP) performance rights - the
vesting condition for these rights is based on the completion of
three years continuous service by the participant (and once
granted the rights are not subject to any performance
conditions).
Restricted shares
GE Telstra Wholesale restricted shares (previously referred to as
GMD Telstra Wholesale restricted shares)
Due to the Structural Separation Undertaking (SSU) arising from
the National Broadband Network (NBN) transaction, the GE
Telstra Wholesale is prohibited from participating in the financial
year 2014, 2013 and 2012 LTI plans. As a result, an alternative
remuneration arrangement has been provided in financial years
2014 and 2013, which is a restricted share plan where the number
of restricted shares allocated is based on the same performance
measures as his financial year 2013 and 2012 STI plans.
Employee Share Plan (ESP) restricted shares
Restricted shares provided under the ESP in financial years 2014,
2013 and 2012 were allocated at no cost to certain eligible
employees (excluding executives). The shares are held by the
Trustee on behalf of employees until the restriction period ends.
During the restriction period, employees are entitled to exercise
the voting rights attached to the shares and to receive dividends
on the shares. The shares are released from trust on the earlier of
three years from the date of allocation or the date on which the
participating employee ceases relevant employment.
A description of each type of restricted share that existed in
financial year 2014 is set out below:
Executive LTI restricted shares:
• GE Telstra Wholesale restricted shares - performance hurdles
are applied in determining the number of restricted shares
allocated and therefore the restricted shares are not subject to
any performance hurdles.
Employee restricted shares:
• Employee Share Plan (ESP) restricted shares - there are no
performance hurdles for these restricted shares.
27. EMPLOYEE SHARE PLANS (CONTINUED)

NOTES TO THE FINANCIAL STATEMENTS(Continued)
Financial Report
Telstra Corporation Limited and controlled entitiesTelstra Annual Report 177
Telstra Growthshare Trust (continued)
(b) Long term incentive (LTI) plans (continued)
(ii) Description of equity instruments (continued)
Options
An employee or executive is not entitled to Telstra shares unless
the options initially vest (subject to the achievement of the
relevant performance hurdles) and then are exercised. This means
that the employee or executive cannot use options to vote or
receive dividends until they have vested and been exercised. If the
performance hurdles are satisfied in the applicable performance
period, options must be exercised at any time before the expiry
date, otherwise they will lapse. Once the options are exercised and
the exercise price is paid, Telstra shares will be transferred to the
eligible employee or executive.
A description of each type of option that existed in financial year
2014 is set out below:
Executive LTI options:
• Relative Total Shareholder Return options (RTSR options) - the
performance hurdle for these options is based on growth in
Telstra's total shareholder return relative to the growth in total
shareholder return of the companies in a peer group.
Employee options:
• ESOP options - the vesting condition for these options is based
on the completion of three years continuous service by the
participant (and once granted are not subject to any
performance conditions)
• US ESOP options - the vesting condition for these options is
based on the completion of three years continuous service by
the participant (and once granted are not subject to any
performance conditions).
(iii) Performance hurdles
Performance rights
Details of the relevant performance hurdles in relation to
performance rights, are set out below:
Relative Total Shareholder Return (RTSR) performance rights
For financial years 2014, 2013, 2012, 2011 and 2010 RTSR
performance rights, the single performance period is the three
year period ending on 30 June 2016, 30 June 2015, 30 June 2014,
30 June 2013 and 30 June 2012 respectively.
If Telstra achieves a result placing it in at least the 50th percentile
for the performance period, then:
• the number of RTSR performance rights that will meet the
hurdle for that performance period is scaled proportionately
from the 50th percentile (which equates to 25 per cent of the
allocation) to the 75th percentile (which equates to 100 per
cent of the allocation)
• any performance rights that do not meet the hurdle will lapse.
If Telstra does not reach the 50th percentile, all of these RTSR
performance rights will lapse.
Any RTSR performance rights that meet the hurdle become
restricted shares and are held by the Trustee until the restriction
period ends (four years after the effective allocation date of the
performance rights).
Free-Cashflow Return-on-Investment (FCF ROI) performance
rights
For financial years 2014, 2013, 2012, 2011 and 2010 FCF ROI
performance rights, the single performance period is the three
year period ending on 30 June 2016, 30 June 2015, 30 June 2014,
30 June 2013 and 30 June 2012 respectively.
The number of FCF ROI performance rights that will meet the
hurdle is calculated as follows:
• if the threshold target is achieved, then 50 per cent of the
allocation of FCF ROI performance rights will meet the hurdle
• if the result achieved is between the threshold and stretch
targets, then the number of FCF ROI performance rights that
will meet the hurdle is scaled proportionately between 50 per
cent and 100 per cent
• if the stretch target is achieved or exceeded, then 100 per cent
of the FCF ROI performance rights will meet the hurdle
• if the threshold target is not achieved, all of these FCF ROI
performance rights will lapse.
Any FCF ROI performance rights that meet the hurdle become
restricted shares and are held by the Trustee until the end of the
restriction period (four years after the effective allocation date of
the performance rights).
Employee Share Rights Plan (ESRP) performance rights
As part of the employee share rights plan for financial years 2011
and 2010, certain eligible employees were provided with
performance rights that vest upon completing certain
employment requirements. If an eligible employee continues to be
employed by an entity that forms part of the Telstra Group three
years after the effective allocation date of the performance rights
(and in certain other circumstances) the performance rights will
vest. These performance rights are not subject to any
performance hurdles.
27. EMPLOYEE SHARE PLANS (CONTINUED)

NOTES TO THE FINANCIAL STATEMENTS(Continued)
Telstra Corporation Limited and controlled entities178 Telstra Annual Report
Telstra Growthshare Trust (continued)
(b) Long term incentive (LTI) plans (continued)
(iii) Performance hurdles (continued)
Options
Details of the performance hurdles relevant to options are set out
below:
ESOP options and US ESOP options
As part of the employee share option plan for financial year 2009,
certain eligible employees were provided with options that vest
upon completing certain employment requirements. If an eligible
employee continues to be employed by an entity that forms part of
the Telstra Group three years after the effective allocation date of
the options (and in certain other circumstances), the options will
vest. These options are not subject to any performance hurdles.
Relative Total Shareholder Return (RTSR) options
For RTSR options for financial year 2009, the applicable
performance hurdle is based on comparing the TSR growth of
Telstra against other companies in the peer group. Telstra is then
given a score to determine its rank by comparison with the peer
group. The RTSR options vest only if Telstra achieves a rank of at
least the 50th percentile.
The Board has the discretion to amend the members in the peer
group, as well as make necessary adjustments to the calculation
of the TSR amount, TSR growth or rank.
For RTSR options, there are three performance periods:
• first performance period - 1 July 2008 to 30 June 2010
• second performance period - 1 July 2008 to 30 June 2011
• third performance period - 1 July 2008 to 30 June 2012.
The result for each performance period is separately measured. If
Telstra achieves a rank greater than or equal to the 50th percentile
for the performance period, then:
• the number of TSR options that will vest for that performance
period is scaled proportionately from the 50th percentile (at
which 25 per cent of the allocation becomes exercisable) to the
75th percentile (at which 100 per cent of the allocation
becomes exercisable)
• 25 per cent of any unvested options for that performance
period will lapse.
If Telstra achieves a rank of less than the 50th percentile for the
performance period, then none of the options allocated for that
performance period will vest and 25 per cent of the options will
lapse.
In addition, for the third performance period, if Telstra's rank
meets or exceeds:
• both the 50th percentile and the rank achieved in the first
performance period, the remaining unvested options from the
first performance period will vest, and/or
• both the 50th percentile and the rank achieved in the second
performance period, the remaining unvested options from the
second performance period will vest.
The number of additional unvested options which may vest is also
determined by using a linear scale.
If Telstra achieves a rank of less than the 50th percentile for the
third performance period, then no options will vest for the third
performance period. Furthermore, any remaining unvested
options will lapse following the end of the third performance
period.
Restricted shares
Details of the relevant performance hurdles in relation to
restricted shares are set out below:
GE Telstra Wholesale restricted shares
As part of the financial year 2014 and 2013 GE Telstra Wholesale
restricted share plans, the GE Telstra Wholesale was provided
with restricted shares. Performance hurdles were applied in
determining the number of restricted shares allocated and
therefore the restricted shares are not subject to any performance
hurdles.
Employee Share Plan (ESP) restricted shares
As part of the financial year 2014, 2013 and 2012 ESP, certain
eligible employees were provided with restricted shares. There are
no performance hurdles for these restricted shares.
27. EMPLOYEE SHARE PLANS (CONTINUED)

NOTES TO THE FINANCIAL STATEMENTS(Continued)
Financial Report
Telstra Corporation Limited and controlled entitiesTelstra Annual Report 179
Telstra Growthshare Trust (continued)
(b) Long term incentive (LTI) plans (continued)
(iv) Summary of movements and other information
(*) Forfeited refers to either instruments that lapsed on cessation
of employment or the instrument lapsing unexercised.
(#) Exercised refers to either options exercised during the year or
performance rights and restricted shares released from
restriction.
(^) Expired refers to the performance hurdle not being met.
27. EMPLOYEE SHARE PLANS (CONTINUED)
Number of equity instruments
Outstanding
at
30 June 2013 Granted Forfeited (*) Exercised (#) Expired (^)
Outstanding
at
30 June 2014
Exercisable
at
30 June 2014
Growthshare 2009
ESOP options......................................... 9,169,697 - (4,734,733) (4,434,964) - - -
US ESOP options................................... 29,000 - (17,500) (11,500) - - -
RTSR options ......................................... 2,329,659 - (55,329) (2,274,330) - - -
Growthshare 2010
RTSR performance rights..................... 3,674,716 - - (3,674,716) - - -
FCF ROI performance rights................. 2,116,894 - - (2,116,894) - - -
Growthshare 2011
ESRP performance rights..................... 982,905 - (13,400) (969,505) - - -
RTSR performance rights..................... 5,069,579 - (154,160) - - 4,915,419 -
FCF ROI performance rights................. 5,059,346 - (154,160) - - 4,905,186 -
Growthshare 2012
ESP restricted shares........................... 2,138,600 - - (214,700) - 1,923,900 -
RTSR performance rights..................... 2,453,859 - (35,169) - - 2,418,690 -
FCF ROI performance rights................. 2,453,859 - (35,169) - (1,056,968) 1,361,722 -
Growthshare 2013
ESP restricted shares........................... 2,483,900 - - (254,000) - 2,229,900 -
RTSR performance rights..................... 2,469,604 - (194,226) - - 2,275,378 -
FCF ROI performance rights................. 2,469,604 - (194,226) - - 2,275,378 -
GE Telstra Wholesale restricted shares 116,371 - - - - 116,371 -
Growthshare 2014
ESP restricted shares........................... - 2,695,300 - (89,700) - 2,605,600 -
RTSR performance rights..................... - 2,705,618 (145,383) - - 2,560,235 -
FCF ROI performance rights................. - 2,705,618 (145,383) - - 2,560,235 -
GE Telstra Wholesale restricted shares - 133,595 - - - 133,595 -

NOTES TO THE FINANCIAL STATEMENTS(Continued)
Telstra Corporation Limited and controlled entities180 Telstra Annual Report
Telstra Growthshare Trust (continued)
(b) Long term incentive (LTI) plans (continued)
(iv) Summary of movements and other information (continued)
(*) Forfeited refers to either instruments that lapsed on cessation
of employment or the instrument lapsing unexercised.
(#) Exercised refers to either options exercised during the year or
performance rights and restricted shares released from
restriction.
(^) Expired refers to the performance hurdle not being met.
27. EMPLOYEE SHARE PLANS (CONTINUED)
Number of equity instruments
Outstanding
at
30 June 2012 Granted Forfeited (*) Exercised (#) Expired (^)
Outstanding
at
30 June 2013
Exercisable at
30 June 2013
Growthshare 2006
RG performance rights ........................... 40,517 - (22,398) (18,119) - - -
NT performance rights ........................... 18,313 - (9,166) (9,147) - - -
Growthshare 2008
ESOP options........................................... 10,133,145 - (10,132,395) (750) - - -
ROI options .............................................. 3,337,162 - (540,941) (2,796,221) - - -
Growthshare 2009
ESOP options........................................... 11,653,546 - (960,028) (1,523,821) - 9,169,697 9,169,697
US ESOP options..................................... 36,000 - (2,000) (5,000) - 29,000 29,000
RTSR options ........................................... 4,992,832 - (196,958) (2,466,215) - 2,329,659 2,329,659
Growthshare 2010
ESRP performance rights....................... 1,555,645 - (212,652) (1,342,993) - - -
RTSR performance rights....................... 3,848,717 - (174,001) - - 3,674,716 -
FCF ROI performance rights................... 2,346,779 - (229,885) - - 2,116,894 -
Growthshare 2011
ESRP performance rights....................... 1,076,385 - (93,480) - - 982,905 -
RTSR performance rights....................... 5,639,238 - (569,659) - - 5,069,579 -
FCF ROI performance rights................... 5,639,238 - (579,892) - - 5,059,346 -
Growthshare 2012
ESP restricted shares............................. 2,357,100 - - (218,500) - 2,138,600 -
RTSR performance rights....................... 2,749,267 - (295,408) - - 2,453,859 -
FCF ROI performance rights................... 2,749,267 - (295,408) - - 2,453,859 -
Growthshare 2013
ESP restricted shares............................. - 2,556,700 - (72,800) - 2,483,900 -
RTSR performance rights....................... - 2,664,516 (194,912) - - 2,469,604 -
FCF ROI performance rights................... - 2,664,516 (194,912) - - 2,469,604 -
GE Telstra Wholesale restricted shares - 116,371 - - - 116,371 -

NOTES TO THE FINANCIAL STATEMENTS(Continued)
Financial Report
Telstra Corporation Limited and controlled entitiesTelstra Annual Report 181
Telstra Growthshare Trust (continued)
(b) Long term incentive (LTI) plans (continued)
(iv) Summary of movements and other information (continued)
(*) Options include RTSR, ROI, ESOP and US ESOP options. The
options “exercised” includes those participants who have been
made redundant and are then consequently entitled to the Telstra
shares.
(^) Performance rights include RG, NT, RTSR, FCF ROI and ESRP
performance rights.
(#) Restricted shares relate to GE Telstra Wholesale and ESP
restricted shares.
(**) The fair value of these instruments is calculated using an
option pricing model that takes into account various factors,
including the exercise price and expected life of the instrument,
the current price of the underlying share and its expected
volatility, expected dividends, the risk-free rate for the expected
life of the instrument, and the expected average volatility of
Telstra’s peer group companies.
(***) The fair value of these instruments is based on the market
value of Telstra shares at the allocation date.
(^^) The weighted average share price for instruments exercised
during financial year 2013 was $4.65 for the financial years 2008
and 2009 allocation of options, $3.73 for the financial years 2006
and 2010 allocation of performance rights, and $4.41 for financial
years 2012 and 2013 allocation of ESP restricted shares
respectively. These share prices were based on the closing market
price on the exercise dates.
(##) The weighted average share price for instruments exercised
during financial year 2014 was $5.03 for the financial year 2009
allocation of options, $4.92 for the financial years 2010 and 2011
allocations of performance rights, and $5.11 for financial years
2012, 2013 and 2014 allocations of ESP restricted shares
respectively. These share prices were based on the closing market
price on the exercise dates.
27. EMPLOYEE SHARE PLANS (CONTINUED)
Options (*) Performance rights (^) Restricted Shares (#)
Number
Weighted
average fair
value (**) Number
Weighted
average fair
value (**) Number
Weighted
average fair
value (***)
Outstanding
as at 30 June 2012.................. 30,152,685 $0.32 25,663,366 $1.95 2,357,100 $3.36
Granted.................................... - - 5,329,032 $2.71 2,673,071 $4.55
Forfeited .................................. (11,832,322) $0.42 (2,871,773) $2.16 - -
Exercised (^^) .......................... (6,792,007) $0.35 (1,370,259) $2.89 (291,300) $3.66
Expired..................................... - - - - - -
Outstanding
as at 30 June 2013.................. 11,528,356 $0.21 26,750,366 $2.03 4,738,871 $4.01
Granted.................................... - 5,411,236 $3.05 2,828,895 $5.10
Forfeited .................................. (4,807,562) $0.22 (1,071,276) $2.50 - -
Exercised (##) ........................ (6,720,794) $0.20 (6,761,115) $1.71 (558,400) $4.19
Expired..................................... - - (1,056,968) $2.68 - -
Outstanding
as at 30 June 2014.................. - - (23,272,243) $2.31 7,009,366 $4.44
Exercisable
as at 30 June 2014.................. - - - - - -

NOTES TO THE FINANCIAL STATEMENTS(Continued)
Telstra Corporation Limited and controlled entities182 Telstra Annual Report
Telstra Growthshare Trust (continued)
(b) Long term incentive (LTI) plans (continued)
(v) Fair value of equity instruments granted
The fair value of LTI instruments granted during the financial year
was calculated using a valuation technique that is consistent with
the Black-Scholes methodology and utilises Monte Carlo
simulations. The following weighted average assumptions were
used in determining the valuation:
(*) The date on which the instruments become exercisable.
For financial year 2014 LTI FCF ROI and RTSR performance rights,
the fair value was measured at a grant date on 16 October 2013
and has been allocated over the period for which the service is
received, which commenced on 1 July 2013.
The expected stock volatility is a measure of the amount by which
the price is expected to fluctuate during a period. This was based
on historical daily and weekly closing share prices.
The fair value of financial year 2014 ESP restricted shares is based
on the market value of Telstra shares at the allocation date of 28
February 2014 and has been allocated over the period for which
the service is received, which commenced on 1 July 2013.
The fair value of financial year 2014 GE Telstra Wholesale
restricted shares is based on the market value of Telstra shares at
the allocation date of 15 August 2013.
27. EMPLOYEE SHARE PLANS (CONTINUED)
Growthshare
LTI FCF ROI
performance
rights
Growthshare
LTI RTSR
performance
rights
Growthshare
LTI FCF ROI
performance
rights
Growthshare
LTI RTSR
performance
rights
Oct 2013 Oct 2013 Oct 2012 Oct 2012
Share price ..................................................................................... $4.96 $4.96 $4.03 $4.03
Risk-free rate ................................................................................. 3.17% 3.17% 2.51% 2.51%
Dividend yield ................................................................................ 7.0% 7.0% 8.0% 8.0%
Expected stock volatility ............................................................... 17.0% 17.0% 19.0% 19.0%
Expected life................................................................................... (*) (*) (*) (*)
Expected rate of achievement of TSR performance hurdles...... n/a 39.4% n/a 44%

NOTES TO THE FINANCIAL STATEMENTS(Continued)
Financial Report
Telstra Corporation Limited and controlled entitiesTelstra Annual Report 183
Telstra Growthshare Trust (continued)
(c) Telstra Directshare and Ownshare
(i) Nature of Telstra Directshare and Ownshare
Telstra Directshare
The Directshare plan, previously operated by the Company, was
cancelled with effect from August 2012 as it is no longer in use.
Under the Directshare plan, non-executive Directors could
nominate to receive a percentage of their total remuneration
package as Telstra shares (allocated to participating Directors at
market price). As a result of its cancellation, no new grants may be
made under the Directshare plan. Existing grants under the plan
will remain on foot and, under the terms of the Directshare plan
and the relevant trust deed, will continue to apply to such grants.
The restriction period on Directshares already allocated continues
until the earliest of:
• 10 years from the date of allocation of the shares
• the time when the participating Director is no longer a Director
of, or is no longer employed by, a company in the Telstra Group
• the time when the Trustee determines that an “event” under the
terms of Directshare has occurred.
Telstra Ownshare
The Ownshare plan, previously operated by the Company, has not
been offered since October 2013 and will not be offered in the
future. Under the Ownshare plan, certain eligible employees
could, at their election, be provided with part of their remuneration
in Telstra shares. Shares were acquired by the trustee from time to
time and allocated to these employees at the time when their
application was accepted. Although the trustee holds the shares
in trust, the participant retains the beneficial interest in the
shares (dividends, voting rights, bonuses or rights issues) until
they are transferred at the expiration of the restriction period.
The restriction period continues until the earliest of:
• three years from the date of allocation
• the time when the participant ceases employment with the
Telstra Group
• the time when the Board of Telstra determines that an ‘event’
has occurred.
At the end of the restriction period, the Ownshare instruments will
be transferred to the participant (unless the participant directs
the trustee to sell the Ownshare instruments on the participant’s
behalf). The participant is not able to deal in the shares until this
transfer has taken place.
Existing grants under the plan will remain on foot under the terms
of the Ownshare plan and the relevant trust deed will continue to
apply to such grants.
(ii) Instruments granted during the financial year
No instruments were granted under the Ownshare plan during
financial year 2014, therefore the weighted average fair value of
fully paid shares granted to participants as at 30 June 2014 was
nil (2013: $4.03) and the total fair value of shares granted was nil
(2013: $632,808).
27. EMPLOYEE SHARE PLANS (CONTINUED)

NOTES TO THE FINANCIAL STATEMENTS(Continued)
Telstra Corporation Limited and controlled entities184 Telstra Annual Report
Telstra Growthshare Trust (continued)
(c) Telstra Directshare and Ownshare (continued)
(iii) Summary of movements
The table below provides information about our Directshare and
Ownshare plans.
(*) The number of Ownshare instruments granted is based on the
weighted average price of a Telstra share in the week ending on
the day before the allocation date, in conjunction with the
remuneration foregone.
(^) Directshares and Ownshare instruments are not required to be
exercised. The fully paid shares held by the Telstra Growthshare
Trust relating to these instruments are transferred to the
participants at the completion of the restriction period (unless an
Ownshare participant directs the trustee to sell the Ownshare
instruments on the participant’s behalf).
27. EMPLOYEE SHARE PLANS (CONTINUED)
Number of equity instruments
Outstanding at
30 June 2012
Granted
(*) Distributed (^)
Outstanding at
30 June 2013 Distributed (^)
Outstanding at
30 June 2014
Directshares
5 September 2003 allocation .............. 9,525 - (7,648) 1,877 (1,877) -
20 February 2004 allocation................ 10,233 - (8,216) 2,017 (2,017) -
20 August 2004 allocation ................... 2,755 - (2,212) 543 - 543
19 February 2005 allocation................ 7,911 - (5,911) 2,000 - 2,000
19 August 2005 allocation ................... 5,248 - (2,875) 2,373 - 2,373
17 February 2006 allocation................ 8,230 - (4,499) 3,731 - 3,731
18 August 2006 allocation ................... 12,343 - (5,697) 6,646 - 6,646
23 February 2007 allocation................ 14,522 - (5,061) 9,461 - 9,461
17 August 2007 allocation ................... 15,343 - (4,836) 10,507 - 10,507
29 February 2008 allocation................ 24,968 - (9,283) 15,685 - 15,685
21 August 2008 allocation ................... 33,449 - (14,082) 19,367 - 19,367
6 March 2009 allocation ...................... 57,059 - (15,152) 41,907 - 41,907
21 August 2009 allocation ................... 6,313 - - 6,313 - 6,313
19 February 2010 allocation................ 6,809 - - 6,809 - 6,809
214,708 - (85,472) 129,236 (3,894) 125,342
Ownshares
24 December 2009 allocation.............. 110,122 - (110,122) - - -
5 November 2010 allocation ................ 146,065 - (7,683) 138,382 (138,382) -
21 October 2011 allocation.................. 175,836 - (10,923) 164,913 (20,945) 143,968
23 October 2012 allocation.................. - 157,149 (2,356) 154,793 (13,691) 141,102
432,023 157,149 (131,084) 458,088 (173,018) 285,070

NOTES TO THE FINANCIAL STATEMENTS(Continued)
Financial Report
Telstra Corporation Limited and controlled entitiesTelstra Annual Report 185
Telstra Growthshare Trust (continued)
(d) Other equity plans
In exceptional circumstances, Telstra has put in place structured
retention incentive plans. These are designed to protect Telstra
from the loss of employees who possess specific skill sets
considered critical to the business and where Telstra is vulnerable
to losing key personnel. Such retention plans are not restricted to
senior executives. The plans are granted on an ad hoc basis and
the participants receive Telstra shares subject to satisfaction of
certain conditions.
As part of his service agreement negotiated upon appointment,
the Chief Financial Officer (CFO) and GE, International was
allocated 96,500 performance shares of which 50 per cent are
eligible to vest after two years and the remaining 50 per cent are
eligible to vest after three years from the date of commencement
of his employment. Vesting is subject to an assessment of
performance by the Board and performance shares are forfeited in
the event of resignation before vesting. In the event of redundancy
or termination of employment for no reason, a pro rata entitlement
of the performance shares as at the time of cessation of
employment vests. During financial year 2014, the first tranche of
48,250 performance shares vested on 14 December 2013.
TESOP99 and TESOP97
As part of the Commonwealth’s sale of its shareholding in
financial years 2000 and 1998, Telstra offered eligible employees
the opportunity to buy ordinary shares of Telstra.
The applicable share plans were:
• the Telstra Employee Share Ownership Plan II (TESOP99)
• the Telstra Employee Share Ownership Plan (TESOP97).
Although the Telstra ESOP Trustee Pty Ltd (wholly owned
subsidiary of Telstra) is the trustee for TESOP99 and TESOP97 and
holds the shares in the trust, the participating employee retains
the beneficial interest in the shares (dividends and voting rights).
Generally, Telstra offered employees interest free loans to acquire
certain shares, and in some cases the employees became entitled
to certain extra shares and loyalty shares as a result of
participating in the plans. All shares acquired under the plans
were transferred from the Commonwealth either to the employees
or to the trustee for the benefit of the employees.
While a participant remains an employee of an entity within the
Telstra Group or, in the case of TESOP97 only, the company that
was their employer when the shares were acquired, there is no
date by which the employee must repay the loan. However, a
participant may, at any time:
• elect to repay the loan and have the shares transferred into
their name or
• arrange through the trustee the sale of the shares where the
proceeds of the sale (after deducting the costs of sale) will be
enough to repay the loan.
The loan shares, extra shares and, in the case of TESOP99, the
loyalty shares were subject to a restriction on the sale of the
shares or transfer to the employee for three years or until the
relevant employment ceased. This restriction period has now been
fulfilled under each plan.
If a participant ceases to be employed by an entity within the
Telstra Group or, in the case of TESOP97 only, the company that
was their employer when the shares were acquired, the employee
must repay their loan within two months of leaving to acquire the
relevant shares. This is the case except where the restriction
period has ended because of the employee’s death or disablement
(in which case the loan must be repaid within 12 months).
If the employee has ceased employment and does not repay the
loan when required, the trustee must sell the shares if the sale
proceeds (after deducting the costs of sale) will be enough to
repay the loan. The sale proceeds must then be used to pay the
costs of the sale and any amount outstanding on the loan, after
which the balance will be paid to the employee. The Telstra
Entity’s recourse under the loan is limited to the amount
recoverable through the sale of the employee’s shares.
27. EMPLOYEE SHARE PLANS (CONTINUED)

NOTES TO THE FINANCIAL STATEMENTS(Continued)
Telstra Corporation Limited and controlled entities186 Telstra Annual Report
TESOP99 and TESOP97 (continued)
The Telstra ESOP Trust Trustee continues to hold loan shares
where the employee ceased employment and elected not to repay
the loan, until the share price is sufficient to recover the loan
amount and associated costs of sale. The Trustee is then required
to sell the shares. As at 30 June 2014, there were 148,800 (2013:
73,000) shares held for this purpose.
The following table provides information about our TESOP99 and
TESOP97 share plans.
(*) The fair value of these shares is based on the market value of
Telstra shares at reporting date and exercise date.
(#) The amount exercised relates to the shares released from trust
as a result of the interest free loan to employees being fully repaid
during the year.
(^) The amount sold relates to loan shares disposed of to the
Growthshare Trust and external third parties during year. For
financial year 2013 only, 9,258,700 TESOP99 shares were sold in
an off market transaction at market price to the Growthshare
Trust.
The employee share loan balance as at 30 June 2014 is $17 million
(2013: $20 million). For TESOP99, the weighted average loan still
to be repaid is $4.42 (2013: $4.64) per instrument.
27. EMPLOYEE SHARE PLANS (CONTINUED)
TESOP97 TESOP99
Weighted
average
fair value
Total fair
value
Weighted
average
fair value
Total fair
value
Number (*) $m Number (*) $m
Equity instruments outstanding and exercisable as at
30 June 2012 ....................................................................... 2,500 $3.69 - 13,754,400 $3.69 51
Exercised (#) ....................................................................... (2,500) $3.85 - (77,500) $4.38 -
Sold (^) ................................................................................. - - - (9,527,100) $4.68 45
Equity instruments outstanding and exercisable as at
30 June 2013 ....................................................................... - - - 4,149,800 $4.77 20
Exercised (#) ....................................................................... - - - (96,000) $5.09 -
Sold (^) ................................................................................. - - - (236,400) $5.17 1
Equity instruments outstanding and exercisable as at
30 June 2014 ....................................................................... - - - 3,817,400 $5.21 20
NOTES TO THE FINANCIAL STATEMENTS(Continued)
Financial Report
Telstra Corporation Limited and controlled entitiesTelstra Annual Report 187
In accordance with AASB 124: “Related Party Disclosures”, key
management personnel (KMP) have authority and responsibility
for planning, directing and controlling the activities of the Telstra
Group. Hence, KMP are deemed to include the following:
• the non-executive Directors of the Telstra Entity; and
• certain executives in the Chief Executive Officer’s (CEO’s) senior
leadership team, including the CEO.
KMP aggregate compensation
During financial years 2014 and 2013, the aggregate
compensation provided to our KMP was as follows:
Refer to the Remuneration Report, which is part of the Directors’
Report for further details regarding KMP’s remuneration.
Other transactions with our KMP and their related parties
During financial year 2014, apart from transactions trivial and
domestic in nature and on normal commercial terms and
conditions, there were no other transactions with our KMP and
their related parties.
28. KEY MANAGEMENT PERSONNEL COMPENSATION
Telstra Group
As at 30 June
2014 2013
$ $
Short term employee benefits ............................................................................................................................... 20,991,753 23,215,153
Post employment benefits ..................................................................................................................................... 322,011 385,612
Other long term benefits ........................................................................................................................................ 4,845,292 261,494
Termination benefits .............................................................................................................................................. 1,020,456 -
Share-based payments.......................................................................................................................................... 9,161,751 8,919,444
36,341,263 32,781,703

NOTES TO THE FINANCIAL STATEMENTS(Continued)
Telstra Corporation Limited and controlled entities188 Telstra Annual Report
Transactions involving our controlled entities
Interests in controlled entities are set out in note 25. Our
transactions with our controlled entities recorded in the income
statement and statement of financial position are as follows.
(a) The Telstra Entity sold and purchased goods and services and
received and paid interest to its controlled entities. These
transactions are in the ordinary course of business and are on
normal commercial terms and conditions.
On 28 February 2014, we divested 70 per cent of our directories
business via disposal of our 100 per cent shareholding in the
Sensis Pty Ltd and its controlled entities (Sensis Group) and
acquisition of 30 per cent of Project Sunshine I Pty Ltd, the new
holding company of the Sensis Group. Refer to notes 12, 25 and 26
for further details. As a result, transactions with our controlled
entities include only eight months of transactions with the Sensis
Group and any transactions subsequent to the date of disposal,
have been included in transactions with our joint ventures and
associated entities.
• the Telstra Entity received procurement fees from its
controlled entity Sensis Pty Ltd for the use of Yellow Pages®
and White Pages® trademarks amounting to $63 million to the
date of the Sensis Group disposal (2013: $263 million). As at 30
June 2014, the Telstra Entity recorded nil revenue received in
advance (2013: $136 million) for the use of these trademarks
• the Telstra Entity paid management fees to its controlled entity
Sensis Pty Ltd amounting to $190 million to the date of the
Sensis Group disposal (2013: $329 million) for undertaking
agency and contract management services for the national
directory service.
Details of other significant transactions involving our controlled
entities during financial year 2014 are as follows:
• the Telstra Entity received income from its controlled entity
Telstra Multimedia Pty Ltd amounting to $367 million (2013:
$367 million) for access to ducts that store the hybrid fibre
coaxial (HFC) cable network
• the Telstra Entity paid for international connectivity and
management services to Telstra International Limited
amounting to $249 million (2013: $221 million).
29. RELATED PARTY DISCLOSURES
Telstra Entity
Year ended/As at
30 June
2014 2013
$m $m
Income from controlled entities
Sale of goods and services (a)............................................................................................................................... 541 789
Dividend revenue (b) .............................................................................................................................................. 217 635
Expenses to controlled entities
Purchase of goods and services (a) ...................................................................................................................... 713 746
Finance costs ......................................................................................................................................................... 9 24
Total amounts receivable at 30 June
Current
Controlled entities - receivables (d) ..................................................................................................................... 60 1,119
Controlled entities - loans (e)(f) ............................................................................................................................ 3,466 3,387
Allowance for amounts owed by controlled entities (e)...................................................................................... (3,074) (3,163)
452 1,343
Movement in allowance for amounts owed by controlled entities
Opening balance .................................................................................................................................................... (3,163) (2,948)
Reversal of impairment loss (c) ............................................................................................................................ 89 -
Impairment loss (c) ................................................................................................................................................ - (215)
Closing balance (e)................................................................................................................................................. (3,074) (3,163)
Total amounts payable at 30 June
Current
Controlled entities - payables (a)(d) ..................................................................................................................... 77 250
Controlled entities - loans (e) ............................................................................................................................... 3,826 1,936
3,903 2,186

NOTES TO THE FINANCIAL STATEMENTS(Continued)
Financial Report
Telstra Corporation Limited and controlled entitiesTelstra Annual Report 189
Transactions involving our controlled entities (continued)
(b) During financial year 2014, the Telstra Entity recorded dividend
revenue, including mainly:
• $150 million (2013: $114 million) from Telstra Media Pty
Limited
• $64 million (2013: $518 million) from Telstra Holdings Pty Ltd.
(c) The profit before income tax expense of the Telstra Entity
includes a reversal of impairment loss of $89 million (2013:
impairment loss of $215 million) relating to a movement in
allowance for amounts owed by controlled entities.
(d) The Telstra Entity and its Australian controlled entities have
formed a tax consolidated group, with a tax funding arrangement
currently in place. The amounts receivable or amounts payable to
the Telstra Entity under this arrangement are due in the next
financial year upon final settlement of the current tax payable for
the tax consolidated group. Refer to note 9 for further details.
(e) The Telstra Entity operates a current account with some of its
controlled entities, being an internal group bank account used to
settle transactions with these controlled entities or between two
controlled entities. Cash deposit balances in the current account
owed to these controlled entities are recorded as loans. All loan
balances with our controlled entities are unsecured, with
settlement required in cash. As at 30 June 2014, $3,324 million
(2013: $3,244 million) related to loans owed by controlled entities,
and $3,826 million (2013: $1,935 million) related to loans payable
to controlled entities. We also have an allowance for amounts
owed by controlled entities of $3,074 million (2013: $3,163 million)
as at 30 June 2014.
(f) As at 30 June 2014, the Telstra Entity had a loan of $142 million
(2013: $142 million) with Telstra OnAir Holdings Pty Ltd. This loan
is an interest free loan.
Transactions involving our joint ventures and associated
entities
Interests in our joint ventures and associated entities are set out
in note 26. Our transactions with our joint ventures and
associated entities recorded in the income statement and
statement of financial position are as follows.
29. RELATED PARTY DISCLOSURES (CONTINUED)
Telstra Group
Year ended/As at
30 June
2014 2013
$m $m
Income from joint ventures and associated entities
Sale of goods and services (g)............................................................................................................................... 177 135
Distribution from Foxtel Partnership (h) .............................................................................................................. 165 155
Interest on loans to joint ventures and associated entities (i) ........................................................................... 54 53
Expenses to joint ventures and associated entities
Purchase of goods and services (g) ...................................................................................................................... 775 749
Total amounts receivable at 30 June
Current
Joint ventures and associated entities - trade receivables (g) .......................................................................... 3 2
3 2
Non current
Joint ventures and associated entities - loans (i) ............................................................................................... 457 457
Allowance for amounts owed by joint ventures and associated entities (i) ...................................................... (6) (6)
451 451
Movement in allowance for amounts owed by joint ventures and associated entities
Opening balance .................................................................................................................................................... (6) (5)
Foreign currency exchange differences ............................................................................................................... - (1)
Closing balance...................................................................................................................................................... (6) (6)
Total amounts payable at 30 June
Current
Joint ventures and associated entities - payables (g) ........................................................................................ 58 56

NOTES TO THE FINANCIAL STATEMENTS(Continued)
Telstra Corporation Limited and controlled entities190 Telstra Annual Report
Transactions involving our joint ventures and associated
entities (continued)
(g) We sold and purchased goods and services, and received
interest from our joint ventures and associated entities. These
transactions were in the ordinary course of business and on
normal commercial terms and conditions.
Details of our individually significant transactions involving our
joint ventures and associated entities during financial year 2014
are as follows:
• we purchased pay television services amounting to $668
million (2013: $655 million) from our joint venture Foxtel. The
purchases were to enable the resale of Foxtel services,
including pay television content, to our existing customers as
part of our ongoing product bundling initiatives. In addition, we
made sales to Foxtel for our cost recoveries of $119 million
(2013: $119 million)
• we made purchases of $23 million (2013: $27 million) from our
joint venture Reach Ltd (Reach) in line with market prices.
These were for the purchase of, and entitlement to, capacity
and connectivity services.
(h) A $165 million (2013: $155 million) distribution was received
from our joint venture Foxtel during the year.
(i) Loans provided to joint ventures and associated entities relate
to loans provided to Reach of $6 million (2013: $6 million) and
Foxtel Management Pty Ltd of $451 million (2013: $451 million).
The loan provided to Reach is an interest free loan and repayable
upon the giving of 12 months’ notice by both PCCW Limited and us.
We have fully provided for the non-recoverability of the loan as we
do not consider that Reach is in a position to be able to repay the
loan amount in the medium term.
In April 2012, Telstra Corporation Limited provided a loan to Foxtel
Management Pty Ltd to fund the acquisition of shares in AUSTAR.
The loan is interest bearing and it has a minimum term of just over
10 years and a maximum of 15 years.
Commitments to and from our joint ventures and associated
entities
Our purchase commitments to Project Sunshine I Pty Ltd,
primarily for advertising services, amount to $69 million.
Project Sunshine I Pty Ltd commitments to Telstra, mainly for
telecommunication services and property subleases amount to
$95 million.
Transactions involving other related entities
Post employment benefits
As at 30 June 2014, the Telstra Superannuation Scheme (Telstra
Super) owned 38,774,394 shares in Telstra Corporation Limited
(2013: 40,152,463) at a cost of $135 million (2013: $136 million)
and a market value of $202 million (2013: $192 million). All of
these shares were fully paid at 30 June 2014. In financial year
2013, we paid dividends to Telstra Super of $11 million (2013: $10
million). We own 100 per cent of the equity of Telstra Super Pty Ltd,
the trustee of Telstra Super.
Telstra Super also holds bonds issued by Telstra Corporation
Limited. These bonds had a cost of $16 million (2013: $6 million)
and a market value of $16 million (2013: $6 million) at 30 June
2014.
All purchases and sales of Telstra shares and bonds by Telstra
Super are determined by the trustee and/or its investment
managers on behalf of the members of Telstra Super.
Key management personnel (KMP)
Refer to note 28 for further details on our KMP’s remuneration and
their other related parties transactions.
29. RELATED PARTY DISCLOSURES (CONTINUED)

NOTES TO THE FINANCIAL STATEMENTS(Continued)
Financial Report
Telstra Corporation Limited and controlled entitiesTelstra Annual Report 191
(a) Includes reversal of $595 million of impairment losses (2013:
$722 million of impairment losses) relating to the value of our
investments in, and amounts owed by, our controlled entities. The
impairment losses have been eliminated on consolidation of the
Telstra Group.
Except for those noted below, our accounting policies for the
Telstra Entity are consistent with those for the Telstra Group:
• under our tax funding arrangements, amounts receivable (or
payable) recognised by the Telstra Entity for the current tax
payable (or receivable) assumed from our wholly owned
entities are booked as current assets or liabilities
• investments in controlled entities, included within non current
assets above, are recorded at cost less impairment of the
investment value. Where we hedge the value of our investment
in an overseas controlled entity, the hedge is accounted for in
accordance with note 2.22. Refer to note 25 for details on our
investments in controlled entities
• our interests in associated entities and joint ventures,
including partnerships, are accounted for using the cost
method of accounting and are included within non current
assets in the table above.
Property, plant and equipment commitments
Total property, plant and equipment expenditure commitments
contracted for at balance date but not recorded in the financial
statements amounted to $847 million (2013: $1,222 million).
30. PARENT ENTITY INFORMATION
Telstra Entity
As at 30 June
2014 2013
$m $m
Statement of financial position
Total current assets ............................................................................................................................................... 10,137 8,145
Total non current assets (a)................................................................................................................................... 31,896 31,870
Total assets ........................................................................................................................................................... 42,033 40,015
Total current liabilities........................................................................................................................................... 12,077 8,707
Total non current liabilities ................................................................................................................................... 16,586 17,857
Total liabilities ...................................................................................................................................................... 28,663 26,564
Share capital .......................................................................................................................................................... 5,719 5,711
Cashflow hedging reserve ..................................................................................................................................... (122) (92)
General reserve...................................................................................................................................................... 194 194
Retained profits ..................................................................................................................................................... 7,579 7,638
Total equity............................................................................................................................................................ 13,370 13,451
Telstra Entity
Year ended 30 June
Restated
2014 2013
$m $m
Statement of comprehensive income
Profit for the year (a) .............................................................................................................................................. 3,407 3,760
Total comprehensive income ................................................................................................................................ 3,457 4,297

NOTES TO THE FINANCIAL STATEMENTS(Continued)
Telstra Corporation Limited and controlled entities192 Telstra Annual Report
Contingent liabilities and guarantees
Common law claims
Asbestos-related claims
For asbestos claims made under common law, we assess each
claim on a case by case basis. Asbestos liabilities are inherently
difficult to estimate due to the extremely long term nature of
asbestos claims and the risk of significant changes in case law,
legislation, litigation processes and medical developments.
Therefore, arriving at any estimate will inevitably involve
significant judgement about assumptions used and actual
amounts could be considerably different from initial estimates.
In light of the significant uncertainty associated with asbestos
claims, the associated costs of resolution are not able to be
measured with sufficient reliability and, as required by accounting
standards, no provision has been made to cover these liabilities as
at 30 June 2014. These claims will continue to be assessed and
where appropriate, settled on a case by case basis. We do not
expect that the liability and costs associated with asbestos claims
will have a material adverse effect on our financial position,
results of operations or cash flows.
Other claims
Certain common law claims by employees and third parties are yet
to be resolved. As at 30 June 2014, management believes that the
resolution of these contingencies will not have a significant effect
on the Telstra Entity’s financial results. The maximum amount of
these contingent liabilities cannot be reliably estimated.
Indemnities, performance guarantees and financial support
We have provided the following indemnities, performance
guarantees and financial support through the Telstra Entity:
• indemnities to financial institutions to support bank
guarantees to the value of $483 million (2013: $455 million) in
respect of the performance of contracts
• indemnities to financial institutions and other third parties in
respect of performance and other obligations of our controlled
entities. The maximum amount of our contingent liabilities for
this purpose is $130 million (2013: $212 million)
• indemnities to financial institutions in respect of the
obligations of TelstraClear to third parties of $27 million (2013:
$25 million). We have, however, received an indemnity for an
equal amount from the acquirer as part of the TelstraClear
disposal
• financial support for certain controlled entities to the amount
necessary to enable those entities to meet their obligations as
and when they fall due. The financial support is subject to
conditions, including individual monetary limits totalling $45
million (2013: $134 million) and a requirement that the entity
remains our controlled entity
• during financial year 1998 we resolved to provide IBM Global
Services Australia Limited (IBMGSA) with guarantees issued on
a several basis up to $210 million as a shareholder of IBMGSA.
During financial year 2000 we issued a guarantee of $68 million
on behalf of IBMGSA. During financial year 2004, we sold our
shareholding in this entity. The $68 million guarantee, provided
to support service contracts entered into by IBMGSA and third
parties, was made with IBMGSA bankers or directly to IBMGSA
customers. As at 30 June 2014, this guarantee remains
unchanged and $142 million (2013: $142 million) of the $210
million guarantee facility remains unused.
Upon sale of our shareholding in IBMGSA and under the deed of
indemnity between shareholders, our liability under these
performance guarantees has been indemnified for all guarantees
that were in place at the time of sale. Therefore, the overall net
exposure to any loss associated with a claim has effectively been
offset.
30. PARENT ENTITY INFORMATION (CONTINUED)

NOTES TO THE FINANCIAL STATEMENTS(Continued)
Financial Report
Telstra Corporation Limited and controlled entitiesTelstra Annual Report 193
We are not aware of any matter or circumstance that has occurred
since 30 June 2014 that, in our opinion, has significantly affected
or may significantly affect in future years:
• our operations
• the results of those operations or
• the state of our affairs
other than the following:
Final dividend
On 14 August 2014, the Directors of Telstra Corporation Limited
resolved to pay a fully franked final dividend of 15 cents per
ordinary share. The record date for the final dividend will be 29
August 2014, with payment being made on 26 September 2014.
Shares will trade excluding the entitlement to the dividend on 27
August 2014.
A provision for dividend payable amounting to $1,866 million has
been raised as at the date of resolution.
The final dividend will be fully franked at a tax rate of 30 per cent.
The financial effect of the dividend resolution was not brought to
account as at 30 June 2014.
There are no income tax consequences for the Telstra Group
resulting from the resolution and payment of the final ordinary
dividend, except for $800 million of franking debits arising from
the payment of this dividend that will be adjusted in our franking
account balance.
The Dividend Reinvestment Plan continues to be suspended.
Acquisition of controlled entity
On 11 August 2014 Telstra entered into a legally binding
agreement to acquire additional shares in Ooyala Inc., a provider
of video streaming and analytics, for a total cash consideration of
US$270 million subject to any completion adjustments. As at 30
June 2014 we owned 27 per cent (undiluted) of equity in Ooyala
Inc., which was accounted for as an available-for-sale investment
because we did not meet the AASB 128: "Investments in
Associates and Joint Ventures" criteria for equity accounting as an
associate. This transaction will increase our equity ownership of
Ooyala Inc. to 98 per cent on completion of the acquisition and,
coupled with our existing investment of US$61 million, the total
cost of our investment will be US$331 million. Completion is
subject to conditions precedent, including regulatory approval
and is expected in the next 60 days.
Capital management
On 14 August 2014, our Board resolved to undertake an off market
share buy-back of up to approximately $1 billion. The share buy-
back will be available to eligible shareholders and implemented by
way of a tender process and at a discount to market price. The
shares bought back will be cancelled by the Company, reducing
the number of shares the Company has on issue. The buy-back will
be funded by accumulated cash surplus in the Company and will
be made up of a capital and a dividend component. The dividend
component will be fully franked and our estimate of the decrease
in franking credits is $243 million, based on the assumption of
Telstra’s ASX listed share price of $5.30, buy-back discount of
10% and a non-resident shareholding of 21.8%.
31. EVENTS AFTER REPORTING DATE

DIRECTORS’ DECLARATION
Telstra Corporation Limited and controlled entities194 Telstra Annual Report
This Directors’ Declaration is required by the Corporations Act
2001 of Australia.
The Directors of Telstra Corporation Limited have made a
resolution that declared:
For and on behalf of the board
(a) in the Directors’ opinion, the financial statements and notes of the
Telstra Group for the financial year ended 30 June 2014 set out on
pages 66 to 193:
(i) comply with the Accounting Standards applicable in Australia,
International Financial Reporting Standards and
Interpretations (as disclosed in note 1.1 to the financial
statements), and Corporations Regulations 2001
(ii) give a true and fair view of the financial position of Telstra
Corporation Limited and the Telstra Group as at 30 June 2014
and of the performance of Telstra Corporation Limited and the
Telstra Group, for the year ended 30 June 2014
(iii) have been made out in accordance with the Corporations Act
2001.
(b) they have received declarations as required by section 295A of the
Corporations Act 2001
(c) at the date of this declaration, in the Directors’ opinion, there are
reasonable grounds to believe that Telstra Corporation Limited
will be able to pay its debts as and when they become due and
payable
(d) at the date of this declaration there are reasonable grounds to
believe that the members of the extended closed group identified
in note 25(a) to the financial statements, as parties to a Deed of
Cross Guarantee, will be able to meet any obligations or liabilities
to which they are, or may become subject to, under the Deed of
Cross Guarantee described in note 25(a).
Catherine B Livingstone AO
Chairman
14 August 2014
Sydney, Australia
David I Thodey
Chief Executive Officer and
Executive Director

Ernst & Young680 George Street Sydney NSW 2000 AustraliaGPO Box 2646 Sydney NSW 2001
Tel: +61 2 9248 5555Fax: +61 2 9248 5959ey.com/au
A member firm of Ernst & Young Global LimitedLiability limited by a scheme approved under Professional Standards Legislation Telstra Annual Report 195
Report on the Financial Report
We have audited the accompanying financial report of Telstra Corporation Limited, which comprises the consolidated statement of financial position as at 30 June 2014, the consolidated income statement, the consolidated statement of comprehensive income, the consolidated statement of changes in equity and the consolidated statement of cash flows for the year then ended, notes comprising a summary of significant accounting policies and other explanatory information, and the directors' declaration of the consolidated entity comprising the company and the entities it controlled at the year's end or from time to time during the financial year.
Directors’ Responsibility for the Financial Report
The directors of the company are responsible for the preparation of the financial report that gives a true and fair view in accordance with Australian Accounting Standards and the Corporations Act 2001 and for such internal controls as the directors determine are necessary to enable the preparation of the financial report that is free from material misstatement, whether due to fraud or error. In Note 1, the directors also state, in accordance with Accounting Standard AASB 101 Presentation of Financial Statements, that the financial statements comply with International Financial Reporting Standards.
Auditor’s Responsibility
Our responsibility is to express an opinion on the financial report based on our audit. We conducted our audit in accordance with Australian Auditing Standards. Those standards require that we comply with relevant ethical requirements relating to audit engagements and plan and perform the audit to obtain reasonable assurance about whether the financial report is free from material misstatement.
An audit involves performing procedures to obtain audit evidence about the amounts and disclosures in the financial report. The procedures selected depend on the auditor's judgment, including the assessment of the risks of material misstatement of the financial report, whether due to fraud or error. In making those risk assessments, the auditor considers internal controls relevant to the entity's preparation and fair presentation of the financial report in order to design audit procedures that are appropriate in the circumstances, but not for the purpose of expressing an opinion on the effectiveness of the entity's internal controls. An audit also includes evaluating the appropriateness of accounting policies used and the reasonableness of accounting estimates made by the directors, as well as evaluating the overall presentation of the financial report.
We believe that the audit evidence we have obtained is sufficient and appropriate to provide a basis for our audit opinion.
Independence
In conducting our audit we have complied with the independence requirements of the Corporations Act 2001. We have given to the directors of the company a written Auditor's Independence Declaration, a copy of which is included in the directors' report.
Opinion
In our opinion:
a. the financial report of Telstra Corporation Limited is in accordance with the Corporations Act 2001, including:
i giving a true and fair view of the consolidated entity’s
financial position as at 30 June 2014 and of its performance
for the year ended on that date; and
ii complying with Australian Accounting Standards and the Corporations Regulations 2001; and
b. the financial report also complies with International Financial Reporting Standards as disclosed in note 1.
Report on the Remuneration Report
We have audited the Remuneration Report included in pages 44 to 63 of the directors' report for the year ended 30 June 2014. The directors of the company are responsible for the preparation and presentation of the Remuneration Report in accordance with section 300A of the Corporations Act 2001. Our responsibility is to express an opinion on the Remuneration Report, based on our audit conducted in accordance with Australian Auditing Standards.
Opinion
In our opinion, the Remuneration Report of Telstra Corporation Limited for the year ended 30 June 2014, complies with section 300A of the Corporations Act 2001.
Ernst & Young
SJ Ferguson
Partner
Sydney
14 August 2014
Independent Auditor's report to the Members of Telstra Corporation Limited

Telstra Corporation Limited and controlled entities196 Telstra Annual Report
SHAREHOLDERINFORMATIONListing Information
Markets in which our shares are traded
We are listed, and all our issued shares are quoted on the Australian Securities Exchange (ASX) and the New Zealand Stock Exchange (NZX).
Markets on which our debt securities are listed
We also have debt securities listed on the ASX, the London Stock Exchange, the Singapore Stock Exchange and the Swiss Stock Exchange.
Distribution of securities and security holdings
The following table shows the number of listed shares on issue at 14 July 2014:
Distribution of shares
The following table summarises the distribution of our listed shares as at 14 July 2014:
The number of shareholders holding less than a marketable parcel of shares was 15,014 holding 659,660 shares (based on the closing market price on 14 July 2014).
Title of classIdentity of
person or groupAmount owned %
Listed Shares Listed shareholders 12,443,074,357 100.00
Size of Holding Number of Shareholders % Number of Shares %
1-1,000 663,984 47.46% 370,997,925 2.98%
1,001-5,000 507,059 36.25% 1,217,758,309 9.79%
5,001-10,000 122,814 8.78% 875,253,222 7.03%
10,001-100,000 101,333 7.24% 2,430,224,118 19.53%
100,001 and over 3,745 0.27% 7,548,840,783 60.67%
Total 1,398,935 100.00% 12,443,074,357 100.00%

SHAREHOLDERINFORMATION
Telstra Corporation Limited and controlled entitiesTelstra Annual Report 197
Substantial shareholders
As at 14 July 2014, we are not aware of any substantial shareholders
Twenty largest shareholders as at 14 July 2014
The following table sets out the Top 20 holders of our shares (when multiple holdings are grouped together):.
Voting Rights
Shareholders (whether residents or non-residents of Australia) may vote at a meeting of shareholders in person, directly or by proxy, attorney or representative, depending on whether the shareholder is an individual or a company.
Subject to any rights or restrictions attaching to our shares, on a show of hands each shareholder present in person or by proxy, attorney or representative has one vote and, on a poll, has one vote for each fully paid share held. Presently, we have only one class of fully paid ordinary shares and these do not have any voting restrictions. If shares are not fully paid, on a poll the number of votes attaching to the shares is pro-rated accordingly.
Shareholders Number of Shares % of Issued Capital
1 HSBC CUSTODY NOMINEES (AUSTRALIA) LIMITED 1,879,141,905 15.10%
2 J P MORGAN NOMINEES AUSTRALIA LTD 1,642,592,458 13.20%
3 NATIONAL NOMINEES LIMITED 1,488,764,721 11.96%
4 CITICORP NOMINEES PTY LIMITED 574,279,904 4.62%
5 BNP PARIBAS NOMS PTY LTD 302,590,368 2.43%
6 RBC INVESTOR SERVICES AUSTRALIA NOMINEES PTY LTD 120,399,393 0.97%
7 AMP LIFE LIMITED 95,608,702 0.77%
8 UBS WEALTH MANAGEMENT AUSTRALIA NOMINEES PTY LTD 53,381,807 0.43%
9 AUSTRALIAN FOUNDATION INVESTMENT COMPANY LIMITED 52,445,000 0.42%
10 UBS NOMINEES PTY LTD 42,964,417 0.35%
11 ARGO INVESTMENTS LIMITED 41,504,800 0.33%
12 NEWECONOMY COM AU NOMINEES PTY LIMITED 36,418,851 0.29%
13 QUESTOR FINANCIAL SERVICES LIMITED 31,236,364 0.25%
14 TELSTRA GROWTHSHARE PTY LTD 28,546,744 0.23%
15 NAVIGATOR AUSTRALIA LTD 25,868,444 0.21%
16 NULIS NOMINEES (AUSTRALIA) LIMITED 23,579,363 0.19%
17 SHARE DIRECT NOMINEES PTY LTD 19,461,553 0.16%
18 NETWORK INVESTMENT HOLDINGS PTY LTD 17,309,017 0.14%
19 EQUITAS NOMINEES PTY LTD 16,018,179 0.13%
20 MILTON CORPORATION LIMITED 13,610,253 0.11%
Total for Top 20 6,505,722,243 52.28%

Non-Financial Results
Key performance indicator FY14 FY13 FY12
Employee engagement(i)
Score (%)
82 80 77
Health and safety(ii)
Lost Time Injury Frequency Rate (LTIFR)
1.12 1.36 1.32
Gender equality(iii)
Women in executive management (%)
26 25 25
Volunteering during Telstra time(iv)
Total (days)
5,122 4,248 1,375
Payroll giving
Participation rate (%)
5.3 3.6 1.6
Social and community investment(iv)
Value ($m)
217 231 240
Everyone Connected
Targeted community programs (people
impacted)(‘000s)
143 146 102
Carbon emissions(v)
Tonnes of carbon dioxide equivalent
(tCO2e)(‘000s)
1,592 1,634 1,677
Carbon emissions intensity(v)
tCO2e per terabyte of data
0.58 0.83 1.24
E-waste
Mobile phones (tonnes collected)
15.3 14.0 14.3
REFERENCE TABLES
Five Year Summary - Financial Results
FY14
($m)
FY13(iii)
($m)
FY12
($m)
FY11
($m)
FY10
($m)
Total income (excluding finance income) 26,296 24,776 25,503 25,304 25,029
EBITDA(i) 11,135 10,168 10,234 10,151 10,847
EBIT(ii) 7,185 6,090 5,822 5,692 6,501
Profit for the period from continuing
operations
4,549 3,640 n/a n/a n/a
Gain/(loss) for the period from
discontinued operations
(204) 151 n/a n/a n/a
Profit for the period 4,345 3,791 3,424 3,250 3,940
Dividends declared per share (cents) 29.5 28.0 28 28 28
Total assets 39,360 38,527 39,525 37,913 39,282
Gross debt 16,048 15,628 17,222 16,232 16,031
Net debt 10,521 13,149 13,277 13,595 13,926
Total equity 13,960 12,875 11,689 12,292 13,008
Capital expenditure 3,661 3,689 3,591 3,410 3,471
Free cash flow 7,483 5,024 5,197 5,477 6,225
Earnings per share (cents) 34.4 30.1 27.5 26.1 31.4
Dividend payout ratio (%) 86 93 102 107 89
(i) Operating profit before interest, depreciation
and amortisation and income tax expense.
EBITDA is used as a measure of financial
performance by excluding certain variables
that affect operating profits but which may
not be directly related to all financial aspects
of the operations of the company. EBITDA is
not a measure of operating income, operating
performance or liquidity under A-IFRS. Other
companies may calculate EBITDA in a different
manner to us.
(ii) EBITDA less depreciation and amortisation.
(iii) Restated for the retrospective adoption of
AASB:119 "Employee Entitlements".
(i) Telstra Group. 2013 results adjusted to exclude
CSL and Sensis Group (79% was previously
reported).
(ii) This data relates to Telstra Corporation Limited
only and does not include subsidiaries or
contractors.
(iii) Full time and part time staff in Telstra
Corporation Limited and its wholly owned
subsidiaries, excluding casual and agency
staff.
(iv) Sensis Group data included from 1 July 2013
until 28 February 2014.
(v) Australian operations for Telstra Corporation
Limited. This includes relevant Australian
subsidiaries, joint ventures and partnerships.
Sensis Group has been included from 1 July
2013 until 28 February 2014.
198 Telstra Annual Report

REFERENCE TABLES
Note:
There are a number of factors that have impacted our results this year. In the
table, above, we have adjusted the results for:
(i) Sensis adjustments:
Adjustment for the equity share on the profit of our 30% interests in Project
Sunshine I Pty Ltd as an associated entity, the new holding company of the
Sensis Group from the reported Telstra Group results. Adjustment for the sale
proceeds from the divestment of 70% of our Sensis directories business from the
reported Telstra Group results.
(ii) Mergers & Acquisitions adjustments:
Adjustments for material mergers and acquisition activities from the reported
Telstra Group results. This includes DCA eHealth Solutions Pty Ltd, Fred IT Group
Pty Ltd, NSC Group Pty Ltd, O2 Networks Pty Ltd and Ooyala Inc.
(iii) CSL adjustment:
Adjustment for the net gain on disposal of the CSL Group from the reported
Telstra Group results.
(iv) Octave adjustment:
Adjustment for the write off from the foreign currency translation reserve
associated with the Octave investment from the reported Telstra Group results.
We have commenced liquidation of the legal entities in the Octave Group in FY14.
(v) Sequel Media adjustment:
Adjustment for the impairment of Sequel Media Group from the reported Telstra
Group results. The carrying value of Sequel Media Group goodwill was impaired
by $12m.
This table was subject to review by our auditors.
REPORTED ADJUSTMENTS FY14 GUIDANCE BASIS
FY14
$m
FY13
$m
Growth
%
Sensis(i)
$m
M&A(ii)
$m
CSL(iii)
$m
Octave(iv)
$m
Sequel(v)
$m
FY14
$m
FY13
$m
Growth
%
Sales revenue 25,119 24,298 3.4% 0 (101) 0 0 0 25,018 24,298 3.0%
Total revenue 25,320 24,474 3.5% 0 (101) 0 0 0 25,219 24,474 3.0%
Total income (excl. finance
income) 26,296 24,776 6.1% 0 (101) (561) 0 0 25,634 24,776 3.5%
Labour 4,732 4,527 4.5% 0 (32) 0 0 0 4,700 4,527 3.8%
Goods and services purchased 6,465 6,247 3.5% 0 (42) 0 0 0 6,423 6,247 2.8%
Other expenses 3,988 3,833 4.0% 0 (11) 0 (98) (12) 3,867 3,833 0.9%
Operating expenses 15,185 14,607 4.0% 0 (85) 0 (98) (12) 14,990 14,607 2.6%
Share of net profit/(loss) from joint
ventures and associated entities 24 (1) n/a (24) 0 0 0 0 0 (1) n/a
EBITDA 11,135 10,168 9.5% (24) (16) (561) 98 12 10,644 10,168 4.7%
Depreciation and amortisation 3,950 4,078 (3.1%) 0 (10) 0 0 0 3,940 4,078 (3.4%)
EBIT 7,185 6,090 18.0% (24) (6) (561) 98 12 6,704 6,090 10.1%
Net finance costs 957 933 2.6% 0 0 0 0 0 957 933 2.6%
Profit before income tax expense 6,228 5,157 20.8% (24) (6) (561) 98 12 5,747 5,157 11.4%
Income tax expense 1,679 1,517 10.7% 0 1 0 0 0 1,680 1,517 10.7%
Profit for the year from continuing
operations 4,549 3,640 25.0% (24) (7) (561) 98 12 4,067 3,640 11.7%
(Loss)/profit for the year from
discontinued operation (204) 151 n/a 0 0 0 0 0 (204) 151 n/a
Profit for the year from continuing
and discontinued operations 4,345 3,791 14.6% (24) (7) (561) 98 12 3,863 3,791 1.9%
Attributable to:
Equity holders of the Telstra Entity 4,275 3,739 14.3% 0 (7) (561) 98 12 3,817 3,739 2.1%
Non controlling interests 70 52 34.6% (24) 0 0 0 0 46 52 (11.5%)
Free cashflow 7,483 5,024 48.9% (454) 205 (2,107) 0 0 5,127 5,024 2.1%
Guidance versus Reported Results
This schedule details the adjustments made to the reported results for the current year to reflect the performance of the business
on the basis which we provided guidance to the market. Our guidance assumes wholesale product price stability, no impairments to
investments and excludes any proceeds or gain on the sale, and purchase of businesses.
Telstra Annual Report 199

GLOSSARY
Technology Terms
4G (or 4G-LTE) - Fourth generation of wireless
networks. It gives users faster download and
upload speeds and better response times than
previous generations. 4G lets customers do
things like downloading files, sending large
attachments, web browsing and online
multi-tasking faster than previous generations.
4G-LTE also provides more network capacity
and thus delivers benefits for network operators.
The faster you can deliver data, the greater the
capacity you make available for other users on
the network.
4G dongle – A small device that plugs into a
computer and allows internet access via a 4G
wireless network.
ADSL – Asymmetric Digital Subscriber Line. A
broadband technology that provides access to
the internet at fast speeds. Data is carried over
the copper network phone lines. These data
speeds can enable the delivery of voice, data and
video services.
ADSL 2+ – Extends the capability of basic ADSL
by increasing the potential speeds that
customers experience. Telstra’s ADSL 2+ service
can deliver a maximum download speed of
20Mbps. (The actual customer download speed
can vary depending on line conditions. Typical
download speeds are 10Mbps).
Cloud – Provision of services, software, storage
and security over the internet, typically on a
pay-for-use basis. In simple terms, it allows
access to information/programs etc on multiple
devices in multiple locations.
Cyber safety – The safe use of information and
telecommunications technology (including
mobile phones) and the internet.
eHealth – eHealth is the sharing of health
resources and provision of health care by
electronic means. It encompasses three main
areas:
the delivery of health information, for health
professionals and health consumers, through
the internet and telecommunications
the use of IT and e-commerce to improve
public health services (for example, the
delivery of training services for health
workers)
the use of e-commerce and e-business
practices in health systems management.
FTTN – Fibre to the Node. A broadband access
solution that delivers fibre from a telco’s
exchange facility to a street cabinet (the “node”),
with the final connections to a premises being
the copper network phone lines.
FTTP – Fibre to the Premises. A broadband
access solution that delivers fibre from a telco’s
exchange facility directly to the outside of a
building. Because fibre can deliver faster data
transfer speeds than copper, FTTP solutions,
which do not depend on copper, offer potential
internet speeds faster than FTTN solutions (see
definition of FTTN).
HFC – Hybrid Fibre Coax. A way of delivering
video, voice and data using both coaxial cables
(like the ones used for connecting your television
to an antenna) and fibre optic cables. Optical
fibre connects a telco’s facility (called a
headend) to hubs in suburban streets, and then
coaxial cables connect the hubs and customer
premises. Telstra uses an HFC network to deliver
Foxtel and Big Pond Cable Internet services.
Telstra customers using HFC networks can
receive download speeds of up to 100Mbps.
IPTV – Television, video signals or other
multimedia services that are distributed to
subscribers or viewers using Internet Protocol
over a broadband connection. Examples include
Telstra’s T-Box and Foxtel on T-Box services.
Mobile broadband – Wireless internet access
delivered over the mobile phone network to
computers and other digital devices using
portable modems.
NAS – Network Applications and Services. The
NAS business has been identified as an area of
strategic growth for Telstra and includes unified
communications, video conferencing, cloud
services, managed networks and contact centre
solutions.
NBN – National Broadband Network.
Next IP™ – Telstra's high-performance national
data network with coverage to over 95% of
Australian businesses. It enjoys seamless
integration with the wireless Next G® network,
making it easier for staff and offices around the
nation to work as one. It allows businesses
access to the same networks and services as
large enterprises, but without the same level of
investment.
PSTN – Public switched telephone network.
Generic term for public telephone networks.
Often referred to as “fixed line”, it is the standard
home telephone service, delivered over copper
wires.
Roaming – A service which allows customers to
use their mobile phone while in a service area of
another carrier, for example overseas.
Spectrum – All wireless communications
signals travel through the air via radio frequency,
known also as spectrum. The government grants
telcos licences for dedicated use of portions
(bands) of the spectrum. As people increase
their use of wireless networks, more spectrum is
required.
ULL – Unconditioned Local Loop. The local loop is
the copper wire that connects the Telstra
exchange in your area to your house. Telstra is
required to provide access to this wire to other
operators and they can use it to provide
customers with their own services such as
broadband and voice telephone services.
Unified Communications – An integrated
hardware and software offering that combines
enterprise communications on a single platform.
It is any communications system that
encompasses a broad range of technologies and
applications that have been designed as a single
communications platform. A unified
communications system generally enables
companies to use integrated data, video and
voice from multiple locations in one supported
product.
Wi-Fi hotspot – A device that other devices
can connect to wirelessly in order to access the
Internet. (Wi-Fi refers to a set of wireless
standards commonly used by devices for
short-distance wireless communication).
Financial Terms
EBITDA – Earnings before interest, income tax
expense, depreciation and amortisation. An
indicator of a company’s operational profitability.
NPAT –Net profit after tax.
EPS – Earnings per share. A company’s profit
divided by the number of shares on issue.
DPS – Dividend per share.
Capex – Capital expenditure. This is expenditure
on assets such as property, equipment,
intangible assets etc.
Free cashflow – Represents the cash that a
company is able to generate from its operations
after spending money required to maintain or
expand its asset base.
200 Telstra Annual Report

INDEX
A
Advocacy (4, 7, 8-9, 12, 13, 14, 16, 45, 52)
Asbestos (5, 25, 42, 192)
Asia (4, 5, 11, 12, 34, 36)
Auditor Independence (64, 100, 103,195)
Autohome Inc. (IFC, 5, 11, 18, 70, 92, 95,
133, 147, 149-150, 167)
B
Board of Directors (36)
Balance Sheet (21, 68)
C
Carbon Emissions (3, 30-31, 198)
Cash Flow Statement (69)
Chairman and Chief Executive Officer’s
Message (4-6)
CEO remuneration (45)
Committees of the Board (41)
Community (2, 5, 14, 23, 25, 27, 28, 29,
32, 38)
Controlled Entities (20, 27, 169)
Contact Details (inside back cover)
Corporate Governance (IFC, 27, 33, 34,
35-38)
Credit Rating (135)
CSL New World Mobility Limited (5, 11, 15,
16, 18, 20, 21, 25, 51, 92, 147, 149, 150, 154)
Customer Service (4, 5, 9, 10, 12, 13, 16, 17)
D
Director’s Report (IFC, 39 - 64)
Disaster Relief (29)
Diversity (14, 25-27, 35, 36, 37, 38)
Dividends (2, 4, 5, 15, 21, 39, 91, 198, 200,
204, inside back cover)
E
Earnings Per Share (15, 198, 200)
Electromagnetic Energy (EME) (24)
Employee Engagement (25, 26, 198)
Employee Share and Option Plans
(44 – 63)
Environment (5, 13, 14, 22, 24, 30-31,
34, 38)
Expenses (15, 18, 19, 20, 199)
F
Financial Calendar (IBC)
Financial Statements and Notes (65–194)
Five Year Summary (198)
G
Glossary (200)
Goodwill and Other Intangible Assets
(74, 77, 79–80, 94, 149–150)
H
Health and Safety (25, 17, 38, 198)
I
Impaired Financial Assets (77)
Income Statements (67, 97)
Independent Auditor’s Report (195)
Indigenous (24, 26, 29)
Information Security (13)
M
Material Business Risks (13)
Mobiles (IFC, 3, 4, 5, 8, 11, 12, 15, 16-17,
18, 19, 24, 28, 29, 31, 34, 198, 200)
muru-D (11)
N
National Broadband Network (NBN)
(5, 6, 12, 14, 16, 18, 19, 20, 34)
Net Profit After Tax (67)
Net Promoter System (NPS) (4, 8)
Network (IFC, 2, 4, 5, 6, 8, 10, 11, 12, 13, 14,
15, 18, 19, 20, 24, 25, 29, 30, 31, 34, 36, 200)
Network, Applications and Services
(11, 17 – 19)
Notes to the Cash Flow Statements (145)
Notes to the Financial Statements
(71 – 193)
O
Operating and Financial Review (OFR)
(IFC – 31)
R
Remuneration (44 – 63)
Risk Management (13 – 14)
S
Sales Revenue (82, 95, 97)
Senior Management (34)
Sensis (5, 11, 15, 17, 18, 20, 21, 25, 26,
30, 31, 198, 199)
Shareholder Information (196)
Shares in Controlled Entities and
Associates (160–173)
Statement of Cash Flows (69)
Statement of Financial Position (68)
Strategy (7-14, 44, 47-48)
Sustainability (22-31, 42)
T
Technology (IFC, 6, 8, 11, 12, 13, 14, 19,
23, 28, 31, 34, 200)
U
United Nations Global Compact (24)
W
Wi-Fi (4,8,10,12,17)
Telstra Annual Report 201

202 Telstra Annual Report
NOTES

NOTES
Telstra Annual Report 203

Online Shareholder Services
Telstra’s Investor Centre at www.telstra.
com/investor has all the latest news and
information available for shareholders.
Shareholders can also easily
manage their shareholding online at
www.linkmarketservices.com.au/telstra.
To access your information, you will need your
SRN/HIN and postcode. Follow the prompts to log
in and select from the following menu options:
Holdings – transaction history, holding balance
and value and latest closing share price.
Payment and Tax – dividend payment history,
payment instructions and TFN details. You
can update your bank details here.
Communication – become an e-Shareholder
and update postal/email addresses
and communication elections here.
Keeping informed
You can keep up to date with the
latest news about Telstra by:
on our website at www.telstra.com.
au/aboutus/media/rss-feeds/.
Annual Report
Telstra’s 2014 Annual Report is available
to all shareholders on our Investor Website
at www.telstra.com.au/annualreports.
To receive a hardcopy of the Annual Report (free of
charge), you can call our Share Registry on 1300 88
66 77 and request that the Report be sent to you.
You may also update your communication
preferences online to change the way you
receive future copies of the Annual Report.
Please refer to the Online Shareholder
Services for instructions on how to do this at
www.linkmarketservices.com.au/telstra.
Sustainability Reporting
Selected graphs and data presented in this
Report are included in the Bigger Picture 2014
Sustainability Report, which is available online
at www.telstra.com/sustainability/report. This
Report provides more detailed information
and analysis for our stakeholders on Telstra’s
sustainability approach and performance. You can
also subscribe to our sustainability newsletter
at www.telstra.com/sustainability/subscribe.
We develop our sustainability reporting with
reference to industry and sustainability
standards including the United Nations Global
Compact Communication on Progress and the
Global Reporting Initiative G3.1 Sustainability
Reporting Guidelines and Telecommunications
Sector Supplement (pilot). This financial year we
have applied the GRI framework to application
level B+. The full GRI Index can be found online
at www.telstra.com/sustainability/report.
®Registered trademark of Telstra Corporation Limited.
™Trademark of Telstra Corporation Limited.
*Registered trademark of Sensis Pty Ltd.
Foxtel marks are used under licence by Foxtel Management Pty Ltd.
All amounts are expressed in Australian Dollars ($A) unless otherwise stated.
Designed by magneticdesign.com.au
204 Telstra Annual Report

CONTACT DETAILS
Registered Office
Level 41, 242 Exhibition Street
Melbourne Victoria 3000 Australia
Damien Coleman
Company Secretary
email: [email protected]
General Enquiries – Registered Office
Australia: 1300 368 387
All Other: +61 (8) 8308 1721
Shareholder Enquiries
Australian Share Register
Australia: 1300 88 66 77
All Other: +61 1300 88 66 77
Fax: +61 (2) 9287 0303
email: [email protected]
website: www.linkmarketservices.com.au/telstra
Link Market Services Limited
PO Box A942
Sydney South NSW 1234 Australia
New Zealand Share Register
New Zealand: 0800 835 787
All Other: +64 9 375 5998
Fax: +64 (9) 375 5990
email: [email protected]
website: www.linkmarketservices.co.nz
Link Market Services Limited
PO Box 91976
Auckland 1142
New Zealand
Investor Relations
Level 32, 242 Exhibition Street
Melbourne Victoria 3000 Australia
Australia: 1800 880 679
All Other: +61 (3) 8647 4954
email: [email protected]
Sustainability
Level 37, 242 Exhibition Street
Melbourne Victoria 3000 Australia
email: [email protected]
Telstra Corporation Limited
ABN 33 051 775 556
Incorporated in the Australian Capital Territory
Telstra is listed on Stock Exchanges in
Australia and in New Zealand (Wellington)
Websites
Telstra Investor Centre:
www.telstra.com.au/investor
Telstra’s Sustainability home page:
www.telstra.com.au/sustainability
Indicative Financial Calendar (i)
Final dividend paid Friday 26 September 2014
Annual General Meeting Tuesday 14 October 2014
Half-Year Results announcement Thursday 12 February 2015
Ex-dividend share trading commences Wednesday 25 February 2015
Record date for interim dividend Friday 27 February 2015
Interim dividend paid Friday 27 March 2015
Annual Results announcement Thursday 13 August 2015
Ex-dividend share trading commences Wednesday 26 August 2015
Record date for final dividend Friday 28 August 2015
Final dividend paid Friday 25 September 2015
Annual General Meeting Tuesday 13 October 2015
(i) Timing of events may be subject to change. Any change will be notified to the Australian Securities
Exchange (ASX).

telstra.com.au/investor