Teller & Cash Activity Analysis Tools - CU*Answers Teller & Cash Activity Analysis Tools Here,...
19
Revision date: December 5, 2017 For an updated copy of this booklet, check out the Reference Materials page of our website: http://www.cuanswers.com/client_reference.php CU*BASE ® is a registered trademark of CU*Answers, Inc. Teller & Cash Activity Analysis Tools CU*BASE Relationship Management Tools I NTRODUCTION Take a look at the numbers...what do you see? Let’s talk about the teller line. What do we need to know in order to have a conversation about how we are serving our members? From the member’s point of view... “Is my credit union convenient? Is it open when I need it to be?” What numbers represent the member’s response to credit union services? How many members really do use teller services on a daily basis? On an hourly basis? On what day of the month? And how many transactions do they do per visit? This software will track your members as they use your teller line services. From the CEO’s point of view... “What is the most effective way to meet our members’ expectations?” It’s more than saying the lines are short and members don’t have to wait. Members expect convenient and reasonably priced services. How can a credit union CEO use the numbers to match member demand with the credit union’s goals for providing service? What if you added one more person? What is the formula to equate the expenses of one more teller and the number of members who will be served during the teller’s day? How many members per hour? How many transactions? From the branch leader’s point of view... “I’m in the middle! How can I communicate to senior management that our branch is on goal?”
Transcript of Teller & Cash Activity Analysis Tools - CU*Answers Teller & Cash Activity Analysis Tools Here,...

Revision date: December 5, 2017
For an updated copy of this booklet, check out the Reference Materials page of our website: http://www.cuanswers.com/client_reference.php
CU*BASE® is a registered trademark of CU*Answers, Inc.
Teller & Cash Activity Analysis Tools
CU*BASE Relationship Management Tools
INTRODUCTION
Take a look at the numbers...what do you see?
Let’s talk about the teller line. What do we need to know in order to have a
conversation about how we are serving our members?
From the member’s point of view...
“Is my credit union convenient? Is it open when I need it to be?”
What numbers represent the member’s response to credit union
services? How many members really do use teller services on a daily basis? On an hourly basis? On what day of the month? And how
many transactions do they do per visit? This software will track your
members as they use your teller line services.
From the CEO’s point of view...
“What is the most effective way to meet our members’ expectations?”
It’s more than saying the lines are short and members don’t have to wait. Members expect convenient and reasonably priced services.
How can a credit union CEO use the numbers to match member
demand with the credit union’s goals for providing service?
What if you added one more person? What is the formula to equate
the expenses of one more teller and the number of members who will
be served during the teller’s day? How many members per hour?
How many transactions?
From the branch leader’s point of view...
“I’m in the middle! How can I communicate to senior management that our branch is on goal?”

2 Teller & Cash Activity Analysis Tools
Here, CU*BASE tools give a quick view of member activity correlated
to your resource plan. They let everyone see member activity and
how your team plans to meet member needs.
From the accountant’s point of view...
“What are the specifics? Were policies met? Were drawer balances within the limits set by management?”
How exactly do you define a teller transaction? What is the difference
between understanding how many teller checks were cut to members and the flow of cash into our branches? Do you understand the
number of errors being made on a daily basis?
When it is all added together it can be a little confusing. Are these numbers
just for the sake of numbers? No. If you are trying to improve how you
serve your members, how you build your organization, and how you can ensure that both members and staff prosper from your efforts, you must be
constantly diligent in understanding the process. This starts with
understanding the numbers.
CONTENTS
INTRODUCTION 3
WHAT CU*BASE ACTIVITY ANALYSIS TOOLS ARE... 3 WHAT CU*BASE ACTIVITY ANALYSIS TOOLS ARE NOT... 3 WHERE THE DATA COMES FROM 3
TELLER ACTIVITY ANALYSIS TOOLS 5
ANALYZING TELLER ACTIVITY BY TIME OF DAY 5 ANALYZING TELLER ACTIVITY BY DAY OF WEEK 8 ANALYZING TELLER ACTIVITY BY DAY OF MONTH 11 HOW ARE THE “TOTALS” CALCULATED ON EACH TELLER ACTIVITY
DASHBOARD? 15 ANALYZING TELLER ACTIVITY BY TRANSACTION TYPE 16
CASH ACTIVITY ANALYSIS TOOLS 18
CASH ACTIVITY ANALYSIS INQUIRY 18
Teller & Cash Activity Analysis Tools 3
INTRODUCTION
WHAT CU*BASE ACTIVITY ANALYSIS TOOLS ARE...
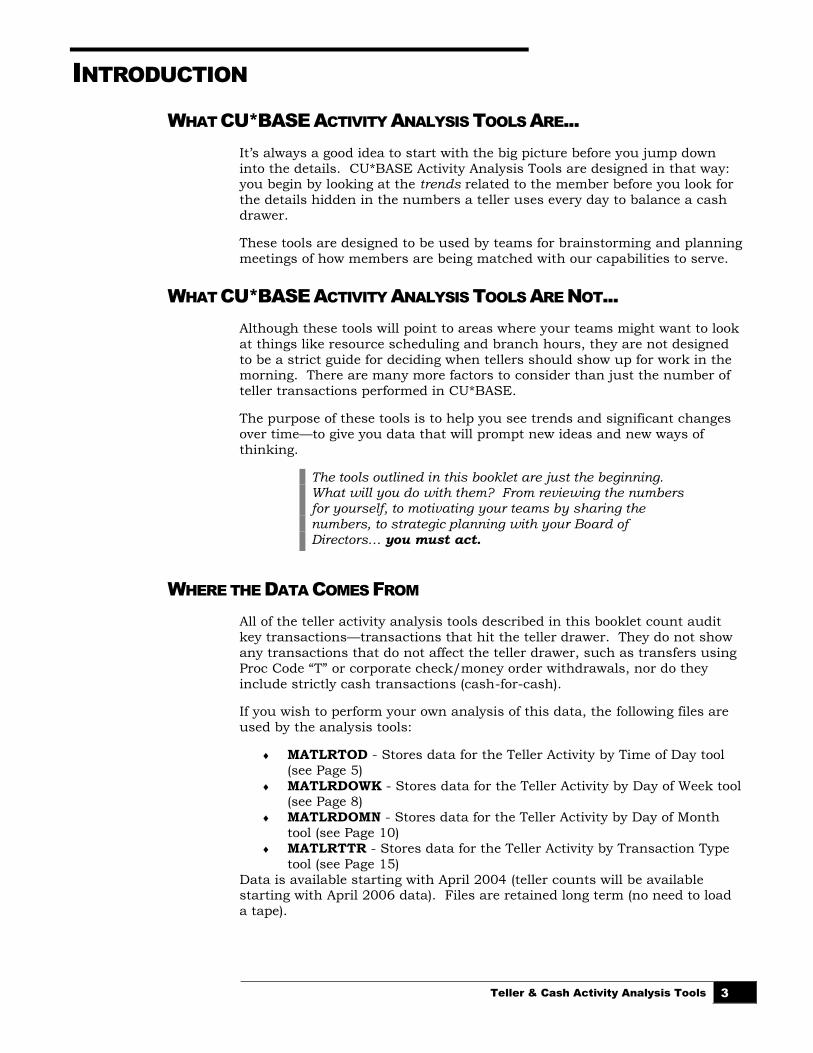
It’s always a good idea to start with the big picture before you jump down
into the details. CU*BASE Activity Analysis Tools are designed in that way: you begin by looking at the trends related to the member before you look for
the details hidden in the numbers a teller uses every day to balance a cash
drawer.
These tools are designed to be used by teams for brainstorming and planning
meetings of how members are being matched with our capabilities to serve.
WHAT CU*BASE ACTIVITY ANALYSIS TOOLS ARE NOT...
Although these tools will point to areas where your teams might want to look
at things like resource scheduling and branch hours, they are not designed
to be a strict guide for deciding when tellers should show up for work in the morning. There are many more factors to consider than just the number of
teller transactions performed in CU*BASE.
The purpose of these tools is to help you see trends and significant changes
over time—to give you data that will prompt new ideas and new ways of
thinking.
The tools outlined in this booklet are just the beginning. What will you do with them? From reviewing the numbers for yourself, to motivating your teams by sharing the numbers, to strategic planning with your Board of Directors… you must act.
WHERE THE DATA COMES FROM
All of the teller activity analysis tools described in this booklet count audit
key transactions—transactions that hit the teller drawer. They do not show
any transactions that do not affect the teller drawer, such as transfers using
Proc Code “T” or corporate check/money order withdrawals, nor do they
include strictly cash transactions (cash-for-cash).
If you wish to perform your own analysis of this data, the following files are
used by the analysis tools:
MATLRTOD - Stores data for the Teller Activity by Time of Day tool
(see Page 5)
MATLRDOWK - Stores data for the Teller Activity by Day of Week tool (see Page 8)
MATLRDOMN - Stores data for the Teller Activity by Day of Month
tool (see Page 10)
MATLRTTR - Stores data for the Teller Activity by Transaction Type
tool (see Page 15)
Data is available starting with April 2004 (teller counts will be available starting with April 2006 data). Files are retained long term (no need to load
a tape).

4 Teller & Cash Activity Analysis Tools
The data stored in these files originally comes from file
TEACTR, which is simply a cumulative file that contains the detail records from TEAUDT1 and TEAUDT2 teller
audit files. The TEAUDTx files are refreshed daily, and the TEACTR file retains data for a rolling 90 days.
For the Cash Activity analysis tool (see Page 18), transaction data comes
from the CSHCHK file, which includes activity from the previous month only.

Teller & Cash Activity Analysis Tools 5
TELLER ACTIVITY ANALYSIS TOOLS
ANALYZING TELLER ACTIVITY BY TIME OF DAY
This tool gives you a quick visual of when the bulk of your teller activity
occurs during a typical day. Again, this is not so much an employee scheduling tool as a “big picture” view of member behavior patterns that
might prompt some new ideas and creative thinking as to how you could
meet your member needs even more effectively.
Teller Activity by Time of Day (Tool #846)
The Mechanics
The summary screen shows transaction counts starting with the first
transaction of the day (”Open”) to 9:00 a.m. and continuing in one hour time
increments until the block from 7:00 p.m. until the last transaction of the
day (“Close”). (Remember that only transactions that hit the teller drawer
are included in these counts.)
Use these icons (available on many of the inquiry tools
on the following pages) to recreate
the summary in PDF (requires iText Sharp install), MS
Excel, or to produce a comma-delimited file (*.CSV) you can
use in another program for further
analysis.

6 Teller & Cash Activity Analysis Tools
Use the Date field at the top of the screen to display data from a different
time period. Data is available starting with April, 2004, activity (teller counts
from April 2006).
To view transactions for a single branch only, enter the number into the
Branch field at the top of the screen (press Enter to refresh the screen). Use
00 to combine all branches together. This system uses the branch as
recorded on the transaction record, meaning the teller branch where the
transaction was posted.
The # of Transactions is the number of actual transactions processed, and # of Members is the number of actual members represented by those transactions. (Obviously if a member does transactions at different times
during the day, or at different branches, the same member would be
included in more than one of the counts. The idea here to see the number of
members that were served, regardless of who they were.)
The # of Tellers column shows the total number of employees that were
involved in posting teller transactions during the times listed. The system looks at the number of unique employee IDs in the teller statistical file (see Page 3); counts are available starting with April 2006 data.

Teller & Cash Activity Analysis Tools 7
Printing an Analysis Report
Use Print (F14) to produce a printed report of teller activity by time of day.
The following screen will appear:
Because you were working on the Time of Day inquiry, the report will default
to printing data by time of day. Enter the desired starting month and year
(the report will include 12 months of data starting with the date specified),
then use Enter to produce the report.
Report Sample
5/31/06 10:31:28 CU*BASE TEXT CREDIT UNION LTLRDT PAGE 1
TELLER ACTIVITY - TIME OF DAY REPORT USER DAWNM
BRANCH 00 ALL BRANCHES
TIME OF TOTAL AVG TRX
DAY TRX'S MONTH RANK APR-2005 MAY-2005 JUN-2005 JUL-2005 AUG-2005 SEP-2005
Open to 9:00 30,746 2,562 3% 9 2,844 3,243 2,719 2,912 3,099 2,509
9:00 to 10:00 105,542 8,795 11% 5 9,341 9,490 9,602 9,384 9,616 8,812
10:00 to 11:00 113,745 9,479 12% 3 9,953 10,384 9,960 10,223 9,982 9,281
11:00 to 12:00 123,809 10,317 13% 1 10,751 10,389 10,212 10,676 10,345 10,070
12:00 to 1:00 114,658 9,555 12% 2 9,640 10,092 9,754 9,532 9,995 10,102
1:00 to 2:00 100,504 8,375 11% 7 8,931 8,517 8,822 8,662 9,160 8,638
2:00 to 3:00 99,616 8,301 11% 8 9,145 8,876 8,589 8,684 8,993 8,623
3:00 to 4:00 105,490 8,791 11% 6 9,340 9,508 8,929 8,939 8,557 9,326
4:00 to 5:00 113,166 9,431 12% 4 10,293 10,095 9,930 9,614 9,805 10,292
5:00 to 6:00 27,924 2,327 3% 10 3,242 2,271 2,220 2,718 2,094 2,896
6:00 to 7:00 508 42 % 11 56 48 34 42 55 54
7:00 to Close 2 0 % 12 2 0 0 0 0 0
TOTAL 935,710 77,976 83,538 82,913 80,771 81,386 81,701 80,603
RANK 1 2 5 4 3 6
PERCENTAGE 9% 9% 9% 9% 9% 9%
OCT-2005 NOV-2005 DEC-2005 JAN-2006 FEB-2006 MAR-2006
7:00 to Close 2,573 2,379 2,335 2,161 1,690 2,282
9:00 to 10:00 8,689 8,222 8,326 7,610 7,199 9,251
10:00 to 11:00 9,424 9,154 9,455 8,292 8,258 9,379
11:00 to 12:00 10,578 10,137 10,708 9,976 9,292 10,675
12:00 to 1:00 9,356 9,089 10,250 8,618 8,696 9,534
1:00 to 2:00 7,887 7,578 8,958 7,739 7,060 8,552
2:00 to 3:00 7,694 7,977 8,565 7,464 7,161 7,845
3:00 to 4:00 8,772 8,108 9,334 8,063 7,463 9,151
4:00 to 5:00 8,949 8,230 9,625 8,721 8,155 9,457
5:00 to 6:00 2,398 1,568 2,162 1,972 1,848 2,535
6:00 to 7:00 106 30 17 21 20 25
7:00 to Close 0 0 0 0 0 0
TOTAL 76,426 72,472 79,735 70,637 66,842 78,686
RANK 9 10 7 11 12 8
PERCENTAGE 8% 8% 9% 8% 7% 8%

8 Teller & Cash Activity Analysis Tools
ANALYZING TELLER ACTIVITY BY DAY OF WEEK
This is simply another look and another perspective.
What is the effect of having five Fridays in one month versus a month that
has only four? Do rules of thumb for Mondays in February hold for
Mondays in October? This is just one more view of how teller activity can be
searched for trends, for how it matches your plans during scheduling, and how things might be altered by something as simple as the Friday before a
holiday weekend.
What does your team see?
Teller Activity by Day of Week (Tool #845)
The Mechanics
The summary screen displays transaction counts by day of the week, for the
entire month and year selected at the top of the screen. (Remember that only transactions that hit the teller drawer are included in these counts.) Notice
the Freq. column showing how many times each day was repeated during
that particular month.
Use the “Date” field at the top of the screen to display data
from a different time period. Data is available starting with April 2004 activity (teller counts from April 2006).
To view transactions for a single branch only, enter the number into the
Branch field at the top of the screen (press Enter to refresh the screen). Use
00 to combine all branches together. This system uses the branch as
recorded on the transaction record, meaning the teller branch where the
transaction was posted.
Refer to Page 17 for information about
setting up figures to show your credit union’s goals for the number of
members and transactions handled by each teller, compared to
the actual teller line activity.

Teller & Cash Activity Analysis Tools 9
The % of Transactions is calculated by dividing each day’s transaction count
by the total transactions for the entire month. (Percentages are rounded up
to the nearest whole number.)
The Actual column under Total Trx is the number of actual transactions
processed, and the Actual column under # of Members is the number of
actual members represented by those transactions. (Obviously if a member
does transactions at different times during the day, or at different branches,
the same member would be included in more than one of the counts. The
idea here to see the number of members that were served, regardless of who
they were.) Avg. Daily Trx are calculated by dividing the total transactions
by the number of times that day was repeated during the month (Freq.)
The #of Tlrs column shows the total number of employees that were involved
in posting teller transactions on the days listed. The system looks at the number of unique employee IDs in the teller statistical file (see Page 3); counts are available starting with April 2006 data.
Printing an Analysis Report
Use Print (F14) to produce a printed report of teller activity by day of the
week. The following screen will appear:
Because you were working on the Day of Week inquiry, the report will default
to printing data by day of the week. Enter the desired starting month and year (the report will include 12 months of data starting with the date
specified), then use Enter to produce the report.
10 Teller & Cash Activity Analysis Tools
Report Sample
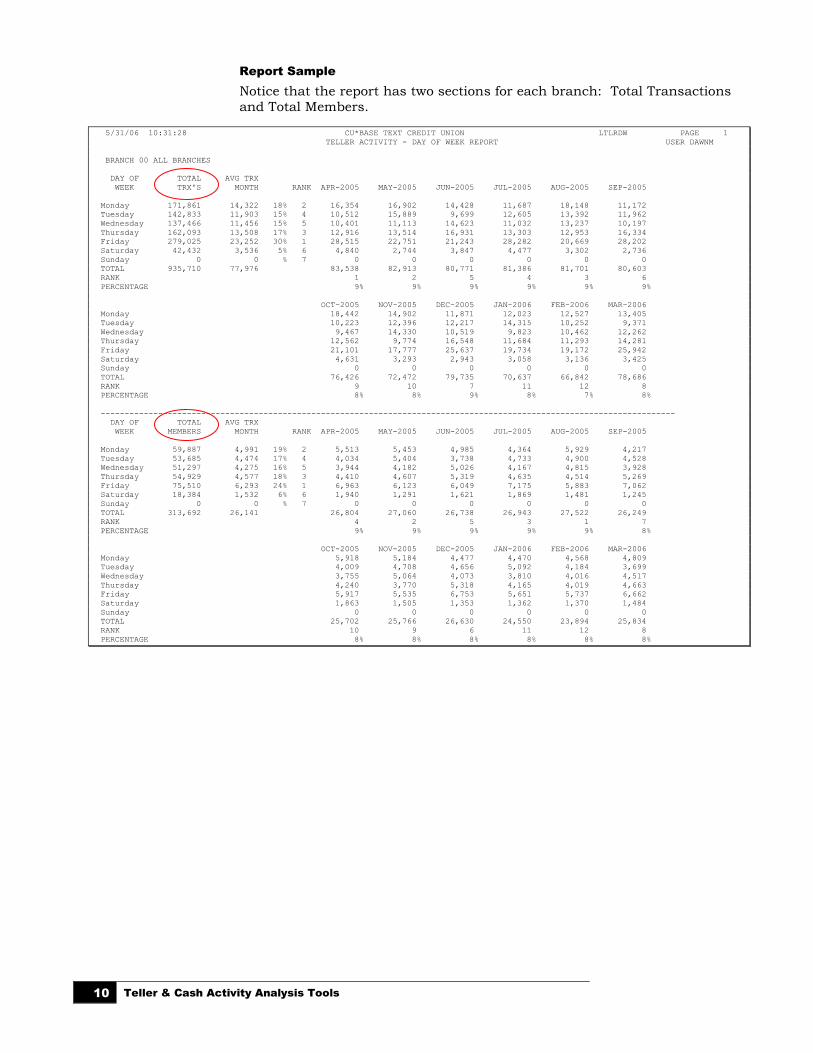
Notice that the report has two sections for each branch: Total Transactions
and Total Members.
5/31/06 10:31:28 CU*BASE TEXT CREDIT UNION LTLRDW PAGE 1
TELLER ACTIVITY - DAY OF WEEK REPORT USER DAWNM
BRANCH 00 ALL BRANCHES
DAY OF TOTAL AVG TRX
WEEK TRX'S MONTH RANK APR-2005 MAY-2005 JUN-2005 JUL-2005 AUG-2005 SEP-2005
Monday 171,861 14,322 18% 2 16,354 16,902 14,428 11,687 18,148 11,172
Tuesday 142,833 11,903 15% 4 10,512 15,889 9,699 12,605 13,392 11,962
Wednesday 137,466 11,456 15% 5 10,401 11,113 14,623 11,032 13,237 10,197
Thursday 162,093 13,508 17% 3 12,916 13,514 16,931 13,303 12,953 16,334
Friday 279,025 23,252 30% 1 28,515 22,751 21,243 28,282 20,669 28,202
Saturday 42,432 3,536 5% 6 4,840 2,744 3,847 4,477 3,302 2,736
Sunday 0 0 % 7 0 0 0 0 0 0
TOTAL 935,710 77,976 83,538 82,913 80,771 81,386 81,701 80,603
RANK 1 2 5 4 3 6
PERCENTAGE 9% 9% 9% 9% 9% 9%
OCT-2005 NOV-2005 DEC-2005 JAN-2006 FEB-2006 MAR-2006
Monday 18,442 14,902 11,871 12,023 12,527 13,405
Tuesday 10,223 12,396 12,217 14,315 10,252 9,371
Wednesday 9,467 14,330 10,519 9,823 10,462 12,262
Thursday 12,562 9,774 16,548 11,684 11,293 14,281
Friday 21,101 17,777 25,637 19,734 19,172 25,942
Saturday 4,631 3,293 2,943 3,058 3,136 3,425
Sunday 0 0 0 0 0 0
TOTAL 76,426 72,472 79,735 70,637 66,842 78,686
RANK 9 10 7 11 12 8
PERCENTAGE 8% 8% 9% 8% 7% 8%
------------------------------------------------------------------------------------------------------------------------
DAY OF TOTAL AVG TRX
WEEK MEMBERS MONTH RANK APR-2005 MAY-2005 JUN-2005 JUL-2005 AUG-2005 SEP-2005
Monday 59,887 4,991 19% 2 5,513 5,453 4,985 4,364 5,929 4,217
Tuesday 53,685 4,474 17% 4 4,034 5,404 3,738 4,733 4,900 4,528
Wednesday 51,297 4,275 16% 5 3,944 4,182 5,026 4,167 4,815 3,928
Thursday 54,929 4,577 18% 3 4,410 4,607 5,319 4,635 4,514 5,269
Friday 75,510 6,293 24% 1 6,963 6,123 6,049 7,175 5,883 7,062
Saturday 18,384 1,532 6% 6 1,940 1,291 1,621 1,869 1,481 1,245
Sunday 0 0 % 7 0 0 0 0 0 0
TOTAL 313,692 26,141 26,804 27,060 26,738 26,943 27,522 26,249
RANK 4 2 5 3 1 7
PERCENTAGE 9% 9% 9% 9% 9% 8%
OCT-2005 NOV-2005 DEC-2005 JAN-2006 FEB-2006 MAR-2006
Monday 5,918 5,184 4,477 4,470 4,568 4,809
Tuesday 4,009 4,708 4,656 5,092 4,184 3,699
Wednesday 3,755 5,064 4,073 3,810 4,016 4,517
Thursday 4,240 3,770 5,318 4,165 4,019 4,663
Friday 5,917 5,535 6,753 5,651 5,737 6,662
Saturday 1,863 1,505 1,353 1,362 1,370 1,484
Sunday 0 0 0 0 0 0
TOTAL 25,702 25,766 26,630 24,550 23,894 25,834
RANK 10 9 6 11 12 8
PERCENTAGE 8% 8% 8% 8% 8% 8%

Teller & Cash Activity Analysis Tools 11
ANALYZING TELLER ACTIVITY BY DAY OF MONTH
Same old, same old. Another view.
What’s different about this is that you can analyze your best day of the
month. Was it because it was a Monday or a Friday? Or because it was the
1st, the 15th or the 30th? What effect does the calendar have on your
lobbies and how members need your services? Does it change from month to month? What would you like your team to understand about what
happened last month?
The point of trends is whether or not you can avoid negative situations or
recreate positive ones. With a little insight, can you figure out your tactics
for next month? And the month after that?
Teller Activity by Day of Month (Tool #844)
Select a Branch by using the lookup at the top of the screen.
12 Teller & Cash Activity Analysis Tools
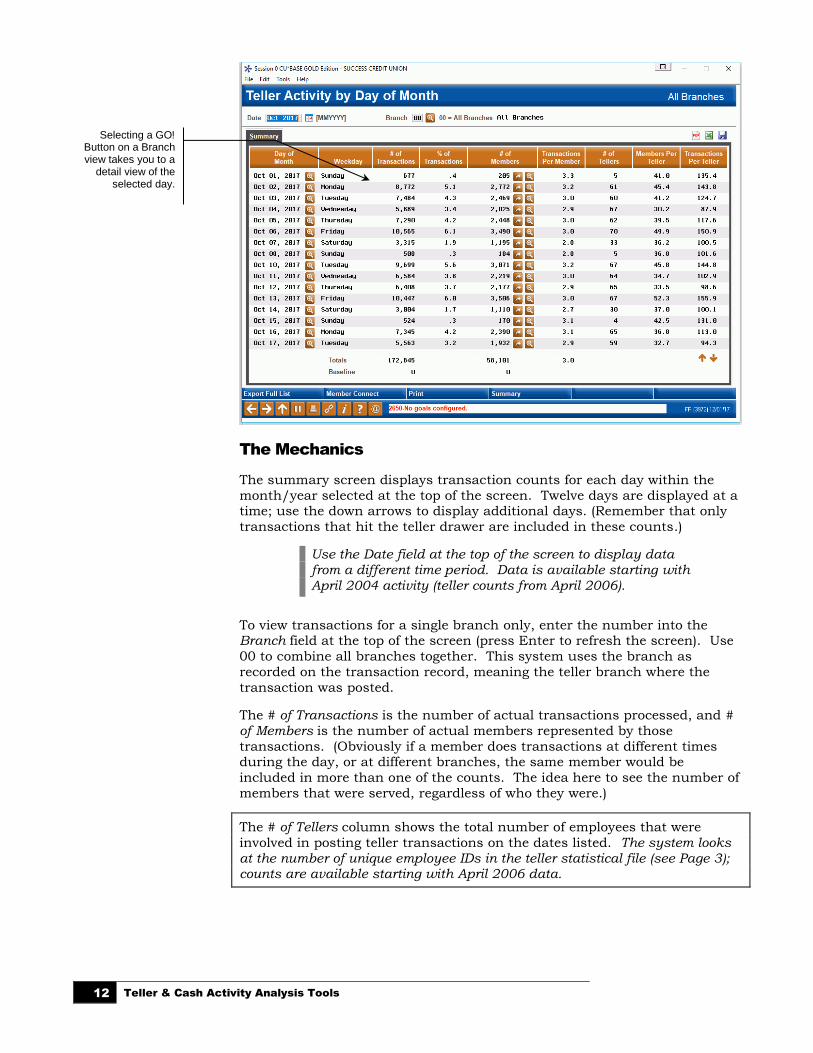
The Mechanics
The summary screen displays transaction counts for each day within the
month/year selected at the top of the screen. Twelve days are displayed at a time; use the down arrows to display additional days. (Remember that only
transactions that hit the teller drawer are included in these counts.)
Use the Date field at the top of the screen to display data from a different time period. Data is available starting with
April 2004 activity (teller counts from April 2006).
To view transactions for a single branch only, enter the number into the Branch field at the top of the screen (press Enter to refresh the screen). Use
00 to combine all branches together. This system uses the branch as
recorded on the transaction record, meaning the teller branch where the
transaction was posted.
The # of Transactions is the number of actual transactions processed, and # of Members is the number of actual members represented by those
transactions. (Obviously if a member does transactions at different times during the day, or at different branches, the same member would be
included in more than one of the counts. The idea here to see the number of
members that were served, regardless of who they were.)
The # of Tellers column shows the total number of employees that were
involved in posting teller transactions on the dates listed. The system looks at the number of unique employee IDs in the teller statistical file (see Page 3); counts are available starting with April 2006 data.
Selecting a GO! Button on a Branch view takes you to a
detail view of the selected day.

Teller & Cash Activity Analysis Tools 13
Printing an Ranking/Analysis Report
Use Print (F14) to produce a printed report of teller activity by day of the
month. This report will rank dates according to the most and least amount
of activity (number of teller transactions posted). The following screen will
appear:
Enter the number of days for the ranking (for example, you can see the top
10 busiest days and the bottom 10, least busy days). You can enter a minimum number of members to exclude days where only a few members
were served (for example, to exclude very slow Saturdays or days when the
credit union was not open a full day).
Finally, enter the date range to specify which data should be analyzed (for
example, you could analyze the most and least busy days within a calendar
quarter). Use Enter to produce the report.
Report Sample
5/31/06 10:46:32 CU*BASE TEST CREDIT UNION (AL) LTLDOM PAGE 1
TELLER ACTIVITY - DAY OF MONTH REPORT USER DAWNM
Top 010 January 01, 2006 - March 31, 2006
BRANCH 00 ALL BRANCHES
Day of Trx/ Teller Mbr/ Trx/
Date Week Rank Transactions % Members % Mbr Count Teller Teller
------------------ ---------- ---- ------------ ---- ---------- ---- ------ ----- -------- ------
March 03, 2006 Friday 1 5,999 2.8 2,735 2.6 2.2 30 91.2 200.0
February 03, 2006 Friday 2 5,689 2.6 2,663 2.5 2.1 30 88.8 189.6
March 31, 2006 Friday 3 5,356 2.5 2,493 2.3 2.1 27 92.3 198.4
January 03, 2006 Tuesday 4 5,312 2.5 2,414 2.3 2.2 0 .0 .0
January 20, 2006 Friday 5 5,204 2.4 2,381 2.2 2.2 0 .0 .0
March 10, 2006 Friday 6 5,081 2.4 2,397 2.3 2.1 27 88.8 188.2
January 06, 2006 Friday 7 5,044 2.3 2,332 2.2 2.2 0 .0 .0
March 17, 2006 Friday 8 4,939 2.3 2,334 2.2 2.1 27 86.4 182.9
February 10, 2006 Friday 9 4,856 2.2 2,330 2.2 2.1 28 83.2 173.4
February 24, 2006 Friday 10 4,854 2.2 2,302 2.2 2.1 26 88.5 186.7
TOTAL FOR DATE RANGE 216,165 106,473 2.0
5/31/06 10:46:32 CU*BASE TEST CREDIT UNION (AL) LTLDOM PAGE 2
TELLER ACTIVITY - DAY OF MONTH REPORT USER DAWNM
Bottom 010 January 01, 2006 - March 31, 2006
BRANCH 00 ALL BRANCHES
Day of Trx/ Teller Mbr/ Trx/
Date Week Rank Transactions % Members % Mbr Count Teller Teller
------------------ ---------- ---- ------------ ---- ---------- ---- ------ ----- -------- ------
February 25, 2006 Saturday 1 670 .3 358 .3 1.9 9 39.8 74.4
January 21, 2006 Saturday 2 710 .3 386 .4 1.8 0 .0 .0
January 14, 2006 Saturday 3 754 .3 420 .4 1.8 0 .0 .0
January 28, 2006 Saturday 4 773 .4 439 .4 1.8 9 48.8 85.9
March 25, 2006 Saturday 5 786 .4 431 .4 1.8 9 47.9 87.3
February 11, 2006 Saturday 6 798 .4 459 .4 1.7 9 51.0 88.7
February 18, 2006 Saturday 7 810 .4 421 .4 1.9 9 46.8 90.0
January 07, 2006 Saturday 8 821 .4 409 .4 2.0 0 .0 .0
March 11, 2006 Saturday 9 828 .4 473 .4 1.8 9 52.6 92.0
March 18, 2006 Saturday 10 837 .4 431 .4 1.9 9 47.9 93.0
TOTAL FOR DATE RANGE 216,165 106,473 2.0
14 Teller & Cash Activity Analysis Tools
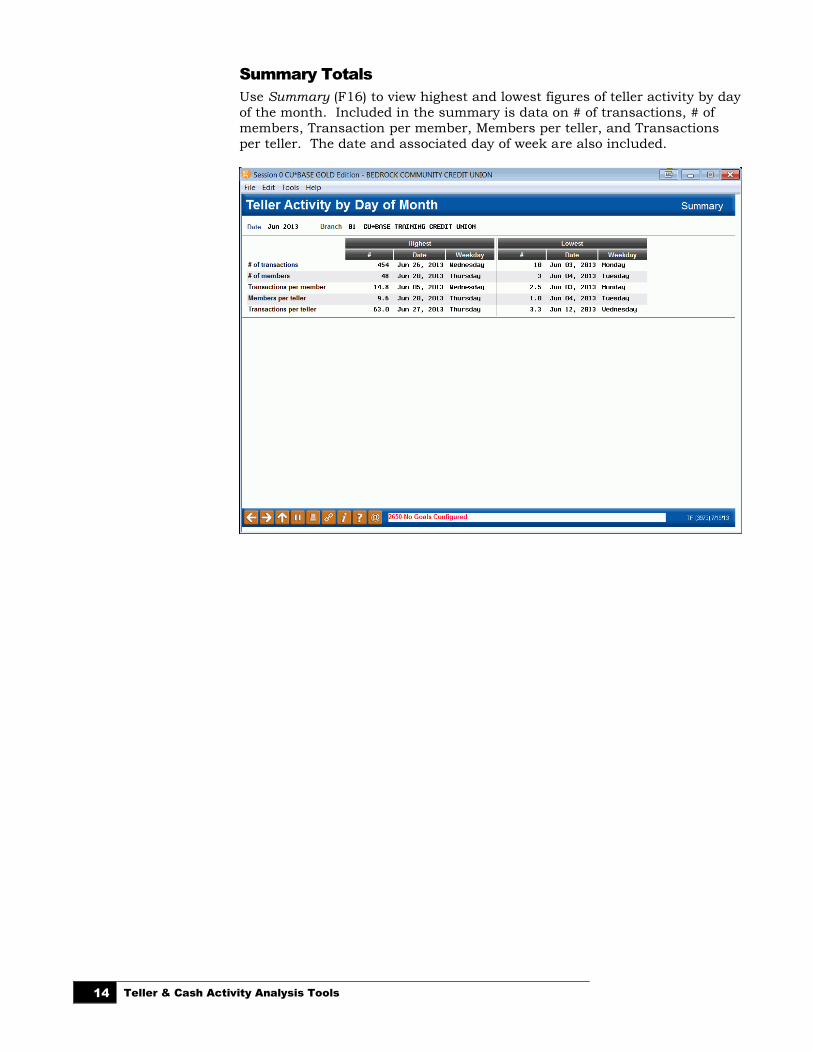
Summary Totals
Use Summary (F16) to view highest and lowest figures of teller activity by day
of the month. Included in the summary is data on # of transactions, # of
members, Transaction per member, Members per teller, and Transactions
per teller. The date and associated day of week are also included.

Teller & Cash Activity Analysis Tools 15
HOW ARE THE “TOTALS” CALCULATED ON EACH TELLER ACTIVITY
DASHBOARD?
The Teller Activity by Day, Week or Month dashboards are designed to
evaluate trends of your branch; they are not designed to be used for exact
reconciliation. The “Totals” figure at the bottom of the screen calculates the unique members who made visits for that dashboard’s time period. Refer to
the examples below for further explanation of how this affects calculation.
• Remember: All of the teller activity that is analyzed comes from
transactions that hit the teller drawer. The data does not show any
transactions that do not affect the teller drawer, such as transfers
using Proc Code “T” or corporate check/money order withdrawals,
nor do they include strictly cash transactions (cash-for-cash).
Example 1: Comparing Teller Activity Time of Day Totals with Teller
Activity Day of Week Totals
Let’s say Sally visited credit union branch 01 twice Monday (9am and
3pm). Sally appears twice in the Branch 01 Monday Total on the “Teller
Activity by Day” dashboard. (She came twice during that day). Sally is, however, only counted once (as one unique member) in the Branch 01
“Totals” for the associated “Teller Activity Day of Week” Total.
Example 2: Comparing Teller Activity Day of Week Total Figures
Between Different Branches
Let’s look at this from another angle as to how this might affect the Totals of three different Teller Activity by Week dashboards. Let’s say two members
(Sally and John) visited Branch 01 on the Monday and only Sally visited
Branch 02 on Tuesday of the same week. The Total of the Teller Activity by
Day of Week for Branch 01 includes 2 counts (Sally and John). For Branch
02 only one member (Sally) is counted in the Total. You cannot, however,
add the totals of these two branches, to calculate the Total for the Activity by Day of Week for Branch 00. For the Branch 00 Total, two unique members
are counted (Sally and John).

16 Teller & Cash Activity Analysis Tools
ANALYZING TELLER ACTIVITY BY TRANSACTION TYPE
What teller transactions are included in all of these analysis tools?
As you start tracking and talking with your teams about the throughput of
your teller lines, one of the common discussions will be, “but tellers do more
than what is being counted here!” This tool is designed to show what is
being counted and the breakdown of how these activities are being processed
by your tellers.
For organizations that use tellers for many tasks throughout the day, it’s not
as quick and dirty as this screen might imply. How many new accounts did
the teller open? Did the teller have any back office responsibilities? Did the
teller work with the Phone Operator software while answering the phone?
It’s a difficult task for CU*BASE to analyze these cross-departmental activities. But maybe there is something that should be added to this
analysis to make it a more well-rounded view of your lobby activity.
Or maybe not. As credit unions grow, there is a greater degree of
specialization by employees. Many credit unions have separated their call
centers from lobby activity, and now focus more of their member service sales activity on Member Service or Financial Service Representatives. What
is your plan? How can this tool help you understand the teller activity that
CU*BASE is tracking as part of its general servicing of member accounts and
the accounting of your teller drawers and vault activity?
Teller Activity by Transaction Type (Tool #847)

Teller & Cash Activity Analysis Tools 17
The Mechanics
The summary screen shows transaction counts by audit key type, similar to
the daily Teller Closing Transaction Audit Report (LTLAU2), except that this summarizes an entire month’s activity for all tellers. (Remember that only
transactions that hit the teller drawer are included in these counts.)
Use the “Date” field at the top of the screen to display data from a different time period. Data is available starting with April, 2004, activity.
18 Teller & Cash Activity Analysis Tools
CASH ACTIVITY ANALYSIS TOOLS
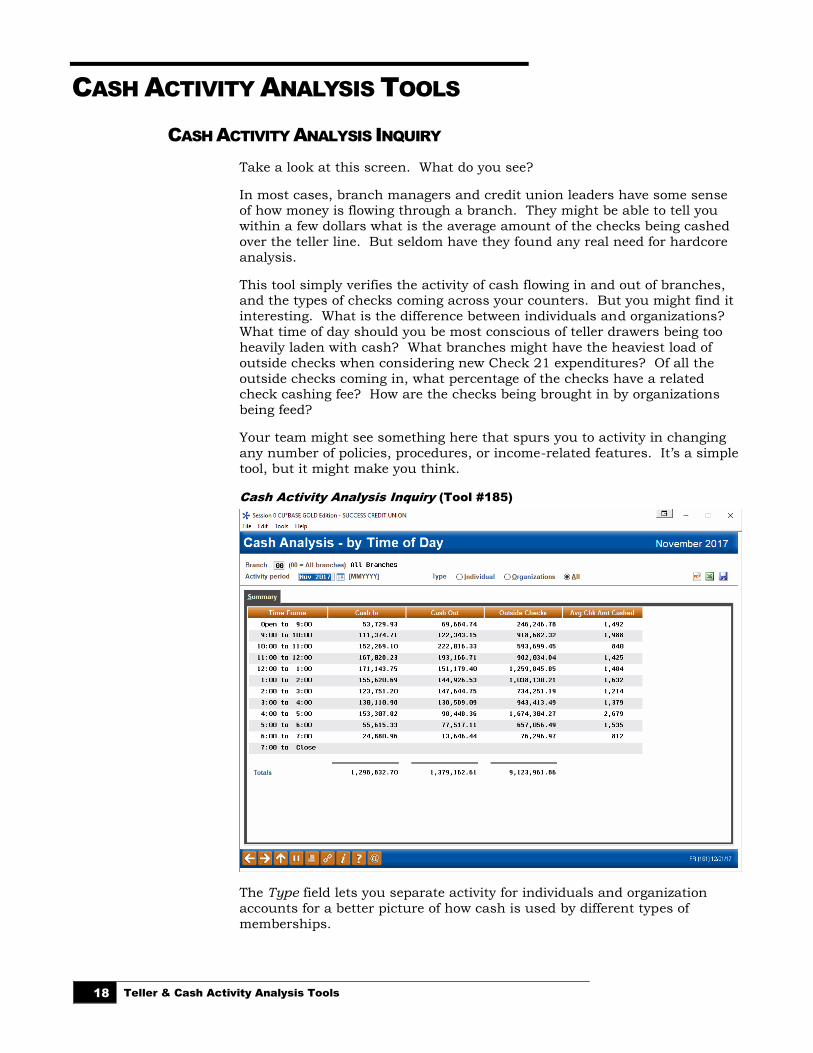
CASH ACTIVITY ANALYSIS INQUIRY
Take a look at this screen. What do you see?
In most cases, branch managers and credit union leaders have some sense of how money is flowing through a branch. They might be able to tell you
within a few dollars what is the average amount of the checks being cashed
over the teller line. But seldom have they found any real need for hardcore
analysis.
This tool simply verifies the activity of cash flowing in and out of branches, and the types of checks coming across your counters. But you might find it
interesting. What is the difference between individuals and organizations?
What time of day should you be most conscious of teller drawers being too
heavily laden with cash? What branches might have the heaviest load of
outside checks when considering new Check 21 expenditures? Of all the
outside checks coming in, what percentage of the checks have a related check cashing fee? How are the checks being brought in by organizations
being feed?
Your team might see something here that spurs you to activity in changing
any number of policies, procedures, or income-related features. It’s a simple
tool, but it might make you think.
Cash Activity Analysis Inquiry (Tool #185)
The Type field lets you separate activity for individuals and organization
accounts for a better picture of how cash is used by different types of
memberships.

Teller & Cash Activity Analysis Tools 19
The Mechanics
The summary screen shows cash activity starting with the first transaction
of the day (”Open”) to 9:00 a.m. and continuing in one hour time increments
until the block from 7:00 p.m. until the last transaction of the day (“Close”).
Transactions come from the CSHCHK file and include activity from the
previous month only. This file records cash deposits, cash withdrawals, and
cash-for-cash transactions. It also counts all incoming outside checks and
in-house drafts, regardless of whether the check was cashed or deposited. (If
an outside check was partially deposited with the rest in cash, the cash back
portion is not counted, however.)
Hint Regarding Teller Transfers: If funds are “transferred” by simply entering a deposit amount on one account and the same amount as a withdrawal on another account on the Teller Deposits/Withdrawals screen, the withdrawal is actually considered a drawer transaction because CU*BASE takes cash from the drawer then turns
right around and deposits it into the other account. This withdrawal would therefore be counted in the CSHCHK file. If a transfer is made using Proc Code T, the transaction is considered a true transfer and does not affect this file.
To view data for a single branch only, enter the number into the Branch field at the top of the screen (press Enter to refresh the screen). Use 00 to
combine all branches together. This system uses the branch as recorded on
the transaction record, meaning the teller branch where the transaction was
posted.