
Tell Your Library's Story with Infographics: Tips From an Accidental Graphic Designer
77
Tell your library’s story with infographics: Tips from an accidental graphic designer MAKING IT COUNT: CALIFORNIA LIBRARY ASSOCIATION PRECONFERENCE 2014 @lindahofschire
-
Upload
libraryresearchservice -
Category
Data & Analytics
-
view
151 -
download
3
Transcript of Tell Your Library's Story with Infographics: Tips From an Accidental Graphic Designer
Tell your library’s story with infographics:Tips from an accidental graphic designer
MAKING IT COUNT: CALIFORNIA LIBRARY
ASSOCIATION PRECONFERENCE 2014
@lindahofschire
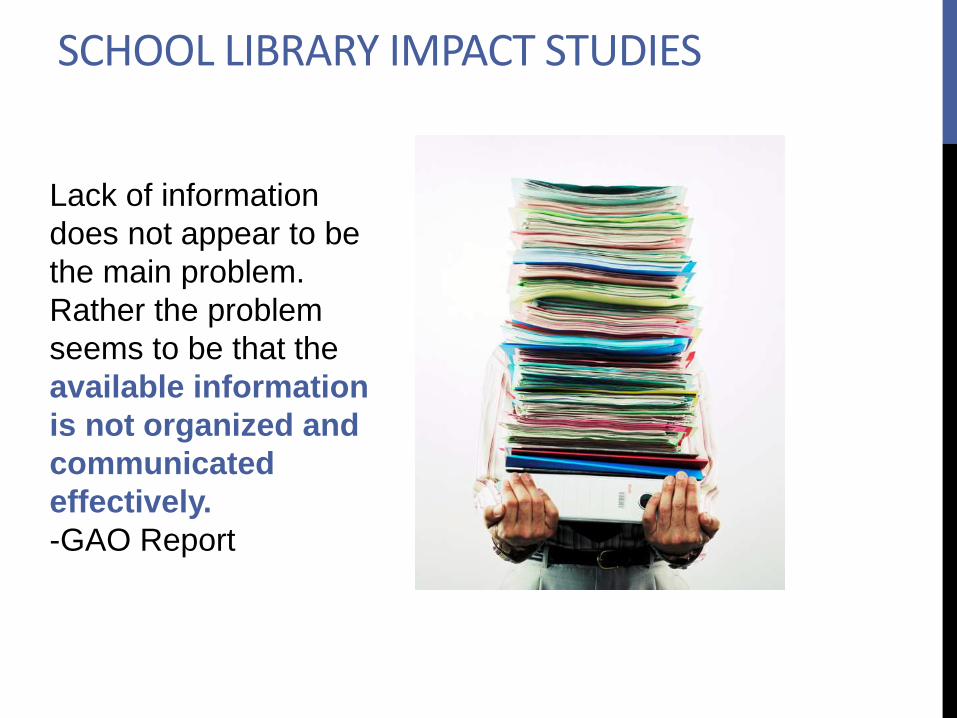
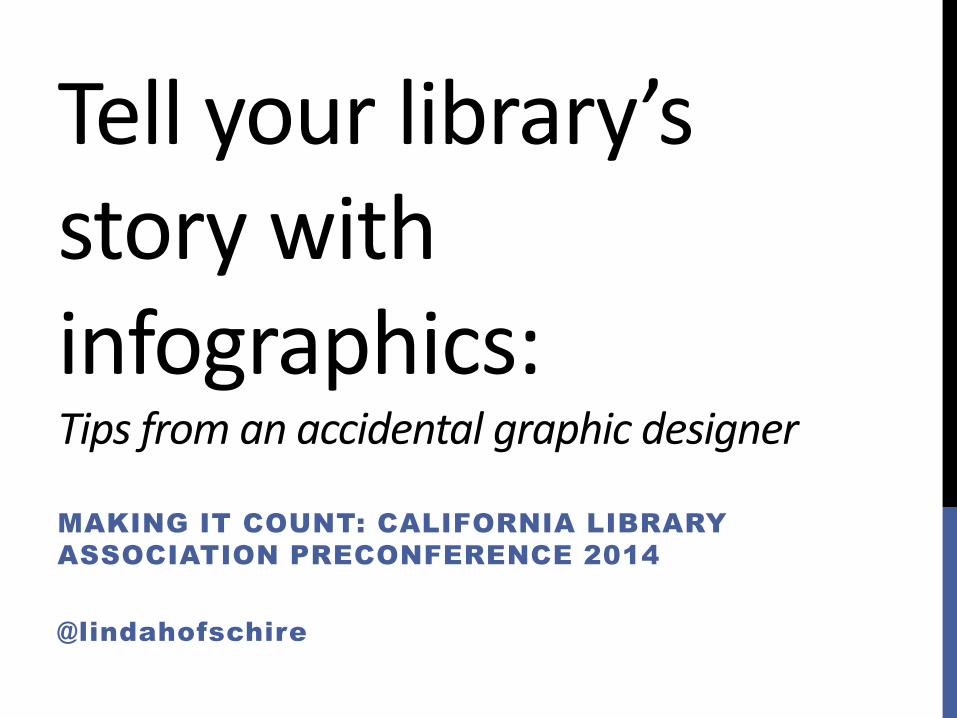
SCHOOL LIBRARY IMPACT STUDIES
Lack of information
does not appear to be
the main problem.
Rather the problem
seems to be that the
available information
is not organized and
communicated
effectively.
-GAO Report
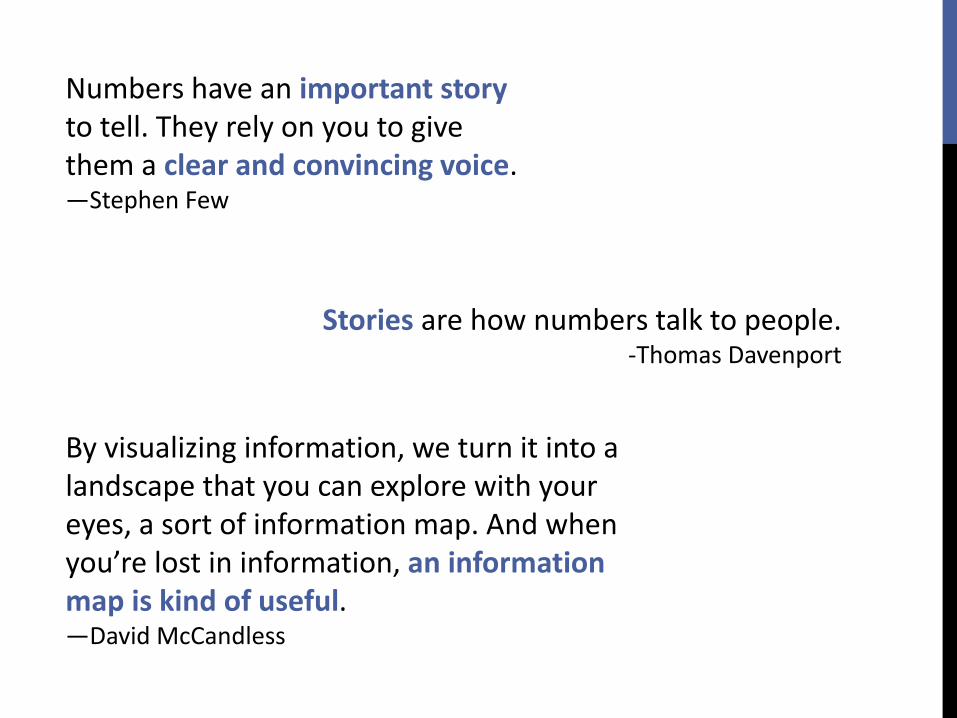
Stories are how numbers talk to people.-Thomas Davenport
By visualizing information, we turn it into a landscape that you can explore with your eyes, a sort of information map. And when you’re lost in information, an information map is kind of useful.―David McCandless
Numbers have an important story to tell. They rely on you to give them a clear and convincing voice.―Stephen Few
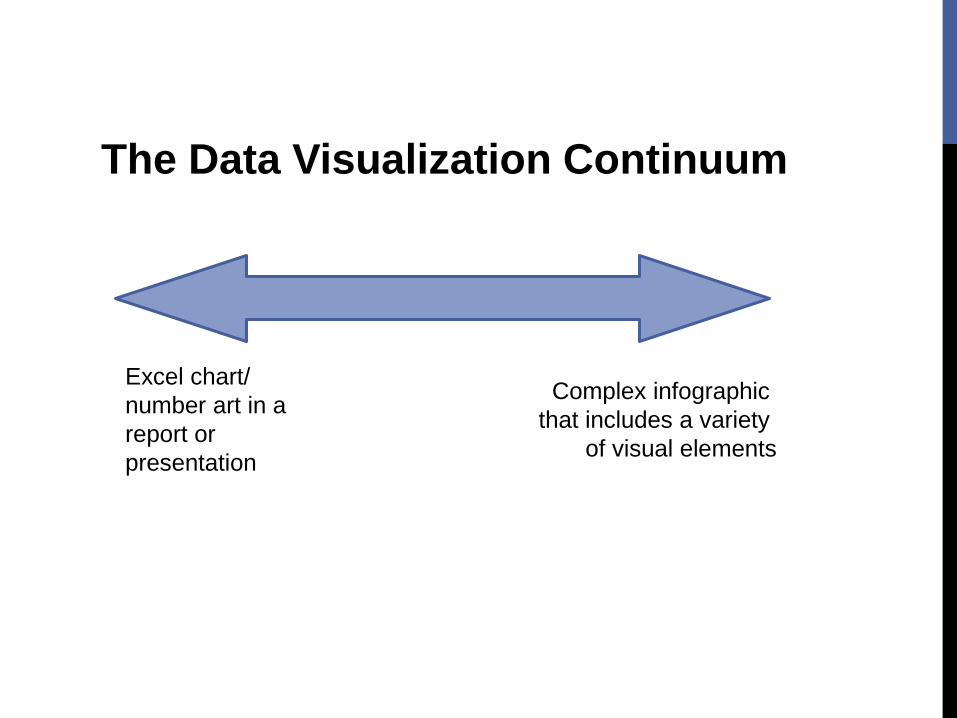
The Data Visualization Continuum
Excel chart/
number art in a
report or
presentation
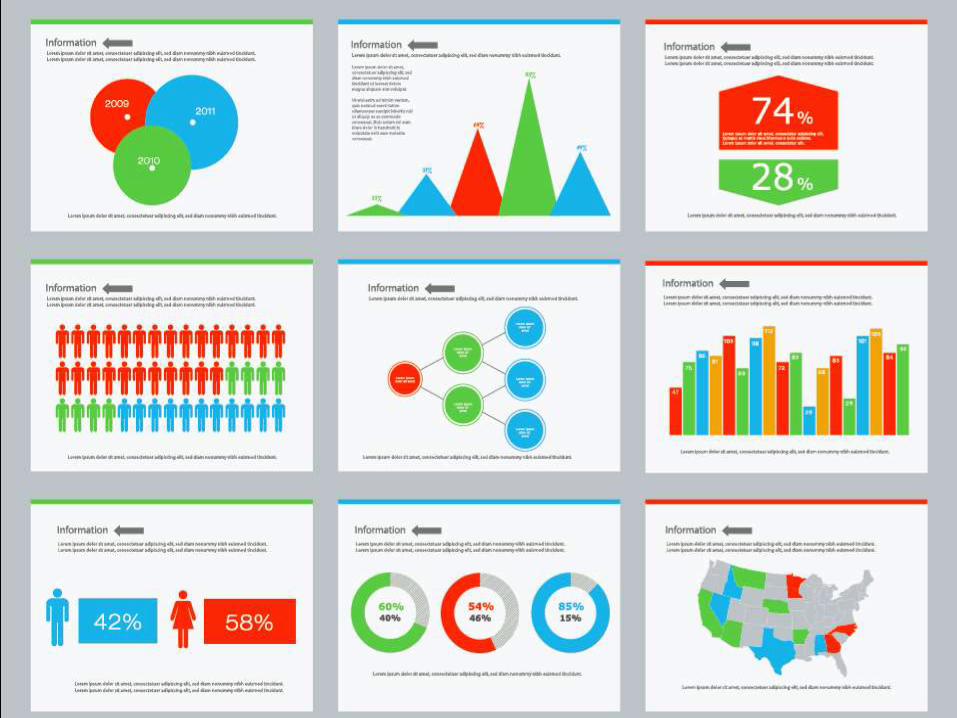
Complex infographic
that includes a variety
of visual elements
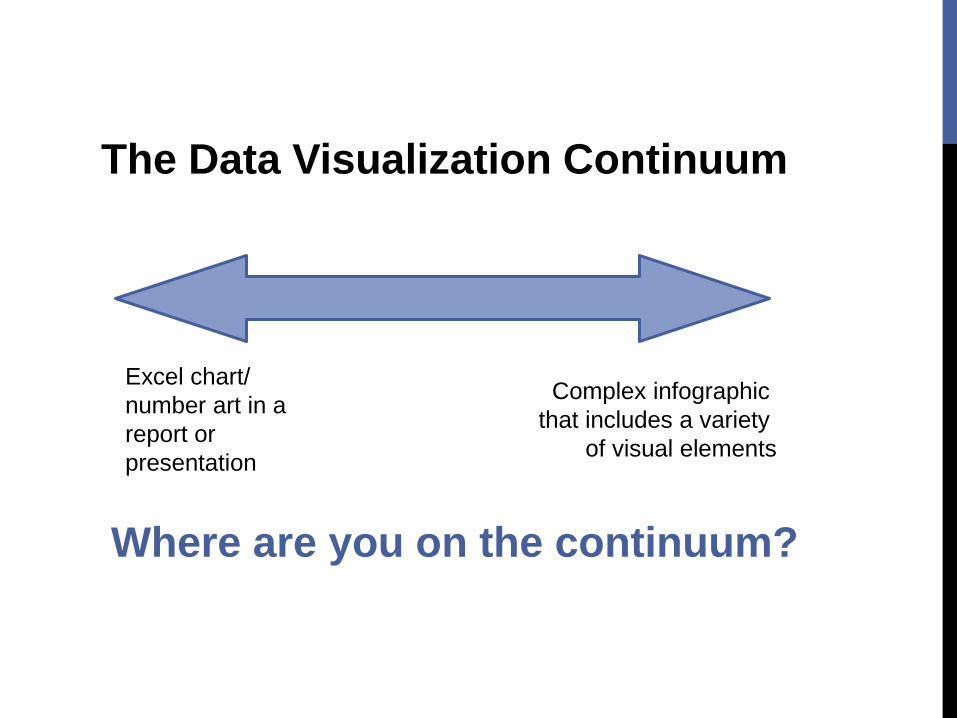
The Data Visualization Continuum
Excel chart/
number art in a
report or
presentation
Complex infographic
that includes a variety
of visual elements
Where are you on the continuum?
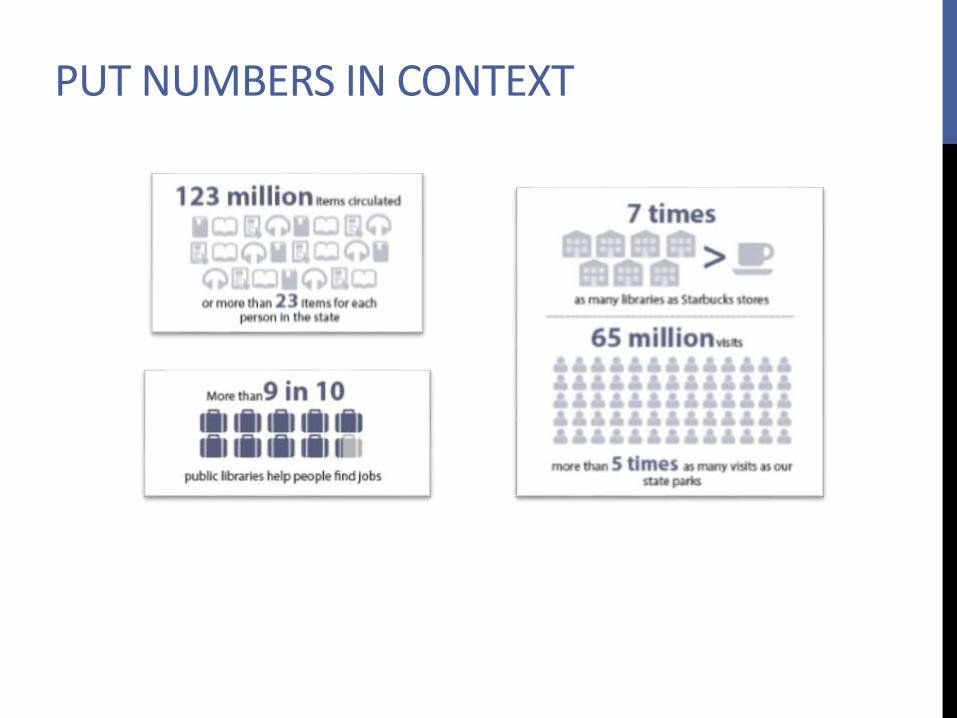
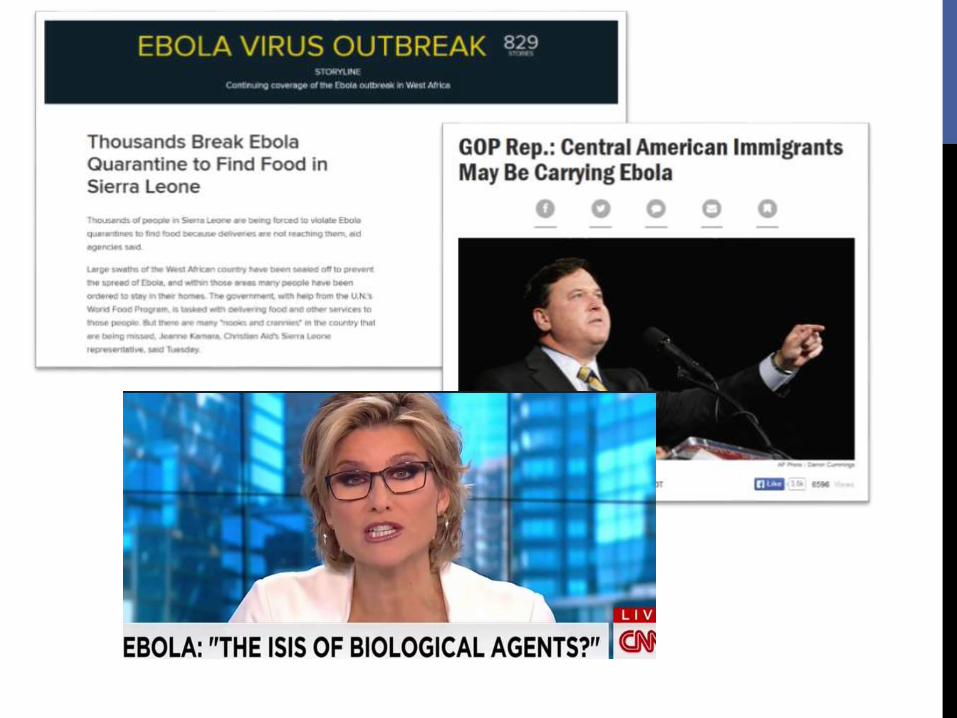
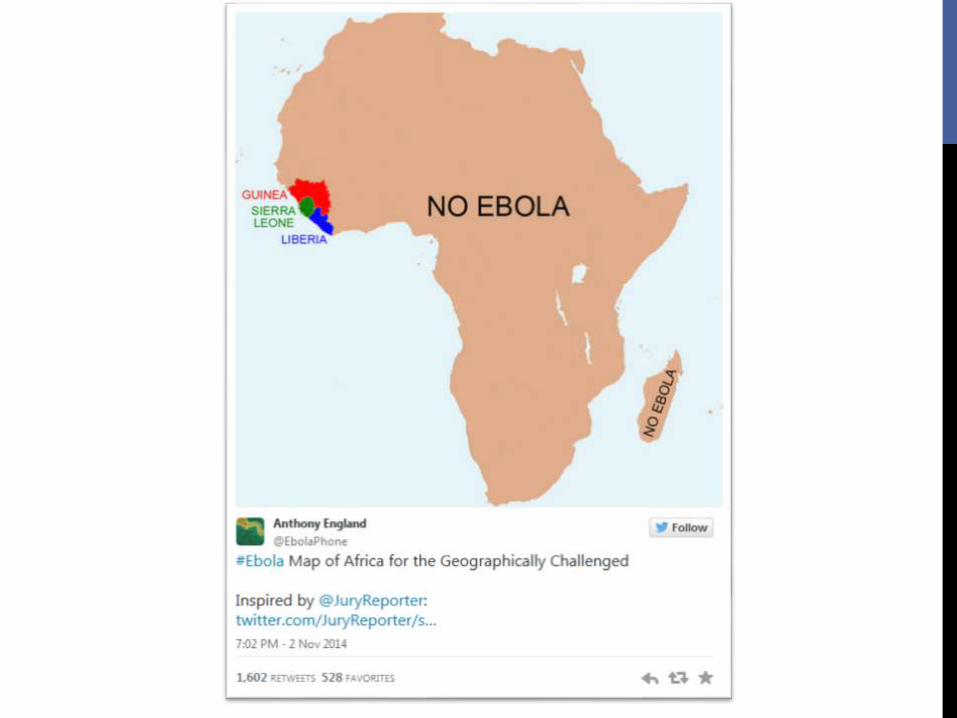
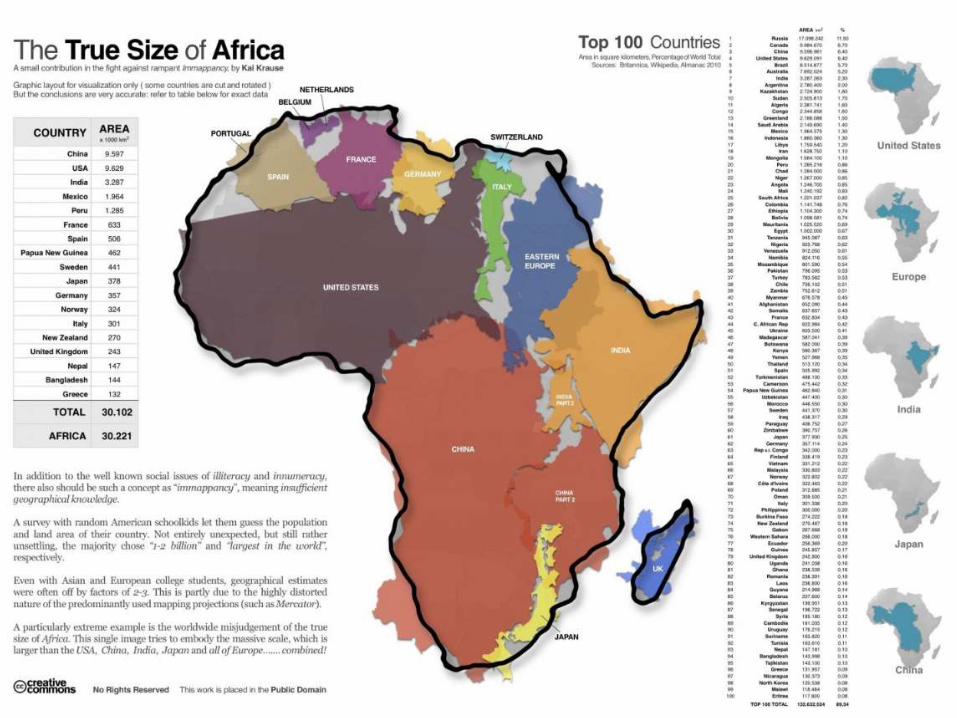
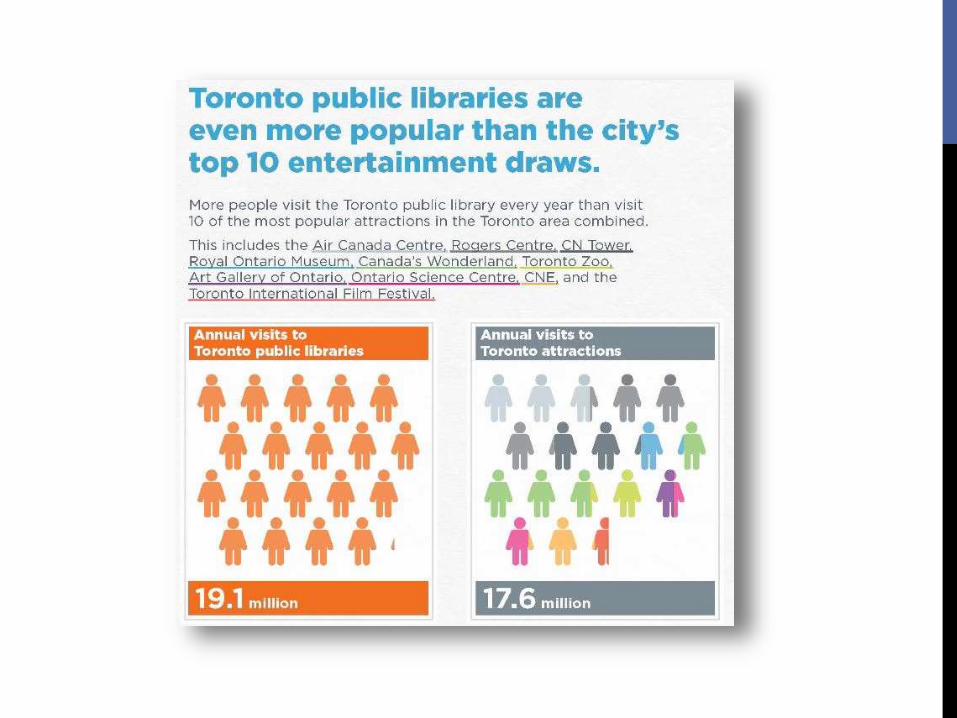
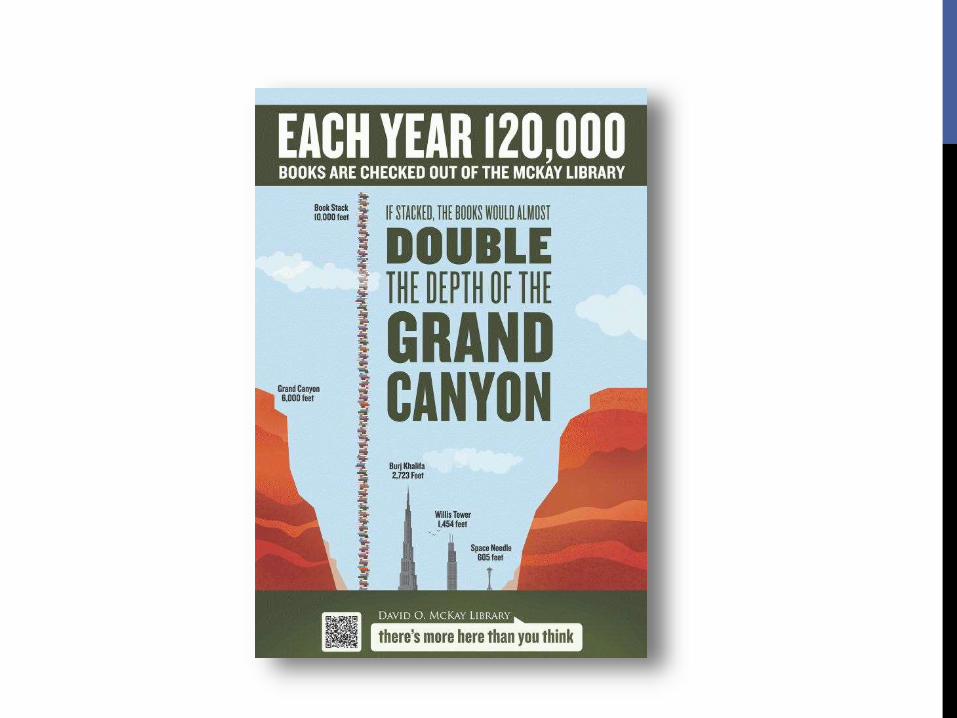
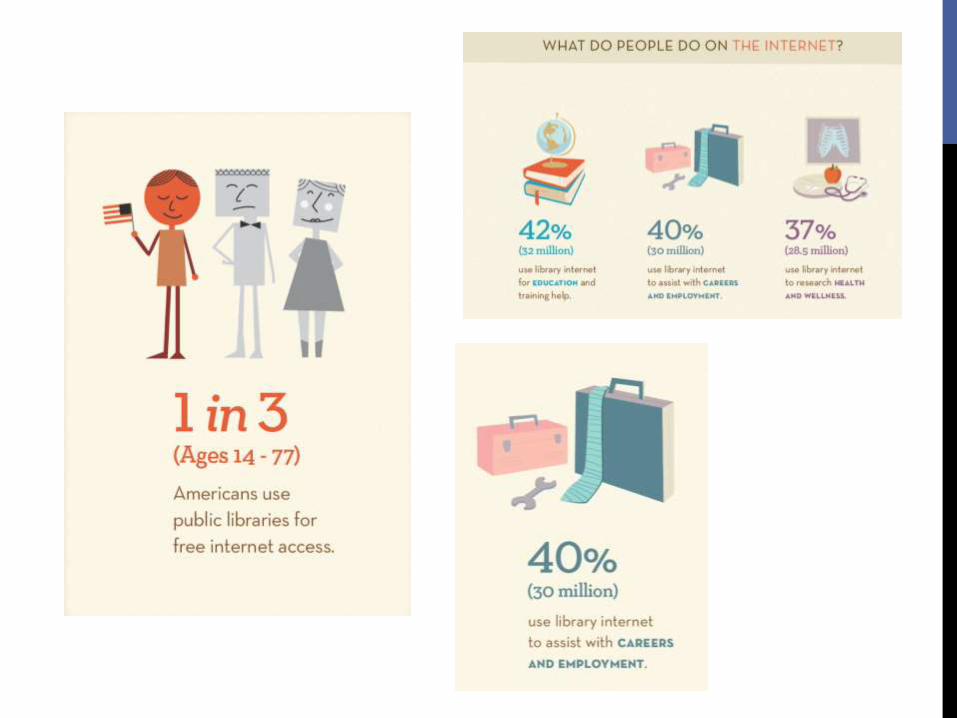
PUT NUMBERS IN CONTEXT
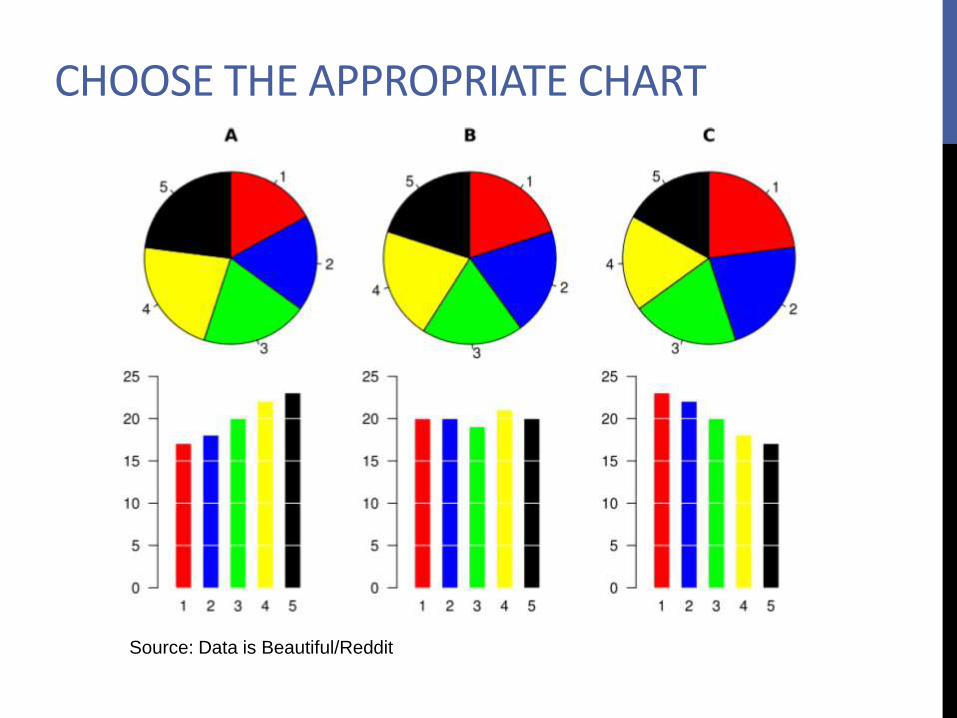
Source: Data is Beautiful/Reddit
CHOOSE THE APPROPRIATE CHART
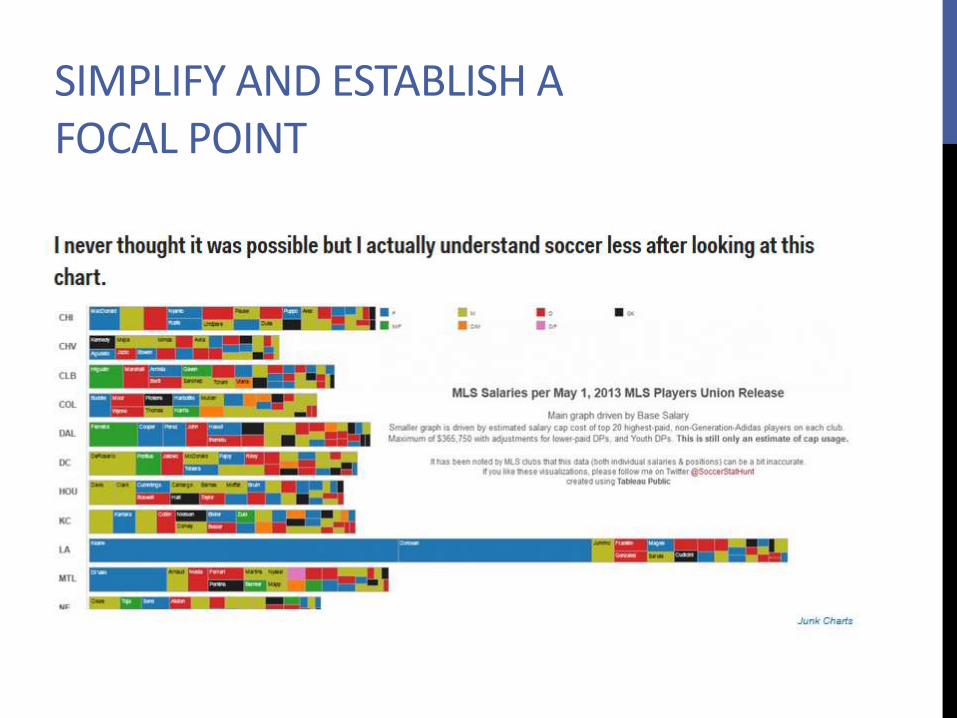
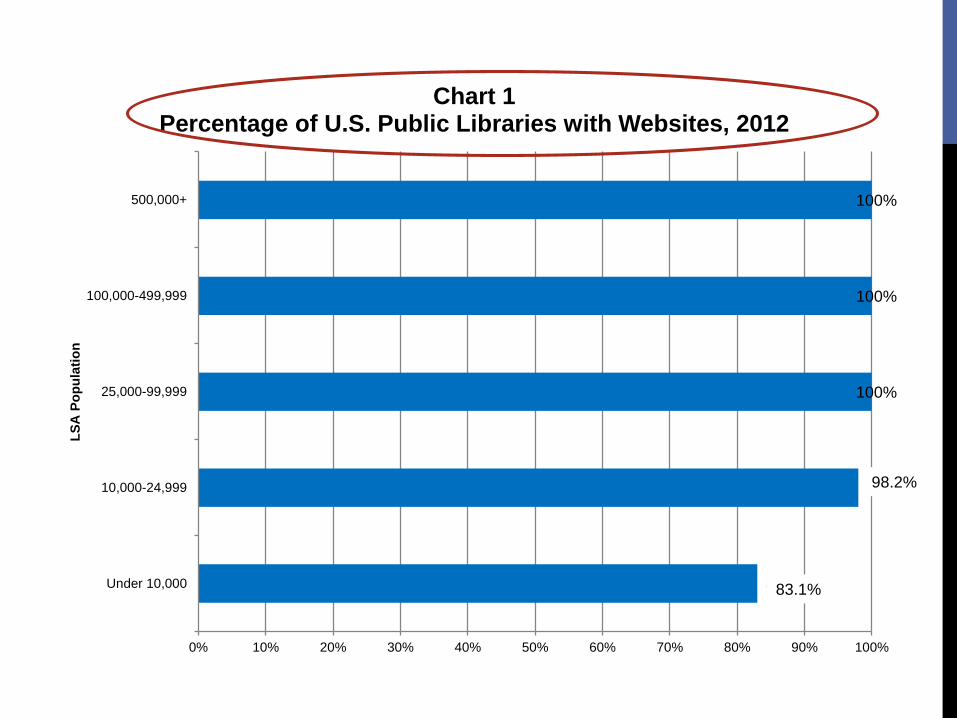
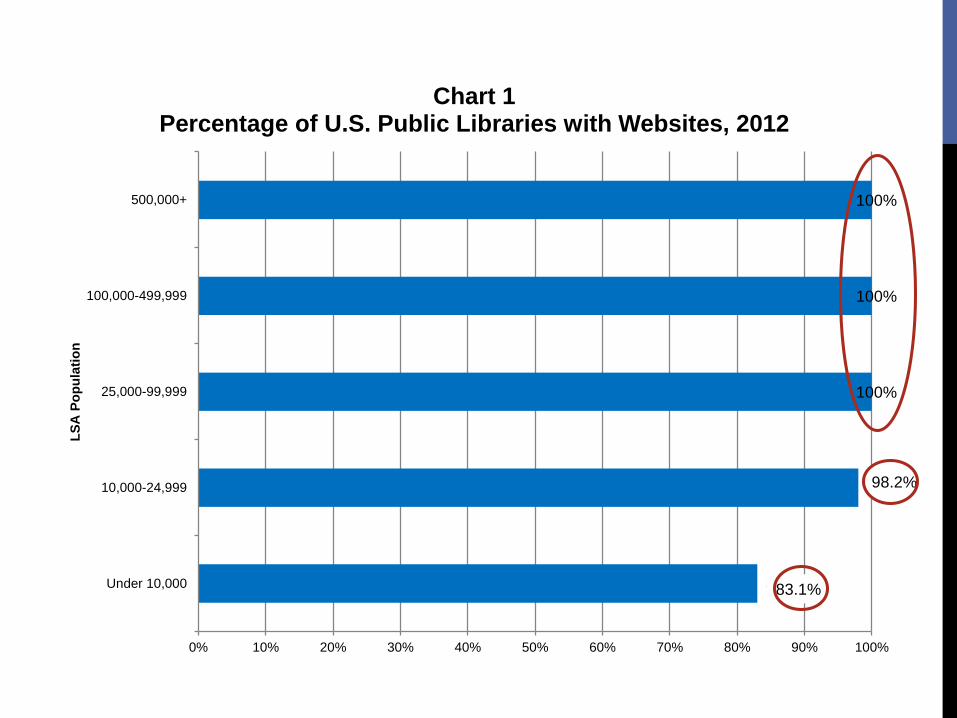
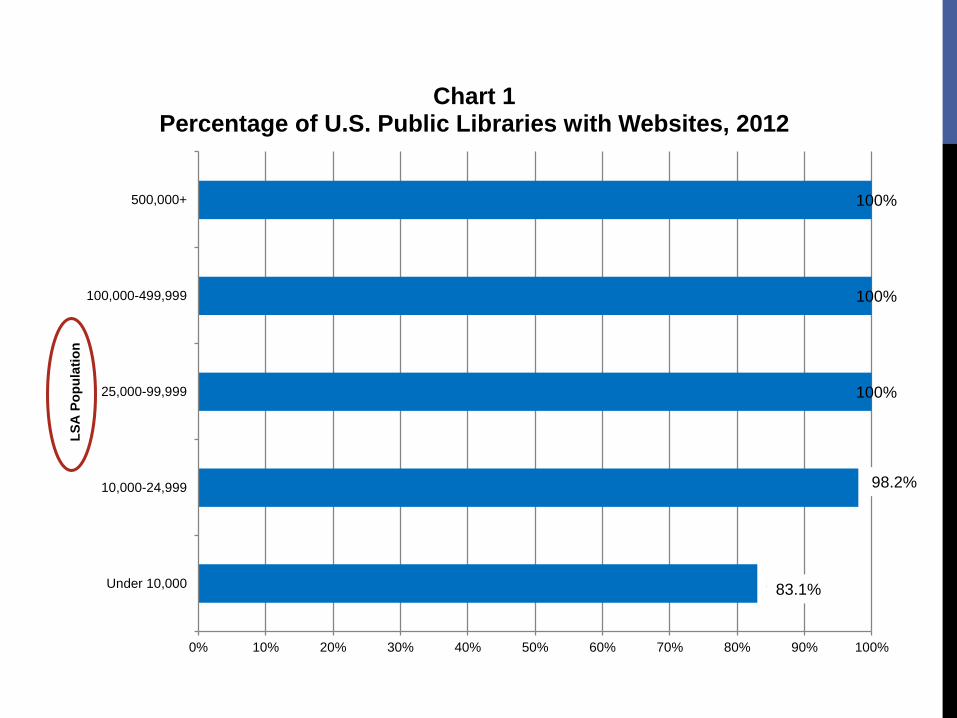
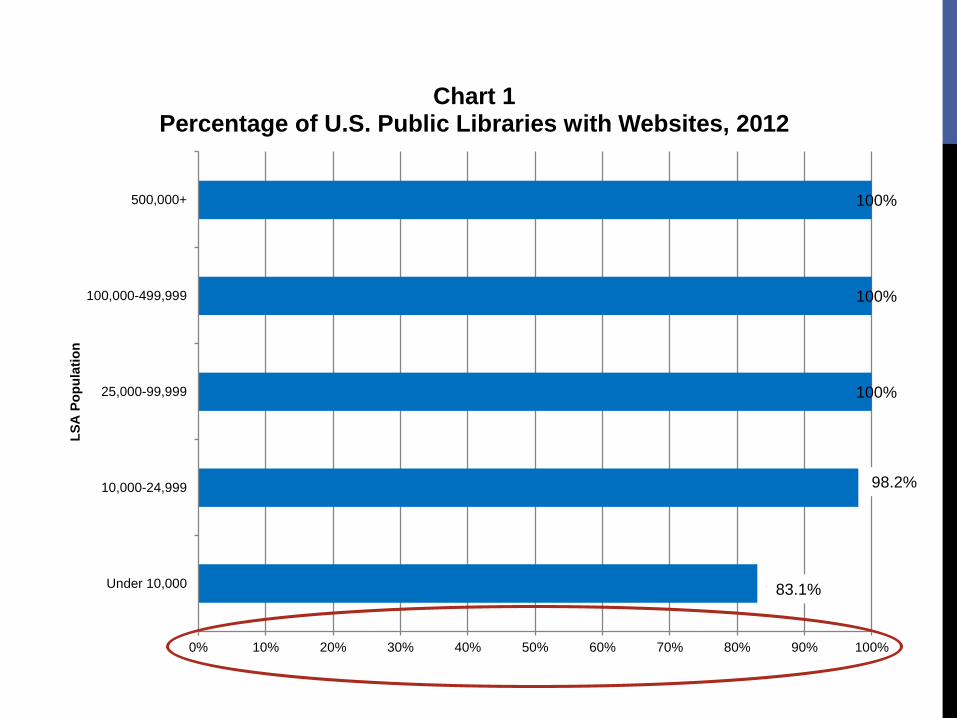
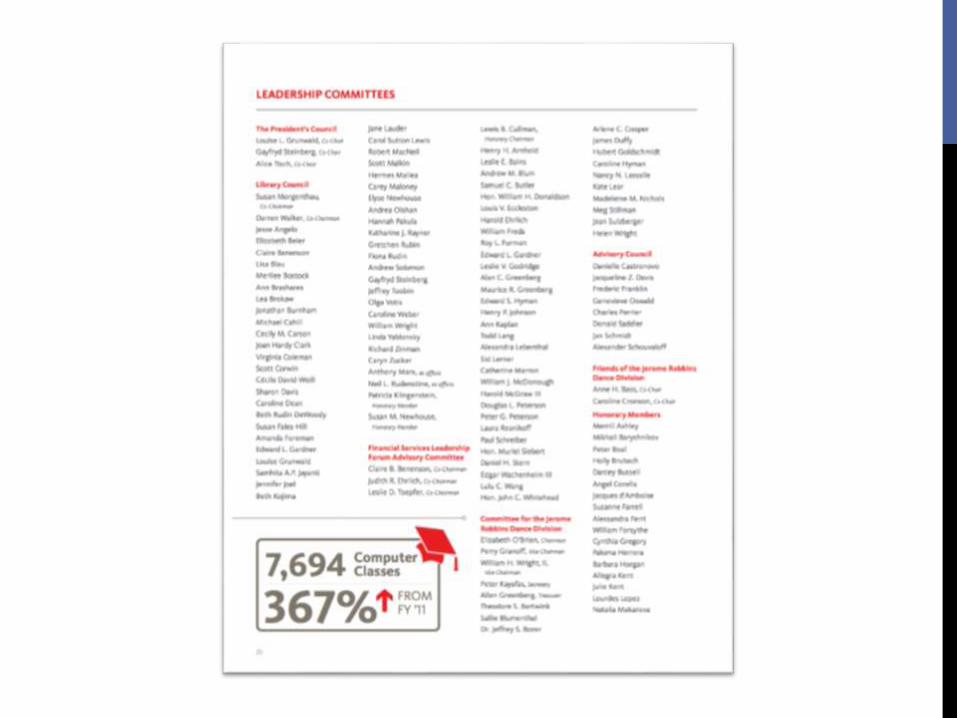
SIMPLIFY AND ESTABLISH A FOCAL POINT
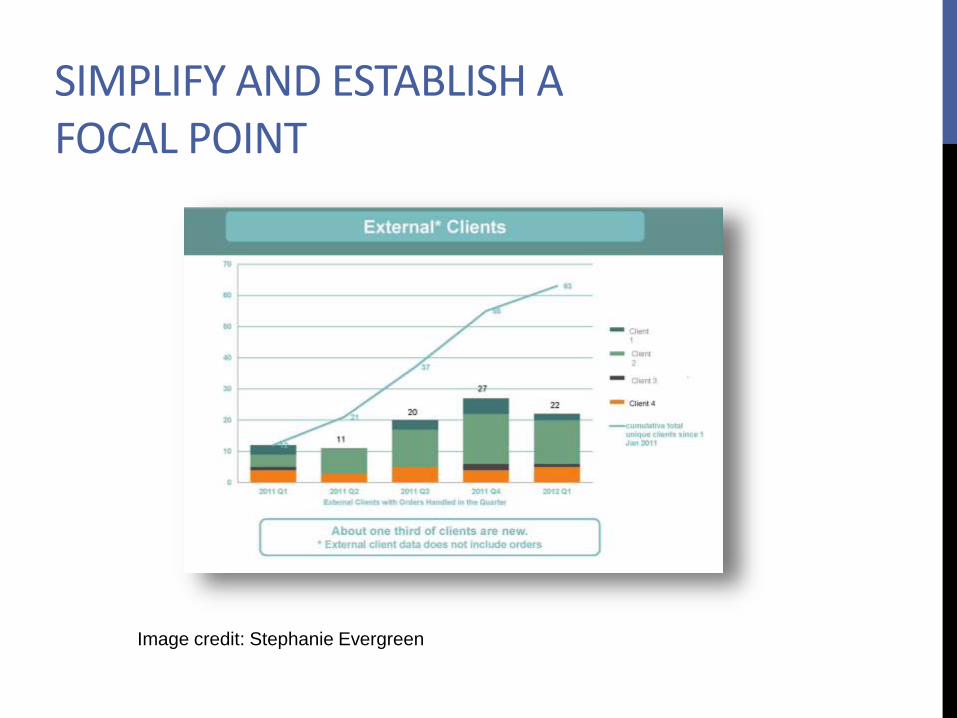
SIMPLIFY AND ESTABLISH A FOCAL POINT
Image credit: Stephanie Evergreen
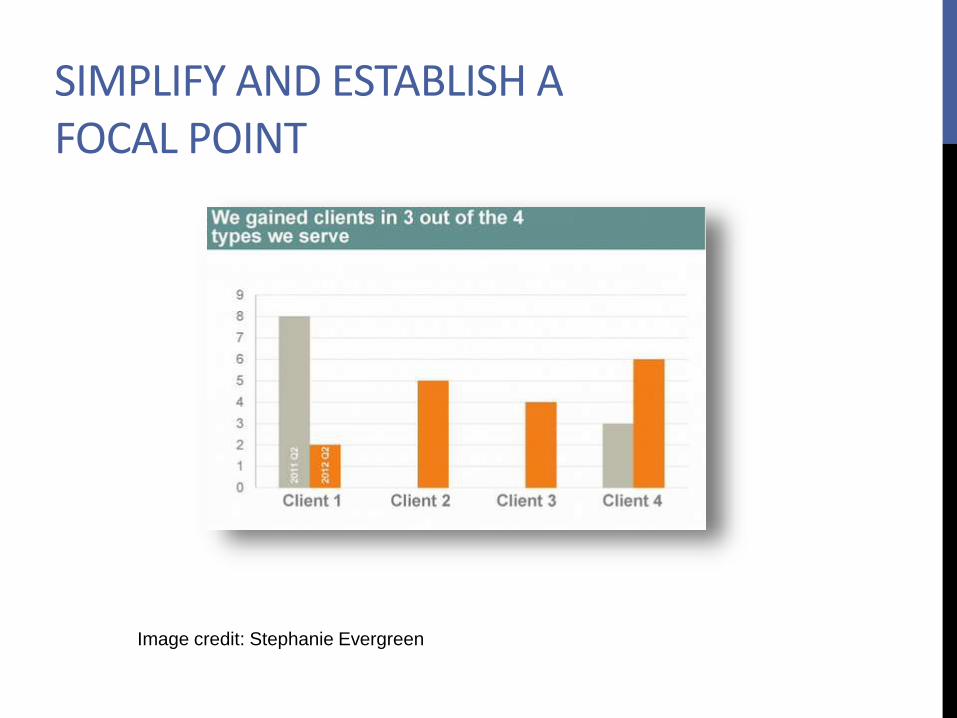
SIMPLIFY AND ESTABLISH A FOCAL POINT
Image credit: Stephanie Evergreen

83%
98%
100%
100%
100%
0% 10% 20% 30% 40% 50% 60% 70% 80% 90% 100%
Under 10,000
10,000-24,999
25,000-99,999
100,000-499,999
500,000+
LS
A P
op
ula
tio
n
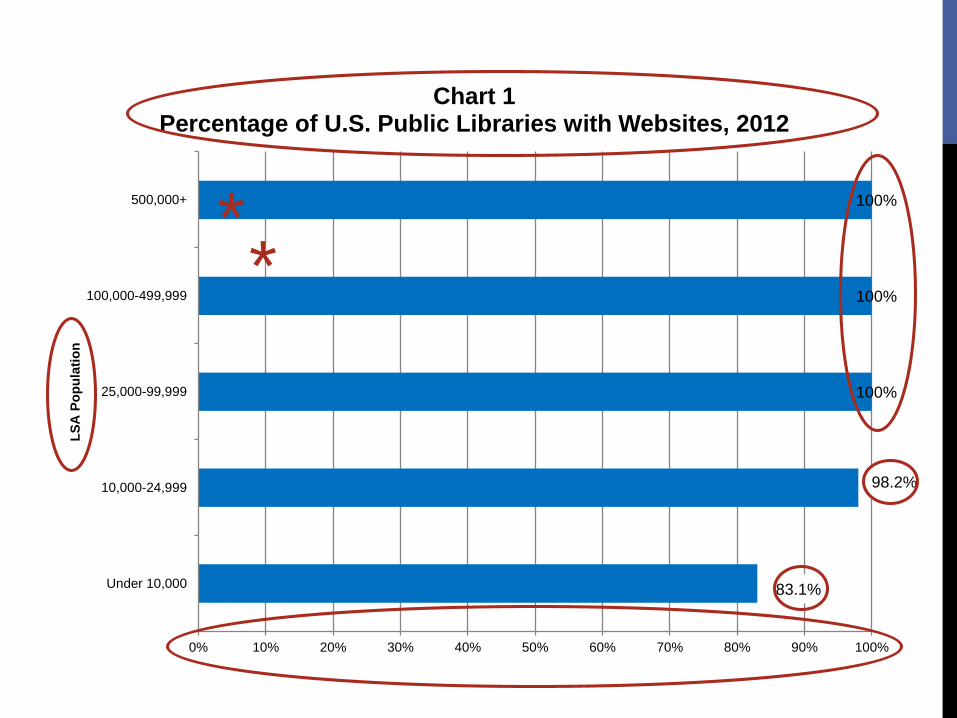
Chart 1Percentage of U.S. Public Libraries with Websites, 2012
83.1%
98.2%
83%
98%
100%
100%
100%
0% 10% 20% 30% 40% 50% 60% 70% 80% 90% 100%
Under 10,000
10,000-24,999
25,000-99,999
100,000-499,999
500,000+
LS
A P
op
ula
tio
n
Chart 1Percentage of U.S. Public Libraries with Websites, 2012
83.1%
*
98.2%
*
83%
98%
100%
100%
100%
0% 10% 20% 30% 40% 50% 60% 70% 80% 90% 100%
Under 10,000
10,000-24,999
25,000-99,999
100,000-499,999
500,000+
LS
A P
op
ula
tio
n
Chart 1Percentage of U.S. Public Libraries with Websites, 2012
83.1%
98.2%

83%
98%
100%
100%
100%
0% 10% 20% 30% 40% 50% 60% 70% 80% 90% 100%
Under 10,000
10,000-24,999
25,000-99,999
100,000-499,999
500,000+
LS
A P
op
ula
tio
n
Chart 1Percentage of U.S. Public Libraries with Websites, 2012
83.1%
*
98.2%
*
83%
98%
100%
100%
100%
0% 10% 20% 30% 40% 50% 60% 70% 80% 90% 100%
Under 10,000
10,000-24,999
25,000-99,999
100,000-499,999
500,000+
LS
A P
op
ula
tio
n
Chart 1Percentage of U.S. Public Libraries with Websites, 2012
83.1%
98.2%
83%
98%
100%
100%
100%
0% 10% 20% 30% 40% 50% 60% 70% 80% 90% 100%
Under 10,000
10,000-24,999
25,000-99,999
100,000-499,999
500,000+
LS
A P
op
ula
tio
n
Chart 1Percentage of U.S. Public Libraries with Websites, 2012
83.1%
98.2%
83%
98%
100%
100%
100%
0% 10% 20% 30% 40% 50% 60% 70% 80% 90% 100%
Under 10,000
10,000-24,999
25,000-99,999
100,000-499,999
500,000+
LS
A P
op
ula
tio
n
Chart 1Percentage of U.S. Public Libraries with Websites, 2012
83.1%
98.2%
83%
98%
100%
100%
100%
0% 20% 40% 60% 80% 100%
Under 10,000
10,000-24,999
25,000-99,999
100,000-499,999
500,000+
Percent of U.S. Public Libraries with Websites
Siz
e o
f P
op
ula
tio
n S
erv
ed
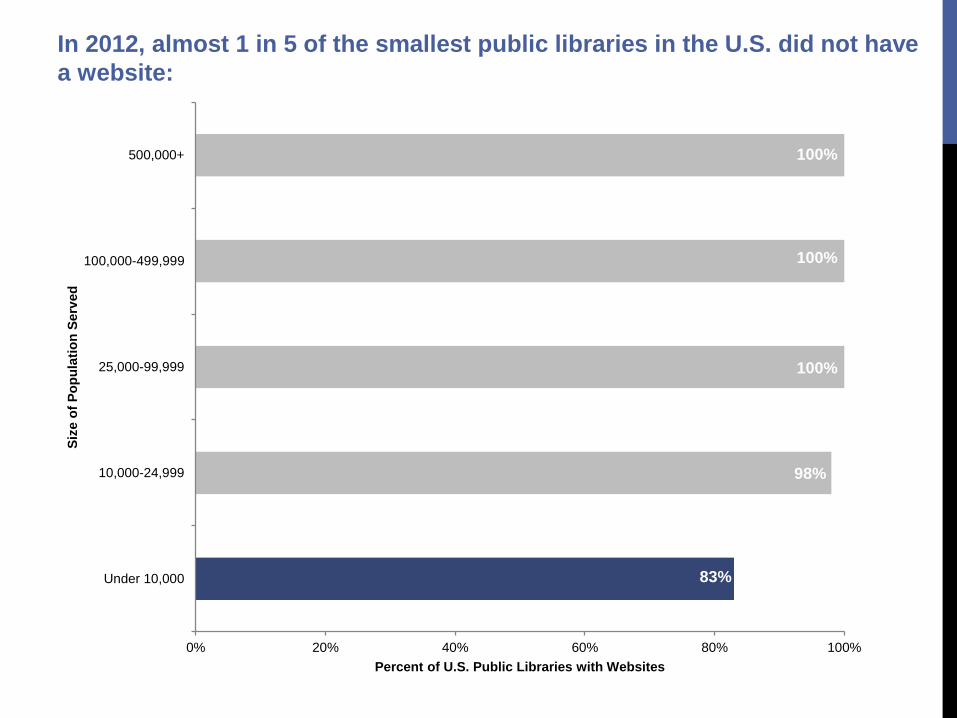
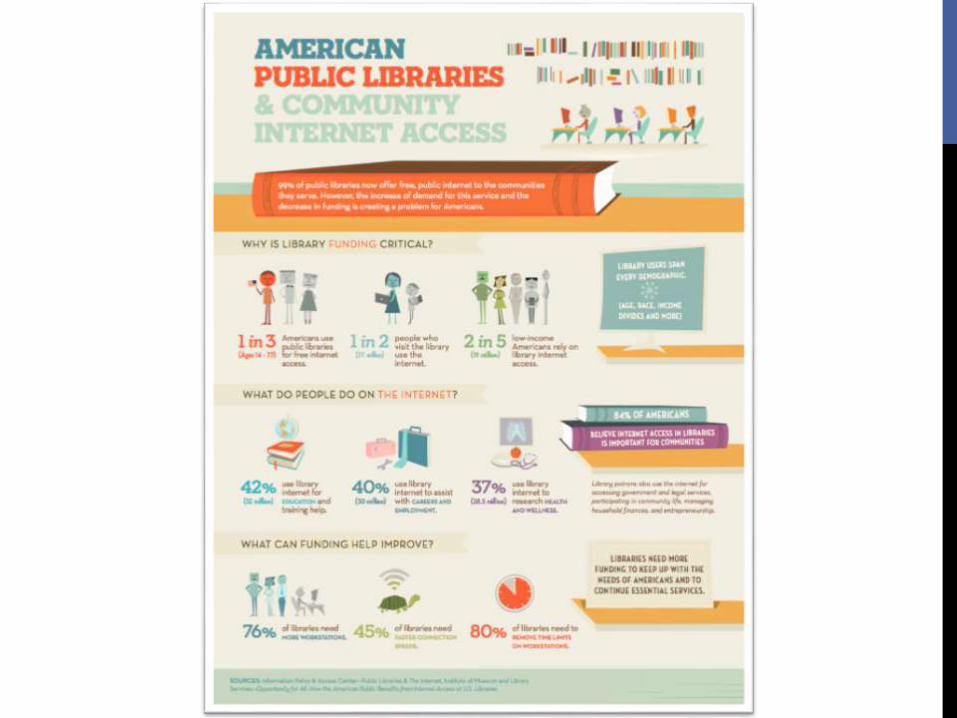
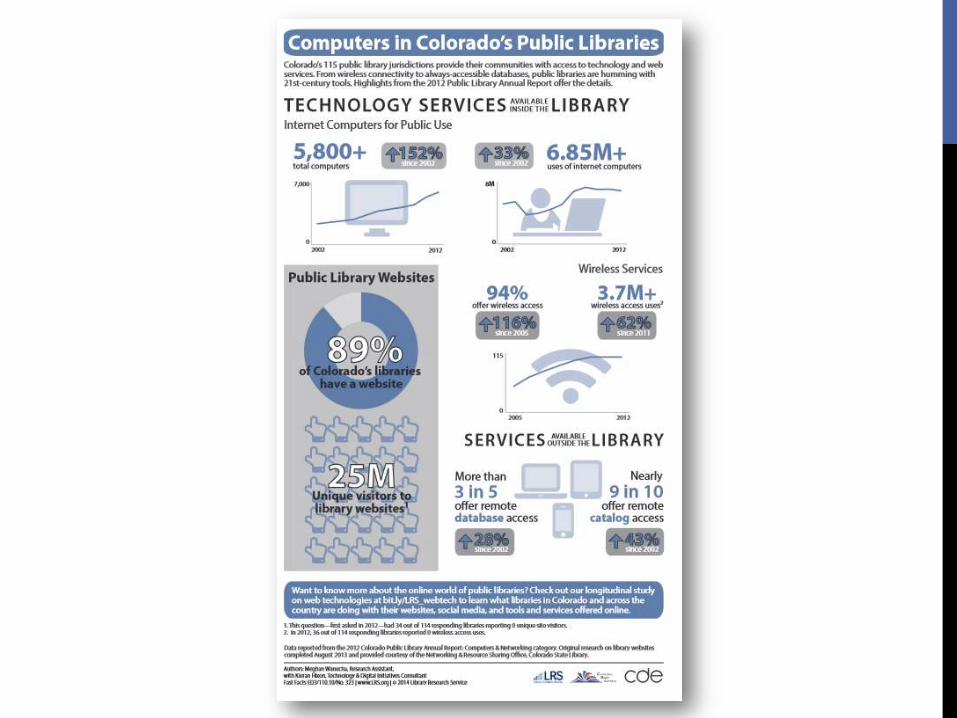
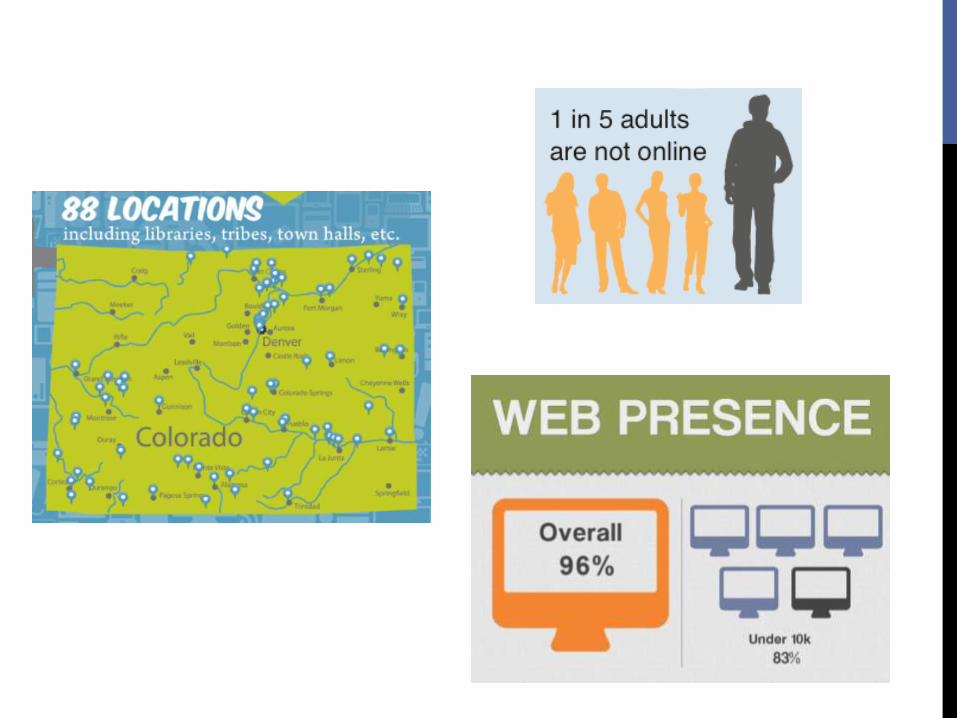
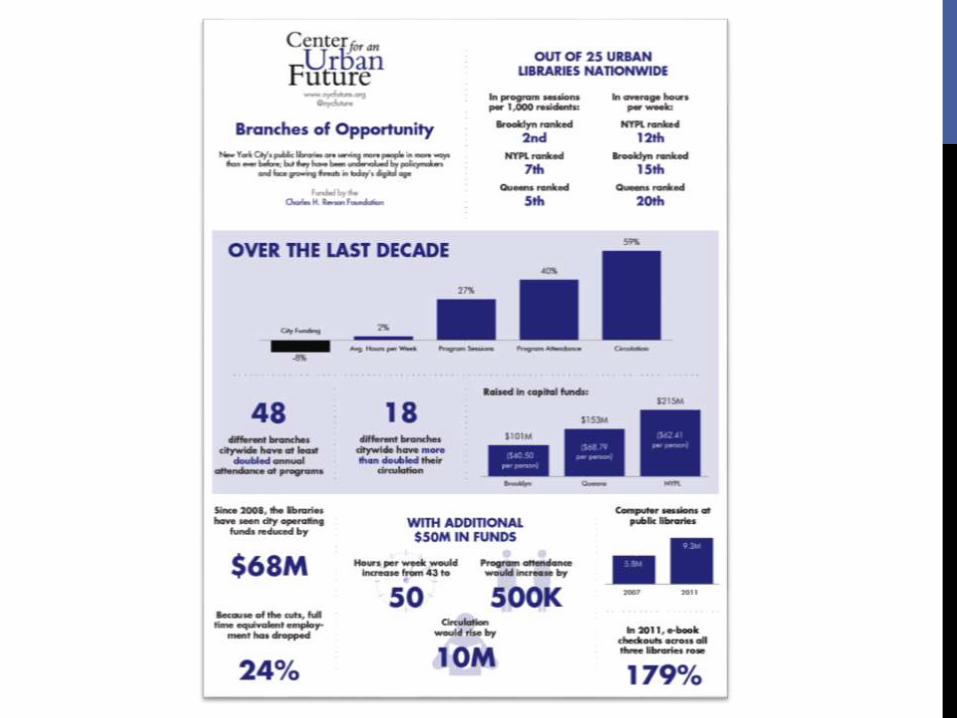
In 2012, almost 1 in 5 of the smallest public libraries in the U.S. did not have
a website:

83%
98%
100%
100%
100%
0% 10% 20% 30% 40% 50% 60% 70% 80% 90% 100%
Under 10,000
10,000-24,999
25,000-99,999
100,000-499,999
500,000+
LS
A P
op
ula
tio
n
Chart 1Percentage of U.S. Public Libraries with Websites, 2012
83.1%
98.2%

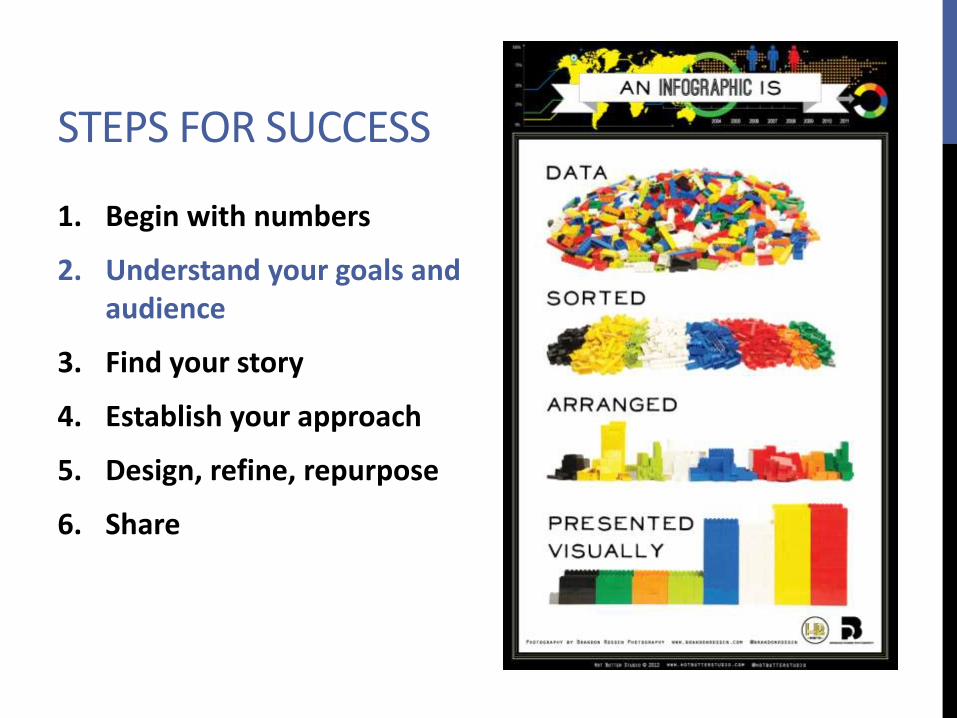
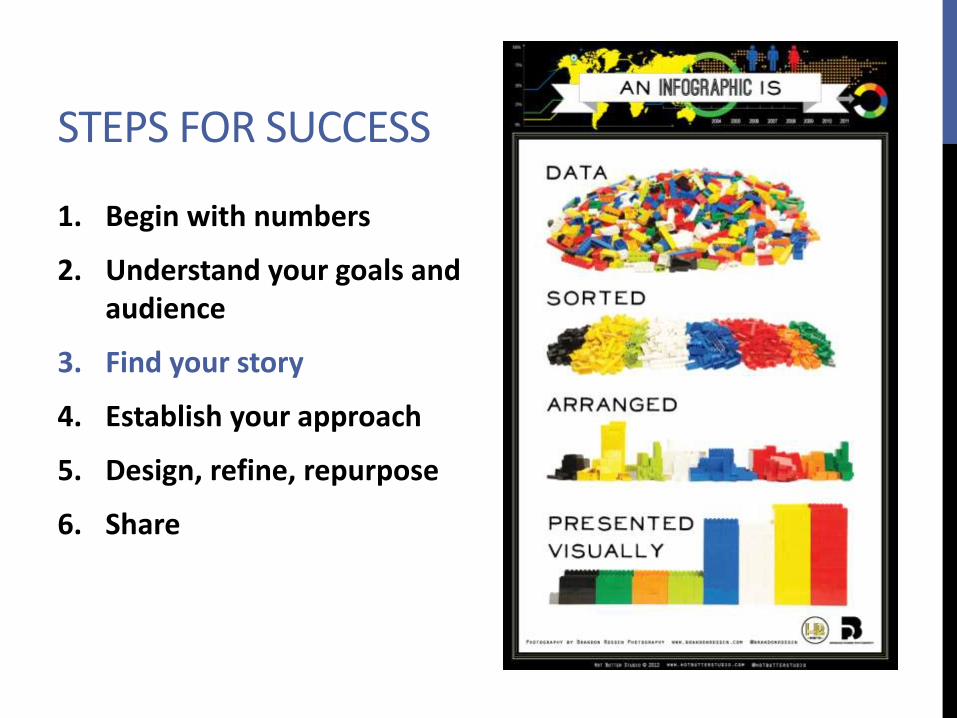
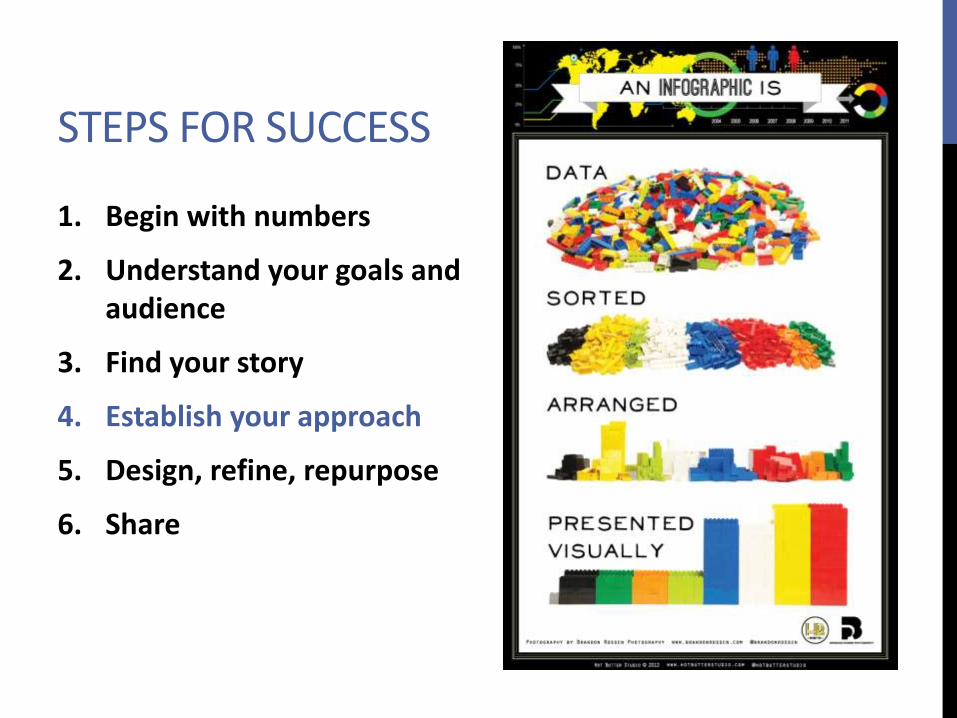
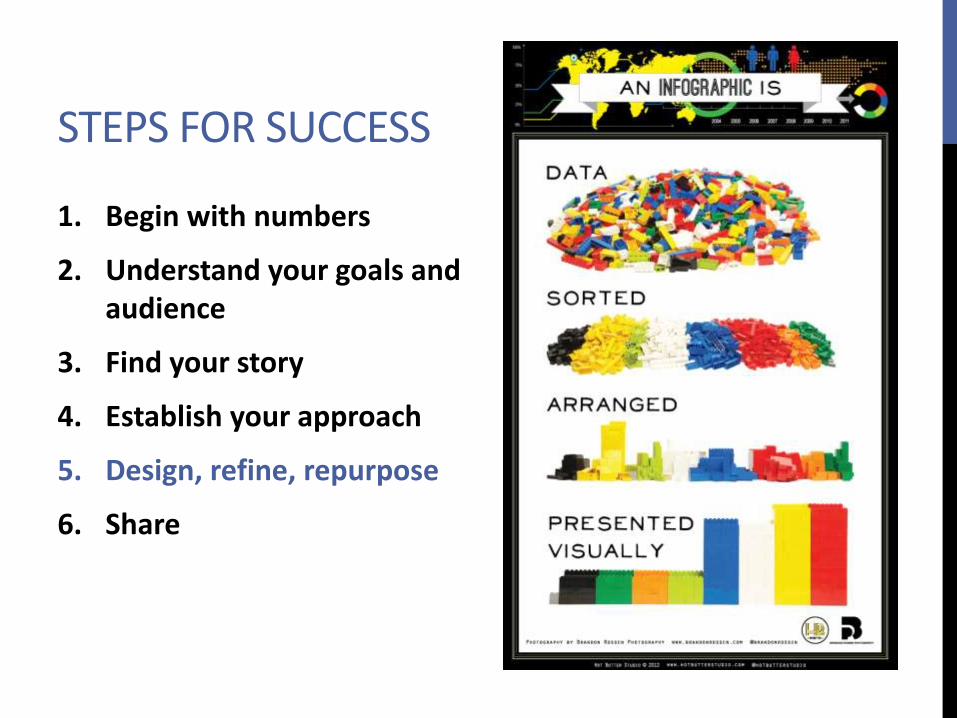
STEPS FOR SUCCESS
1. Begin with numbers
2. Understand your goals and audience
3. Find your story
4. Establish your approach
5. Design, refine, repurpose
6. Share

STEPS FOR SUCCESS
1. Begin with numbers
2. Understand your goals and audience
3. Find your story
4. Establish your approach
5. Design, refine, repurpose
6. Share
STEPS FOR SUCCESS
1. Begin with numbers
2. Understand your goals and audience
3. Find your story
4. Establish your approach
5. Design, refine, repurpose
6. Share
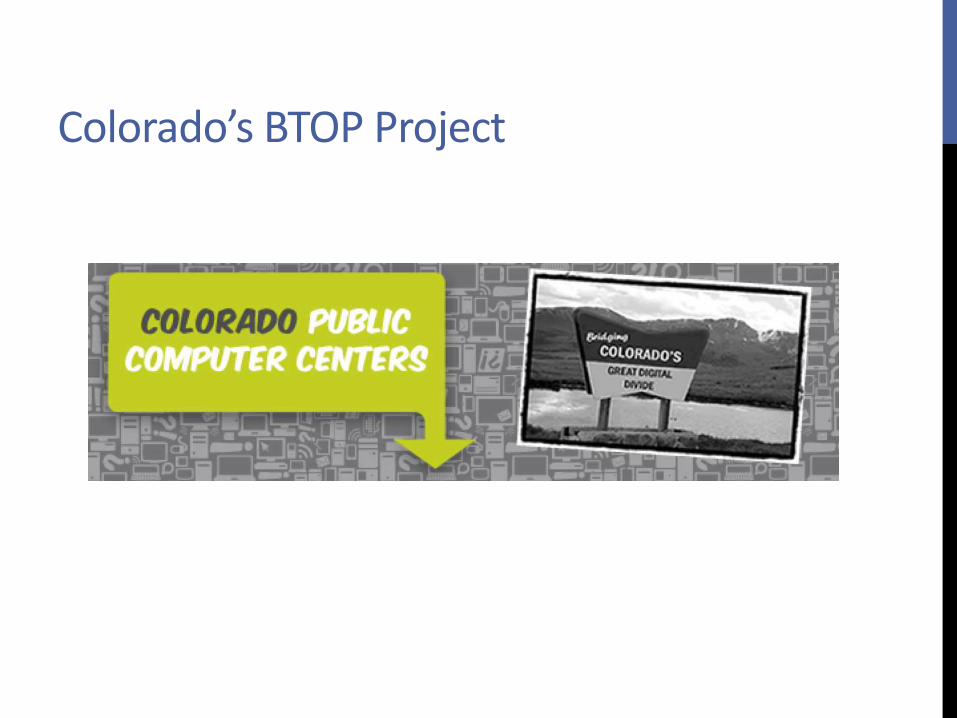
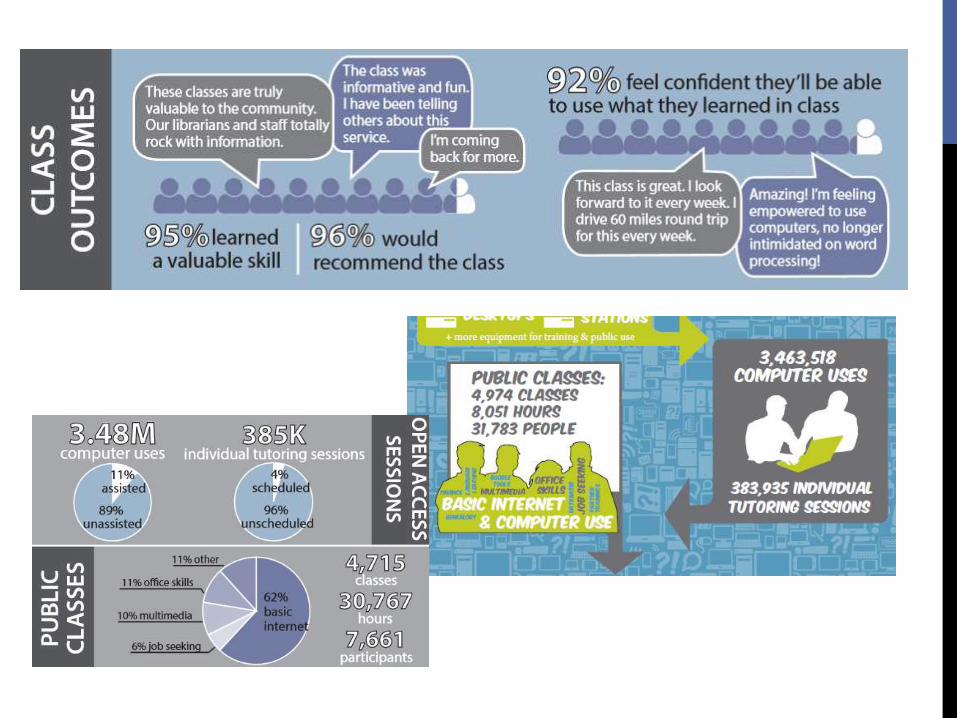
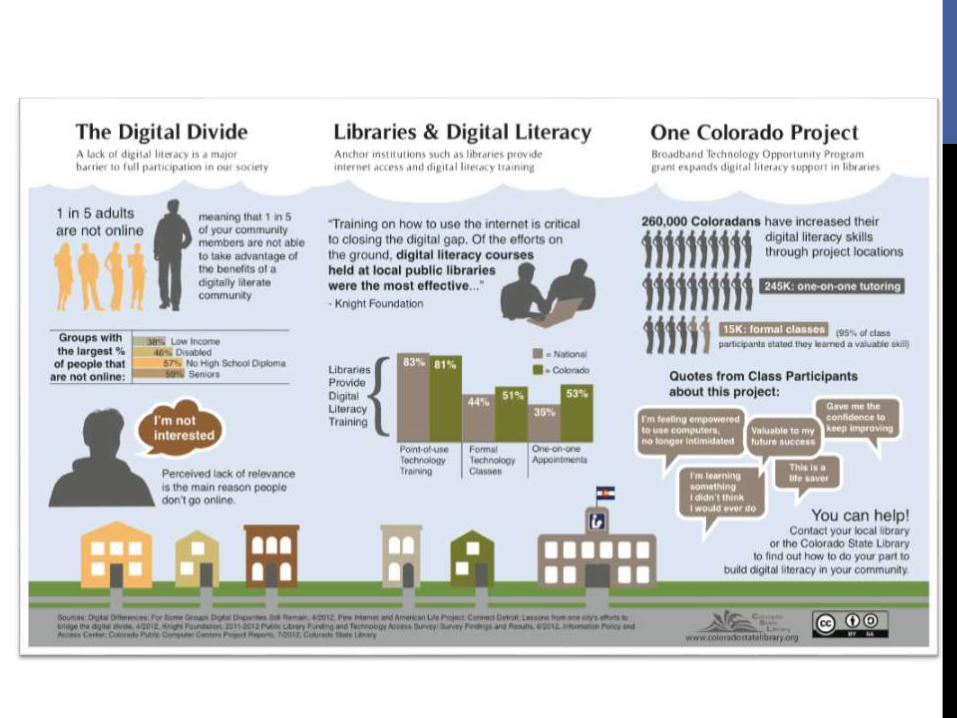
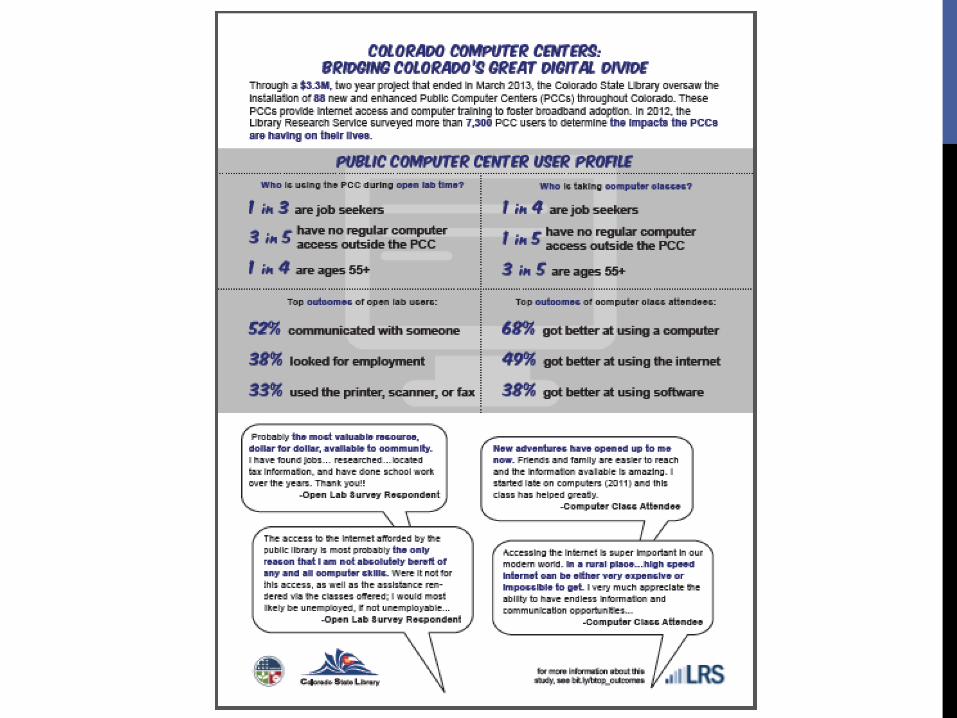
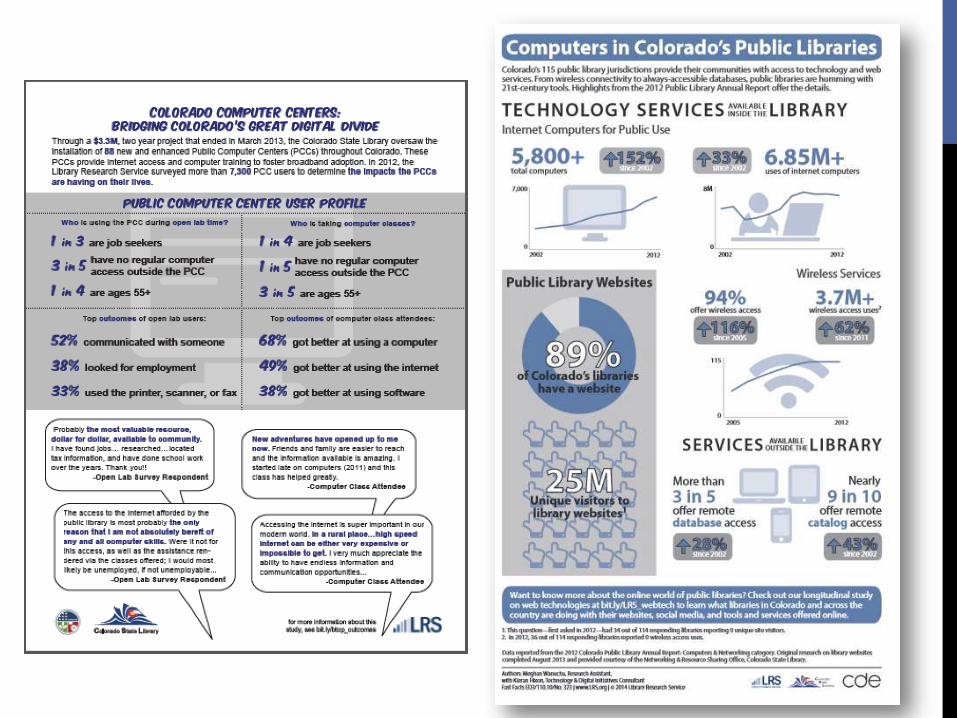
Colorado’s BTOP Project
STEPS FOR SUCCESS
1. Begin with numbers
2. Understand your goals and audience
3. Find your story
4. Establish your approach
5. Design, refine, repurpose
6. Share
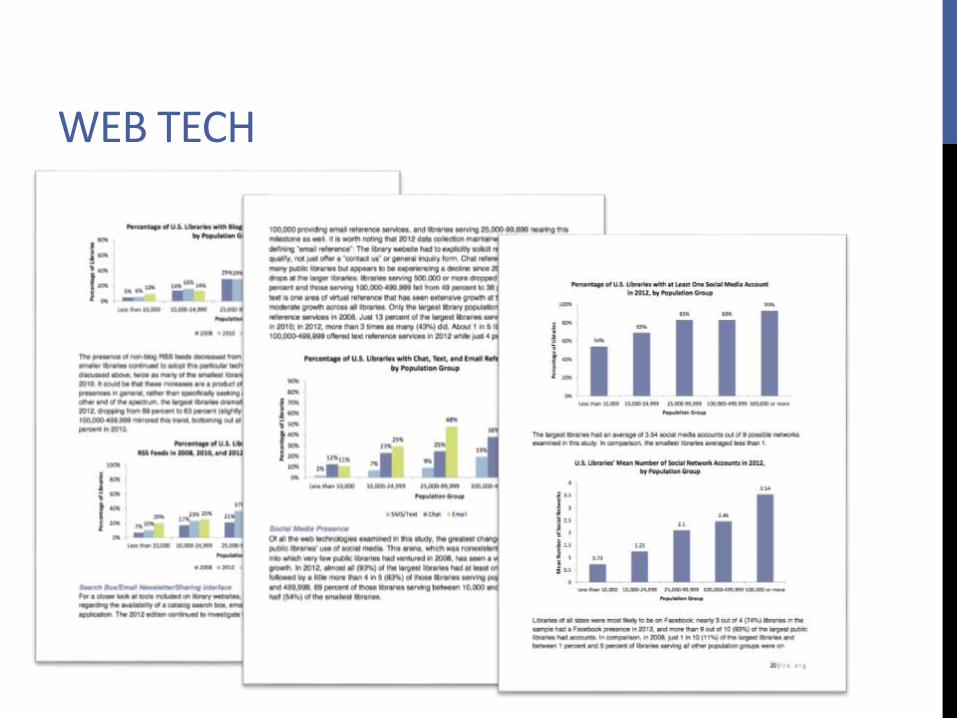
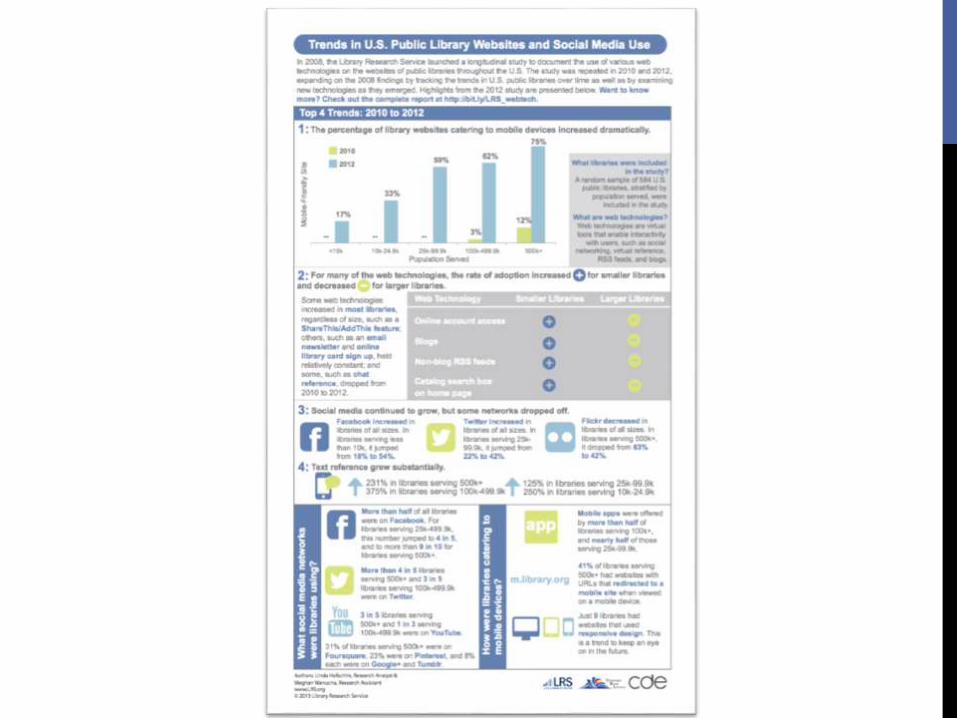
WEB TECH
WEB TECH
Mobile-friendly sites
Adoption patterns in larger vs. smaller libraries
Social media
Text reference
STEPS FOR SUCCESS
1. Begin with numbers
2. Understand your goals and audience
3. Find your story
4. Establish your approach
5. Design, refine, repurpose
6. Share
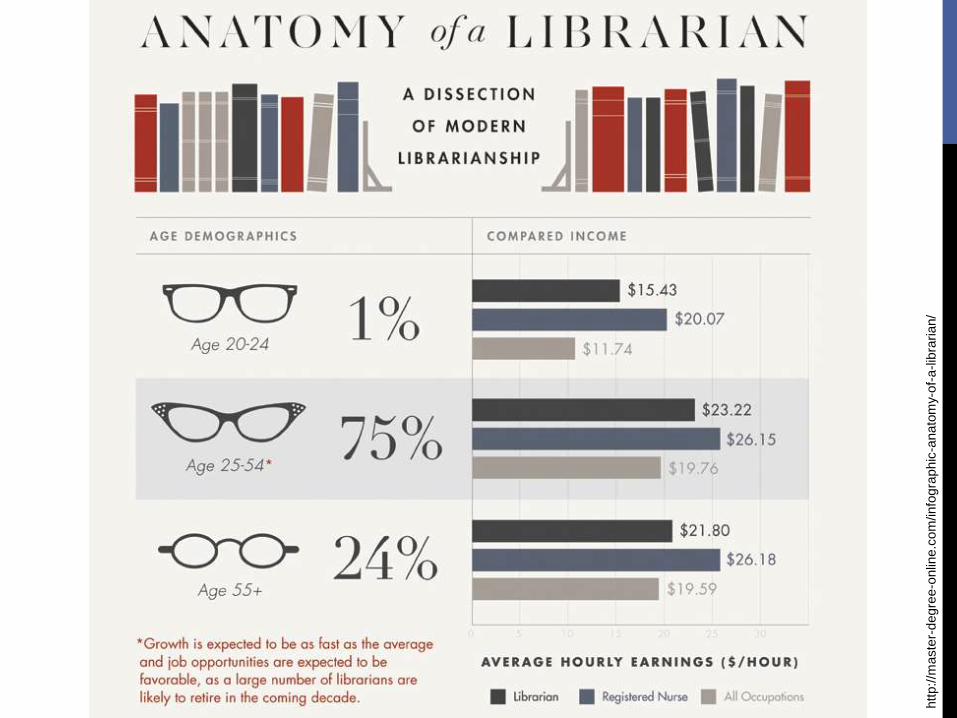
http://m
aste
r-degre
e-o
nlin
e.c
om
/info
gra
phic
-anato
my-o
f-a
-lib
rarian/
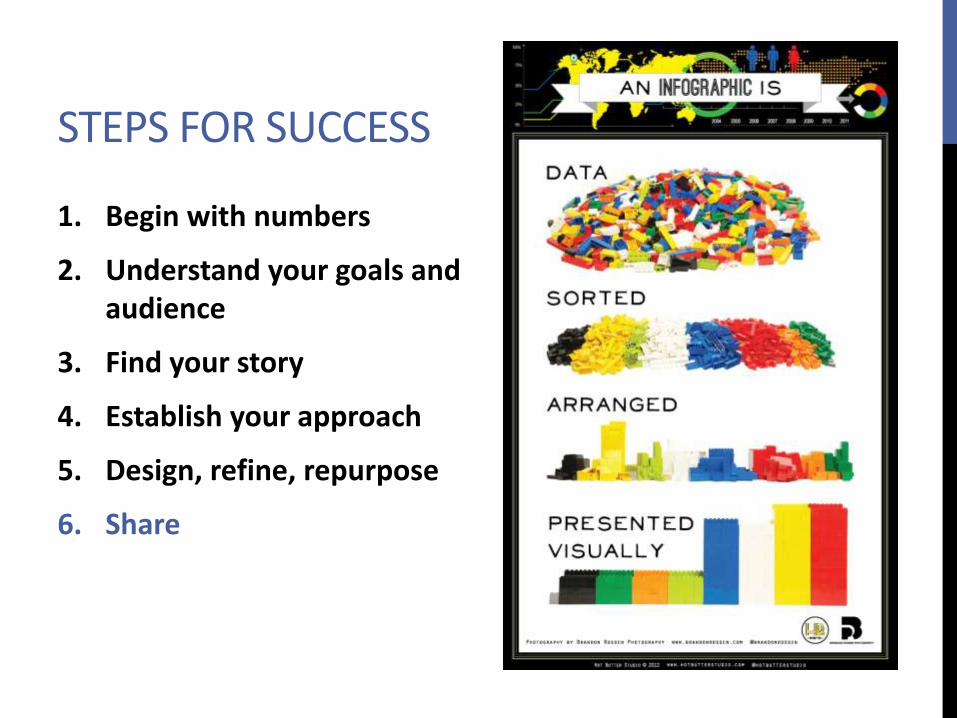
STEPS FOR SUCCESS
1. Begin with numbers
2. Understand your goals and audience
3. Find your story
4. Establish your approach
5. Design, refine, repurpose
6. Share
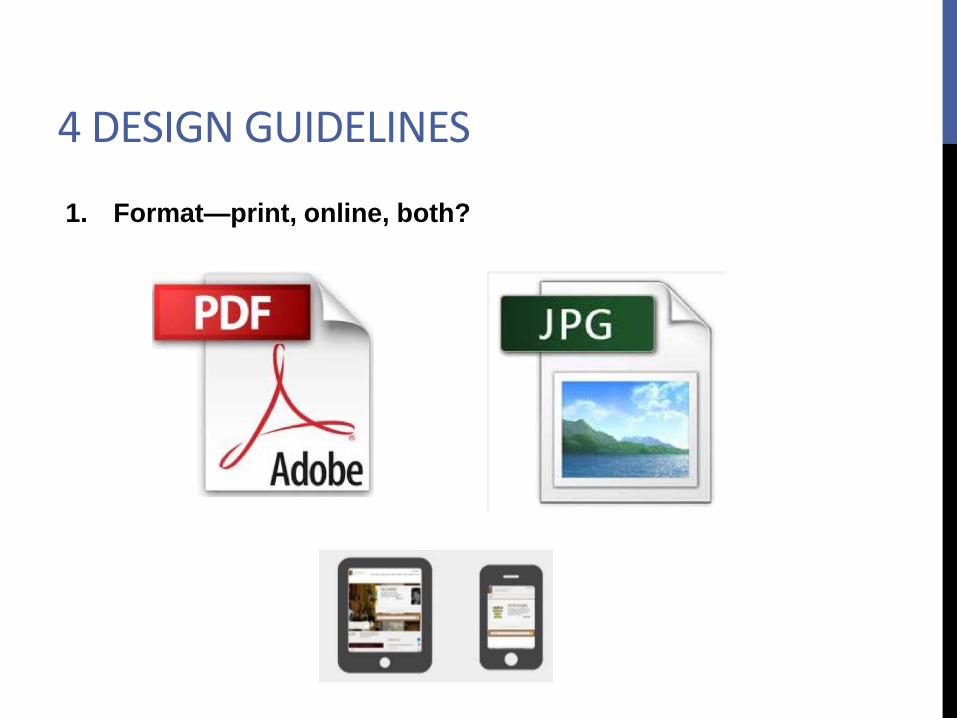
4 DESIGN GUIDELINES
1. Format—print, online, both?
4 DESIGN GUIDELINES
1. Format—print, online, both?
2. K.I.S.S.

4 DESIGN GUIDELINES
1. Format—print, online, both?
2. K.I.S.S.
3. Show rather than tell
4 DESIGN GUIDELINES
1. Format—print, online, both?
2. K.I.S.S.
3. Show rather than tell
4. Colors and fonts
STEPS FOR SUCCESS
1. Begin with numbers
2. Understand your goals and audience
3. Find your story
4. Establish your approach
5. Design, refine, repurpose
6. Share

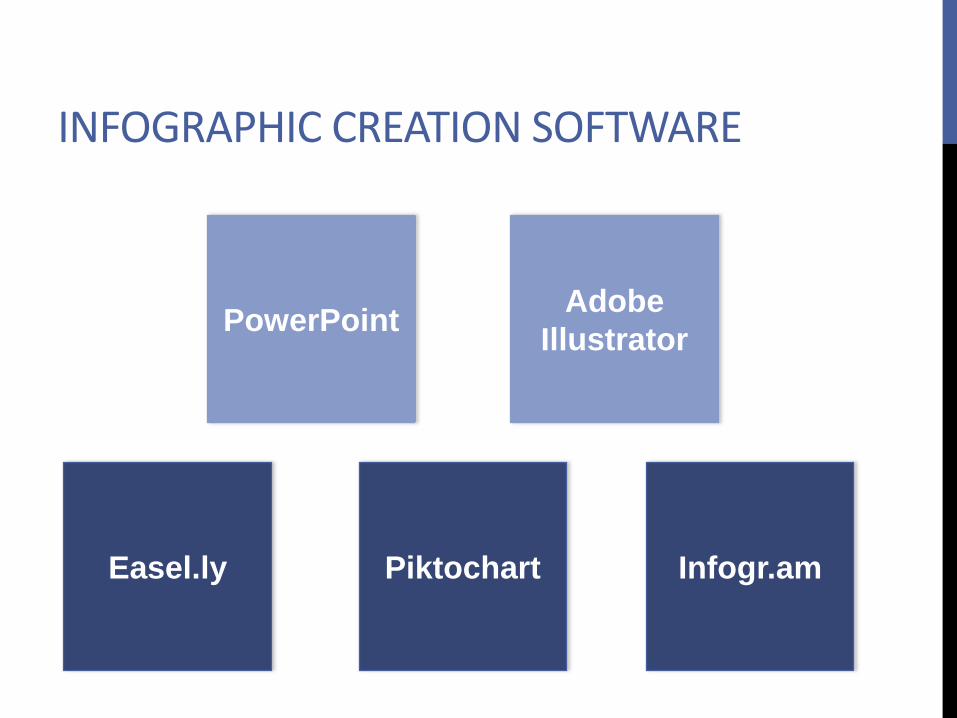
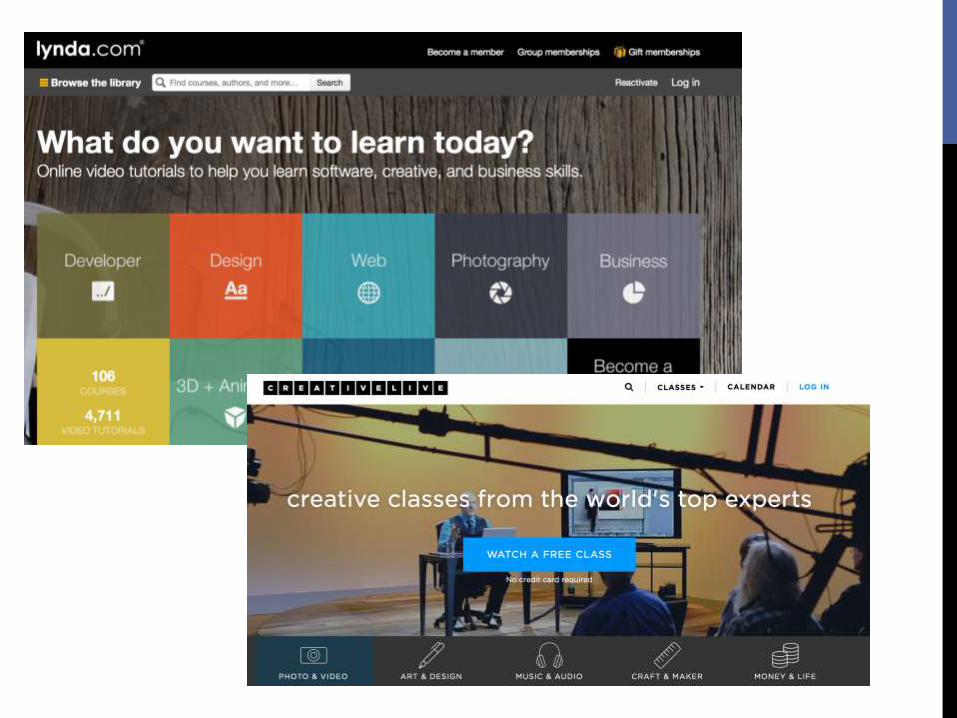
INFOGRAPHIC CREATION SOFTWARE
PowerPointAdobe
Illustrator
PiktochartEasel.ly Infogr.am
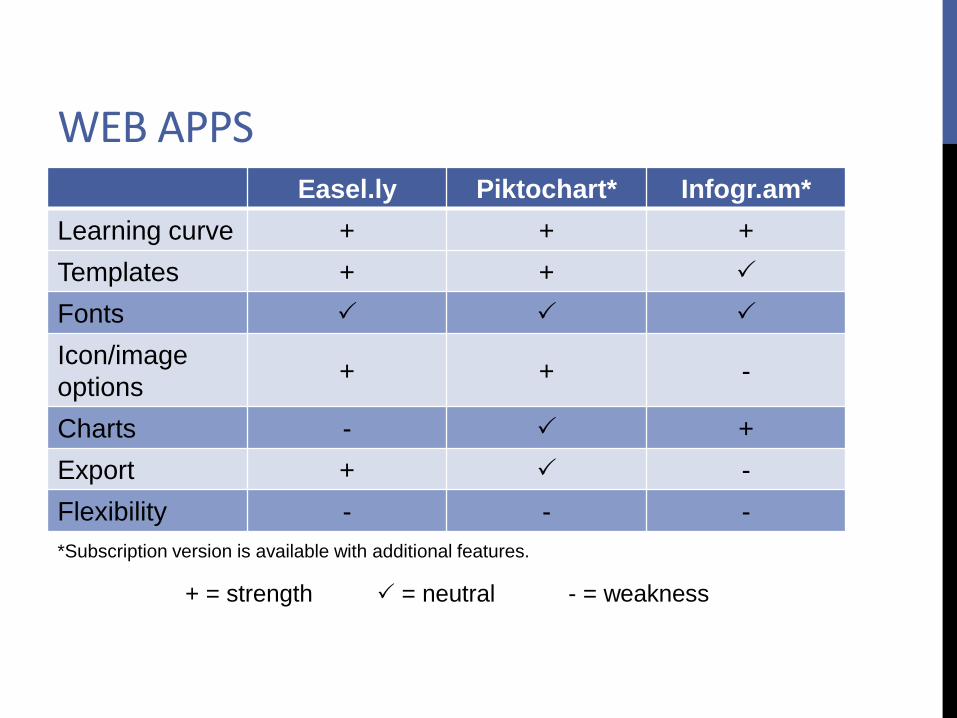
WEB APPSEasel.ly Piktochart* Infogr.am*
Learning curve + + +
Templates + +
Fonts
Icon/image
options+ + -
Charts - +
Export + -
Flexibility - - -
*Subscription version is available with additional features.
+ = strength = neutral - = weakness
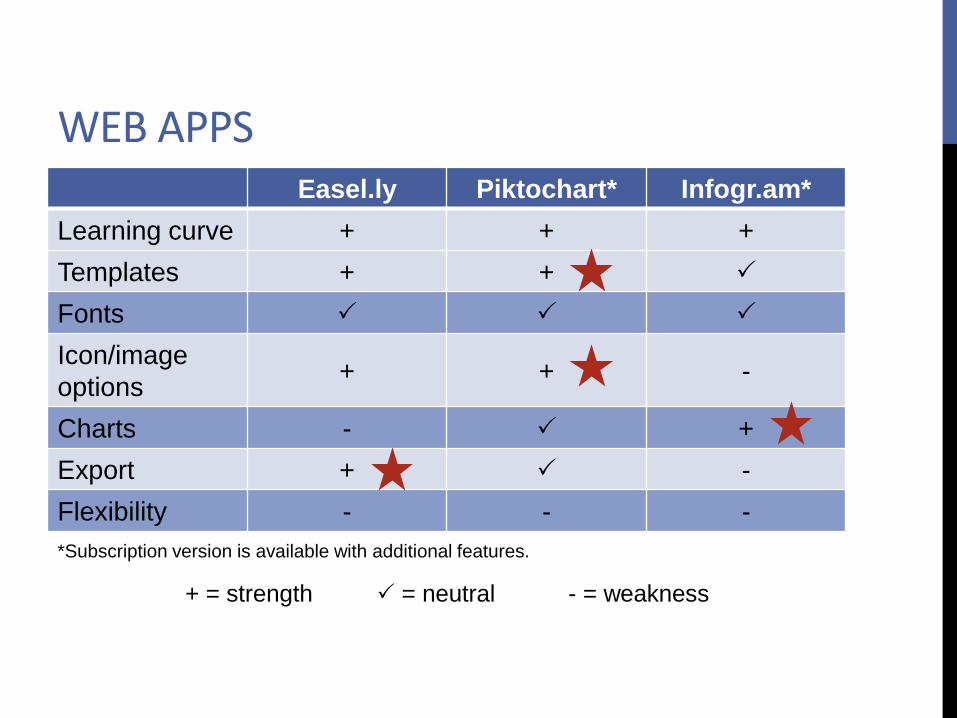
WEB APPSEasel.ly Piktochart* Infogr.am*
Learning curve + + +
Templates + +
Fonts
Icon/image
options+ + -
Charts - +
Export + -
Flexibility - - -
*Subscription version is available with additional features.
+ = strength = neutral - = weakness
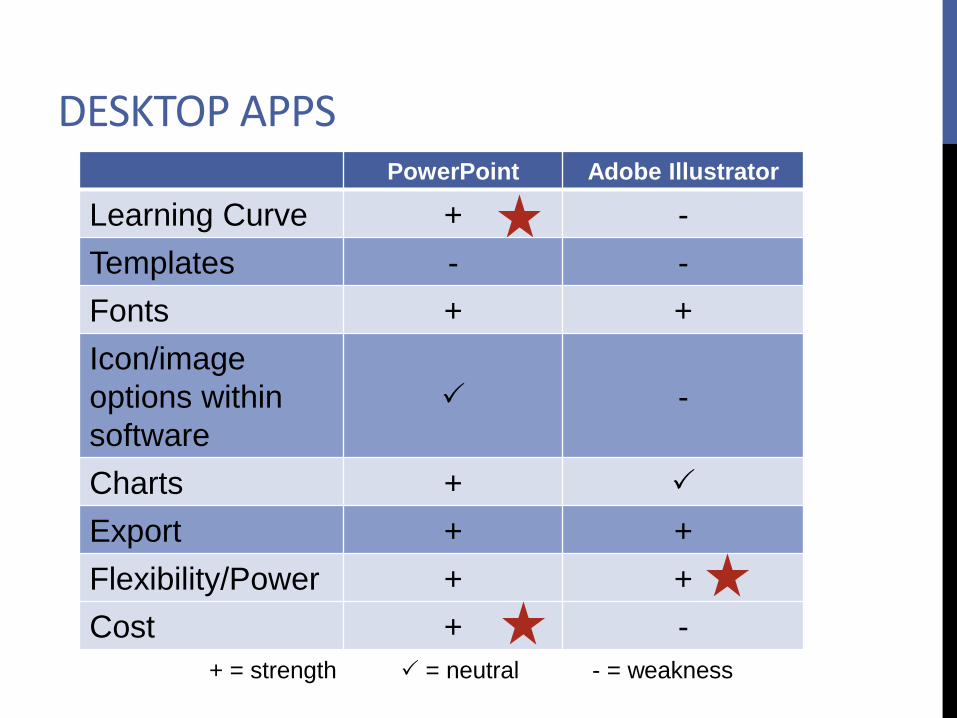
DESKTOP APPSPowerPoint Adobe Illustrator
Learning Curve + -
Templates - -
Fonts + +
Icon/image
options within
software
-
Charts +
Export + +
Flexibility/Power + +
Cost + -
+ = strength = neutral - = weakness
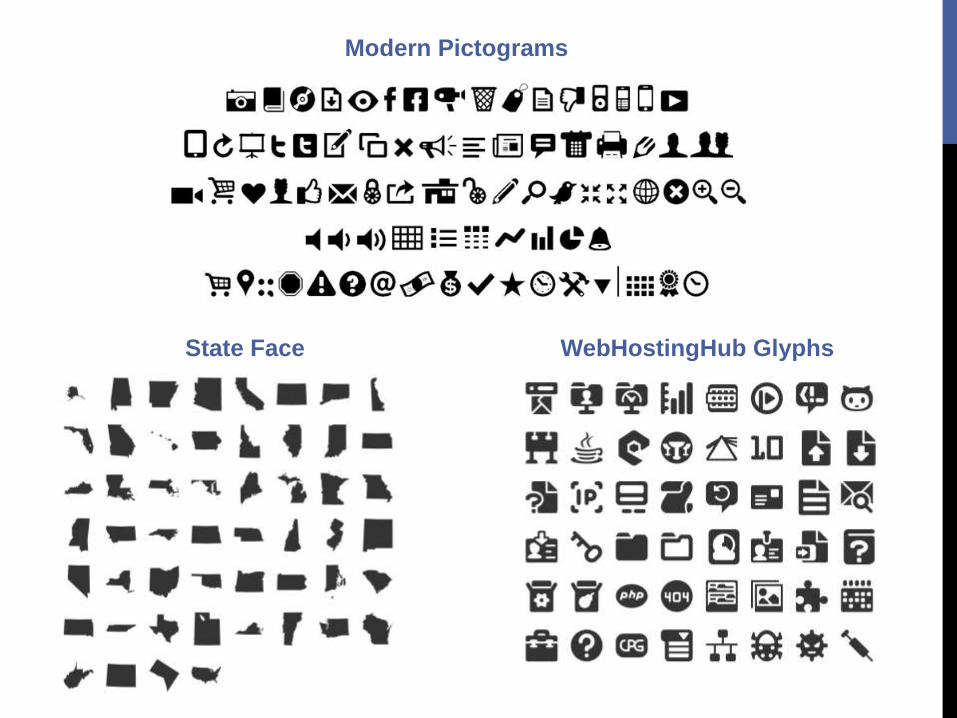
Modern Pictograms
State Face WebHostingHub Glyphs
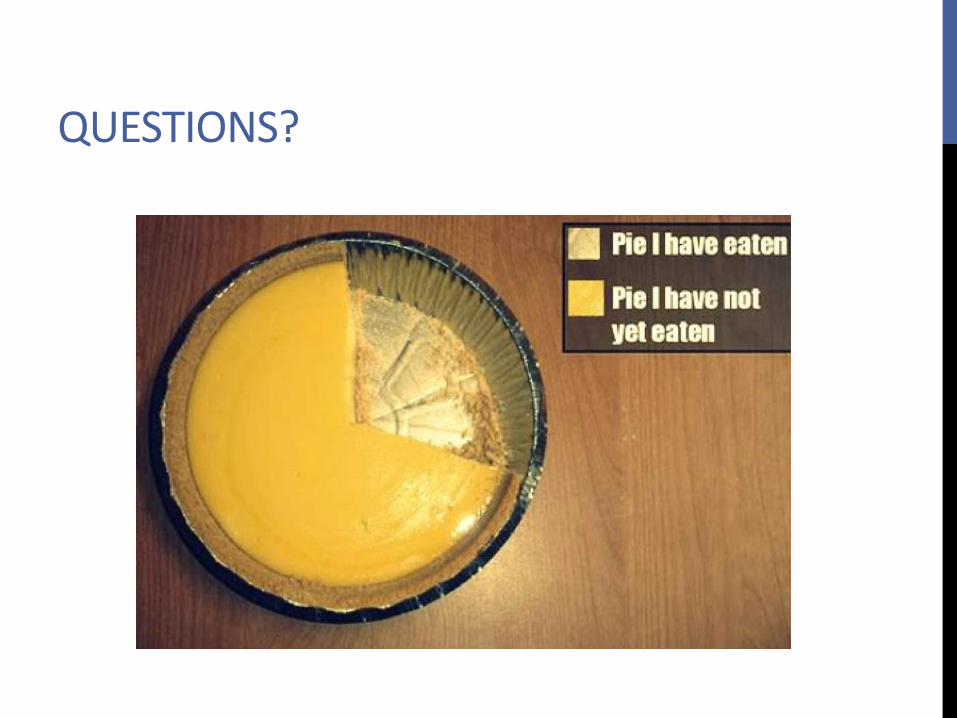
QUESTIONS?

http://RIPL.LRS.org/
#RIPLeffect
Enrollment opens January 5
PL-EVAL: PUBLIC LIBRARY RESEARCH & EVALUATION LISTSERV
Welcoming all those interested in public
library research and evaluation, PL-
EVAL is a connecting point to ask
questions, share ideas, and learn from
experiences across the field.
Sign up at http://bit.ly/pl_eval
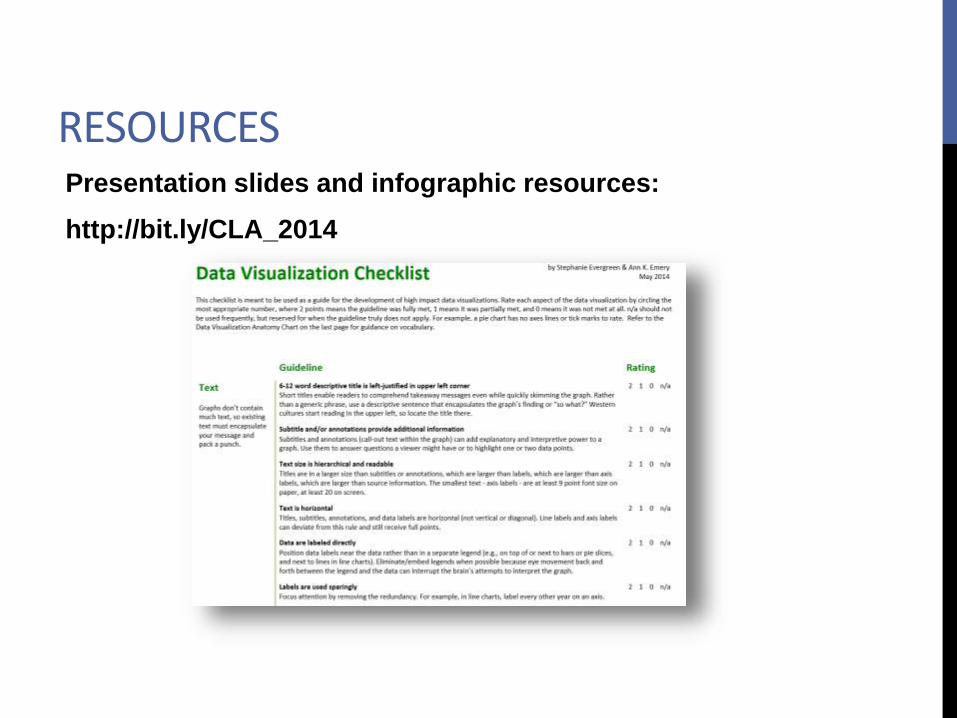
RESOURCESPresentation slides and infographic resources:
http://bit.ly/CLA_2014