
Telenor external presentation – First Quarter 2011 v17 · PDF fileSource: TRAI...
20
12/13/2012 1 Forward in India 14 December 2012 Disclaimer The following presentation is being made only to, and is only directed at, persons to whom such presentation may lawfully be communicated (’relevant persons’). Any person who is not a relevant person should not act or rely on this presentation or any of its contents. Information in the following presentation relating to the price at which relevant investments have been bought or sold in the past or the yield on such investments cannot be relied upon as a guide to the future performance of such investments. This presentation does not constitute an offering of securities or otherwise constitute an invitation or inducement to any person to underwrite, subscribe for or otherwise acquire securities in any company within the Telenor Group. The release, publication or distribution of this presentation in certain jurisdictions may be restricted by law, and therefore persons in such jurisdictions into which this presentation is released, published or distributed should inform themselves about, and observe, such restrictions. This presentation contains statements regarding the future in connection with the Telenor Group’s growth initiatives, profit figures, outlook, strategies and objectives. All statements regarding the future are subject to inherent risks and uncertainties, and many factors can lead to actual profits and developments deviating substantially from what has been expressed or implied in such statements.
-
Upload
trinhxuyen -
Category
Documents
-
view
215 -
download
1
Transcript of Telenor external presentation – First Quarter 2011 v17 · PDF fileSource: TRAI...

12/13/2012
1
Forward in India
14 December 2012
Disclaimer
The following presentation is being made only to, and is only directed at, persons to whom such presentation may lawfully be communicated (’relevant persons’). Any person who is not a relevant person should not act or rely on this presentation or any of its contents. Information in the following presentation relating to the price at which relevant investments have been bought or sold in the past or the yield on such investments cannot be relied upon as a guide to the future performance of such investments. This presentation does not constitute an offering of securities or otherwise constitute an invitation or inducement to any person to underwrite, subscribe for or otherwise acquire securities in any company within the Telenor Group. The release, publication or distribution of this presentation in certain jurisdictions may be restricted by law, and therefore persons in such jurisdictions into which this presentation is released, published or distributed should inform themselves about, and observe, such restrictions. This presentation contains statements regarding the future in connection with the Telenor Group’s growth initiatives, profit figures, outlook, strategies and objectives. All statements regarding the future are subject to inherent risks and uncertainties, and many factors can lead to actual profits and developments deviating substantially from what has been expressed or implied in such statements.

12/13/2012
2
Forward in India
Jon Fredrik Baksaas, CEO of Telenor Group
• Business update
• The Indian wireless market
• Ambition and strategy
• Business plan and targets
• Summary
Content

12/13/2012
3
Telenor Group perspective on India
• Value creation built on growth profile
• Size and governance to manage new markets
• Operational excellence
• Learnings across the Group
Rational approach to a challenging situation
• Supreme Court ruling in February to quash licences awarded in 2008
• Uncertainty regarding conditions and timeline for licence quashing and re-auctioning of spectrum
• Legal disputes with Unitech Ltd
• Scale-down from 13 to 9 circles in July
• Establishing a new platform for continued operations

12/13/2012
4
Secured spectrum in six best-performing circles
• Acquired spectrum in six circles
– Total population of 600 million
– Real penetration of 40%
• Value driven and circle-by-circle approach in auction
• 5 MHz spectrum in 1800 MHz band, valid for 20 years
• Winning bid INR 40 bn (NOK 4.2 bn)
From 13 to 6 circles in India
Maharashtra
Gujarat
Maharashtra
Andhra Pradesh
UP West
UP East
Bihar
Population (m)
62
96
86
90
123
139
Operating cash flow (INR billion) Revenues (INR billion)
Declining operating losses
Q211 Q311 Q411 Q112 Q212 Q312
Other
6 circles8.1
9.5 8.8
8.1
6.9
5.7
Q211 Q311 Q411 Q112 Q212 Q312
Other
6 circles-9.5
-8.7
-7.7
-6.6
-5.4
-4.1
6 circles
Other circles
6 circles
Other circles
INR/NOK = 0.104 as of 10 December 2012 Operating cash flow defined as EBITDA before other items – capex.
12/13/2012
5
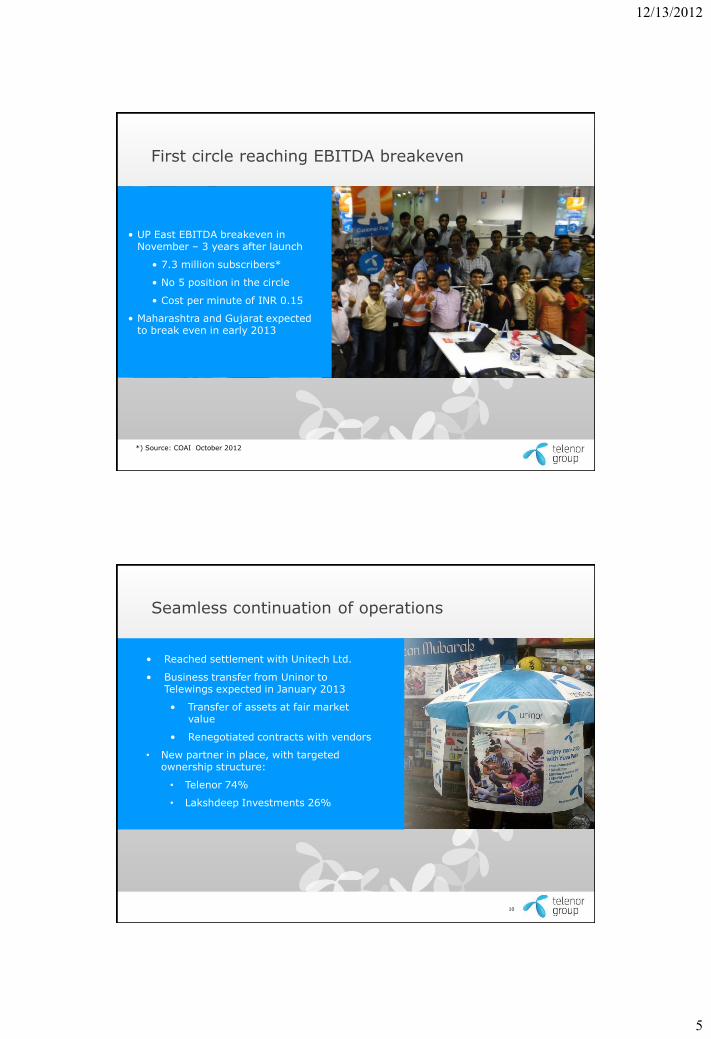
• UP East EBITDA breakeven in November – 3 years after launch
• 7.3 million subscribers*
• No 5 position in the circle
• Cost per minute of INR 0.15
• Maharashtra and Gujarat expected to break even in early 2013
*) Source: COAI October 2012
First circle reaching EBITDA breakeven
10
Seamless continuation of operations
• Reached settlement with Unitech Ltd.
• Business transfer from Uninor to Telewings expected in January 2013
• Transfer of assets at fair market value
• Renegotiated contracts with vendors
• New partner in place, with targeted ownership structure:
• Telenor 74%
• Lakshdeep Investments 26%

12/13/2012
6
Forward in India
Sigve Brekke, Managing Director Uninor
• Business update
• The Indian wireless market
• Ambition and strategy
• Business plan and targets
• Summary
Content

12/13/2012
7
Gross revenues (INR bn) Subscribers (million)
The Indian wireless market continues to grow
• Several clean-ups in customer bases impacting growth in 2H 2012
• Telecom spending 2.6% of GDP (vs. 4.1% developing Asia average)
272 302 322 368 397
754 815
853
959 1026
2008 2009 2010 2011 LTM
6 circles Pan-India
133
206
304
370 376 341
521
747
894 907
2008 2009 2010 2011 Q312
6 circles Pan-India
+8%
+10%
CAGR 2008-2012
Source: TRAI (subscribers and revenue), WCIS/EIU (telecom spending and GDP). LTM = Last twelve months Q411-Q312
Large untapped growth potential on voice services
• 40% real penetration in our 6 circles
• Data services have not taken off yet
• Still significant room for growth in basic voice services

12/13/2012
8
Market concentration lower than in other markets
Source: Local regulators and company estimates
“Top 3” revenue market share – 6 circles
69%
66%
75%
71%
68%
68%
Andhra Pradesh
Bihar
Maharashtra
Gujarat
UP West
UP East
“Top 3” revenue market share - Asia
70%
81%
92%
99%
99%
India
Pakistan
Bangladesh
Thailand
Malaysia
Revenue market share & rank* Subscriber market share & rank*
2.9 %
4.0 %
4.6 %
4.7 %
5.6 %
7.0 %
Andhra Pradesh
Bihar
Maharashtra
Gujarat
UP West
UP East
5.9 %
8.1 %
7.9 %
7.7 %
9.5 %
10.1 %
Andhra Pradesh
Bihar
Maharashtra
Gujarat
UP West
UP East
Cluster approach providing results at circle level
5
6
7
6
7
7
6
7
6
7
7
8
*) Source: TRAI Quarterly report September 2012 Revenue market share based on gross revenue
40-45% population coverage in these circles Target above 20% subscriber market share in clusters where present

12/13/2012
9
The path to consolidation has started
• Recent spectrum auction resulted in fewer players
• Operators scaling down in underperforming circles
• M&A Regulations not defined, future spectrum outlays hampering M&A
• Long term: 4-5 players in each circle
• Pragmatic and value-driven approach to future consolidation
Regulatory framework becoming clearer, with some uncertainties remaining
• Auction of unsold spectrum, refarming and spectrum payment for incumbents
• Mobile termination rates
• TRAI recommendation to cut MTR from INR 0.20 to INR 0.10
• MVNO and spectrum sharing
• M&A regulation not defined

12/13/2012
10
• Business update
• The Indian wireless market
• Ambition and strategy
• Business plan and targets
• Summary
Content
Our ambition
Create value by taking
a credible mass-market position

12/13/2012
11
Our strategy
• Best in servicing basics
• Best in mass market distribution
• Best in low cost operations
Position brand as best price on local voice
• “Sabse Sasta” - most affordable
• Build on-net communities
• Become preferred second SIM in cluster
• Network capacity-based pricing
• Focus on recharge

12/13/2012
12
Reduce rotational churn and build customer loyalty
ARPU 150-300
ARPU 50 -150
ARPU < 50 Rotational churners
Prospects
Loyals (1st or 2nd SIM)
Execution Monitoring
• KPIs up-to smallest units • Execute immediately on
micro level
• Traffic • Distribution • Customer behaviour
Location Business Intelligence leads to action at micro level

12/13/2012
13
Churn development* ARPU development (INR)*
ARPU discount towards market to narrow
*) 6 circles, on comparable basis
• Very local traffic patterns – 80% of traffic stays within the local area
• ARPU 30 – 40% below market, with potential for narrowing the gap
13%
15%
11%
9% 9% 9%
Sep'10 Sep'11 Sep'12
87 93
88
Q310 Q311 Q312
Prepaid market average
Excellence in mass market distribution
• 350,000 outlets
• 8 million customer interactions every day
System
DMS
Transformation

12/13/2012
14
Cluster profitability (illustrative)*
Cluster approach
• Very local traffic patterns –80% of traffic stays within the local area
• Build positions in identified intra-circle clusters
• Network coverage and capacity
• Excellence in distribution
• Affordable prices (on-net focus)
• Profitability followed up and measured at cluster (and site) level
Dec 2011
July 2012
Oct 2012
*) Cluster profitability measured on contribution, i.e. revenues minus direct costs
Network efficiency (Example UP East) Erlang/Site/MHz vs Indian peers
0 2 4 6 8 10 12
Best-in-class on spectrum efficiency
• No new capacity sites in 2011-2012
Feb'12 Jul'12 Nov'12
Network utilisation
78 % 83 % 87 %
Erlang/TRX 5.2 5.6 6.0
Erlang/Site/MHz 10.5 12.4 13.6

12/13/2012
15
Extreme outsourcing enables cost efficient operations from smaller scale
Opex split (2012)
Personnel
Marketing
and Sales
Other
Network
Business Strategy
Regulatory Plan Deploy Operating
Centre Field
Operations
Application & Service
development Billing
Customer Care
Sales, Marketing
Traditional
In house Outsourced Partially outsourced
• No legacy and established outsourcing business model give late entrant advantage
– Creating scale from a small base
Cost per minute already below incumbents
24
15
-
10
20
30
40
50
60
70
80
Jan
Feb
Marc
h
Apri
l
May
June
July
Aug
Sep
Oct
Nov
Dec
Jan
Feb
Marc
h
Apri
l
May
June
July
Aug
Sep
Oct
2011 2012
Uninor UP East cost per minute Q312
Incumbent
~29 paise ~24 paise
>150m subs ~41m subs
Source: TRAI and company reportings

12/13/2012
16
• Business update
• The Indian wireless market
• Ambition and strategy
• Business plan and targets
• Summary
Content
Targeted return on business plan
• Return on equity on new money above 25%
• High regulatory and legal risk
• Increase non-recourse debt over time to reduce equity exposure
Capital employed Capital employed
Equity
Debt

12/13/2012
17
Operating cash flow (INR billion)
2013 focus: Operating cash flow breakeven by end of year
• INR 155 bn peak funding maintained
• Moderate funding need until breakeven
• INR 13 bn upfront part of licence fee to be offset by
‒ 2008 licence fee of INR 16.6 bn
‒ Tax effect of loss recognition
-35
-44
-36
-17
2009 2010 2011 9M 2012
INR/NOK = 0.104 as of 10 December 2012
Monthly churn (%)
Subscribers (mill)*
Mid term ambitions
• Continue subscriber growth to build scale and market position
• No 2-3 market position in clusters where present
• Reduce rotational churn and increase customer loyalty
• Best in low cost operations
• Consolidation and more rational pricing behaviour to add further value
34
23
55
2012 2016
12
8
2012 2016
*) 30 days definition, 2012 figure as of Q3
UP East Q3 2012: 8%

12/13/2012
18
Number of sites (‘1000) *
35
Low capex requirement going forward
• Capex-light operating model from 100% tower sharing - no own towers
• Capex primarily related to radio network equipment
• Re-allocation of equipment from scaled-down circles
• Long term capex/sales around 5%
17
26
2012 2016
*) 6 circles
• Business update
• The Indian wireless market
• Ambition and strategy
• Business plan and targets
• Summary
Content

12/13/2012
19
Ready to move forward in India
• Operational focus – execution of strategy
• Bring company to operating cash flow breakeven by end of 2013
• Value creation potential beyond 2013
Forward in India
14 December 2012

12/13/2012
20
Circle characteristics
Circle category
Population (million)
GDP per capita (INR)
Mobile SIM penetration
SIM mkt share Top 3
UP East B 123 39,300 60% 50%
UP West B 90 42,200 57% 51%
Gujarat A 62 112,300 86% 60%
Maharashtra A 96 129,600 72% 57%
Bihar C 139 29,400 44% 49%
Andhra Pradesh
A 86 85,100 79% 53%
Source: TRAI


![GHM Q411 Teleconf Slides - FINAL2.pptx [Read-Only] Relations... · 2014-09-21 · SAFE HARBOR STATEMENT This presentation contains forward-looking statements within the meaning of](https://static.fdocuments.us/doc/165x107/5f5dfe531e1a563a8d0f9eab/ghm-q411-teleconf-slides-read-only-relations-2014-09-21-safe-harbor-statement.jpg)