TELEMETRY NETWORK SYSTEM (TMNS) LINK...
10
Telemetry Network System (TMNS) Link Management Algorithm Verification Item Type text; Proceedings Authors O'Connell, Ray Publisher International Foundation for Telemetering Journal International Telemetering Conference Proceedings Rights Copyright © held by the author; distribution rights International Foundation for Telemetering Download date 17/05/2018 08:30:16 Link to Item http://hdl.handle.net/10150/579656
Transcript of TELEMETRY NETWORK SYSTEM (TMNS) LINK...
Telemetry Network System (TMNS) LinkManagement Algorithm Verification
Item Type text; Proceedings
Authors O'Connell, Ray
Publisher International Foundation for Telemetering
Journal International Telemetering Conference Proceedings
Rights Copyright © held by the author; distribution rights InternationalFoundation for Telemetering
Download date 17/05/2018 08:30:16
Link to Item http://hdl.handle.net/10150/579656
1
TELEMETRY NETWORK SYSTEM (TMNS)
LINK MANAGEMENT ALGORITHM VERIFICATION
Ray O’Connell
RoboComAI LLC
Cincinnati, Ohio USA
ABSTRACT
Telemetry Network System (TmNS) contains a centralized link manager which allows efficient
use of the frequency spectrum by dynamically allocating capacity to transmit based on need and
priority. To verify the accurate operation of the telemetry system link management algorithm
prior to system demonstration, a combination of novel techniques were leveraged in the areas of
modeling and simulation, and test bed verification. This paper will cover the process of
verifying the link management algorithm from the use of the OPNET iNET simulation to test
bed radio simulators along with the developed test bed tools used to capture the results.
KEYWORDS
Link Management, TDMA, TmNS, iNET, QoS
I. INTRODUCTION
This paper brief covers the design tools used in the development of Link Manager (LM)
Component of the iNET Telemetry Network System (TmNS) which is funded by the Central
T&E Investment Program (CTEIP). The LM plays a key role in the assignment of capacity to
networked telemetry radios sharing the same allocated frequency. During the development of
the Link Manager, two visualization methods were developed to support the development, use,
monitoring, testing, and maintenance of the application. The unique visualization methods that
were developed to verify the operation of the LM are the focus of this paper.
II. INET LINK MANAGER OPERATION OVERVIEW
The RF Link Management system optimizes the use of frequency allocations on the test range
through the use of a centralized link manager. Each allocated frequency is managed by a TDMA
channel access scheme which divides the time into epochs, where one or more transmit
opportunities (TxOPs) are allocated to each link. The TxOP messages are sent from the Link
Manager on the ground network to ground radios and to the test article radios through uplinks
from ground radios.
2
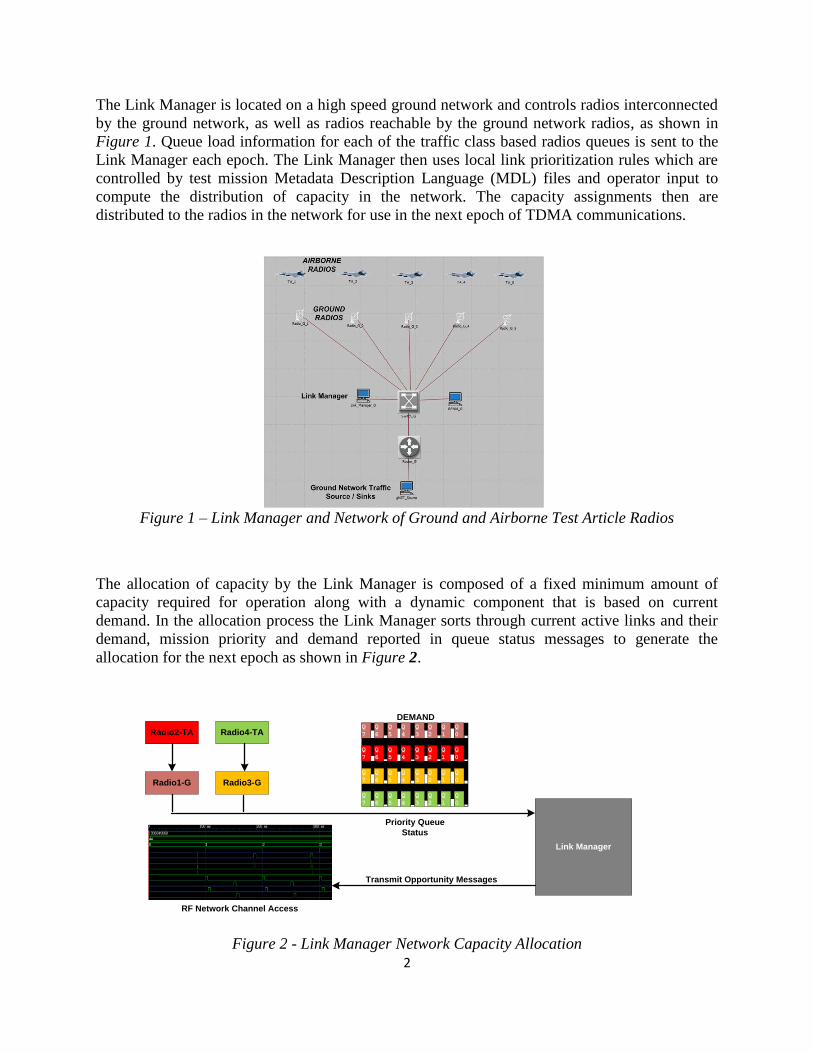
The Link Manager is located on a high speed ground network and controls radios interconnected
by the ground network, as well as radios reachable by the ground network radios, as shown in
Figure 1. Queue load information for each of the traffic class based radios queues is sent to the
Link Manager each epoch. The Link Manager then uses local link prioritization rules which are
controlled by test mission Metadata Description Language (MDL) files and operator input to
compute the distribution of capacity in the network. The capacity assignments then are
distributed to the radios in the network for use in the next epoch of TDMA communications.
Figure 1 – Link Manager and Network of Ground and Airborne Test Article Radios
The allocation of capacity by the Link Manager is composed of a fixed minimum amount of
capacity required for operation along with a dynamic component that is based on current
demand. In the allocation process the Link Manager sorts through current active links and their
demand, mission priority and demand reported in queue status messages to generate the
allocation for the next epoch as shown in Figure 2.
Q
7
Q
6
Q
5
Q
4
Q
3
Q
2
Q
1
Q
0
Q
7
Q
6
Q
5
Q
4
Q
3
Q
2
Q
1
Q
0
Q
7
Q
6
Q
5
Q
4
Q
3
Q
2
Q
1
Q
0
Q
7
Q
6
Q
5
Q
4
Q
3
Q
2
Q
1
Q
0
DEMAND
Radio1-G
Radio2-TA
Radio3-G
Radio4-TA
Link Manager
Transmit Opportunity Messages
Priority Queue
Status
RF Network Channel Access
Figure 2 - Link Manager Network Capacity Allocation
3
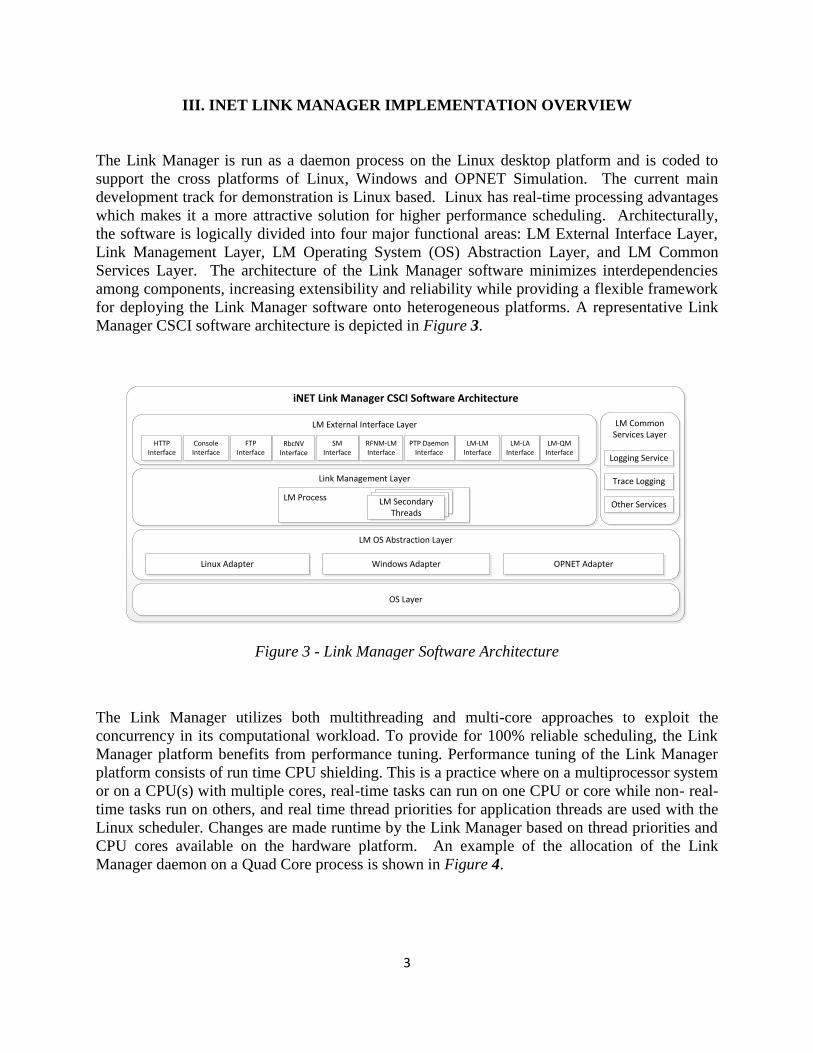
III. INET LINK MANAGER IMPLEMENTATION OVERVIEW
The Link Manager is run as a daemon process on the Linux desktop platform and is coded to
support the cross platforms of Linux, Windows and OPNET Simulation. The current main
development track for demonstration is Linux based. Linux has real-time processing advantages
which makes it a more attractive solution for higher performance scheduling. Architecturally,
the software is logically divided into four major functional areas: LM External Interface Layer,
Link Management Layer, LM Operating System (OS) Abstraction Layer, and LM Common
Services Layer. The architecture of the Link Manager software minimizes interdependencies
among components, increasing extensibility and reliability while providing a flexible framework
for deploying the Link Manager software onto heterogeneous platforms. A representative Link
Manager CSCI software architecture is depicted in Figure 3.
iNET Link Manager CSCI Software Architecture
LM External Interface Layer
Link Management Layer
LM OS Abstraction Layer
OS Layer
LM Common Services Layer
Linux Adapter Windows Adapter OPNET Adapter
Console Interface
LM-LM Interface
SM Interface
Logging Service
LM ProcessOther Services
RFNM-LMInterface
PTP Daemon Interface
LM-LA Interface
LM-QM Interface
HTTPInterface
FTPInterface
LM Secondary Threads
Trace Logging
RbcNVInterface
Figure 3 - Link Manager Software Architecture
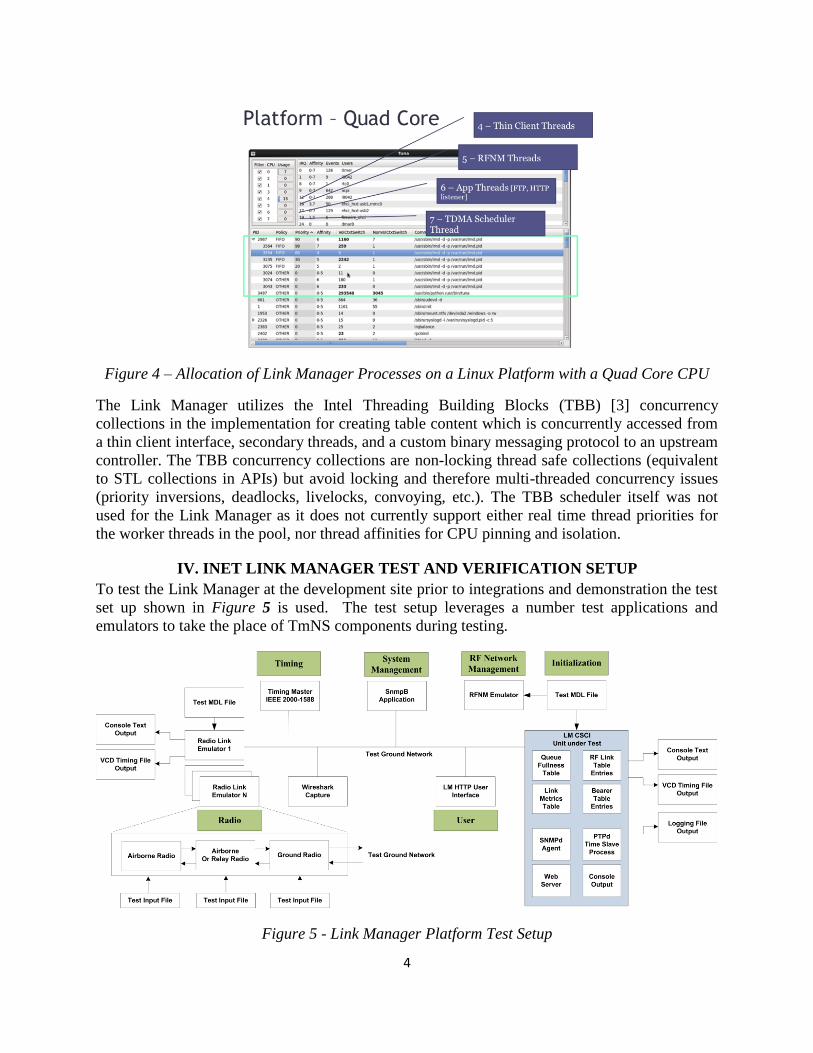
The Link Manager utilizes both multithreading and multi-core approaches to exploit the
concurrency in its computational workload. To provide for 100% reliable scheduling, the Link
Manager platform benefits from performance tuning. Performance tuning of the Link Manager
platform consists of run time CPU shielding. This is a practice where on a multiprocessor system
or on a CPU(s) with multiple cores, real-time tasks can run on one CPU or core while non- real-
time tasks run on others, and real time thread priorities for application threads are used with the
Linux scheduler. Changes are made runtime by the Link Manager based on thread priorities and
CPU cores available on the hardware platform. An example of the allocation of the Link
Manager daemon on a Quad Core process is shown in Figure 4.
4
Figure 4 – Allocation of Link Manager Processes on a Linux Platform with a Quad Core CPU
The Link Manager utilizes the Intel Threading Building Blocks (TBB) [3] concurrency
collections in the implementation for creating table content which is concurrently accessed from
a thin client interface, secondary threads, and a custom binary messaging protocol to an upstream
controller. The TBB concurrency collections are non-locking thread safe collections (equivalent
to STL collections in APIs) but avoid locking and therefore multi-threaded concurrency issues
(priority inversions, deadlocks, livelocks, convoying, etc.). The TBB scheduler itself was not
used for the Link Manager as it does not currently support either real time thread priorities for
the worker threads in the pool, nor thread affinities for CPU pinning and isolation.
IV. INET LINK MANAGER TEST AND VERIFICATION SETUP
To test the Link Manager at the development site prior to integrations and demonstration the test
set up shown in Figure 5 is used. The test setup leverages a number test applications and
emulators to take the place of TmNS components during testing.
Figure 5 - Link Manager Platform Test Setup
5
The platform test setup shown in Figure 5 is composed of the following key components:
Timing
o External Timing Master running as a PTP Master on the ground network. This sets the
timing for the radio simulators and LM
System Management
o Control of LM system state and verification of status values with SnmpB Application
RF Network Management
o Application to exercise of the LM external network management interface using RANs
format and SNMP control/status messages
Initialization
o MDL Test Document which is read in automatically and under user control to set the test
configuration. The MDL file can be loaded in using the thin client web based interface
User
o The User interface is a thin client application which can be run on the LM computer
directly or remotely through a network connection.
Radio
o The radio simulators are applications developed to exercise the LM-to-radio interface. It
exchanges time sensitive LM formatted messages with the LM
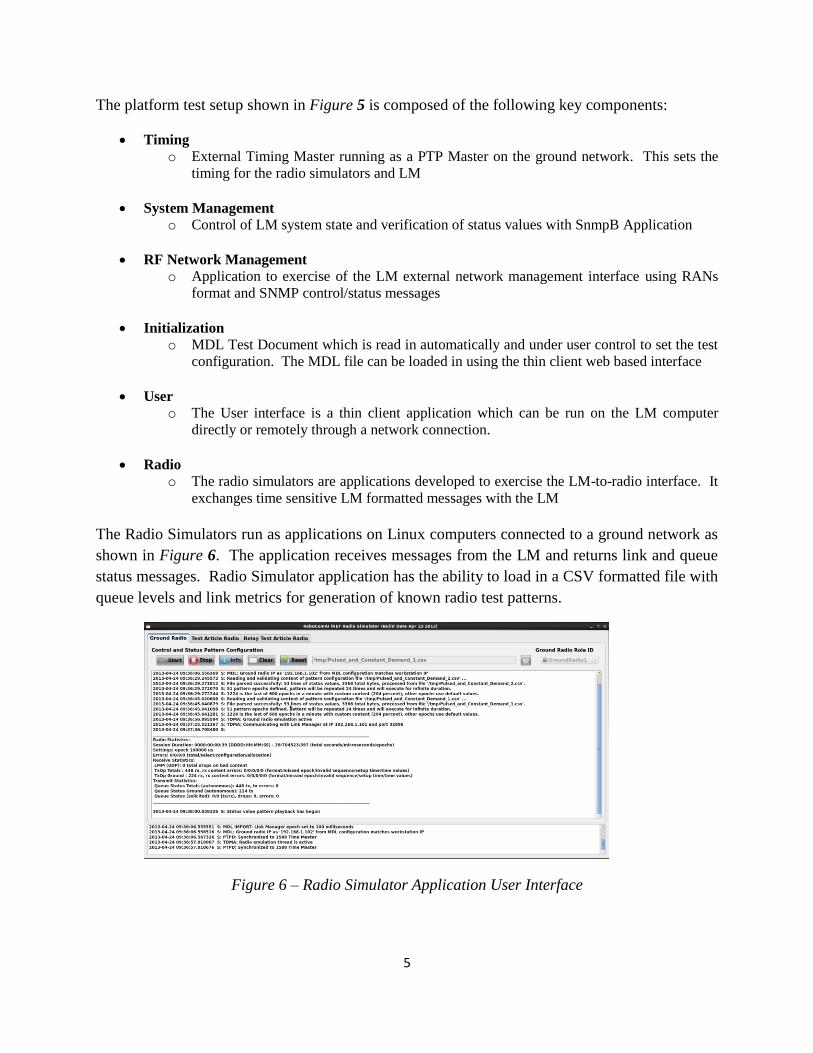
The Radio Simulators run as applications on Linux computers connected to a ground network as
shown in Figure 6. The application receives messages from the LM and returns link and queue
status messages. Radio Simulator application has the ability to load in a CSV formatted file with
queue levels and link metrics for generation of known radio test patterns.
Figure 6 – Radio Simulator Application User Interface
6
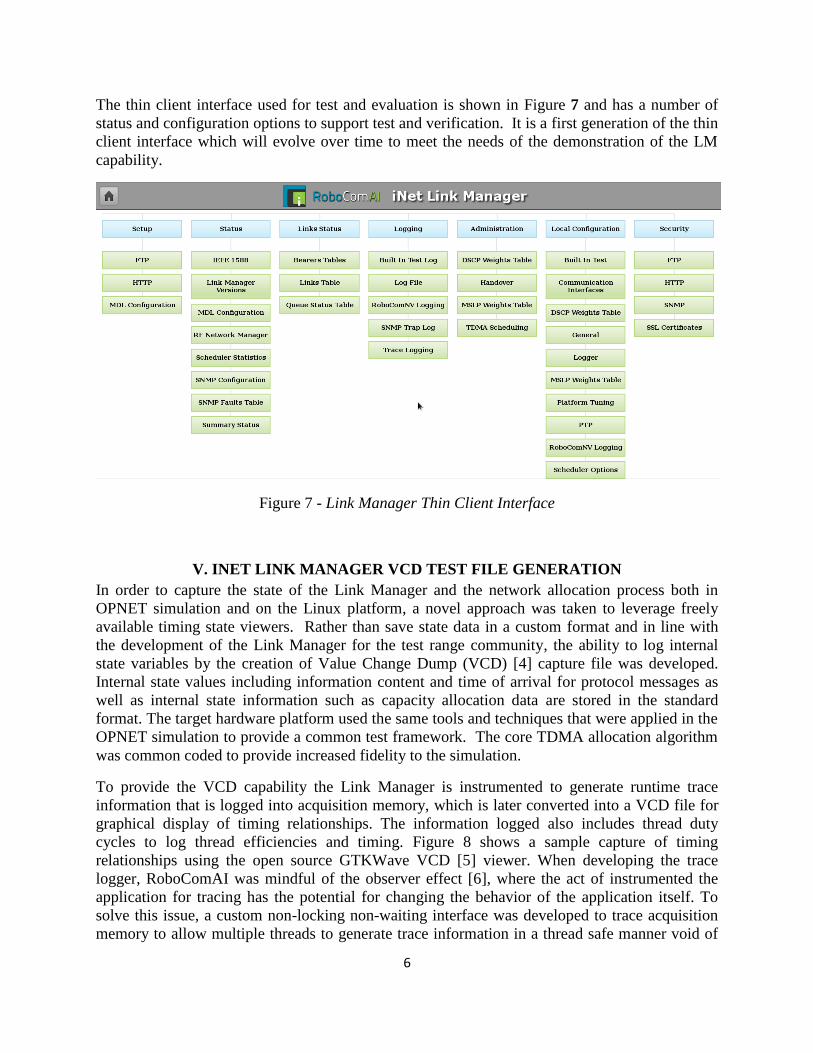
The thin client interface used for test and evaluation is shown in Figure 7 and has a number of
status and configuration options to support test and verification. It is a first generation of the thin
client interface which will evolve over time to meet the needs of the demonstration of the LM
capability.
Figure 7 - Link Manager Thin Client Interface
V. INET LINK MANAGER VCD TEST FILE GENERATION
In order to capture the state of the Link Manager and the network allocation process both in
OPNET simulation and on the Linux platform, a novel approach was taken to leverage freely
available timing state viewers. Rather than save state data in a custom format and in line with
the development of the Link Manager for the test range community, the ability to log internal
state variables by the creation of Value Change Dump (VCD) [4] capture file was developed.
Internal state values including information content and time of arrival for protocol messages as
well as internal state information such as capacity allocation data are stored in the standard
format. The target hardware platform used the same tools and techniques that were applied in the
OPNET simulation to provide a common test framework. The core TDMA allocation algorithm
was common coded to provide increased fidelity to the simulation.
To provide the VCD capability the Link Manager is instrumented to generate runtime trace
information that is logged into acquisition memory, which is later converted into a VCD file for
graphical display of timing relationships. The information logged also includes thread duty
cycles to log thread efficiencies and timing. Figure 8 shows a sample capture of timing
relationships using the open source GTKWave VCD [5] viewer. When developing the trace
logger, RoboComAI was mindful of the observer effect [6], where the act of instrumented the
application for tracing has the potential for changing the behavior of the application itself. To
solve this issue, a custom non-locking non-waiting interface was developed to trace acquisition
memory to allow multiple threads to generate trace information in a thread safe manner void of

7
potential concurrency issues. This technology can be used with any application which requires
insight into thread timing and signal relationships.
Figure 8 - Link Manager VCD Output File Displayed in GTKWave Viewer
Waveform viewers are used in conjunction with the simulation of a digital or analog hardware
operation or integrated circuit design. The waveform viewers can support the use one of many
different file formats. The VCD format was selected for this application since it was the most
common among viewers and was supported by freeware viewers. Of the viewers that we used,
the GTKWave viewing tool proved to be reliable and most often used for analysis of the OPNET
simulation parameter output files. In order to isolate the time sensitive components of the Link
Manager code from the VCD state output process, an intermediate VCD Memory Store was used
to save state information until saved to a file as shown in Figure 9. For the OPNET simulation
the same base code used to capture VCD output during a simulation.
Figure 9 – Platform State Variable Capture to VCD File
8
VI. SIMULATION AND PLATFORM NETWORK VISUALIZATION TOOL
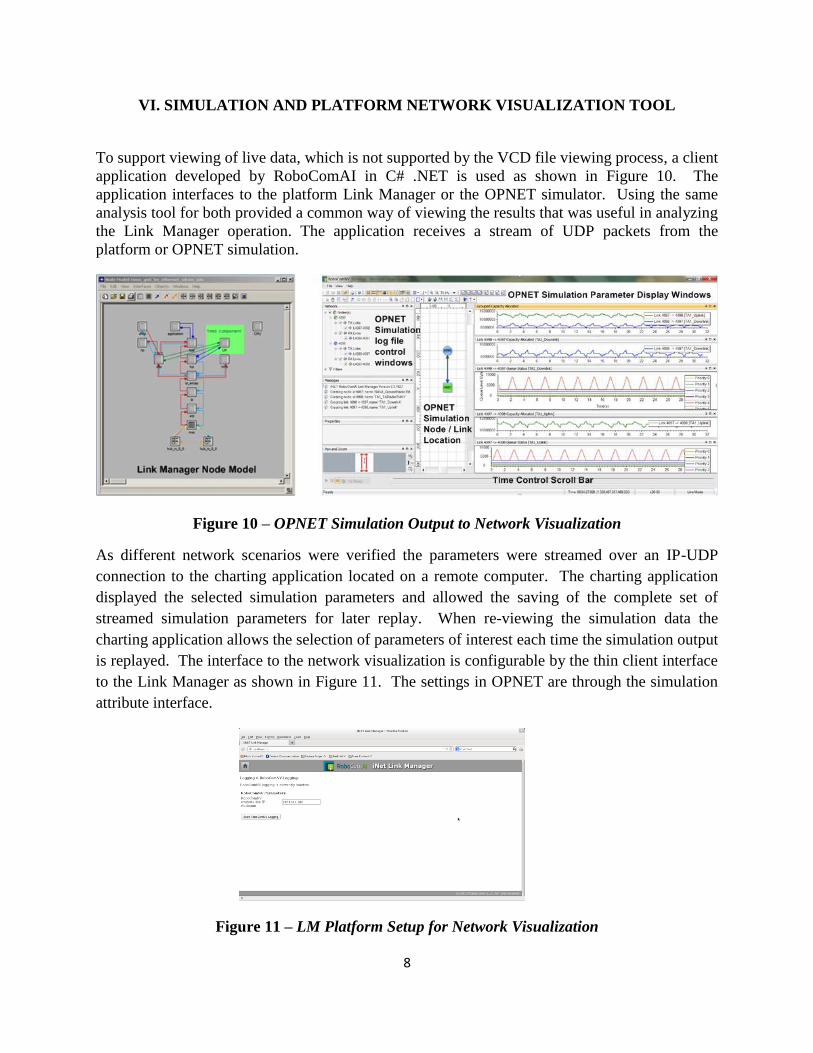
To support viewing of live data, which is not supported by the VCD file viewing process, a client
application developed by RoboComAI in C# .NET is used as shown in Figure 10. The
application interfaces to the platform Link Manager or the OPNET simulator. Using the same
analysis tool for both provided a common way of viewing the results that was useful in analyzing
the Link Manager operation. The application receives a stream of UDP packets from the
platform or OPNET simulation.
Figure 10 – OPNET Simulation Output to Network Visualization
As different network scenarios were verified the parameters were streamed over an IP-UDP
connection to the charting application located on a remote computer. The charting application
displayed the selected simulation parameters and allowed the saving of the complete set of
streamed simulation parameters for later replay. When re-viewing the simulation data the
charting application allows the selection of parameters of interest each time the simulation output
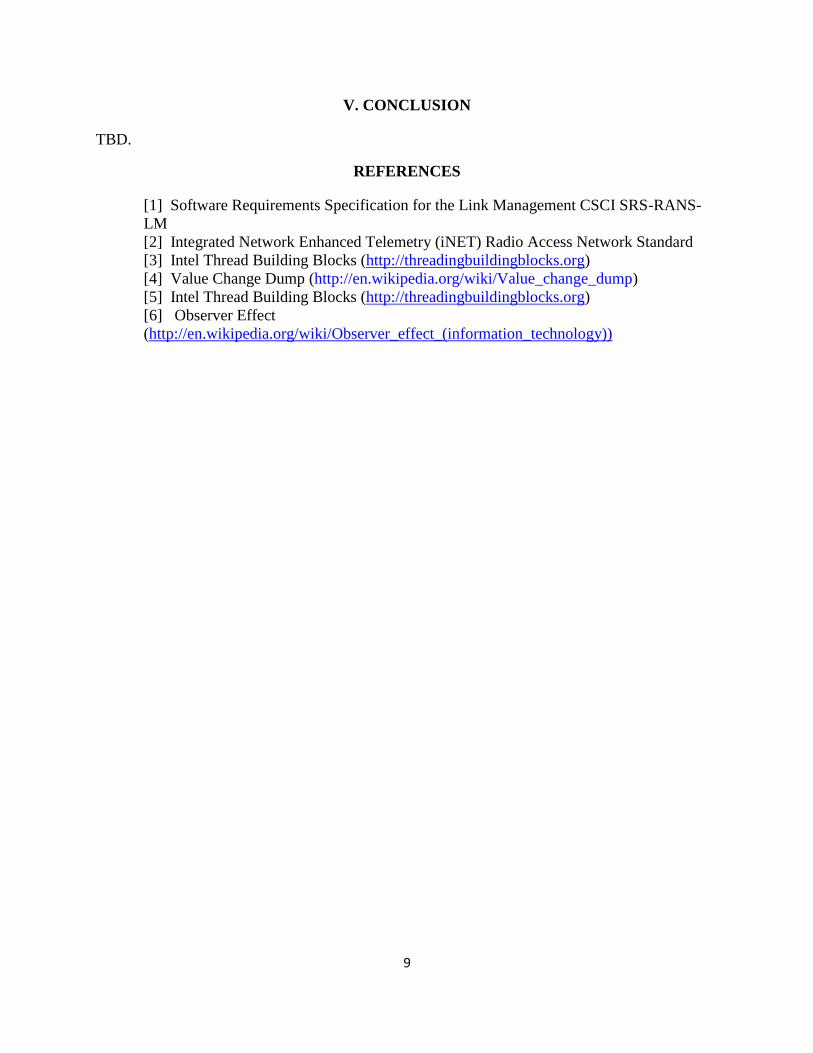
is replayed. The interface to the network visualization is configurable by the thin client interface
to the Link Manager as shown in Figure 11. The settings in OPNET are through the simulation
attribute interface.
Figure 11 – LM Platform Setup for Network Visualization
9
V. CONCLUSION
TBD.
REFERENCES
[1] Software Requirements Specification for the Link Management CSCI SRS-RANS-
LM
[2] Integrated Network Enhanced Telemetry (iNET) Radio Access Network Standard
[3] Intel Thread Building Blocks (http://threadingbuildingblocks.org)
[4] Value Change Dump (http://en.wikipedia.org/wiki/Value_change_dump)
[5] Intel Thread Building Blocks (http://threadingbuildingblocks.org)
[6] Observer Effect
(http://en.wikipedia.org/wiki/Observer_effect_(information_technology))