Telecommunications demand – a review of forecasting · PDF fileTelecommunications demand...
23
© Robert Fildes, IIF & Lancaster Centre for Forecasting Telecommunications demand – a review of forecasting issues Robert Fildes, Lancaster University [email protected] This paper is based on on work published in the IJF: 2002(4) as part of a special issue on Telecoms Demand Forecasting. The text downloadable from Science Direct
Transcript of Telecommunications demand – a review of forecasting · PDF fileTelecommunications demand...

© Robert Fildes, IIF & Lancaster Centre for Forecasting
Telecommunications demand – a review of forecasting issues
Robert Fildes, Lancaster [email protected]
This paper is based on on work published in the IJF: 2002(4) as part of a special issue on Telecoms Demand Forecasting.
The text downloadable from Science Direct
© Robert Fildes, IIF & Lancaster Centre for Forecasting
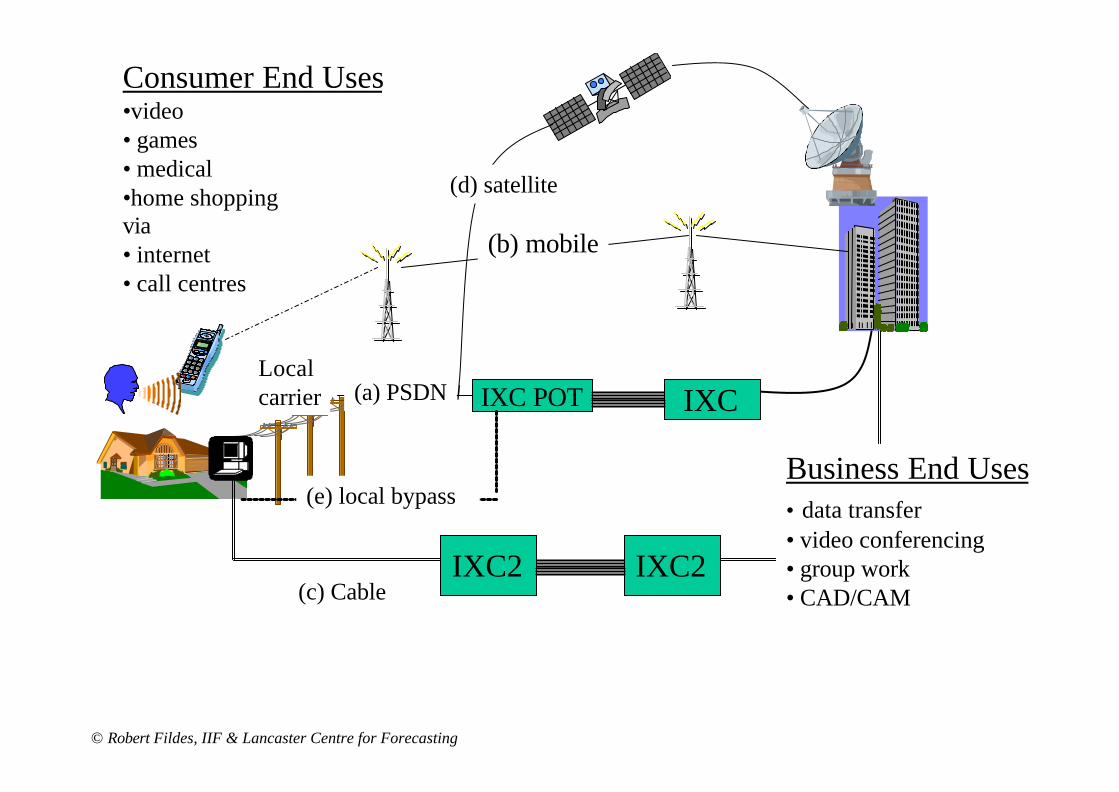
(c) Cable
(b) mobile
(d) satellite
Consumer End Uses•video• games• medical•home shoppingvia• internet• call centres
IXC2 IXC2
IXC POT(a) PSDN IXC
(e) local bypassBusiness End Uses• data transfer• video conferencing• group work• CAD/CAM
Localcarrier

© Robert Fildes, IIF & Lancaster Centre for Forecasting
•A Hierarchy of Forecasts
lOverall demand for an application
lCompetition within technologies to service application
lCompetition between suppliers
l Once investment in place ä operating costs are minimal
Forecasting Implicationsä e.g. for entrants, price collusion, price leadership
Usage
Access
Equipment
© Robert Fildes, IIF & Lancaster Centre for Forecasting
•
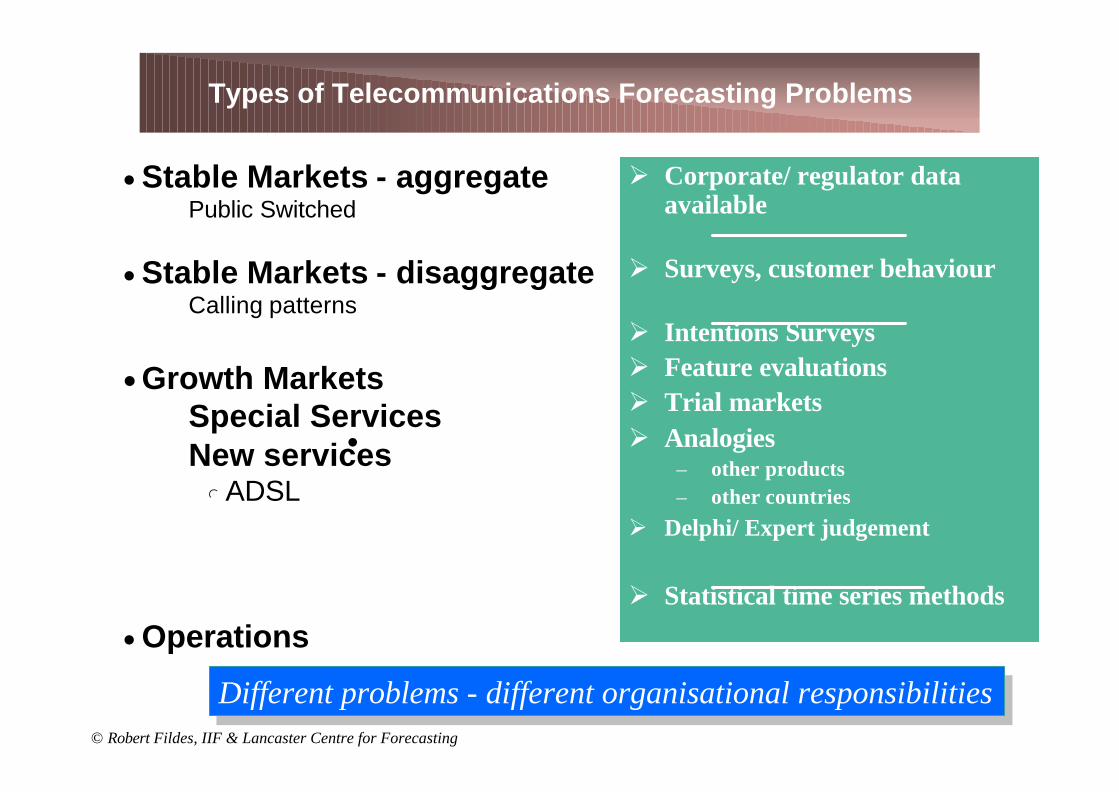
n Stable Markets - aggregateä Public Switched
n Stable Markets - disaggregateä Calling patterns
nGrowth Marketsä Special Servicesä New services
l ADSL
n Operations
Types of Telecommunications Forecasting Problems
Ø Corporate/ regulator data available
Ø Surveys, customer behaviour
Ø Intentions SurveysØ Feature evaluationsØ Trial markets Ø Analogies
– other products– other countries
Ø Delphi/ Expert judgement
Ø Statistical time series methods
Different problems - different organisational responsibilitiesDifferent problems - different organisational responsibilities
© Robert Fildes, IIF & Lancaster Centre for Forecasting
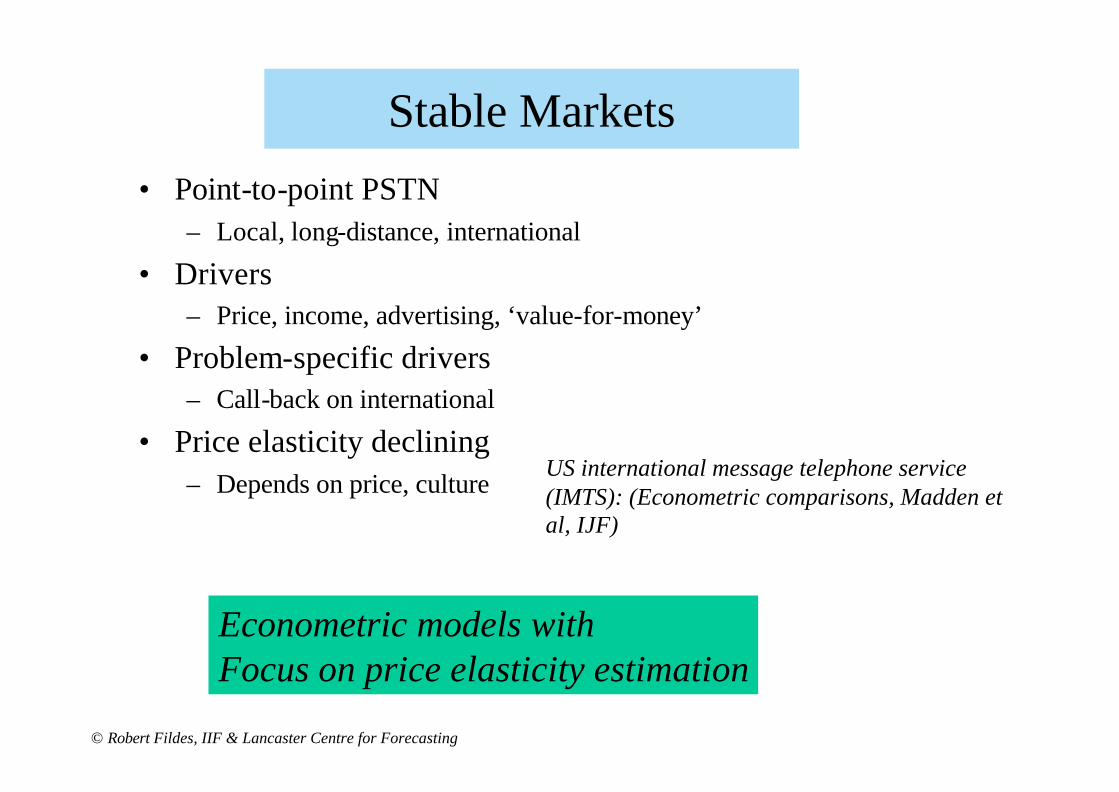
Stable Markets
• Point-to-point PSTN– Local, long-distance, international
• Drivers– Price, income, advertising, ‘value-for-money’
• Problem-specific drivers– Call-back on international
• Price elasticity declining– Depends on price, culture
Econometric models withFocus on price elasticity estimation
US international message telephone service (IMTS): (Econometric comparisons, Madden et al, IJF)

© Robert Fildes, IIF & Lancaster Centre for Forecasting
Conclusions - Stable MarketsConclusions - Stable Markets
n Increasing econometric sophisticationØ model specification (externalities: market
size)Ø diagnostics Ø multicollinearity - the interrelationship
between the explanatory variables, e.g ownership of durables and income
•But no stability or forecasting tests
•Time varying coefficients?
Missing out or including inappropriate variablesê•mis-understanding the market• poor forecasts,•bad policy
Does the model work better than alternatives?
Is the market changing,are new services getting more acceptable, is quality becoming more important?
Missing out or including inappropriate variablesê•mis-understanding the market• poor forecasts,•bad policy
Does the model work better than alternatives?
Is the market changing,are new services getting more acceptable, is quality becoming more important?

© Robert Fildes, IIF & Lancaster Centre for Forecasting
Stable Markets – Disaggregate Stable Markets – Disaggregate
Access & Usage• Based on Cross-sectional household data• Conditional models of usage, given choice of technology
or carrier• Focus on price elasticity
– By household demographics to support universal service analysis– Linked to marketing planning
Evaluation:Despite their use for forecasting• Dynamics of change not taken into account• No forecasting evaluation
Evaluation:Despite their use for forecasting• Dynamics of change not taken into account• No forecasting evaluation
© Robert Fildes, IIF & Lancaster Centre for Forecasting
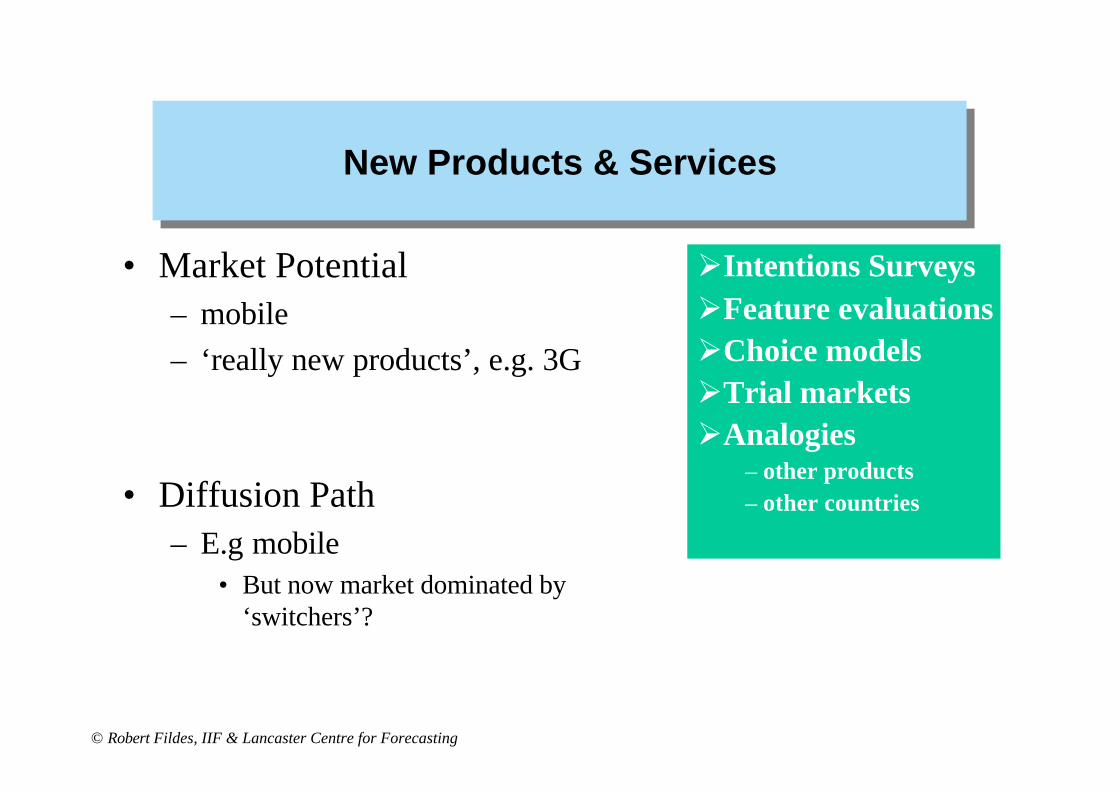
New Products & ServicesNew Products & Services
• Market Potential– mobile– ‘really new products’, e.g. 3G
• Diffusion Path– E.g mobile
• But now market dominated by ‘switchers’?
ØIntentions SurveysØFeature evaluationsØChoice modelsØTrial markets ØAnalogies
– other products– other countries

© Robert Fildes, IIF & Lancaster Centre for Forecasting
First generationUp to T
Both generations,Competition
Time line
Adopters at T-1
Market Potential forfirst generation, M1
Adoptersat T
Adopters &Users at T
Leavers Switchers
Exit
Adopters &Users at T+1
Adopters &Users at T+1
Switchers
ExitExit
Market Potential forsecond generation, M2
M1, not M2
Leavers
Forecasting telecommunication service subscribers in substitutive and competitive environments, Jun et al, IJF, 2002
© Robert Fildes, IIF & Lancaster Centre for Forecasting
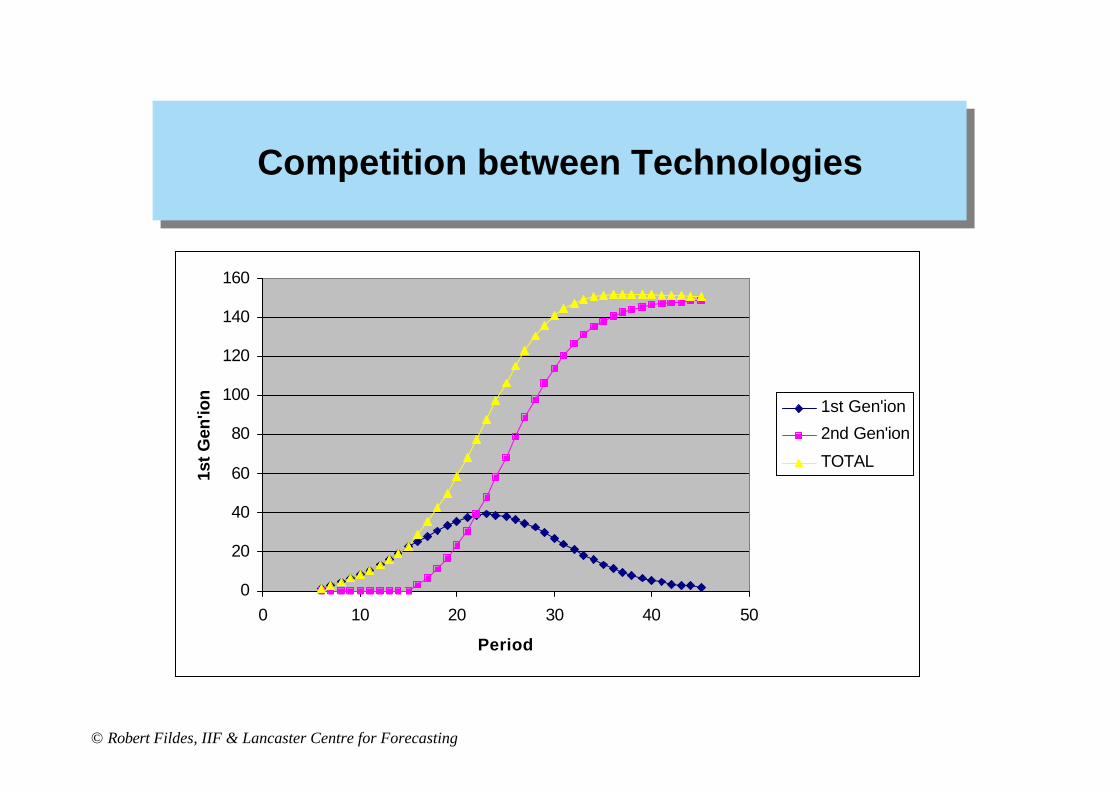
Competition between TechnologiesCompetition between Technologies
0
20
40
60
80
100
120
140
160
0 10 20 30 40 50
Period
1st
Gen
'ion
1st Gen'ion
2nd Gen'ion
TOTAL

© Robert Fildes, IIF & Lancaster Centre for Forecasting
Segmentation Approaches to Forecasting)
Small
LargeCommercial
LargeService
Business
Income > 30K
Income < 30K
Professional
BusinessSubscribers
Attending College Not attending
Below 21 years
Income < 20K
21 - 50
Income > 30K Income <30K
Not retired Retired
> 50
PersonalSubscribers
All users
• Forecast consumption in each segment• Project numbers in each segment }and multiply
Market Potential -Decomposition Methods I (applies to new and established markets
Market Potential -Decomposition Methods I (applies to new and established markets
© Robert Fildes, IIF & Lancaster Centre for Forecasting
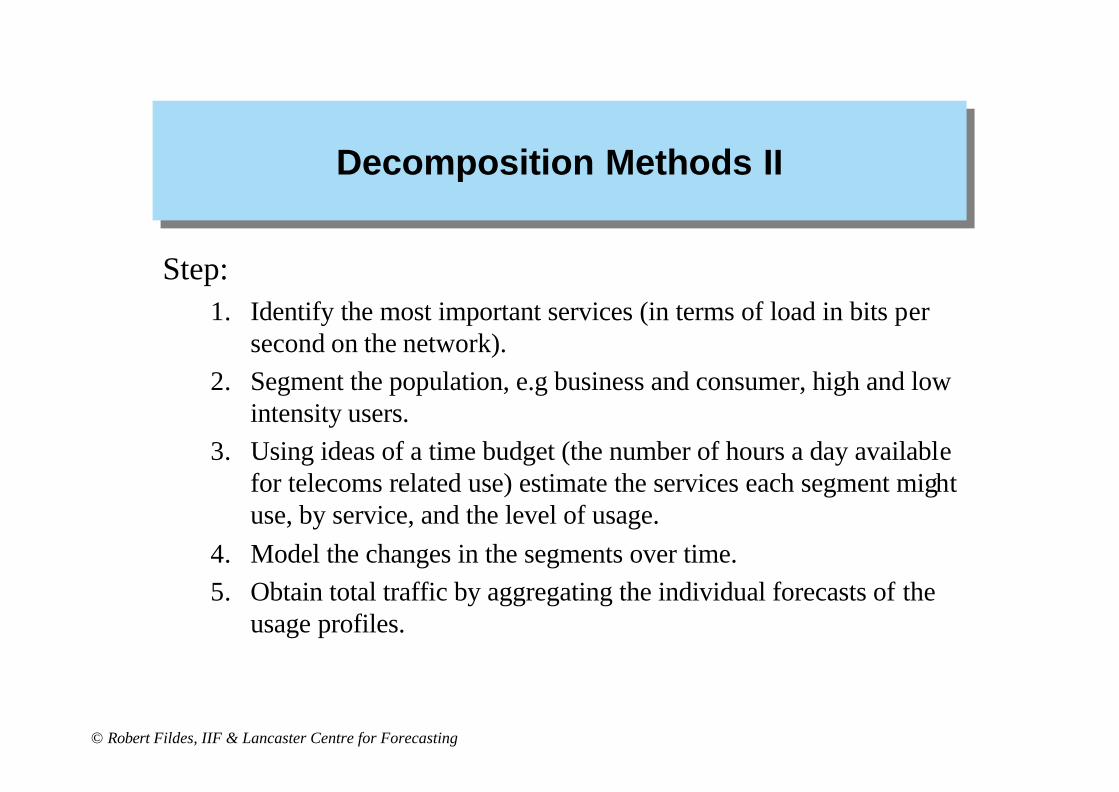
Decomposition Methods IIDecomposition Methods II
Step: 1. Identify the most important services (in terms of load in bits per
second on the network).2. Segment the population, e.g business and consumer, high and low
intensity users.3. Using ideas of a time budget (the number of hours a day available
for telecoms related use) estimate the services each segment might use, by service, and the level of usage.
4. Model the changes in the segments over time.5. Obtain total traffic by aggregating the individual forecasts of the
usage profiles.
© Robert Fildes, IIF & Lancaster Centre for Forecasting
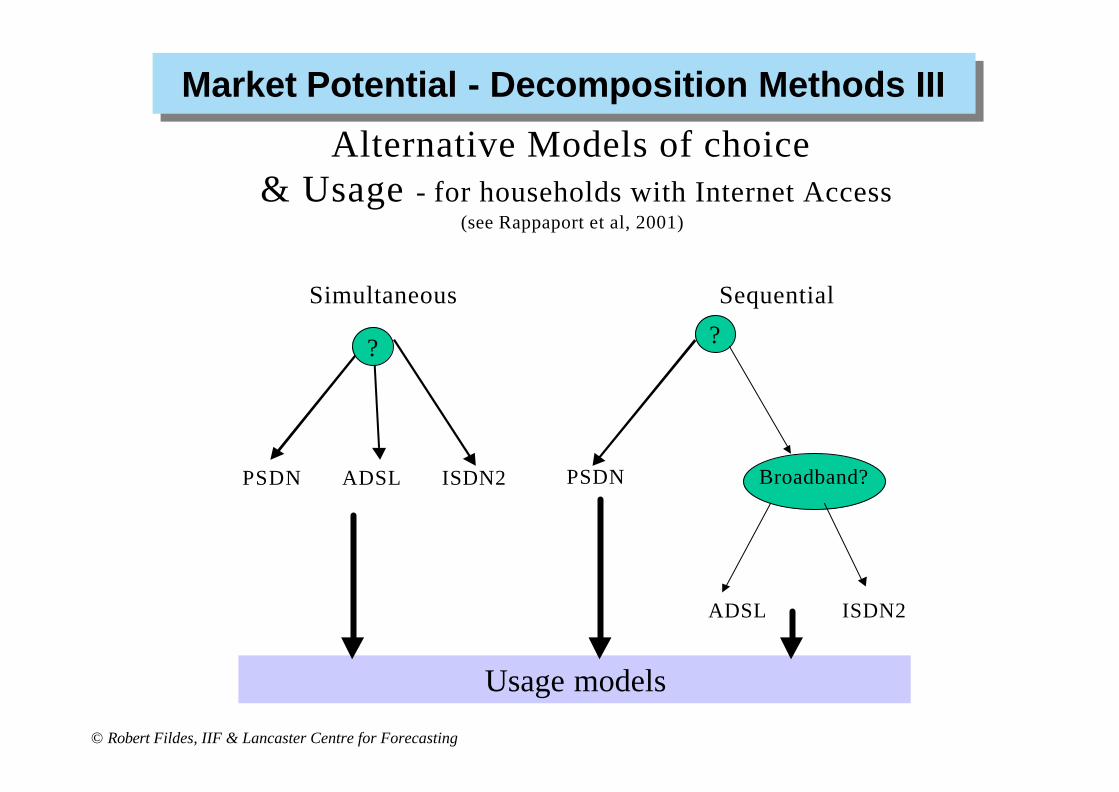
Alternative Models of choice& Usage - for households with Internet Access
(see Rappaport et al, 2001)
Simultaneous Sequential
?
PSDN ADSL ISDN2
?
PSDN Broadband?
ADSL ISDN2
Usage models
Market Potential - Decomposition Methods III Market Potential - Decomposition Methods III
© Robert Fildes, IIF & Lancaster Centre for Forecasting
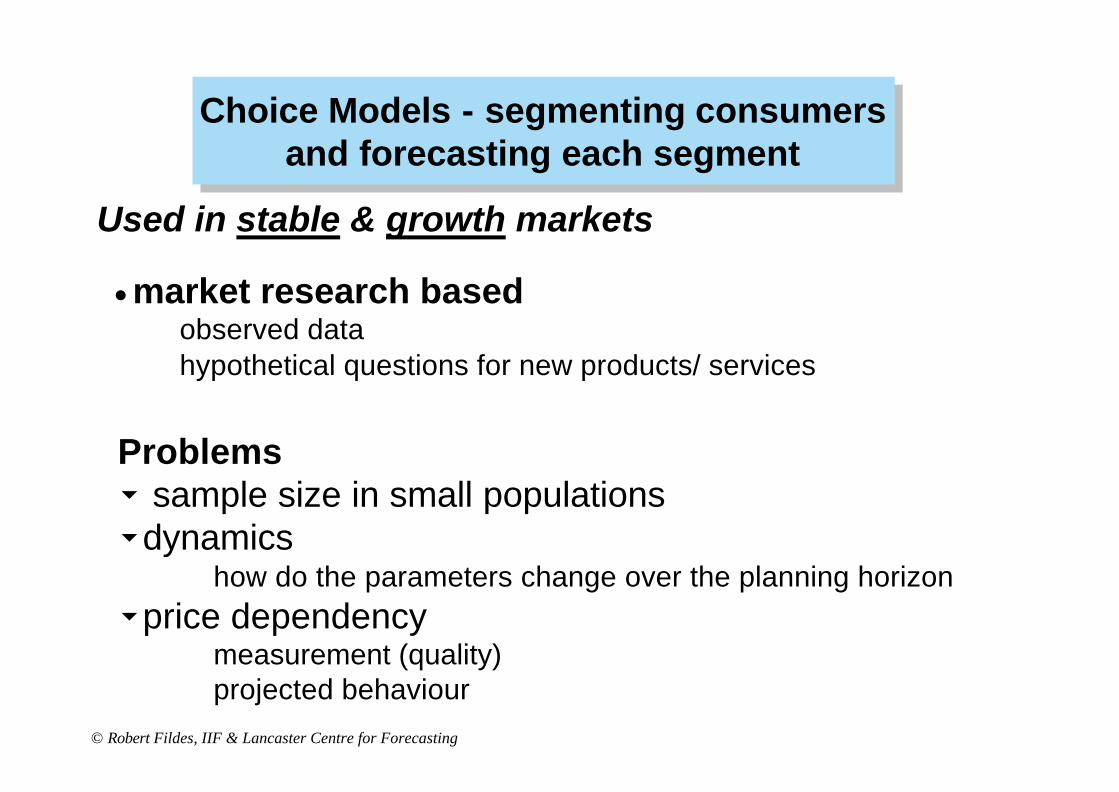
Choice Models - segmenting consumers and forecasting each segment
Choice Models - segmenting consumers and forecasting each segment
nmarket research basedä observed dataä hypothetical questions for new products/ services
Problems6 sample size in small populations6dynamics
ä how do the parameters change over the planning horizon6price dependency
ä measurement (quality)ä projected behaviour
Used in stable & growth markets
© Robert Fildes, IIF & Lancaster Centre for Forecasting
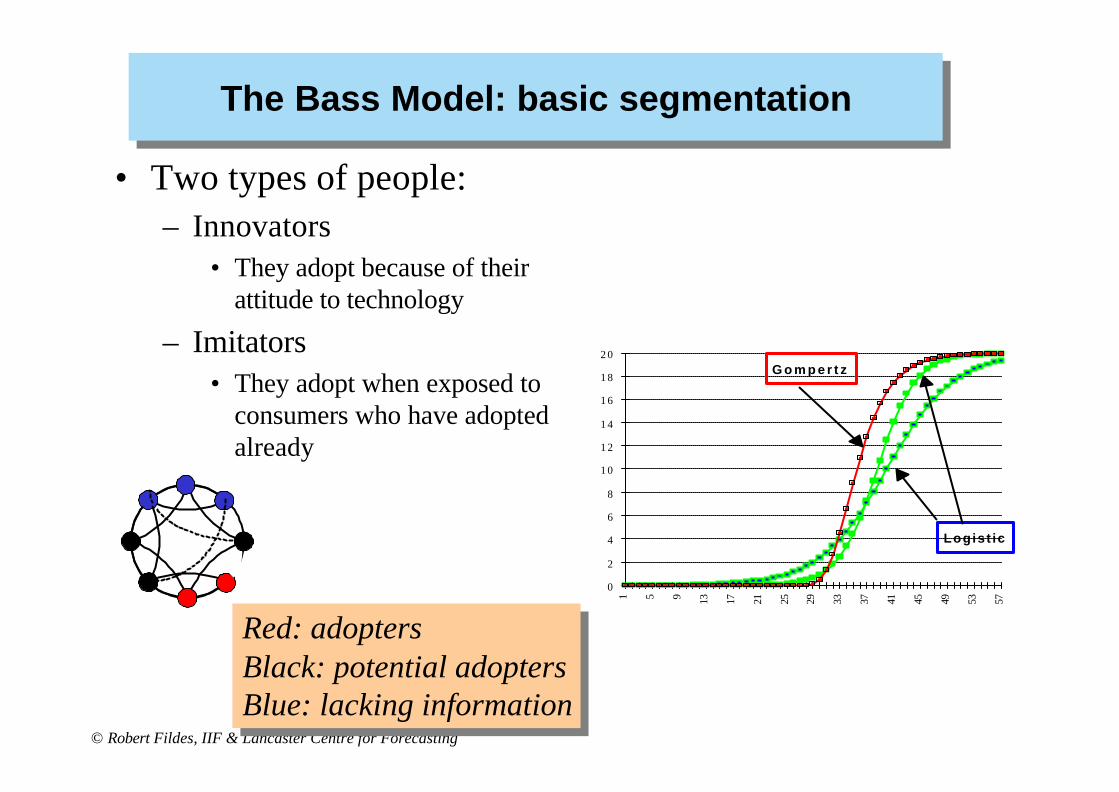
The Bass Model: basic segmentationThe Bass Model: basic segmentation
• Two types of people:– Innovators
• They adopt because of their attitude to technology
– Imitators • They adopt when exposed to
consumers who have adopted already
Red: adoptersBlack: potential adoptersBlue: lacking information
Red: adoptersBlack: potential adoptersBlue: lacking information
0
2
4
6
8
1 0
1 2
1 4
1 6
1 8
2 0
1 5 9 13 17 21 25 29 33 37 41 45 49 53 57
Logist ic
G o m p e r t z
© Robert Fildes, IIF & Lancaster Centre for Forecasting
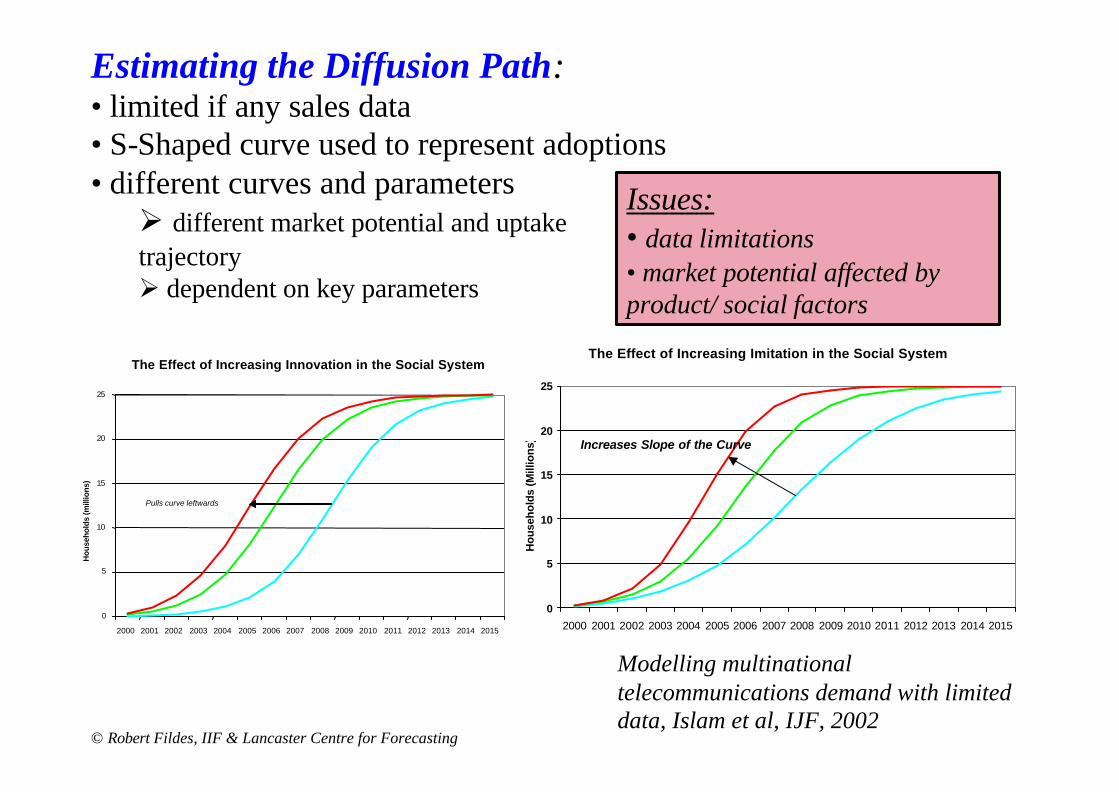
Estimating the Diffusion Path:• limited if any sales data• S-Shaped curve used to represent adoptions• different curves and parametersØ different market potential and uptake trajectoryØ dependent on key parameters
Modelling multinational telecommunications demand with limited data, Islam et al, IJF, 2002
The Effect of Increasing Imitation in the Social System
0
5
10
15
20
25
2000 2001 2002 2003 2004 2005 2006 2007 2008 2009 2010 2011 2012 2013 2014 2015
Hou
seho
lds
(Mill
ions
) Increases Slope of the Curve
The Effect of Increasing Innovation in the Social System
0
5
10
15
20
25
2000 2001 2002 2003 2004 2005 2006 2007 2008 2009 2010 2011 2012 2013 2014 2015
Hou
seho
lds
(mill
ions
)
Pulls curve leftwards
Issues:• data limitations• market potential affected by product/ social factors
© Robert Fildes, IIF & Lancaster Centre for Forecasting
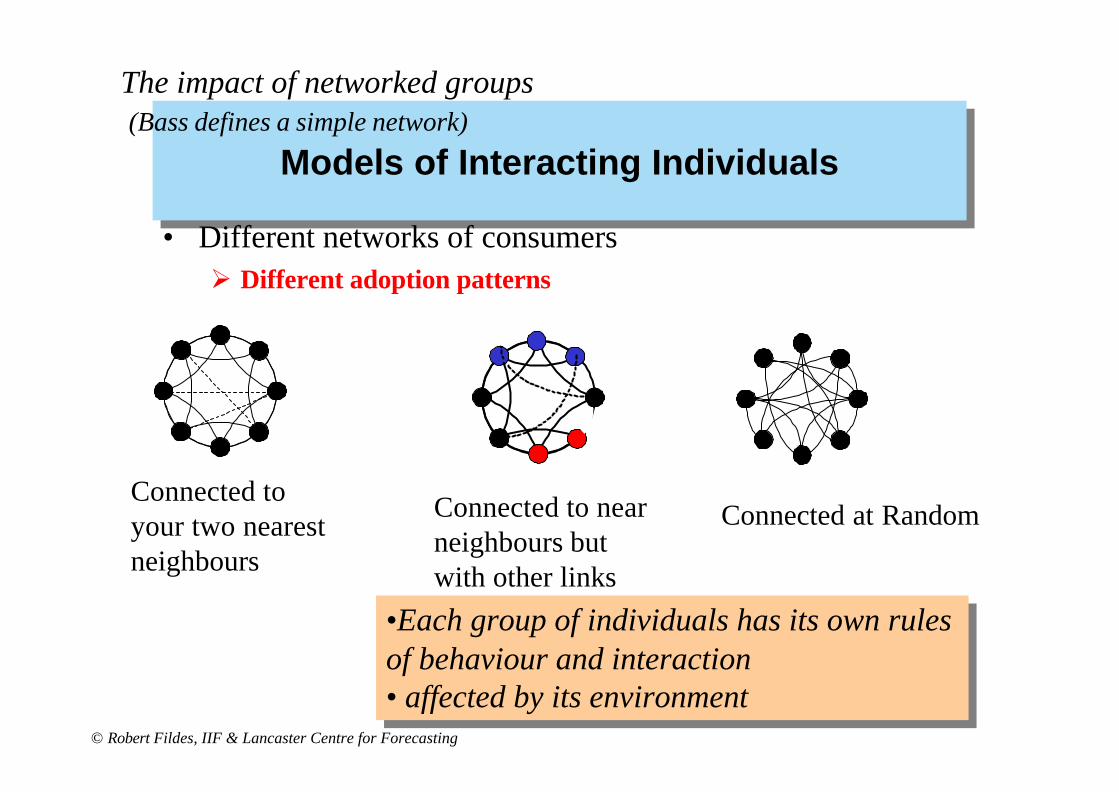
Models of Interacting IndividualsModels of Interacting Individuals
• Different networks of consumers Ø Different adoption patterns
Connected to your two nearest neighbours
Connected at RandomConnected to near neighbours but with other links
•Each group of individuals has its own rules of behaviour and interaction• affected by its environment
•Each group of individuals has its own rules of behaviour and interaction• affected by its environment
The impact of networked groups(Bass defines a simple network)
© Robert Fildes, IIF & Lancaster Centre for Forecasting
How can these ‘Agent based models’ be used (Collings, BTExact)
How can these ‘Agent based models’ be used (Collings, BTExact)
• Aim to understand behaviour of interacting markets– Diverse individual behaviour– Asymmetric information and motivation
• Examples – Financial markets– Customer relationship management
© Robert Fildes, IIF & Lancaster Centre for Forecasting
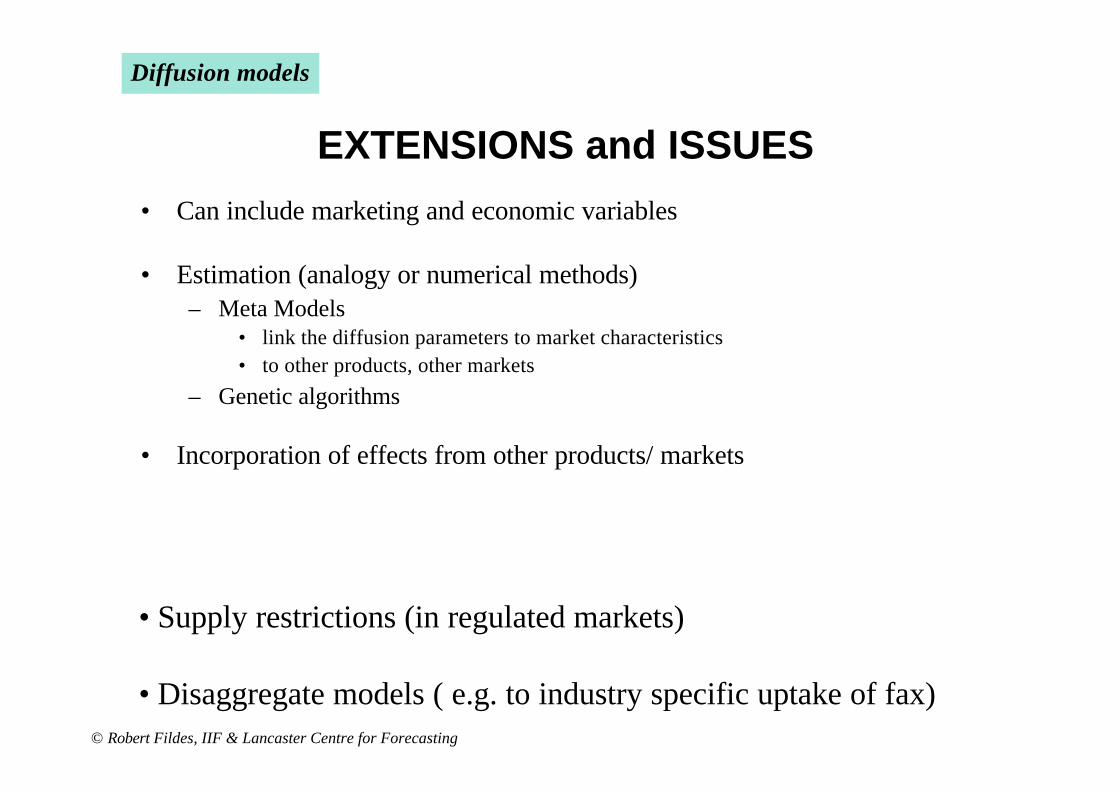
EXTENSIONS and ISSUES
• Can include marketing and economic variables
• Estimation (analogy or numerical methods)– Meta Models
• link the diffusion parameters to market characteristics• to other products, other markets
– Genetic algorithms
• Incorporation of effects from other products/ markets
Diffusion models
• Supply restrictions (in regulated markets)
• Disaggregate models ( e.g. to industry specific uptake of fax)

© Robert Fildes, IIF & Lancaster Centre for Forecasting
Bass Model - Diffusion Parameters and Meta Model
Imitation
Innovation
Mobile
NICs
UK, Denmark
Japan
Describing the speed and shape of the adoption path
Average diffusionparameters
© Robert Fildes, IIF & Lancaster Centre for Forecasting
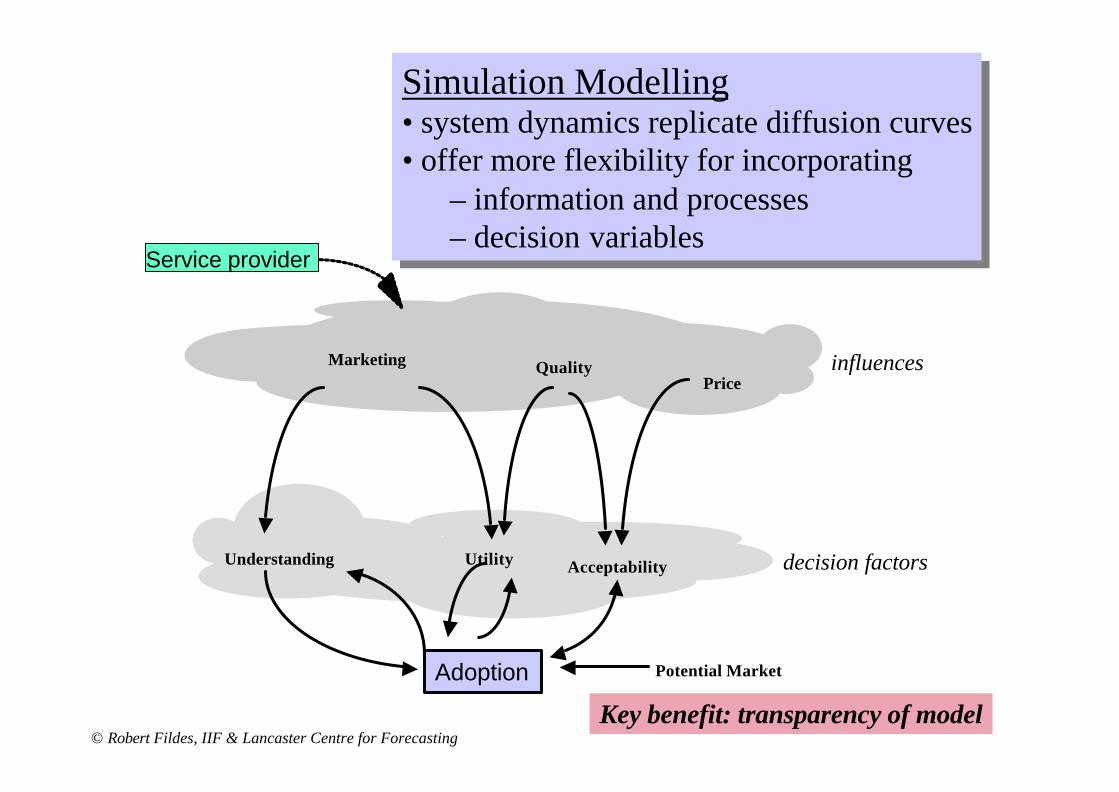
Service provider
decision factors
influences
Potential Market
Marketing QualityPrice
Understanding Utility Acceptability
Adoption
Simulation Modelling• system dynamics replicate diffusion curves• offer more flexibility for incorporating
– information and processes– decision variables
Simulation Modelling• system dynamics replicate diffusion curves• offer more flexibility for incorporating
– information and processes– decision variables
Key benefit: transparency of model
© Robert Fildes, IIF & Lancaster Centre for Forecasting
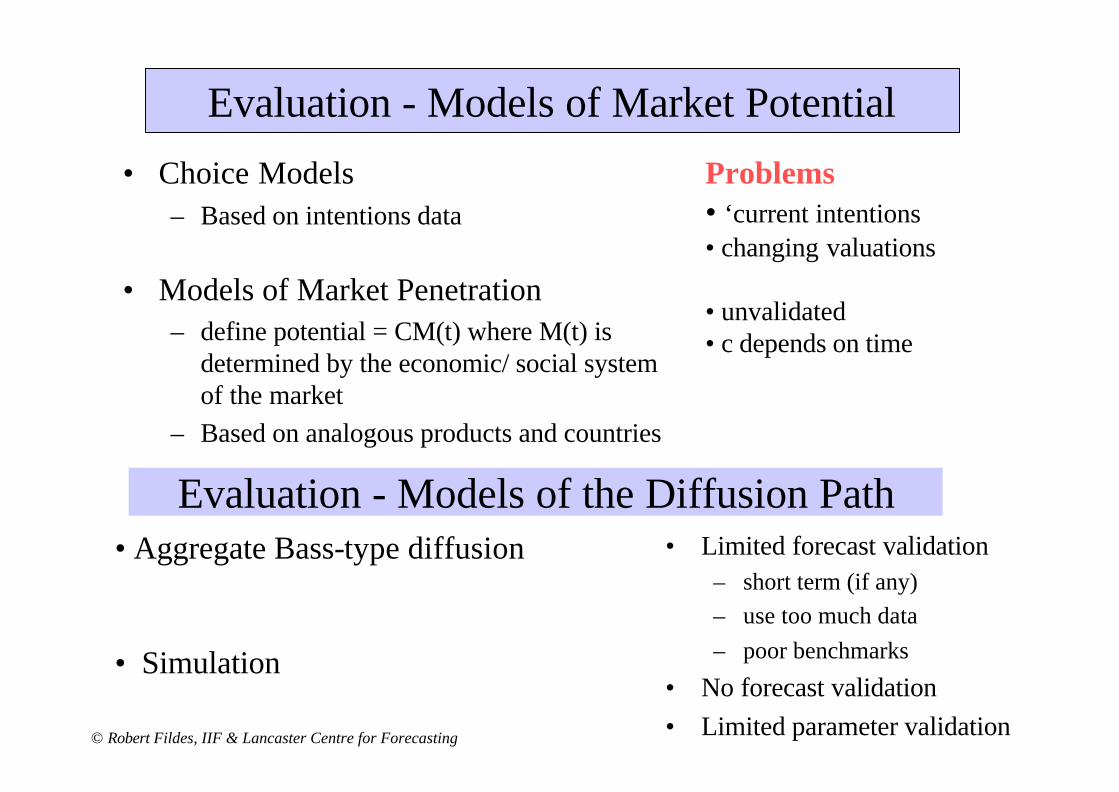
Evaluation - Models of Market Potential
• Choice Models– Based on intentions data
• Models of Market Penetration– define potential = CM(t) where M(t) is
determined by the economic/ social system of the market
– Based on analogous products and countries
Problems • ‘current intentions• changing valuations
• unvalidated• c depends on time
Evaluation - Models of the Diffusion Path• Limited forecast validation
– short term (if any)– use too much data– poor benchmarks
• No forecast validation• Limited parameter validation
• Aggregate Bass-type diffusion
• Simulation
© Robert Fildes, IIF & Lancaster Centre for Forecasting
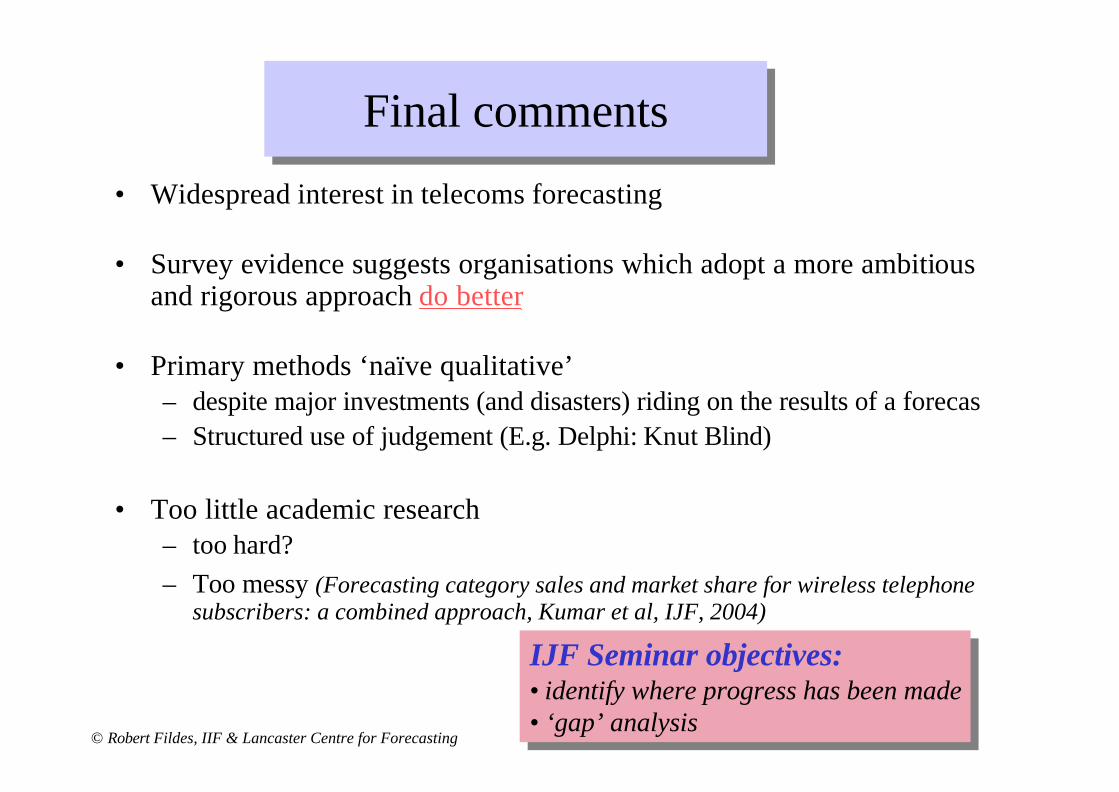
Final commentsFinal comments
• Widespread interest in telecoms forecasting
• Survey evidence suggests organisations which adopt a more ambitious and rigorous approach do better
• Primary methods ‘naïve qualitative’– despite major investments (and disasters) riding on the results of a forecas– Structured use of judgement (E.g. Delphi: Knut Blind)
• Too little academic research– too hard?– Too messy (Forecasting category sales and market share for wireless telephone
subscribers: a combined approach, Kumar et al, IJF, 2004)
IJF Seminar objectives:• identify where progress has been made• ‘gap’ analysis
IJF Seminar objectives:• identify where progress has been made• ‘gap’ analysis