Telecom KPIs definitions
22
PROCESS for TBF Success Rate Optimization: Definition : Temporary Block Flow (TBF) is a physical connection used by the two Radio Resource entities to support the unidirectional transfer of PDUs on packet data physical channels. The TBF is allocated radio resource on one or more PDCHs and comprises a number of RLC/MAC blocks carrying one or more LLC PDU. TBF Success Rate is when during a data session, TBFs are successfully established on UL and DL. PROCESS for Optimization : 1. Identify the Bad performing Cells for TBF Success Rate. 2. Identify the bifurcation of Poor TBF Success Rate: whether UL or DL is poor or it is poor in both directions. 3. Take the detailed report showing (Ex. Total TBF Requests, Total TBF Success, Failure reasons) 4. Identify the failure reasons after analyzing detailed report and follow the below mentioned process. Failure is mainly due to TBF Congestion or MS No response. 5. TBF Congestion: a. Check The Static and Dynamic PDCH definition from BSC Configuration data) b. If you find Zero Static or Dynamic PDCH, define the same. c. If PDCH definition is sufficient as per the guidelines, then check whether the TBF requests are high. If requests are high, then we need to define more PDCHs in the cell. But before defining more PDCHs, check whether the Voice Utilization is not high and there is no TCH Congestion in the cell.. 6. Check Hardware/TRX alarms; Resolve if find any. 7. Audit for any parameters related discrepancies and define as per standard parameters set. 8. MS No Response: RF and Environmental Factors:
-
Upload
ritesh-gupta-itil-certified -
Category
Technology
-
view
122 -
download
2
Transcript of Telecom KPIs definitions

PROCESS for TBF Success Rate Optimization:
Definition: Temporary Block Flow (TBF) is a physical connection used by the two Radio
Resource entities to support the unidirectional transfer of PDUs on packet data physical channels. The TBF is allocated radio resource on one or more PDCHs and comprises a number of RLC/MAC blocks carrying one or more LLC PDU. TBF Success Rate is when during a data session, TBFs are successfully established on UL and DL.
PROCESS for Optimization:
1. Identify the Bad performing Cells for TBF Success Rate.
2. Identify the bifurcation of Poor TBF Success Rate: whether UL or DL is poor or it is poor in both directions.
3. Take the detailed report showing (Ex. Total TBF Requests, Total TBF Success, Failure reasons)
4. Identify the failure reasons after analyzing detailed report and follow the below mentioned process. Failure is mainly due to TBF Congestion or MS No response.
5. TBF Congestion:
a. Check The Static and Dynamic PDCH definition from BSC Configuration data)
b. If you find Zero Static or Dynamic PDCH, define the same.
c. If PDCH definition is sufficient as per the guidelines, then check whether the TBF requests are high. If requests are high, then we need to define more PDCHs in the cell. But before defining more PDCHs, check whether the Voice Utilization is not high and there is no TCH Congestion in the cell..
6. Check Hardware/TRX alarms; Resolve if find any.
7. Audit for any parameters related discrepancies and define as per standard parameters set.
8. MS No Response: RF and Environmental Factors:
a. Low Coverage Areas (Try to reduce low coverage patches with physical optimization; New sites)
b. Interference/ Bad quality/ UL-DL Imbalance;
c. Check the states for TRx on which PDCH is configured can be issue of TRx also; Change TRx if you found random behavior of TRx.
After all rectification observe the subsequent days report if you still find the problem repeat the same process with due care to Pin Point the actual cause.
PROCESS for Optimization of Average GPRS RLC throughput and Average EDGE RLC Throughput:
Definition: Throughput is the amount of data uploaded/downloaded per unit of time.
PROCESS for Optimization:
1. Identify the Bad performing Cells for Poor GPRS/EDGE Throughput.
2. Identify the bifurcation of Poor Throughput: whether UL or DL is poor or it is poor in both directions.
3. Take the detailed report showing (Ex. Total TBF Requests, Coding Scheme Utilization)
4. Identify the cells after analyzing detailed report and follow the below mentioned process.
5. Take the configuration dump of the poor cells:
a. Check The Static and Dynamic PDCH definition from BSC Configuration data)
b. If you find Zero Static or Dynamic PDCH, define the same.
c. If PDCH definition is sufficient as per the guidelines, then check whether the TBF requests are high. If requests are high, then we need to define more PDCHs in the cell. But before defining more PDCHs, check whether the Voice Utilization is not high and there is no TCH Congestion in the cell.
d. Check whether there are enough Idle TS defined at the site. If not, definition to be done.

6. Check whether it is due to poor radio conditions/interference; check C/I. Perform a drive test to analyze the cell in more detail.
7. Check Gb Congestion/Utilization at the BSC/PCU.
8. Check Hardware/TRX alarms; Resolve if find any.
9. Audit for any parameters related discrepancies and define as per standard parameters set.
After all rectification observe the subsequent days report if you still find the problem repeat the same process with due care to Pin Point the actual cause.
PROCESS for Optimization of Downlink Multislot Assignment Success Rate:
Definition: User timeslot request based on traffic types and MS multi-timeslot capability
and the actual timeslot allocated by the system which can also be termed as Downlink Multislot Assignment Success rate.
PROCESS for Optimization:
1. Identify the Bad performing Cells for Poor DL Multislot Assignment.
2. Take the detailed report showing (Ex. Total TBF Requests, Failure in terms of TS requests)
3. Identify the cells after analyzing detailed report and follow the below mentioned process.
4. Take the configuration dump of the poor cells:
a. Check The Static and Dynamic PDCH definition from BSC Configuration data)
b. If you find Zero Static or Dynamic PDCH, define the same.

c. If PDCH definition is sufficient as per the guidelines, then check whether the TBF requests are high. If requests are high, then we need to define more PDCHs in the cell. But before defining more PDCHs, check whether the Voice Utilization is not high and there is no TCH Congestion in the cell.
d. Check the multiplexing thresholds and upgrade/downgrade reports.
5. Check whether it is due to poor radio conditions/interference; check C/I. Perform a drive test to analyze the cell in more detail.
6. Check Gb Congestion/PCU-DSP Utilization.
7. Check Hardware/TRX alarms; Resolve if find any.
8. Audit for any parameters related discrepancies and define as per standard parameters set.
After all rectification observe the subsequent days report if you still find the problem repeat the same process with due care to Pin Point the actual cause.
PROCESS for SDCCH Assignment Success Rate Optimization:
Definition: When From the MS SDCCH Request is sent to Base Station and if MS
successfully gets the SDCCH in response SDCCH Assignment has done successfully.
PROCESS for Optimization:
9. Identify the Bad performing Cells for SDCCH Assignment Success Rate
10. Take the detailed report showing (Ex. Total SDCCH Assignment Request, Total SDCCH Assignment Successful)
11. Follow the below mentioned Process after Analyzing detailed report...

12. From Report Check whether you have Idle SDCCH available in cell or not for SDCCH Assignment; because the Main factor for lowering SDCCH Assignment success rate is SDCCH congestion.
13. SDCCH Congestion:
a. Check The SDCCH Requests (Immediate Assignment Measurement Per Cell Report form M200)
b. Ex. Call purpose, SMS, Location Update
c. If you find High SDCCH Request and low TCH utilization Check “SDCCH Dynamic Allocation Allow” feature is enabled or not? if not enable this feature.
d. If you have very High SDCCH Request for Location Updating; optimize the LAC boundary.
e. Only For some exceptional cases you can increase the Static SDCCH Time Slots.
14. Check Hardware/Transmission alarms; Resolve if find any.
15. Audit for any parameters related discrepancies and define as per standard parameters set.
16. RF and Environmental Factors:
a. Low Coverage Areas (Try to reduce low coverage patches with physical optimization; New sites)
b. Interference/ Bad quality/ UL-DL Imbalance;
c. Check the states for TRx on which SDCCH is configured can be issue of TRx also; Change TRx if you found random behavior of TRx.
17. After all rectification observe the subsequent days report if you still find the problem repeat the same process with due care to Pin Point the actual cause.

PROCESS for SDCCH DROP Rate Optimization:
Definition: When MS is already on SDCCH and in-between communication with Base
station SDCCH channel got disconnected abruptly then SDCCH Drop has occurred.
PROCESS for Optimization:
1. Identify the Bad performing Cells for SDCCH Drop Rate
2. Take the detailed report showing (Ex. Total SDCCH Assignment Successful, Total SDCCH Dropped)
3. Follow the below mentioned Process after Analyzing detailed report...
4. The Main Reasons for High SDCCH Drop Rate are improper Parameters Configuration and Bad RF & Environmental factors.
5. First Audit for any parameters related discrepancies and define as per standard parameters set.
6. Check for Neighbor Relations and correct if it is not proper.
7. For counter level analysis refer “Call Drop Measurement per Cell” report from M2000.
8. Low Coverage: Through Drive Test Find out the low coverage patched and try to improve with physical optimization; New site; coverage enhancement features for some cases(Ex. Power Boost Tech, No Combining, TMA/TMB)
9. Interference: Check for interference from repeaters, Intra-Network interference due to aggressive reuse or improper Freq., Inter-Network can also be the case. Find out the actual cause and rectify it.
10. Antenna System: High VSWR due to feeders, Improper antenna configuration(Ex. Sector cable Swap)
11. Check for Hardware Issue and rectify if you found any.
12. After the activity check the subsequent days report and repeat the procedure for pin pointing the actual cause.
PROCESS for RACH (Random Access Channel) Success Rate Optimization:
Definition: For all services there will CH REQ (Channel Request) from MS and in the
response of CH REQ if MS will get the IMM ASS CMD (Signaling Ch) Access to system is successful. Nature of this Access REQ is random so it is call Random Access Channel Request.
PROCESS for Optimization:
1. Identify the Bad performing Cells for RACH Success Rate
2. Take detailed report and analyze for no of failure of Request and failures.
3. The main reasons for bad RACH success rate could be access from very distant place with very low coverage; Parameters Configuration discrepancies.
4. First Check for Parameters Configuration discrepancies and correct as per standard parameter set.
5. The main parameters to look for Huawei
a. “MS MAX Retrans” can set depending upon Traffic and Clutter.
b. “Tx-Interger” will reduce the RACH collision and can improve RACH success rate.
c. “T3122” waiting time for next network access.

d. “RACH Min.Access Level(dbm)” very important parameter for low coverage rural areas.
e. “CCCH conf” & “BS_AG_BLKS_RES” check properly defined or not? Because if you have overload with AGCH “IMM ASS” can’t be send in the response of CH REQ.
6. Check for Hardware Issues (Ex. BTS sensitivity has very crucial role to play here)
7. Check for Uplink Interference and quality.
8. Check for UL-DL imbalance and correct if any problem.
9. After the activity check the subsequent days report and repeat the procedure for pin pointing the actual cause.
PROCESS for TCH Assignment Success Rate Optimization:
Definition: When From the MS TCH Request is sent to Base Station and if MS successfully
gets the TCH in response TCH Assignment has done successfully.
PROCESS for Optimization:
1. Identify the Bad performing Cells for TASR( TCH Assignment Success Rate)
2. Take the detailed report showing (Ex. Total Assignment Request, Total Assignment Successful)
3. Follow the below mentioned Process after Analyzing detailed report...

4. From Report Check whether you have Idle TCH available in cell or not for Assignment and follow the below process.
A & B in above Flow chart are measurement Points for TCH Assignment Failures...
5. As per the Above Process If you have already used “Re-Assignment”, “Directed Retry” and “Queuing” features and still you are having issue with TCH Congestion (No Idle TCH)... Try to Decrease Half Rate Triggering Thresholds...
6. Ex. Below Parameters for Huawei System
“TCH Busy Traffic Threshold (%)”
“AMR TCH/H Prior Allowed”
“AMR TCH/H Prior Cell Load Threshold”
7. Check for discrepancies with Parameter Configuration and set as per Standard Parameters set available.

8. If you find Issue is not with High Traffic and Congestion... Check Hardware Issue (Ex. BTS/BSC/MSC hardware / UL-DL Imbalance due to VSWR) resolve if you find any.
9. Transmission Issues at A-bis/A-ter/A links
10. If Hardware is Ok check for Bad RF Environment... (Very low Coverage, High Interference, Bad Quality, Call from Distant Place (TA).
11. Follow below Process for Above Points... You can check the counters Report for Pin pointing the actual cause. (Ex. Assignment Per Cell Report from M2000)
12. Correct the affected area (Ex. If call is getting originated from High TA and getting failed due improper strength ; Optimize the Site Coverage with Physical Optimization) and check the subsequent days Report; If you still find the issue follow the same flow right from the starting with due care to PIN Point the Actual cause..
13. TBF Success Rate
14. Average GPRS RLC throughput & Average EDGE RLC Throughput
15. Downlink Multislot Assignment Success Rate
16. SDCCH Assignment Success Rate
17. SDCCH DROP Rate
18. ACH (Random Access Channel) Success Rate
19. Assignment Success Rate
PROCESS for Rx Quality Optimization:
• Definition :
• Poor Speech Quality could be due to

• Patchy Coverage ( holes)
• No Target cell for Handover
• Echo , Audio holes, Voice Clipping
Interference ---:
• Co-channel
• Adjacent channel
• External
• Multipath
• Noise
Speech Quality Parameters
• RxQUAL: Measured on the midamble.
• Indicates poor speech quality due to radio interface impairments
• FER : Measured on the basis of BFI ( Ping -Pong effect on speech )
• Preferred under Frequency Hopping situation
• Audio holes: Blank period of speech, due to malfunctioning of Transcoder boards or
PCM circuits.
• Mean Opinion Score (MOS) : ITU standard for estimating speech quality
Mean Opinion Score
Criteria for Voice Quality : A set value “x” at which “y” percent of customers rate the voice quality at Circuit Merits(CM) 4 - 5.
Speech Quality – Estimation
Speech RxQual FER FH DTX ReasonBAD HIGH LOW NO NO Air Interface ImpairmentsBAD HIGH HIGH NO NO Severe Air Interface ImpairmentsBAD LOW HIGH NO NO Transmission and Switching system , TranscoderBAD LOW HIGH YES NO Air Interface ImpairmentsBAD GOOD HIGH YES NO Transmission and Switching system , Transcoder
GOOD HIGH LOW YES NO Hopping ImplementationCLIPPING LOW HIGH YES YES Hopping Implementation and VADCLIPPING LOW LOW YES YES VAD
ECHO LOW LOW Y/N Y/N Transmission and Switching system , Transcoder

MOS up to a certain extent can easily estimated by configuring an algorithm using the Alarms in the HP E74XX systems for the following elements, an example of subset of which is illustrated above
- RxQual Full and Sub
- RxLev Full and Sub
- FER and RLT
- L3 Measurement Report
- L3 Handover specfic messages
PROCESS for Optimization:
1) Physical optimization
2) New cell dependency
3) Overshooting
4) Neighbor list tuning
5) BCCH tuning (Freq plan)

From M2000 extract Rx Quality measurement distribution Counters to know Trx –cell wise Rx Quality.
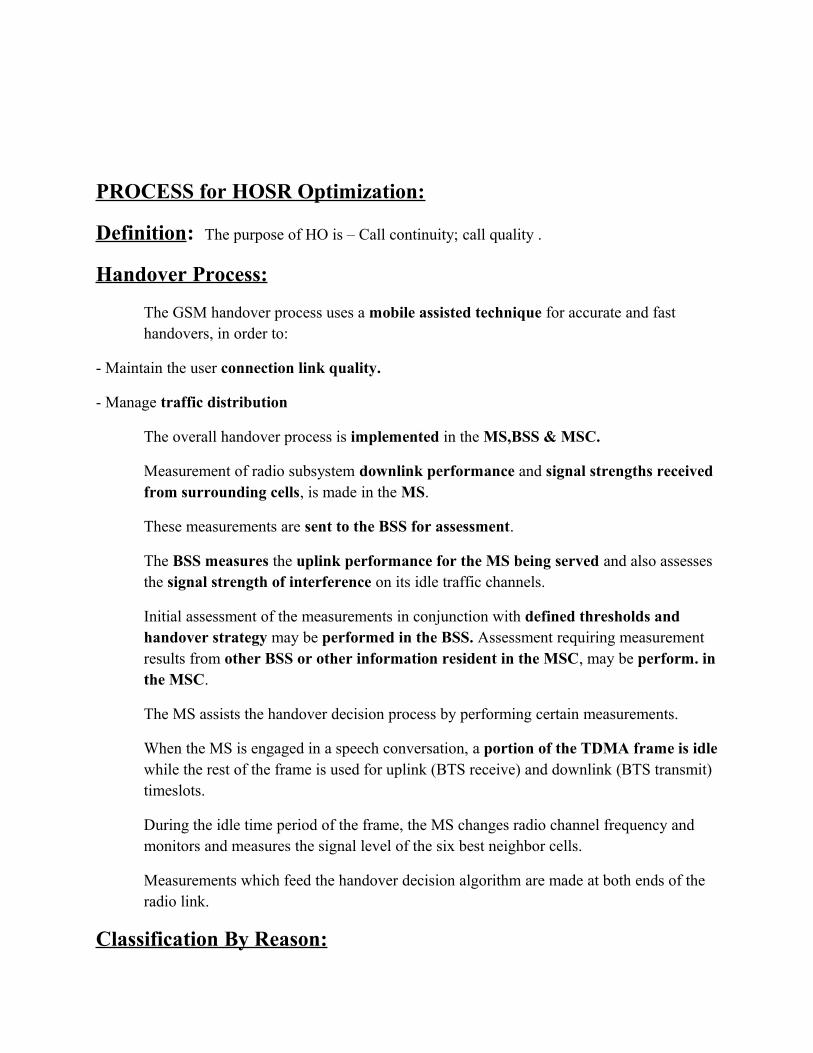
PROCESS for HOSR Optimization:
Definition: The purpose of HO is – Call continuity; call quality .
Handover Process:
The GSM handover process uses a mobile assisted technique for accurate and fast handovers, in order to:
- Maintain the user connection link quality.
- Manage traffic distribution
The overall handover process is implemented in the MS,BSS & MSC.
Measurement of radio subsystem downlink performance and signal strengths received from surrounding cells, is made in the MS.
These measurements are sent to the BSS for assessment.
The BSS measures the uplink performance for the MS being served and also assesses the signal strength of interference on its idle traffic channels.
Initial assessment of the measurements in conjunction with defined thresholds and handover strategy may be performed in the BSS. Assessment requiring measurement results from other BSS or other information resident in the MSC, may be perform. in the MSC.
The MS assists the handover decision process by performing certain measurements.
When the MS is engaged in a speech conversation, a portion of the TDMA frame is idle while the rest of the frame is used for uplink (BTS receive) and downlink (BTS transmit) timeslots.
During the idle time period of the frame, the MS changes radio channel frequency and monitors and measures the signal level of the six best neighbor cells.
Measurements which feed the handover decision algorithm are made at both ends of the radio link.
Classification By Reason:

• Emergency HO
– Timing advance (TA) Emergency HO
– Bad quality (BQ) Emergency HO
– Rx Level Drop Emergency HO
– Interference emergency HO
• load HO
• Normal HO
– Edge HO
– Layer HO
– Power budget (PBGT) HO
• Fast moving MS HO (Speed-sensitive HO )
PROCESS for Optimization:
18. Identify the Bad performing Cells for HOSR
19. Take the detailed report showing cause & target cell
20. Check congestion; hardware Alarm; Quality; Rx level
21. Late Handover – Handover margin (like Rx level-Rx Qual etc )need to define properly.
22. Ping-Pong Handover – A proper Hysteresis is used to prevent the Ping Pong effect. This can be caused by fading
23. Unnecessary Handover – more number of handovers, higher risk of facing quality problem and even in call drop
24. Missing neighbor – Best server is not in there in neighbor list
25. BCCH Missing
26. Same BCCH & BSIC combination
27. one way neighbor handover
28. Neighbor cell in other BSC- need to define correct CGI,BCCHNO,BSIC
29. Congestion on other cell

PROCESS for TCH drop Optimization:
Definition: Call Drop rate
PROCESS for Optimization:
Call drops are identified through SACCH messages. A Radio Link Failure Counter value is broadcast on the BCH. The counter value may vary from network to network. At the establishment of a dedicated channel, the counter is set to the broadcast value (which will be the maximum allowable for the connection). The mobile decrements the counter by 1 for every FER (unrecoverable block of data) detected on the SACCH and increases the counter by 2 for every data block that is correctly received (up to the initial maximum value). If this counter reaches zero, a radio link failure is declared by the mobile and it returns back to the idle mode.
If the counter reaches zero when the mobile is on a SDCCH then it is an SDCCH Drop. If it happens on a TCH, it is a TCH drop.
Sometimes an attempted handover, which may in itself have been an attempt to prevent a drop, can result in a dropped call.
When the quality drops, a mobile is usually commanded to perform a handover. Sometimes however, when it attempts to handover, it finds that the target cell is not suitable. When this happens it jumps back to the old cell and sends a Handover Failure message to the old cell. At this stage, if the handover was attempted at the survival threshold, the call may get dropped anyway. If on the other hand the thresholds were somewhat higher, the network can attempt another handover.
1 2
Channel Request Channel Request
Imm Assignment Imm Assignment
Service Request Service Request
Signalling SDCCH Signalling: :
Signalling SpeechTCH
RLT = 0 ; DROPS RLT = 0 ; DROPSSDCCH DROP ! TCH DROP !
3 SDCCH / TCH
Handover Command
Hand Access
Handover Failure
HANDOVER FAILURE DROP !


From M2000 extract Call Drop Measurement counters to know cause.
PROCESS for SCR:
Definition: SCR = ((Total Call - INTERNAL_FAILURES)/TOTAL CALLS) x 100%...
Total Call = BSS Originate Call->2G ORG CALL ATTEMPT TIMES + Trunk Office Direction Incoming Office Traffic->SEIZURE TIMES
INTERNAL_FAILURES = Failure Reason Traffic-> CAUSE013_switch equipment congestion+ CAUSE016_temporary failure+ CAUSE027_switch equipment failure+ CAUSE061_no CR resource+ CAUSE062_no CCB resource+ CAUSE166_network error+ CAUSE169_temporary error+ CAUSE170_device congestion+ CAUSE201_IWF resource unavailable
PROCESS for Optimization:
1. Identify the Failure reasons count for each internal failure reason.
2. Check detailed explanation of cause values those contributing the major factor.
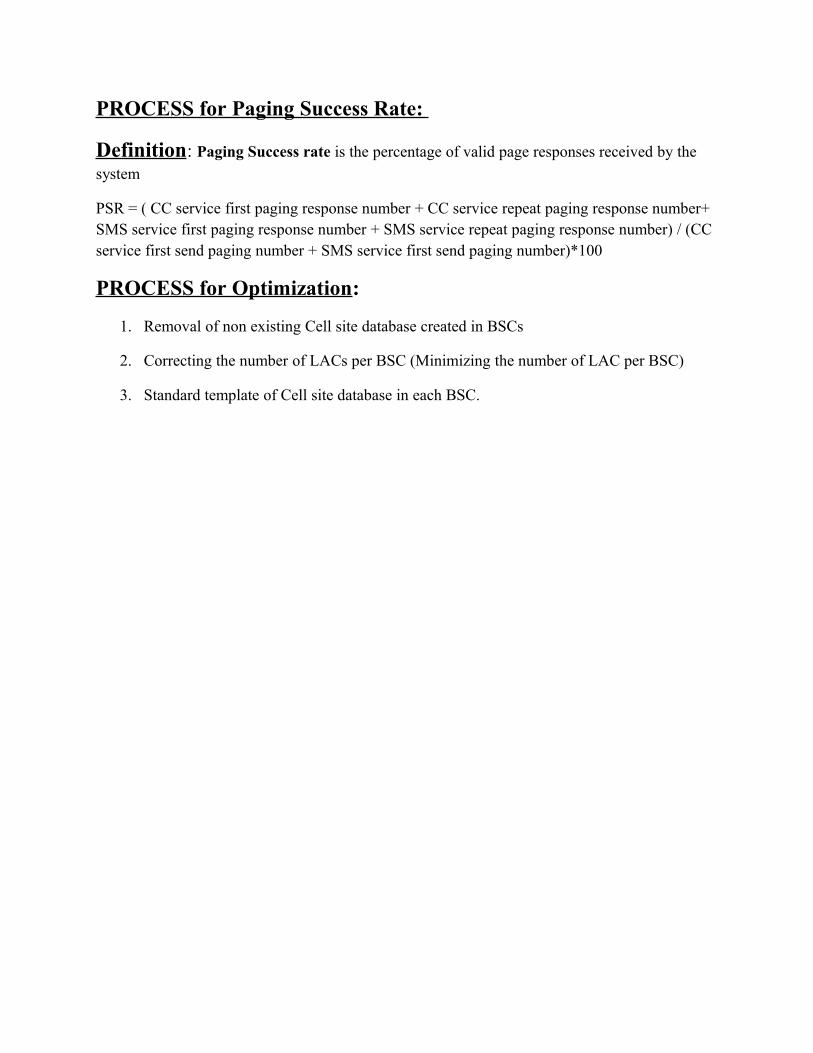
PROCESS for Paging Success Rate:
Definition: Paging Success rate is the percentage of valid page responses received by the
system
PSR = ( CC service first paging response number + CC service repeat paging response number+ SMS service first paging response number + SMS service repeat paging response number) / (CC service first send paging number + SMS service first send paging number)*100
PROCESS for Optimization:
1. Removal of non existing Cell site database created in BSCs
2. Correcting the number of LACs per BSC (Minimizing the number of LAC per BSC)
3. Standard template of Cell site database in each BSC.
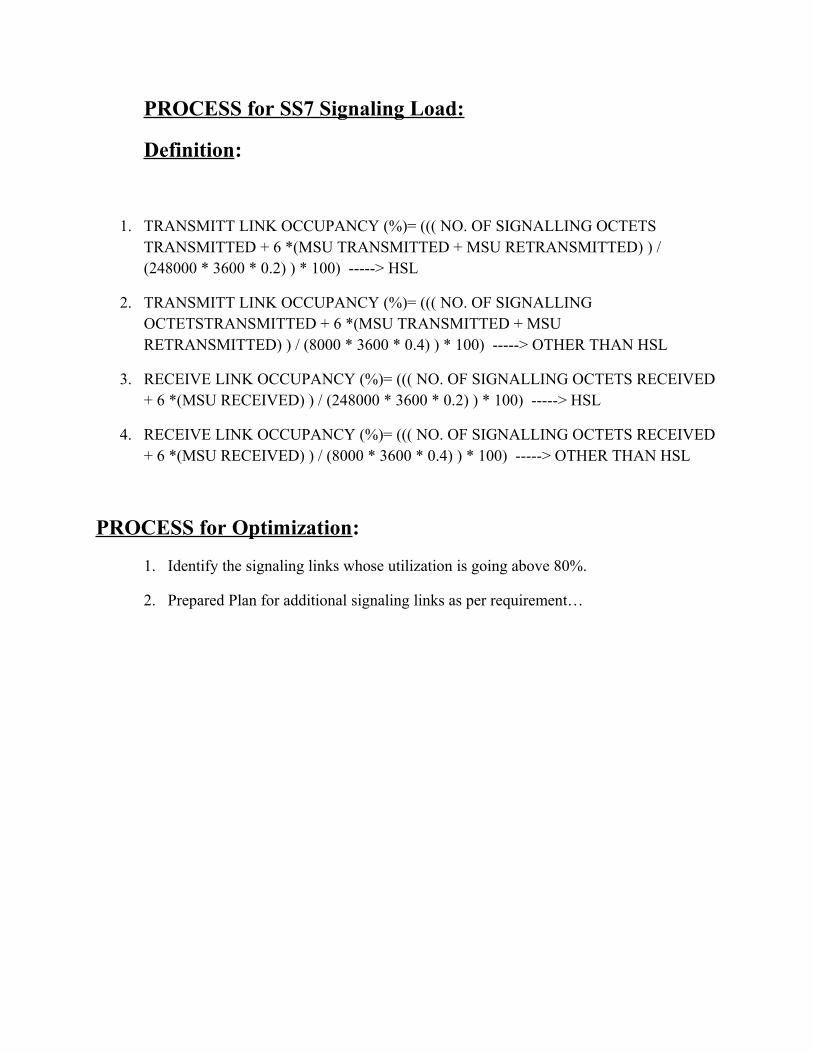
PROCESS for SS7 Signaling Load:
Definition:
1. TRANSMITT LINK OCCUPANCY (%)= ((( NO. OF SIGNALLING OCTETS TRANSMITTED + 6 *(MSU TRANSMITTED + MSU RETRANSMITTED) ) / (248000 * 3600 * 0.2) ) * 100) -----> HSL
2. TRANSMITT LINK OCCUPANCY (%)= ((( NO. OF SIGNALLING OCTETSTRANSMITTED + 6 *(MSU TRANSMITTED + MSU RETRANSMITTED) ) / (8000 * 3600 * 0.4) ) * 100) -----> OTHER THAN HSL
3. RECEIVE LINK OCCUPANCY (%)= ((( NO. OF SIGNALLING OCTETS RECEIVED + 6 *(MSU RECEIVED) ) / (248000 * 3600 * 0.2) ) * 100) -----> HSL
4. RECEIVE LINK OCCUPANCY (%)= ((( NO. OF SIGNALLING OCTETS RECEIVED + 6 *(MSU RECEIVED) ) / (8000 * 3600 * 0.4) ) * 100) -----> OTHER THAN HSL
PROCESS for Optimization:
1. Identify the signaling links whose utilization is going above 80%.
2. Prepared Plan for additional signaling links as per requirement…