Tela Nueva Lagoon Design (SEEHD edit) - CSU, Chico · Pond Design for Tela Nueva, Atlántida...
70
SEEHD CALIFORNIA STATE UNIVERSITY, CHICO Ben Forte Formatted: Font:(Default) Times New Roman, 24 pt, Bold 15 January 2009 Mr. Marcos Yanes Municipality of Tela Atlántida, Honduras WASTEWATER STABILIZATION POND DESIGN FOR TELA NUEVA, ATLÁNTIDA HONDURAS Mr. Yanes: On behalf of the Municipality of Tela, the California State University, Chico student group, SEEHD (Sustainable Engineering and Environmental Health for Development), is pleased to present the enclosed Wastewater Stabilization Pond Design for Tela Nueva, Atlántida Honduras. The enclosed design addresses economic, sustainability, and cultural concerns, resulting in technologically appropriate recommendations that will help to ensure human health in the municipality of Tela. A description of the existing wastewater lagoon system, where the wastes generated in Tela Viejo are treated, is included in this document, as is a design for a new lagoon system to serve the expanding population of Tela Nueva through 2020. Recommendations for the new system, including design and cost estimates, are discussed. This document concludes with a discussion of sustainable and safe effluent agricultural and aquacultural reuse options as recommended by the World Health Organization’s (WHO) in Guidelines for the Safe Use of Wastewater, Excreta, and Greywater (2006). SEEHD is committed to assisting the municipality of Tela with fundraising and technical assistance on this important project. Without action on the part of the municipality of Tela, the current Tela Viejo system will not be able to support the future population of the municipality, which will lead to health and environmental problems in the near future. Thus, it is recommended that the construction of a new sustainable lagoon wastewater treatment facility for Tela Nueva is started in 2009. If you have any questions or comments regarding the contents of this Wastewater Stabilization Pond Design for Tela Nueva, Atlántida Honduras, please feel free to contact the undersigned. Sincerely, Louise Fox Benjamin Forte Co-President Co-President
Transcript of Tela Nueva Lagoon Design (SEEHD edit) - CSU, Chico · Pond Design for Tela Nueva, Atlántida...

SEEHD CALIFORNIA STATE UNIVERSITY, CHICO
Ben ForteFormatted: Font:(Default) Times NewRoman, 24 pt, Bold
15 January 2009 Mr. Marcos Yanes Municipality of Tela Atlántida, Honduras WASTEWATER STABILIZATION POND DESIGN FOR TELA NUEVA, ATLÁNTIDA HONDURAS
Mr. Yanes:
On behalf of the Municipality of Tela, the California State University, Chico student group, SEEHD (Sustainable Engineering and Environmental Health for Development), is pleased to present the enclosed Wastewater Stabilization Pond Design for Tela Nueva, Atlántida Honduras. The enclosed design addresses economic, sustainability, and cultural concerns, resulting in technologically appropriate recommendations that will help to ensure human health in the municipality of Tela.
A description of the existing wastewater lagoon system, where the wastes generated in Tela Viejo are treated, is included in this document, as is a design for a new lagoon system to serve the expanding population of Tela Nueva through 2020. Recommendations for the new system, including design and cost estimates, are discussed. This document concludes with a discussion of sustainable and safe effluent agricultural and aquacultural reuse options as recommended by the World Health Organization’s (WHO) in Guidelines for the Safe Use of Wastewater, Excreta, and Greywater (2006).
SEEHD is committed to assisting the municipality of Tela with fundraising and technical assistance on this important project. Without action on the part of the municipality of Tela, the current Tela Viejo system will not be able to support the future population of the municipality, which will lead to health and environmental problems in the near future. Thus, it is recommended that the construction of a new sustainable lagoon wastewater treatment facility for Tela Nueva is started in 2009.
If you have any questions or comments regarding the contents of this Wastewater Stabilization Pond Design for Tela Nueva, Atlántida Honduras, please feel free to contact the undersigned.
Sincerely, Louise Fox Benjamin Forte Co-President Co-President

WASTEWATER STABILIZATION POND SYSTEM DESIGN FOR
TELA NUEVA, ATLÁNTIDA HONDURAS
SEEHD (Sustainable Engineering and Environmental Health for Development)
California State University, Chico
Student Chapter
15 January 2009
Prepared for: Municipalidad de Tela
Tela, Atlántida, Honduras C.A.

ACKNOWLEDGMENTS
CSUC-SEEHD Contributors: Kara Scheitlin, Contributing Writer, AutoCAD Drawings Louise Fox, Contributing Writer Faculty Advisor: Stewart Oakley, PhD.
Department of Civil Engineering California State University, Chico
[email protected] Municipality of Tela Collaborators: Marcos Yanes

TABLE OF CONTENTS Executive Summary ... . . . . . . . . . . . . . . . . . . . . . . . . . . . . . . . . . . . . . . . . . . . . . . . . . . . . . . . . . . . . . . . . . . . . . . . . . . . . . . . . . I
Overview ...................................................................................................................................... I ECOMAC Data and Findings...................................................................................................... I Proposed System Design............................................................................................................IV System Budget .............................................................................................................................V
1.0 Introduction ... . . . . . . . . . . . . . . . . . . . . . . . . . . . . . . . . . . . . . . . . . . . . . . . . . . . . . . . . . . . . . . . . . . . . . . . . . . . . . . .1 1.1 Project Background ........................................................................................................ 1 1.2 Project Overview ............................................................................................................ 1
2.0 Population, Flows, and Loadings .. . . . . . . . . . . . . . . . . . . . . . . . . . . . . . . . . . . . . . . . . . . . . . . . . . . .2 2.1 Population Estimates ...................................................................................................... 2 2.2 Flow Estimates................................................................................................................ 4 2.3 Loading Estimates........................................................................................................... 6
3.0 Pre-Treatment .. . . . . . . . . . . . . . . . . . . . . . . . . . . . . . . . . . . . . . . . . . . . . . . . . . . . . . . . . . . . . . . . . . . . . . . . . . . . . . .8 3.1 Parshall Flume................................................................................................................ 8 3.2 Grit Chamber .................................................................................................................. 9 3.3 Bar Screen Design ........................................................................................................ 12
4.0 Facultative Ponds .. . . . . . . . . . . . . . . . . . . . . . . . . . . . . . . . . . . . . . . . . . . . . . . . . . . . . . . . . . . . . . . . . . . . . . . . 15 4.1 Solar Insolation............................................................................................................. 15 4.2 Pond Sizing ................................................................................................................... 18
5.0 Maturation Pond... . . . . . . . . . . . . . . . . . . . . . . . . . . . . . . . . . . . . . . . . . . . . . . . . . . . . . . . . . . . . . . . . . . . . . . . . 20 5.1 Hydraulic Retention Time ............................................................................................. 20 5.2 Pond Sizing ................................................................................................................... 20
6.0 Sludge Management .. . . . . . . . . . . . . . . . . . . . . . . . . . . . . . . . . . . . . . . . . . . . . . . . . . . . . . . . . . . . . . . . . . . . . 23 6.1 Sludge Production......................................................................................................... 23 6.2 Desludging .................................................................................................................... 24
7.0 Effluent Reuse .. . . . . . . . . . . . . . . . . . . . . . . . . . . . . . . . . . . . . . . . . . . . . . . . . . . . . . . . . . . . . . . . . . . . . . . . . . . . . 35 7.1 Agriculture Reuse.......................................................................................................... 35 7.2 Aquaculture Reuse ........................................................................................................ 46
References .. . . . . . . . . . . . . . . . . . . . . . . . . . . . . . . . . . . . . . . . . . . . . . . . . . . . . . . . . . . . . . . . . . . . . . . . . . . . . . . . . . . . . . . . . . . . . . . 55

TABLES Table ES-1: Summary of Monitoring Results for E. coli, Fecal Coliforms, BOD5, and SS ..........II Table ES-2: Solid Composition & Helminth Content in Sludge .................................................. III Table ES-3: Removal Efficiencies in Systems Evaluated by ECOMAC ..................................... IV Table ES-4: Select Design Results ............................................................................................... IV Table ES-5: Total System Budget1 ..............................................................................................VII Table 1: Results for Population and Flows ..................................................................................... 2 Table 2: Projected Population of Tela Nueva, Honduras 2010-2020 ............................................. 3 Table 3: Results for System Loading.............................................................................................. 6 Table 4: Results for Parshall Flume................................................................................................ 8 Table 5: Results for Grit Chamber................................................................................................ 10 Table 6: Volume and Depth of Grit Accumulated........................................................................ 12 Table 7: Results for Bar Screen .................................................................................................... 13 Table 8: Results for Facultative Ponds ......................................................................................... 15 Table 9: 10 year Average Solar Radiation Data per month in Tela, Honduras ............................ 16 Table 10: Maximum Surface Loading of Facultative Pond.......................................................... 17 Table 11: Results for Maturation Pond......................................................................................... 20 Table 12: Results for Sludge Management................................................................................... 23 Table 13: Precipitation and Evaporation Data for Cuenca Cangrejal (1986 to 1996) .................. 25 Table 14: Option 1 Desludging Cost ............................................................................................ 32 Table 15: Option 2 Desludging Cost ............................................................................................ 33 Table 16: Evaluation of Desludging Options................................................................................ 33 Table 17: Summary of Health Risks Associated with Wastewater Reuse.................................... 36 Table 18: Pathogen Reductions Achieveable by Various Health Protection Measures ............... 37 Table 19: Maximum Concentrations of Trace Elements .............................................................. 39 Table 20: Standards for Chemical Concentrations in Vegetables ................................................ 40 Table 21: Monthly Average Precipitation and Evaporation (1986-1996) and Monthly Hydraulic
Loading.................................................................................................................................. 43 Table 22: Examples of Hazards Associated with Waste-Fed Aquaculture .................................. 47 Table 23: Standards for Chemical Concentrations in Fish ........................................................... 48 Table 24: Quality of Fish grown in Wastewater-Fed Ponds......................................................... 48 Table 25: Microbial Quality Targets for Waste-Fed Aquaculture................................................ 49 Table 26: Health Protection Measures Against Trematodes......................................................... 51
FIGURES Figure ES-1: Caudal Promedio Lagunas Catacamas Este (6-9/11/03) ...........................................II Figure ES-2: Caudal Promedio Lagunas Catacamas .................................................................... III Figure ES-3: Caudal Promedio Lagunas de Danli (18-21/11/03)................................................. III Figure ES-4: Worker collecting a wastewater sample.................................................................. VI Figure 1: Projected Population of Tela, 2010-2020........................................................................ 3 Figure 2: Map of Tela, Honduras.................................................................................................... 4 Figure 3: Urban Area of Tela, Honduras ........................................................................................ 5 Figure 4: CSUC students installing a pre-fabricated Parshall flume .............................................. 8 Figure 5: Proper bar screen cleaning procedures.......................................................................... 12 Figure 6: 10-Year Monthly Average Surface Loading ................................................................. 17 Figure 7: Properly Constructed maturation pond baffles.............................................................. 22 Figure 8: Drying Time Versus Depth of Sludge for Option 1 (16% TS) ..................................... 26 Figure 9: Drying Time Versus Depth of Sludge for Option 2 (20% TS) ..................................... 26 Figure 10: Sludge drying in the bottom of a facultative lagoon ................................................... 28 Figure 11: Sludge stored on-site in piles....................................................................................... 30 Figure 12: Required desludging equipment.................................................................................. 31 Figure 13: Examples of options for the reduction of pathogens................................................... 38 Figure 14: Health Protection Measures Against Trematodes ....................................................... 50
EXHIBITS Exhibit 1: Site Location Exhibit 2: Proposed Site Layout Illustration Exhibit 3: Pre-Treatment Detail

I
EXECUTIVE SUMMARY
OVERVIEW
The California State University, Chico student group, SEEHD (Sustainable Engineering and Environmental Health for Development), began assisting the municipality of Tela Nueva, Atlántida Honduras in 2005 with designing and implementing improvements to the community’s wastewater treatment system. The existing Tela treatment plant, which serves a region of the municipality known as Tela Viejo, is currently being operated successfully, however, rapid population growth has led Tela to request plans for an additional wastewater treatment system with a capacity to serve the future population.
This report will provide the municipality of Tela with recommendations for the design and construction of a Tela Nueva wastewater treatment system. The enclosed design is based on economical, environmental, cultural and technical issues that affect design considerations, as well as analytical data collected in 2003 from Tela’s existing wastewater system by the Honduran business ECOMAC.
Ten wastewater systems throughout Honduras were evaluated in the ECOMAC study, which was the first of its kind in Central America. In this Executive Summary, select data from the ECOMAC study is presented, as is an overview of budget and design results.
ECOMAC DATA AND FINDINGS
The objective of the ECOMAC project was to monitor the removal effectiveness of wastewater systems during both the dry (March, April, May) and rainy (September, October and November) seasons, in order to gauge the efficiency of operation and the sustainability of the wastewater systems being researched.
ECOMAC performed research on each system over five-day time periods. The size and age range of the population served by each wastewater system and the physical construction of the system were evaluated over the first two days, and samples of physical, chemical and microbiological materials were obtained from the system during the last three days. The assessment of the efficiency and sustainability of each wastewater system was based on the removal of organic material, suspended solids and pathogens (fecal coliforms, Escherichia coli, Shigella, and helminth eggs). Additionally, sludge was analyzed for fixed, volatile and total solid content. All samples were obtained and analyzed using standard methods for analysis (APHA, 1992).
The ECOMAC data is available in its entirety in the report Informe de Monitoreo: Lagunas de Estabilizacion de Tela, Proyecto Monitorio de Sistemas de Estabilizacion de Tratamiento de Aguas Negras (ECOMAC, 2004). Selected monitoring results from the ECOMAC study are displayed in Table ES-1 below.

Executive Summary SEEHD
II
Table ES-1: Summary of Monitoring Results for E. coli , Fecal Coliforms, BOD5, and SS
for all Systems Monitored, Wet and Dry Seasons Mean1
(Range of Values) Parameter Influent Final System Effluent
2.71E+07 2.89E+04 Escherichia coli (NMP/100mL) (1.22E+06—8.96E+08) (2.71E+02—1.17E+07)
4.70E+07 5.47E+04 fecal coliforms (NMP/100mL) (2.84E+06—2.01E+09) (6.21E+02—1.47E+07)
206 56 BOD5 (mg/L) (62—438) (19—93)
37 filtered BOD5 (mg/L) ---
(11—91) 207 72 SS (mg/L)
(66—383) (24—135) 1 Fecal coliform and Escherichia coli concentrations are geometric means. All others are arithmetic means.
Flow data graphs (Figure ES-1 through Figure ES-3) are used to estimate the ratio of Qmax to Qmin. As no pumps will be used in the proposed Tela Nueva system, flow data for the existing Tela Viejo system (which uses pumps) is not used for flow estimates in the design. Instead, average flows from the three systems in the ECOMAC study with conditions most similar to Tela are used.
Figure ES-1: Caudal Promedio Lagunas Catacamas Este (6-9/11/03)
Source: ECOMAC, 2004.

Executive Summary SEEHD
III
Figure ES-2: Caudal Promedio Lagunas Catacamas Sector Suroeste (10-13/11/03)
Source: ECOMAC, 2004.
Figure ES-3: Caudal Promedio Lagunas de Danli (18-21/11/03)
Source: ECOMAC, 2004.
ECOMAC results for sludge analysis, which are used for sludge calculations in this design, are presented in Table ES-2.
Table ES-2: Solid Composition & Helminth Content in Sludge
Sample Total Solids
Fixed Solids
Volatile Solids
Helminth
No. (%) (%) (%) (eggs/gram dry weight) 1 12 78 22 18 2 14 70 30 101 3 12 77 23 24
Average 13 75 25 48

Executive Summary SEEHD
IV
Helminth, fecal coliform, and BOD5 removal efficiencies in the systems evaluated by ECOMAC are included as Table ES-3.
Table ES-3: Removal Efficiencies in Systems Evaluated by ECOMAC
Parameter Facultative Lagoon
Maturation Pond Total
helminth egg removal > 95-100% 100% 100% fecal coliform removal 1-2 log10 2.0 log10 4.0-4.0 log10 BOD5 removal -- -- > 70% total
Source: ECOMAC, 2004.
PROPOSED SYSTEM DESIGN
The enclosed design is for a lagoon system that will serve the population of Tela through the year 2020. It consists of pre-treatment (Parshall Flume and grit chamber), two facultative ponds in parallel, and a maturation pond. Selected results for system values may be found in Table ES-4.
Table ES-4: Select Design Results Variable Description Value Units
Population and Flows P0 initial population in 2010 20,000 persons
P2020 projected population in 2020 25,200 persons q water consumption 150 L/person-day
Qavg average flow rate 3,820 m3/day Qmin minimum flow rate 1,140 m3/day Qmax maximum flow rate 7,640 m3/day
Parshall Flume W parshall flume throat width 0.23 m
Grit Chamber ad width of grit chamber 1.1 m L length of crit chamber 14 m V volume of grit accumulated per 7-day week 2.14 m3/week
Psa depth of grit accumulated per 7-day week 0.14 m/week -- grit chamber depth 0.14 m -- frequency of cleaning once every 4 days --
Facultative Ponds AF, Total total area of facultative ponds 36,590 m2
AF area of each facultative pond 18,295 m2
LF length of Each facultative pond 192 m WF width of each facultative pond 96 m DF depth of each facultative pond 1.8 m i slope of sides of facultative pond 3 --
VF volume of each facultative pond 30,448 m3 HRTF hydraulic retention time of facultative pond 16 days

Executive Summary SEEHD
V
Table ES-4: Select Design Results (cont’d) Variable Description Value Units
Maturation Pond AM area of maturation pond 14,856 m2 LM length of maturation pond 212 m WM width of maturation pond 70 m DM depth of maturation pond 1.8 m NB number of baffles 6 -- LB individual baffle length 58 m WB width of channel between baffles 12.2 m
Sludge Production Ms-d mass of solids accumulated daily 955 kg/day Ms-y mass of solids accumulated yearly 234,900 kg/year VS-y volume of sludge accumulated per year 1,740 m3/year
Sludge Production (Option 1) D0 initial optimal depth of sludge for drying 0.27 m DS final depth of dried sludge 0.171 m VFS volume of sludge accumulated per year (after drying) 2640 m3/year tD time until desludging is required 3 years tS drying time of sludge 106 days LS cumulative length of on-site sludge storage piles 178.2 m AS Area required for sludge storage 535 m2 -- desludging time 6.2 days
SYSTEM BUDGET
There are two main factors that influence the cost of a sustainable wastewater treatment system such as the one proposed in this report: operational and sludge removal costs.
Operational Costs
In order to ensure proper functioning of the treatment system, there must be two on-site workers (one laborer and one skilled operator). Workers are responsible for weed control around ponds, grit chamber and bar screen cleaning, controlling wildlife, and cleaning scum off of the pond surfaces (in order to prevent mosquitoes and other vectors).
The skilled operator is required to record monthly data on the pond system, such as odor, color, and flow rate. The operator will need to be trained in collecting influent and effluent samples so that a lab may perform various analyses of the system which will verify that the system is functioning properly. Effluent should be tested for helminth eggs and fecal coliforms to ensure acceptable reduction of pathogens.
In addition to the two on-site workers, an engineer will be needed for approximately two days every two months record and analyze flow data or any other required analyses, and to verify that

Executive Summary SEEHD
VI
the system is functioning and is being maintained properly. A worker using proper water quality sampling techniques is presented as Figure ES-4.
Figure ES-4: Worker collecting a wastewater sample
Current daily wages for a laborer, a skilled operator, and an engineer in Honduras are estimated to be 100, 300 and 500 Lempira (US $5, $16, and $26) per day, respectively (Cámara, 2006). The skilled operator and laborer are assumed to work six eight-hour days per week, and the engineer is assumed to work two eight-hour days per month.
Sludge Removal Costs
As detailed in the sludge removal section of this report, a five-year desludging frequency is estimated for each of the two lagoons (Option 1). The cost of desludging in 2006 was US$5/m3. This value is adjusted throughout the lifetime of the system to account for inflation of desludging costs.
Total Cost of System
As displayed in Table ES-5, the monthly cost per household in 2010 would be approximately US$22, and in 2020 it would be US$34.

Executive Summary SEEHD
VII
Table ES-5: Total System Budget1 Daily Cost Daily Cost Purchase Monthly Yearly Lps/Day US$/day Frequency US$/month (US$/year)
Labor1
Laborer 100 5 24 days/month 126 1,516 Skilled Operator 200 11 24 days/month 253 3,032 Engineer 800 42 2 days/month 1600 19,200 Desludging
Option 12 4,256 51,068 Yearly Cost in 2010 = 74,816
Cost per Household in 2010 = 22 Yearly Cost in 20203 = 96,490
Cost per Household in 20203 = 23
Total cost 2010-2020 w/ compound interest = US$930,664 1 According to Camara Hondurena de la Industria de la Construccion, 2006. 2 Calculated using total lifetime cost of Option 1 (as calculated in desludging section of this document) divided to get average yearly cost 2010-2020. 3 Inflation rate according to CIA World Factbook, 2008, 11-year time frame.

1
1.0 INTRODUCTION
1.1 PROJECT BACKGROUND
Since its establishment in 2005, SEEHD has provided technical assistance for a 12-year-old wastewater stabilization lagoon system in Tela Viejo, Honduras. A site location diagram is presented as Exhibit A. It is estimated that the wastes of approximately 8,000 residents of Tela are being treated by the system, which consists of a facultative lagoon followed in series by two maturation lagoons.
Analytical data has shown that the existing Tela wastewater system effluent quality is sufficient to ensure human health (ECOMAC, 2004). SEEHD published a 2006 report that provided recommendations of required system renovations, and methods to achieve these renovations. Since then, the Tela Viejo wastewater system has undergone large-scale maintenance and redesign, including the installation of a working Parshall Flume, construction of a by-pass channel and desludging of the primary lagoon (which was recently completed). SEEHD will publish an additional technical document in 2008, which will review the progress of these recommendations as well as additional recommendations for the existing system.
While the existing Tela treatment plant continues to be successful, rapid population growth has lend the municipality of Tela to request plans for an additional wastewater treatment system. This report provides the municipality of Tela with recommendations for the design and construction of a Tela Nueva wastewater treatment system.
1.2 PROJECT OVERVIEW
The enclosed design addresses economical, sustainability, and cultural concerns, resulting in technologically appropriate recommendations. Without action on the part of the Municipality of Tela, the current Tela Viejo system will not be able to support the future population. Thus, it is recommended that the municipality of Tela start construction a new sustainable lagoon wastewater treatment facility for Tela Nueva in 2009. SEEHD is committed to assisting Tela with technical assistance and obtaining funding.
This report summarizes a design for a new long-term sustainable wastewater stabilization pond design for Tela Nueva, as well as recommendations for sustainable effluent reuse options for agriculture and aquaculture, as an alternative use for the treated lagoon system effluent which is currently discharged into a river which flows into the Caribbean Ocean. A proposed site layout is presented as Exhibit B.

2
2.0 POPULATION, FLOWS, AND LOADINGS
Results for population and flow calculations are presented in Table 1.
Table 1: Results for Population and Flows Variable Description Value Units
r population growth rate 0.02 decimal % /year t time -- years
Pt projected population at time t -- persons P0 Initial Population in 2010 20,000 persons
P2020 projected population in 2020 25,200 persons I infiltration of concrete pipes 800 m3/day q water consumption 150 L/person-day k percentage of water excreted 0.8 decimal % R expirimental ratio of Qmax to Qmin 5.6 --
Qavg average flow rate 3,820 m3/day Qmin minimum flow rate 1,140 m3/day Qmax maximum flow rate 7,640 m3/day
2.1 POPULATION ESTIMATES
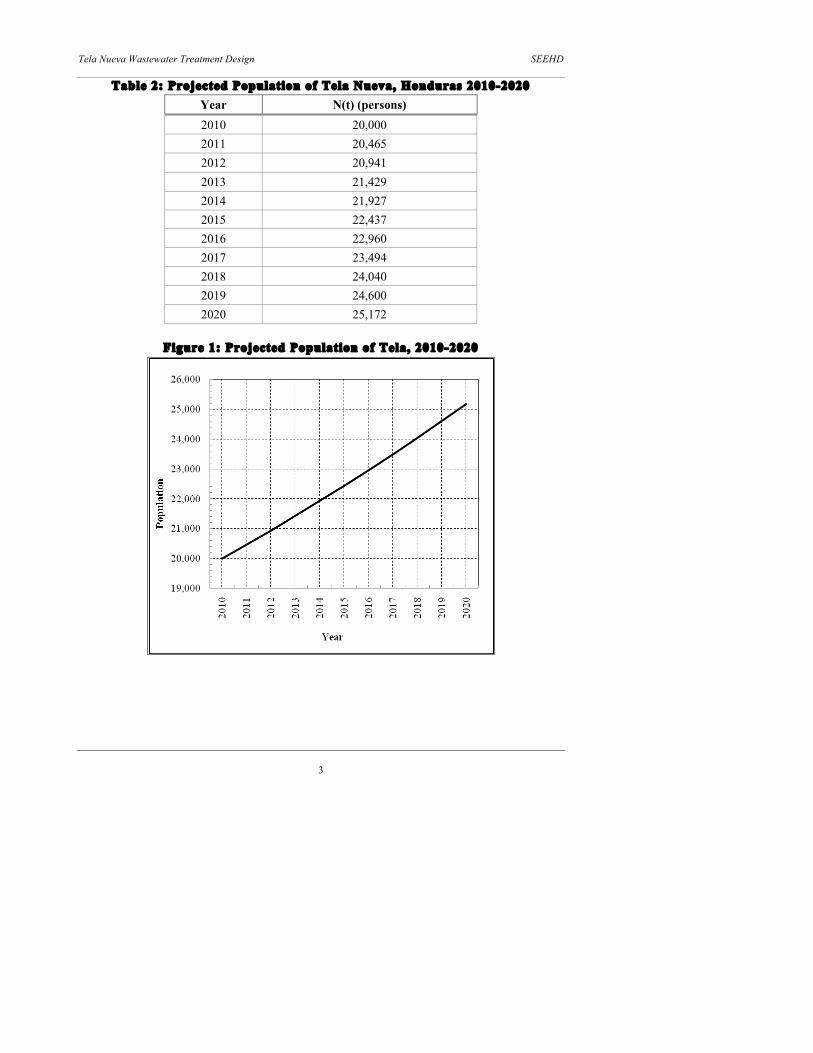
The proposed treatment system will provide wastewater treatment for an estimated 20,000 residents of Tela Nueva in 2010. The projected future population is presented in Figure 1 and Table 2.
Projected Population at Time t
Where:
Pt = projected population at time t, persons P0 = initial population in 2010, persons r = population growth rate, decimal % (CIA, 2008) t = time, years
Tela Nueva Wastewater Treatment Design SEEHD
3
Table 2: Projected Population of Tela Nueva, Honduras 2010-2020 Year N(t) (persons) 2010 20,000 2011 20,465 2012 20,941 2013 21,429 2014 21,927 2015 22,437 2016 22,960 2017 23,494 2018 24,040 2019 24,600 2020 25,172
Figure 1: Projected Population of Tela, 2010-2020

Tela Nueva Wastewater Treatment Design SEEHD
4
2.2 FLOW ESTIMATES
The proposed system is designed to provide wastewater treatment for Tela Nueva, which currently does not have any wastewater treatment system. It will be assumed that the population of Tela Nueva makes up half of the total population of Tela, and that the urban area of Tela is approximately 80 ha (See Figure 2). Since accurate data of water consumption is not available for Tela, an average water consumption value q = 150 L/person-day observed in Nicaragua is used for the proposed design (Pan American Health Organization, 2002).
Figure 2: Map of Tela, Honduras
Source: Infohn, 2007.
Since the treatment plant will be designed to treat the waste of the residents of Tela Nueva through 2020, it is assumed that the area used in infiltration calculations is I = 40 ha, or approximately half of the area of Tela (See Figure 3). Infiltration is calculated according to Mara (2003).

Tela Nueva Wastewater Treatment Design SEEHD
5
Figure 3: Urban Area of Tela, Honduras
Source: Infohn, 2007.
Average Flow Rate
According to Mara (2003), average flow rate may be calculated as follows:
Where:
Qavg = average flow rate, m3/day k = percentage of water excreted, % P2020 = projected population in 2020, persons q = water consumption, L/person-day I = infiltration of concrete pipes, m3/day
Maximum Flow Rate
Where:
Qmax = maximum flow rate, m3/day
Minimum Flow Rate
Flow data from five cities that are similar to Tela was used to create an experimental ratio R =
Qmax/Qmin = 5.6 to be used for the Tela Nueva treatment plant design (ECOMAC, 2004).
Tela Nueva Wastewater Treatment Design SEEHD
6
Where:
Qmin = minimum flow rate, m3/day
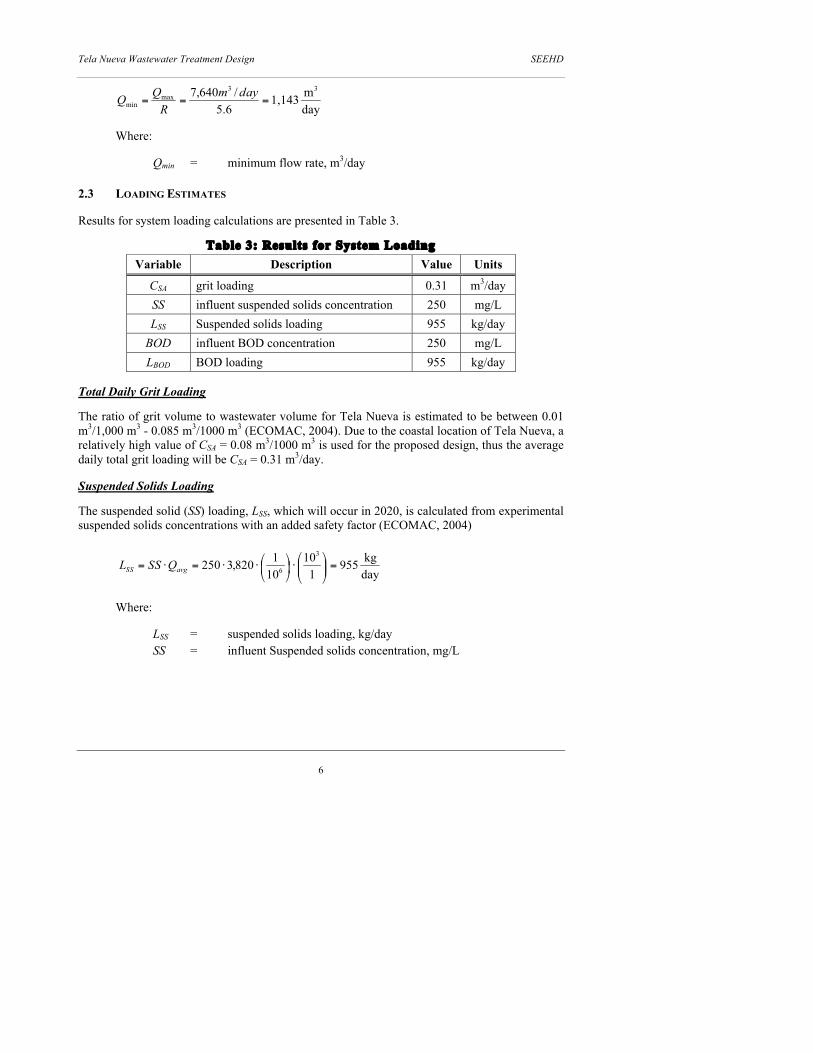
2.3 LOADING ESTIMATES
Results for system loading calculations are presented in Table 3.
Table 3: Results for System Loading Variable Description Value Units
CSA grit loading 0.31 m3/day SS influent suspended solids concentration 250 mg/L LSS Suspended solids loading 955 kg/day
BOD influent BOD concentration 250 mg/L LBOD BOD loading 955 kg/day
Total Daily Grit Loading
The ratio of grit volume to wastewater volume for Tela Nueva is estimated to be between 0.01 m3/1,000 m3 - 0.085 m3/1000 m3 (ECOMAC, 2004). Due to the coastal location of Tela Nueva, a relatively high value of CSA = 0.08 m3/1000 m3 is used for the proposed design, thus the average daily total grit loading will be CSA = 0.31 m3/day.
Suspended Solids Loading
The suspended solid (SS) loading, LSS, which will occur in 2020, is calculated from experimental suspended solids concentrations with an added safety factor (ECOMAC, 2004)
Where:
LSS = suspended solids loading, kg/day SS = influent Suspended solids concentration, mg/L

Tela Nueva Wastewater Treatment Design SEEHD
7
BOD Loading
The maximum biochemical oxygen demand (BOD) loading, which will occur in 2020, is calculated from experimental BOD concentrations with an added safety factor (ECOMAC, 2004).
Where:
LBOD = BOD loading, kg/day BOD = influent BOD concentration, mg/L

8
3.0 PRE-TREATMENT
3.1 PARSHALL FLUME
A proposed site layout is presented as Exhibit B, and a pre-treatment detail may be found in Exhibit C. Results for Parshall Flume calculations are presented in Table 4.
Table 4: Results for Parshall Flume Variable Description Value Units
W parshall flume throat width 0.23 m HA height of water at point A at the center of P.F. 0.205 m Z drop in invert 0.055 m
Hmax maximum upstream head in canal 0.33 m Cr -- 0.16 --
Parshall Flume Throat Width
It is recommended that the Municipality of Tela select a Parshall Flume with a throat width W = 0.23 m (9 in.) throat width. A total cost of approximately US$2,000 should be expected for installation and materials associated with Parshall Flume construction. A photograph of CSUC-SEEHD members installing a pre-fabricated Parshall Flume in Tela Vieja, Honduras is presented as Figure 4.
Figure 4: CSUC students installing a pre-fabricated Parshall flume

Tela Nueva Wastewater Treatment Design SEEHD
9
Height of Water at point A at the Center of the Parshall Flume
Where:
HA = height of water A at the center of the Parshall Flume, m
Maximum Upstream Head in Canal
Where:
HMax = maximum upstream head in canal, m
Cr
Drop in Invert
Where:
Z = drop in invert, m
3.2 GRIT CHAMBER
The grit chamber will consist of two stainless steel gated channels. This will allow for the grit chamber to be cleaned without shutting down the system, causing overflow. The depth of each grit chamber should allow for one week’s worth of grit accumulation, although actual cleaning of the grit chamber should be more frequent. Each grit chamber should be equipped with a 0.1016 m - 0.1524 m (4 in. – 6 in.) PVC pipe so that the channel may be drained for cleaning. The pipe

Tela Nueva Wastewater Treatment Design SEEHD
10
should be placed above the estimated depth of grit (Psa) with a screen over the pipe end so that solids do not clog the pipe.
A bypass channel should be placed upstream of the bar screen. In case of inadequate cleaning or precipitation, which causes the water height to rise above 0.5 m, the influent will overflow into the bypass channel. Workers should clean the grit chamber weekly so that the system functions properly. Results for Grit Chamber calculations are presented in Table 5. A proposed site layout is presented as Exhibit B, and a pre-treatment detail may be found in Exhibit C.
Table 5: Results for Grit Chamber Variable Description Value Units
vmax maximum velocity through grit chamber 0.3 m/s Pmax maximum water depth in grit chamber 0.28 m ad width of grit chamber 1.1 m Cv ratio of Vmin/Vmax 0.87 -- Csa ratio of grit volume to wastewater volume 0.08 m3/1000m3 vmin minimum velocity through grit chamber 0.26 m/s Lmin minimum length of grit chamber 13.5 m Lmax maximum length of grit chamber 15.7 m
L length of grit chamber 14 m -- grit chamber depth 0.14 m V volume of grit accumulated per 7-day week 2.14 m3/week
Psa depth of grit accumulated per 7-day week 0.14 m/week top Loading time 7 days
-- frequency of cleaning once every 4 days --
Maximum Water Depth in Grit Chamber
Where:
PMax = maximum water depth in grit chamber, m
Width of Grit Chamber
Tela Nueva Wastewater Treatment Design SEEHD
11
Where:
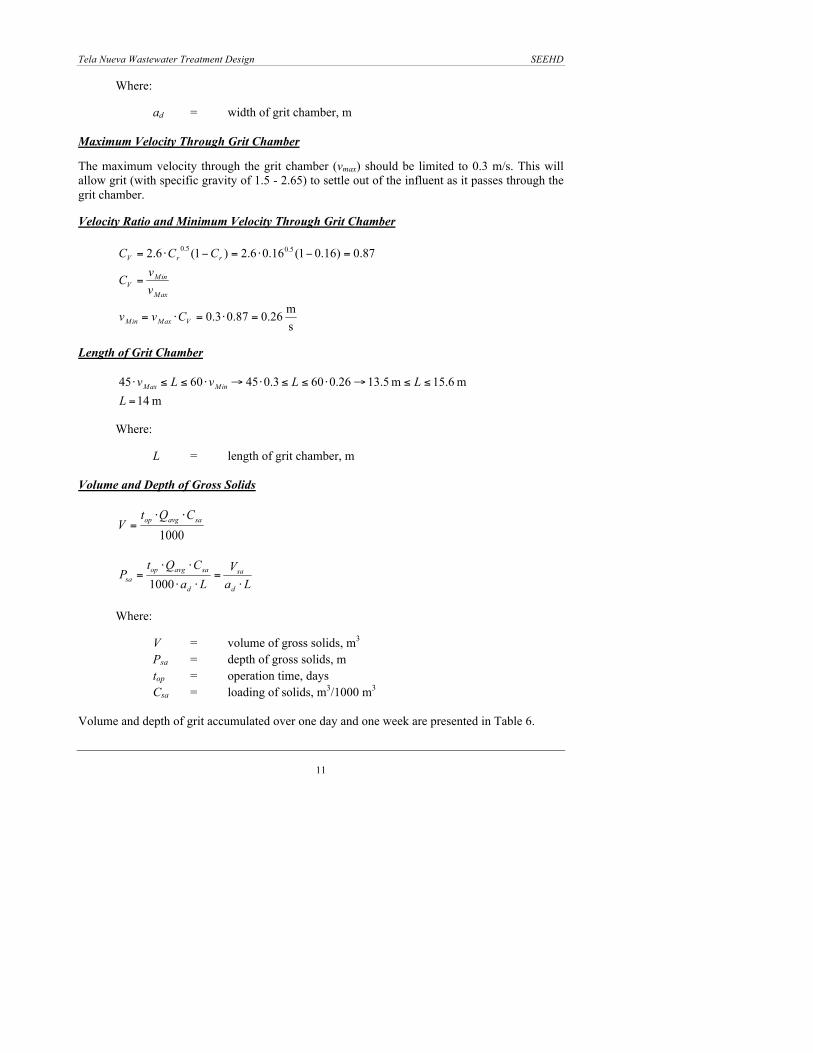
ad = width of grit chamber, m
Maximum Velocity Through Grit Chamber
The maximum velocity through the grit chamber (vmax) should be limited to 0.3 m/s. This will allow grit (with specific gravity of 1.5 - 2.65) to settle out of the influent as it passes through the grit chamber.
Velocity Ratio and Minimum Velocity Through Grit Chamber
Length of Grit Chamber
Where:
L = length of grit chamber, m
Volume and Depth of Gross Solids
Where:
V = volume of gross solids, m3
Psa = depth of gross solids, m top = operation time, days Csa = loading of solids, m3/1000 m3
Volume and depth of grit accumulated over one day and one week are presented in Table 6.

Tela Nueva Wastewater Treatment Design SEEHD
12
Table 6: Volume and Depth of Grit Accumulated
Time Volume Gross Solids Accumulated
Depth Gross Solids Accumulated
(days) (m3) (m)
1 0.31 0.02 7 2.14 0.14
3.3 BAR SCREEN DESIGN
A stainless steel or aluminum bar screen should be installed in the primary treatment system in order to prevent large solids from entering the pond system.
The bar screen should be cleaned daily so that the channel does not overflow. The contents cleaned off of the bar screen should be buried immediately, as it is likely that it will be contaminated with helminths and other pathogens. Proper bar screen cleaning procedures may be observed in Figure 5.Results for bar screen calculations are presented in Table 7. In addition, a proposed site layout is presented as Exhibit B, and a pre-treatment detail may be found in Exhibit C.
Figure 5: Proper bar screen cleaning procedures

Tela Nueva Wastewater Treatment Design SEEHD
13
Table 7: Results for Bar Screen Variable Description Value Units
ab bar width 10 mm eb bar spacing 50 mm db bar thickness (depth) 35 mm
acanal approach channel width 0.65 m Lcanal approach channel length 2 m
va approach velocity 0.5 m/s vR maximum velocity through barscreen 0.6 m/s hf head loss through barscreen 0.008 m
Width of Bars
Width of bars = ab = 10 mm
Distance Between Bars
Distance between bars = eb = 50 mm Thickness (Depth) of Bars
Depth of Bars = db = 35 mm Approach Channel Width
Where:
acanal = approach channel width, m
Velocity of Approach Channel

Tela Nueva Wastewater Treatment Design SEEHD
14
Where:
va = velocity of approach channel, m/s
Headloss Through Barscreen
The maximum velocity across the bar screen should be vR = 0.6 m/s.
Where:
hf = headloss through bar screen, m vR = maximum velocity across bar screen, m/s
g = gravity, m/s2

15
4.0 FACULTATIVE PONDS
There should be multiple inlets and outlets on each facultative pond in order to reduce short-circuiting of the system. Each of these inlets and outlets should be equipped with a weir so that the flow may be adjusted in order to ensure equal flow distribution throughout the ponds. Results of facultative pond calculations are presented in Table 8 and a proposed site layout is presented as Exhibit B.
Table 8: Results for Facultative Ponds Variable Description Value Units
RS minimum solar insolation in December 1.32E+08 kJ/ha-day CSMax maximum surface loading 261 kg O2/ha-day AF, Total total area of facultative ponds 36,590 m2
AF area of each facultative pond 18,295 m2 -- length to width ratio of facultative pond 2:1 -- LF length of each facultative pond 192 m WF width of each facultative pond 96 m DF depth of each facultative pond 1.8 m
AF, Bottom area of bottom of e ach facultative pond 15,440 m i slope of sides of facultative pond 3 --
VF volume of each facultative pond 30,448 m3 HRTF hydraulic retention time of facultative pond 16 days
4.1 SOLAR INSOLATION
Tela Solar insolation values (RS) are based on longitudinal and latitudinal location, and are presented as Table 9.

Tela Nueva Wastewater Treatment Design SEEHD
16
Table 9: 10 year Average Solar Radiation Data per month in Tela, Honduras Latitude 15.77° N Longitude 87.46° W
Month kJ/ha-day
January 1.43E+08 February 1.73E+08
March 2.06E+08 April 2.21E+08 May 2.14E+08 June 2.08E+08 July 2.04E+08
August 2.07E+08 September 1.92E+08
October 1.59E+08 November 1.43E+08 December 1.32E+08
Average 1.83E+08 Source: NASA, 2008
In order to add a safety factor to the design, the minimum monthly insolation value will be used in the pond design. Therefore:
RS = solar insolation in December, kJ/ha-day
Maximum Surface Loading
Monthly maximum surface loading values for the facultative pond are presented in Table 10 and shown graphically in Figure 6.
Where:
CSMax = maximum surface loading, kg O2/ha-day

Tela Nueva Wastewater Treatment Design SEEHD
17
Table 10: Maximum Surface Loading of Facultative Pond
Month Csm (kg O2/ha-day)
January 281.26 February 340.92
March 405.56 April 435.39 May 422.6 June 409.82 July 403.43
August 409.11 September 378.57
October 314.65 November 281.26 December 261.38 Average 362
Figure 6: 10-Year Monthly Average Surface Loading
0
50
100
150
200
250
300
350
400
450
500
Jan
Feb
Mar
Apr
May
Jun
Jul
Aug
Sept
Oct
Nov
Dec
Year
Popu
latio
n

Tela Nueva Wastewater Treatment Design SEEHD
18
4.2 POND SIZING
Total Area of Facultative Ponds
Where:
AF,Total = total area of facultative ponds, m2
Length and Width of Each Facultative Pond
A length to width ratio of 2:1 will be used for the facultative pond.
Where:
LF = length of each facultative pond, m WF = width of each facultative pond, m q = ratio of length to width
The depth of each facultative pond shall be DF = 1.8 m.
Area of Bottom of Each Facultative Pond
Where:
AF,Bottom= area of bottom of each facultative pond, m2
i = slope of sides of facultative pond
Volume of Each Facultative Pond
The volume may be determined using the equation for a trapezoid, and assuming a 3:1 slope (i) on the sides of the pond.

Tela Nueva Wastewater Treatment Design SEEHD
19
Where:
VF = volume of each facultative pond, m3
Hydraulic Retention Time
Where:
HRTF = hydraulic retention time, days
This hydraulic retention time is greater than the 10-day minimum WHO standard required to achieve helminth removal.

20
5.0 MATURATION POND
Results for maturation pond calculations are presented in Table 11 and a proposed site layout is presented as Exhibit B.
Table 11: Results for Maturation Pond
Variable Description Value Units HRTM hydraulic retention time of maturation pond 7 days
VM volume of maturation pond 26,740 m3 AM area of maturation pond 14,856 m2 DM depth of maturation pond 1.8 m -- length to width ratio of maturation pond 100:1 -- LM length of maturation pond 212 m WM width of maturation pond 70 m
LB, Total cumulative length of baffles 1,220 m NB number of baffles 6 -- LB individual baffle length 58 m WB width of channel between baffles 12.2 m
In order to ensure proper effluent quality, the maturation pond should have a length to width ratio greater than 50:1. This will be achieved using baffles, which will eliminate the problem of short-circuiting. For the treatment system in Tela, a 100:1 length to width ratio will be incorporated. The total length of the maturation pond will be three times the total width of the pond, although this may need to be adjusted depending on the site that is selected for the system. The depth of the maturation pond (DM) will be 1.8 m. Maturation pond baffles should be no more than 10 cm above the design water level so that they do not block sunlight, as displayed in Figure 7.
5.1 HYDRAULIC RETENTION TIME
The maturation pond should have a 7-day hydraulic retention time (HRTM).
5.2 POND SIZING
Volume of Maturation Pond
Where:
VM = volume of maturation pond, m3

Tela Nueva Wastewater Treatment Design SEEHD
21
Area of Maturation Pond
Where:
AM = area of maturation pond, m2
DM = depth of maturation ponds, m
Overall Length and Width of Maturation Pond
Where:
LM = overall length of maturation pond, m WM = overall width of maturation ponds, m
Length and Width of Maturation Pond Using Baffles
Where:
LB, Total = length of maturation pond using baffles, m WB = width of maturation ponds using baffles, m
Number of Baffles
Where:
NB = number of baffles

Tela Nueva Wastewater Treatment Design SEEHD
22
Figure 7: Properly Constructed maturation pond baffles

23
6.0 SLUDGE MANAGEMENT
Results of sludge management calculations are presented in Table 12 and a proposed site layout is presented as Exhibit B.
Table 12: Results for Sludge Management Variable Description Value Units
Sludge Production GES specific gravity of solids 1.82 -- GEL specific gravity of sludge 1.06 -- Msd mass of solids accumulated daily 955 kg/day Msy mass of solids accumulated yearly 234,900 kg/year VS-y volume of sludge accumulated per year 1,740 m3/year
Desludging Option 1 Option 2 P precipiation -- mm/month E evaporation -- mm/month IS infiltration for desludging 0 -- ke factor reducing evaporation of water 0.6 --
TS0 initial decimal percentage of total solids in sludge 0.16 0.20 -- TSf final decimal percentage of total solids in sludge 0.2 -- D0 initial optimal depth of sludge for drying 0.27 0.15 m DS final depth of dried sludge 0.171 0.095 m VFS volume of sludge accumulated per year (after drying) 2,640 1,467 m3/year tD time until desludging is required 3 5 years tS drying time of sludge 106 59 days LS cumulative length of on-site sludge storage piles 178.2 99 m AS area required for sludge storage 535 297 m2 -- desludging time 6.2 3.5 days
Using ECOMAC data detailed in the Executive Summary of this document, specific gravities of solids (GEs) and sludge (GEL) were found to be 1.82 and 1.06. The maximum average flow Qmax
= 3,820 m3/day is used for all sludge production calculations.
6.1 SLUDGE PRODUCTION
Mass of Solids Accumulated Daily and Yearly
Mass of solids accumulated daily:
Tela Nueva Wastewater Treatment Design SEEHD
24
Mass of solids accumulated yearly:
Assuming 35% of the total solids are fixed, 65% of the total solids are volatile, and 50% of the total volatile solids will be digested over time:
Volume of Sludge Accumulated Yearly
Where:
VS-y = volume of sludge accumulated per year, m3
ρH20 = density of water, kg/m3 TS0 = initial decimal percent of total solids in sludge, decimal %
6.2 DESLUDGING
The system should be designed so that flow to the multiple inlets may be stopped for desludging. This will allow for one pond to be in use at a time while the other pond is being desludged. In order to handle the increased flow during desludging of one pond, all channels should have a flow capacity of at least .
Optimal Time for Desludging
Precipitation and evaporation data from surrounding areas will be used in sludge drying calculations for Tela (see Table 13).

Tela Nueva Wastewater Treatment Design SEEHD
25
Table 13: Precipitation and Evaporation Data for Cuenca Cangrejal (1986 to 1996)
Month Temp Precipitation, P Evaporation, E E-P E-P (°C) (mm) (mm) (mm) (m/day)
January 24.1 281 87.4 -193.6 -6.45E-03 February 24.4 210.4 104.5 -105.9 -3.53E-03 March 25.4 247.6 133.1 -114.5 -3.82E-03 April 26.9 95.5 156.7 61.2 2.04E-03 May 27.8 45.3 160.7 115.4 3.85E-03 June 28.1 103 149.6 46.6 1.55E-03 July 27.3 119.6 155.3 35.7 1.19E-03 August 27.6 181.8 146.9 -34.9 -1.16E-03 September 27.1 217.7 120.3 -97.4 -3.25E-03 October 26.2 458.3 99.1 -359.2 -1.20E-02 November 25.3 442.8 83 -359.8 -1.20E-02 December 24.8 351.2 81.5 -269.7 -8.99E-03 Source: Departamento de Servicios Hidrológicos y Climatológicos, Secretaria de Recursos Naturales y Ambiente, Gobierno de Honduras.
As displayed in Table 13, April, May and June are the contiguous months with the maximum net evaporation, thus are the months where air drying the sludge in situ is the most feasible.
Desludging Options
Option 1: Allow sludge to dry to 16% total solid content before excavating.
Option 2: Allow sludge to dry to 20% total solid content before excavating.
Optimal Sludge Depth for Drying
The desired time period for desludging is sixty days with a thirty day safety factor. The ratio of actual evaporation to potential evaporation (ke) varies between 0.6 and 1.0. In order to add a safety factor for drying time, the minimum value ke = 0.6 is assumed for all calculations. The corresponding optimal depth of sludge for Options 1 and 2 may be observed in Figure 8 and Figure 9, and a photograph depicting sludge drying in the bottom of a facultative lagoon is presented as Figure 10.
.

Tela Nueva Wastewater Treatment Design SEEHD
26
Figure 8: Drying Time Versus Depth of Sludge for Option 1 (16% TS)
Figure 9: Drying Time Versus Depth of Sludge for Option 2 (20% TS)

Tela Nueva Wastewater Treatment Design SEEHD
27
Option 1:
It may be observed on Figure 8 that the optimal initial depth of sludge for drying is D0 = 0.27 m.
Option 2:
It may be observed on Figure 9 that the optimal initial depth of sludge for drying is D0 = 0.15 m.
Final Depth of Dried Sludge
Option 1:
Where:
DS = final depth of dried sludge, m D0 = initial depth of sludge, m
TS0 = initial decimal percentage of total solids, decimal % TSf = final decimal percentage of total solids, decimal %
Option 2:
Final Volume of Sludge Produced per Year After 90 Days Drying Time
Option 1:
Where:
VFS = final volume of sludge after 90 days drying time, m3
Option 2:

Tela Nueva Wastewater Treatment Design SEEHD
28
Drying Time of Sludge
It is assumed that there is no infiltration for sludge calculations.
Option 1:
Where:
tS = drying time of sludge, days (E-P)Min = minimum net evaporation in June, mm IS = infiltration, m3/day
Option 2:
Figure 10: Sludge drying in the bottom of a facultative lagoon

Tela Nueva Wastewater Treatment Design SEEHD
29
Time Until Desludging
Option 1:
Where:
= time until desludging, days
Option 2:
On-Site Storage Area Requirements
Sludge should be stored in piles with a base of three meters, a height of two meters, and a top width of one meter (see Figure 11). The cumulative length of on-site sludge storage piles for each pond in each desludging event (LTotal) is:
Option 1:
AS = total area required for sludge storage = 535 m2
Option 2:
AS = total area required for sludge storage = 297 m2

Tela Nueva Wastewater Treatment Design SEEHD
30
Figure 11: Sludge stored on-site in piles
Desludging Equipment
The minimum equipment required for desludging is one bulldozer, one excavator, and at least two dump trucks. Required equipment is displayed in Figure 12.

Tela Nueva Wastewater Treatment Design SEEHD
31
Figure 12: Required desludging equipment
Desludging Time
Facultative ponds may be desludged at an approximate rate of 425 m3/day. The time it takes to desludge the pond will largely depend on the volume and total dry solids in the sludge.
Option 1:
Option 2:
Yearly and Lifetime Cost of Desludging
The average cost of the removal of sludge from the Tela maturation pond in 2007 (including equipment, labor and transporting the equipment) was US$5/m3. Assuming an inflation rate of 6.3% (CIA, 2008), it is estimated that desludging in 2010 will cost US$6/m3. A relative comparison of one desludging event in 2010 for both ponds may be estimated as:

Tela Nueva Wastewater Treatment Design SEEHD
32
Option 1:
Option 2:
It is important to note that, although Option 1 is significantly more expensive than Option 2, desludging will be less frequent if Option 1 is selected, therefore evaluating the cost of desludging on the basis of one desludging event is misleading. Additionally, costs for transport of equipment (excavator, dump trucks) are not included in budget analyses. Lifetime cost estimates for desludging Option 1 and Option 2 are displayed in Table 14 and Table 15 (desludging years for each option are highlighted).
Table 14: Option 1 Desludging Cost
Year Sludge Volume Cumulative Volume Cost Total Cost (m3/yr) (m3) (US$/m3) (US%)
2010 2,640 2,640 6 2011 2,640 5,280 6 2012 2,640 7,920 7 2013 2,640 10,560 7 2014 2,640 13,200 8 128,995 2015 2,640 15,840 8
2016 2,640 18,480 9 2017 2,640 21,120 9 2018 2,640 23,760 10 2019 2,640 26,400 10 320,982 2020 2,640 29,040 11
2021 2,640 31,680 12 2022 2,640 34,320 12 2023 2,640 36,960 13 2024 2,640 39,600 14 558,872
Total: 561,751 1 Total Cost for Option 1 is calculated as follows (using values projected beyond the project lifetime that is in red italic text): 128,995+320,982+[(0.20)(558,872)] in order to account for five-year desludging event.

Tela Nueva Wastewater Treatment Design SEEHD
33
Table 15: Option 2 Desludging Cost
Year Sludge Volume Cumulative Volume Cost Total Cost (m3/yr) (m3) (US$/m3) (US%)
2010 2,640 2,640 6 2011 2,640 5,280 6 2012 2,640 7,920 7 76,105 2013 2,640 10,560 7
2014 2,640 13,200 8 2015 2,640 15,840 8 159,975 2016 2,640 18,480 9 2017 2,640 21,120 9
2018 2,640 23,760 10 194,347 2019 2,640 26,400 10 2020 2,640 29,040 11 2021 2,640 31,680 12 372,222
Total: 676,094 1 Total Cost for Option 2 is calculated as follows (using values projected beyond the project lifetime that is in red italic text): 76,105+159,975+194,347+[(0.66)(372,222)] in order to account for four-year desludging event.
It may be observed that, although the cost per desludging event is significantly less expensive for Option 2, the frequency of desludging makes Option 1 less costly on a lifetime basis.
Evaluation of Desludging Options
Various criteria for selecting the optimal desludging option are listed in Table 16. The favorable option for each specific criterion is highlighted.
Table 16: Evaluation of Desludging Options
Criterion Option 1 (16% TS) Option 2 (20% TS) Drying time of sludge 106 days 59 days Time until desludging 5 years 3 years On-site storage area requirements 535 m2 298 m2 Desludging time 6.2 days 3.5 days Cost of desludging both lagoons (in 2010)
US$ 31,608 US$ 17,604
Lifetime cost of desludging 2010-20201
US$ 561,751 US$ 676,094
1 Yearly sludge volume production in 2020 of 2,640m3 assumed throughout lifteme of project as safety factor. Inflation rate of 6.3% (CIA, 2008).

Tela Nueva Wastewater Treatment Design SEEHD
34
It may be observed in Table 16 that both Option 1 and Option 2 have numerous positive factors that may influence selection of the appropriate alternative. However, time until desludging and lifetime cost are the most important factors to consider, and it is known that the probability that desludging will occur every three years in a locale such as Tela is extremely low.
Based on these factors, Option 1 is selected for desludging.
Desludging Work Plan
Once the pond has been desludged, it is recommended that the pond initially be filled with clean water and flow to both ponds should resume until the following year when the second facultative pond should be cleaned.
During the removal of sludge, workers are at high risk of infection. The workers should be made aware of the pathogens they are being exposed to, as well as symptoms of infection. Contractors should develop a method of hygiene that includes the sanitary washing of heavy equipment, tools, boots, and clothes of workers. Workers should wear appropriate protection such as gloves boots, and eyewear. These precautions will not only help to decrease the risk of infection among workers, but will also reduce the possibility of transmission of excreta related illnesses to the general public.

35
7.0 EFFLUENT REUSE
7.1 AGRICULTURE REUSE
WHO Agriculture Reuse Guidelines
According to the World Health Organization (WHO), the primary aim of WHO Guidelines for the safe use of wastewater, excreta and greywater is to “maximize public health protection and the beneficial use of important resources. Wastewater may be used to irrigate agricultural crops while recycling nutrients in efforts to add further treatment to wastewater system effluent, increase household food security and nutrition in poor households. Wastewater is a year-round source of water that contains nutrients essential for agriculture. Water scarcity, health issues, and concerns about environmental effects have also increased the interest in wastewater use for agriculture (WHO, 2006).
Stringent conditions for wastewater treatment standards such as those mandated in the United States by the EPA are not realistic for developing countries. The World Health Organization updated 2006 standards more appropriately take into account sustainable practices and the national, sociocultural, economic, and environmental factors that come in to play when working in developing countries such as Honduras. The WHO standards are implementable in locations such as Tela because “overly strict standards may not be sustainable and, paradoxically, may lead to reduced health protection, because they may be viewed as unachievable under local circumstances and, thus, ignored (WHO, 2006).
According to the WHO, the principal driving forces of wastewater use in agriculture are:
• Increasing water scarcity and stress, and degradation of freshwater resources resulting from improper disposal of wastewater;
• Population increase and related increased demand for food and fibre; • A growing recognition of the resource value of wastewater and the nutrients it contains;
and • The Millennium Development Goals (MDGs), especially the goals for ensuring
environmental sustainability and eliminating poverty and hunger.
Wastewater contains a variety of pathogens that can survive in wastewater, on crops, or in the soil long enough to infect humans. The most significant health risks associated with the use of wastewater for irrigation in Tela are helminth, bacterial/viral, and protozoal infections as presented in Table 17. In places where no wastewater treatment is in place, helminths are usually the greatest health risk to workers and communities.

Tela Nueva Wastewater Treatment Design SEEHD
36
Table 17: Summary of Health Risks Associated with Wastewater Reuse in Agriculture
Group exposed
Helminth Infections Bacterial/virus infections
Protozoal infections
Consumers Significant risk of Ascaris infection for both adults and children with untreated wastewater
Cholera, typhoid and shigellosis outbreaks reported from use of untreated wastewater; seropositive responses for Heliobacter pylori (untreated); increase in non-specific diarrhoea when water quality exceeds 104 thermotolerant coliforms/100 ml
Evidence of parasitic protozoa found on wastewater-irrigated vegetable surfaces, but no direct evidence of disease transmission
Farm workers and their families
Significant risk of Ascaris infection for both adults and children in contact with untreated wastewater; risk remains, especially for children, when wastewater treated to <1 nematode egg per litre; increased risk of hookworm infection in workers
Increased risk of diarrhoeal disease in young children with wastewater contact if water quality exceeds 104 thermotolerant coliforms/100 ml; elevated risk of Salmonella infection in children exposed to untreated wastewater; elevated seroresponse to norovirus in adults exposed to partially treated wastewater
No data on transmission of protozoan infections during sprinkler irrigation with wastewater
Nearby communities
Ascaris transmission not studied for sprinkler irrigation but same as above for flood or furrow irrigation with heavy contact
Sprinkler irrigation with poor water quality (106-108 total coliforms/100ml) and high aerosol exposure associated with increased rates of infections; use of partially treated water (104-105 thermotolerant coliforms/100ml or less) in sprinkler irrigation not found to be associated with increased viral infection rates
Source: WHO, 2006.
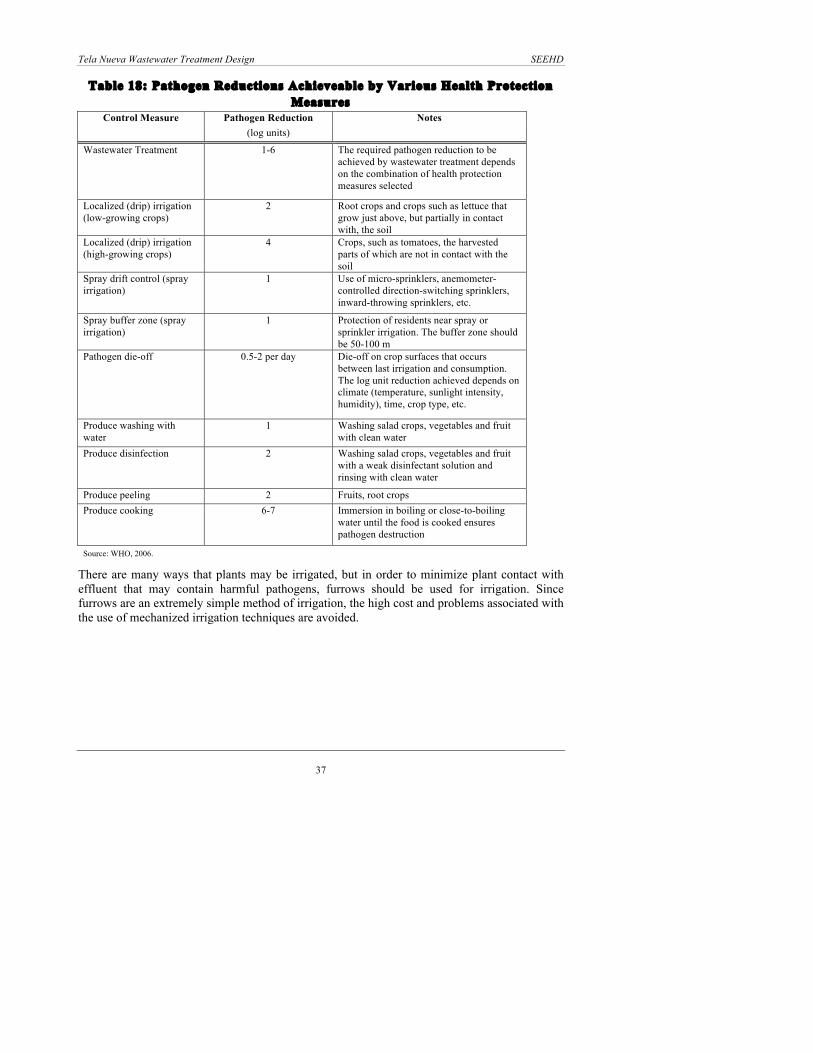
The WHO uses health-based targets to define a level of health protection that corresponds to a given hazard. The WHO has determined that a 6-7 log pathogen removal is adequate for wastewater reuse in slow-rate unrestricted design irrigation. Using the WHO guidelines, there are a variety of ways we may achieve a 6-7 log removal as presented in Table 18 and Figure 13.
Tela Nueva Wastewater Treatment Design SEEHD
37
Table 18: Pathogen Reductions Achieveable by Various Health Protection Measures
Control Measure Pathogen Reduction Notes (log units)
Wastewater Treatment 1-6 The required pathogen reduction to be achieved by wastewater treatment depends on the combination of health protection measures selected
Localized (drip) irrigation (low-growing crops)
2 Root crops and crops such as lettuce that grow just above, but partially in contact with, the soil
Localized (drip) irrigation (high-growing crops)
4 Crops, such as tomatoes, the harvested parts of which are not in contact with the soil
Spray drift control (spray irrigation)
1 Use of micro-sprinklers, anemometer-controlled direction-switching sprinklers, inward-throwing sprinklers, etc.
Spray buffer zone (spray irrigation)
1 Protection of residents near spray or sprinkler irrigation. The buffer zone should be 50-100 m
Pathogen die-off 0.5-2 per day Die-off on crop surfaces that occurs between last irrigation and consumption. The log unit reduction achieved depends on climate (temperature, sunlight intensity, humidity), time, crop type, etc.
Produce washing with water
1 Washing salad crops, vegetables and fruit with clean water
Produce disinfection 2 Washing salad crops, vegetables and fruit with a weak disinfectant solution and rinsing with clean water
Produce peeling 2 Fruits, root crops Produce cooking 6-7 Immersion in boiling or close-to-boiling
water until the food is cooked ensures pathogen destruction
Source: WHO, 2006.
There are many ways that plants may be irrigated, but in order to minimize plant contact with effluent that may contain harmful pathogens, furrows should be used for irrigation. Since furrows are an extremely simple method of irrigation, the high cost and problems associated with the use of mechanized irrigation techniques are avoided.

Tela Nueva Wastewater Treatment Design SEEHD
38
Figure 13: Examples of options for the reduction of pathogens by combinations of health protection measures
Source: WHO, 2006.
Wastewater treatment in a pond system similar to the one proposed for Tela will achieve a 3-4 log removal of pathogens, as is also known from experience with similar systems. In order to achieve the desired 6-7 log removal, we must integrate other methods into the system in order to grow crops suitable for human consumption. For further removal, unrestricted or restricted irrigation may be adopted. Restricted irrigation refers to the irrigation of all crops except salad crops and vegetables that may be eaten uncooked. Unrestricted irrigation refers to the irrigation of all crops. Including wastewater treatment, die-off, and furrows for irrigation, the desired 6-7 log removal will be achieved. Washing of the crop is also important, adding 1 log pathogen removal.
Other concerns in wastewater treatment are trace elements. In general, these contaminants are difficult or impossible to remove in a system such as the one proposed in this report. Moreover,

Tela Nueva Wastewater Treatment Design SEEHD
39
testing for many of these contaminants is expensive and impractical in a place like Tela. A system that will remove all of these contaminants is economically and logistically infeasible for the community, and, as discussed earlier, efforts to implement a more complicated system may have the effect of creating more risk for the community. However, while the main goals of treatment systems in a developing country are associated with pathogen reduction, it is important to keep these other risks in mind while designing a system because they may affect irrigation and plant health in wastewater reuse.
Some maximum concentrations of trace elements for agriculture reuse are shown in Table 19. According to Tchobanoglous and Burton (2001), when certain nutrients are too abundant for plants they can harm or even kill vegetation. Important nutrients to consider in agriculture reuse are N, Na, P. The nutrients K, Zn, B, and S may also be important to consider in some situations. Corresponding WHO Standards for chemical concentrations in vegetables are shown in Table 20.
Table 19: Maximum Concentrations of Trace Elements
Element Max Concentration Element Max
Concentration (mg/L) (mg/L)
Al 5 Mn 0.2
As 0.1 Mo 0
Be 0.1 Ni 0.2
Cd 0 Pb 5
Co 0.1 Se 0
Cr 0.1 Sn -
Cu 0.2 Ti -
F 1 W -
Fe 5 V 0.1
Li 2.5 Zn 2 Source: Wastewater Engineering, 2001.

Tela Nueva Wastewater Treatment Design SEEHD
40
Table 20: Standards for Chemical Concentrations in Vegetables Chemical Standard for Vegetablesa
(mg/kg)
Heavy Metals Arsenic 0.2 Cadmium 0.2 Lead 0.2 Methyl mercury NS Organics
Dioxinsb NS DDT, TDE NS PCBs NS NS, no standard a General Standard for leafy vegetable except for arsenic, which is fruit based. b Includes dioxins and other polychlorinated, co-planar aromatic compounds with similar properties.
Source: WHO, 2006.
Crop Selection
When selecting a crop, there are several factors that must be taken into account. A few of these are:
• Nutrient uptake capacity • Crop irrigation requirements • Climate • Crop salinity tolerance • Yield • Harvest months and frequency • Profitability
The leading cash crops grown in Honduras are fruits such as bananas and plantains (1,696,409 metric tons/year) and coffee (190,640 metric tons/year). Other important crops include sugarcane (5 million metric tons/year), cantaloupes and other melons, oranges, and oil palm fruit. The principal food crops are corn (470,000 metric tons/year), beans (75,000 metric tons/year), and rice (19,200 metric tons/year) (Encarta, 2008). The recommended crops for agriculture reuse in Tela may include bananas, coffee, pineapple, sugar cane, melons, corn, or beans (Encarta, 2008). Due to the lack of availability of crop-specific information, and the current market for crops as fuels, the crops analyzed for agricultural reuse in this design are sugar cane (Option 1) and corn (Option 2).

Tela Nueva Wastewater Treatment Design SEEHD
41
Estimated Nitrogen Uptake Needs
Option 1:
The estimated average nitrogen uptake for sugar cane can be estimated as U = 300 kg N/ha-year.
Option 2:
An estimated average nitrogen uptake for corn may be estimated as U = 225 kg N/ha-year (Beegle, 1999).
Growing Seasons
Growing seasons are from El Centro Panamericano de Ingeniería Sanitaria y Ciencias del Ambiente (CEPIS, 2005).
Option 1:
An estimated growing season for sugar cane is 10 months.
Option 2:
An estimated growing season for corn is 6 months.
Evapotranspiration and Precipitation Data
Precipitation, evaporation, and evapotranspiration data may be found in Table 21.
Leaching Factor and Salinity of Irrigation Water
Where:
ECdw = salinity of drainage water percolating below root zone, dS/m ECiw = salinity of irrigation water, dS/m LF = leaching fraction

Tela Nueva Wastewater Treatment Design SEEHD
42
Relative Crop Yield
Option 1:
The crop-specific incremental decrease in yield for sugar cane is 5.9 and the salinity threshold is 1.7 (Asano, 2007).
Where:
Y = relative crop yield, metric tons/ha b = crop-specific incremental decrease in yield, % per dS/m EC0 = salinity threshold of crop
Option 2:
The crop-specific incremental decrease in yield for sugar cane is 12.0 and the salinity threshold is 1.7 (Asano, 2007).
Hydraulic Loading Rate
Where:
Lw(i) = hydraulic loading rate, mm (ET-P)m = net evapotranspiration for month m, mm Ei = irrigation efficiency, decimal percent
Monthly Lw(i) values for sugar cane and corn are shown in Table 21. It may be observed that sugar cane (Option 1) would require approximately 3.7 m/year and corn (Option 2) would require approximately 8.9 m/year of irrigation in excess of net precipitation.

Wastewater Treatment Design SEEHD
43
Table 21: Monthly Average Precipitation and Evaporation (1986-1996) and Monthly Hydraulic Loading
Mon
th
Prec
ipita
tion,
P (m
m)
Eva
pora
tion,
E (m
m)
E-P
, (m
m)
Cro
p-sp
ecifi
c w
ater
req
uire
men
ts
for
suga
r ca
ne c
rop(
mm
)
Cro
p-sp
ecifi
c w
ater
req
uire
men
ts
for
corn
cro
p(m
m)
Exc
ess w
ater
req
uire
d (in
exc
ess
of (P
-E) f
or ir
riga
tion
of su
gar
cane
(m
m)
Exc
ess w
ater
req
uire
d (in
exc
ess
of (P
-E) f
or ir
riga
tion
of c
orn
(m
m)
LF Ei
Suga
r ca
ne L
w(i)
(mm
)
Cor
n L
w(i)
(mm
)
January 281 87.4 -193.6 300 600 106.4 406.4 0.2 0.8 160 610 February 210.4 104.5 -105.9 300 600 194.1 494.1 0.2 0.8 291 741 March 247.6 133.1 -114.5 300 600 185.5 485.5 0.2 0.8 278 728 April 95.5 156.7 61.2 300 600 361.2 661.2 0.2 0.8 542 992 May 45.3 160.7 115.4 300 600 415.4 715.4 0.2 0.8 623 1,073 June 103 149.6 46.6 300 600 346.6 646.6 0.2 0.8 520 970 July 119.6 155.3 35.7 300 600 335.7 635.7 0.2 0.8 504 954 August 181.8 146.9 -34.9 300 600 265.1 565.1 0.2 0.8 398 848 September 217.7 120.3 -97.4 300 600 202.6 502.6 0.2 0.8 304 754 October 458.3 99.1 -359.2 300 600 -59.2 240.8 0.2 0.8 361 November 442.8 83 -359.8 300 600 -59.8 240.2 0.2 0.8 360 December 351.2 81.5 -269.7 300 600 30.3 330.3 0.2 0.8 45 495
Annual 2,754 1,478 -1,276 3,600 7,200 2,324 5,924 3.7 m/yr 8.9 m/yr
Available wastewater = Qavg = 3,820 m3/day = 114,840 m3/month = 1,378,080 m3/year
Aw (sugar cane) = (1,378,080 m3/year)/(3.7m) = 372,454 m2/year = 37.3 ha/year
Aw (corn) = (1,378,080 m3/year)/(8.9 m) = 155,015 m2/year = 15.5 ha/year Source: Departeamento de Servicios Hidrologicos y Climatologicos, Secretaria de Recursos Naturales y Abiente, Gobierno de Honduras.

Tela Nueva Wastewater Treatment Design SEEHD
44
Hydraulic Loading Based on Nitrogen Limits
Option 1:
Where:
Lw(n) = hydraulic loading rate based on nitrogen limits, m/yr Cp = concentration of nitrogen in drainage water, mg/L (P-ET)a = precipitation - evapotranspiration, m/yr U = crop nitrogen uptake, kg/ha-yr f = fraction of applied nitrogen in irrigation water, mg/L Cn = concentration of nitrogen in irrigation water, mg/L
Since Lw(n) is the greater of the two hydraulic loading values for sugar cane, Lw(n) = 8.6 m/year will govern the design for Option 1.
Option 2:
Since Lw(i) is the greater of the two hydraulic loading values for corn, Lw(i) = 9.6 m/year will govern the design for Option 2.
Agriculture Reuse Land Area Requirements
Option 1:
Where:
AW = agriculture reuse land area requirements, ha LW = irrigation design hydraulic loading rate, m/yr
Option 2:
Tela Nueva Wastewater Treatment Design SEEHD
45
The projected land requirement for use of all of the effluent for agricultural reuse greatly exceeds the amount of agricultural land available in Tela. A portion of effluent may be used for other methods of sustainable reuse such as aquaculture. Excess effluent may be discharged into the river.
Storage Requirements
Option 1:
Where:
VW = storage requirements, m3/month
Option 2:
Potential Gross Annual Revenue from Sale of Crops
Option 1:
According to CEPIS (2005), the cost of sugar cane is US$20/ha, and the yield is 170 metric tons/ha.
Where:
RCrop = gross revenue from sale of crops, US$/ha-harvest CCrop = cost of crop,US$/ha YCrop = yield, metric tons/ha AW = irrigation area, ha
Option 2:
According to Agweb (2008), the cost of corn is currently approximately $3.50 per bushel, with 56 lbs corn/bushel (UNC, 2008).

Tela Nueva Wastewater Treatment Design SEEHD
46
It should be noted that the cost of corn is relatively high at this time because of the increased production of ethanol. Depending on the future of ethanol as a fuel commodity, this price could be somewhat more variable (thus possibly more profitable) than other crops.
7.2 AQUACULTURE REUSE
WHO Aquaculture Reuse Guidelines
The main objectives of the WHO aquaculture reuse guidelines are to maximize public health protection and the beneficial use of important resources. In order to meet these goals, the adverse health impacts of waste-fed aquaculture must be weighed against the environmental and health benefits of reuse practices. Evaluation of these tradeoffs can be complicated, so “wherever waste-fed aquaculture contributes significantly to food security and nutritional status, the point is to identify associated hazards, define the risks they represent to vulnerable groups and design measures aimed at reducing these risks” (WHO, 2006).
The Guidelines provide an “integrated preventive management framework for safety applied from the point of waste generation to the consumption of products grown with wastewater and excreta” (WHO, 2006). Minimum requirements which will reasonably protect the health of people consuming or using waste-fed aquaculture are described in order to delineate health-based targets. These health-based targets are not mandatory, which allows local or national authorities in a given area to adapt the conditions to their local cultural, environmental, health and economic conditions. The flexibility found in the guidelines allows for more possibilities in implementation of wastewater reuse for aquaculture.
The WHO follows the Stockholm Framework for establishing guidelines for safe reuse of wastewater in aquaculture. This approach integrates “risk assessment and risk management to control water-related diseases… in terms of water- and sanitation-related microbial hazards” (WHO, 2006). Examples of hazards associated with waste-fed aquaculture are displayed in Table 22. WHO Standards for chemical concentrations in fish are shown in Table 23.

Tela Nueva Wastewater Treatment Design SEEHD
47
Table 22: Examples of Hazards Associated with Waste-Fed Aquaculture
Hazard Exposure Route Relative Importance Comments
Excreta-Related Pathogens Bacteria (E. coli, Vibriocholerae, Salmonella spp., Shigellaspp.)
Contact, Consumption
Low - Medium
Concentrations of bacteria are always high in the gut. Cross-contamination from gut contents to edible flesh during cleaning is the greatest risk. Hygenic processing and cooking reduce the risk. Poor personal hygiene after wastewater/excreta contact will increase the risk of infection/disease.
Helminths Soil-transmitted (Ascaris, hookworms, Taeniaspp.)
Contact, Consumption
Low - High Risk depends on how wastewater and excreta are handled, if shoes are worn, etc. Risks are probably higher for plant producers or consumers than for fish producers or consumers.
Trematodes (Clonorchis, Opisthorchis, Fasciola, Schistomsoma)
Contact, Consumption
Nil - High Foodbornetrematodes and schistosomes are present only in certain geographic regions and require suitable intermediate hosts. Foodbornetrematodes present risk where they are endemic and fish or plants are often eaten raw. Animals may serve as reservoirs, and thus they can be difficult to eliminate. Schistosomiasis is transmitted through water contact in endemic areas.
Protozoa (Giardiaintestinalis, Cryptosproidium, Entamoebiaspp.)
Contact, Consumption
Low - medium
Same comments as for bacteria.
Viruses (hepatitis A virus, hepatitis E virus, adenovirus, rotavirus, norovirus
Contact, Consumption
Low - medium
Same comments as for bacteria.
Vector-borne pathogens (Plasmodium spp., dengue virus, Wuchereriabancrofti)
Vector contact Nil - medium
Limited to geographical areas where disease is endemic and suitable vectors are present. No specific risk associated with aquaculture but certain culicine vectors of filariasis breed in organically polluted water.
Chemicals Heavy metals (arsenic, cadmium, lead, mercury)
Consumption Low Mercury may bioaccumulate in long-lived fish, but most fish produced in waste-fed aquaculture are harvested young. Pond water quality typical of waste-fed systems also reduces the uptake of mercury by fish and plants. Other heavy metals also may accumulate in fish or aquatic plants but rarely to levels considered unsafe.
Source: WHO, 2006.

Tela Nueva Wastewater Treatment Design SEEHD
48
Table 23: Standards for Chemical Concentrations in Fish
Chemical Standard for fish and fish products
Heavy Metals (mg/kg)
Arsenic NS Cadmium 0.05-1.0 Lead 0.2 Methyl mercury 0.5-1.0 Organics Dioxinsb 0.000 004
DDT, TDE 5 PCBs 2 NS, no standard a General Standard for leafy vegetable except for arsenic, which is fruit based. b Includes dioxins and other polychlorinated, co-planar aromatic compounds with similar properties.
Source: WHO, 2006.
Primary risks of waste-fed aquaculture to product consumers are “associated with trematode parasites where they are endemic; other excreta-related pathogens in the gut contents or on the surfaces of fish or plants; and toxic chemicals in the fish flesh or edible plant parts” (WHO, 2006).
The quality of fish grown in wastewater-fed ponds should be assessed by the bacterial count per gram of fish muscle (Mara, 2003). For numbers of total aerobic bacteria and E. coli, the quality of fish should be interpreted as displayed in Table 24.
Table 24: Quality of Fish grown in Wastewater-Fed Ponds
Plate Count Quality
0-10 per g (‘standard plate count’) Very good 11-30 per g Medium 31-50 per g Poor >50 per g Unacceptable
‘Very good’ quality fish may possibly be used as human food, ‘medium quality’ may be used in animal food or a similar product, and ‘poor’ or ‘unacceptable’ could be used as fertilizer or for some other product that will allow for a further pathogen removal safety factor. WHO microbial quality targets for waste-fed aquaculture are displayed in Table 25.

Tela Nueva Wastewater Treatment Design SEEHD
49
Table 25: Microbial Quality Targets for Waste-Fed Aquaculture Media Viable Trematode eggs1 E. coli Helminth eggsc
(number/100 ml or /g total solids) (arithmetic mean number /100 ml or /g total solidsa,b)
(arithmetic mean number/L or /g total
solidsa,d)
Product consumers
Pond water ND < 104 < 1
Wastewater ND < 105 < 1
Treated excreta ND < 106 < 1 Edible fish flesh or plant parts
Infective metacercariae (presence or absence per fish or
plant) not detectable or non-infective
Codex Alimentarius Commision
Specificationse
Not detectable
Aquacultural Workers and Local Communities
Pond water NDe < 103 < 1
Wastewater NDe < 104 < 1
Treated excreta NDe < 105 < 1 1 Includes schistosome eggs where relevant a Excreta is measured in grams of total solids (i.e. dry weight); 100 ml of wastewater/excreta contains approximately 1-4 g of total solids. b An arithmetic mean should be determined throughout the irrigation season. For pond water and product consumers, for example, the mean values of < 104E. coli per 100 ml should be obtained for at least 90% of samples in order to allow for the occasional high-value samples (i.e. with 105 or 106 E. Coli per 100 ml). c Applicable when emergent aquatic plants are grown and when there is high contact with wastewater, excreta, contaminated water or contaminated soils. d An arithmetic mean should be determined throughout the irrigation season. The mean value of < 1 egg per litre should be obtained for at least 90% of samples in order to allow for the occasional high-value sample (i.e. with > 10 eggs per litre). e The Codex AlimentariusCommision does not specify microbial qualities for fish flesh or aquatic plants; rather, it recommends the adoption of hazard analysis and critical control point (HACCP) principles as applied from production to consumption. f Viable schistosome eggs where relevant.
ND = Not detectable Source: WHO, 2006.
Health protection measures against trematodes in waste-fed aquaculture are displayed in Figure 14. Details for numbered health protection measures from Figure 14 are presented as Table 26.

Tela Nueva Wastewater Treatment Design SEEHD
50
Figure 14: Health Protection Measures Against Trematodes
Source: WHO, 2006.

Tela Nueva Wastewater Treatment Design SEEHD
51
Table 26: Health Protection Measures Against Trematodes Sources of Hazards Human/ animal excreta 1. Treat wastes by storage for >30 days prior to addition to the
pond. 2. Prevent deliberate and accidental fecal contamination through
surface runoff and household latrines connected to ponds. Replace overhanging fish pond latrines with safer sanitation facilities.
3. Keep animals away from ponds. 4. Treat infected humans and other animals with appropriate
medication. Wastewater 5. Treat wastewater by adequate methods to remove or inactivate
trematode eggs. Animal reservoirs 3. Keep animals (e.g. cats, dogs) away from ponds. 4. Treat infected domestic animals with appropriate medication.
6. Dispose of raw fish remains after cleaning so that animals cannot access them.
Intermediate hosts (Snails)
7. remove vegetation from ponds and pond surroundings.
Infected fingerlings 8. Use other snail control techniques as appropriate. 9. Prevent fecal contamination of fingerling production ponds. Contaminated fish 10. Process fish feed to inactivate trematode metacercariae. feed 11. Use non-infected fish to produce fish feed. Post-harvest controls
Cooking 12. Cook fish or plants thoroughly prior to consumption. 13. Clean knives and other utensils carefully to remove any eggs,
which tend to adhere to such surfaces. Hygiene 14. Wash hands thoroughly after handling and cleaning fish. Health promotion 15. Educate children and communities at risk about parasite life
cycles and how to prevent infection. Food processing 16. Fish or plants may be processed at home or commercially with
heat, acid, salt, irradiation, freezing, drying or combinations of these processes to inactivate infective trematode metacercariae.
Fish and plant inspection
17. Fish and plants in the market should be periodically inspected to indicate contamiation problems and trigger implementation of health protection measures by local health authorities.
Source: WHO, 2006.
ECOMAC data on systems with similar design as this one for Tela Nueva may be found in the Executive Summary of this document. These data show that with proper design, an aquaculture

Tela Nueva Wastewater Treatment Design SEEHD
52
pond could be successfully implemented into the Tela Nueva sustainable wastewater treatment system.
Area of Aquaculture Pond Based on Nitrogen Requirements
Where:
Aaqua,N = area of aquaculture pond by nitrogen requirements, m2 CN = concentration of nitrogen in effluent, mg/L CN,max = maximum nitrogen tolerated by aquaculture, kg N/ha
Area of Aquaculture Pond Based on BOD Requirements
Where:
Aaqua,BOD = area of aquaculture pond based on BOD5 requirements, ha CBOD = concentration of BOD5 in effluent, mg/L CBOD,Max = maximum BOD5 tolerated by aquaculture, kg BOD5/ha-day
Area of Aquaculture Pond
Since nitrogen requires a greater area than BOD5 loading, nitrogen governs the aquaculture pond design, and Aaqua = 117,500 m2 = 12 ha.
Depth of Aquaculture Pond
The depth of the aquaculture pond should be greater than 1.5 m to allow fish to swim without conflicting with plant growth. It is recommended that the Tela aquaculture pond has a depth of two meters (Mara, 2003).
Fish Yield
According to Mara (2003), a maximum of eight metric tons per hectare-year of fish may be produced, and approximately 30% of the yield will not survive for various reasons. Therefore it was estimated that 67 metric tons of fish may be produced per year. This will result in aquaculture revenue of approximately US$201,000/year.

Tela Nueva Wastewater Treatment Design SEEHD
53
Hydraulic Retention Time in Aquaculture Pond
Where:
HRTaqua = hydraulic retention time in aquaculture pond, days Daqua = depth of aquaculture pond, m e = (∑ (E-P)year)/365 = net evaporation rate, mm/day
It is also important to monitor the ammonia levels in the pond. It the concentration of free ammonia is high it will poison the fish. The concentration of nitrogen influent is estimated to be 37.5 mg/l. The current system is estimated to have an average temperature of 25 degrees Celsius and a pH of 7.5. According to Mara (2003), the concentration of the total ammonia in the facultative pond effluent may be calculated using this information.
Concentration of Total Ammonia in Effluent (T = 25 °C)
Where:
Ce = concentration of total ammonia in effluent, mg/L Ci = concentration of total ammonia in influent, mg/L pH = activity of dissolved hydrogen

Tela Nueva Wastewater Treatment Design SEEHD
54
Percentage of Free Ammonia
Where:
pNH3 = percentage free ammonia pKa = acid dissociation constant T = temperature, °C
Maximum Expected Values of Free Ammonia in Aquaculture Ponds
For a pH of 7.0 and a temperature of 25°C, the maximum percentage of free ammonia in the aquaculture pond is 0.566 (Mara, 2003). Therefore there is no possibility of ammonia toxicity in the design.

55
REFERENCES
Agweb, Monthly Continuation Chart, US Grains: Corn, <http://www.agweb.com>, November, 2008.
APHA (American Public Health Association), Standard Methods for the Examination of Water and Wastewater, 18th Edition, America Public Health Association, Washington D.C., 1992.
Asano, T., et. al., Water Reuse: Issues Technologies, and Applications, Metcalf & Eddy, McGraw-Hill, 2007.
Cámara Hondureña de la Industría de la Construcción, Lista de Precios de Alquiler de Equipo en San Pedro Sula, Mes de Junio, pp. 60, 2006.
CEPIS (Centro Panamericano para Ingeniería Sanitaria), Uso de Aguas Residuales Tratadas en Cultivos: Relacion de Cultivos Temporalescf, 2005.
CIA, The World Factbook – Honduras, Central Intelligence Agency, <https://www.cia.gov/library/publications/the-world-factbook/geos/ho.html>, November 2008.
CSUC-SEEHD (California State University Sustainable Engineering and Environmental Health for Development), Sustainable Wastewater Treatment and Reuse, Tela Honduras, 2006.
Departamento de Servicios Hidrologicos y Climatologicos, Secretaria de Recursos Naturales y Abiente, Gobierno De Honduras.
ECOMAC, Informes de Monitoreo: Lagunas de Estabilización en Honduras, (11 Volumenes) Proyecto Monitoreo de Sistemas de Estabilización de Tratamiento de Aguas Negras, Department of the Army, U.S. Army Corps of Engineers, Mobile District, Tegucigalpa, 2004.
Encarta Microsoft® Online Encyclopedia 2008, Honduras, <http://encarta.msn.com>, November 2008.
CSUC-SEEHD, Sustainable Wastewater Treatment and Reuse: Tela, Honduras, 2006.
Pan American Health Organization, Health in the Americas, 2002 Edition, Vol. I, World Health Organization Press, 2002.
Beegle, D., and Durst, P., Nitrogen Fertilization of Corn, College of Agricultural Sciences Cooperative Extension, The Pennsylvania State University, 1999.
Infohn, Honduras Digital, <http://www.infohn.com/tela/>, November, 2008.
Mara, D., Domestic Wastewater Treatment in Developing Countries, Earthscan, London, 2003.
NASA, Monthly Averaged Insolation Incident On A Horizontal Surface, Surface Meteorology and Solar Energy, <http:eosweb.larc.nasa.gov/cgi-bin/sse/grid.cgi?uid=0>, May 2008.
Oakley, S., Manual de Diseno, Construccion, Operacion y Mantenimiento, Monitoreo y Sostenibilidad, USAID, fhis, RRAS-CA, June 2005.

REFERENCES (CONTINUED)
56
Tchobanoglous, G. and Burton, F., Wastewater Engineering: Treatment, Disposal, and Reuse, Metcalf & Eddy. McGraw-Hill Inc., 2001.
WHO, The Safe Use of Wastewater, Excreta, and Greywater, Volume II: Wastewater Use in Agriculture, World Health Organization Press, 2006.
WHO, The Safe Use of Wastewater, Excreta, and Greywater, Volume III: Wastewater and Excreta Use in Aquaculture, World Health Organization Press, 2006.
UNC (University of North Carolina), U.S. Commercial Bushel Sizes, <http://www.unc.edu/~rowlett/units/scales/bushels.html>, November 2008.

EXHIBITS