Tel.: 47 73 90 40 00 - NGU · Tel.: 47 73 90 40 00 Telefax 47 73 92 16 20 REPORT Report no.:...
62
Geological Survey of Norway N-7441 Trondheim, Norway Tel.: 47 73 90 40 00 Telefax 47 73 92 16 20 REPORT Report no.: 2004.019 ISSN 0800-3416 Grading: Open Title: Results of analytical tests on FFI 2003 sediment cores Authors: Aivo Lepland Client: NGU, FFI County: Commune: Map-sheet name (M=1:250.000) Map-sheet no. and -name (M=1:50.000) Deposit name and grid-reference: Number of pages: 63 Price (NOK): 85,- Map enclosures: Fieldwork carried out: Date of report: 20.03.2004 Project no.: 294800 Person responsible: Summary: Seven gravity cores collected by FFI in the summer of 2003 have been profiled with the X-ray inspection system (XRI) and logged for P-wave velocity, bulk density and magnetic susceptibility using multi-sensor core logger (MSCL). Sediment cores were opened after these non-destructive analyses, sedimentologically described and undrained shear strength was measured on selected intervals. The cores were also subsampled for determining water content, wet density, dry density and grain-size characteristics. Keywords: Marine geology Seabed sediments Sedimentology Grain size Sediment density Geotechnical properties Physical properties
Transcript of Tel.: 47 73 90 40 00 - NGU · Tel.: 47 73 90 40 00 Telefax 47 73 92 16 20 REPORT Report no.:...

Geological Survey of NorwayN-7441 Trondheim, Norway Tel.: 47 73 90 40 00 Telefax 47 73 92 16 20 REPORT
Report no.: 2004.019 ISSN 0800-3416 Grading: Open
Title:
Results of analytical tests on FFI 2003 sediment cores
Authors:
Aivo Lepland Client:
NGU, FFI
County: Commune:
Map-sheet name (M=1:250.000) Map-sheet no. and -name (M=1:50.000)
Deposit name and grid-reference: Number of pages: 63 Price (NOK): 85,- Map enclosures:
Fieldwork carried out: Date of report:
20.03.2004Project no.:
294800Person responsible:
Summary:
Seven gravity cores collected by FFI in the summer of 2003 have been profiled with the X-ray
inspection system (XRI) and logged for P-wave velocity, bulk density and magnetic susceptibility using
multi-sensor core logger (MSCL). Sediment cores were opened after these non-destructive analyses,
sedimentologically described and undrained shear strength was measured on selected intervals. The cores
were also subsampled for determining water content, wet density, dry density and grain-size
characteristics.
Keywords: Marine geology Seabed sediments Sedimentology
Grain size Sediment density Geotechnical properties
Physical properties

CONTENTS
1 INTRODUCTION AND MATERIALS ............................................................................ 4
2 METHODS AND RESULTS............................................................................................. 4
2.1 X-ray inspection system (XRI) .................................................................................. 4
2.2 Multi sensor core logger (MSCL) .............................................................................. 5
2.2.1 Gamma ray density............................................................................................. 5
2.2.2 Magnetic susceptibility ...................................................................................... 6
2.2.3 P-Wave velocity ................................................................................................. 6
2.3 Lithostratigraphic description .................................................................................... 7
2.4 Grain-size analyses..................................................................................................... 7
2.5 Determination of geotechnical and physical properties of sediments........................ 8
2.5.1 Undrained shear strength.................................................................................... 8
2.5.2 Water content, wet density and dry density ....................................................... 8
FIGURES
Fig. 1. Ternary plot of all grain size analyses. Upper diagram is a close-up of the plot area
with the majority of data points (bordered by red lines).
Fig. 2. Correlation diagram for MSCL bulk density and wet density, obtained by determining
the weight of known sample volume. Solid line shows the expected correlation; dashed
line indicates the offset of 0.3 g/cm3.
APPENDIX
Appendix 1. Stratigraphic profiles of X-ray images (XRI), P-wave velocity, bulk density,
magnetic susceptibility, water content, wet density, dry density, undrained shear
strength, and median grain size.
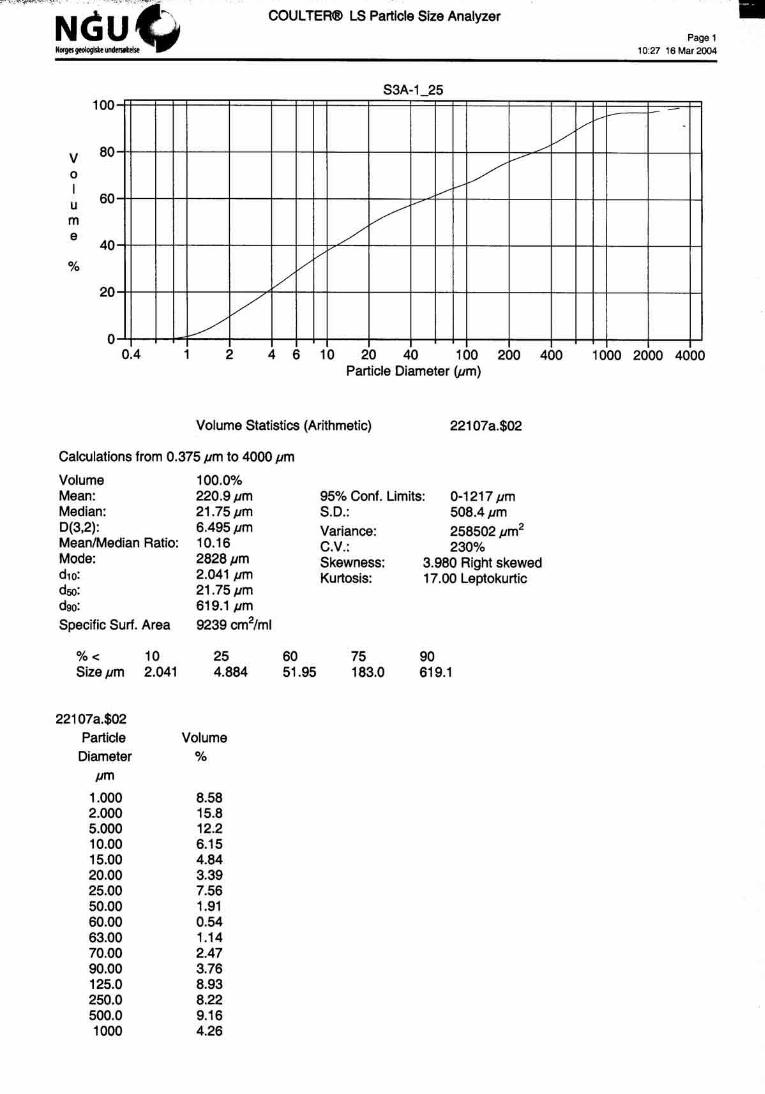
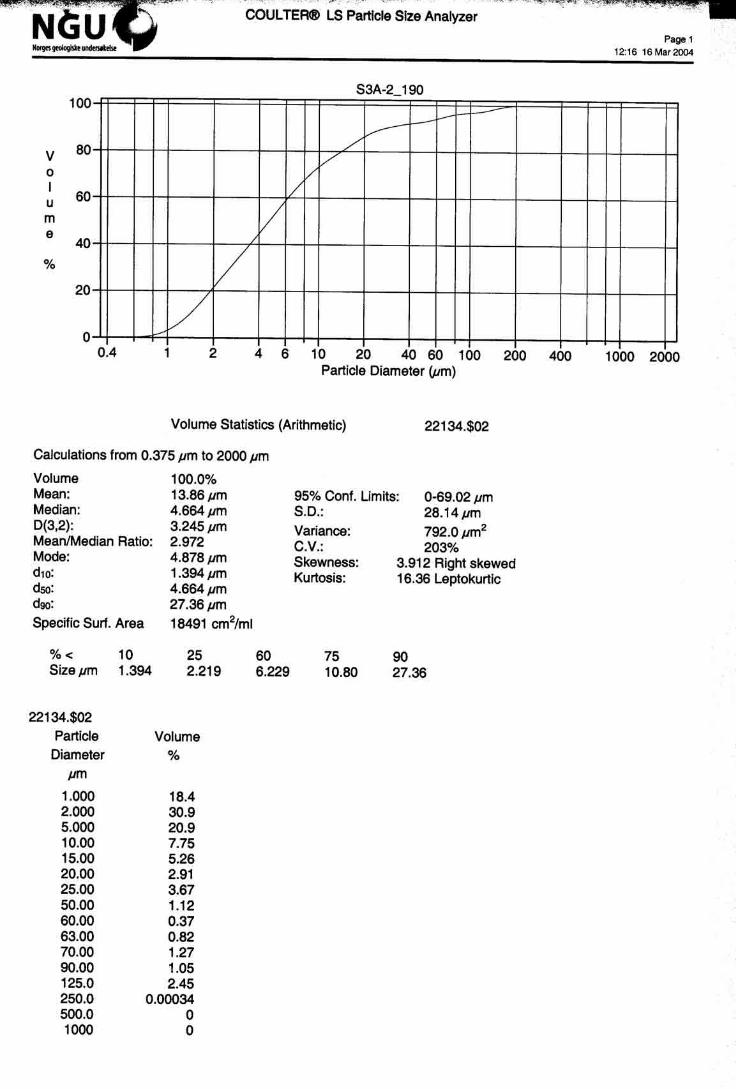
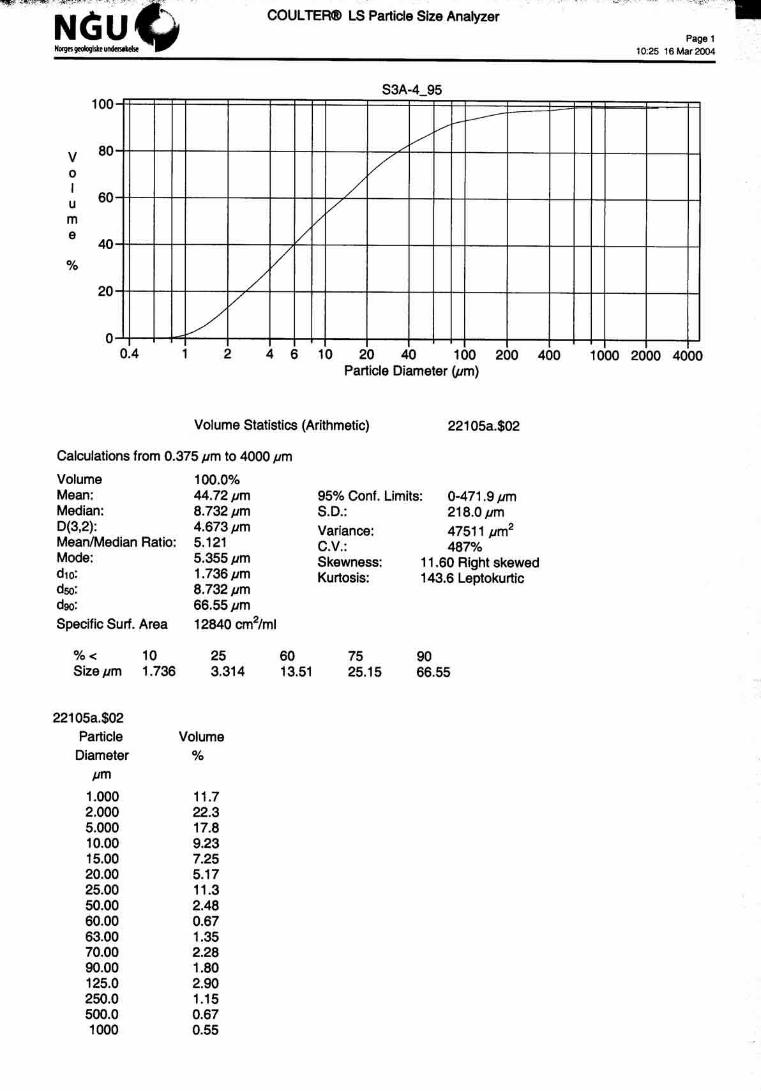
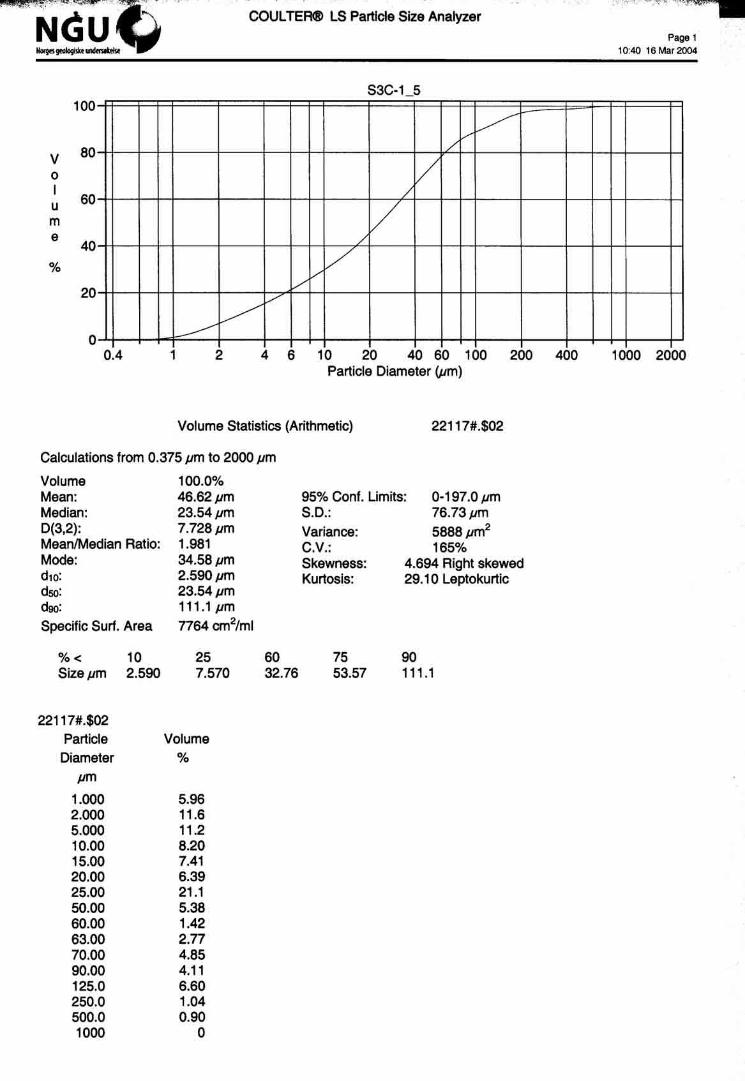
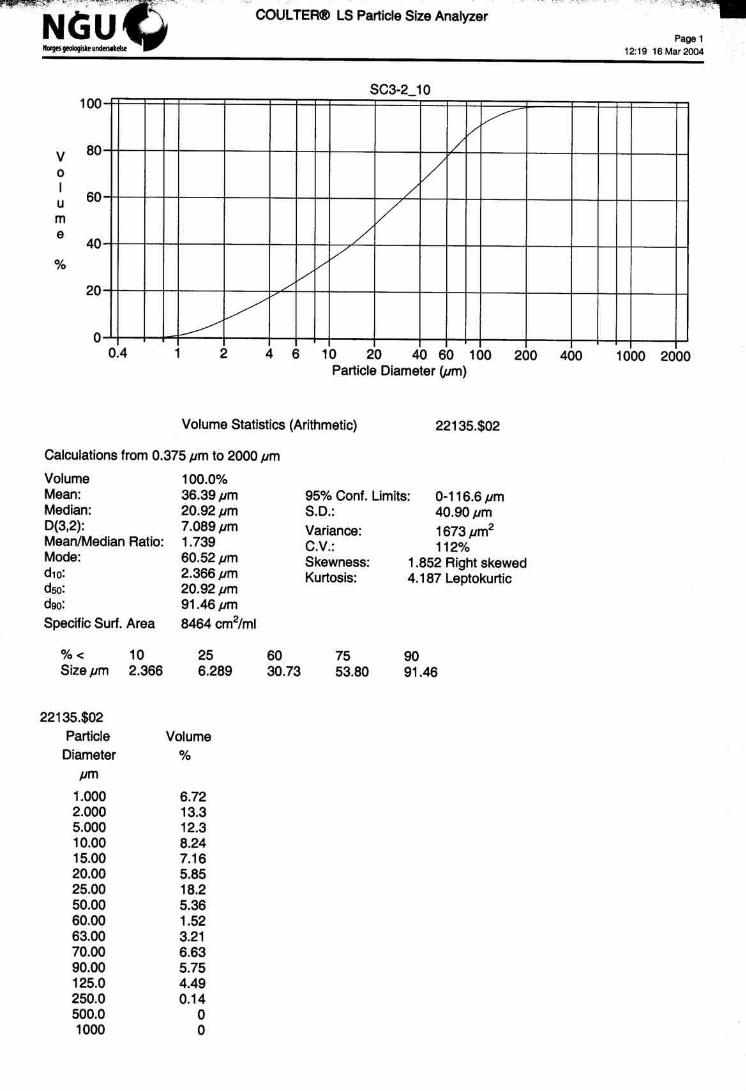
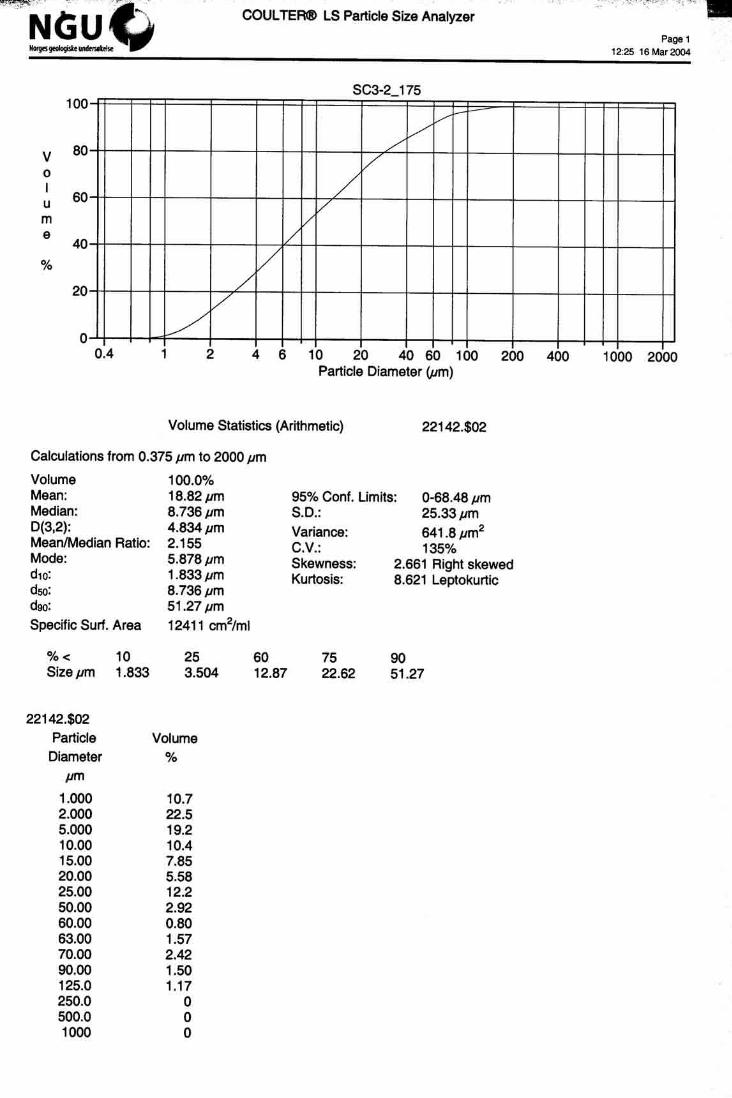
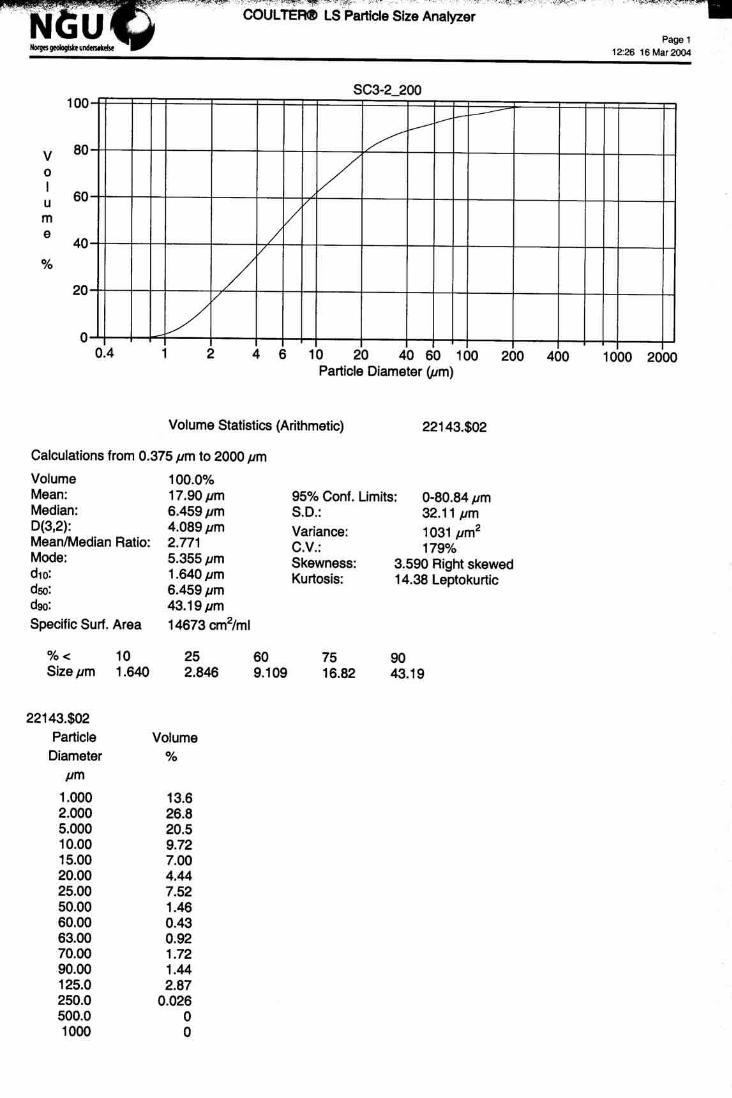
Appendix 2. Cumulative grain-size distribution plots and statistical characteristics of
individual samples. Note that sample IDs show the core numbers and subsampling
depths, i.e. sample S3A-1_10 stands for the subsample collected from 10 cm depth of
core S3A-1.

4
1 INTRODUCTION AND MATERIALS
This report presents results of analytical tests undertaken on 7 sediment cores collected by
FFI. The objective of these analyses is to provide sedimentologic and sediment physical
properties characteristics, which can potentially be related and/or correlated with sediment
acoustic parameters.
2 METHODS AND RESULTS
The laboratory procedures with the sediment cores involved (i) stratigraphic profiling with an
X-ray inspection system, (ii) stratigraphic profiling for P-wave velocity, sediment bulk
density and magnetic susceptibility using a multi sensor core logger (MSCL), (iii)
lithostratigraphic description, (iv) grain-size analysis, (v) determination of geotechnical and
physical properties of sediments. Descriptions of methods/procedures are given below.
Figures 1-7 in Appendix 1 show compilations of all obtained results and illustrate down-core
variations of studied parameters. All tests were carried out at NGU except MSCL logging that
was undertaken at the University of Bergen.
2.1 X-ray inspection system (XRI)
The images of the XRI system reflect variable X-ray absorption (transparency) of different
sediment components. The XRI system consists of an X-ray tube and an image intensifier that
converts invisible X-rays into visible light. A CCD camera is used to capture the visible
image. The size of an XRI image depends upon specific settings, typically covering 10-15 cm
long sediment intervals. The sediment core is placed between the X-ray tube and the image
intensifier; different core sections can be inspected by sliding the assembled X-ray tube and
image intensifier along the core. X-ray transparency of a sediment is strongly influenced by
the grain-size and the images are generally lighter for the fine-grained sediments and darker
for coarse-grained sediments. XRI is a handy, non-destructive method to study the texture and
structure of sediments, to characterize the distribution of gas pockets, shells, wood fragments
and clasts, and to interpret the disturbances caused by bioturbation, gas escape or shear. The
possibility to rotate the core simultaneously with imaging facilitates detailed geometric
analyses of specific structural features.
In Appendix 1, the XRI documentation is given as sequences of digital images where each
individual image corresponds to ca. 13 cm sediment intervals. The scale at the side of the
images shows the depth in centimetres from the sediment surface or from the core section top
in case of multiple sections. Individual images from all cores have been montaged to provide
the complete XRI sequence. The enclosed CD contains 2 video clip files (SC3-2-sec1 and
SC3-2 sec2) that were obtained from both sections (upper - sec1 and lower - sec2) of core
SC3-2 while steadily moving the assembled X-ray tube and image intensifier along the core.

5
2.2 Multi sensor core logger (MSCL)
The GEOTEK manufactured Multi Sensor Core Logger (MSCL) at the University of Bergen
was used to study physical properties of sediments by means of gamma-ray density, P-wave
velocity and magnetic susceptibility. The MSCL consists of a conveyor system, a central unit
assembly including three sensors, a microprocessor and a computer. The conveyor system has
two track sections, mounted and aligned on either side of the central unit, and a belt driven
pusher block which is driven in either direction by a stepper motor and gear box assembly.
The central unit assembly incorporates a compressional wave (P-Wave) logger, a gamma ray
attenuation logger and a magnetic susceptibility loop. Automation is achieved through the use
of an internal processor, interfaced with the rack-mounted computer that controls the entire
running process and stores data.
Up to 140 cm long core sections are placed on the right hand track with the top located at the
reference position. A conveyor system automatically pushes each core section through the
sensor array (incrementally past gamma ray attenuation logger, the p-wave logger and
through the magnetic susceptibility coil) with measurements being taken at spatial increments
as defined by the user; 0.5 cm and 1 cm step-sizes were used in this study. The computer
controlling the conveyor also controls the sensors, so that all data are automatically
correlated. Adjacent core sections are loaded on to the conveyor by the user when prompted
by the software commands. In this way a complete core can be logged in a continuous process
while the raw and processed data are displayed graphically in real time on the monitor.
Complete control of the graphic display is provided, both in terms of the presentation and
processing protocols. Both raw and processed data are saved in formats suitable for exporting
to other software environments for further data manipulation or data presentation.
Spreadsheets with processed MSCL data for all seven cores are given as Excel files on the
enclosed CD.
2.2.1 Gamma ray density
Density is determined by measuring the attenuation of gamma rays through the cores. The
gamma ray attenuation unit comprises a 10 millicurie Cesium-137 capsule (housed in a 150
mm diameter primary lead shield) with both 2.5 and a 5.0 mm collimators and a sodium
iodide scintillation detector (housed in a 150 mm diameter collimated lead shielding to
minimize any background radiation). A density resolution of better than 1% depending upon
counting time used and core condition is normally achieved. The source and detector are
mounted diametrically across the diameter of the core.
A narrow (pencil size) beam of gamma rays with energies principally at 0.662 MeV is emitted
from the Cesium -137 source and passes through the diameter of the sediment core. At these
energy levels Compton scattering is the primary mechanism for the attenuation of the gamma
rays in most sedimentary material. The incident photons are scattered by collision with
electrons encountered in the core and there is a partial energy loss. This attenuated gamma
beam is measured by the Sodium Iodide detector. The Compton scattering of the photons is
directly related to the number of electrons in the path of the gamma ray beam. The bulk
density of the sediment is calculated by comparing the attenuation of gamma rays through the

6
sediment core to the attenuation of the gamma rays through a standard of aluminium density
calibration billet, mounted into the liner of exactly the same type as the sediment core.
However, the plastic liner used to obtain the studied sediment cores had unusually small
diameter to fit any of calibrations billets supplied by the MSCL manufacturer. In order to be
able to run the calibration this particular liner, a special aluminium billet was designed.
However, comparisons of MSCL bulk density results with below described wet density
measurements have revealed systematic inconsistencies between different methods; these
methodological problems are discussed in section 2.5.2.
2.2.2 Magnetic susceptibility
The magnetic susceptibility Bartington loop (150 mm) sensor (MS2B) is used in the MSCL
system. A low intensity non-saturating alternating magnetic field is produced by an oscillator
circuit in the sensor loop. Changes in the oscillator frequency caused by the sediment in the
sensor loop are measured and converted into volume specific magnetic susceptibility values
(SI units). The magnitude of the magnetic susceptibility values is dependent on the type of
sediment, content of magnetic minerals and the volume of sediment within the coil. Identical
cores of varying diameters will give different magnetic susceptibility values but will show the
same down core profile. The calibration of the magnetic susceptibility loop, performed using
a standard of known magnetic susceptibility, gives 5% calibration accuracy.
Density and magnetic susceptibility profiles shown in Appendix 1 display a general
correspondence of these two parameters. However, density signal is obtained from thinner (<
1 cm) sediment interval compared to magnetic susceptibility (4-6 cm thick interval) hence the
density logs have proven to be more specific and useful defining stratigraphic boundaries.
2.2.3 P-Wave velocity
The P-Wave logger system consists of two rolling compressional wave transducers (PWT),
with soft couplings and a centre frequency around 220 kHz. These PWT’s are spring-located
on either side of the core to generate and detect short ultrasonic pulses. A short 220 kHz
compressional wave pulse is produced at the transmitting transducer at a repetition rate of 1
kHz. This wave pulse travels through the core and is detected by the receiving transducer and
the time of flight of the wave pulse is measured. Timing measurements have an accuracy of
50 ns providing velocity accuracy of about 0.2%, depending on core thickness and condition.
Calibration can be achieved using a length of core line filled with distilled water of known
temperature and velocity. The p-wave travel time is corrected for the P-wave travel time delay
caused by the core liner and the electronics of the system.
P-wave velocity logs given in Appendix 1 show that most of the velocity values cluster
around ca. 1600 m/s, consistent with the expected values for clayey-silty sediments. However,
some parts of cores, most frequently the upper portions, show occasionally scattered profiles
with values spread over the wide range. These abrupt jumps on P-wave velocity profiles are
evidently not controlled by changes in the sediment character, but most probably reflect bad
contact and/or open, air-filled spaces in the sediment liner (air-filled spaces were often
observed in between liner wall and core sample) that blunder the measurement.

7
2.3 Lithostratigraphic description
Lithostratigraphic description was undertaken on split cores that were obtained by cutting
through the liner plastic lengthwise and pulling a steel wire through the sediment. The
stratigraphic logging focused upon sedimentary structures and texture.
CLAY0 10 20 30 40 50 60 70 80 90 100
SILT
0
10
20
30
40
50
60
70
80
90
100
SAND +GRAVEL
0
10
20
30
40
50
60
70
80
90
100
S3A-1
S3A-2
S3A-3
S3A-4
S3A-5
S3C-1
SC3-2
CLAY
0 10 20 30
SILT
70
80
90
SAND +GRAVEL
10
20
30
40
50
S3A-1
S3A-2
S3A-3
S3A-4
S3A-5
S3C-1
SC3-2
Fig. 1. Ternary plot of all grain size analyses. Upper diagram is a close-up of the plot area
with the majority of data points (bordered by red lines).
2.4 Grain-size analyses

8
For grain size analyses ca. 2 cm thick sediment slices were typically obtained from the
following sediment depths depending upon the core length; 10, 25, 50, 75 100, 125, 150, 175,
200 and 225 cm. Occasionally, up to 5 cm deviations from this sampling scheme were
allowed if the desired sampling interval overlapped with the stratigraphic boundary.
Altogether 45 samples were analysed using sieving for fractions coarser than 2 mm and laser
diffraction technique using Coulter LS 200 for fractions finer than 2 mm. Samples were
oxidised with H2O2 to remove organic matter prior to analyses. The sample suspensions used
in Coulter LS 200 were dispersed in ultrasonic bath.
Figure 1 shows the distribution of all grain size results on the ternary plot of clay (<2 µm), silt
(2-63 µm) and sand-gravel (>63 µm). Stratigraphic variations of median grain size are given
in Appendix 1. Complete sets of obtained grain size characteristics are found in Appendix 2.
2.5 Determination of geotechnical and physical properties of sediments
The sampling scheme (10 cm, 25 cm, 50 cm etc.) deployed for grain size analyses was also
used to study the geotechnical and physical properties of sediments and the down-core trends
of these parameters.
2.5.1 Undrained shear strength
The Falling Cone apparatus was used to measure sediment shear strength. The split core was
placed underneath the cone holder with the tip of the cone touching the sample. The
penetration depth of the cone into the sediment after releasing the cone is proportional to the
undrained shear strength. Note that the values of undrained shear stress may bear a systematic
error due to compaction and dewatering during transport and storage prior to analyses.
2.5.2 Water content, wet density and dry density
These parameters were determined with the aid of a thin-wall steel cylinder with known
volume and weight. This cylinder was inserted into the sediment and known volumes of wet,
undisturbed sediments were subsampled. Weights of wet and dry (drying at 105 ºC for 24
hours) subsamples, combined with the known volume, allowed calculating water content, wet
density and dry density according to the following formulas:
Water content = Weight of pore water / Weight of dry sediment
Wet density = Weight of wet sample / Volume of wet sample
Dry density = Weight of dry sample / Volume of wet sample
Wet density values obtained by determining the weight of known volume should ideally
coincide with the MSCL bulk density values. Figure 2 shows the correspondence between wet
and bulk densities, and illustrates that MSCL bulk density values are systematically higher

9
than wet density values. All data points except one sandy-gravely sample from S3A-4 display
a systematic ca. 0.3 g/cm3 offset (Fig. 2).
During calibration a uniform density and related attenuation capacity of the gamma rays were
assumed for aluminium billets supplied by the MSCL manufacturer and the aluminium billet
that was made for the purpose of this particular study. This may not have been the case, and it
is possible that the newly made calibration billet has higher gamma ray attenuation capacity in
comparison to the original MSCL billets. This difference in gamma ray attenuation capacity
may have thus caused slightly wrong calibration and resulted in systematically elevated (by
ca. 0.3 g/cm3) MSCL bulk density values.
MSCL bulk density (g/cm3)
1,4 1,6 1,8 2,0 2,2 2,4 2,6
We
t d
en
sity (
g/c
m3)
1,4
1,6
1,8
2,0
2,2
2,4
2,6
S3A-1
S3A-2
S3A-3
S3A-4
S3A-5
S3C-1
SC3-2
Fig. 2. Correlation diagram for MSCL bulk density and wet density, obtained by determining
the weight of known sample volume. Solid line shows the expected correlation; dashed line
indicates the offset of 0.3 g/cm3.

APPENDIX 1
Stratigraphic profiles of X-ray images (XRI), P-wave velocity, bulk density, magnetic
susceptibility, water content, wet density, dry density, undrained shear strength, and
median grain size.

S3A-1
XRILithology
0,0
0,5
1,0
1,5
depth(m)
2,0

2
XRILithology
0,0
0,5
1,0
1,5
depth(m)
2,0

XRILithology
0,0
0,5
1,0
1,5
depth(m)
2,0

S3A-4
XRILithology
0,0
0,5
1,0
1,5
depth(m)
2,0

5
XRILithology
0,0
0,5
1,0
1,5
depth(m)
2,0

C 1
XRILithology
0,0
0,5
1,0
1,5
depth(m)
2,0

C 2
XRILithology
0,0
0,5
1,0
1,5
depth(m)
2,0
2,5
APPENDIX 2
Cumulative grain-size distribution plots and statistical characteristics of individual
samples. Note that sample IDs show the core numbers and subsampling depths, i.e.
sample S3A-1_10 stands for the subsample collected from 10 cm depth of core S3A-1.