TEKSCOPE - w140.comw140.com/tekwiki/images/5/5c/Tekscope_1973_V5_N6_Nov_1973.pdf · the most...
20
TEKSCOPE TEKTRONIX@ I commllled lo lecltn/cal excellence Volume 5 Number 6 Nov/Dec 1973 • . . . . • . . . • . . • . . . . • . . . . • . . . . • . . • . • • . . • • . . • • • . • • • lOniv • • • • • • • • • • • • • • • • • • • • • • • • . . . • • . . . . • . . . . • . . . . • . . . . • . • • • • • • • • • • • • • • • • • • • • • • • • • • • • • . . . • . . • • • . . • • • • . . . • • . . . . • • • • • • • • • • • • • • • • • • • • • • • • • • • • • . . .. . • . . • • • • • • • • • • # . . • • • • • • • • • • • • • • • • • • • • • • • ' • •
Transcript of TEKSCOPE - w140.comw140.com/tekwiki/images/5/5c/Tekscope_1973_V5_N6_Nov_1973.pdf · the most...

TEKSCOPE TEKTRONIX@ I commllled lo
lecltn/cal excellence
Volume 5 Number 6 Nov/Dec 1973
• . . . . • . . . • . . • . . . . • . . . . • . . . . • . . • . • • . . • • . . • • • . • • • lOniv • • • • • • • • • • • • • • • • • • • • • • •
• . . . • • . . . . • . . . . • . . . . • . . . . • . • • • • • • • •
• • • • • • • • • • • • • • • • • • • • • . . . ~ • . . • • • . . • • • • . . . • • . . . . • • • • • • • • • • • • • • • • • • • • • • • • • • • • • . . .. . • . . • • • • • • • • • • # . . •
• • • • • • • • • • • • • • • •
• • • • • • ' • •

TEKTRONIX® commilled to
technical excellence
Cover: Dr. Gail Massey of the Oregon Graduate Center makes adjustments to a _ Q-switched neod ymium YAG laser using the R7912 . The dot pattern is the electronically-generated graticule and the waveform is typical of a detector output from a pulsed laser.
11 .......... --...:...- TEKSCOPE
TEKSCOPE Customer Information from Tektronix, Inc. P .0. Box 500, Beaverton, Oregon 97005
Editor: Gordon Allison,
Ass't Editor: Dale Aufrecht,
Graphic Designer: Tom Jones
Contents
3 A new way to look at transients Fast, single-shot pulses are digitized for computer analysis or display on large-screen X -Y monitors.
10 A fast A/D plug-in for the oscilloscope A plug-in that accepts plug-ins expands 7000-Series Oscilloscope measurements to include true RMS and peak-topeak voltages displayed digitally and with typical digital accuracies.
16 Digitizing and displaying fast pulses Q-switched lasers generate very short pulses of light. The R7912 is an ideal instrument for measuring the fast pulses from this type of laser.
18 Getting around in Tektronix instruments Color-coded wires, well-marked printed circuit boards and unique connectors are a big help in servicing today's compact oscilloscopes.
20 Tekscope 1972-73 Index A chronological listing of articles that appeared in Tekscope during 1972-73.
Copyright © 1973, Tektronix, Inc. All rights reserved. U.S.A. and Foreign Products of Tektronix, Inc. are covered by U.S.A. and Foreign Patents and/or Patents Pending. TEKTRONIX, SCOPEMOBILE, TELEQUIPMENT and~ are registered trademarks of Tektronix, Inc. Printed in U.S.A.

(
Carlo Infante
)
' )
A new way to look at transients
The display and analysis of fast, single-shot pulses has long been one of the most challenging problems in oscillography. These pulses result
from measurements in a ·wide variety of fields such as laser research, nuclear research, computer design and service, stress analysis of components, and others. In the past, the only way to view fast transients, which may be a nanosecond or less in duration, has been to use an oscilloscope ·with a viewing hood or the very best scope/ camera combination. These methods have been quite successful as proven by the many thousands of TEKTRONIX oscilloscopes in installations of this kind, but there are some obvious disadvantages. One is the need to dark-adapt one's eyes before attempting to view a fast transient. Another is the time required to develop and analyze the photograph containing the waveform. Still another is the expense and inconvenience of using film, particularly ·when the waveforms need to be digitized for computer processing. l\fany of the present methods for digitizing waveforms from film involve hand processing with resultant time-consuming delays and possibility for errors.
The TEKTRONIX R7912 Transient Digitizer solves these problems in a unique and novel way, and in addition, provides features not available on earlier instruments. The functions of writing and reading, which in a normal oscilloscope are carried out by the same CRT beam, are accomplished by two separate electron beams in the R 7912; waveform display is handled by a third beam in an associated monitor. This allows optimizing the design of each function to achieve the overall goal of large, bright, high-resolution ·waveform displays. The waveform can be displayed on a TV monitor such as the TEKTRONIX 632 to provide a bright, large-screen display easily viewable in room-ambient light; equivalent photographic ·writing rate in this mode is 30,000 div/ 1.J.s. In addition, the waveform can be automatically digitized; i.e., the ·waveforms are processed into a computer-compatible format so they can be analyzed by a computer. Or, if desired, the waveforms can be stored in a self-contained memory (optional) and displayed on an X-Y monitor; an equivalent stored writing rate of 8,000 div / p.s can be achieved with no limitation on storage time. (If display area is 8 by 10 centimeters stored writing rate is equivalent to 8,000 cm/ vs.)
Instrument Description
Fig. 1 shows a block diagram of the instrument. The writing section of the R7912 is similar to a conventional oscilloscope. The input signal is acquired, conditioned, and amplified by vertical plug-ins from the TEKTRONIX 7000-Series family. Any of the 7 A-Series plug-ins can be used, allowing a wide choice of vertical capabilities from high gain (as low as 10 p.V /div ·with the 7 A22 D ifferen ti al Amplifier) to maxim um bandwidth ( 1 GHz with the 7A21N Direct Access Unit). Horizontal s·weep and sweep gate are generated by a 7B-Series time base plug-in.
3

The input signal is applied to the CRT writing gun. Design and operation of the CRT is described in a special feature section of this article. The waveform written on the target by the writing gun is read out by the reading gun. ' 1\Tith the instrument operating in the NON STORE mode, the reading beam scans the target linearly in a TV format and operation is quite similar to that of a conventional TV camera. Each time the reading beam crosses a written point, a small current pulse is generated in the target lead. This pulse is amplified and .Processed to provide the video output signal.
Synchronizing signals for the Read System and the associated video monitor are generated by the Sync Generator. The X and Y Ramp Generator and Scan
CHARACTER GENERATOR
SYSTEM
ELECTRONIC GRATICULE
GENERATOR !OPTIONAL)
Z·A XI S CONTROL SI GNAL
VERT ICAL { SIGNA L FROM
VE RTICAL PLUG-IN
}
CRT READOUT TO VERTICAL AND HORIZONTA L AMPLIFIERS
}
TO VERTICAL AND HORIZONTAL AM PLI FIERS
WRITE GUN HIGH ·VOL TA GE
SUPPLY
y
Amplifier produce the waveforms required to drive the X and Y deflection plates of the Read System.
Jn the DIGITAL mode, the read sequence is changed while the write sequence remains as already described Jn this mode, the target is scanned in steps in a 512 by 512 matrix rather than linearly. Also, fast scanning occurs vertically in the DIGITAL mode which is opposite to the NON STORE mode where fast scanning is done in the horizontal direction as in conventional TV. Fig. 2 illustrates these two scan modes using simplified waveforms and scan lines. The NON STORE mode, being similar to conventional TV, will not be explained further here.
DETECTED VIDEO
COMP SYNC
VIDEO PROCESSOR
VIDEO BLANK
DIGITAL INPUT AND OUTPUT
,-"----..
MEMOR Y BOARD
!OPTIO NAL)
CALIBRATOR ff;
} :~~J: 1--------+--------- OUTPUT ...__ ___ _,
X ANO Y RAMP
GENERATOR
SCAN t+----------~
L-------------....;;:a,-A~MP '----- -'
Fig. I. R7912 Block Diagram .
4.
X-Y ALIGNMENT
------~h' COILS
READ GUN SUPPLY

NON STORE MODE DIGITAL MODE
OISPLAY DISPLAY
(a) (b)
OUTPUT (A) COMPOSITE VIDEO OU TPUT IBI DIGITAL DATA, 10 BITS IPARALLELI
Fig. 2. Target scanning modes.
Vertical scanning is used in the DIGITAL mode due to the nature of the waveforms normally digitized. Notice that for the simplified scan shown in Fig. 2B, each vertical scan line intersects the waveform only once. In this mode, addresses of points on the target are transferred and stored in memory only ·when a trace has been written at that point on the target. This results in the fastest readout of information needed to define a waveform, and requires less storage space in memory for the waveform . In actual operation, the trace is several samples ,.vide and circuitry is incorporated in the instrument to reduce the amount of information which must be communicated to define a trace. The counters and logic circuits required for digital operation are contained in the Logic circuit. The optional 1\!Iemory allows waveforms to be stored in the DIGITAL mode for later transfer to a computer, or for display on a storage display unit through a display interface.
The R7912 uses the CRT READOUT SYSTEl'vI pioneered in the TEKTRONIX 7000 Series to display measurement parameters along with the waveform. These characters are written on the diode target by the writing beam on a time-shared basis and become part of the output signal in the NON STORE mode. An optional converter is available for use in the DIGIT AL mode to take the readout information directly from the plug-ins and convert it into an ASCII coded format which becomes part of the data communicated to the computer.
The optional Electronic Graticule Generator produces a clot array similar to the graticule on a conventional oscilloscope CRT. The electronic graticule is written on a time-share basis with the input signal and, like the CRT READOUT signal, becomes part of the output signal from the Read System. This electronic graticule eliminates parallax associated with overlay graticules and minimizes errors due to non-linearities or drift in the amplifiers or CRT deflection system.
Novel Circuitry-The Key to Performance As you would expect in a state-of-the-art instrument, many novel circuits make up the R7912. These include a highly stable -10 kV povver supply, an electronic graticule generator, low-noise amplifiers, and unique
logic circuits. Let's look at several of these circuits in more detail.
Ramp Generator. A block diagram of the Ramp Generator is shown in Fig. 3. Two of these circuits are used in the R7912; one for the vertical and one for the horizontal. In the NON STORE mode, the Integrator generates a highly linear ramp (waveform A) whose amplitude is precisely set by two stable discriminators which define the upper and lower end points of the ramp. This v.ravefonn is synchronized by the action of the Phase Detector '"'hich compares the end of the ramp with the sync pulses. If there is an error, it changes the timing, or charge current, of the integrator to insure proper timing.
CLOCK HIPUT
Fig. 3. Ramp Gen erator.
~/svr;c ~ltJPUT
In the DIGITAL mode, 5-1'vIHz clock pulses are connected to a Single-Shot 1\foltivibrator and to a ...;- 512 Counter. Each time the M ultivibrator fires, a small amount of current is injected into the Integrator, resulting in a step at its output. The voltage of the output step remains stationary during the Multivibrator 's quiescent period. After a number of ramp and hold steps have been accomplished, the Upper Threshold Discriminator resets the End-Of-Ramp Flip Flop causing the Integrator to reset. The circuit is then ready to produce a new staircase waveform. The output of the Encl-Of-Ramp Flip Flop and the ...;- 512 Counter are compared by the Phase Detector. If these pulses do not occur simultaneously, a correction signal is generated by the Phase Detector and the charging current of the Integrator is suitably adjusted. In this fashion, the Phase Detector insures that precisely 512 steps are generated for each vertical or horizontal scan, resulting in a stable digitized waveform.
One of the features of this circuit is that the period of the staircase can be changed without affecting the accuracy of the staircase. This occurs in the operation of the R79 l 2 when a point is addressed on the target where a waveform has been written. Normally, the staircase holds at each step for about 100 nanoseconds while the signal on the target lead is checked for a change in state since the previous sample. If there is no change, the staircase is advanced to the next step. How-
5
6
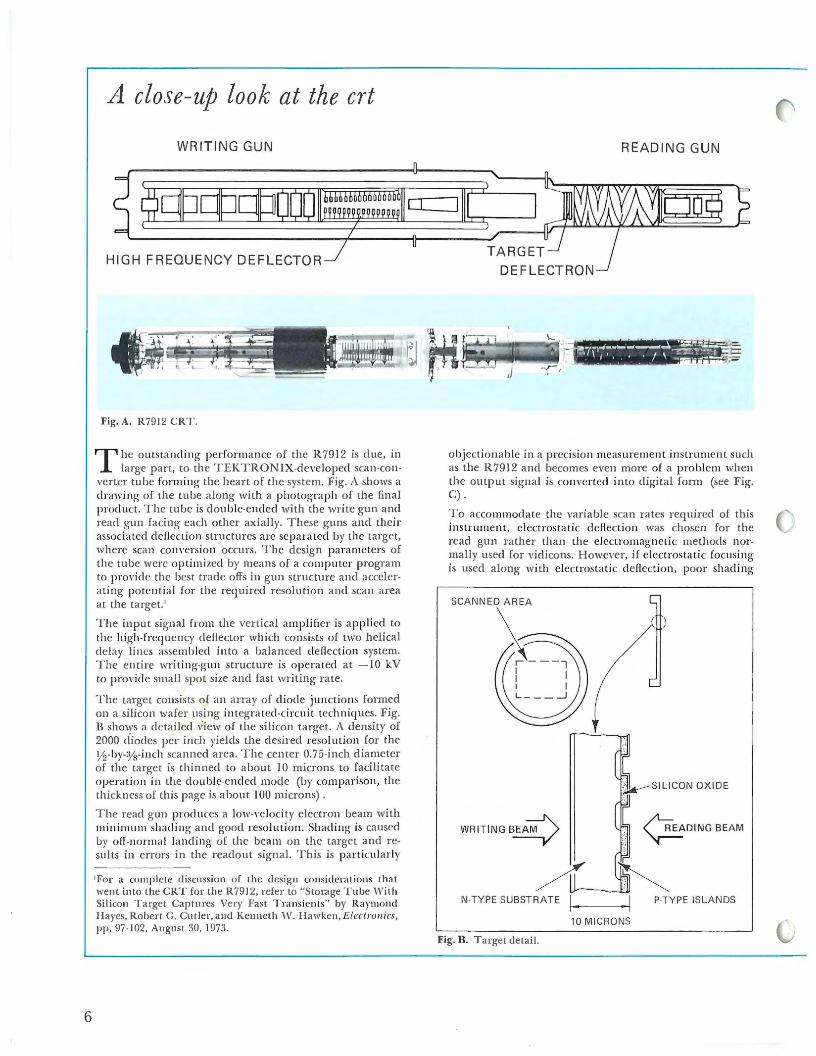
A close-up look at the crt
WRITING GUN
HIGH FREQUENCY DEFLECTOR
Fig. A. R7912 CRT.
T he outstanding performance of the R 7912 is clue, in large part, to the TEKTRONIX-developed scan-con
verter tube forming the heart of the system. Fig. A shows a drawing of the tube along with a photograph of the final product. The tube is double-ended with the write gun and read gun facing each other axially. These guns and their associated deflection structures are separated by the target, where scan conversion occurs. The design parameters of the tube were optimized by means of a computer program to provide the best trade offs in gun structure and accelerating potential for the required resolution and scan area at the target.'
The input signal from the vertical amplifier is applied to the high-frequency deflector which consists of two helical delay lines assembled into a balanced deflection system. The entire writing-gun structure is operated at -10 kV to provide small spot size and fast writing rate.
The target consists of an array of diode junctions formed on a silicon wafer using integrated-circuit techniques. Fig. B shows a detailed ,;iew of the silicon target. A density of 2000 cliodes per inch yields the desired resolution for the y2-by-%-inch scanned area. The center 0.75-inch diameter of the target is thinned to about I 0 microns to facilitate operation in the double-ended mode (by comparison, the thickness of this page is about 100 microns).
The read gun produces a low-velocity electron beam with minimum shading and good resolution. Shading is caused by off-normal landing of the beam on the target and results in errors in the readout signal. This is particularly
1For a complete discuss ion of lhe design considerations that went into the CRT for lhe R7912, refer to "Storage Tube With Silicon Target Captures Very Fast Transients" by Raymond Hayes, Robert G. Cutler, and Kenneth'"'· Hawken , Electronics, pp. 97-102, August 30, 1973.
READING GUN
objectionable in a precision measurement instrument such as the R7912 and becomes even more of a problem when the output signal is converted into digital form (see Fig. C).
To accommodate the variable scan rates required of this instrument, electrostatic deflection was chosen for the read gun rather than the electromagnetic methods normally used for vidicons. However, if electrostatic focusing is used along with electrostatic deflection, poor shading
( )
WRITINGB~
~~~ N-TYPE SUBSTRATE li-•..-------i P-TYPE ISLANDS
10 MICRONS
Fig. B. Target detail.
( characteristics result. To solve these problems, a hybrid design was developed consisting of an electrostatic deflection system surrounded by an axial magnetic focusing field. The deflection plates actually consist of a cylindrical electrode pattern photo-etched on the interior wall of the tube (see Fig. A). The axial magnetic field is provided by an external solenoid. This configuration is called a deflectron deflection system. 2
As the reading beam is scanned across the target, it charges the target negatively towards the read-gun cathode potential and the target diodes are reverse biased. High-velocity electrons from the write gun bombard the back of the target, creating electron-hole pairs which diffuse through the target. This causes the diodes to conduct and discharge in the written area. '"'hen the reading beam next scans the written area, it recharges the diodes, producing a signal current in the target lead. Amplification and processing of this signal provides the video or digital output signal.
2For a complete discussion of the dcflectron system , see "Electron Trajectories in Twisted Electrostatic Deflection Yokes" by E. F. Ritz, IEEE Tra11.rnrlio11s 011 E/ertro11ir D1,11ires, November 1973.
LINEAR VIDEO
A. Severe shading.
B. Ideal case, no shading.
DIGITIZED VIDEO
/Blanking pulse~
Erroneously digitized signal due to shading
Correctly I digitized signal
Fig. C. Effects of shading on digitized video.
ever, when a change is detected, the staircase holds at this step for about 1.6 microseconds to allmv time for the address of this data point to be transferred to the computer or stored in memory. As a result, each staircase may have a different duration since the number of these pa uses for address transfer will vary depending on the nature of the waveform written on the target. In a conventional feedback-stabilized circuit, this would result in timing variation and an inaccurately digitized waveform. To prevent this, the clock input pulses are interrupted during the address communication time. Both the Single-Shot Multivibrator and the --;- 512 Counter remain inactive until the clock resumes. Highly stable circuitry in the Integrator holds the step level very constant during the pause . The overall result is that ·when normal operation resumes, the outputs of the End-Of-Ramp Flip-Flop and the --;- 512 Counter have been delayed by the same amount of time. Therefore, no error signal is generated at the input of the Phase Detector and the ramp generator remains stable and phase locked even though the period of the staircase has rha_nged.
Each of the vertical and horizontal steps has a BCDcoded address associated ·with it ·which is stored in the optional memory or transferred to a computer ·when valid vvavefonn data is detected on the target. Both a vertical and a horizontal address is required to define a point on the target. Since the clot raster is a 512 by 512 matrix, there are over 250,000 addressable points on the target. The average waveform normally requires about 1500 po in ts for com pie te definition. However, under some conditions such as dual-trace operation, two waveforms may be stored in memory simultaneously. To provide adequate storage, a 4000-word memory has been provided as an option for the R7912.
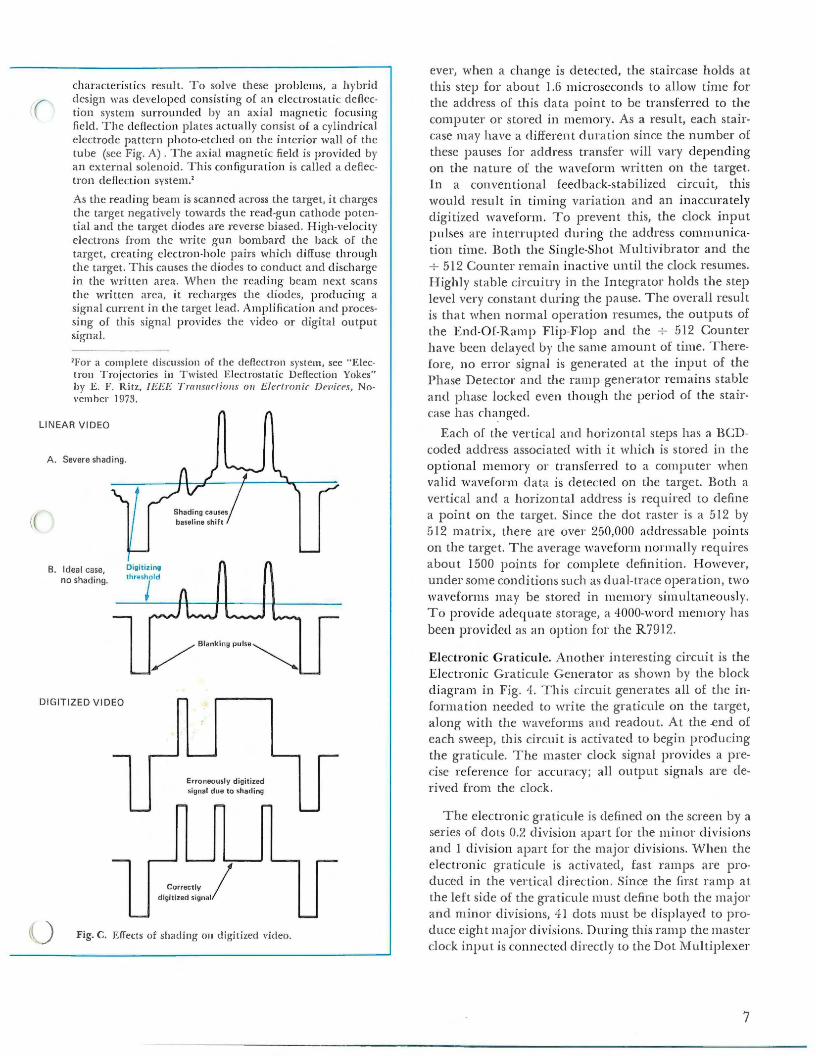
Electronic Graticule. Another interesting circuit is the Electronic Graticule Generator as shown by the block diagram in Fig. 4. This circuit generates all of the information needed to write the graticule on the target, along with the waveforms and readout. At the -end of each sweep, this circuit is activated to begin producing the graticule. The master clock signal provides a precise reference for accuracy; all output signals are derived from the clock.
The electronic graticule is defined on the screen by a series of dots 0.2 division apart for the minor divisions and I division apart for the major divisions. ' '\Then the electronic graticule is activated, fast ramps are produced in the vertical direction. Since the first ramp at the left side of the graticule must define both the major and minor divisions, 41 dots must be displayed to produce eight major divisions. During this ramp the master clock input is connected directly to the Dot Multiplexer
7
which produces one Z-Axis intensifying pulse for each clock input.
The Vertical Dot Counter ( + 45) produces an output after 45 clock pulses, which serves as a reference to the phase-locked Vertical Integrator. Operation of this ramp generator is similar to the Ramp Generator described previously. As the vertical ramp is reset, it trig-
MASTER CLOCK -1 ~ 1 VERTICAL
DOT COUNTER
(7 45)
-
MAJOR DIVISION COUNTER
(7 5)
1 l
(VERTICAL DOTS 7 5 DIVIDED BY 5)
COUNTER
t.,__
SWEEP GATE
GRATICULE DISABLE
(DIRECT VERTICAL DOTS)
HORIZONTAL - COUNTER (7 11)
(END t GRATICULE)
-s 1
GRATICULE GATING
FLIP FLOP
- R
-
(RESET)
- GRATICULE CONTROL
AND SWITCHING
LOGIC
Fig. 4. Block diagram of Electronic Graticule Generator.
8
gers the Horizontal Staircase Generator which moves the next trace one step or 0.2 division to the right. At the same time, the output of the l'viajor Division Counter (+ 5) changes state, causing the Dot l'vlultiplexer to switch from the direct vertical dots input to the Vertical-Dots-Divided-by-5 Input. During this vertical ramp, a clot is displayed every fifth clock pulse to define a major division.
PHASE-LOCK f---+
DETECTOR r
DOT MULTI-PLEXER
_:~GRATICULE . ~ • INTENSITY
(ON/OFF COMMAND)
VERTICAL RAMP
GENERATOR
I
HORIZONTAL STAIRCASE
GENERATOR
- WWWv WVv VERTICAL RAMP TO
CHANNEL SWITCH
fr:l PULSES/HORIZONTAL SrTE~\ "--~S/HORIZONTAL S~
1111~1111~~~ ll:
--
Z-AXIS UNBLANKING TO Z-AXIS LOGIC
···1 / HORIZONTAL STAIRCASE
TO CHANNEL SWITCH
_J CHANNEL SWITCH COMMAND
~~~~B~~L_ ~o_c_~.ou.~J
Fig. 5. Performance of R 7912 (top waveforms) compared to fastest conventional oscilloscope (bottom waveforms). No waveform is shown for the conventional oscilloscope at 2.4 GHz since it could not display this signal.

(
Three more vertical ramps are generated in this manner. Then, the output of the Major Division Counter switches so that dots are again displayed every 0.2 division . Action continues until the graticule is complete. vVhen the Horizontal Counter (-7- 11) has received 11 inputs from the Major Division Counter (-7- 5) the graticule is complete and it resets the Grat
icule Gating Flip Flop. This action turns off the Graticule Control block and halts operation of this circuit. About four milliseconds are required to write the complete graticule.
The Proof Is In The Performance Performance of the instrument is best shown by the accompanying photographs. Fig. 5 shows continuous sinewave signals as displayed by both an R7912 Transient Digitizer/TV monitor (NON STORE mode) and a TEKTRONIX 7904 Oscilloscope. Identical plugins were used for both measurement systems. Fig. 6 shows the reconstructed display of a single pulse that was digitized by the R7912. The digital information was feel to a computer through the instrument's optional memory and interface circuits. It was then reconstructed and displayed on a TEKTRONIX storage display monitor.
Fig. 6. Digitized waveform, reconstructed and displayed on a TEKTRONIX Ci03 Storage Monitor.
Acknowledgments This instrument, as many state-of-the-art projects, is the result of the dedicated effort of many people. These include: Carlo Infante, Program l\fanager; Jim Cavoretto, Project Engineer who also provided valuable assistance in compiling this article; Al Allworth, Don Roberts, and Stu McNaughton, Electrical Engineers; Walt Lowy, Engineering Technician; Ray Hayes, Ken Hawken, Bob Culter, Hal Cobb, Ed Ritz, and Bo Janko, CRT Engineering; Loyal Strom, Helene Albright and Ken Nesvold, Prototype Support; Doug Giesbers, Larry Pearson and Phil Lloyd, Mechanical Engineering; Nick Hughes and Ray Blohm, Instrument Manufacturing. Th~ list would not be complete if special recognition were not given to these marketing people whose inputs and support were always very valuable: Bob Hightower, Rob Johnson, and Bill West. ~
9
Hideki Iwata Ken Sternes
0.5V MIN 500 2VMAX
MODE RANGE
OUT JL OUT Si-Si S1 S2 20V
COUPLING
OUT AC DC
INPUT lMll 20pf
10
A fast A/D plug-in for the oscilloscope
VERTICAL DISPLAY
ATTEN---@-
2X
lkY MAX' TO GND
TRIGGERING
AUTO TRIG'D •
TEMP OUT 1omv/•c
TEKTRONIX®
M1 MULTIFUNCTION MODULE
TEKTflONIX®
7012 A/D
CONVERTER
RANGE
20V 200V 2V 0.5kV
INPUT HIGH COi
M3 RMS VOLTS M

VERTICAL DISPLAY ATTEN
ox OUT lX
OUT Ac+oc
0 ne picture is worth a thousand words. And sometimes even a thousand ·words can't adequately
convey the information. \ 1Ve might paraphrase this to say, "One waveform displayed is worth a thousand voltmeter readings." And sometimes even a thousand voltmeter readings can't adequately portray the ·waveform. It's true, huv.1ever, that often a picture, or '\•rnvefonn, doesn't tell the complete story. The addition of a few words, or figures, can impart a lot of valuable information.
The introduction of the TEKTRONIX 7000-Series Oscilloscope with CRT READOUT brought us the powerful measuring capability afforded by displaying both vvaveforms and alphanumerics on the CRT at the same time. To many, this seemed to be merely a convenience for recording deflection factors along with the trace when photographing the screen. It has proven to be a convenience-and much more, for it has broadened the role of the oscilloscope to include counters, DVM's, computer-aided measurements and the like. Now a new analog-to-digital converter plug-in for the 7000-Series adds several highly useful measurements to your oscilloscope's repertoire.
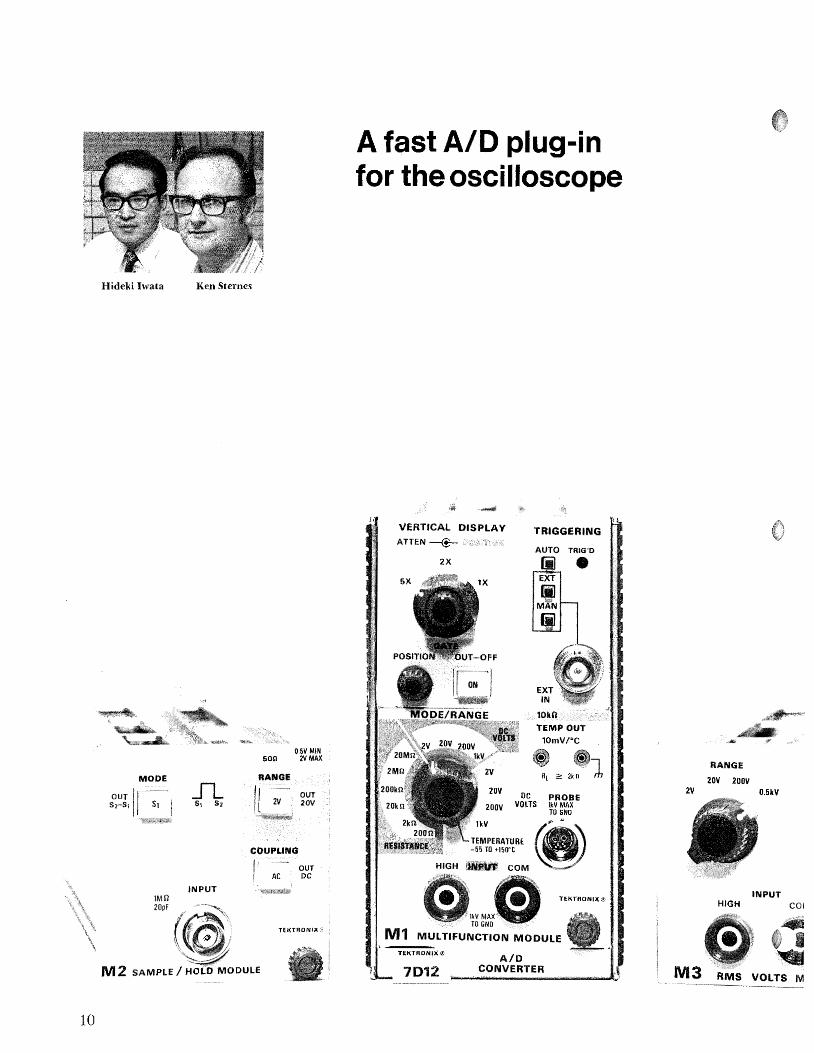
The 7012 Plug-in The 7Dl2 A/D Converter plug-in is designed for use with any 7000-Series Oscilloscope containing CRT READOUT. The unit consists of t\vo basic sections: the plug-in mainframe, which contains a fast, 4 Y2-digit,
MODULE
ANALOG IN PUT - SIGNAL DC VOLTAGE
- PROCESSING SECTION
i ~
POWER SUPPLY DISPLAY I ~
AMPLIFIER I
I GATE I AMPLIFIER SIGNAL I I GATE
SCALE FACTOR, MEASUREMENT UNIT. DECIMAL POINT, LAST DIGIT SUPPRESSION
A/D converter, inverter power supply, dual-trace 100-MHz vertical amplifier, readout control section and trigger circuit; and a smaller module which plugs into the front of the 7Dl2. Three modules are currently available-the Ml :Multifunction J\fodule for measuring DC volts, resistance and temperature; the :rvI2 Sample/ Hold 1\fodule for measuring voltage from ground to a selected point, or the difference voltage between any two selected points; and the M3 RMS Volts Module for making true RMS voltage measurements. We will discuss each of these in some detail; but first, let's take a closer look at the 7Dl2 mainframe.
The block diagram in Fig. l shows the major sections of the 7DI2 and the modules. The modules process various analog signals- peak voltage, R:MS voltage, resistance, temperature, etc., and produce a DC voltage which the 7DI2 converts to digital readout information for the 7000-Series Oscilloscope. The M2 and 1\II3 also provide an analog signal for display.
The function of each block in the 7D 12 is readily apparent except, perhaps, for the inverter power supply. This supply permits floating the A/D converter, enabling us to make measurements with the input elevated as high as I kV. Triggering of the 7D 12 can be accomplished internally from a unijunction transistor oscillator, externally thru a BNC connector, or manually by a front-panel push button.
7012 PLUG·IN
TRIGGER I CIRCUIT
... VHI_
TO OSCILLOSCOPE
411, DIGIT - REAQOUT CHARACTER -VLO, A/D CONVERTER - CONTROL GENERATOR -
SECTION
t Jl
I INVERTER
POWER SUPPLY
SIGNAL - DUAL TRACE TO .... VERTICAL -
~
, , AMPLIFIER OSCILLOSCOPE
VERTICAL
Fig. 1. Block diagram of plug-in module and 7Dl2 plug-in.
11
AID STAND·BY
OFFSET VOLTAGE STORAGE CAPACITOR
REFERENCE CURRENT
GENERATOR
STOP COUNT LOGIC
20K COUNT
START RAMP
STOP COUNT
AIOSTAND-BY
CLOCK AID STAND·BY START RAMP GENERATOR
CLOCK SYNC & 1------<I----- CONTROL SECTION OF COUNTERS, MEMORIES,
D/A CONVERTERS
TRIGGER PULSE
TRIGGER CIRCUIT
COUNTERS, MEMOR IES TRANSFER
L..-------+-----------3 'RESET
CLOCK GENERATOR
1--------.- READOUT
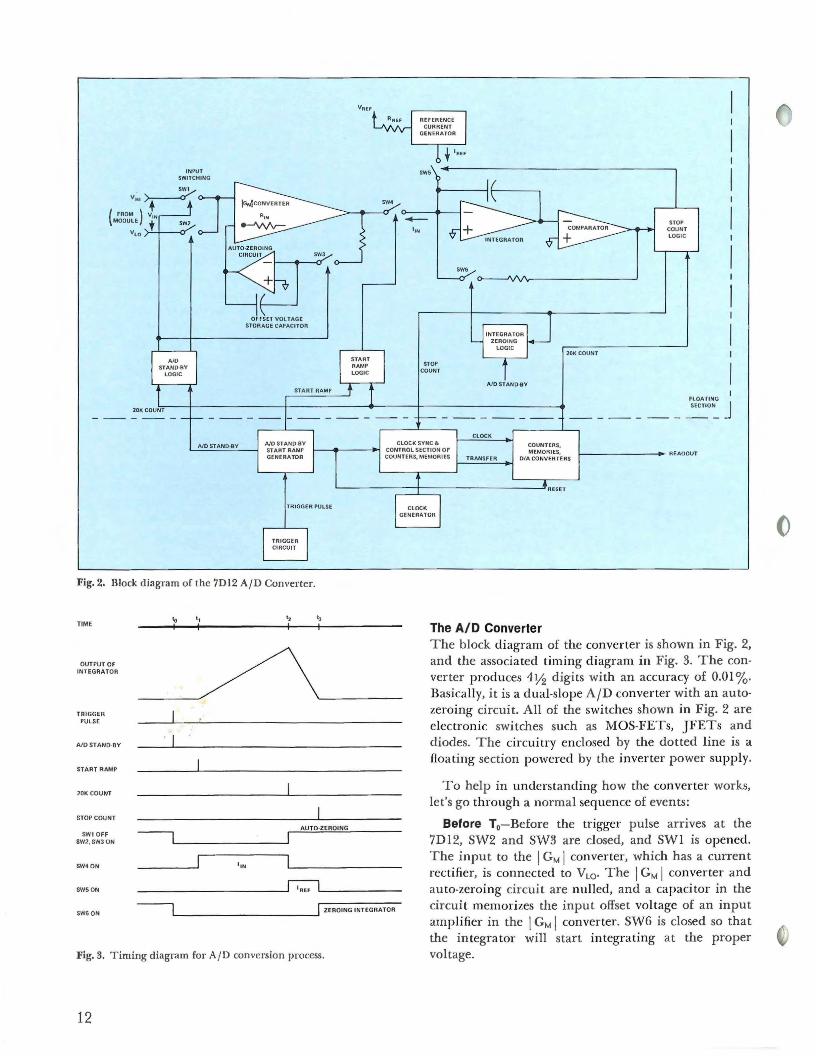
Fig. 2. Block diagram of the 7Dl2 A/D Converter.
TIME to 1,
OUTPUT OF INTEGRATOR
TRIGGER PULSE
A /0 ST AND·BY
START RAMP
20K COUNT
STOP COUNT
AUTO ·ZEROING SWl OFF
SW2, SW3 ON
SW40N
SW50N --------------'~L--------SW60N --i .__ ___________ __,I ZEROING INTEGRATOR
Fig. 3. Timing diagram for A/ D conversion process.
12
The A/D Converter The block diagram of the converter is shown in Fig. 2, and the associated timing diagram in Fig. 3. The converter produces 4Y2 digits with an accuracy of 0.013. Basically, it is a dual-slope A/D converter with an autozeroing circuit. All of the switches shown in Fig. 2 are electronic switches such as MOS-FETs, JFETs and diodes. The circuitry enclosed by the dotted line is a floating section powered by the inverter power supply.
To help in understanding how the converter works, let's go through a normal sequence of events:
Before T0-Before the trigger pulse arrives at the 7D 12, SW2 and SW3 are closed, and SWl is opened. The input to the I GM I converter, which has a current rectifier, is connected to Vw. The I GM I converter and auto-zeroing circuit are nulled, and a capacitor in the circuit memorizes the input offset voltage of an input amplifier in the I GM I converter. SW6 is closed so that the integrator will start integrating at the proper voltage.
10 -1 1-When a trigger pulse arrives at t0, the A/D Stand-by Start-Ramp Generator produces an A/D stand-by pulse to switch the states of SWI, SW2, SW3, and SW6 through the A/D Stand-by Logic circuit. The input of the I GM I converter is now connected to VHi·
The input voltage V 1N is equal to VHi minus VLo·
11 - 12-Af ter 2 milliseconds, a start-ramp pulse is produced at t 1 to turn Sv\14 on through the Start Ramp Logic, to start integrating the input current, I 1N, and the counter is started by the clock pulse from the Clock Synch. and Control Section.
12 -t3-At 20,000 counts of the counter at t2, SW4 is opened, and SW5 is closed to start integrating down by the reference current, IREF· At t2, the auto-zeroing circuit is activated again by turning SWI off and SW2 and SW3 on through the A/D Stand-by Logic.
After 13-When the output of the integrator reaches the zero level, a stop-count pulse is produced, and the reference current is turned off at t3• The counter stops. The content of the counter is then transferred to memory where the output is converted to an analog readout signal. S\i\16 is turned on again to prepare the integrator for the next measurement. The digital readout is equal to (I1N/IREF) x 20,000. I 1N is equal to I V1N I /R1N where R 1N is a discrete resistor in the I GM I converter, and Im is equal to V REF/Rm. The readout can be expressed by the following equation:
Readout= «I v,N I /R1N) I (Vm/RREF)) x 20,000 ....
Eq. I
With the use of the auto-zeroing circuit, the I GM I converter cannot clrif t more than 100 microvolts for the instrument's operating range of +15°C to +40°C. By using a precision input amplifer with high gain and high common-mode-rejection, V1N in Eq. I is made equal to the voltage input to the 7D 12. VREF is a temperaturecompensated zener diode with a temperature coefficient of 5 p.p.m./°C. The ratio of R 1N and RREF can be tightly controlled by using matched resistors whose temperature tracking is better than 2 p.p.m./°C. Therefore, total maximum temperature coefficient is 7 p.p.m./ 0 C. The required accuracy of ±0.013 over a ±5°C temperature range is easily achieved.
Now let's take a closer look at the plug-in modules.
The M1 Multifunction Module The Ml /7D 12 combination forms a 4Y2-cligit voltmeter and ohmmeter, and a 3Y2-digit temperature indicator. The DC voltmeter measures from 0 to 1000 V in four ranges with a resolution of 100 µ V on the 2 V range. System accuracy is ±0.03% of reading ±0.005% of full scale over the ambient temperature range of 20°C to 30°C, or ±0.043 of reading ±0.0053 of full scale from
I5°C to 40°C. Either input connector can be elevated I kV above ground, and the input impedance is 10 Mn on all ranges.
Resistance from 0 to 20 Mn is measured in six ranges, with a resolution of 10 milliohms on the 200 orange. The accuracy is ±0.093 of reading plus ±0.013 of full scale from I 5°C to 40°C.
Both temperature and DC voltage can be measured using the convenient P6058 voltage/temperature probe. Temperature from -55°C to +150°C can be measured with a resolution of 0.1 °C and an accuracy of± I °C up to 125°C and ±2°C up to 150°C. A pair of terminals on the .Ml's front panel provides an analog output of IO mVj°C (0°C 0 volts). This output is available regardless of the Mode/Range switch setting.
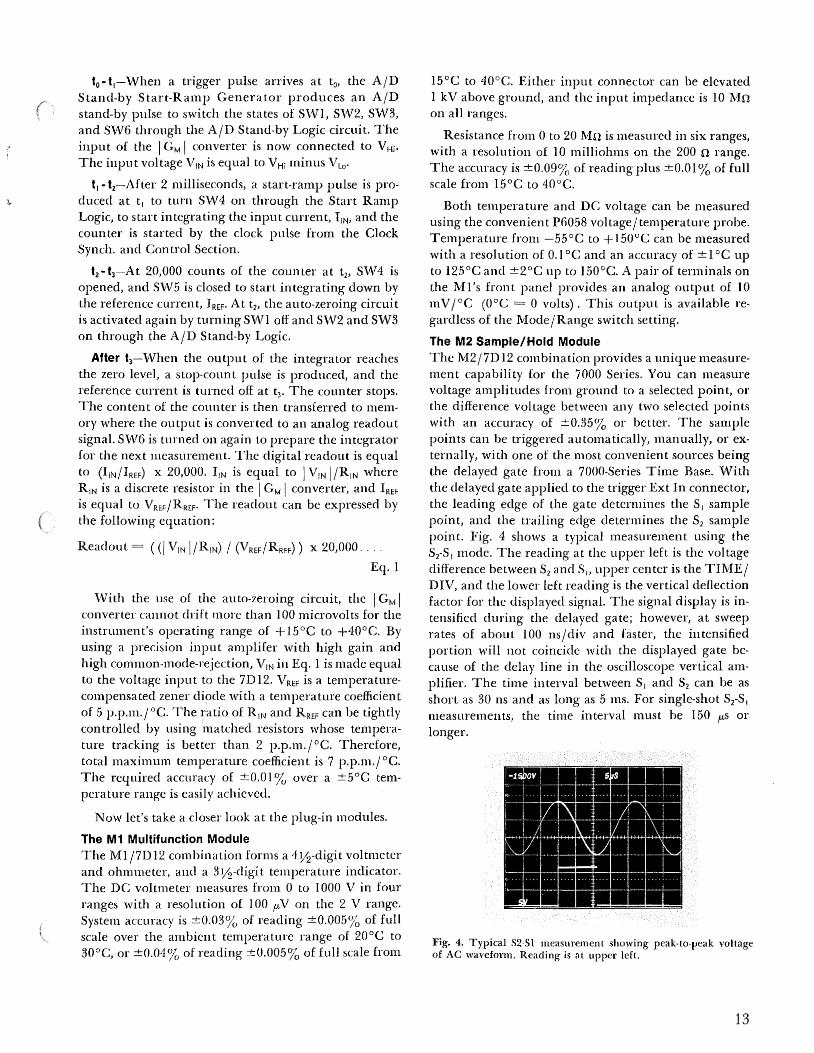
The M2 Sample/Hold Module The M2/7Dl2 combination provides a unique measurement capability for the 7000 Series. You can measure voltage amplitudes from ground to a selected point, or the difference voltage between any two selected points with an accuracy of ±0.353 or better. The sample points can be triggered automatically, manually, or externally, with one of the most convenient sources being the delayed gate from a 7000-Series Time Base. With the delayed gate applied to the trigger Ext In connector, the leading edge of the gate determines the S1 sample point, and the trailing edge determines the S2 sample point. Fig. 4 shows a typical measurement using the SrS 1 mode. The reading at the upper left is the voltage difference between S2 and S" upper center is the TIME/ DIV, and the lower left reading is the vertical deflection factor for the displayed signal. The signal display is intensified during the delayed gate; however, at sweep rates of about 100 ns/div and faster, the intensified portion will not coincide with the displayed gate because of the delay line in the oscilloscope vertical amplifier. The time interval between S1 and S2 can be as short as 30 ns and as long as 5 ms. For single-shot SrS 1
measurements, the time interval must be 150 µs or longer.
Fig. 4. Typical S2-Sl measurement showing peak-to-peak voltage of AC waveform. Reading is at upper left.
13

10 Nanosecond Aperture Time One of the unusual features of the M2 is the 10 ns aperture time. This makes it useful for measuring high dv /dt signals such as the fast A/D converter waveform pictured in Fig. 5. Accuracy of the measurement is typically better than ±0.253 if 40 ns is allowed for settling time following an input signal step-function.
Fig. 6 illustrates an application of the M2/7DI2 teamed up with a 7Dl5 Universal Counter/Timer plug-in to make accurate rate-of-rise measurements on a ramp signal. The M2 is operated in the S2-S 1 mode. The delayed gate from the time base plug-in is used to gate both the M2/7Dl2 and the 7Dl5. The +2.35 V reading in the upper left corner is the change in amplitude during the brightened portion of the trace. The time interval as measured by the 7Dl5 is 20.92 µsand the IX indicates the reading was taken during a single event rather than an average of several ramps. Accuracy of the M2/7Dl2 in this mode is ±0.353. The linearity of the ramp can be quickly checked by moving the delayed gate along the ramp and noting any change in the amplitude reading provided by the M2.
The M3 RMS Volts Module The M3/7D12 combination brings another unique measurement capability to the oscilloscope-measuring true RMS voltages. The M3 measures DC, the true RMS voltage of signals from 40 Hz to I 00 kHz, and the true RMS value of AC+ DC. The maximum input is 500 V RMS or 1000 V peak. Voltages are displayed digitally on the CRT with 3Y2-digit readout, with a resolution of I m V achievable on the 2 volt scale. Accuracy of the M3 is ±0.253 of full scale up to 40 kHz on the 2 V and 20 V ranges, derated to ±0.53 above 40 kHz. The maximum
permissible crest factor (EPEAK) is 5. Response time of ERMS
the M3, that is the time required for the readout to reach its stated accuracy after a step voltage is applied, is less than 2 seconds.
The M3 can measure distorted sinewaves such as the outputs from SCR circuits, or non-sinusoidal waveforms such as pulse trains with duty cycles as low as 43. The photograph in Fig. 7 shows the measurement of the RMS voltage from a silicon controlled rectifier. The RMS value of the displayed waveform is the reading at
Fig. 5. Voltage level at any point on this A/D waveform can be made by positioning the gate to start at the desir~d point.
Fig. 6. The S2·Sl mode being used to ac· curately measure rate·of-rise on a ramp signal. The voltage difference is+2.35 V and elapsed time 20.92 µs.
Fig. 7. True Rl\,fS value of SCR is measured by the M3/7Dl2.
14
Fig. 8A. Measuring true R:MS value of AC+DC waveform.
Fig. 8B. Measurement of same waveform with DC component removed by AC coupling.

(
upper left, and the lower reading is the vertical display sensitivity. Another example, showing the effect of DC on the RMS measurement is shown in Fig's. SA and 8B. The waveform in Fig. 8A is a 2-volt pulse with a I-volt DC component. Fig. 8B is the same pulse with the DC component removed by AC coupling the M3. If the pulse were symmetrical, the RivIS value in the DCcoupled reading would be V2 times the AC-coupled reading since ERMS = j (DC) 2+ (ACRMs) 2 and, in this instance, ACRMS =DC = 1 volt.
Now, let's take a look at how the M3 functions. The block diagram of the M3 is shown in Fig. 9. Following the input attenuator, the signal progresses through two separate channels. The lower channel is an amplifier for conditioning the signal for display as an analog signal, or waveform, on the CRT. The modulator allows the floating input to be transformer coupled to the chassis-referenced 7D 12 display amplifier. Bandpass of the analog channel is DC to 700 kHz.
The upper channel converts the input signal to a DC voltage equivalent to the RMS value, for driving the A/D converter in the 7D 12. The operational rectifier and voltage-to-current converter, although shown as two separate blocks, are difficult to separate physically. A simplified circuit diagram of the two is shown
HIGH
COM
INPUT ATTN .
OPERATIONAL RECTIFIER
VOLTAGE TO CURRENT
CONVERTER
IK:in I
in Fig. IO. vVhen the input is a positive signal, the current path is through Q 1, Rand CR2; when negative, it is through Q21 R and CR 1• The voltage across R is Ke1N
and you will note that the current flows unidirectionally in the output. The output current is thus proportional to the absolute value of the input voltage. To prepare the signal for squaring, the output current is divided into two equal parts for driving the multiplying circuit. These two equal currents then pass to the
gain cell which squares, averages and takes the square root of the input currents. The output of the gain cell is equal to the RMS value of the input voltage to the rvI3, but is referenced to some positive voltage rather than the common buss. By using a summing amplifier this positive voltage is subtracted, bringing the output back to the common reference for driving the 7Dl2.
Summary
The 7D 12, with its plug-in modules, adds important new measurement capability to your 7000-Series Oscilloscope. And, it is measurement capability with digital accuracy. True RMS voltage, DC voltage, resistance, temperature, and voltage difference between any two selectable points on a waveform are all measurements available to you using the 7Dl2 plug-in. ~
CURRENT DIVIDER l~I
GAIN CELL TOA·D
CONVERTER 7Dl2
MODULATOR ISOLATION
TRANSFORMER DEMODULATOR
TO DISPLAY AMP 7012
CRl
CR2
lOMHz Osc.
Fig. 9. Block diagram of the M3 true RMS volts module.
Fig. 10. Simplified block diagram of operational rectifier and voltage-to-current converter used in M3.
15

Teknique
Digitizing and displaying fast pulses
Hale Farley
Did you know that high-speed signals can be quickly made computer compatible? Or that they can be
displayed on a large screen TV monitor in real time or stored on an X-Y monitor in a refreshed mode? The TEKTRONIX R7912 Transient Digitizer can digitize signals that occur in a few tenths of a nanosecond. The signal is captured on a diode-array target at sweep rates
Dr. Gail Massey of the Oregon Graduate Center making adjustments to a pulsed neodymium Y AG laser, using the R7912.
16
up to 500 picoseconds per division. In the DIGITAL mode, it is scanned off at a rate slow enough for a minicomputer to handle, with a maximum writing rate equivalent to 8,000 div/ µs. The NON STORE mode provides bright, large screen displays at writing rates equivalent to 30,000 div j 1_is.
Just how fast is 500 picoseconds? The fastest entity known is light. In 500 picoseconds, light travels about six inches. One source of light pulses which is receiving increasing attention in many research laboratories is the laser. A laser (light amplification by stimulated emission of radiation) is a source of energy that occurs within a very short time frame.
The pulse train produced by a mode-locked laser often has fast pulses that are separated by only a few nanoseconds. A switching method such as a dye cell is used in conjunction with a mode-locked laser to permit only a single pulse train to leave the laser cavity. The individual pulses within the train can be as short as five picoseconds. The ability to capture and display a single pulse is limited by the response of the detector and the measurement instrument. vVith the R7912 and the 7A21N Direct Access Plug-in, instrument risetime is 350 picoseconds at a sensitivity of 4V /div or less.
Fig. I shmvs a very simple mode-locked laser ·which produces nvo basic waveforms ·which can be analyzed with the R79 l 2. Response of the llashlamps can be measured with the R7912 by either of two methods. One is to place a current-sensing resistor in series with the power lead for each lamp. A drawback of this method is that multiple signal channels are needed, one for each lamp. A preferred method of measuring Hashlamp response is with a light pipe and photo-diode detector. Now, the display shmvs the actual Hashlamp output on a single channel. The R7912 can be operated in the NON STORE mode to provide a real-time display for adjusting the Hashlamps and setting the pumping power. In the DIGITAL mode, the R79l2 digitizes the waveform to allow computer action on the signal or for automatic computation. Some of the data that can be obtained from this setup is:
• Total light output. • Duration of light pulse. • Peaks, breaks, or other irregularities in the power
curve. • Area under the curve for indication of power (may
be determined automatically by the computer). • Auto-feedback calibration of the pumping power
to maintain desired light output (under computer control).
1Naveform B shown in Fig. l is the pulse-train output of the mode-locked laser. Normally, this signal is ob-

)
tained using a beam-splitter mirror and a photo-diode detector. Again, the R7912 can be operated in the NON STORE mode to produce a real-time display which makes system setup easy. The large screen TV monitor allows you to view the detector output easily, even from across a brightly lighted room, while you make system adjustments. This waveform can also be computerized for measurement of output power, Fast Fourier Transform computations, or many other computer-aided functions.
A typical laser system is shown in Fig. 2. 'Some of the points where measurements could be made with an R79 l 2 are identified by the detectors shown in this diagram. Typical waveforms that would result at these measurement points are also shown . A Pockel cell is a typical optical switch used in laser systems. It switches fast enough to select an individual pulse out of the
OSGI LLATOR CAVITY
0 0
10 MS/DIV TO 100 MS/DIV----~
WAV EFOR M A . Flash lam11 output is norma ll y measured
in terms o f microseconds .
Fig. I. Mode-locked laser.
LASER OSC ILLA TOR
OPTI CAL SWITC H
"'~"' AMPLI FI ER
0
DEVICE BEAM SPLITTER
PHOTO·DIO~ DETECTO~~ I
WAVEFORM B. Typica l pu lse· train ou tput of
mode . locked laser .
BEAM CHAMBER SPLITTER
>
PH OTO-DIODEL,.J DETECTOR (=' I ) I
> PHOTO·DI ODµ
DETECTOR (~; ii
J~ DETECTOR 1=31
~~~ 10 NS/DI V 500 ~S/D I V 10 MS/D IV -----
WAVE FORM A. Rejected pu lse train .
WAV EF ORM B. Selec ted µulse (time sca le expanded)_
Fig. 2. Measurements in laser system.
WAVE FOR M C. Detector output.
mode-locked pulse train. The rejected portion of the pulse train can be sensed by photo-diode detector #I and compared with the amplified output at photodiode detector #2 to see if a complete single pulse came through the optical switch and how cleanly this pulse was extracted from the pulse train.
A variety of detectors could be used to measure the effect of the pulse at the target. Choice of the detector would be determined by the phenomenon you desire to measure at the target. Some typical detectors used are:
• Photo diode-measures photon flux ; i.e., photons of various energies and X-rays.
• Faraday cup-measures charge of particles. • Energy/ charge analyzer- measures energy versus
charge. • Beta spectrometer-measures electrons of various
energies. • Secondary electron detector- rneasures work-func
tion characteristics o[ various materials. • Neutron detectors-measures neutron activity .
\ 1Vaveform C is a typical outp ut waveform produced by any o1 the above detectors.
As in the previous measurement, the R7912 can be used either in the NON STORE or the DIGITAL mode. For system setup and alignment or real-time analysis of measurement results, the NON STORE mode used with a TV monitor provides a good display. However, some high-powered lasers must allow several minutes to elapse between pulses. In that circumstance, the DIGITAL mode used with a storage monitor provides the best display. This setup allmvs the display to be viewed and analyzed for extended periods. Also, new information can he written over the previous trace for direct comparison.
VVe men ti on eel previously that the output signal from the detectors can be digitized for computer analysis. It is not feasible in these limited pages to describe in detail the computations tha.t can be made on these signals by the computer. The operating capabilities are 111ainly lilllited by the abilities of the programmer and physical limitations of the computer.
Jn this article, we have given only an over-view of the measurement capability of the R79 l 2 Transient Digitizer. \1Vhile we have not answered all of the questions you may have regarding measurements to be made with this system, we hope to have implanted the seeds o[ a few ideas which will germinate into solut ions [or your individual measurernent problems. ~
17

Servicescope Getting around in Tektronix Instruments
Most electronic equipment is pretty complex inside. Especially when it comes to locating specific components and circuitry while trouble
shooting the unit.
Serviceability has always been an important design consideration at Tektronix. Beginning with our first instrument, the Type 511 Oscilloscope, we endeavored to make components easy to locate and replace. And leads were soldered in, in a manner allowing them to be easily lifted for troubleshooting. The notched ceramic strips used in later instruments such as the 535 and 545 made servicing almost a pleasure.
Now, with the use of printed circuit boards and the automatic insertion and soldering of components, servicing has become a bit more difficult. Components are reduced in size and component density is vastly increased. Locating and replacing specific components on a crmvded circuit board can be a real problem. Here are some of the things we are doing at Tektronix to make it easier for you.
<.? z -q-~(.) :c 0.

)
Printed Circuit Board Marking Much can be done to accommodate component marking if proper attention is given to this ·when designing the circuit board. ' 'Vith space limited, we assign priority to marking active devices such as transistors and IC's, adjustable components, plugs and connectors, and danger points. Both the circuit symbol and control name are usually shown for adjustments. :Markings follow the A.S.A. code for component symbols-"Q" designates transistors, "U" integrated circuits, "CR" diodes, "K" relays and so forth. Incidentally, you will find most active devices mounted in sockets rather than soldered on the circuit board.
The location of the number one pin for IC's, and the proper orientation for multi-lead connectors are also noted on the printed circuit board. Some of the most useful markings are test points denoted by "TP". These correspond to test points shown in the manual schematics and usually have provision for easily attaching a probe. The instruction manual also contains photos of each printed circuit board with all components and adjustments labeled.
Connectors Play an Important Part
It's easier to take things apart if leads and cables terminate in connectors. You'll find some real innovations by Tektronix engineers in this area. The Peltola connector provides a compact, inexpensive means of connecting shielded leads to the printed circuit board. Harmonica connectors accommodate ten-lead ribbon cable in a minimum of space and are easy to put on or disconnect. And unique inter-board connectors provide direct connection between circuit boards without the need for cabling.
Color Coded Wires
This year Tektronix applied color-coding stripes to over 75 million feet of wire for use in our instruments. Another 6 or 7 million conductor feet of ribbon cable, also color coded, is supplied by outside vendors. These brightly colored leads enhance the internal appearance of Tektronix instruments, but that isn't the primary purpose for color coding. It serves a very useful function in building the instrument and in servicing it.
The color-coding scheme is basically in accordance with 1'vIIL-STD-681B. The color of the wire insulation identifies the fun ction of the lead as follows:
Black - Grounds Brmvn- Heaters and filaments Reel B+ pmver supplies Violet - B- pmver supplies Gray - Internal AC Pmver White - Signal leads
Color stripes are added to these solid-colored backgrounds to further identify the lead. For example, a floating ground is black ·with a white stripe. The red and violet power supply leads are coded to denote their deviation from ground or zero voltage as follows (the numbers corresponding to the standard resistor color code):
+
0
4th supply 3rd supply 2nd supply 1st supply
1st supply 2nd supply 3rd supply 4 th supply
2-4 & 2-4X Series 2-3 & 2-3X Series 2-1 & 2-IX Series 2-0 & 2-0X Series
7-0 & 7-03 Series 7-1 & 7-IX Series 7-2 & 7-2X Series 7-3 & 7-3X Series
For example, the 2-0 and 2-0X series are used for the first, or lowest, positive power supply. The 2-0 lead is the regulated bus. The 2-01 is the decoupled 2-0 supply. If another lead is needed the 2-03 code is used. The most unregulated lead in this supply is coded 2-09, and if another lead is needed, the next most unregulated lead is coded 2-08.
The gray base color is used for internal AC wiring. Conductors for the line (hot) side, starting at the AC input, are color coded 8-0, 8-01, 8-02 in sequence. The black stripe corresponds to the black lead in the pm,ver cord.
Conductors for the neutral (cold) side are color coded 8-9, 8-19, 8-29 in sequence; the white stripe corresponding to the ·white lead in the power cord.
Signal leads have a white base color. The stripes are used only for lead identification· and have no significance.
The use of ribbon cable complicates the use of color coding to code wires according to function. In fact, it becomes a practical impossibility considering the variety of ribbon cables used. There is a practical coding scheme that is useful, however. Color can be used to denote the lead position in the cable. For example, all leads in a ribbon cable have a base white color. The first lead, which '"'ill be connected to slot number one in a connector, has a brown stripe; the number two lead has a red stripe and so on. This color scheme is used on ribbon cables with two or more conductors.
Summary
Getting around in electronic instruments can be frustrating and time consuming. Well-marked chassis and printed circuit boards, color-coded wiring, and innovative connectors are all designed to make it easier to get around in your Tektronix instruments. ~
19

1972-73 Tekscope Index
January 1972 Volume 4 Number I
The 7Ll2 Spectrum Analyzer Plug-In/Frequency Stabilization Techniques/Optimizing l'vfixer Performance Using the 7LI2/Servicing the I401A Spectrum Analyzer
Ma1·ch 1972 Volume 4 Nmnber2
A Nanosecond Portable Oscilloscope/A Review of Basic Counter Principles/A Potpourri of Servicing Aids
May 1972 Volume 4 Number 3
A New Dimension in Plug-In Instrumentation/The 7704A-Extended Performance Plus lHodularity / Semiautomatic Testing with the Curve Tracer /Instruction l\Ianuals, A Service Technician's Best Friend
July 1972 Volume 4 Number 4
Three New Instruments, Three Kinds of Storage/Tektronix Looks at Light/In-Circuit Testing of Tunnel Diodes/\Vashing Your Tektronix Instruments
September 1972 Volume 4 Number 5
The New Look In Portables/The Oscilloscope-Controlled Counter/Differential Amplifier Techniques Part I/ Servicing the 432 / 434 Oscilloscopes
November 1972 Volume 4 Nmnber6
Progress In Semiconductor Testing/Linear IC Testing with the Curve Tracer/Oscilloscope to Curve Tracer with One Plug-In/Delaying Sweep Goes Digital/Differential Amplifier Techniques Part II/ Senicing 5100-Series Display Units
January/February 1973 Volume 5 Number I
Tests and Measurements with TEKTEST III/Differential Amplifier Techniques Part III/Repairing Oscilloscope Probes
March/ April 1973 Volume 5 Number 2
The Oscilloscope 'With Computing Power/Portable Power/Preserving Scope Bandwidth and Sensitivity /Senicing the 7T1 I Trigger Circuit
May/June 1973 Volume5Number3
A Simple Sampling Oscilloscope/TwoBright Dotson the Measurement Horizon/Dual-Trace Sampling 1\:Ieasurements/Servicing the 7T1 I Sweep Circuit
July/August 1973 Volume5Number4
The TEKTRONIX Calculator-It All Adds Up/The Calculator and You/A Close-Up Look/PROGRAl\JMING-As Easy As 'Writing A Formula/Reliable By Design
Septembe1·/0ctober 1973 Volume 5 Number 5
Philosophy of Product Design/ A New Approach to Multi-Function Instrumentation/ A New HighSpeed Logic Pulser for Logic Testing/A Time Mark Generator with Error-Percentage Readout/ Operational Amplifier Applications/ A New 225-MHz Universal Counter /Timer /Verification or Calibration? A Time Saving Decision
November/December 1973 Volume 5 Number 6
A New Way to Look at Transients/A Fast A/D Plug-In for the Oscilloscope/Digitizing and Displaying Fast Pulses/Getting Around in Tektronix Instruments/1972-73 Tekscope Index
A2784


![TEKSCOPE - w140.comw140.com/tekscope_scans/Indiv_Issue_Scans/7-3_1975.pdf · LO give you more up-tn-datein[orJnation OJ] TEKTROi\!X instruments our customers wish to utly or sell.](https://static.fdocuments.us/doc/165x107/5b55e0bd7f8b9a18618c045a/tekscope-w140-lo-give-you-more-up-tn-dateinorjnation-oj-tektroix-instruments.jpg)