Technology One Limited - ASX2017/11/21 · Technology One Limited Appendix 4E 30 September 2017...
117
1 Technology One Limited ABN 84 010 487 180 Appendix 4E and Annual Financial Report for the year ended 30 September 2017 For personal use only
Transcript of Technology One Limited - ASX2017/11/21 · Technology One Limited Appendix 4E 30 September 2017...

1
Technology One Limited ABN 84 010 487 180
Appendix 4E and Annual Financial Report
for the year ended 30 September 2017
For
per
sona
l use
onl
y
1
Technology One Limited ABN 84 010 487 180
Annual Financial Report - 30 September 2017
Contents PageResults for announcement to the market 1 Directors' report 3 Corporate governance statement 52 Financial statements
Consolidated income statement 60 Consolidated statement of comprehensive income 61 Consolidated statement of financial position 62 Consolidated statement of changes in equity 63 Consolidated statement of cash flows 64 Notes to the consolidated financial statements 65
108 109
Directors' declaration Auditor's Independence Declaration Independent auditor's report to the members 110
For
per
sona
l use
onl
y

1
Technology One Limited Appendix 4E
30 September 2017
Results for announcement to the market 2017 2016 $'000 $'000
Revenue for ordinary activities Up 10% to 273,253 249,018 Profit from ordinary activities after tax attributable to members Up 8% to 44,494 41,344 Net profit for the period attributable to members Up 8% to 44,494 41,344
Dividends
Current period
Amount per security
Cents
Franked amount per
security Cents
Interim dividend 2.60 1.95 Final dividend 5.60 4.20 Special dividend 2.00 1.50
Prior period Interim dividend 2.36 2.36 Final dividend 5.09 5.09 Special dividend 2.00 2.00
The record date for determining entitlements to the final dividend of 5.60 cents per share and special dividend of 2.00 cents per share for the year ending 30 September 2017 is 29 November 2017. Conduit foreign income of 0.728 cents per share on the final dividend and 0.260 cents per share on the special dividend will be paid. The payment date for the final dividend is 14 December 2017.
2017 Cents
2016 Cents
Profit from ordinary activities after tax attributable to members
Basic EPS 14.18 13.26
Diluted EPS 14.10 13.11
Weighted average number of ordinary shares outstanding during the period used in the calculation of the Basic EPS 313,865,453 311,780,703
For
per
sona
l use
onl
y
2
Technology One Limited Appendix 4E
30 September 2017 (continued)
NTA backing 30 Sept 2017 Cents
30 Sept 2016 Cents
Net tangible asset backing per ordinary share 35.04 29.00
Compliance statement
The report is based on the consolidated financial report which has been audited.
Refer to the attached full financial report for all other disclosures in respect of the Appendix 4E.
Signed:
A Di Marco
Brisbane 21 November 2017
For
per
sona
l use
onl
y

Technology One LimitedDirectors' report
30 September 2017
3
Directors' report
Your directors present their report on the consolidated entity (referred to hereafter as the Company) consisting of Technology One Limited and the entities it controlled at the end of, or during, the year ended 30 September 2017.
Directors
The following persons were Directors of Technology One Limited during the financial year and up to the date of this report:
Adrian Di Marco B Sc, MAICD, FACS Appointed 8 December 1999.
Experience and expertise Mr Di Marco founded TechnologyOne in 1987, after extensive experience in the software industry in the area of large scale fixed time and fixed price software development. Mr Di Marco has over 35 years’ experience in the software industry. He has been responsible for all operational aspects of TechnologyOne, as well as the strategic direction of the company.
Mr Di Marco has played a major role in promoting the Australian IT industry, and is a past director of the Australian Information Industry Association, the industry’s peak body. He has been a director of a number of IT companies. He has also been actively involved in charitable organisations, and is a past director of the Royal Children’s Hospital Foundation Board. He is a member of the Australian Institute of Company Directors and a Fellow of the Australian Computer Society. Mr Di Marco has received extensive recognition for his contribution and pioneering work for the IT industry. He remains a major shareholder of TechnologyOne.
Mr Di Marco is the Executive Chairman of TechnologyOne, and Chief Innovation officer for the company. He continues to work with the executive team and Board. He continues to focus on strategy, innovation and creativity to ensure the company continues to build future platforms for strong growth.
Special responsibilities Chairman of the Board, and Chief Innovation Officer.
Interests in shares and options 31,372,500 ordinary shares in Technology One Limited held beneficially through Masterbah Pty Ltd.
6,000 ordinary shares in Technology One Limited held via family trust.
Ron McLean Appointed 8 December 1999.
Experience and expertise Mr McLean has more than 40 years experience in the enterprise software industry including holding Senior Executive and Managing Director roles in several International and Australian Software companies.
His involvement in the enterprise software industry has included leading and managing software development, consulting and sales and marketing teams.
Mr McLean joined the Board as a Non Executive director in 1992 was appointed as the General Manager in 1994, Chief Operating Officer in 1999 and was the promoted to Chief Executive Officer of Operations in 2003.
Mr McLean retired from this role at TechnologyOne on the 15th July 2004 and remains a Non Executive Director.
Interests in shares and options 101,000 ordinary shares in Technology One Limited held beneficially through RONMAC Investments Pty Ltd.
40,000 ordinary share in Technology One held via a Pension fund.
For
per
sona
l use
onl
y

Technology One LimitedDirectors' report
30 September 2017 (continued)
4
Directors’ (continued)
John Mactaggart FAICD Appointed 8 December 1999.
Experience and expertise Mr Mactaggart’s experience spans industries such as agriculture, agri-tech, manufacturing and software. He is a co-founder of Brisbane Angels, and an active investor and mentor in a large number of entrepreneurial ventures. Mr Mactaggart played an integral role in the creation, funding, and development of TechnologyOne and remains a major shareholder. Mr Mactaggart has been a Fellow of the Australian Institute of Company Directors since 1991.
Interests in shares and options 42,872,500 ordinary shares in Technology One Limited held beneficially through JL Mactaggart Holdings Pty Ltd. 30,000 ordinary shares in Technology One Limited held via family trust.
Kevin Blinco B Bus, FCA Appointed 1 April 2004.
Experience and expertise Mr Blinco is a former director and chairman of Business Advisory accounting firm Moore Stephens Brisbane Ltd. He has over 30 years’ experience in the areas of business services and planning, investment strategies, management and financial advice. Mr. Blinco is a director of a number of unlisted companies. His expertise is broadly respected and acknowledged throughout the business community. He is a Fellow of the Institute of Chartered Accountants and a Member of the Institute of Company Directors.
Special responsibilities Chairman of the Audit Committee and Remuneration Committee.
Interests in shares and options 260,000 ordinary shares in Technology One Limited held beneficially through Autun Pty Ltd ATF Blinco Accumulation Superannuation Fund.
Richard Anstey FAICD, FAIM Appointed 2 December 2005.
Experience and expertise Mr. Anstey has more than 35 years experience in I.T. & telecommunications industries and in associated investment banking and funds management roles. Most of his career he has been building and managing his own companies. The first being Tangent Group Pty Ltd established a strong reputation for software and strategic advice for the banking and finance sector. After the sale of Tangent, he co-founded inQbator which became iQfunds as an early stage investment group focused upon the technology, telecommunications and life sciences sector. iQFunds has managed 3 Federal Government backed seed funds, the last being iQFund 3 and has invested in over 30 companies over the past 15 years.
Mr. Anstey now continues his career in venture capital and corporate advisory roles through iQFunds. Mr. Anstey is a Director and Non-Executive Chairman of Veriluma Limited (ASX: VRI).
Special responsibilities Chairman of the Nomination Committee.
Interests in shares and options 19,000 ordinary shares in Technology One Limited. F
or p
erso
nal u
se o
nly

Technology One LimitedDirectors' report
30 September 2017 (continued)
5
Directors’ (continued)
Jane Andrews PhD GAICD Appointed 22 February 2016.
Experience and expertise Dr Jane Andrews joined the Board in 2016, bringing more than 15 years’ leadership experience in research and innovation-based organisations.
As a founder and investor in numerous innovative companies, Dr Andrews has extensive experience in corporate strategy, entrepreneurship, commercialisation, innovation, research and development.
Dr Andrews is a Graduate of the Australian Institute of Company Directors, holds a PhD in Life Sciences, a Bachelor of Science (First Class Honours) and a Graduate Diploma in Applied Finance and Investment.
Interests in shares and options 24,300 ordinary shares held in Technology One Limited held beneficially through the Sarabande Zenith Jewel Trust.
Company Secretary Stephen Kennedy BBus, FGIA Appointed 13 April 2017.
Mr Kennedy was appointed Company Secretary on 13 April 2017 and has been employed with TechnologyOne since January 2017.
Meetings of directors The numbers of meetings of the Company's Board of Directors and of each Board Committee held during the year ended 30 September 2017, and the numbers of meetings attended by each director were:
Where a director did not attend all meetings of the Board or relevant committee, the number of meetings for which the director was eligible to attend is shown in brackets. In sections where there is a dash, the director was not a member of that committee.
Full meetings Meeting of committees of directors
(Board)
Audit Nomination Remuneration
A Di Marco 11 - - -R McLean 11 4 - - J Mactaggart 11 - 3(4) 3(4) K Blinco 11 4 4 4 R Anstey 10 (11) 4 4 4 J Andrews 10 (11) 4 4 4
For
per
sona
l use
onl
y
Technology One LimitedDirectors' report
30 September 2017 (continued)
6
Principal activities
The principal activity of Technology One Limited (the Company) during the financial year was the development, marketing, sales, implementation and support of fully integrated enterprise business software solutions, including:
• TechnologyOne Enterprise Asset Management• TechnologyOne Financials• TechnologyOne Human Resource & Payroll• TechnologyOne Enterprise Budgeting• TechnologyOne Supply Chain• TechnologyOne Property & Rating• TechnologyOne Student Management• TechnologyOne Business Intelligence• TechnologyOne Enterprise Content Management• TechnologyOne Performance Planning• TechnologyOne Spatial• TechnologyOne Enterprise Cash Receipting• TechnologyOne Stakeholder Management• TechnologyOne Business Process Management
Dividends - Technology One Limited
Dividends paid to members during the financial year were as follows:
2017 $'000
2016 $'000
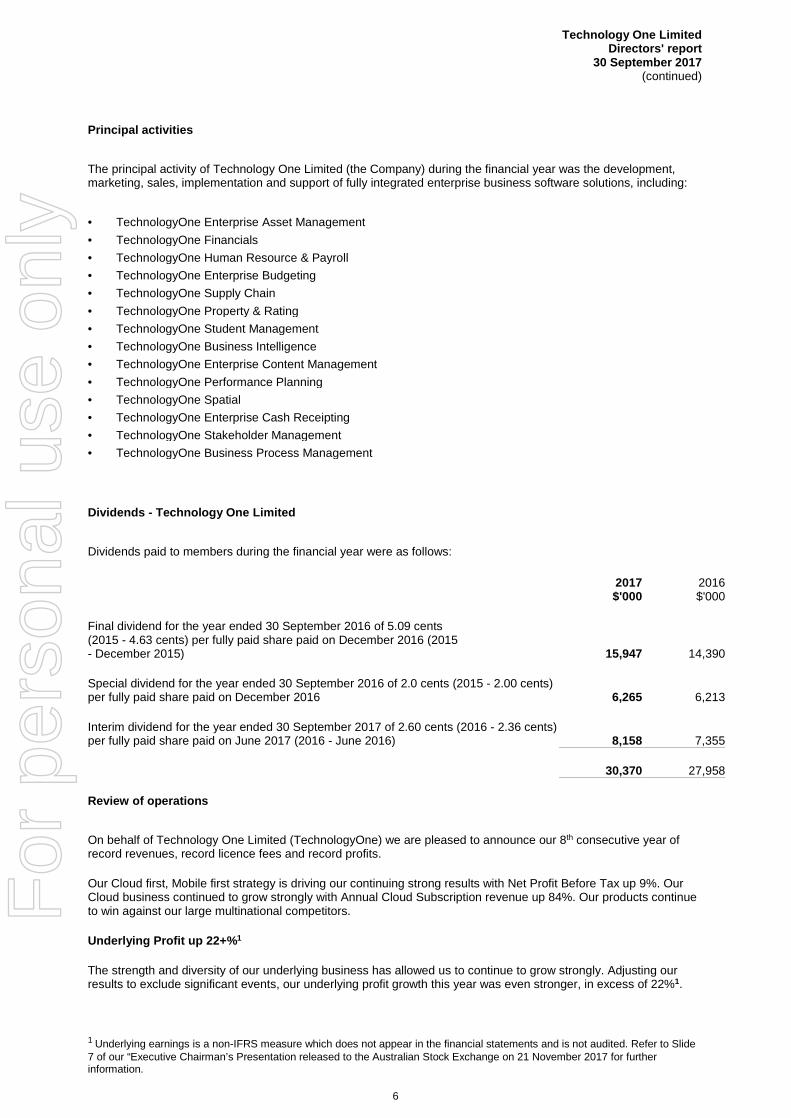
Final dividend for the year ended 30 September 2016 of 5.09 cents (2015 - 4.63 cents) per fully paid share paid on December 2016 (2015 - December 2015) 15,947 14,390
Special dividend for the year ended 30 September 2016 of 2.0 cents (2015 - 2.00 cents) per fully paid share paid on December 2016 6,265 6,213
Interim dividend for the year ended 30 September 2017 of 2.60 cents (2016 - 2.36 cents) per fully paid share paid on June 2017 (2016 - June 2016) 8,158 7,355
30,370 27,958
Review of operations
On behalf of Technology One Limited (TechnologyOne) we are pleased to announce our 8th consecutive year of record revenues, record licence fees and record profits.
Our Cloud first, Mobile first strategy is driving our continuing strong results with Net Profit Before Tax up 9%. Our Cloud business continued to grow strongly with Annual Cloud Subscription revenue up 84%. Our products continue to win against our large multinational competitors.
Underlying Profit up 22+%1
The strength and diversity of our underlying business has allowed us to continue to grow strongly. Adjusting our results to exclude significant events, our underlying profit growth this year was even stronger, in excess of 22%1.
1 Underlying earnings is a non-IFRS measure which does not appear in the financial statements and is not audited. Refer to Slide 7 of our “Executive Chairman’s Presentation released to the Australian Stock Exchange on 21 November 2017 for further information.
For
per
sona
l use
onl
y

Technology One LimitedDirectors' report
30 September 2017 (continued)
7
This year TechnologyOne has had to contend with two significant challenges which we have previously reported upon at the half year:
• Brisbane City Council (BCC) LGS Contract ($4.3m impact on profitability) • Evolve User Conference ($3m impact on profitability)
Looking Forward to 2018 Financial Year
Looking to the 2018 year, we do not expect any further impact to our earnings from these events. With these headwinds removed, this sets us up for another very strong performance in the 2018 financial year.
Our clarity and continuity of vision is the key to our ongoing long-term success. Our vision is based on our unique ‘power of one’ business model that sees TechnologyOne as the only enterprise vendor providing a totally integrated experience to customers, in which we build, market, sell, implement, support and run our world-class enterprise software.
The strength of our product offerings, our enterprise vision, vertical market focus and the resilient nature of the enterprise software market are the foundation for our continuing success. When coupled with our innovation, creativity and substantial ongoing investment into new and emerging technologies, we are well positioned for strong growth in the coming years.
Dividend up 8%
In light of our strong results and our confidence in the coming year, the dividend for the second half has been increased to 5.60 cents per share, up 10% on the prior year. The Board has also proposed once again a special dividend of 2 cents per share. This takes the total dividend, including special dividend, for the year to 10.20 cents per share, an increase of 8% on the prior year. This represents a payout ratio of 72% for the full year.
UP 8%
0.00
2.00
4.00
6.00
8.00
10.00
12.00
2013 2014 2015 2016 2017
Cent
s per
shar
e
Dividend Last 5 Years
Special Div(cps)
DPS (cps)
Compound Growth 16%
For
per
sona
l use
onl
y

Technology One LimitedDirectors' report
30 September 2017 (continued)
8
Results Summary
Highlights of our results include:
• Net Profit Before Tax of $58m, up 9%• Underlying profit excluding significant events of $65m, up 22% (refer above)• Revenue of $273m, up 10%• Total Expenses of $215m, up 10%• Total R&D expenses of $49.9m, up 8%, which is 18% of revenue
Our results by revenue stream are as follows:
• Total Annual Subscription Revenue of $139m, up 17%. This consists of:• Annual Licence Fees of $120m, up 11%• Annual Cloud Contract Value (ACV) of $27.1m, up 69%1
• Initial Licence Fees of $62m, up 10%• Total Consulting Fees of $71m, in line to last year
1 Note: Annual Cloud Revenue recognized this financial year was $19m, up 84%
We have continued to invest heavily in Research and Development, which was $49.9m for the year, as follows:
• Ci, our existing very successful enterprise software suite• Ci Anywhere, our new generation product which supports any and all mobile devices• TechnologyOne Cloud
We continue to take a conservative approach, with all costs associated with these investments being fully expensed as incurred. We expect significant revenue streams to emerge from these investments in future years. These items are discussed in more detail later in this letter.
TechnologyOne Cloud continues to grow very strongly
The TechnologyOne Cloud continues to grow very strongly with Annual Contract Value (ACV) now $27.1m, up 69%. We have added 112 new customers to the TechnologyOne Cloud this year, taking the number of enterprise customers on the TechnologyOne Cloud to over 270 customers.
Once again, we have found that all our large contract wins this year, were based on the TechnologyOne Cloud.
We expect this strong growth to continue in the years to come. Our target is to once again grow this business strongly with Annual Contract Value to reach $42m in the next 12 months, an increase of 55%.
As previously forecasted the TechnologyOne Cloud achieved a critical milestone this year, contributing a profit of $2.5m this year, versus a loss of $2.2m last year, as our single instance, mass production, Software as a Service
$10.1MUP 145%, ($6.0M)
$16MUP 100%, ($8M)
$18.6MUP 84%, ($8.5M)
$27.1MUP 69%, ($11.1M)
$33MUP 77%, ($14.4M)
$42MUP 55%, ($14.9M)
0.05.0
10.015.020.025.030.035.040.045.0
Cloud Revenue Billed Annual Contract Value Signed
$'m
FY15
FY16
FY17
FY18Forecast
For
per
sona
l use
onl
y
Technology One LimitedDirectors' report
30 September 2017 (continued)
9
(SaaS) offering achieved critical mass. We remain confident that as we continue to achieve greater scale in this business, it will become a platform for the generation of significantly more profits in the coming years.
As we move forward our focus will now move away from ‘top line’ revenue growth to achieving continuing growth in profitability. Our Cloud 8.0 and 9.0 architecture, which further builds on our new massively scalable, mass production architecture, will be key to achieving this goal.
TechnologyOne Cloud has now been independently audited and recommended to be certified for the Federal Government IRAP security standard, making us the first enterprise SaaS vendor to achieve this high level of security accreditation in Australia which gives us a significant competitive advantage. We are now seeing a significant increase in business in the Federal Government arena.
Continued Market Focus Our focus on specific markets once again underpinned our success. We continue to be very strong in Local Government, Higher Education, Health / Community Services and Federal Government. We see opportunities for substantial growth in the coming years in State Government, Asset / Project Intensive Industries and Financial Services. We see that we have substantial room to continue to grow in our chosen markets.
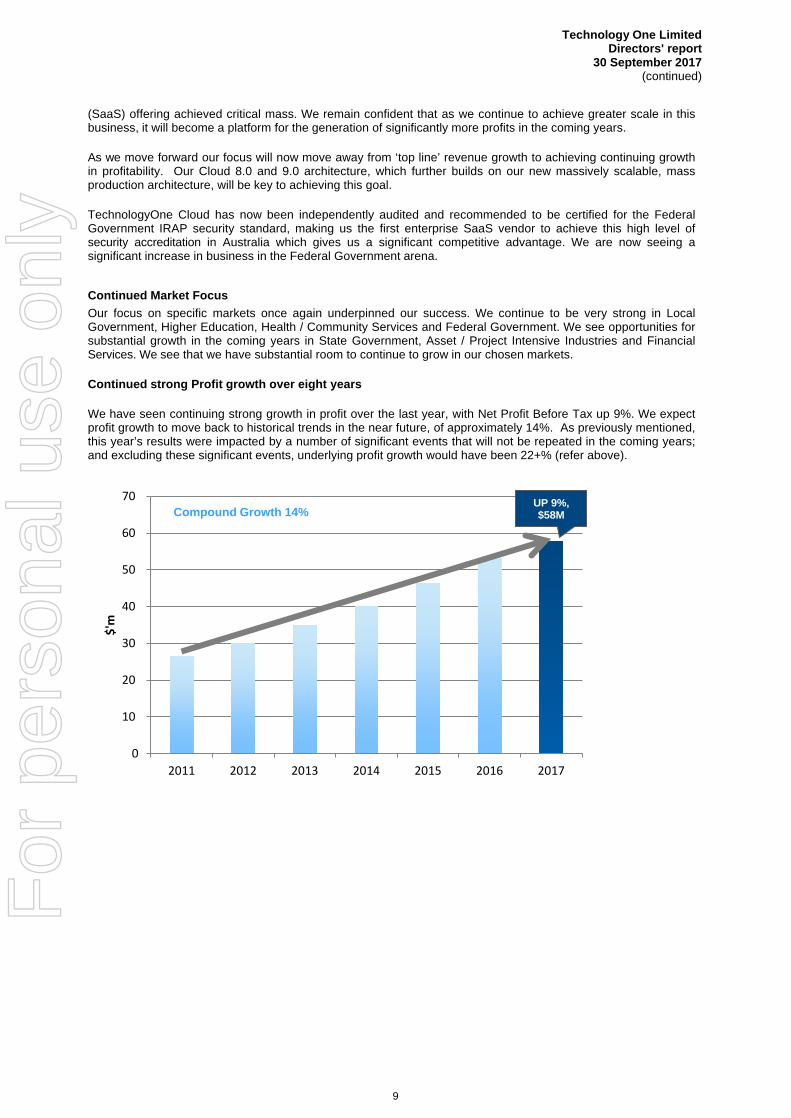
Continued strong Profit growth over eight years
We have seen continuing strong growth in profit over the last year, with Net Profit Before Tax up 9%. We expect profit growth to move back to historical trends in the near future, of approximately 14%. As previously mentioned, this year’s results were impacted by a number of significant events that will not be repeated in the coming years; and excluding these significant events, underlying profit growth would have been 22+% (refer above).
UP 9%, $58M
0
10
20
30
40
50
60
70
2011 2012 2013 2014 2015 2016 2017
$'m
Compound Growth 14%
For
per
sona
l use
onl
y
Technology One LimitedDirectors' report
30 September 2017 (continued)
10
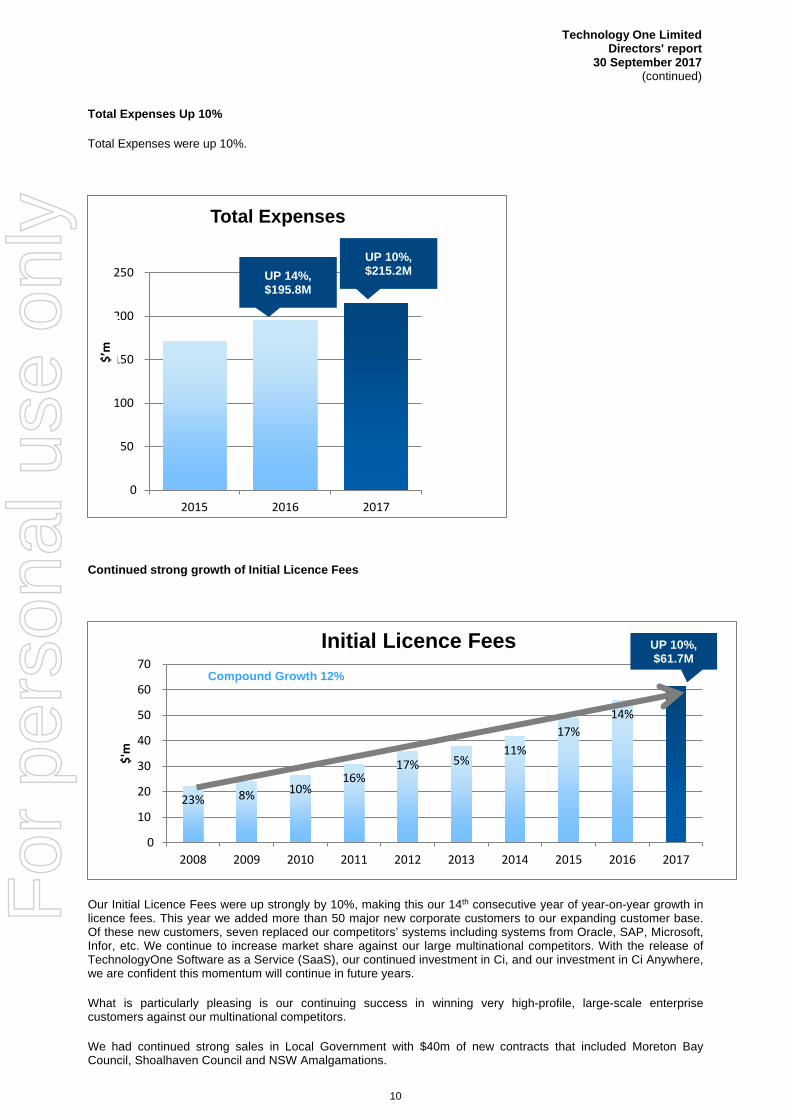
Total Expenses Up 10%
Total Expenses were up 10%.
Continued strong growth of Initial Licence Fees
Our Initial Licence Fees were up strongly by 10%, making this our 14th consecutive year of year-on-year growth in licence fees. This year we added more than 50 major new corporate customers to our expanding customer base. Of these new customers, seven replaced our competitors’ systems including systems from Oracle, SAP, Microsoft, Infor, etc. We continue to increase market share against our large multinational competitors. With the release of TechnologyOne Software as a Service (SaaS), our continued investment in Ci, and our investment in Ci Anywhere, we are confident this momentum will continue in future years.
What is particularly pleasing is our continuing success in winning very high-profile, large-scale enterprise customers against our multinational competitors.
We had continued strong sales in Local Government with $40m of new contracts that included Moreton Bay Council, Shoalhaven Council and NSW Amalgamations.
UP 14%, $195.8M
UP 10%, $215.2M
0
50
100
150
200
250
2015 2016 2017
Total Expenses
23% 8% 10%16%
17% 5%11%
17%14%
UP 10%, $61.7M
0
10
20
30
40
50
60
70
2008 2009 2010 2011 2012 2013 2014 2015 2016 2017
$'m
Initial Licence FeesCompound Growth 12%
$’m
For
per
sona
l use
onl
y

Technology One LimitedDirectors' report
30 September 2017 (continued)
11
We also secured strong sales in Australia’s Federal Government with Department of Industry and Science (DIIS) and The Treasury selecting us to provide shared services to other departments using TechnologyOne Software as a Service (SaaS).
We also saw strong sales into Education with wins that included Victoria University, University of Sussex and Sydney Catholic Schools.
Subscription Licences continue to grow strongly
An important goal has been to move our business away from perpetual licences, and to move all new business to five-year subscription licences, to create a strong, long-term annuity business. This year we achieved over 85% of all new business being recurring subscription licences. Total subscription licences were $31.7m, up 150%.
What is important to note is that once the five-year subscription period comes to an end, we expect customers to continue to use and subscribe to the software on an annual basis, which will create significant future revenue streams as shown below.
Continued strong growth of Annual Licence Fees
In keeping with our very high customer retention and satisfaction rates in excess of 99%, our recurring Annual Licence Fees once again grew strongly by 11%. Our investment in Ci Anywhere (the continued evolution of our Ci enterprise software) and the TechnologyOne Cloud has been critical to our ongoing success in this area.
02,0004,0006,0008,000
10,00012,00014,000
FY19 FY20 FY21 FY22
'$'0
00
Future Annual Subscription Licence upon completion of existing 5 Year Subscription
Contracts
UP 11%, $119.9M
0
20
40
60
80
100
120
140
2008 2009 2010 2011 2012 2013 2014 2015 2016 2017
$'m
Annual Licence Fees
Compound Growth 14%
For
per
sona
l use
onl
y

Technology One LimitedDirectors' report
30 September 2017 (continued)
12
Consulting Services
Total Consulting Revenue was inline with last year, but the proft contribution was down 46% ($4.5m).
This division was impacted by a number of ‘one off’ events, as follows:
• TechnologyOne Evolve customer conference, which saw all our consultants attend the conference, andwhich impacted our utilisation and other associated costs to an amount of $1.2m.
• The Brisbane City Council (BCC) LGS project, in which TechnologyOne was frustrated by BCC to deliveragainst the contract. This impacted the business unit by $2m.
• The United Kingdom consulting practice loss increased by $1.1m, which was expected as we build thisnew practice.
Consulting Business margins to improve substantially in the coming years
We see significant upside in future years for our Consulting business as it substantially improves its profit margin from the current 7% to a target of approximately 20%, as we implement a new strategy that will see this business separated into two separate and focused business units, as follows: Consulting New Customers and Consulting Existing Customers. These business units will have different cultures, systems and processes to deliver excellence for their respective areas of focus. Consulting New Customers will be project focused, to deliver large and complex projects ‘on time and to budget’. Consulting Existing Customers will be account focused, with a service culture driven by a dedicated service delivery manager, guaranteed service levels, a catalogue of services and premium support. We have appointed a new Operating Officer to implement this strategy, Ms Nancy Mattenberger, who has extensive experience leading the INFOR consulting practice in the USA.
Inline, $71.3M
0
10
20
30
40
50
60
70
80
2008 2009 2010 2011 2012 2013 2014 2015 2016 2017
$'m
Compound Growth 5%
For
per
sona
l use
onl
y

Technology One LimitedDirectors' report
30 September 2017 (continued)
13
Research & Development (R&D)
R&D continues to be a significant investment for TechnologyOne at $49.9m for the year, up 8% and representing 18% of revenue, which still exceeds the average of our competitors of approximately 12%. R&D continues to be fully expensed in the period it is incurred.
R&D continued across our entire Ci Enterprise Suite, as well our next generation product Ci Anywhere and the TechnologyOne Cloud.
We remain committed to delivering Compound Annual Growth (CAG) of 8% or less over the next five years to 2021 (compared to our historical growth rate of 16%), which will save approximately $75m over the five-year period.
Our R&D program in the coming years continues to be at the leading edge of our industry as we embrace new technologies, new concepts and new paradigms. The level of innovation and creativity is greater than at any time in our company’s 30-year history.
Ci Anywhere
Ci Anywhere is the continuation of our very successful Ci product, and allows organisations to embrace smart mobile devices including iPad, iPhone and Android devices, as part of our enterprise solution. We are the only major enterprise software vendor committing to deliver our entire suite of enterprise software and all our functionality on these mobile devices, as we envision a world where all work will be done on these devices in the near future. We see our customers flowing across smart mobile devices throughout the course of their day. Our software has been designed to be incredibly simple to use, and to adapt to the device, allowing customers to continue their work seamlessly as they flow across devices.
Ci Anywhere opens up a new world of possibilities for our customers, allowing them to access their data from any device, anywhere in the world, at any time. It is a new and exciting generation of enterprise software that is incredibly simple to use. Ci Anywhere will enable our customers to embrace the digital revolution.
We continue to work aggressively to complete our Ci Anywhere suite by late 2018.
TechnologyOne Cloud
The TechnologyOne Cloud delivers the TechnologyOne Enterprise Suite as a service through the cloud to our customers. TechnologyOne takes complete responsibility for providing the processing power, software and services, including backup, recovery, upgrade and support services for our cloud customers.
TechnologyOne is one of only a few companies globally delivering true enterprise Software as a Service (SaaS), offering a fully configurable solution, based on a mass production line of servers that run our software for all of our customers in a single instance of software, which provides massive economies of scale to our customers.
TechnologyOne is uniquely placed because we own our software. Unlike hosting providers that simply host someone else’s software in the cloud, we own our software and are able to make a substantial investment each year in ongoing R&D, to continue to improve our software to capitalise on new technologies, concepts and ideas.
0
10
20
30
40
50
60
70
80
90
100
2016 2017 2018 2019 2020 2021
$'m
Projectedfrom 2016
HistoricalGrowth Rate
$96.6m
$67.6m
$29.0mHistorical Compound Growth 16%
Historical Compound Growth 16%
Model Compound Growth 8%
For
per
sona
l use
onl
y

Technology One LimitedDirectors' report
30 September 2017 (continued)
14
Because we run our software for thousands of customers simultaneously, we have optimised our software and built the TechnologyOne Cloud specifically to do this, and we can achieve enormous economies of scale that cannot be achieved by hosting providers. The TechnologyOne Cloud delivers a level of service, security, reliability, scalability and future proofing that hosting providers cannot achieve.
As part of our SaaS offering we automatically make new releases of our software, with new features, functions and concepts, available to our customers. Our customers do not need to do anything to seamlessly get these new releases into production.
TechnologyOne is at the very forefront of delivering the benefits of mass production to the enterprise software industry. As we have seen in other industries, the economies of scale of mass production will change the face of the software industry.
The TechnologyOne Cloud provides a compelling value proposition to our customers, giving them what is essentially a very simple, cost-effective and highly scalable model of computing.
We have now delivered our mass production Software as a Service (SaaS) platform. This provides a massively scalable platform with significant economies of scale.
We have continued to build on our mass production SaaS platform with the release of TechnologyOne Cloud 7.0, which continues to deliver further economies of scale and enhanced security. We are now working on the next generation of our Cloud, 8.0. The pace at which we are innovating is accelerating, and we are seeing many opportunities to continue to improve the features, speed, security, availability and scalability of our cloud for our customers.
We have now migrated all our early adopter customers from our earlier versions of the TechnologyOne Cloud 1.0 to 5.0, to the Cloud 6.0 architecture.
We are excited by the opportunities the TechnologyOne Cloud offers not only to our customers, but to us as well. It will allow us to streamline our operations, reduce our costs, improve our customers’ experience, as well as reduce the time to market for new features and functions. It will allow us to become more creative, more innovative and work in real time with our customers.
All TechnologyOne Cloud costs are fully expensed in the period they are incurred.
Connected Intelligence (Ci)
Ci is our existing highly successful enterprise product suite. We continue to invest in adding new features and functions for our customers, and have committed to the ongoing support of this product on an indefinite basis.
An important part of our strategy is to allow our existing Ci customers to progressively and simply embrace the benefits of our Ci Anywhere offering, as well as the TechnologyOne Cloud when they wish to do so.
United Kingdom
We see the UK as a platform for significant growth for TechnologyOne in the coming years. Our ‘blue ocean’ strategy is gaining traction, which is to provide a total ERP solution for higher education and local government sectors. Important to the success of this strategy will be the introduction of our Human Resources & Payroll (HRP) product and Student Management product to this market. The regionalisation of these products for the UK market is in progress, and we will work with early adopters in the UK to establish these products.
As we bring more products into the UK market, this increases our product offering, and also allows us to move into the less crowded ‘blue ocean’ space, as we will be one of only a few enterprise vendors in the UK market
The challenge for us in the coming years is now to build a large, professional and very successful consulting practice to implement and support our products in the UK region.
This year we have once again increased our footprint in the UK, adding six new customers, taking us to a total of 43 enterprise customers in the region, which now gives us critical mass.
As previously foreshadowed, the challenge for us in the coming years is to build a successful and profitable consulting practice in the UK. This is not an insignificant undertaking. Furthermore, the regionalisation of our products for the UK is much more significant and challenging than originally expected, as we deal with unknown requirements including UCAS, UKVI, HESA and SLC. We expect the regionalisation will be completed late 2018.
Given these facts, we have made the decision to slow our rate of growth in the UK for the next two years so we can address these issues, and focus on our existing customers to ensure that they are all strong reference sites.
For
per
sona
l use
onl
y

Technology One LimitedDirectors' report
30 September 2017 (continued)
15
As part of this strategy we have appointed a new Operating Officer for the UK, from one of our competitors, to lead this next stage of the UK story, with a strong focus on our customers’ success. We expect to return to growth in the UK in the 2020 financial year.
Solution Showcases
Following the success of our Evolve customer conference which saw more than 2,300 attendees, over three days, with 11 concurrent streams by industry, and a huge exhibition area; we have now been running our Showcases throughout Australia, New Zealand and the United Kingdom. These Showcases demonstrate our vision for a digital future, with a focus on our Ci Anywhere enterprise suite and the TechnologyOne Cloud. This event will create significant sales momentum for us in the coming years.
Appointment of new CEO and Chief Operating Officer
Recently TechnologyOne announced the appointment of its long-serving and highly successful Chief Operating Officer, Mr Edward Chung, to the new role of Chief Executive Officer, effective May 23. Mr Chung has been a TechnologyOne executive for approximately 10 years. Mr Adrian Di Marco, TechnologyOne's founder and one of Australia's longest serving CEOs over a period of 30 years, continues in the role of Executive Chairman and Chief Innovation officer. Mr Di Marco continues to work with the executive team and Board to focus on strategy, innovation and creativity to ensure the company continues to build future platforms for strong growth.
These changes have been a long time in the planning and have been openly discussed for the last few years with shareholders and staff. Over the last five years we have built a very strong and talented executive team.
We have also appointed another senior executive, Mr Stuart MacDonald, to the role of Chief Operating Officer for the company, to support Edward in his new role.
Balance Sheet Strength
TechnologyOne continues to have a strong balance sheet with cash and cash equivalents of $93m.Our debt/equity ratio remains conservative at less than 1% and interest cover is over 1,192 times.
Operating cash flow was once again strong at $46m for the full year, versus a Net Profit After Tax of $44.5m, and exceeds our target ratio of 1 times NPAT.
Our Cloud Business is generating significant operating cash flow
An initial concern by investors was that our cloud business would not allow us to continue to generate significant free cash flow. The mass production architecture and significant economies of scale we have been able to achieve has, as expected, seen this business contribute an additional $15.9m of additional free cash flow this financial year.
NPAT $41.3MNPAT $44.5M
$43.7M$46.4M
0
5
10
15
20
25
30
35
40
45
50
0
5
10
15
20
25
30
35
40
45
50
2016 2017
$'m
$'m
NPAT versus Operating Cash Flows
Operating Cash FlowsFor
per
sona
l use
onl
y

Technology One LimitedDirectors' report
30 September 2017 (continued)
16
Corporate structure
The Technology One group of companies consists of the following: • Technology One Limited• Technology One New Zealand Limited• Technology One Corporate Sdn Bhd• Technology One UK Limited• Avand Pty Ltd• Avand Pty Ltd (New Zealand) Pty Ltd• Desktop Mapping Systems Pty Ltd• Digital Mapping Solutions NZ Limited• Boldridge Pty Ltd• Icon Solution Unit Trust• Jeff Roorda & Associates Pty Ltd
Significant changes in the state of affairs
There were no significant changes in the Company's state of affairs during the financial year.
Matters subsequent to the end of the financial year
On 21 November, the directors of Technology One Limited declared a final dividend on ordinary shares in respect of the 2017 financial year. The total amount of the dividend is $17,664,000 and is 75% franked. There was also a special dividend declared for the 2017 financial year of $6,309,000 which is also 75% franked.
No other matter or circumstance has occurred subsequent to period end that has significantly affected, or may significantly affect, the operations of the Company, the results of those operations or the state of affairs of the Company or economic entity in subsequent financial years.
Likely developments
Refer to the Review of Operations section above.
Indemnification and insurance of officers
Insurance and indemnity arrangements established in the previous year concerning officers of the Company were renewed or continued during the year ended 30 September 2017.
An indemnity agreement has been entered into between TechnologyOne and each of the directors of the Company named earlier in this report and with each full-time executive officer and secretary of the Company. Under the agreement, the Company has indemnified those officers against any claim or for any expenses or costs which may arise as a result of work performed in their respective capacities. There is a limit of $25,000,000 for any one claim.
TechnologyOne paid an insurance premium in respect of a contract insuring each of the directors of the Company named earlier in this report and each full-time executive officer and secretary of the Company, against all liabilities and expenses arising as a result of work performed in their respective capacities, to the extent permitted by law.
For
per
sona
l use
onl
y
Technology One LimitedDirectors' report
30 September 2017 (continued)
17
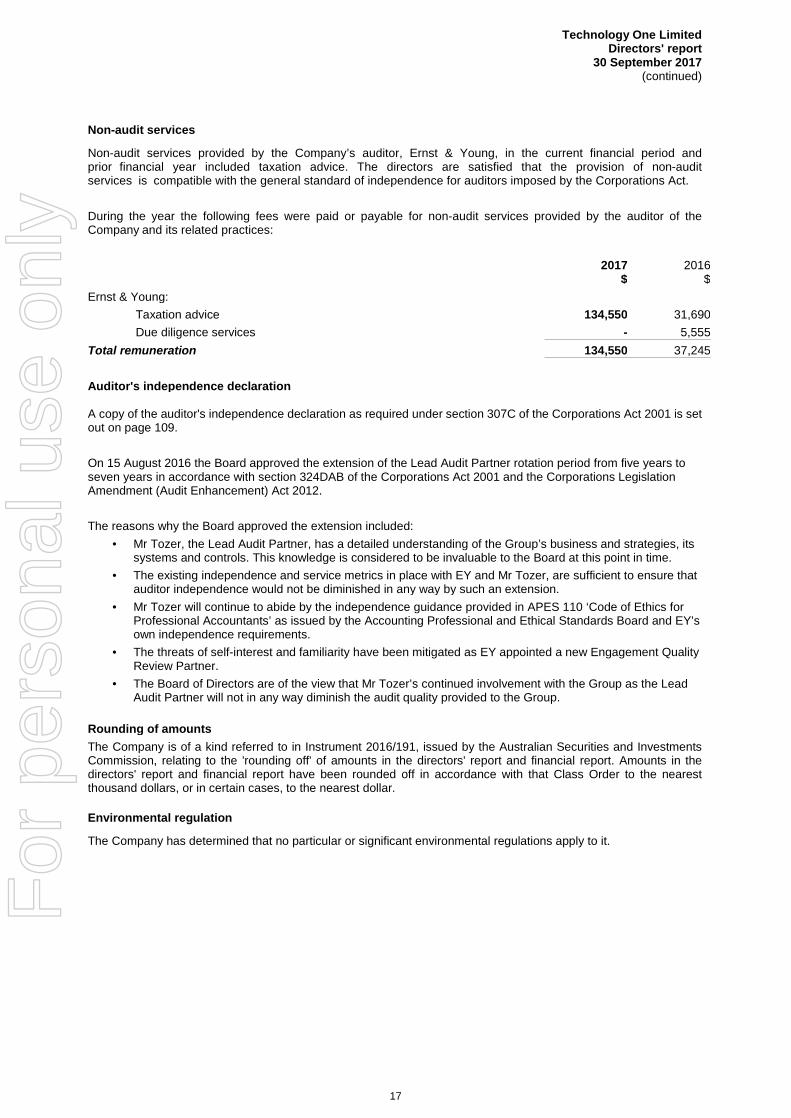
Non-audit services
Non-audit services provided by the Company’s auditor, Ernst & Young, in the current financial period and prior financial year included taxation advice. The directors are satisfied that the provision of non-audit services is compatible with the general standard of independence for auditors imposed by the Corporations Act.
During the year the following fees were paid or payable for non-audit services provided by the auditor of the Company and its related practices:
2017 $
2016 $
Ernst & Young: Taxation advice 134,550 31,690 Due diligence services - 5,555
Total remuneration 134,550 37,245
Auditor's independence declaration
A copy of the auditor's independence declaration as required under section 307C of the Corporations Act 2001 is set out on page 109.
On 15 August 2016 the Board approved the extension of the Lead Audit Partner rotation period from five years to seven years in accordance with section 324DAB of the Corporations Act 2001 and the Corporations Legislation Amendment (Audit Enhancement) Act 2012.
The reasons why the Board approved the extension included: • Mr Tozer, the Lead Audit Partner, has a detailed understanding of the Group’s business and strategies, its
systems and controls. This knowledge is considered to be invaluable to the Board at this point in time.• The existing independence and service metrics in place with EY and Mr Tozer, are sufficient to ensure that
auditor independence would not be diminished in any way by such an extension.• Mr Tozer will continue to abide by the independence guidance provided in APES 110 ‘Code of Ethics for
Professional Accountants’ as issued by the Accounting Professional and Ethical Standards Board and EY’sown independence requirements.
• The threats of self-interest and familiarity have been mitigated as EY appointed a new Engagement QualityReview Partner.
• The Board of Directors are of the view that Mr Tozer’s continued involvement with the Group as the LeadAudit Partner will not in any way diminish the audit quality provided to the Group.
Rounding of amounts The Company is of a kind referred to in Instrument 2016/191, issued by the Australian Securities and Investments Commission, relating to the 'rounding off' of amounts in the directors' report and financial report. Amounts in the directors' report and financial report have been rounded off in accordance with that Class Order to the nearest thousand dollars, or in certain cases, to the nearest dollar.
Environmental regulation
The Company has determined that no particular or significant environmental regulations apply to it.
For
per
sona
l use
onl
y

Technology One LimitedDirectors' report
30 September 2017 (continued)
18
Share options
Unissued shares As at the date of this report, there were 4,199,817 unissued ordinary shares under options (4,199,817 at the reporting date). Refer to note 32 for further details of the options outstanding.
Option holders do not have any right, by virtue of the option, to participate in any share issue of the company.
Shares issued on the exercise of options During the year, employees and executives have exercised options to acquire 2,147,433 fully paid ordinary shares in Technology One Limited at a weighted average exercise price of $1.07. Refer to note 32 for further details of the options exercised during the year.
This report is made in accordance with a resolution of directors.
Adrian Di Marco Executive Chairman
Brisbane 21 November 2017
For
per
sona
l use
onl
y

Technology One LimitedRemuneration report
30 September 2017
19
Remuneration Report (Audited)
The remuneration report contains the following sections.
1. Introduction2. About this report3. Executive Remuneration Framework4. Relationship between remuneration and company performance5. Executive Statutory Remuneration6. Equity Plans7. Remuneration governance8. Non-executive director fees9. Director shareholdings10. Equity instruments held by Key Management Personnel11. Loans to key management personnel12. Other transactions with key management personnel
1 Introduction
TechnologyOne is pleased to present its Remuneration Report for the 2017 financial year, which sets out the remuneration framework for the Executive Chairman, our Executives and our Non-executive Directors.
TechnologyOne has attracted exceptional Executives, Directors and employees, who collectively have been responsible for delivering long term profitable growth and substantial shareholder returns. In order to attract and retain such talent in a highly competitive and fast moving environment, it is critical to have a remuneration framework that enables TechnologyOne to compete for talent against the world’s biggest enterprise software companies such as Oracle and SAP, as well as other Australian software companies.
We continue to engage with our shareholders and advisors in the ongoing refinement of our remuneration framework to ensure it is fair and equitable, and continues to reward Key Management Personnel (KMP) appropriately to drive performance for the Company and our shareholders.
The principles of our remuneration framework are to: • Attract, retain and motivate skilled directors and executives in leadership positions;• Provide remuneration which is appropriate and competitive both internally and against comparable
companies (our peers);• Align Executives’ financial rewards with shareholder interests and our business strategy;• Achieve outstanding shareholder wealth creation;• Articulate clearly to Executives the direct link between individual and group performance, and individual
financial reward;• Reward superior performance, while managing risks; and• Provide flexibility to meet changing needs and emerging competitive market practices.
Our executive remuneration framework complies with common practice for ASX200 companies, but has been adapted to meet the demands of the enterprise software market. Relative to our ASX-listed peers, our Executives receive:
• Relatively low fixed remuneration to enable a greater emphasis on performance;• Relatively large at risk short term incentive (STI) portion aligning executives to current year performance;
and• Long term incentives (LTI) linked to long term strategy, targets, and shareholder wealth creation.
The reason for our emphasis on STIs is that short-term performance is a key driver of TechnologyOne’s long-term success. This is because over 65% of our revenues each year are recurring revenues based on contract wins in prior years. If we drive short-term performance through new licences and profit, this translates into greater shareholder wealth over the longer term.
For
per
sona
l use
onl
y
Technology One LimitedRemuneration report
30 September 2017 (continued)
20
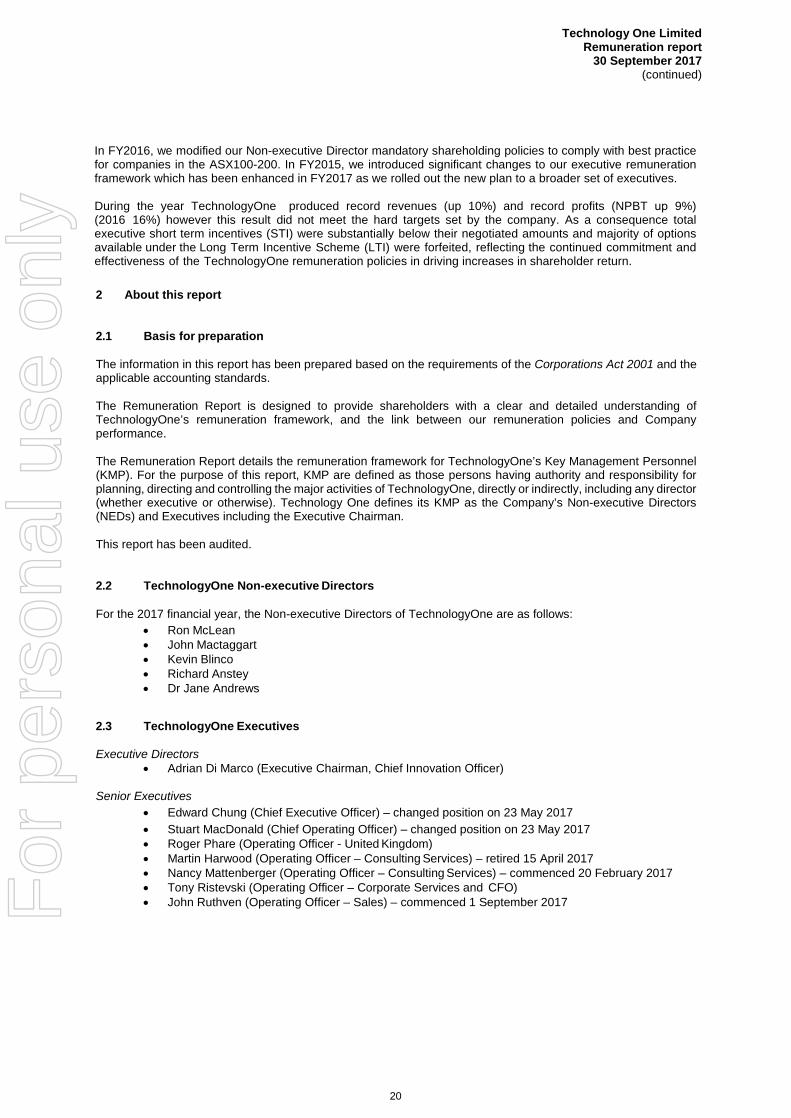
In FY2016, we modified our Non-executive Director mandatory shareholding policies to comply with best practice for companies in the ASX100-200. In FY2015, we introduced significant changes to our executive remuneration framework which has been enhanced in FY2017 as we rolled out the new plan to a broader set of executives.
During the year TechnologyOne produced record revenues (up 10%) and record profits (NPBT up 9%) (2016 16%) however this result did not meet the hard targets set by the company. As a consequence total executive short term incentives (STI) were substantially below their negotiated amounts and majority of options available under the Long Term Incentive Scheme (LTI) were forfeited, reflecting the continued commitment and effectiveness of the TechnologyOne remuneration policies in driving increases in shareholder return.
2 About this report
2.1 Basis for preparation
The information in this report has been prepared based on the requirements of the Corporations Act 2001 and the applicable accounting standards.
The Remuneration Report is designed to provide shareholders with a clear and detailed understanding of TechnologyOne’s remuneration framework, and the link between our remuneration policies and Company performance.
The Remuneration Report details the remuneration framework for TechnologyOne’s Key Management Personnel (KMP). For the purpose of this report, KMP are defined as those persons having authority and responsibility for planning, directing and controlling the major activities of TechnologyOne, directly or indirectly, including any director (whether executive or otherwise). Technology One defines its KMP as the Company’s Non-executive Directors (NEDs) and Executives including the Executive Chairman.
This report has been audited.
2.2 TechnologyOne Non-executive Directors
For the 2017 financial year, the Non-executive Directors of TechnologyOne are as follows: • Ron McLean• John Mactaggart• Kevin Blinco• Richard Anstey• Dr Jane Andrews
2.3 TechnologyOne Executives
Executive Directors • Adrian Di Marco (Executive Chairman, Chief Innovation Officer)
Senior Executives • Edward Chung (Chief Executive Officer) – changed position on 23 May 2017• Stuart MacDonald (Chief Operating Officer) – changed position on 23 May 2017• Roger Phare (Operating Officer - United Kingdom)• Martin Harwood (Operating Officer – Consulting Services) – retired 15 April 2017• Nancy Mattenberger (Operating Officer – Consulting Services) – commenced 20 February 2017• Tony Ristevski (Operating Officer – Corporate Services and CFO)• John Ruthven (Operating Officer – Sales) – commenced 1 September 2017F
or p
erso
nal u
se o
nly

Technology One LimitedRemuneration report
30 September 2017 (continued)
21
2.4 Key personnel changes during the financial year
During the financial year the following changes were made:
• Edward Chung moved from the position of Chief Operating Officer – Asia Pacific to Chief Executive Officeron 23 May 2017
• Stuart MacDonald moved from the position of Operating Officer – Sales and Marketing to Chief Operating Officer effective 23 May 2017
• Martin Harwood, Operating Officer – Consulting Services stepped down from the role of Operating Officer,Consulting Services effective 20 February 2017. Mr Harwood retired and left the company effective 15 April2017
• Nancy Mattenberger was appointed to the role of Operating Officer – Consulting Services effective 20February 2017
• John Ruthven was appointed to the role of Operating Officer – Sales effective 1 September 2017
2.5 Board Committee changes during the financial year
There were no Board Committee changes during the financial year.
The Board believes that its existing Directors contribute valuable knowledge, skills and experience. In order to ensure that the Board and its committees clearly have a majority of independent directors, the Board is considering to appoint an additional independent Director at an appropriate time.
3 Executive Remuneration Framework
TechnologyOne has continued to refine the executive remuneration framework which was introduced in the 2015 financial year. The LTI scheme which now is based on options issued at market price and no discount, KPI’s relevant to the executives area of influence are agreed to ensure they are aligned to creating long term shareholder value.
For 2017, the board, following market consultation, believe that the disclosure of targets for the LTI KPI’s is commercially sensitive and therefore have not been disclosed. As in 2016, for 2017 the LTI KPI’s are reviewed annually and set by the Board. The KPI’s are primarily yearly based measures to ensure a consistency year on year but importantly over a 3 year window creates value for shareholders which is when the options vest. Thus the executive will only benefit if shareholder value is created. The targets are set at levels to ensure TechnologyOne continues to drive strong profit growth year on year. Details of the plan and worked example are provided in section 3.6. Executives only receive value if performance targets are met that have been previously set for the LTI.
TechnologyOne will continue to honour existing contracts with its Executives that predated the new framework, and which need to be honoured both legally and morally; as well as ensuring the existing momentum in the business is not lost.
This report is written with a focus on the new remuneration framework, and where there exist older quarantined arrangements, these will be highlighted as exceptions.
3.1 Changes to remuneration framework in 2017 financial year
In the 2017 financial year, we have revised the remuneration benchmarks for our executives to include locally- based senior executives from global companies operating in the enterprise software market, as well as KMP from our information technology industry peers in the ASX200.
Every third year the committee reviews and compares the Non-executive Director fees to market This year as part of the process of adding a Non-executive director to the board, we engaged an independent third party to review our director’s fees and benchmark them against our peers to ensure we can continue to attract and retain quality directors. This has resulted in an increase in Directors fees to $127,000, including statutory superannuation contributions. Directors fees have been set at the 75th percentile of ASX 101 – ASX 200 companies with CPI increases until the next review in three years time.
The minimum mandatory shareholding for Directors has also been increased to the equivalent of one year’s before -tax remuneration, with directors having two years to achieve this target.
For
per
sona
l use
onl
y

Technology One LimitedRemuneration report
30 September 2017 (continued)
22
3.2 Our remuneration benchmarks
The talent pool in Australia for executives with large scale enterprise software experience and a proven track record is extremely small and is hotly contested with start-up companies at the lower end, and large multinationals at the other end of the spectrum. In such a ferociously competitive and relatively small market, our experience has shown that to attract and retain talented executives who understand large scale enterprise software, requires a remuneration framework that is appropriately structured for the enterprise software market The changes made to our LTI framework have been influenced by like organisations and ensuring we provide a flexible incentive structure whilst driving shareholder value.
We have benchmarked our executives’ remuneration against Australian-based KMP from our competitors in the enterprise software industry: Oracle, Microsoft, SAP, Workday and NetSuite. Our executive remuneration is also calibrated against other listed IT companies on the ASX such as Seek Limited, Wisetech Limited and Aconex Limited.
3.3 Executive remuneration structure and principles
The TechnologyOne Operating Officers are the leaders of the organisation. It is their role to inspire, develop and lead over 1,100 talented professionals to perform at exceptional levels to produce outstanding returns for our shareholders.
When it is necessary to appoint a new candidate to these roles, only the best that the market can offer will be considered. They will have a proven track record and will therefore be able to command significant remuneration packages in their own right. These packages are significant (often 6 to 7 figures) but we believe that the organisation needs this level of management expertise to keep the growth momentum experienced over the past 10 years, continuing into the future.
The remuneration arrangements of our Executives are made up of both fixed and at risk remuneration. The remuneration arrangements are comprised of the following three components:
• Fixed remuneration;• Short Term Incentive (STI) which is at risk and represents a share of profit (performance based); and• Long Term Incentive (LTI) which is at risk and performance based.
Our remuneration structure differs from our ASX-listed peers, to encourage over performance, with a substantially lower proportion of fixed remuneration of 33% vs 65% for our peers; and an over weighting to the STI of 33% vs 15% for our peers. Over time, the fixed remuneration proportion becomes even lower compared to our peers due to increases in the STI component. This difference from our ASX-listed peers is justified by the fact that improvements in our short-term performance are based on factors such as new licence fees, which drive TechnologyOne’s recurring revenues and shareholder returns.
For
per
sona
l use
onl
y

Technology One LimitedRemuneration report
30 September 2017 (continued)
23
Fixed remuneration Short term incentive (STI) Long term incentive (LTI)
Nature Base salary plus superannuation. Includes any salary sacrifice items.
Paid monthly with 20% retention by TechnologyOne until accounts are audited and finalized. Paid 3 months after year end.
From 2016, Executives will be allocated options which provide the right to purchase one TechnologyOne share, subject to meeting performance targets.
Percentage of total remuneration at contract start date
Typically, 33% of total remuneration at start of contract, decreasing over time due to increase of STI.
Typically, 33% of total remuneration at start of contract.
Typically, 33% of total remuneration at start of contract, decreasing over time due to increase of STI.
Changes in percentage of total remuneration over time
Typically increases by CPI each year but decreases as a percentage of total remuneration based on larger increases in STI component.
Typically increases over time in line with increases in Company (or business segment) profitability (see section 3.5 for more information).
Typically decreases as a percentage of total remuneration based on larger increases in STI component.
Performance targets N/A Percentage of agreed executive net profit before tax (NPBT) for the Group; or percentage of net profit before tax (NPBT) for the relevant business segment for the Executive (see section 4.3 for more information).
The LTI scheme has a blended approach of performance targets 1 such as:
- NPAT growth- Licence fee growth- Sales operating
expense growth- R&D expense
growth
Performance period N/A Annual Three years Clawback available No Yes, if business outcomes
differ from expected Yes
Cap N/A No Yes, attainment of 100% of target if stretch goal is reached
Floor N/A No Yes 0% vesting if actual performance is less than mid hurdle
1 LTI targets will be reviewed each year as executives join the LTI scheme in the coming years.
The targets have been excluded as they are commercially sensitive. The targets will be disclosed at the completion of the performance period. The targets set are hard targets. Annually targets will be set and reviewed by the Board.
Additional detail on each of these components is included later in this report.
For
per
sona
l use
onl
y

Technology One LimitedRemuneration report
30 September 2017 (continued)
24
3.4 Fixed remuneration Key attributes of the fixed remuneration component include:
• The Board determines an appropriate level of fixed remuneration for Executives withrecommendations based on market benchmarking from the Remuneration Committee at the start oftheir contract;
• Fixed remuneration is made up of base remuneration and superannuation. Fixed remunerationincludes cash salary and any salary sacrifice items;
• Fixed remuneration grows at a rate similar to CPI, there are no guaranteed fixed remuneration payincreases for Executives; and
• The Executives fixed remuneration is reviewed annually, following the end of the performance period(30 September). For the 2017 financial year, the average fixed remuneration increases for theExecutive Chairman and Executives was 1%.
3.5 Short term incentives (STI)
Overview
Our STI differs from that of many other ASX200 companies because strong short term performance creates a strong recurring revenue base in the long term, driving outstanding performance & shareholder wealth.
Key attributes of the short term incentives (STI) are as follows: • TechnologyOne Executives have a cash-based STI set at the start of their contract which is typically
approximately 33% of their total remuneration and which increases to approximately 50% of theirremuneration over time;
• The STI target is based on a percentage of net profit before tax (NPBT) for the Group or percentageof net profit before tax (NPBT) for the relevant business segment for the Executive. This effectivelyaligns the target incentive with shareholder return. The STI targets are not renegotiated during thecourse of the Executive’s employment to provide certainty to the Executive, that if they build theirbusiness, they will share in the upside;
• The STI is calculated and paid monthly with up to 20% retention to assist the Executives in meetingtheir short term financial obligations. This is appropriate because Executives’ fixed remuneration isvery low compared to our ASX-listed peers (33% vs 65%). Up to 20% retention of STI is paid threemonths after TechnologyOne’s year end to ensure that the STI paid are based on audited andfinalised accounts. In the unlikely event business outcomes differ materially to what was expected, theCompany can claw back any STI;
• The STI is uncapped to encourage over-achievement, driving performance in current year and longterm shareholder wealth; and
• There is no floor on the STI, aligning Executives with shareholder expectations.
Change in STI over time
TechnologyOne Executives have an STI set at the start of their contract which is typically approximately 33% of their total targeted remuneration compared to only 15% for our ASX-listed peers. Over future years with strong continuing performance by the Executive, the STI increases to approximately 50% of their targeted remuneration compared to 15% for our ASX-listed peers.
The best way to consider the mechanics of the TechnologyOne salary packaging arrangements is by way of the following example. Consider a candidate who can command a remuneration package of $900,000 in the open market. The TechnologyOne method is as follows:
Fixed remuneration package of approximately $300,000 or 33% of the package with minimal future adjustments, akin to CPI, in future years.
The LTI is typically 33% of the package compared to industry norms of 15% to 20%
The STI target typically commences at 75% to 100% of the fixed remuneration value established during contract negotiations. Our expectation is at the start of an Executives contract the STI will be similar to their fixed remuneration. In this example $300,000 is used as the initial STI target. If we assume that net profit before tax (NPBT) of the Group is to be used and the forecast NPBT is $40M (a 15% increase on the prior year) then the contract STI will be $300,000/$40M, or 0.75% of profit.
For
per
sona
l use
onl
y
Technology One LimitedRemuneration report
30 September 2017 (continued)
25
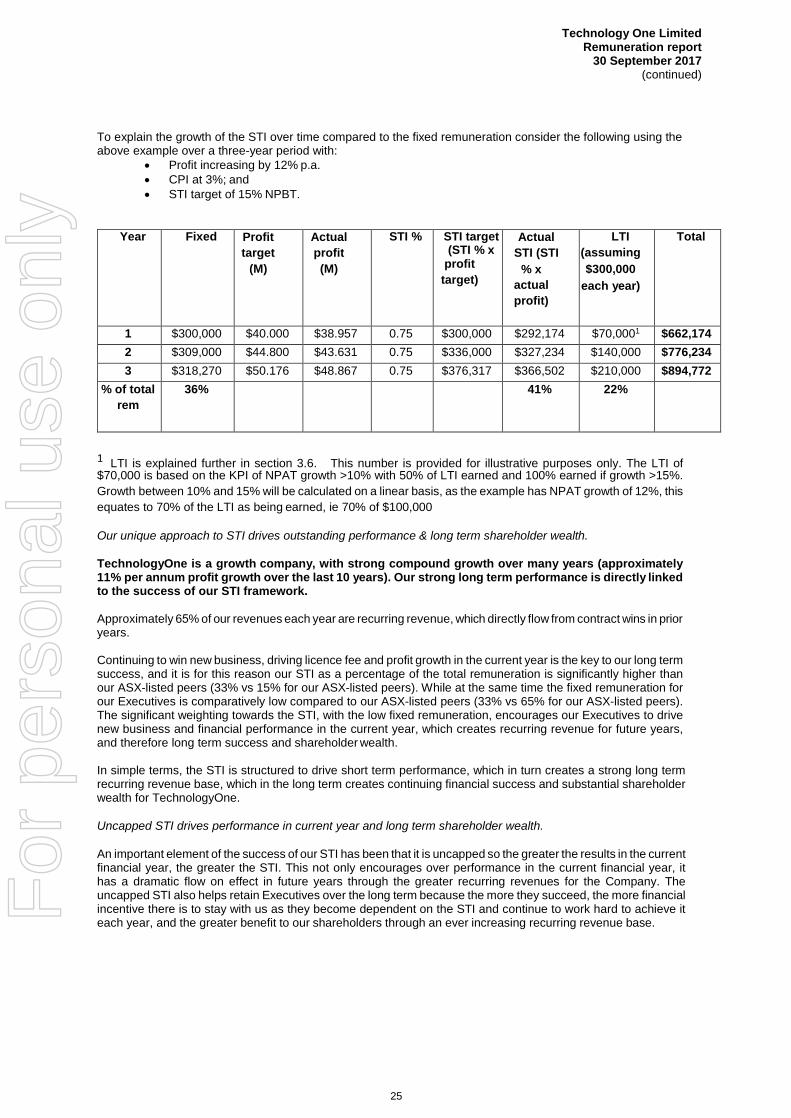
To explain the growth of the STI over time compared to the fixed remuneration consider the following using the above example over a three-year period with:
• Profit increasing by 12% p.a.• CPI at 3%; and• STI target of 15% NPBT.
Year Fixed Profit target
(M)
Actual profit (M)
STI % STI target (STI % x
profit target)
Actual STI (STI
% x actual profit)
LTI (assuming $300,000
each year)
Total
1 $300,000 $40.000 $38.957 0.75 $300,000 $292,174 $70,0001 $662,174 2 $309,000 $44.800 $43.631 0.75 $336,000 $327,234 $140,000 $776,234 3 $318,270 $50.176 $48.867 0.75 $376,317 $366,502 $210,000 $894,772
% of total rem
36% 41% 22%
1 LTI is explained further in section 3.6. This number is provided for illustrative purposes only. The LTI of$70,000 is based on the KPI of NPAT growth >10% with 50% of LTI earned and 100% earned if growth >15%. Growth between 10% and 15% will be calculated on a linear basis, as the example has NPAT growth of 12%, this equates to 70% of the LTI as being earned, ie 70% of $100,000
Our unique approach to STI drives outstanding performance & long term shareholder wealth.
TechnologyOne is a growth company, with strong compound growth over many years (approximately 11% per annum profit growth over the last 10 years). Our strong long term performance is directly linked to the success of our STI framework.
Approximately 65% of our revenues each year are recurring revenue, which directly flow from contract wins in prior years.
Continuing to win new business, driving licence fee and profit growth in the current year is the key to our long term success, and it is for this reason our STI as a percentage of the total remuneration is significantly higher than our ASX-listed peers (33% vs 15% for our ASX-listed peers). While at the same time the fixed remuneration for our Executives is comparatively low compared to our ASX-listed peers (33% vs 65% for our ASX-listed peers). The significant weighting towards the STI, with the low fixed remuneration, encourages our Executives to drive new business and financial performance in the current year, which creates recurring revenue for future years, and therefore long term success and shareholder wealth.
In simple terms, the STI is structured to drive short term performance, which in turn creates a strong long term recurring revenue base, which in the long term creates continuing financial success and substantial shareholder wealth for TechnologyOne.
Uncapped STI drives performance in current year and long term shareholder wealth.
An important element of the success of our STI has been that it is uncapped so the greater the results in the current financial year, the greater the STI. This not only encourages over performance in the current financial year, it has a dramatic flow on effect in future years through the greater recurring revenues for the Company. The uncapped STI also helps retain Executives over the long term because the more they succeed, the more financial incentive there is to stay with us as they become dependent on the STI and continue to work hard to achieve it each year, and the greater benefit to our shareholders through an ever increasing recurring revenue base. F
or p
erso
nal u
se o
nly

Technology One LimitedRemuneration report
30 September 2017 (continued)
26
Likewise, if an Executive under performs in a year, there is a significant financial impact to them as their STI forms a significant portion of their total remuneration. Just as the STI is uncapped on the upside, it is uncapped on the downside. Because the Executive’s fixed remuneration is significantly lower than our ASX-listed peers, if there is under performance this has a significant negative impact on their total remuneration.
The STI framework aligns performance with remuneration outcomes encouraging over performance and penalising under performance.
Timing of STI payment
Because the fixed remuneration of an Executive is very low compared to our ASX-listed peers (33% vs 65%), to assist the Executives in meeting their short term financial obligations, the STI is calculated and paid monthly with up to 20% retention.
Up to 20% retention of their STI is paid three months after TechnologyOne’s year end to ensure that the STI paid are based on audited and finalised accounts. In the unlikely event that business outcomes differ materially to what was expected, the Company can claw back any STI.
TechnologyOne does not defer the STI any longer than three months because: • Executives have low fixed remuneration relative to their ASX-listed peers and so payment of STI in a fair
and reasonable time frame is important. TechnologyOne packages are structured so that our Executivesfixed remuneration and 70% of their STI target is the equivalent of our competitors fixed remuneration.
• TechnologyOne carries minimal risk associated with revenue and as such the long term deferral of STIgreater than three months does not serve any purpose.
• TechnologyOne Executives are already exposed to the long-term outcomes of the business through alarger long term incentive (LTI) component than our ASX-listed peers (33% vs 20% for our peers). It isimportant to note that our LTI being 33% of our Executives remuneration is similar to the STI and LTI ofour ASX-listed peers (15% and 20%).
3.6 Long term incentives (LTI)
TechnologyOne Executives have a long term incentive (LTI) typically set at the start of their contract, at 33% of their total targeted remuneration compared to only 20% for our ASX-listed peers. This creates a strong focus on long term performance, with a strong alignment to long term shareholder wealth creation. It also acts as a powerful inducement for Executives to stay with TechnologyOne over the long term.
TechnologyOne long term incentive (LTI) plan provides for the grant of options as follows: • The LTI plan is designed to provide participants with the incentive to deliver substantial consistent growth in
shareholder value;• Performance is measured over a three-year performance period with individual and Company targets
assessed annually or at the conclusion of the performance period;• In the event an executive does not meet a annual target one year, then the options for that year will be
forfeited. The executive can still earn their options in following years if they hit their targets;• Executives only receive value if performance targets are met at the end of the three-year performance
period. The option vests if the performance targets have been met (this includes annual and 3 yearly testedtargets);
• Performance targets are all ‘hard targets’ that if met, will drive significant shareholder wealth creation;• Executives have the option to purchase one TechnologyOne share at an agreed strike price;• No dividends are paid while the LTI awards are unvested; and• The Board has the discretion to adjust the number of LTI’s awarded or vested in the event of any
unintended consequences.LTI’s are measured against both individual and Company targets. The LTI awards granted may deliver value to Executives subject to meeting performance targets over a three-year period. Targets are designed to reward Executives for outcomes that deliver substantial shareholder value. Targets are not disclosed as they provide our competitors insights into the key focus areas of our business. The targets are set such that they aligned to continue drive year on year strong profit growth F
or p
erso
nal u
se o
nly

Technology One LimitedRemuneration report
30 September 2017 (continued)
27
The following table provides the key features of the LTI award:
Feature Description LTI Each LTI entitles the Executive to receive the right to purchase one TechnologyOne
share in the future at the agreed strike price, subject to meeting specified performance targets. Performance targets have a combination of annual and 3 yearly testing windows. A number of LTI’s are issued to Executives each year referred to as a grant. The grant quantum is calculated according to the formula described below. It is important to note that the LTI for a grant will vest at a future date - three years (or earlier if agreed) from their issue date called the vesting date. If performance targets set for the grant have been met, the number of LTI’s in a grant that vest will be assessed each year for KPI’s with annual targets to have the quantity locked in but not accessible until the end of the 3 year vesting date. KPI’s with 3 yearly testing will not be known until the end of the performance period (i.e. the vesting date).
Number of LTI issued each year in a tranche
The value of the total number of LTI’s issued each year (called a grant) to an Executive is typically 75% to 100% of fixed remuneration and is determined during contract negotiation when an Executive is hired, but will ultimately depend on negotiations and the overall package components negotiated. The contracted LTI % may be changed where appropriate by the Board, such as if there is a change in the Executives responsibilities.
The LTI increases by approximately CPI each year, in line with the increase in fixed remuneration.
The LTI is allocated based on the cost of the option which is accounted under AASB 2 Share Based Payments using the Black-Scholes model with a strike price being the volume weighted average price (VWAP) over the 10 days prior to the grant date with no discount.
Performance period & vesting date
The performance period commences at grant date and extends for three years to give a vesting date. This may be less where an Executive commences part way through a financial year.
For example, the annual grant of LTI’s issued during the 2017 financial year (called the 2017 grant), the performance period would start on 1 October 2016 and end three years later on 30 September 2019 with 30 September 2019 being the vesting date.
Based on meeting the targets over the performance period, up to 100% of the LTI’s in that grant may vest, allowing the Executive to exercise options available in the trading window following the end of the performance period.
For
per
sona
l use
onl
y

Technology One LimitedRemuneration report
30 September 2017 (continued)
28
Feature Description Performance targets Each grant of LTI’s is subject to performance targets being met for the relevant
performance period. The targets are set at levels to ensure they drive strong profit growth year on year. The targets are set at levels to ensure they drive strong profit growth year on year.
If there is more than one performance target, then a portion of LTI’s in a grant are allocated to each specific performance target, called a tranche.
To illustrate how LTI’s are allocated across performance targets, we have assumed an executive’s agreed LTI value is $200,000. For 2017, under the LTI plan rules where the 10 working day VWAP is $5, using the Black Scholes model the cost of each option is $0.64. The executive will be allocated 312,500 options.
Following the above example, the 312,500 options would be allocated into two tranches as follows:
• 156,250 options to profit after tax growth target; and• 156,250 options to licence fee growth target.
The actual number of LTI’s allocated to each target is determined by the Company at the start of the performance period. The number of LTI’s allocated across all targets cannot exceed the total number of LTI’s offered in the grant.
For each performance target there will be a mid and stretch hurdle (for the performance period) based on the executive’s area of responsibility:
• if performance meets the stretch hurdle, 100% vesting of LTI’s for that targetwill be achieved
• If performance meets mid hurdle, then 50% of the number of LTIs will vest• if performance is between stretch and mid hurdle, the number of LTI’s for that
target will vest linearly• if performance is less than the mid hurdle, 0% of the number of LTI’s allocated
to that target will vest.
Mid hurdles have been calculated so that if they are achieved, this will create substantial shareholder wealth. Targets will be based on factors such as Company profit after tax, licence fee growth, consulting revenue growth, R&D expense growth, customer retention rates. It is based on the average result achieved for that target over the performance period.
For
per
sona
l use
onl
y

Technology One LimitedRemuneration report
30 September 2017 (continued)
29
Feature Description Vesting The LTI for a grant will not vest until the end of the performance period (the vesting date)
and the number to vest will be calculated using the performance achieved over the performance period as measured against the performance targets.
Performance targets are set before the performance period as either yearly targets or three year targets.
If the performance target is a three-year target, it is tested at the end of the three-year performance period. For example, R&D expense growth of less than 8% over three years.
Number of LTI’s earned per three-year performance target is equal to Number of LTIs available for that target x percentage earned x individual performance factor
As an example, a three-year performance target based on R&D expense growth might be as follows, based on the annual growth targets set:
• R&D expense growth of < 8% - 100% earned• R&D expense growth > 8% - nil % earned
The individual performance factor (IPR) is typically 100%.
The total number of LTI’s earned across all performance targets by an Executive cannot exceed the total number of LTI in a grant.
The number of LTI’s earned per yearly performance target is equal to 1/3 x number of LTIs available for that target x percentage earned x individual performance factor
As an example a yearly performance target based on profit growth might be as follows, based on the growth for that one-year period:
• Profit growth of 15% - 100% earned• Profit growth of 10% - 50% earned, and apportioned linearly for performance
between 10% and 15%• Profit growth of less than 10% - nil % earned
The individual performance factor (IPR) is typically 100%.
It is important to note that though the LTI’s are earned, they do not vest until the end of the performance period - typically three years.
Refer to section 4.4 for LTI’s offered during the year.
The Board has the discretion in exceptional circumstances to increase the IPR above 100% to a maximum of 200% to take into consideration exceptional individual performance or contribution by an Executive.
The total number of LTI’s earned across all performance targets by an Executive cannot exceed the total number of LTI’s in a grant.
The committee has a preference for a three-year performance window with annual target’s to drive the optimum result.
For
per
sona
l use
onl
y

Technology One LimitedRemuneration report
30 September 2017 (continued)
30
Feature Description Board discretion The Board also retains sole discretion to determine the amount and form of any award
that may vest (if any) to prevent any unintended outcomes, or in the event of a corporate restructuring or capital event.
The Board may also renegotiate the annual grant of LTI’s based on exceptional circumstances such as the change of responsible area for an Executive, a restructuring of the company, an acquisition etc.
In the event of a change of control, and to the extent that the LTI’s have not already lapsed, the Board has the discretion to determine whether the LTI’s vest or otherwise.
Upon termination of an Executive for poor performance, LTI’s will not vest.
Upon redundancy of an Executive, or for other reasons such as resignation due to ill health, the Board has the discretion to negotiate a settlement which includes the vesting of a portion of LTI’s granted.
Expiry At the end of the applicable performance period, any LTI’s that have vested will expire 5 years after vesting.
For
per
sona
l use
onl
y

Technology One LimitedRemuneration report
30 September 2017 (continued)
31
2017 performance targets
The LTI performance targets that have been identified for our Executives are both Company targets such as net profit after tax (NPAT) and individual business unit targets for the Executives business unit such as licence fee growth or R&D expense growth.
The Board has considered the following list of key performance targets that will ensure the Executives will focus on creating long term shareholder wealth. Typically, there is a blended approach of LTI performance targets, incentivising our Executives to work for the benefit of the Company as a whole as well as driving their individual business unit. The board equally has a strong focus on sustainable profit growth thus each executive will have as a minimum 50% of their LTI value aligned profit growth as a measure. The Board acknowledges that this target is also the primary target for STI, however the rationale is that the growth of license income translates into long term annuity income growth. The LTI targets other than NPAT growth are aligned to ensuring that the license income is supported by focus on customer satisfaction to encourage further license sales, the simplification of our software to reduce the cost of implementations which inturn increases our consulting margins, thereby increasing our competitive advantage.
The performance targets for the 2017 year are as follows:
Performance targets 1, 2 Performance
period Testing NPAT growth 3 years Annual 3
NPAT margin growth 3 years Annual
Licence fee growth – APAC 3 years Annual 3
Sales operating expense growth 3 years 3 years 4
Customer Retention by ASM Value - APAC 3 years Annual 3
Consulting Margin Growth 3 years Annual 3
Consulting Revenue Growth 3 years Annual 3
Licence fee growth – UK 3 years Annual 3
Operating Cash Flow / NPAT 3 years Annual 3
R&D Expense growth 3 years 3 years 4
1 Performance targets exclude acquisitions. 2 These performance targets do not have a minimum target. The performance target has to be achieved for the Executive to meet their LTI target 3 The Company has chosen annual testing in circumstances, where long term consistent year on year growth will drive greater shareholder returns. The performance targets are assessed on an annual basis with no LTI’s vesting until the end of the three-year performance period. This ensures that the annually tested KPI’s generate value for shareholders over time. 4 The Company has chosen a three year testing where the average over a three-year performance period average is more appropriate in driving long term shareholder wealth.
For
per
sona
l use
onl
y

Technology One LimitedRemuneration report
30 September 2017 (continued)
32
Quarantined Executive Option Plan (EOP) (now superseded)
These options were issued to existing Executives and TechnologyOne is required to honour. These pre-existing contracts utilises the previous LTI plan based on options. The variation to the 2016 LTI plan allows for options with the condition that there is no discount to the strike price at grant date. The performance criteria still apply as per the 2015 LTI plan. These pre-existing contracts have been quarantined and as existing Executive Contracts come to an end, they will be renegotiated so that the LTI is based on the new LTI plan going forward. All new appointments of Executives to the Company will be under the new LTI plan. For the sake of disclosure, details of the now obsolete and quarantined EOP are provided below.
Under the EOP, options were issued with typically between 0% and 50% discount on the volume weighted average price for the 10 days prior to the grant date. The discount could be forfeited prior to vesting at the Board's discretion based on the performance of the Executive. The option could also be withheld by the Executive Chairman for unsatisfactory performance.
Share options were granted to Executives by the Board based on the option plan approved by the Board.
The options vest if and when the Executive satisfies the period of service contained in each option grant. The contractual life of each option varies between two and five years. There are no cash settlement alternatives.
Options granted under this plan carry no dividend or voting rights.
When exercisable, each option is convertible into one ordinary TechnologyOne share. Further information is set out in note 32 to the financial statements.
4 Relationship between remuneration and company performance
4.1 TechnologyOne’s five-year performance
The 2017 financial year saw net profit after tax increase 8%.
Executives remuneration excluding LTI and termination benefits increased at a rate below net profit after tax, which is the Remuneration Committees goal.
The below table sets out information showing the creation of shareholder wealth for the years ended 30 September 2013 to 30 September 2017.
2013 2014 2015 2016 2017
Actual profit before tax ($’000) 35,097 40,235 46,494 53,240 58,019 Total dividend including special (cps) 5.60 8.16 8.78 9.45 10.20 Earnings per share (basic) 8.80 10.06 11.58 13.26 14.18 Share price at start of period 1.37 2.05 3.18 3.84 5.94 Share price at end of period 2.05 3.18 3.84 5.94 5.02 Total Shareholder Return 54% 59% 24% 57% (14%)
Profit after tax growth % 15% 15% 16% 16% 8% Average Executives growth1 % 15% 7% 15% 15% (6)%
1This is the average annual full time package excluding any termination payments.
As can be seen from this information, the Executives remuneration framework has successfully driven performance and the creation of shareholder wealth over the longer term, while at the same time Executives remuneration has been clearly in alignment with overall company performance.
For
per
sona
l use
onl
y
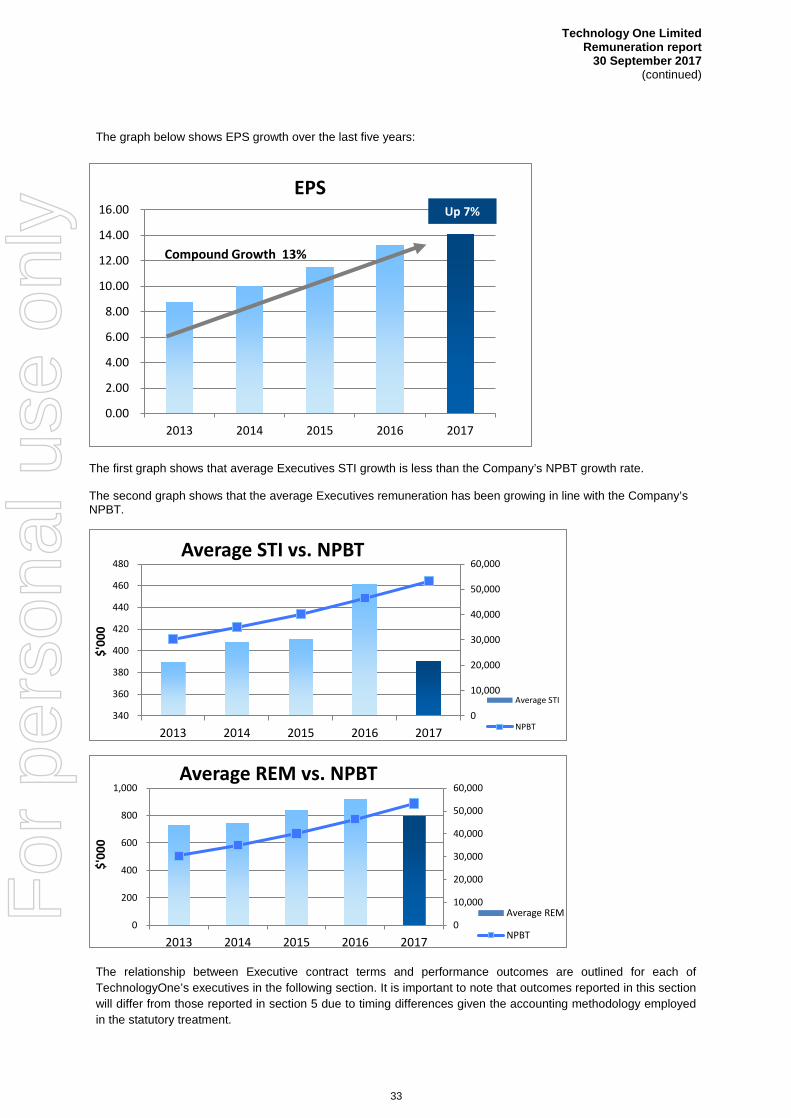
Technology One LimitedRemuneration report
30 September 2017 (continued)
33
The graph below shows EPS growth over the last five years:
The first graph shows that average Executives STI growth is less than the Company’s NPBT growth rate.
The second graph shows that the average Executives remuneration has been growing in line with the Company’s NPBT.
The relationship between Executive contract terms and performance outcomes are outlined for each of TechnologyOne’s executives in the following section. It is important to note that outcomes reported in this section will differ from those reported in section 5 due to timing differences given the accounting methodology employed in the statutory treatment.
Up 7%
0.00
2.00
4.00
6.00
8.00
10.00
12.00
14.00
16.00
2013 2014 2015 2016 2017
EPS
Compound Growth 13%
0
10,000
20,000
30,000
40,000
50,000
60,000
340
360
380
400
420
440
460
480
2013 2014 2015 2016 2017
$'00
0
Average STI vs. NPBT
Average STI
NPBT
0
10,000
20,000
30,000
40,000
50,000
60,000
0
200
400
600
800
1,000
2013 2014 2015 2016 2017
$'00
0
Average REM vs. NPBT
Average REM
NPBT
For
per
sona
l use
onl
y

Technology One LimitedRemuneration report
30 September 2017 (continued)
34
4.2 Summary of Executive remuneration and performance for FY2017
The remuneration package for Executives, including the Executive Chairman, for FY2017 comprises the amounts outlined in the following tables. It is worth noting that employment contract terms presented for the CEO and other Executives do not have a fixed duration period (i.e., they are ongoing rolling contracts that cease following notice of termination by either employee or employer).
Name Adrian Di Marco Position Executive Chairman & Chief Innovation Officer Fixed remuneration 2017
$ 2016
$ Notes
Fixed remuneration 358,574 472,202 Mr Di Marco’s base salary decreased due to the appointment of Edward Chung to the role of CEO and Mr Di Marco volunteering to have his base salary reduced.
Directors fees 127,000 75,132 Inclusive of superannuation. Increase in director fees is covered in section 8
Chairman’s fee - - Superannuation 7,055 10,478 Compulsory superannuation guarantee
contributions up to the maximum contribution base.
Total fixed remuneration 492,629 557,812
% growth on prior year excluding LTI and termination benefits
(16)% 9%
% growth on prior year including LTI and termination benefits
(16%) 9%
Performance based remuneration
1. STI 740,547 913,200 Mr Di Marco, inline with the change in base salary, volunteered to reduce his STI payment from 1.68% to 1.26% based on Group net profit before tax as an incentive. 10% of this is retained for three months after the reporting period.
2. LTI new scheme Nil Nil Mr Di Marco, as in previous years has again agreed to forgo his LTI entitlement of $400,000. The Remuneration Committee recognises that Mr Di Marco’s total remuneration is substantially below that of comparable companies. The Remuneration Committee acknowledges that Mr Di Marco existing 12+% shareholding in TechnologyOne provides the benefits that the LTI aims to achieve.
Value of share options offered Nil Nil 3. LTI old scheme
Value of share options Nil Nil 4. Post-employment
Post-employment benefits Nil Post-employment restraint 12 months Termination notice by either party
3 months
Termination benefits Nil
For
per
sona
l use
onl
y
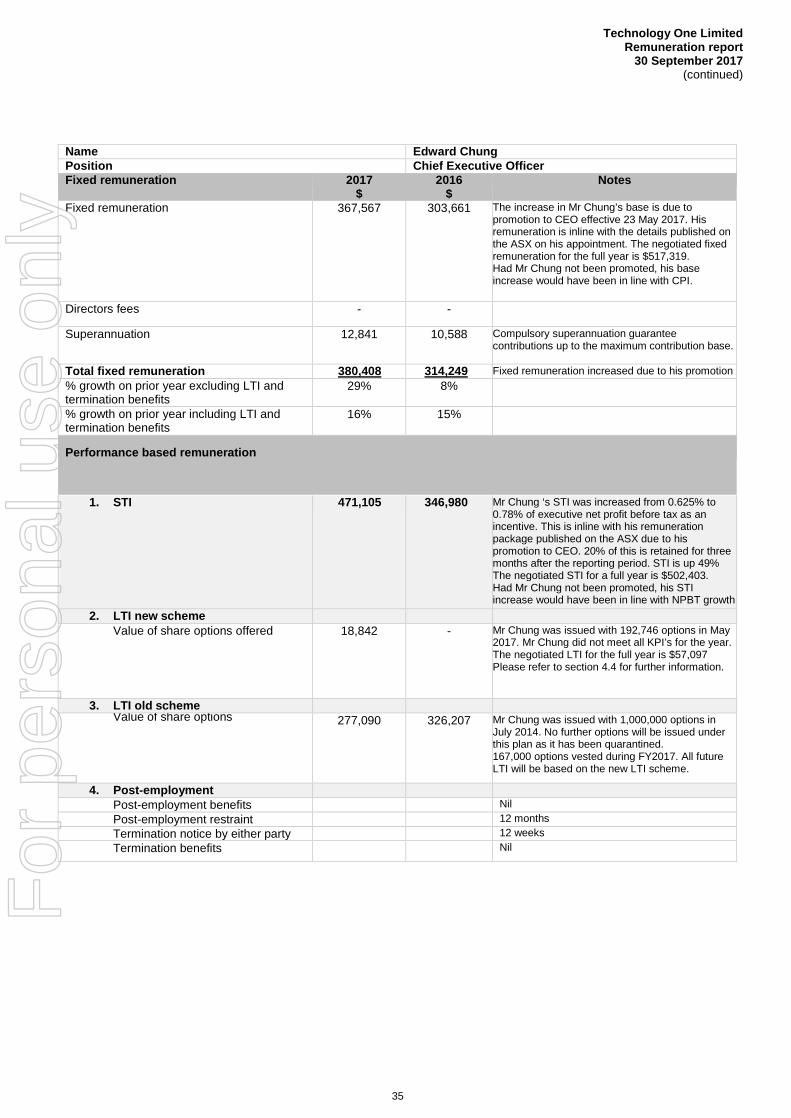
Technology One LimitedRemuneration report
30 September 2017 (continued)
35
Name Edward Chung Position Chief Executive Officer Fixed remuneration 2017
$ 2016
$ Notes
Fixed remuneration 367,567 303,661 The increase in Mr Chung’s base is due to promotion to CEO effective 23 May 2017. His remuneration is inline with the details published on the ASX on his appointment. The negotiated fixed remuneration for the full year is $517,319. Had Mr Chung not been promoted, his base increase would have been in line with CPI.
Directors fees - -
Superannuation 12,841 10,588 Compulsory superannuation guarantee contributions up to the maximum contribution base.
Total fixed remuneration 380,408 314,249 Fixed remuneration increased due to his promotion % growth on prior year excluding LTI and termination benefits
29% 8%
% growth on prior year including LTI and termination benefits
16% 15%
Performance based remuneration
1. STI 471,105 346,980 Mr Chung ‘s STI was increased from 0.625% to 0.78% of executive net profit before tax as an incentive. This is inline with his remuneration package published on the ASX due to his promotion to CEO. 20% of this is retained for three months after the reporting period. STI is up 49% The negotiated STI for a full year is $502,403. Had Mr Chung not been promoted, his STI increase would have been in line with NPBT growth
2. LTI new schemeValue of share options offered 18,842 - Mr Chung was issued with 192,746 options in May
2017. Mr Chung did not meet all KPI’s for the year. The negotiated LTI for the full year is $57,097 Please refer to section 4.4 for further information.
3. LTI old schemeValue of share options 277,090 326,207 Mr Chung was issued with 1,000,000 options in
July 2014. No further options will be issued under this plan as it has been quarantined. 167,000 options vested during FY2017. All future LTI will be based on the new LTI scheme.
4. Post-employmentPost-employment benefits Nil Post-employment restraint 12 months Termination notice by either party 12 weeks Termination benefits Nil
For
per
sona
l use
onl
y

Technology One LimitedRemuneration report
30 September 2017 (continued)
36
Name Roger Phare Position Operating Officer – United Kingdom Fixed remuneration 2017
$ 2016
$ Notes
Fixed remuneration 276,214 230,550 Mr Phare is paid in GBP. His base increased during the year due to an adjustment in cost of living. Mr Phare currently an expatriate based in the UK.
Superannuation Nil Nil No compulsory superannuation guarantee contributions payable as currently employed by Technology One UK Limited.
Total fixed remuneration 276,214 230,550
% growth on prior year excluding LTI and termination benefits
(26%) (1%)
% growth on prior year including LTI and termination benefits
(27%) (4%)
Performance based remuneration
1. STI 204,175 419,420 Mr Phare is paid 7% of UK net profit before tax inclusive of a $4.0m company capital contribution. 20% of this is retained for three months after the reporting period. STI is down 39% in line with a reduction of UK net profit before tax and allowance for company capital contribution. The negotiated STI for a full year is $491,457.
2. LTI new scheme
Value of share options offered - - Mr Phare was issued with 268,056 options in October 2016. Mr Phare did not meet all KPI’s for the year. The negotiated LTI for the full year is $46,902. Please refer to section 4.4 for further information.
3. LTI Old SchemeValue of share options 40,400 61,604 Mr Phare was issued with 1,000,000 options in July
2012. No further options will be issued under this plan as it has been quarantined. 200,000 options vested during FY2017. All future LTI will be based on the new LTI scheme.
4. Post-employmentPost-employment benefits Nil Post-employment restraint 12 months Termination notice by either party 12 weeks Termination benefits Nil
For
per
sona
l use
onl
y

Technology One LimitedRemuneration report
30 September 2017 (continued)
37
Name Martin Harwood Position Operating Officer – Consulting Services Fixed remuneration 2017
$ 2016
$ Notes
Fixed remuneration 96,783 213,161 Mr Harwood ceased being a KMP on the 20th February 2017.
Superannuation 1,168 9,658 Compulsory superannuation guarantee contributions up to the maximum contribution base. Mr Harwood reached the maximum contribution base during October 2016.
Total fixed remuneration 97,951 222,819 % growth on prior year excluding LTI and termination benefits
(88%) 10%
% growth on prior year including LTI and termination benefits
(79%) 18%
Performance based remuneration
1. STI - 566,272 Mr Harwood is paid 1.02% of executive net profit before tax. 20% of this is retained for three months after the reporting period. STI reduced as a result of Mr Harwood retiring and leaving the business during the year.
2. LTI new schemeValue of share options offered - -
3. LTI old schemeValue of share options 137,591 331,693 Mr Harwood was issued with 1,000,000 options
in October 2014. No further options will be issued under this plan as it has been quarantined. 200,000 options vested during FY2017.
4. Post-employmentPost-employment benefits Nil Post-employment restraint 12 months Termination notice by either party 12 weeks Termination benefits Nil
For
per
sona
l use
onl
y

Technology One LimitedRemuneration report
30 September 2017 (continued)
38
Name Stuart MacDonald Position Chief Operating Officer Fixed remuneration 2017
$ 2016
$ Notes
Fixed remuneration 381,255 150,883 Mr MacDonald was promoted May 2017 to the role of COO. Mr MacDonald commenced 11 April 2016 as OO – Sales and Marketing with the company therefore the 2016 base only represents part year base salary. The negotiated fixed remuneration for the full year is $433,800. Had Mr MacDonald not been promoted, his base increase would have been in line with CPI. Superannuation 17,989 14,334 Compulsory superannuation guarantee contributions up to the maximum contribution base.
Total fixed remuneration 399,244 165,217 FY2016 was the prorated fixed remuneration for Mr MacDonald from 11 April.
% growth on prior year excluding LTI and termination benefits
94% 100%
% growth on prior year including LTI and termination benefits
82% 100%
Performance based remuneration
1. STI 322,653 206,754 Mr MacDonald STI increased from 0.455% to 0.533% executive net profit before tax upon his promotion to COO. 20% of this is retained for three months after the reporting period. The negotiated STI for a full year is $343,309.
2. LTI new schemeValue of share options offered 38,478 46,667
Mr MacDonald was issued with 317,211 options during FY2016. Mr MacDonald was issued with 325,364 options during FY2017. Mr MacDonald did not meet all KPI’s for the year. The negotiated LTI for the full year is $123,533 Please refer to section 4.4 for further information.
3. LTI old schemeValue of share options Nil Nil
4. Post-employmentPost-employment benefits Nil Post-employment restraint 12 months Termination notice by either party 12 weeks Termination benefits Nil
For
per
sona
l use
onl
y
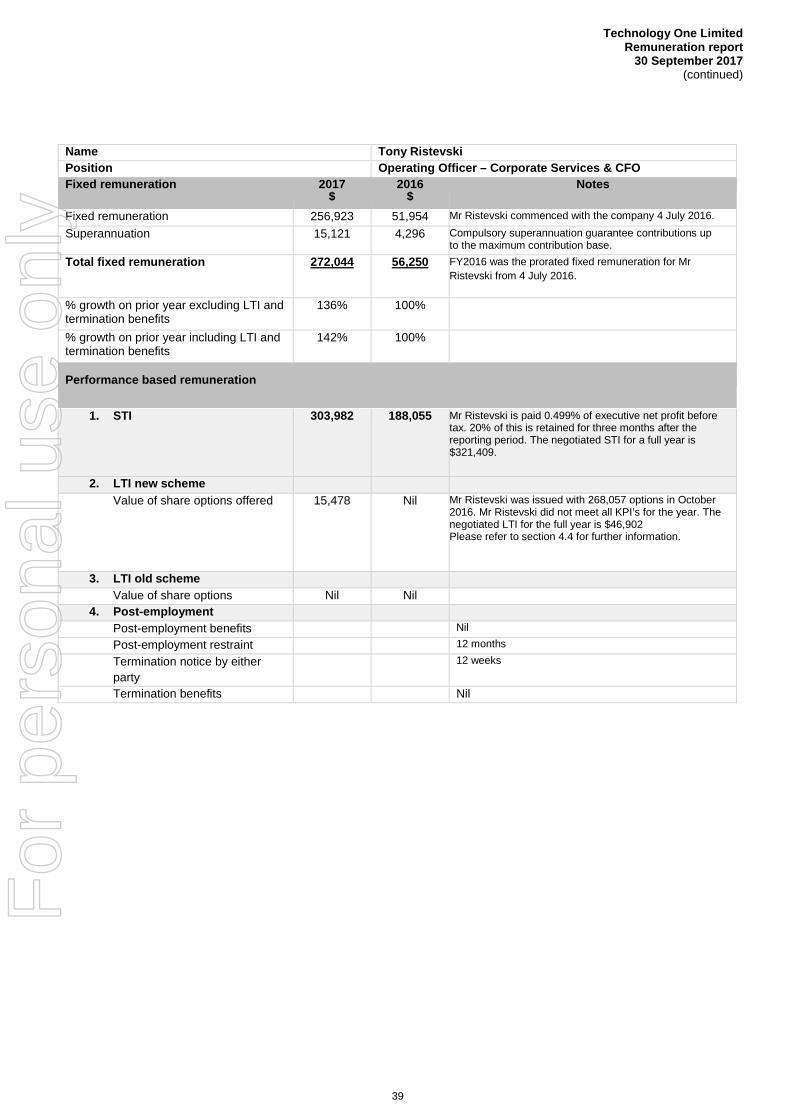
Technology One LimitedRemuneration report
30 September 2017 (continued)
39
Name Tony Ristevski Position Operating Officer – Corporate Services & CFO Fixed remuneration 2017
$ 2016
$ Notes
Fixed remuneration 256,923 51,954 Mr Ristevski commenced with the company 4 July 2016.
Superannuation 15,121 4,296 Compulsory superannuation guarantee contributions up to the maximum contribution base.
Total fixed remuneration 272,044 56,250 FY2016 was the prorated fixed remuneration for Mr Ristevski from 4 July 2016.
% growth on prior year excluding LTI and termination benefits
136% 100%
% growth on prior year including LTI and termination benefits
142% 100%
Performance based remuneration
1. STI 303,982 188,055 Mr Ristevski is paid 0.499% of executive net profit before tax. 20% of this is retained for three months after the reporting period. The negotiated STI for a full year is $321,409.
2. LTI new schemeValue of share options offered 15,478 Nil Mr Ristevski was issued with 268,057 options in October
2016. Mr Ristevski did not meet all KPI’s for the year. The negotiated LTI for the full year is $46,902 Please refer to section 4.4 for further information.
3. LTI old schemeValue of share options Nil Nil
4. Post-employmentPost-employment benefits Nil Post-employment restraint 12 months Termination notice by either party
12 weeks
Termination benefits Nil
For
per
sona
l use
onl
y
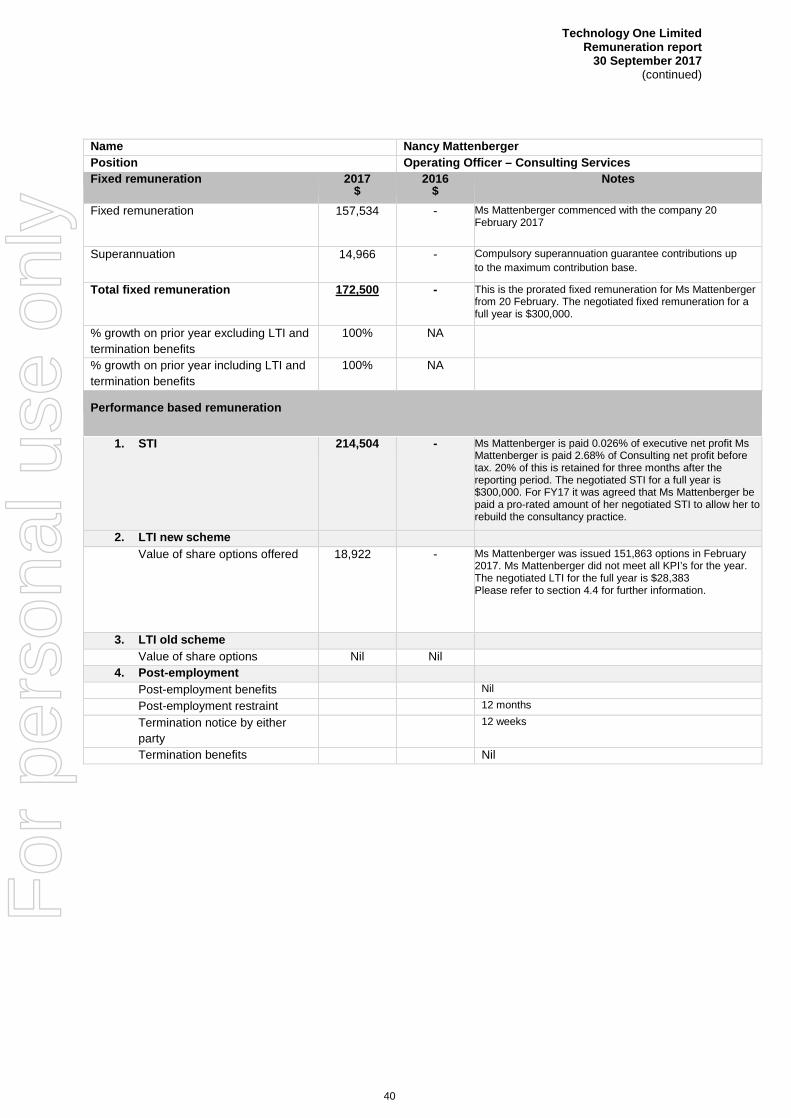
Technology One LimitedRemuneration report
30 September 2017 (continued)
40
Name Nancy Mattenberger Position Operating Officer – Consulting Services Fixed remuneration 2017
$ 2016
$ Notes
Fixed remuneration 157,534 - Ms Mattenberger commenced with the company 20February 2017
Superannuation 14,966 - Compulsory superannuation guarantee contributions upto the maximum contribution base.
Total fixed remuneration 172,500 - This is the prorated fixed remuneration for Ms Mattenbergerfrom 20 February. The negotiated fixed remuneration for afull year is $300,000.
% growth on prior year excluding LTI and termination benefits
100% NA
% growth on prior year including LTI and termination benefits
100% NA
Performance based remuneration
1. STI 214,504 - Ms Mattenberger is paid 0.026% of executive net profit Ms Mattenberger is paid 2.68% of Consulting net profit before tax. 20% of this is retained for three months after the reporting period. The negotiated STI for a full year is $300,000. For FY17 it was agreed that Ms Mattenberger be paid a pro-rated amount of her negotiated STI to allow her to rebuild the consultancy practice.
2. LTI new schemeValue of share options offered 18,922 - Ms Mattenberger was issued 151,863 options in February
2017. Ms Mattenberger did not meet all KPI’s for the year. The negotiated LTI for the full year is $28,383 Please refer to section 4.4 for further information.
3. LTI old schemeValue of share options Nil Nil
4. Post-employmentPost-employment benefits Nil Post-employment restraint 12 months Termination notice by either party
12 weeks
Termination benefits Nil
For
per
sona
l use
onl
y

Technology One LimitedRemuneration report
30 September 2017 (continued)
41
Name John Ruthven Position Operating Officer – Sales and Marketing Fixed remuneration 2017
$ 2016
$ Notes
Fixed remuneration 11,647 - Mr Ruthven commenced 1 September 2017
Superannuation 1,106 - Compulsory superannuation guarantee contributions upto the maximum contribution base.
Total fixed remuneration 12,753 - This is the prorated fixed remuneration for Mr Ruthvenfrom 1 September. The negotiated fixed remunerationfor a full year is $320,000.
% growth on prior year excluding LTI and termination benefits
100% NA
% growth on prior year including LTI and termination benefits
100% NA
Performance based remuneration
1. STI 23,333 - Mr Ruthven’s is paid 0.40% of executive net profit before tax. 20% of this is retained for three months after the reporting period. The negotiated STI for a full year is $280,000.
2. LTI new schemeValue of share options offered - -
3. LTI old schemeValue of share options Nil Nil
4. Post-employmentPost-employment benefits Nil Post-employment restraint 12 months Termination notice by either party
12 weeks
Termination benefits Nil
For
per
sona
l use
onl
y

Technology One LimitedRemuneration report
30 September 2017 (continued)
42
4.3 Calculation of executive STI performance for the year
There is no maximum or minimum STI for Executives as the Company wants to ensure a strong focus on performance in the current year. Please refer section 3.5 for a detailed explanation.
Up to 20% of the STI is deferred for a period of 3 months.
Calculation of STI:
The respective terms of each Executives STI entitlement is summarized in section 4.2 and 4.3. The key measures in which the STI is applied against is as follows for FY17:
UK net profit before tax and allowance for company capital contribution1 of $2,916,791
Executive net profit before tax2 of $60,918,181
CEO net profit before tax3 of $58,773,549
1. UK net profit before tax for incentives is calculated based on the UK company profit before tax plus corporatecontribution of $4.0m. The corporate contribution is based on an agreed amount with the executive and aligned to driveshareholder value.
2. Executive net profit before tax is calculated based on company profit before tax before the Executive STI is calculated.3. The CEO net profit before tax is calculated after we have calculated the Executives STI. Once calculated it is used to
calculate the CEO STI.
4.4 Summary of LTI issued during the year 2017
LTI grant for Edward Chung
192,746 options were granted to Edward Chung effective 23 May 2017 being his start date of the position of Chief Executive Officer based on a volume weighted average price of $5.6046. The value of this issue is $244,700 and the first vesting window will be 1 October 2017 for the year 1 period.
The performance targets that have been set for the 2017 LTI grant for Edward Chung are as follows:
Performance targets % of Options granted
Performance period Testing1
NPAT growth 50% 3 years Yearly NPBT margin growth 17% 3 years Yearly Customer Retention by ASM value 17% 3 years Yearly Operating Cashflow/NPAT 16% 3 years Yearly
The targets have been excluded as they are commercially sensitive. The targets will be disclosed at the completion of the performance period. Annually STI targets will be set and reviewed by the Board.
2017 LTI grant for Stuart MacDonald
54,627 options were granted to Stuart MacDonald effective 23 May 2017 being his start date of the position of Chief Operating Officer based on a volume weighted average price of $5.6046. The value of this issue is $69,352 and the first vesting window will be 1 October 2017 for the year 1 period.
270,737 options were granted to Stuart MacDonald effective 1 October 2016 based on a volume weighted average price of $5.7474. The value of this issue is $203,018 and the first vesting window will be 1 October 2017 for the year 1 period.
The performance targets that have been set for the 2017 LTI grant for Stuart MacDonald are as follows:
Performance targets % of Options granted
Performance period Testing1
NPAT growth 50% 3 years Yearly Licence Fee growth – APAC 30% 3 years Yearly Sales operating expense growth - APAC
10% 3 years 3 years
Customer Retention by ASM value - APAC
10% 3 years Yearly
For
per
sona
l use
onl
y
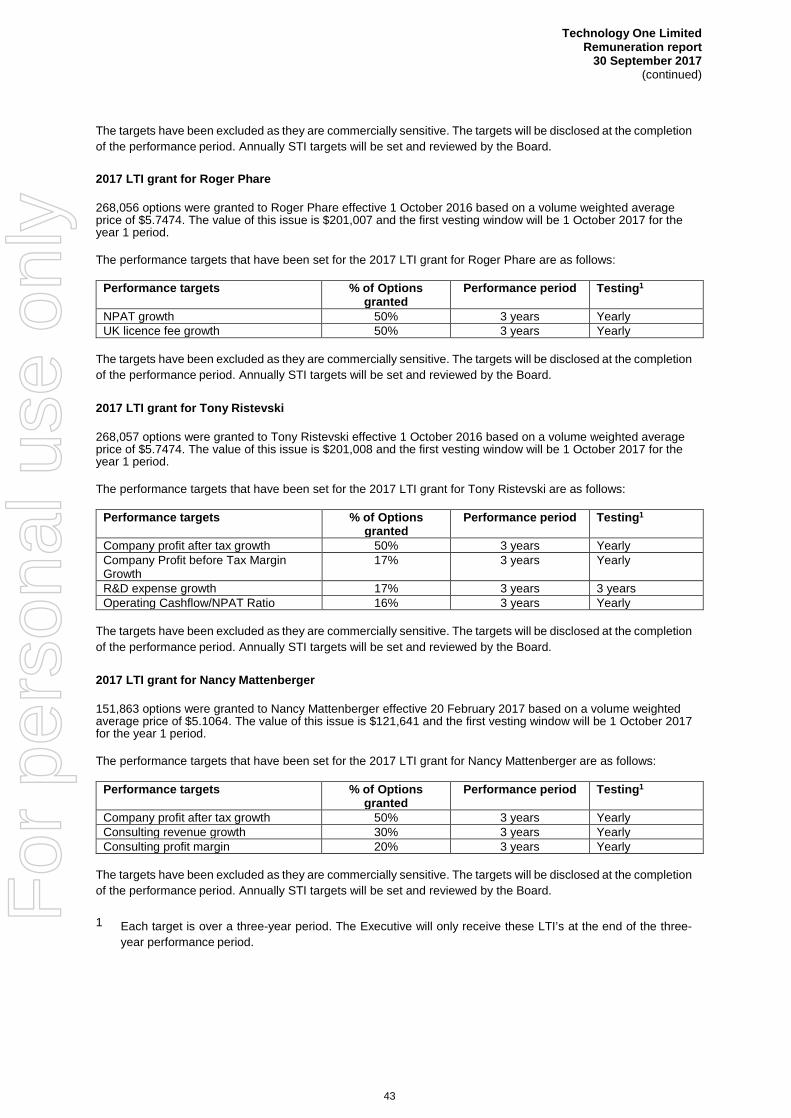
Technology One LimitedRemuneration report
30 September 2017 (continued)
43
The targets have been excluded as they are commercially sensitive. The targets will be disclosed at the completion of the performance period. Annually STI targets will be set and reviewed by the Board.
2017 LTI grant for Roger Phare
268,056 options were granted to Roger Phare effective 1 October 2016 based on a volume weighted average price of $5.7474. The value of this issue is $201,007 and the first vesting window will be 1 October 2017 for the year 1 period.
The performance targets that have been set for the 2017 LTI grant for Roger Phare are as follows:
Performance targets % of Options granted
Performance period Testing1
NPAT growth 50% 3 years Yearly UK licence fee growth 50% 3 years Yearly
The targets have been excluded as they are commercially sensitive. The targets will be disclosed at the completion of the performance period. Annually STI targets will be set and reviewed by the Board.
2017 LTI grant for Tony Ristevski
268,057 options were granted to Tony Ristevski effective 1 October 2016 based on a volume weighted average price of $5.7474. The value of this issue is $201,008 and the first vesting window will be 1 October 2017 for the year 1 period.
The performance targets that have been set for the 2017 LTI grant for Tony Ristevski are as follows:
Performance targets % of Options granted
Performance period Testing1
Company profit after tax growth 50% 3 years Yearly Company Profit before Tax Margin Growth
17% 3 years Yearly
R&D expense growth 17% 3 years 3 years Operating Cashflow/NPAT Ratio 16% 3 years Yearly
The targets have been excluded as they are commercially sensitive. The targets will be disclosed at the completion of the performance period. Annually STI targets will be set and reviewed by the Board.
2017 LTI grant for Nancy Mattenberger
151,863 options were granted to Nancy Mattenberger effective 20 February 2017 based on a volume weighted average price of $5.1064. The value of this issue is $121,641 and the first vesting window will be 1 October 2017 for the year 1 period.
The performance targets that have been set for the 2017 LTI grant for Nancy Mattenberger are as follows:
Performance targets % of Options granted
Performance period Testing1
Company profit after tax growth 50% 3 years Yearly Consulting revenue growth 30% 3 years Yearly Consulting profit margin 20% 3 years Yearly
The targets have been excluded as they are commercially sensitive. The targets will be disclosed at the completion of the performance period. Annually STI targets will be set and reviewed by the Board.
1 Each target is over a three-year period. The Executive will only receive these LTI’s at the end of the three- year performance period.
For
per
sona
l use
onl
y

Technology One LimitedRemuneration report
30 September 2017 (continued)
44
5 Executive Statutory Remuneration
Short-term employee benefits Post- employment benefits
LTI equity remuneration
Fixed Directors' Total fixed Short-term Super- Termination Value of Value of Total % growth % growth
remuneration fees remuneration Incentive annuation benefits share options
performance rights
on prior year excl
on prior year incl
offered LTI & LTI & termination termination
Name benefits benefits
$ $ $ $ $ $ $ $ $ % % A Di Marco (Executive Chairman) 2017 358,574 127,000 485,574 740,547 7,055 - -1 1,233,176 (16%) (16%) 2016 472,202 75,132 547,334 913,200 10,478 - -1 1,471,012
E Chung (Chief Executive Officer) 2017 367,567 - 367,567 471,105 12,841 - 295,932 - 1,147,445 29% 16%
2016 303,661 - 303,661 346,980 10,588 - 326,207 - 987,436R Phare (Operating Officer – United Kingdom) 2 2017 276,214 - 276,214 204,175 - - 40,400 - 520,789 (26%) (27%)2016 230,550 - 230,550 419,420 - - 61,604 - 711,574
M Harwood (Operating Officer – Sales and Marketing) 3 2017
96,783 - 96,783 - 1,168 -
137,591 -
235,542 (88%) (79%)
2016 213,161 - 213,161 566,272 9,658 - 331,693 - 1,120,784P Rogers (Operating Officer - Consulting Services) 2017 - - - - - - - - - (100%) (100%) 2016 276,471 - 276,471 92,278 12,455 65,500 - - 446,704
S MacDonald (Operating Officer – Sales and Marketing)4
2017 381,255 - 381,255 322,653 17,989 - 38,478 - 760,375 94% 82% 2016 150,883 - 150,883 206,754 14,334 - 46,667 - 418,638
T Ristevski (Operating Officer – Corporate Services)5
2017 256,923 - 256,923 303,982 15,121 - 15,478 - 591,504 136% 142% 2016 51,954 - 51,954 188,055 4,296 - - - 244,305N Mattenberger (Operating Officer – Corporate Services)6
2017 157,534 - 157,534 214,504 14,966 - 18,922 - 405,926 100% 100% 2016 - - - - - - - - - J Ruthven (Operating Officer – Sales and Marketing)7 2017 11,647 - 11,647 23,333 1,106 - - - 36,087 100% 100% 2016 - - - - - - - - -
For
per
sona
l use
onl
y

Technology One LimitedRemuneration report
30 September 2017 (continued)
45
Short-term employee benefits Post- employment benefits
LTI Equity remuneration
Fixed Directors' Total fixed Short-term Super- Termination Value of Value of Total % growth % growth
remuneration fees remuneration Incentive annuation benefits share options
performance rights
on prior year excl
on prior year incl
offered LTI & LTI & termination termination
Name benefits benefits
$ $ $ $ $ $ $ $ $ % %
Total Senior Executives 2017 1,906,497 127,000 2,033,497 2,280,299 70,246 - 546,801 - 4,930,844 (10)% (13) %
2016 1,841,469 75,132 1,916,601 2,792,218 71,842 65,500 777,577 50,411 5,674,148 Total KMP 2017 1,906,497 762,000 2,668,498 2,280,299 70,246 - 546,801 - 5,565,844 (5%) (8)%
2016 1,841,469 427,532 2,269,001 2,792,218 71,842 65,500 777,577 50,411 6,026,549
1 Mr D Marco volunteered to have his remuneration reduced effective 1 October 2016 including again the forfeiting an award of $400,000 of options in the 2016/2017 year for his LTI component of his remuneration. The Remuneration Committee acknowledges that Mr Di Marco existing 12+% shareholding in TechnologyOne provides the benefits that the LTI aims to achieve. 2 Mr Phare is paid in Great British Pounds and these amounts have been converted into Australian dollars at an average rate over the year. 3 Mr Harwood stepped down from the role of Operating Officer, Consulting Services effective 20 February 2017. Mr Harwood retired and left the company effective 15 April 2017. 4 Mr MacDonald commenced with the Company on 11 April 2016 and changed position to Chief Operating Officer on 23 May 2017. 5 Mr Ristevski commenced with the Company on 4 July 2016. 6 Ms Mattenberger commenced with the Company on 20 February 2017. 7 Mr Ruthven commenced with the Company on 1 September 2017.
For
per
sona
l use
onl
y

Technology One LimitedRemuneration report
30 September 2017 (continued)
46
6 Equity Plans
6.1 Long term incentive scheme
As discussed previously in this report, TechnologyOne no longer uses the previous Executive Option Plan (EOP), but has in the 2016 financial year implemented an LTI plan aligned to market, shareholder and executive requirements. The LTI’s are described in further detail in section 3.6 of this report.
2017
Name
Number of options
granted during the
period
Value of options at grant date*
Number of options issued
during the period
Number of options still to be issued
Number of options vested
during the period
Number of options
(forfeited) during the
period
Value at lapse date
E Chung 192,746 $244,700 - - 167,000 (43,047) 38,255 R Phare 268,056 $201,007 - - 200,000 (89,352) 46,902M Harwood - - - - 200,000 (200,000) 317,240S MacDonald 325,364 $272,370 - - - (171,535) 85,075T Ristevski 268,057 $201,008 - - - (59,866) 31,424N Mattenberger 151,863 $121,641 - - - (50,621) 28,383
For details of these grants please refer to section 3.6
* The assessed fair value at grant date of options granted to the individuals is allocated equally over the period from grant date to vesting date. The amount is included in the remuneration tables above. As outlined in greater detail in note 1 (q) (iii) fair values at grant date are determined using a Black-Scholes pricing model.
Options forfeited during the period, with the exception of Mr Harwood’s’ due to his retirement, are due to non-achievement of performance targets set by the board for 2017. The board is focused on ensuring that management remuneration and shareholder value are aligned by setting performance targets that create long term shareholder wealth.
The model inputs for options granted to executives are as follows:
(a) Options are granted for no consideration. Each tranche vests at the end of the three-year period.(b) Dividend yield – between 1.6% and 1.9%(c) Expected volatility – between 20.2% and 33.6%(d) Risk-free interest rate – between 1.5% and 2.0%(e) Price of shares on grant date – between $4.97 - $5.94(f) Fair value of options - between $0.68 - $1.27
6.2 Historical performance outcomes under the previous Options Plan
TechnologyOne previously issued options under a now obsolete Executive Option Plan (EOP), which was described in section 3.6. The EOP has now been quarantined and all new Executives to the Company, as well as existing Executives when their existing contracts come to an end, are under the new LTI plan.
For those Executives that are under the older quarantined Option Plan:
• The value actually received by individuals differs from the remuneration outlined in the previous table (whichis based on accounting values). For the 2016 financial year, 16% ($436,816) of the performance relatedbonus as previously accrued in that period became payable in cash to Executives (based on audited results)and was paid during the 2017 financial year. There were no forfeitures.
• The numbers of options over ordinary shares in the Group held during the financial year by each Executive ofthe Group, including their personally related parties, are set out below:
• The KMP have historically received the following share options:• M Harwood participated in options granted 1 October 2014,• E Chung who participated in options granted 14 July 2014, and• R Phare who participated in options granted 1 July 2012.
For
per
sona
l use
onl
y

Technology One LimitedRemuneration report
30 September 2017 (continued)
47
2017
Name Balance at start of year
Granted as compensation Exercised Forfeited
Balance atthe end of the year
Vested and exercisable Unvested
Senior Executives of the Group E Chung 835,000 192,746 (167,000) (43,047) 817,699 - 817,699
R Phare 400,000 268,056 (200,000) (89,352) 378,704 - 378,704
M Harwood 600,000 - (400,000) (200,000) - - - S MacDonald 317,211 270,737 - (171,535) 416,413 - 416,413
T Ristevski - 268,057 - (59,866) 208,191 - 208,191
N Mattenberger - 151,863 - (50,621) 101,242 - 101,242
6.3 Shares provided on exercise of remuneration options Details of ordinary shares in the Group provided as a result of the exercise of remuneration options to each director of Technology One Limited and Senior Executives of the group are set out below.
Name Date of exercise of options Number of ordinary
shares issued on exercise of options during the period
Total paid at exercise
E Chung 11/7/2017 167,000 223,580 R Phare 3/7/2017 200,000 113,720 M Harwood 15/8/2017 400,000 634,460
No amounts are unpaid on any shares issued on the exercise of options.
6.4 Value of LTI grants yet to vest
For the new option plan, they vest three years after the grant date providing that the vesting conditions are met.
For the old EOP, they vest after two years.
The maximum value of options yet to vest has been determined as the amount of the grant date fair value that could be expensed.
The number of options granted during the year is disclosed below:
LTI (Options)
Name Year granted
Vested Forfeited Financial years in
which rights may vest
Maximum total value of grant
yet to vest % % $
E Chung 2017 - 22% 2019 176,420 R Phare 2017 - 33% 2019 200,000 S MacDonald 2017 - 27% 2019 252,000 T Ristevski 2017 - 22% 2019 200,000 N Mattenberger 2017 - 33% 2019 200,000
LTI (Quarantined Options) Name
Year granted Vested Forfeited
Financial years in which
options may vest
Maximum total value of grant
yet to vest % % $
E Chung 2014 33% - 2017 - 2021 992,243 R Phare 2012 80% - 2017 – 2018 80,266
For
per
sona
l use
onl
y

Technology One LimitedRemuneration report
30 September 2017 (continued)
48
7 Remuneration governance
The Remuneration Committee (the Committee) is responsible for developing the remuneration framework for TechnologyOne Executives, and making recommendations related to remuneration to the Board. The Committee develops the remuneration philosophy and policies for Board approval.
As at 30 September 2017, the Committee is made up of a majority of independent Directors and is chaired by an independent director; and consists of the following members:
• Kevin Blinco (Chairman)• Rick Anstey• John Mactaggart• Dr Jane Andrews
The responsibilities of the Committee are outlined in their Charter, which is reviewed annually by the Board.
8 Non-executive director fees
The total amount of Directors fees is capped at a maximum pool that is approved by shareholders. The current fee pool is $1,000,000, which was approved by shareholders at the Annual General Meeting on 17 February 2016.
Non-executive Directors receive fees to recognise their contribution to the work of the Board and the associated committees that they serve. Non-executive Directors do not receive any performance-related remuneration.
The Remuneration Committee has the responsibility for determining the appropriate remuneration for Non-executive Directors. Every third year the committee reviews and compares the Non-executive Director fees to market This year as part of the process of adding a Non-executive director to the board, we engaged an independent third party to review our director’s fees and benchmark them against our peers to ensure we can continue to attract and retain quality directors.
The committee agreed that the directors fees be set at the 75th percentile of ASX 101 – ASX 200 companies with CPI increases until the next review in three years time.
This has resulted in an increase in Directors fees to $127,000, including statutory superannuation contributions. The table below shows the relationship between directors fees and our market capitalisation, directors fees continue to grow at a slower rate than our market capitalisation.
For
per
sona
l use
onl
y

Technology One LimitedRemuneration report
30 September 2017 (continued)
49
Non-Executive Director Fees for 2017 and 2016 Short-term employee benefits Post-
employment benefits Equity remuneration
Name
Fixed remuneration
Directors' fees
Total fixed remuneration
Short-term Incentive
Super- annuation
Termination benefits
Value of share
options
Value of performance
rights
Total % growth on prior year excl
LTI
% growth on prior year incl
LTI
$ $ $ $ $ $ $ $ $
R McLean (Non-executive Director) 2017 - 127,000 127,000 - - - - - 127,000 69% 69% 2016 - 75,132 75,132 - - - - - 75,132
J Mactaggart (Non-executive Director) 2017 - 127,000 127,000 - - - - - 127,000 69% 69% 2016 - 75,132 75,132 - - - - - 75,132
K Blinco (Non-executive Director) 2017 - 127,000 127,000 - - - - - 127,000 69% 69% 2016 - 75,132 75,132 - - - - - 75,132
R Anstey (Non-executive Director) 2017 - 127,000 127,000 - - - - - 127,000 69% 69% 2016 - 75,132 75,132 - - - - - 75,132
Dr J Andrews (Non-executive Director – appointed 22/2/16)
2017 - 127,000 127,000 - - - - - 127,000 145% 145% 2016 - 51,872 51,872 - - - - - 51,872
Total Non- Executive Directors 2017 - 635,000 635,000 - - - -
635,000 80%
80%
2016 - 352,400 352,400 - - - 352,400
For
per
sona
l use
onl
y

Technology One LimitedRemuneration report
30 September 2017 (continued)
50
9 Director shareholdings
Directors are required to hold a minimum shareholding of one year’s (pre tax) directors fees in TechnologyOne shares. Directors are required to rectify any short fall within a 24 month period. New Directors are allowed 24 months to meet this requirement.
The Board in total holds 74,725,300 shares representing 24% of the total shareholding of the Company.
10 Equity instruments held by Key Management Personnel
The number of shares in the Group held during the financial year by each Director and Senior Executive of Technology One Limited, including their personally related parties, are set out below. There were no shares granted during the reporting period as compensation.
2017
Name Balance at the start of year
Purchased during the year
Sale during the year
Net change other Balance at the
end of the year Directors of Technology One Limited A Di Marco 34,378,500 - (3,000,000) - 31,378,500 R McLean 141,000 - - - 141,000 J Mactaggart 45,902,500 - (3,000,000) - 42,902,500 K Blinco 250,000 10,000 - - 260,000 R Anstey 15,000 4,000 - - 19,000 J Andrews 8,325 15,975 - - 24,300
Senior Executives of the Group Balance at the
start of year Received during the
year on the exercise of
options Sale during the
year
Net change other
Balance at the end of the year
E Chung 265,000 167,000 - - 432,000 R Phare - 200,000 (200,000) - - M Harwood 1,000,000 400,000 (1,200,000) (200,000) - S MacDonald - - - - - T Ristevski - - - - - N Mattenberger - - - - - J Ruthven - - - - -
2016
Name Balance at the start of year
Purchased during the year Sales during the
year
Net changeother Balance at the
end of the year Directors of Technology One Limited A Di Marco 37,378,500 - (3,000,000) - 34,378,500 R McLean 141,000 - - - 141,000 J Mactaggart 48,902,500 - (3,000,000) - 45,902,500 K Blinco 250,000 - - - 250,000 R Anstey 7,500 7,500 - - 15,000 J Andrews - 8,325 - - 8,325
Senior Executives of the Group
Balance at the start of year Received during the
year on the exercise of options Sales during the
year
Net change other
Balance at the end of the year
E Chung 350,000 165,000 (250,000) - 265,000 R Phare - 200,000 (200,000) - - M Harwood 400,000 600,000 - - 1,000,000 P Rogers - 200,000 (200,000) - - S MacDonald - - - - - T Ristevski - - - - -
For
per
sona
l use
onl
y

Technology One LimitedRemuneration report
30 September 2017 (continued)
51
11 Loans to key management personnel
There have been no loans to directors or Executives during the financial year (2016 - nil).
12 Other transactions with key management personnel
During the year there were no transactions with the key management personnel. This report is made in accordance with a resolution of directors.
.
For
per
sona
l use
onl
y

Technology One LimitedCorporate governance statement
30 September 2017
52
Corporate governance statement
The Board of Directors of the Company is responsible for its corporate governance. The Board guides and monitors the business and affairs of the Company on behalf of the shareholders by whom they are elected and to whom they are accountable.
The Board has the authority to delegate any of their powers to committees consisting of such Directors and external consultants, as the Directors think fit. The Board has established an Audit & Risk Committee, a Remuneration Committee and a Nomination Committee.
The format of the Corporate Governance Statement is in accordance with the Australian Securities Exchange Corporate Governance Council’s Corporate Governance Principles and Recommendations (3rd Edition). In accordance with the Council’s recommendations, the Corporate Governance Statement must contain specific information and disclose the extent to which the Company has followed the guidelines during the period.
TechnologyOne’s corporate governance practices were in place throughout the year ended 30 September 2017. As noted below there are some recommendations with which the Company has not complied to which the Company explains why at the end of the statement. Apart from these the Company has complied with all the principles’ recommendations.
The Directors have established guidelines for the operation of the Board. Set out below are the Company’s main corporate Governance practices.
The Company’s complete Corporate governance Statement is available on the Company’s internet site www.technologyonecorp.com in the ‘Shareholders’ area.
Board of Directors and its Committees
Board of Directors The directors are as follows: Adrian Di Marco Executive Chairman & Chief Innovation Officer - Major shareholder John Mactaggart Non-executive Director - Major shareholder Ronald McLean Non-executive Director - Independent Kevin Blinco Non-executive Director - Independent Richard Anstey Non-executive Director - Independent Jane Andrews Non-executive Director - Independent
The Company Secretary is Stephen Kennedy.
For
per
sona
l use
onl
y

Technology One LimitedCorporate governance statement
30 September 2017 (continued)
53
The Board of Directors operates in accordance with the following broad principles:
• The Board should comprise of at least three members, but no more than 10. The current Board membership is six.The Board may increase the number of Directors where it is felt that additional expertise in specific areas isrequired. The Company believes for its current size, a smaller Board allows it to be more effective and to reactquickly to opportunities and threats.
• The Board should be comprised of Directors with an appropriate mix of skills, qualifications, expertise, experienceand diversity. The skills, experience and expertise which the Board considers to be particularly relevant includethose in the area of finance, information technology, and Australian and International Business. In respect ofdiversity, the Board recognises that diversity relates to, but is not limited to gender, age, ethnicity and culturalbackground. The Board values diversity and recognises the individual contribution that people can make and theopportunity for innovation that diversity brings.
• The Board shall meet on both a planned basis and an unplanned basis when required, and have available allnecessary information to participate in an informed discussion of agenda items.
• The Directors are entitled to be paid expenses incurred in connection with the execution of their duties as Directors.Each Director is therefore able to seek independent professional advice at the Company’s expense, where it is inconnection with their duties and responsibilities as Director. The Company policy is that a Director wishing to seekindependent legal advice should advise the Chairman at least 48 hours before doing so.
• The Directors and Officers will not engage in short term trading of the Company’s shares. Furthermore, theDirectors and officers will not buy or sell shares at a time when they possess information which, if disclosed publicly,would be likely to materially affect the market price of the Company’s shares. Information is not considered to begenerally available until a reasonable time has elapsed to allow the market to absorb these announcements. Adetailed policy exists on this matter – refer below, section: Trading in Company Securities.
• Directors have a clear understanding of the corporate and regulatory expectations of them. To this end formalletters of appointment are made for each Director setting out the key terms and conditions, any special duties orarrangements, remunerations and expenses, their rights and entitlements, confidentiality and rights of access tocorporate information, as well as Indemnity and Insurance cover provided.
• Newly appointed Directors undertake an induction course covering the Company’s strategy, products andoperations. They are also provided a copy of the Company’s constitution.
• Directors are required to disclose Directors’ interests and any matters that affect the Director’s independence. Thisincludes disclosure of conflicts of interest, which may include transactions with family members or related entities.
• If there is a potential conflict of interest, conflicted Directors must immediately inform the Board and abstain fromdeliberations on such matters. Such Directors are not permitted to exercise any influence over other Boardmembers. If the Board believes the conflict of interest is material or significant the Directors concerned will not beallowed to attend the meeting or receive the relevant Board papers.
For
per
sona
l use
onl
y

Technology One LimitedCorporate governance statement
30 September 2017 (continued)
54
The Role of the Board is as follows:
• Setting objectives, goals and strategic direction for management, with a view to maximising shareholder value.
• Input into and ratifying any significant changes to the company.
• Adopting an annual budget and monitoring financial performance.
• Ensuring adequate internal controls exist and are appropriately monitored for compliance.
• Ensuring significant business risks are identified and appropriately managed.
• Selecting, appointing and reviewing the performance of the Managing Director.
• Setting the highest business standards and code of ethical behaviour.
• Overseeing the establishment and implementation of the risk management system, and annually reviewing its effectiveness.
• Decisions relating to the appointment or removal of the Company Secretary.
A code of conduct has been established for the Board.
The Board has established a diversity policy, which is discussed below.
The Company has established a policy requiring the evaluation of the performance of Directors on an annual basis. This is undertaken by the Nomination Committee.
Appointment of Directors If a vacancy exists, or where the Board considers it will benefit from the appointment of a new Director with particular skills, the Board will interview the candidates. Potential candidates will be identified by the Nomination Committee, with the Board entitled to seek the advice of an external consultant. The Board will then appoint the most suitable candidate, who upon acceptance will hold office until the next Annual General Meeting, where the appointee must retire and is entitled to stand for re-election.
Majority of Independent Directors Four of the six Directors are independent. To be classified as independent, these Directors are Non-Executive Directors of the Company and not allied with the interests of management, a substantial security holder or other relevant stakeholder and can and will bring an independent judgement to bear on issues before the board. Ron McLean was previously an Executive of the Company until 2004. Notwithstanding this, TechnologyOne classify him as an independent Non-Executive Director as a result of the lapse of time (13 years) since holding the position, and the changes in senior management at TechnologyOne since then.
Having said this, some advisors have not considered Mr McLean as being independent. As a result, the Board may not be seen as majority independent. Because of this, the Board appointed Dr Jane Andrews to the Board in 2016 as an independent director and is looking to appoint two additional independent directors in the coming year.
TechnologyOne is also keen to retain Mr McLean on the Board because of his deep industry knowledge and his extensive experience and successful track record in enterprise software, which is uncommon in Australia, which adds significant value to the TechnologyOne Board. F
or p
erso
nal u
se o
nly

Technology One LimitedCorporate governance statement
30 September 2017 (continued)
55
Audit and Risk Committee The Board has established an Audit & Risk Committee. The Committee meets at least four times per year.
The Committee is comprised of: • K Blinco (Chairman)• R Anstey• R McLean• J Andrews
The role of the Committee is as follows: • Ensure the integrity in financial reporting• Receive and review reports from the external auditor• Review for accuracy financial statements for each reporting period prior to approval by the Board, and
publishing• Monitor compliance with the requirements of the Corporations Act, Listing Rules, Australian and Foreign
Taxation Offices and other related legal obligations• Ensure that the financial statements for each reporting period comply with appropriate accounting standards• Regularly review Accounting Standards and Company Policies in conjunction with the Auditors, and recommend
adoption/changes to the Board• Ensure the Internal Audit Function maintains a high standard of performance• Monitor compliance with the requirements of the Corporations Act, Listing Rules, Australian & foreign taxation
offices and other related legal obligations• Oversee the ongoing development by management of an enterprise-wide risk management framework for
management of material risks• Periodically review the adequacy and effectiveness of the Company’s policies and procedures relating to risk
management and compliance• Make recommendations to the Board on key risk management performance indicators and levels of risk appetite
Remuneration Committee The Board has established a Remuneration Committee. The Committee meets at least two times per year.
The Committee is comprised of a majority of independent directors, and is chaired by an independent director. The Committee is comprised of:
• K Blinco (Chairman)• J Mactaggart• R Anstey• J Andrews
The role of the Committee is as follows: • To advise the Board with regard to the Company’s remuneration framework for Executives.• To determine the individual remuneration framework for Executives and Directors.• To give the Company’s Executives encouragement to enhance the Company’s performance and to ensure
that they are fairly, but responsibly, rewarded for their individual contribution.• Make recommendations to the Board, based on the items above.
Non-executive directors’ remuneration is determined by the Board within the aggregate amount per annum which may be paid in directors’ fees.
For
per
sona
l use
onl
y
Technology One LimitedCorporate governance statement
30 September 2017 (continued)
56
Nomination Committee
The Board has established a Nomination Committee.
The Committee meets as required during the year.
The Committee is comprised of a majority of independent directors, and is chaired by an independent director.
The Committee is comprised of: • R Anstey (Chairman)• J Mactaggart• K Blinco• J Andrews
The role of the Committee is as follows: • Assessment of the necessary and desirable competencies and experience for board membership.• Assessment of the independence of each Director.
Evaluation of the membership of the Board, Audit & Risk and Remuneration committees, and their membership.
• Evaluation initially and on an on-going basis of Non-Executive Director’s professional development,commitments, and their ability to commit the necessary time required to fulfil their duties to a high standard.
• Adherence by Directors to the Director’s Code of Conduct and to good corporate governance.• Review of Board succession plans, changes to committees and appointment of new Directors.• Recommendation of, and undertaking the appropriate checks, for the endorsement or non-endorsement of
existing Directors.• Make recommendations to the Board, based on the items above.
Ethical Standards
All directors, managers and employees are expected to act with the utmost integrity and objectivity, observe the highest standards of behaviour and business ethics, and strive at all times to enhance the reputation and performance of the Company.
Shareholders’ Rights
The Board of Directors aims to ensure that shareholders are informed of all major developments affecting the Company’s state of affairs. The information is communicated to shareholders by the:
• Annual Report being distributed to all shareholders. The Board ensures the Annual Report contains all relevant information about the operations of the Company during the financial year, together with details of future developments and other disclosures required under the Corporations Act 2001.
• Company’s Annual General Meeting.• Half Year Results Report distributed to all shareholders.• Disclosures forwarded to the Australian Securities Exchange under the Company’s continuous disclosure
obligations;• Company’s web site, under a special area called Shareholders;.
All information communicated by the Company is in accordance with its continuous disclosure requirements under ASX Listing Rule 3.1.
Risk Management
The Board has received reports from management on the risk management strategies, their effectiveness, and any current risk items. Management is responsible for the design and implementation of control systems, which are reviewed and approved by the Board. The whole area of risk management is outlined in the Corporate Governance Statement (on the company’s website) and is constantly reviewed. Risk management reporting is included in each Board and Audit & Risk Committee meeting. The Board required the CEO and CFO to sign the attestation statements in line with Corporations Act requirements.
For
per
sona
l use
onl
y
Technology One LimitedCorporate governance statement
30 September 2017 (continued)
57
Diversity at Technology One
The diversity of TechnologyOne remains fundamental to our ongoing success. TechnologyOne has established a Diversity Policy which reflects the company’s commitment to providing an inclusive workplace.
A summary of the Diversity Policy is following: • Diversity is one of TechnologyOne’s strengths. TechnologyOne values this diversity and recognises the
individual contribution our people can make and the opportunity for innovation such diversity brings.
• TechnologyOne believes that we will achieve greater success by providing our people with an environment that respects the dignity of every individual, fosters trust, and allows every person the opportunity to realise their full potential.
• TechnologyOne is committed to providing an inclusive workplace and our commitment to diversity extends to our interactions with customer and suppliers.
The Board established measurable objectives for 2017 and the objectives are: • Ensuring compliance with the published diversity policy.• Diversity target - setting targets for the number of women in senior roles in the organisation• Maintain reporting measures that are in compliance with both the ASX guidelines and Workplace Gender
Equality Agency.• Continue to identify employee feedback mechanisms through the review of existing forums and information
provided as well as the identification of appropriate new mechanisms for employee consultation.• Maintain existing educational programs that support diversity including but not limited to induction, on
boarding and leadership programs delivered through the TechnologyOne College.
These objectives have been met, however TechnologyOne recognises further progress and improvement is possible and for this reason, for 2017, TechnologyOne will continue to progress objectives one through to four.
TechnologyOne's Australian workplace profile as at 30 September 2017 is detailed below:
Male % Female % Total Board & Executive Directors 5 83 1 17 6 Executive 6 86 1 14 7 Managers 96 73 35 27 131 Employees 539 63 311 37 850
646 65 348 34 994
The Board is aiming to add up to an additional two Directors to the Board this coming year. This provides the Company with an exciting opportunity to increase the diversity on the Board as well as increasing the number of independent Directors.
For
per
sona
l use
onl
y

Technology One LimitedCorporate governance statement
30 September 2017 (continued)
58
Non-Compliance with ASX Corporate Governance Principles and Recommendations
The Board of Technology One believes in working to the highest standards of Corporate Governance. Notwithstanding this, the Board believes it is important to recognise there is not a ‘one size fits all’ to good Corporate Governance, and that it is important to consider the size of the Company, the industry it operates within, the corporate history and the Company’s inherent strengths.
The ASX Corporate Governance Council has recognised this fact, and has allowed companies to explain where they do not comply with the Corporate Governance Principles and Recommendations 3rd Edition.
The Company has complied with the majority of recommendations, with the exception of but a few. The Board believes the areas of non-conformance shown below will not impact the Company’s ability to meet the highest standards of Corporate Governance, and will at the same time allow the Company to capitalise on its inherent strengths.
This section highlights those areas of non-compliance and provides the reasons why.
Majority of Independent Directors (Refer ASX Corporate Guidelines - Recommendation 2.4)
The number of Directors is six. The Board has identified four of these Directors are independent, and two as not independent because they are major shareholders.
The Board is of the opinion that it should bring independent judgment in making all decisions and believes strongly that having two major shareholders (both who have been founders of the Company) has added to the significant strength to the Board, and provides a continuing vision for the Company’s success.
The independence of Mr Ron McLean has been debated by some corporate advisory groups because he was a past employee of TechnologyOne, ceasing to be an executive in 2004. The Board is of the opinion that, due to the period of time that has lapsed since Mr McLean’s employment with the company, Mr McLean is considered as being independent.
The ASX guidelines commentary provides the following guidelines note which supports this position: “The mere fact that a director has served on a board for a substantial period does not mean that he or she has become too close to management to be considered independent. However, the board should regularly assess whether that might be the case for any director who has served in that position for more than 10 years.”
The ASX guidelines also states that it “recognises that the interests of a listed entity and its security holders are likely to be well served by having a mix of directors, some with a longer tenure with a deep understanding of the entity and its business and some with a shorter tenure with fresh ideas and perspective.”
Having said this, the TechnologyOne Board has committed to a Board renewal process. Because of this, the Board appointed Dr Jane Andrews to the Board in 2016 as an independent director, and is looking to appoint two additional independent directors in the coming year.
For
per
sona
l use
onl
y
Technology One LimitedCorporate governance statement
30 September 2017 (continued)
59
Independent Chairman (Refer to ASX Corporate Guidelines – Recommendation 2.5)
The Board is of the opinion it should maximise the vision, skills and deep industry knowledge of the Company’s founder and major shareholder, Mr Di Marco, to continue to lead the Company forward. He has a long and proven track record of creating significant shareholder wealth for the Company as its Chairman, since listing on the ASX in 1999.
The Board believes Mr Di Marco continues to be the best candidate to clearly communicate the Company’s vision, strategy and to set market expectations. To this end it is seen as appropriate that Mr Adrian Di Marco should remain as Chairman of the Company.
There is no empirical evidence to support the preference of an Independent Chairman.
The ASX Corporate Governance Principles and Recommendations propose that “if the Chair is not an independent Director, a listed entity should consider the appointment of an independent director as the Deputy Chair”. Mr McLean was appointed Deputy Chair at the Board meeting held 15 August 2017. Mr McLean is deemed to be an independent non-executive director in the Board’s opinion.
On 23 May 2017, Ed Chung was appointed as Chief Executive Officer. Mr Di Marco will not be deemed as independent under the ASX guidelines due to him being a substantial shareholder. This however, aligns Mr Di Marco with the interests of the Company’s shareholders.
For
per
sona
l use
onl
y

Technology One LimitedConsolidated income statement
For the year ended 30 September 2017
60
Revenue
Notes
5
2017 2016 $'000 $'000
273,253 249,018
Variable costs (24,766) (23,965) Variable customer cloud costs (9,611) (7,575) Total variable costs (34,377) (31,540)
Occupancy costs (7,750) (9,033) Corporate costs (16,421) (13,665) Depreciation & amortisation 6 (4,237) (3,924) Computer & communication costs (10,599) (9,262) Marketing costs (5,624) (2,751) Employee costs (134,602) (124,006) Share-based payments (1,576) (1,496) Finance expense (48) (101)Total operating costs (180,857) (164,238)
Profit before income tax 7 58,019 53,240
Income tax expense 7 (13,525) (11,896) Profit for the year from continuing operations 44,494 41,344
Cents Cents
Basic earnings per share 31 14.18 13.26 Diluted earnings per share 31 14.10 13.11
The above consolidated income statement should be read in conjunction with the accompanying notes.
For
per
sona
l use
onl
y

Technology One Limited Consolidated statement of comprehensive income
For the year ended 30 September 2017
2017 2016
61
$'000 $'000
Profit for the year from continuing operations 44,494 41,344
Other comprehensive income
Items that may be reclassified to profit or loss in subsequent periods Exchange differences on translation of foreign operations (167) (345)
Other comprehensive income for the year, net of tax (167) (345)
Total comprehensive income for the year 44,327 40,999
The above consolidated statement of comprehensive income should be read in conjunction with the accompanying notes.
For
per
sona
l use
onl
y

Technology One Limited Consolidated statement of financial position
As at 30 September 2017
2017 2016
62
ASSETS
Notes $'000 $'000
Current assets Cash and cash equivalents 8 93,383 82,588 Prepayments 8,220 5,817 Trade and other receivables 9 53,262 41,642 Earned and unbilled revenue 14,305 16,421 Other current assets 10 798 793 Total current assets 169,968 147,261
Non-current assets Property, plant and equipment 11 13,525 11,681 Intangible assets 12 47,549 48,088 Earned and unbilled revenue 11,914 3,980 Deferred tax assets 13 5,482 7,512 Total non-current assets 78,470 71,261
Total assets 248,438 218,522
LIABILITIES Current liabilities Trade and other payables 14 38,253 24,587 Provisions 15 11,270 11,194 Current tax liabilities 392 1,085 Unearned revenue 27,862 20,885 Borrowings 16 10 29 Total current liabilities 77,787 57,780
Non-current liabilities Trade and other payables 28 8,370 16,068 Provisions 17 3,338 4,555 Other non-current liabilities 18 1,423 1,625 Total non-current liabilities 13,131 22,248
Total liabilities 90,918 80,028
Net assets 157,520 138,494
EQUITY Contributed equity 20 32,152 29,984 Other reserves 21 34,687 38,350 Retained earnings 90,681 70,160
Total equity 157,520 138,494
The above consolidated statement of financial position should be read in conjunction with the accompanying notes.
For
per
sona
l use
onl
y

Technology One Limited Consolidated statement of changes in equity
For the year ended 30 September 2017
Share
63
Contributed Retained Dividend FOREX option Total equity earnings reserve reserve reserve equity
Notes $'000 $'000 $'000 $'000 $'000 $'000
Balance at 1 October 2017 Exchange differences on translation of foreign
29,984 70,160 22,172 (561) 16,739 138,494
operations - - - (167) - (167)Profit for the period - 44,494 - - - 44,494Total comprehensive income for the period - 44,494 - (167) - 44,327
Dividends paid 22 - - (30,370) - - (30,370)Transfer to dividend reserve - (23,973) 23,973 - - -Exercise of share options 20 2,168 - - - - 2,168
Share based payments 32 - - - - 1,576 1,576Tax impact of share trust - - - - 1,325 1,325
2,168 (23,973) (6,397) - 2,901 (25,301)Balance at 30 September 2017 32,152 90,681 15,775 (728) 19,640 157,520
Balance at 1 October 2016 Exchange differences on translation of foreign
28,459 58,384 20,562 (216) 10,751 117,940
operations - - - (345) - (345)Profit for the period - 41,344 - - - 41,344Total comprehensive income for the period - 41,344 - (345) - 40,999
Dividends paid 22 - - (27,958) - - (27,958)Transfer to dividend reserve - (29,568) 29,568 - - -Exercise of share options 20 1,525 - - - - 1,525Share-based payments 32 - - - - 1,496 1,496Tax impact of share trust - - - - 4,492 4,492
1,525 (29,568) 1,610 - 5,988 (20,445)Balance at 30 September 2016 29,984 70,160 22,172 (561) 16,739 138,494
The above consolidated statement of changes in equity should be read in conjunction with the accompanying notes.
For
per
sona
l use
onl
y

Technology One Limited Consolidated statement of cash flows For the year ended 30 September 2017
64
Notes 2017 $'000
2016 $'000
Cash flows from operating activities Receipts from customers (inclusive of GST)
296,419 266,492
Unused prepayments to suppliers (2,417) (3,996) Payments to suppliers and employees (inclusive of GST) (238,006) (210,508) Interest received 728 1,035 Income taxes paid (10,507) (10,711) Other revenue 273 1,530 Interest paid (48) (101)Net cash inflow / (outflow) from operating activities 30 46,442 43,741
Cash flows from investing activities Payments for acquisition of subsidiary (net of cash acquired) (1,322) (3,017)
Payments for property, plant and equipment (6,109) (4,889)
Proceeds from sale of property, plant and equipment 3 13
Net cash inflow / (outflow) from investing activities (7,428) (7,893)
Cash flows from financing activities Proceeds from exercise of share options 2,168 1,525 Repayment of finance lease (17) (2,363)Dividends paid to Company's shareholders 22 (30,370) (27,958) Net cash inflow / (outflow) from financing activities (28,219) (28,796)
Net increase / (decrease) in cash and cash equivalents 10,795 7,052 Cash and cash equivalents at the beginning of the financial year 82,588 75,536 Cash and cash equivalents at end of year 8 93,383 82,588
The above consolidated statement of cash flows should be read in conjunction with the accompanying notes.
For
per
sona
l use
onl
y

Technology One Limited Notes to the consolidated financial statements
30 September 2017
65
1 Summary of significant accounting policies
The financial report of Technology One Limited (the Company) for the year ended 30 September 2017 was authorised for issue in accordance with a resolution of directors on 21 November 2017.
Technology One Limited (the Company) is a company limited by shares incorporated in Australia whose shares are publicly traded on the Australian Stock Exchange.
The principal accounting policies adopted in the preparation of these financial statements are set out below. These policies have been consistently applied to all the periods presented, unless otherwise stated. The financial statements are for the consolidated entity consisting of Technology One Limited and its subsidiaries. The nature of the operations and principal activities of the Group are described in the directors' report.
(a) Basis of preparation
The financial report is a general purpose financial report prepared by a for profit entity, which has been prepared in accordance with the requirements of the Corporations Act 2001, Australian Accounting Standards and other authoritative pronouncements of the Australian Accounting Standards Board.
The financial report is presented in Australian dollars and all values are rounded to the nearest thousand dollars ($000) unless otherwise stated.
The accounting policies adopted are consistent with those of the previous financial year.
(i) Compliance with IFRS
This financial report also complies with International Financial Reporting Standards (IFRS) as issued by the International Accounting Standards Board.
(ii) Newly adopted standards
New or amended standards that became applicable for the first time for the 30 September 2017 year end did not result in a change to the Company’s accounting policies or require retrospective adjustments. Certain new accounting standards and interpretations have been published that are not effective for the 30 September 2017 year end reporting period are outlined below.
(iii) Issued but not yet effective
AASB 9 Financial Instruments includes requirements for the classification and measurement of financial assets. It was further amended by AASB 2010 - 7 to reflect amendments to the accounting for financial liabilities. The effective date of this standard is 1 January 2018, however it is available for early adoption. The Company has not yet assessed how it will be affected by the new standard and has not yet decided when to adopt it.
For
per
sona
l use
onl
y
Technology One Limited Notes to the consolidated financial statements
30 September 2017 (continued)
66
1 Summary of significant accounting policies (continued)
(iv) Issued but not yet effective (continued)
AASB 15 Revenue from Contracts with Customers was issued by AASB in January 2015 and replaces all revenue recognition requirements, including those as set out in AASB 118 Revenue. The standard contains a single model that applies to all revenue arising from contracts, unless the contracts are in the scope of other standards (e.g. leases). The effective date of this standard is financial years beginning on or after 1 January 2018, with early adoption permitted. This will apply to the Company initially in the financial report for the financial year ended 30 September 2019. No decision on whether to adopt a retrospective approach has been made.
The contracting arrangements of the Company are complex and involve a number of performance obligations which in some cases may be interdependent. The Company has not yet finalized its position on the impact of AASB15 across all revenue streams, however to date some differences in the timing of revenue recognition (based on current contract terms) have been noted. Our impact assessment is on-going and still requires additional analysis to confirm if ultimately differences exist. The Company is also working with its existing customers on the terms of current agreements and agreements with new customers, as our product offerings evolve, which may vary contract terms and influence the impact of adoption, or cause there to be no ongoing impact. As a result of this, an overall impact assessment on reported results go forward has not been determined. The Company notes this will not impact cash flows.
AASB 16 Leases was issued in February 2016. The standard introduces a single lessee accounting model and requires lessees to recognise assets and liabilities for all leases with a term of more than 12 months, unless the underlying asset is of low value. The standard removes the clarification of leases as either operating or finance leases for the lessee and effectively treats all leases as finance leases. There are also changes in the accounting over the life of the lease. AASB 16 substantially carries forward the lessor accounting requirements in AASB 117. Accordingly, lessor accounting will remain similar to current practice. The new standard will be effective for annual periods beginning on or after 1 January 2019. Early application is permitted, provided the new revenue standard, AASB 15 Revenue from Contracts with Customers, has been applied, or is applied at the same date as AASB 16. The Company has not yet assessed how it will be affected by the new standard and has not yet decided when to adopt it.
(v) Historical cost convention
These financial statements have been prepared under the historical cost convention, as modified by the revaluation of available-for-sale financial assets, financial assets and liabilities (including derivative instruments) at fair value through the income statement.
(vi) Critical accounting estimates
The preparation of financial statements requires the use of certain critical accounting estimates. It also requires management to exercise its judgement in the process of applying the Company's accounting policies. The areas involving a higher degree of judgement or complexity, or areas where assumptions and estimates are significant to the financial statements, are disclosed in note 3.
(b) Principles of consolidation
(i) Subsidiaries
The consolidated financial statements incorporate the assets and liabilities of all subsidiaries of Technology One Limited ('Company' or 'parent entity') as at 30 September 2017 and the results of all subsidiaries for the year then ended. Technology One Limited and its subsidiaries together are referred to in this financial report as the 'Company' or the 'Consolidated entity'.
Intercompany transactions, balances and unrealised gains on transactions between companies are eliminated. Unrealised losses are also eliminated unless the transaction provides evidence of the impairment of the asset transferred. Accounting policies of subsidiaries have been changed where necessary to ensure consistency with the policies adopted by the Company.
(ii) Employee Share Trust
The Company has formed a trust to administer the Company's employee share scheme. This trust is consolidated as the substance of the relationship is that the trust is controlled by the Company. At 30 September 2017, the company had 500,656 (2016 - 954,679) Treasury Shares.
For
per
sona
l use
onl
y

Technology One Limited Notes to the consolidated financial statements
30 September 2017 (continued)
67
1 Summary of significant accounting policies (continued)
(c) Foreign currency translation
(i) Functional and presentation currency
Items included in the financial statements of each of the Company's operations are measured using the currency of the primary economic environment in which the entity operates ('the functional currency'). The consolidated financial statements are presented in Australian dollars, which is Technology One Limited's functional and presentation currency.
(ii) Transactions and balances
Foreign currency transactions are translated into the functional currency using the exchange rates prevailing at the dates of the transactions. Foreign exchange gains and losses resulting from the settlement of such transactions and from the translation at year end exchange rates of monetary assets and liabilities denominated in foreign currencies are recognised in the income statement.
(iii) Group companies
The results and financial position of foreign operations (none of which has the currency of a hyperinflationary economy) that have a functional currency different from the presentation currency are translated into the presentation currency as follows:
• Assets and liabilities for each statement of financial position presented are translated at the closing rate at thedate of that statement of financial position, and
• Income and expenses for each income statement and statement of comprehensive income are translated ataverage exchange rates (unless this is not a reasonable approximation of the cumulative effect of the ratesprevailing on the transaction dates, in which case income and expenses are translated at the dates of thetransactions), and
• All resulting exchange differences are recognised in other comprehensive income.
(d) Revenue recognition
Revenue is measured at the fair value of the consideration received or receivable.
The Company recognises revenue when the amount of revenue can be reliably measured, it is probable that future economic benefits will flow to the entity and specific criteria have been met for each of the Company's activities as described below. The Company bases its estimates on historical results, taking into consideration the type of customer, the type of transaction and the specifics of each arrangement.
The Company sells its licenced software under a perpetual licence contract with associated services, or as part of a “Software as a Service” (SaaS) solution which allows customers access to licensed software for a defined period, along with associated services.
Revenue is recognised for the major business activities as follows:
(i) Software Licence Fee Revenue
Revenue from licence fees due to software sales is recognised on the transferring of significant risks and rewards of ownership of the licensed software under an agreement between the Company and the customer.
(ii) Implementation and Consulting Services Revenue for Licenced Software
Revenue from implementation and consulting services attributable to licensed software is recognised in proportion to the stage of completion, typically in accordance with the achievement of contract milestones and/or hours expended.
(iii) Post Sales Customer Support Revenue for Licensed Software
Post sales customer support (PSCS) revenue for licensed software comprises fees for ongoing upgrades, minor software revisions and helpline support. PSCS revenue is allocated between annual fees for helpline support and fees for rights of access to ongoing upgrades and minor software patches. Fees for rights of access to ongoing upgrades and minor software revisions are recognised at the commencement of the period to which they relate on the basis that the Company has no ongoing obligations or required expenditure related to this revenue.
For
per
sona
l use
onl
y
Technology One Limited Notes to the consolidated financial statements
30 September 2017 (continued)
1 Summary of significant accounting policies (continued)
68
(iv) Project Services Revenue
Revenue from project services agreements is recognised in proportion to their stage of completion, typically in accordance with the achievement of contract milestones and/or hours expended.
(v) Cloud Services
Revenue from cloud services is recognised as the services are performed.
(vi) Unearned Services Revenue
Amounts received from customers in advance of provision of services are accounted for as a liability called Unearned Revenue.
(vii) Earned and Unbilled Revenue
Amounts recorded as earned and unbilled revenue represent revenues recorded on software licence fees and PSCS fees not yet invoiced to customers. These amounts have met the revenue recognition criteria of the Company, but have not reached the payment milestones contracted with customers.
(viii) SaaS Revenue
Software as a Service (SaaS) revenue is separable into each of its components of software licence fees, post sales customer support and cloud services. At each reporting date, the unearned portion is assessed and deferred to be recognised over the period of service.
(e) Income tax
The income tax expense or benefit for the period is the tax payable on the current period's taxable income based on the applicable income tax rate for each jurisdiction adjusted by changes in deferred tax assets and liabilities attributable to temporary differences and to unused tax losses.
The current income tax charge is calculated on the basis of the tax laws enacted or substantively enacted at the end of the reporting period in the countries where the Company's subsidiaries operate and generate taxable income. Management periodically evaluates positions taken in tax returns with respect to situations in which applicable tax regulation is subject to interpretation. It establishes provisions where appropriate on the basis of amounts expected to be paid to the tax authorities.
Deferred income tax is provided in full, using the liability method, on temporary differences arising between the tax bases of assets and liabilities and their carrying amounts in the consolidated financial statements. However, the deferred income tax is not accounted for if it arises from initial recognition of an asset or liability in a transaction other than a business combination that at the time of the transaction affects neither accounting nor taxable profit or loss. Deferred income tax is determined using tax rates (and laws) that have been enacted or substantially enacted by the end of the reporting period and are expected to apply when the related deferred income tax asset is realised or the deferred income tax liability is settled.
Deferred tax assets are recognised for deductible temporary differences and unused tax losses only if it is probable that future taxable amounts will be available to utilise those temporary differences and losses.
Deferred tax liabilities and assets are not recognised for temporary differences between the carrying amount and tax bases of investments in foreign operations where the Company is able to control the timing of the reversal of the temporary differences and it is probable that the differences will not reverse in the foreseeable future.
Deferred tax assets and liabilities are offset when there is a legally enforceable right to offset current tax assets and liabilities and when the deferred tax balances relate to the same taxation authority. Current tax assets and tax liabilities are offset where the entity has a legally enforceable right to offset and intends either to settle on a net basis, or to realise the asset and settle the liability simultaneously.
The carrying amount of deferred income tax assets is reviewed at each reporting date and reduced to the extent that it is no longer probable that sufficient taxable profit will be available to allow all or part of the deferred income tax asset to be utilised.
For
per
sona
l use
onl
y
Technology One Limited Notes to the consolidated financial statements
30 September 2017 (continued)
1 Summary of significant accounting policies (continued)
69
Deferred income tax assets and liabilities are measured at the tax rates that are expected to apply to the year when the asset is realised or the liability is settled, based on tax rates (and tax laws) that have been enacted or substantively enacted at the reporting date.
Technology One Limited and its wholly-owned Australian controlled entities have implemented the tax consolidation legislation. As a consequence, these entities are taxed as a single entity and the deferred tax assets and liabilities of these entities are set off in the consolidated financial statements.
The head entity, Technology One Limited, and the controlled entities in the tax consolidated group account for their own current and deferred tax amounts. These tax amounts are measured as if each entity in the tax consolidated group continues to be a stand-alone taxpayer in its own right.
The Company has applied the Group allocation approach in determining the appropriate amount of current taxes and deferred taxes to allocate to members of the tax consolidated group. The current and deferred tax amounts are measured in a systematic manner that is consistent with the broad principles in AASB 112.
The Company created an Employee Share Trust during 2009 which allows an employee on the exercise of an option to hold the share in the Trust. As per AASB 112, on granting the option, the Company now records a deferred tax asset on the expected value of the share. If the amount of the tax deduction (or estimated future tax deduction) exceeds the amount of the related cumulative remuneration expense, the difference is recognised directly in equity. When the employee exercises the option, the tax effect difference between the actual market value and what was recorded as a deferred tax asset is recognised to equity.
(f) Segment reporting
An operating segment is a component of an entity that engages in business activities from which it may earn revenues and incur expenses (including revenues and expenses relating to transactions with other components of the same entity), whose operating results are regularly reviewed by the entity's chief operating decision maker to make decisions about resources to be allocated to the segment and assess its performance and for which discrete financial information is available.
Operating segments have been identified based on the information provided to the chief operating decision maker - being the Executive Chairman.
Operating segments that meet the quantitative criteria as prescribed by AASB 8 are reported separately. However, an operating segment that does not meet the quantitative criteria is still reported separately where information about the segment would be useful to users of the financial statements.
Information about other business activities and operating segments that are below the quantitative criteria are combined and disclosed in a separate category for 'all other segments'.
(g) Leases
Leases of property, plant and equipment where the Company, as lessee, has substantially all the risks and rewards of ownership are classified as finance leases (note 11). Finance leases are capitalised at the lease's inception at the fair value of the leased property or, if lower, the present value of the minimum lease payments. The corresponding rental obligations, net of finance charges, are included in other short-term and long-term payables. Each lease payment is allocated between the liability and finance cost. The finance cost is charged to the Income Statement over the lease period so as to produce a constant periodic rate of interest on the remaining balance of the liability for each period. The property, plant and equipment acquired under finance leases is depreciated over the asset's useful life or over the shorter of the asset's useful life and the lease term if there is no reasonable certainty that the Company will obtain ownership at the end of the lease term.
Leases in which a significant portion of the risks and rewards of ownership are not transferred to the Company as lessee are classified as operating leases (note 26). Payments made under operating leases (net of any incentives received from the lessor) are charged to the income statement on a straight-line basis over the period of the lease.
For
per
sona
l use
onl
y

Technology One Limited Notes to the consolidated financial statements
30 September 2017 (continued)
70
1 Summary of significant accounting policies (continued)
(h) Research and Development costs
Research and development expenses include payroll, employee benefits and other employee-related costs associated with product development. Technological feasibility for software products is reached shortly before products are released for commercial sale to customers. Costs incurred after technological feasibility is established are not significant, and accordingly, all research and development costs are expensed when incurred.
(i) Impairment of assets
Goodwill and intangible assets that have an indefinite useful life are not subject to amortisation and are tested annually for impairment, or more frequently if events or changes in circumstances indicate that they might be impaired. Other assets are tested for impairment whenever events or changes in circumstances indicate that the carrying amount may not be recoverable. An impairment loss is recognised for the amount by which the asset's carrying amount exceeds its recoverable amount. The recoverable amount is the higher of an asset's fair value less costs to sell and value-in-use. For the purposes of assessing impairment, assets are grouped at the lowest levels for which there are separately identifiable cash inflows which are largely independent of the cash inflows from other assets or groups of assets (cash-generating units). Non-financial assets other than goodwill that suffered an impairment are reviewed for possible reversal of the impairment at the end of each reporting period.
Included in intangible assets is a software data model. This asset has an indefinite useful life. The asset is constantly refreshed and updated with all such costs being recorded in the profit and loss in the period when incurred.
(j) Cash and cash equivalents
For the purpose of presentation in the statement of cash flows, cash and cash equivalents includes cash on hand, deposits held at call with financial institutions, other short-term, highly liquid investments with original maturities of three months or less that are readily convertible to known amounts of cash and which are subject to an insignificant risk of changes in value, and bank overdrafts.
For purposes of the statement of cash flows, cash includes cash and cash equivalents, net of outstanding bank overdrafts.
(k) Trade receivables
Trade receivables are recognised initially at fair value and subsequently measured at amortised cost using the effective interest method, less provision for impairment. Trade receivables are generally due for settlement within 30 days.
Collectability of trade receivables is reviewed on an ongoing basis. Debts which are known to be uncollectible are written off by reducing the carrying amount directly. An allowance account (provision for impairment of trade receivables) is used when there is objective evidence that the Company will not be able to collect all amounts due according to the original terms of the receivables. Significant financial difficulties of the debtor, probability that the debtor will enter bankruptcy or financial reorganisation, and default or delinquency in payments (more than 60 days overdue) are considered indicators that the trade receivable is impaired.
The amount of the impairment loss is recognised in the income statement within corporate expenses. When a trade receivable for which an impairment allowance had been recognised becomes uncollectible in a subsequent period, it is written off against the allowance account. Subsequent recoveries of amounts previously written off are credited against corporate expenses in the income statement.
(l) Investments and other financial assets
The Company classifies its investments in the following categories: financial assets at fair value through the Income Statement, loans and receivables and available-for-sale financial assets. The classification depends on the purpose for which the investments were acquired. Management determines the classification of its investments at initial recognition.
For
per
sona
l use
onl
y

Technology One Limited Notes to the consolidated financial statements
30 September 2017 (continued)
71
1 Summary of significant accounting policies (continued)
(i) Available-for-sale financial assets
Available-for-sale financial assets, comprising principally marketable equity securities, are non-derivatives that are either designated in this category or not classified in any of the other categories. Investments are designated as available-for-sale if they do not have fixed maturities and fixed or determinable payments and management intends to hold them for the medium to long-term.
Investments held which are classified as available-for-sale are measured at fair value where such investments comprise tradeable securities. Fair value is determined by reference to quoted market prices in an active, liquid and observable market.
Gains or losses on available-for-sale investments are recognised as a separate component of equity until the investment is sold, collected or otherwise disposed of, or until the investment is determined to be impaired, at which time the cumulative gain or loss previously reported in equity is included in the statement of comprehensive income.
(m) Property, plant and equipment
Property, plant and equipment are measured at cost less accumulated depreciation and any impairment in value. Depreciation is calculated on a straight-line basis over the estimated useful economic lives of the assets as follows:
Office furniture and equipment 3 - 11 years Computer software 3 - 4 years Motor vehicles 4 - 5 years
The assets' residual values and useful lives are reviewed, and adjusted if appropriate, at the end of each reporting period.
An asset's carrying amount is written down immediately to its recoverable amount if the asset's carrying amount is greater than its estimated recoverable amount (note 1(i)).
Gains and losses on disposals are determined by comparing proceeds with carrying amount. These are included in the income statement.
(n) Intangible assets
(i) Goodwill
Goodwill represents the excess of the cost of an acquisition over the fair value of the Company's share of the net identifiable assets of the acquired subsidiary/associate at the date of acquisition. Goodwill on acquisitions of subsidiaries is included in intangible assets. Goodwill is not amortised. Instead, goodwill is tested for impairment annually, or more frequently if events or changes in circumstances indicate that it might be impaired, and is carried at cost less accumulated impairment losses. Gains and losses on the disposal of an entity include the carrying amount of goodwill relating to the entity sold.
Goodwill is allocated to cash-generating units for the purpose of impairment testing. The allocation is made to those cash-generating units or groups of cash-generating units that are expected to benefit from the business combination in which the goodwill arose, identified according to operating segments (note 4).
(ii) Intellectual Property/Source Code
Intangible assets acquired separately are capitalised at cost, and if acquired as a result of a business combination, capitalised at fair value as at the date of acquisition. Following initial recognition, the cost model is applied to all classes of intangible assets. The useful lives of the intangible assets are assessed to be either finite or indefinite. Where amortisation is charged on intangible assets with finite lives, this expense is taken to the Income Statement through the 'depreciation & amortisation expense' line item. Intangible assets with finite lives are tested for impairment where an indicator of impairment exists. Useful lives are examined on an annual basis and adjustments, where applicable, are made on a prospective basis.
Intellectual Property is amortised on a straight line basis over 8 years.
For
per
sona
l use
onl
y

Technology One Limited Notes to the consolidated financial statements
30 September 2017 (continued)
1 Summary of significant accounting policies (continued)
72
(ii) Intellectual Property/Source Code (continued)
Gains or losses arising from the de-recognition of an intangible asset are measured as the difference between the net disposal proceeds and the carrying amount of the asset and are recognised in the statement of comprehensive income when the intangible asset is derecognised.
(o) Trade and other payables
These amounts represent liabilities for goods and services provided to the Company prior to the end of financial year which are unpaid. The amounts are unsecured and are usually paid within 30 days of recognition
(p) Provisions
Provisions are recognised when the Company has a present legal or constructive obligation as a result of past events, it is probable that an outflow of resources will be required to settle the obligation and the amount has been reliably estimated. Provisions are not recognised for future operating losses.
Provisions are measured at the present value of management's best estimate of the expenditure required to settle the present obligation at the end of the reporting period. The discount rate used to determine the present value is a pre-tax rate that reflects current market assessments of the time value of money and the risks specific to the liability. The increase in the provision due to the passage of time is recognised as interest expense.
(q) Employee benefits
(i) Short-term obligations
Liabilities for wages and salaries, including non-monetary benefits and annual leave expected to be settled within 12 months after the end of the period in which the employees render the related service are recognised in respect of employees' services up to the end of the reporting period and are measured at the amounts expected to be paid when the liabilities are settled. Liabilities for sick leave, which are non-vesting, are recognised when the leave is taken and measured at the rates paid or payable.
(ii) Long service leave
The liability for long service leave is recognised in the provision for employee benefits and is measured as the present value of expected future payments to be made in respect of services provided by employees up to the reporting period. Consideration is given to expected future wage and salary levels, experience of employee departures and periods of service. Expected future payments are discounted using market yields at the end of the reporting period on national corporate bonds with terms to maturity and currency that match, as closely as possible, the estimated future cash outflows.
(iii) Share-based payments
The Company provides benefits to certain employees in the form of share-based payment transactions, whereby employees render services in exchange for rights over shares. The costs of share-based payment transactions with employees are measured by reference to the fair value of the equity instruments at the date at which they are granted. Refer to note 32.
The cost of share-based payments is recognised, together with a corresponding increase in equity, over the period in which the performance and/or service conditions are fulfilled, ending on the date on which the relevant employees become fully entitled to the award (the vesting period). No expense is recognised for awards that do not ultimately vest.
(r) Contributed equity
Ordinary shares are classified as equity.
Issued and paid up capital is recognised at the fair value of the consideration received. Any transaction costs arising on the issue of ordinary shares are recognised directly in equity as a reduction of the share proceeds received.
For
per
sona
l use
onl
y
Technology One Limited Notes to the consolidated financial statements
30 September 2017 (continued)
1 Summary of significant accounting policies (continued)
73
(s) Earnings per share
(i) Basic earnings per share
Basic earnings per share is calculated by dividing:
• The profit attributable to owners of the Company, excluding any costs of servicing equity other than ordinaryshares
• By the weighted average number of ordinary shares outstanding during the year, adjusted for bonuselements in ordinary shares issued during the year and excluding treasury shares.
(ii) Diluted earnings per share
Diluted earnings per share adjusts the figures used in the determination of basic earnings per share to take into account:
• The after income tax effect of interest and other financing costs associated with dilutive potential ordinaryshares, and
• The weighted average number of additional ordinary shares that would have been outstanding assuming theconversion of all dilutive potential ordinary shares.
(t) Dividends
Provision is made for the amount of any dividend declared, being appropriately authorised and no longer at the discretion of the entity, on or before the end of the reporting period but not distributed at the end of the reporting period.
(u) Goods and Services Tax (GST)
Revenues, expenses and assets are recognised net of the amount of associated GST, unless the GST incurred is not recoverable from the taxation authority. In this case it is recognised as part of the cost of acquisition of the asset or as part of the expense.
Receivables and payables are stated inclusive of the amount of GST receivable or payable. The net amount of GST recoverable from, or payable to, the taxation authority is included with other receivables or payables in the statement of financial position.
Cash flows are presented on a gross basis. The GST components of cash flows arising from investing or financing
activities which are recoverable from, or payable to the taxation authority, are presented as operating cash flows.
2 Financial risk management
The Company’s principal financial instruments are finance leases, cash and short-term deposits and assets available-for-sale, contingent consideration and borrowings.
The Company has various other financial assets and liabilities such as trade receivables and trade payables, which arise directly from its operations.
It is, and has been throughout the period under review, the Company’s policy that no trading in financial instruments shall be undertaken. The main risks arising from the Company’s financial assets and liabilities are interest rate risk, foreign currency risk, liquidity risk and credit risk. The Board reviews and agrees policies for managing each of these risks and they are summarised below.
Details of the significant accounting policies and methods adopted, including the criteria for recognition, the basis of measurement and the basis on which income and expenses are recognised, in respect of each class of financial asset, financial liability and equity instrument are disclosed in Note 1 to the Financial Statements.
For
per
sona
l use
onl
y

Technology One Limited Notes to the consolidated financial statements
30 September 2017 (continued)
2 Financial risk management (continued)
74
There are no changes in the financial risks faced by the Company in the period. The Company holds the following financial instruments:
2017 $'000
2016 $'000
Financial assets Cash and cash equivalents
93,383 82,588
Trade and other receivables 53,262 41,642
Earned and unbilled revenue 26,219 20,401
172,864 144,631
Financial liabilities Trade and other payables 30,156 24,587
Borrowings 10 29
Contingent consideration 16,467 17,399
46,633 42,015 (a) Interest rate risk
The Company’s cash and investment assets are exposed to movements in deposit and variable interest rates. The Company does not hedge this exposure. Interest rate risk on cash is not considered to be material.
(b) Foreign currency risk
As a result of operations in New Zealand, Malaysia, Papua New Guinea and the United Kingdom and sales contracts denominated in United States dollars, the Company's statement of financial position can be affected by movements in the exchange rates applicable to these geographical locations and currencies.
The Company does not hedge this risk. The Company’s exposure to foreign currency changes is not significant.
At balance date, the Group had the following exposures in Australian dollar equivalents of amounts to foreign currencies which are not effectively hedged:
2017 USD
$'000
Trade Receivables 628
2017 PGK
$'000
770
2016 USD $'000
539
2016 PGK $'000
988
For
per
sona
l use
onl
y

Technology One Limited Notes to the consolidated financial statements
30 September 2017 (continued)
2 Financial risk management (continued)
75
(c) Credit risk
The Company trades only with recognised, creditworthy third parties. It is the Company's policy that all customers who wish to trade on credit terms are subject to credit verification procedures. In addition, receivable balances are monitored on an ongoing basis with the result that the Company's exposure to bad debts is not significant.
Information on credit risk exposures is contained in Note 9.
(d) Liquidity risk
Liquidity risk arises from the financial liabilities of the Group and Groups subsequent ability to meet their obligations to repay their financial liabilities as and when they fall due.
Total contrac-
Between tual Less than 6 - 12 1 and 5 Over 5 cash 6 months months years years flows
At 30 September 2017 $'000 $'000 $'000 $'000 $'000
Financial assets Cash and cash equivalents 93,383 - - - 93,383 Trade and other receivables 53,262 - - - 53,262 Earned and unbilled 14,305 - 11,914 - 26,219Total 160,950 - 11,914 - 172,864Financial liabilities
Trade and other payables 30,156 - - - 30,156 Borrowings 5 5 - - 10 Contingent consideration 8,097 - 8,370 - 16,467Total 38,258 5 8,370 - 46,633Net inflow / (outflow) 122,692 (5) 3,544 - 126,231
Total contrac
Between tual Less than 6 - 12 1 and 5 Over 5 cash 6 months months years years flows
At 30 September 2016 $'000 $'000 $'000 $'000 $'000
Financial assets Cash and cash equivalents 82,588 - - - 82,588 Trade and other receivables 41,642 - - - 41,642 Earned and unbilled 16,421 - 3,980 - 20,401Total 140,651 - 3,980 - 144,631Financial liabilities
Trade and other payables 24,587 - - - 24,587 Borrowings 5 19 5 - 29Contingent consideration 1,331 - 16,068 - 17,399Total 25,923 19 16,073 - 42,015Net inflow / (outflow) 114,728 (19) (12,093) - 102,616
For
per
sona
l use
onl
y

Technology One Limited Notes to the consolidated financial statements
30 September 2017 (continued)
2 Financial risk management (continued)
76
(e) Fair value measurements
At 30 September 2017 the Company did not hold any assets or liabilities at fair value through the profit and loss.
Contingent consideration as set out in note 28 is classified as Level 3 (2016 - $17,399,000). The valuation techniques and fair value of consideration is outlined in note 28.
Contingent Consideration
$'000
Opening balance at 1 October 2016 17,399 Payments (1,322) (Gains)/losses recognised in the income statement 390 Closing balance at 30 September 2017 16,467
The carrying value of trade receivables, accrued revenue and trade payables are assumed to approximate their fair value due to their short term nature. The fair value of non-current borrowings materially approximates their carrying amount, as the impact of discounting is not significant.
(f) Capital risk management
The Company manages its capital to ensure that entities in the Group will be able to continue as a going concern while maximising the return to stakeholders through the optimisation of the debt and equity balance.
The current risk management structure of the Company is to use all equity funding except for funding required to purchase core information technology assets which is funded by a leasing facility.
The equity funded position of the Company is managed by the Board through dividends, new shares and share buy backs as well as the issue of new equity where considered appropriate to fund business acquisitions.
For
per
sona
l use
onl
y

Technology One Limited Notes to the consolidated financial statements
30 September 2017 (continued)
3 Critical accounting estimates and judgements
77
Estimates and judgements are continually evaluated and are based on historical experience and other factors, including expectations of future events that may have a financial impact on the entity and that are believed to be reasonable under the circumstances.
The Company makes estimates and assumptions concerning the future. The resulting accounting estimates will, by definition, seldom equal the related actual results. The estimates and assumptions that have a significant risk of causing a material adjustment to the carrying amounts of assets and liabilities within the next financial year are discussed below.
(i) Impairment of goodwill and other assets
The Company tests annually whether goodwill has suffered any impairment, in accordance with the accounting policy stated in note 1(n)(i). The recoverable amounts of cash-generating units have been determined based on value-in-use calculations. These calculations require the use of assumptions. Refer to note 12 for details of these assumptions and the potential impact of changes to the assumptions.
All other assets are reviewed for indicators or object evidence of impairment. If indicators or objective evidence exists, the recoverable amount is reviewed.
(ii) Multiple Element Contracts
SaaS contracts entered into by the Group require judgement in the identification and separation of contract components related to software licence fees, post sales customer support and cloud services. The Group assesses each customer contract individually into its components and considers if any components should be aggregated where they cannot be separately determined. Revenue is assigned to each component based upon the stand alone fair value of the component relevant to the total contract value.
(iii) Share-based payments
The costs of equity-settled transactions are measured by reference to the fair value of the equity instruments at the date at which they are granted. The fair value of rights over shares is determined using a Black-Scholes model, further details of which are given in note 32. The accounting estimates and assumptions relating to equity-settled share-based payments would have no impact on the carrying amounts of assets and liabilities with the next annual reporting period but may impact expenses and equity.
(iv) Long service leave
A liability for long service is recognised and measured at the present value of the estimated future cash flows to be made in respect of all employees at balance date. In determining the present value of the liability, attrition rates and pay increases through promotion and inflation have been taken into account.
(v) Contingent consideration
A provision has been made for the present value of anticipated costs for future contingent earn out considerations resulting from the acquisitions made during the year. In estimating the liability, it was assumed that the maximum earn out amount will be payable based on current operating projections. Further details are available at note 28.
For
per
sona
l use
onl
y

Technology One Limited Notes to the consolidated financial statements
30 September 2017 (continued)
4 Segment information
78
(a) Description of segments
The Group's chief operating decision maker makes financial decisions and allocates resources based on the information they receive from its internal management system. Sales are attributed to an operating segment based on the type of product or service provided to the customer.
Segment information is prepared in conformity with the accounting policies of the group as discussed in note 1 and Accounting Standard AASB 8.
TechnologyOne's reportable segments are: • Sales and Marketing - sales of licence fees and customer support to our customers.• Consulting - implementation, consulting services and custom software development services for large scale,
purpose built applications.• Research & Development (R&D) - the research, development and support of our products.• Cloud - the delivery of cloud hosting services to our customers• Corporate - the aggregation of the corporate services functions costs and revenue, and corporately-funded
projects.
Intersegment revenues/expenses are where one operating segment has been charged for the use of another's expertise.
Royalties are a mechanism whereby each segment pays or receives funding for their contribution to the ongoing success of TechnologyOne, the royalty calculation is a percentage of Revenue, which varies (between 10% and 65%) according to the nature of the revenue recognised in each segment. For example, Sales & Marketing pays R&D for the development and support of the products that they have sold, as well as Corporate for the use of corporate services.
Our chief operating decision maker views each segments performance based on revenue post royalties and profit before tax. No reporting or reviews are made of segment assets, liabilities and cash flows and as such this is not measured or reported by segment.
For
per
sona
l use
onl
y
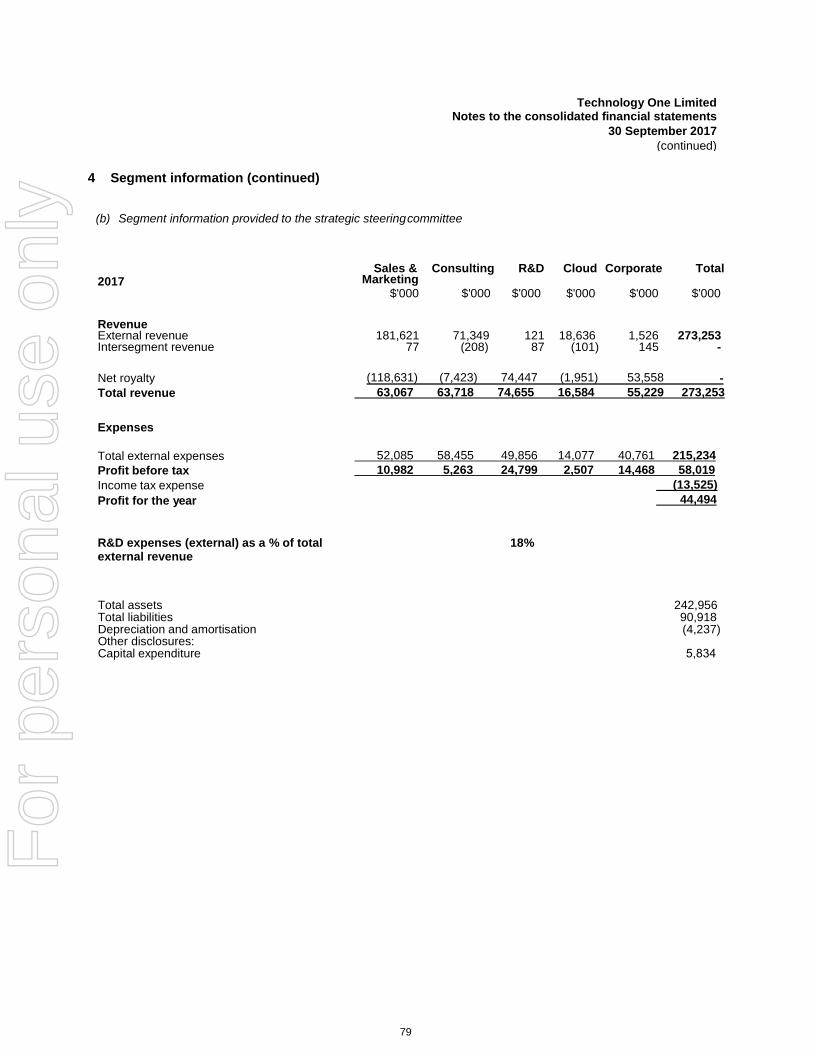
Technology One Limited Notes to the consolidated financial statements
30 September 2017 (continued)
4 Segment information (continued)
79
(b) Segment information provided to the strategic steering committee
2017 Sales &
Marketing Consulting R&D Cloud Corporate Total
$'000 $'000 $'000 $'000 $'000 $'000
Revenue External revenue 181,621 71,349 121 18,636 1,526 273,253 Intersegment revenue 77 (208) 87 (101) 145 -
Net royalty (118,631) (7,423) 74,447 (1,951) 53,558 - Total revenue 63,067 63,718 74,655 16,584 55,229 273,253
Expenses
Total external expenses 52,085 58,455 49,856 14,077 40,761 215,234 Profit before tax 10,982 5,263 24,799 2,507 14,468 58,019 Income tax expense (13,525) Profit for the year 5,263 44,494
R&D expenses (external) as a % of total external revenue
18%
Total assets 242,956 Total liabilities 90,918 Depreciation and amortisation (4,237) Other disclosures: Capital expenditure 5,834
For
per
sona
l use
onl
y
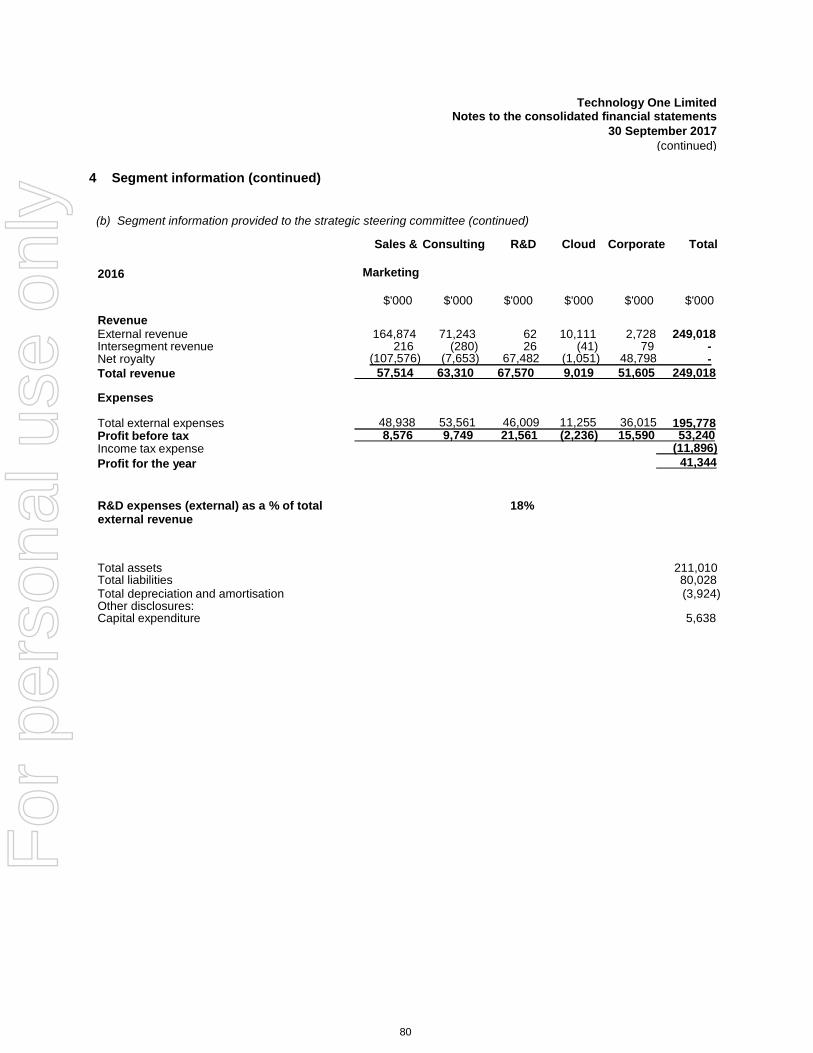
Technology One Limited Notes to the consolidated financial statements
30 September 2017 (continued)
4 Segment information (continued)
80
(b) Segment information provided to the strategic steering committee (continued)
Sales & Consulting R&D Cloud Corporate Total
2016 Marketing
$'000 $'000 $'000 $'000 $'000 $'000 Revenue External revenue 164,874 71,243 62 10,111 2,728 249,018 Intersegment revenue 216 (280) 26 (41) 79 - Net royalty (107,576) (7,653) 67,482 (1,051) 48,798 - Total revenue 57,514 63,310 67,570 9,019 51,605 249,018
Expenses
Total external expenses 48,938 53,561 46,009 11,255 36,015 195,778 Profit before tax 8,576 9,749 21,561 (2,236) 15,590 53,240 Income tax expense (11,896) Profit for the year 9,749 41,344
R&D expenses (external) as a % of total external revenue
18%
Total assets 211,010 Total liabilities 80,028 Total depreciation and amortisation (3,924) Other disclosures: Capital expenditure 5,638
For
per
sona
l use
onl
y

Technology One Limited Notes to the consolidated financial statements
30 September 2017 (continued)
4 Segment information (continued)
81
(c) Other segment information
(i) Segment revenue
2017 $'000
2016 $'000
Australia 241,355 220,448 New Zealand 21,679 20,845
International * 10,219 7,725
Segment revenues from sales to external customers 273,253 249,018
* International segments include United Kingdom, South Pacific and Malaysia.
(ii) Segment assets
2017 $'000
2016 $'000
Australia 212,068 207,116 New Zealand 20,023 5,603 International * 10,865 5,803 Segment assets 242,956 218,522
* International segments include United Kingdom, South Pacific and Malaysia.
All significant non-current assets are located in Australia.
(iii) Major customers
The Company has a number of customers to which it provides both products and services, none of which contribute greater than 10% of external revenue.
For
per
sona
l use
onl
y

Technology One Limited Notes to the consolidated financial statements
30 September 2017 (continued)
82
5 Revenue
2017 2016 $'000 $'000
Sales revenue Software licence fees 61,693 56,165 Implementation and consulting services 64,335 60,026 Post sales customer support 119,929 108,480 Project services 7,013 11,102 Cloud service fees 18,636 10,111 Total sales revenue 271,606 245,884 Other income Rents and sub-lease rentals 273 1,530 Interest received - cash 728 876 Other 646 728 Total other income 1,647 3,134 Total revenue 273,253 249,018
For
per
sona
l use
onl
y

Technology One Limited Notes to the consolidated financial statements
30 September 2017 (continued)
83
6 Expenses
2017 $'000
2016 $'000
Profit before income tax includes the following specific expenses: Depreciation
Plant and equipment 3,688 3,188 Amortisation
Leased office furniture & equipment 10 206 Intangible assets 539 530
Total amortisation 549 736 Total depreciation and amortisation 4,237 3,924
Wages and salaries 110,923 101,339 Defined contribution plan expense 9,320 8,641 Payroll tax 6,800 6,304 Provision for employee benefits 158 1,399 Share-based payments 1,576 1,496 Other 7,032 5,639
135,809 124,818
Provision for doubtful debts (3) (202)Foreign exchange gain 99 816 Rental expenses on operating leases 5,796 6,388 (Gain) / Loss on sale of fixed assets 176 (12)
For
per
sona
l use
onl
y
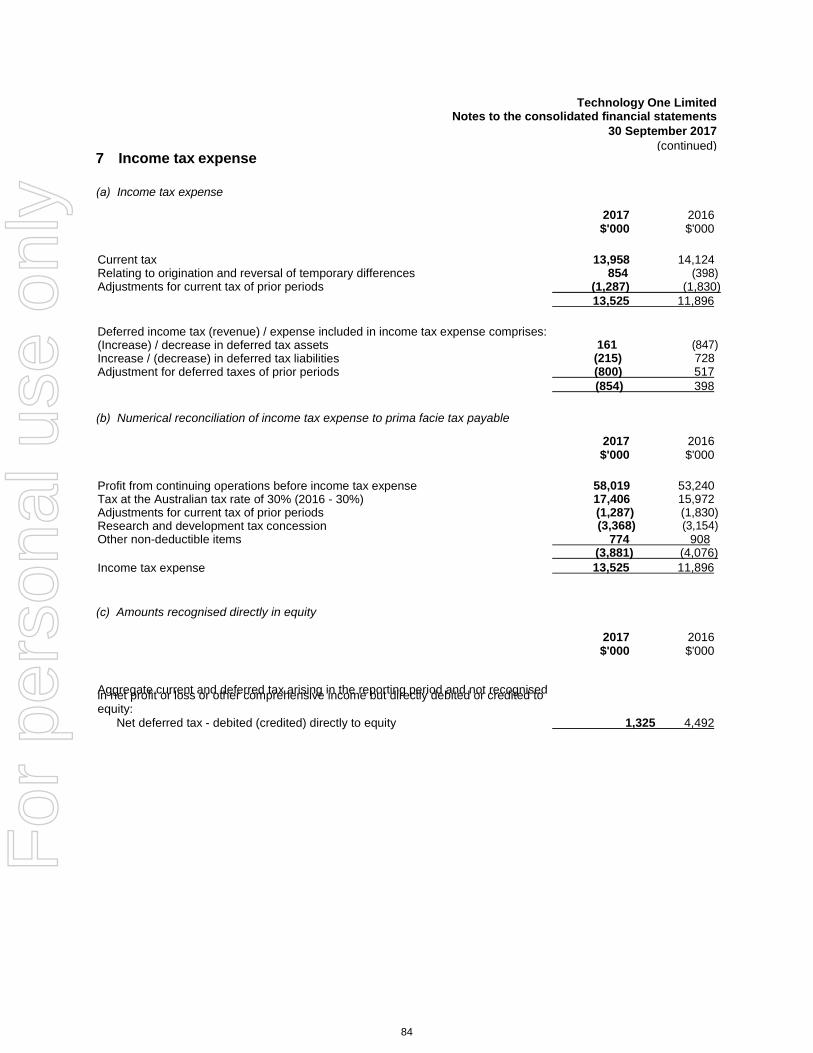
Technology One Limited Notes to the consolidated financial statements
30 September 2017 (continued)
84
2017 2016 $'000 $'000
13,958 14,124 854 (398)
7 Income tax expense
(a) Income tax expense
Current tax Relating to origination and reversal of temporary differences Adjustments for current tax of prior periods (1,287) (1,830)
13,525 11,896
161 (847) (215) 728(800) 517(854) 398
2017 2016 $'000 $'000
58,019 53,240 17,406 15,972
(1,287) (1,830) (3,368) (3,154)
774 908 (3,881) (4,076) 13,525 11,896
2017 2016 $'000 $'000
Deferred income tax (revenue) / expense included in income tax expense comprises: (Increase) / decrease in deferred tax assets Increase / (decrease) in deferred tax liabilities Adjustment for deferred taxes of prior periods
(b) Numerical reconciliation of income tax expense to prima facie tax payable
Profit from continuing operations before income tax expense Tax at the Australian tax rate of 30% (2016 - 30%) Adjustments for current tax of prior periods Research and development tax concession Other non-deductible items
Income tax expense
(c) Amounts recognised directly in equity
Aggregate current and deferred tax arising in the reporting period and not recognisedin net profit or loss or other comprehensive income but directly debited or credited to equity:
Net deferred tax - debited (credited) directly to equity 1,325 4,492
For
per
sona
l use
onl
y

Technology One Limited Notes to the consolidated financial statements
30 September 2017 (continued)
85
8 Current assets - Cash and cash equivalents
2017 $'000
2016 $'000
Cash and cash equivalents 93,383 82,588
The Company has a secured $2 million interchangeable facility which is transferable between an Overdraft, Fixed Rate Commercial Bill and Variable Rate Commercial Bill to assist with working capital requirements.
Cash at bank earns interest at floating rates based on daily bank deposit rates.
Money market accounts at call are made for varying periods of between one day and three months, depending on immediate cash requirements of the Company, and earn interest at the respective money market deposit rates. The fair value of cash assets at 30 September are their carrying values.
9 Current assets - Trade and other receivables
2017 $'000
2016 $'000
Trade receivables (i) (ii) 52,028 41,725 Provision for impairment of receivables (525) (528)
Sundry receivables 1,759 445
53,262 41,642
(i) Trade receivables are non-interest bearing and are on 30 day terms. No interest is charged on trade receivables. Aspecific analysis of debts that may be uncollectible is made at each reporting date by an internal credit committee andprovisions made where appropriate. Provisions recorded are based on estimated irrecoverable amounts from the saleof goods and services, determined by reference to the circumstances of the specific customer.
Included in the trade receivable balance are debtors with a carrying amount of $14,795,838 (2016 - $9,720,605) which are past due at the reporting date for which the consolidated entity has not provided as there has not been a significant change in credit quality and the consolidated entity believes that the amounts are still considered recoverable. Subsequent to 30 September 2017, as at 31 October 2017, trade receivable balances past due has reduced to $12,428,326. The consolidated entity does not hold any collateral over these balances, apart from the withdrawal of future support and software licence use rights. The average age of these receivables is 45 days (2016 - 39 days).
(ii) Included in trade receivables are amounts billed but not yet collected for post implementation customer support tocommence post 30 September at each balance date. An equal and offsetting amount is included in unearned income.The balance at 30 September 2017 is $20,810,000 (2016 - $14,780,000).F
or p
erso
nal u
se o
nly

Technology One Limited Notes to the consolidated financial statements
30 September 2017 (continued)
86
2017 $'000
2016 $'000
528 745 281 248
(284) (465)
9 Current assets - Trade and other receivables (continued)
(a) Impaired trade receivables
Movements in the provision for impairment of receivables are as follows:
At 1 October Provision for impairment recognised during the year
Unused amounts reversed
At 30 September 525 528
In determining the recoverability of a trade receivable the Company considers any change in the credit quality of the trade receivable from the date credit was initially granted up to the reporting date. The concentration of credit risk is limited due to the customer base being large and unrelated. Accordingly, the directors believe that there is no further credit provision required in excess of the allowance for doubtful debts.
10 Current assets - Other current assets
2017 $'000
2016 $'000
Deposits receivable 407 302
Income tax receivable 391 491
798 793
For
per
sona
l use
onl
y

Technology One Limited Notes to the consolidated financial statements
30 September 2017 (continued)
87
11 Non-current assets - Property, plant and equipment
Office furniture
&
Leased office
furniture & Computer Leased
computer equipment
$'000 equipment
$'000 software
$'000 vehicles
$'000 software
$'000 Total $'000
Year ended 30 September 2017 Opening net book amount 11,507 62 48 64 - 11,681Additions 5,834 - - - - 5,834Disposals (367) - - - (367)Depreciation charge (3,625) (10) (38) (25) - (3,698)Make good movement 78 (3) - - Closing net book amount 13,427 49 10 39
- 75- 13,525
At 30 September 2017 Cost 38,804 1,240 2,946 282 248 43,520 Accumulated depreciation (25,377) (1,191) (2,936) (243) (248) (29,995)Net book amount 13,427 49 10 39 - 13,525
Year ended 30 September 2016 Opening net book amount 7,630 2,020 226 136 - 10,012Additions 5,630 - 7 - - 5,637Disposals (426) - - (29) - (455)Depreciation charge (2,961) (206) (184) (43) - (3,394)Exchange differences 1 (1) (1) - - (1) Make good movement (118) - - - - (118) Transfer 1,751 (1,751) - - - - Closing net book amount 11,507 62 48 64 - 11,681
At 30 September 2016 Cost or fair value 34,953 1,240 2,946 282 248 39,669 Accumulated depreciation (23,446) (1,178) (2,898) (218) (248) (27,988)Net book amount 11,507 62 48 64 - 11,681
Motor
For
per
sona
l use
onl
y

Technology One Limited Notes to the consolidated financial statements
30 September 2017 (continued)
88
12 Non-current assets - Intangible assets
Goodwill $'000
Intellectual property/
Source code $'000
Customer contracts
$'000
Total $'000
Year ended 30 September 2017 Opening net book amount 40,003 7,152 933 48,088 Amortisation charge - (484) (55) (539)Closing net book amount 40,003 6,668 878 47,549
At 30 September 2017 Cost 40,003 10,358 1,100 51,461 Accumulated amortisation - (3,690) (222) (3,912)Net book amount 40,003 6,668 878 47,549
Year ended 30 September 2016 Opening net book amount 31,230 5,019 996 37,245 Additions 8,773 2,600 - 11,373Amortisation charge - (467) (63) (530)Closing net book amount 40,003 7,152 933 48,088
At 30 September 2016 Cost 40,003 10,358 1,100 51,461 Accumulation amortisation - (3,206) (167) (3,373)Net book amount 40,003 7,152 933 48,088
Included in Intellectual property/ Source code is $4.2m of source code that has an indefinite useful life, and is tested annually for impairment.
These assets have an indefinite life due to the nature of the asset being the core architecture of software. These assets are maintained each year and the costs of maintenance expensed as incurred.
(a) Impairment tests for goodwill and indefinite life intangibles
Goodwill is allocated to the Company's cash generating units (CGUs) identified according to each reportable segment for impairment testing purposes.
A segment-level summary of the goodwill allocation is presented below.
2017
Sales & Marketing
$'000
Consulting
$'000
Research & Development
$'000
Total
$'000
Goodwill 13,378 12,947 13,678 40,003
Indefinite life intangibles 1,428 1,386 1,386 4,200
14,806 14,333 15,064 44,203
2016 Goodwill 13,378 12,947 13,678 40,003
Indefinite life intangibles 1,428 1,386 1,386 4,200
14,806 14,333 15,064 44,203
For
per
sona
l use
onl
y
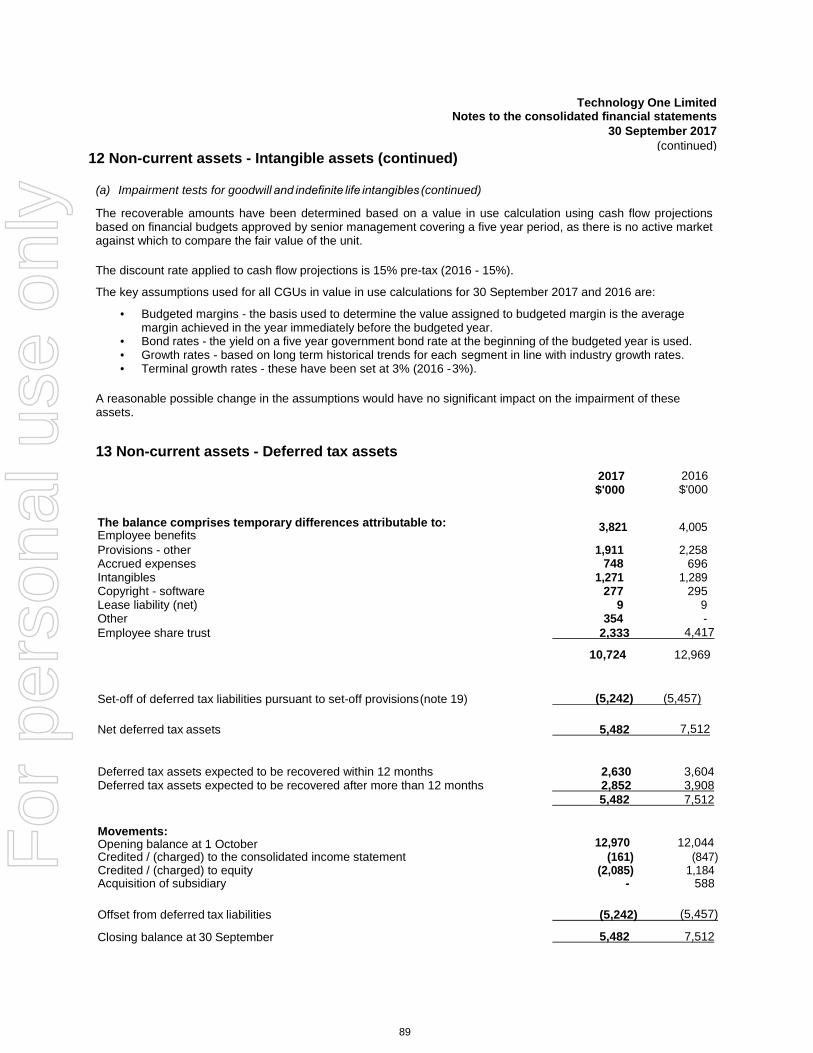
Technology One Limited Notes to the consolidated financial statements
30 September 2017 (continued)
89
12 Non-current assets - Intangible assets (continued)
(a) Impairment tests for goodwill and indefinite life intangibles (continued)
The recoverable amounts have been determined based on a value in use calculation using cash flow projections based on financial budgets approved by senior management covering a five year period, as there is no active market against which to compare the fair value of the unit.
The discount rate applied to cash flow projections is 15% pre-tax (2016 - 15%).
The key assumptions used for all CGUs in value in use calculations for 30 September 2017 and 2016 are:
• Budgeted margins - the basis used to determine the value assigned to budgeted margin is the averagemargin achieved in the year immediately before the budgeted year.
• Bond rates - the yield on a five year government bond rate at the beginning of the budgeted year is used.• Growth rates - based on long term historical trends for each segment in line with industry growth rates.• Terminal growth rates - these have been set at 3% (2016 - 3%).
A reasonable possible change in the assumptions would have no significant impact on the impairment of these assets.
13 Non-current assets - Deferred tax assets 2017 $'000
2016 $'000
The balance comprises temporary differences attributable to: Employee benefits
3,821 4,005
Provisions - other 1,911 2,258 Accrued expenses 748 696 Intangibles 1,271 1,289 Copyright - software 277 295 Lease liability (net) 9 9 Other 354 -Employee share trust 2,333 4,417
10,724 12,969
Set-off of deferred tax liabilities pursuant to set-off provisions (note 19) (5,242) (5,457)
Net deferred tax assets 5,482 7,512
Deferred tax assets expected to be recovered within 12 months 2,630 3,604 Deferred tax assets expected to be recovered after more than 12 months 2,852 3,908
5,482 7,512
Movements: Opening balance at 1 October 12,970 12,044 Credited / (charged) to the consolidated income statement (161) (847)Credited / (charged) to equity (2,085) 1,184Acquisition of subsidiary - 588
Offset from deferred tax liabilities (5,242) (5,457)
Closing balance at 30 September 5,482 7,512
For
per
sona
l use
onl
y
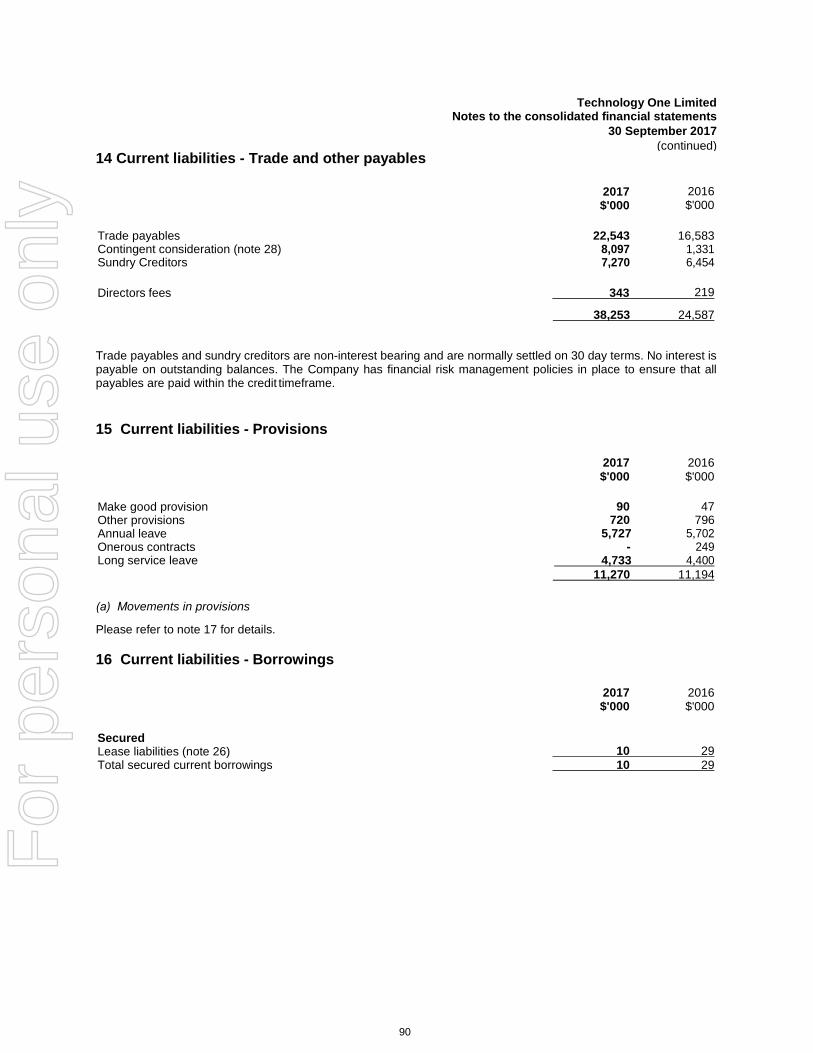
Technology One Limited Notes to the consolidated financial statements
30 September 2017 (continued)
90
14 Current liabilities - Trade and other payables
2017 $'000
2016 $'000
Trade payables 22,543 16,583 Contingent consideration (note 28) 8,097 1,331 Sundry Creditors 7,270 6,454
Directors fees 343 219
38,253 24,587
Trade payables and sundry creditors are non-interest bearing and are normally settled on 30 day terms. No interest is payable on outstanding balances. The Company has financial risk management policies in place to ensure that all payables are paid within the credit timeframe.
15 Current liabilities - Provisions
2017 2016 $'000 $'000
90 47 720 796
5,727 5,702 - 249
4,733 4,40011,270 11,194
2017 2016 $'000 $'000
10 29
Make good provision Other provisions Annual leave Onerous contracts Long service leave
(a) Movements in provisions
Please refer to note 17 for details.
16 Current liabilities - Borrowings
Secured Lease liabilities (note 26) Total secured current borrowings 10 29
For
per
sona
l use
onl
y
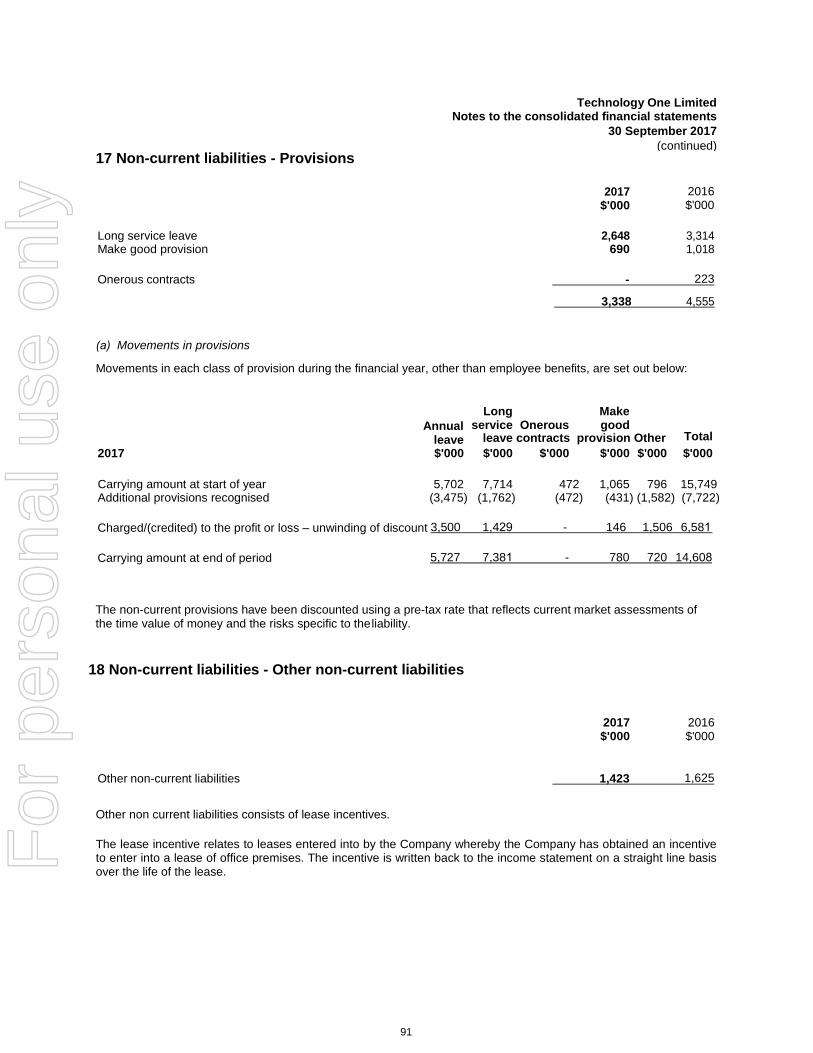
Technology One Limited Notes to the consolidated financial statements
30 September 2017 (continued)
91
17 Non-current liabilities - Provisions
2017 $'000
2016 $'000
Long service leave 2,648 3,314 Make good provision 690 1,018
Onerous contracts - 223
3,338 4,555
(a) Movements in provisions
Movements in each class of provision during the financial year, other than employee benefits, are set out below:
Annual leave
Long Make service Onerous good
leave contracts provision Other Total 2017 $'000 $'000 $'000 $'000 $'000 $'000
Carrying amount at start of year 5,702 7,714 472 1,065 796 15,749 Additional provisions recognised (3,475) (1,762)
Charged/(credited) to the profit or loss – unwinding of discount 3,500 1,429
(472) (431) (1,582) (7,722)
- 146 1,506 6,581
Carrying amount at end of period 5,727 7,381 - 780 720 14,608
The non-current provisions have been discounted using a pre-tax rate that reflects current market assessments of the time value of money and the risks specific to the liability.
18 Non-current liabilities - Other non-current liabilities
2017 $'000
2016 $'000
Other non-current liabilities 1,423 1,625
Other non current liabilities consists of lease incentives.
The lease incentive relates to leases entered into by the Company whereby the Company has obtained an incentive to enter into a lease of office premises. The incentive is written back to the income statement on a straight line basis over the life of the lease. F
or p
erso
nal u
se o
nly

Technology One Limited Notes to the consolidated financial statements
30 September 2017 (continued)
92
19 Non-current liabilities - Deferred tax liabilities
2017 $'000
2016 $'000
The balance comprises temporary differences attributable to: Accrued receivables
(5,212) (5,090)
Accelerated depreciation for tax purposes - (587)Prepayments (30) (34)
Other - 254Total deferred tax liabilities (5,242) (5,457)
Set-off of deferred tax liabilities pursuant to set-off provisions (note 13) 5,242 5,457
Net deferred tax liabilities - -
Movements:
Opening balance at 1 October (5,457) (4,730) Charged / (credited) to the income statement 215 (727) Offset to deferred tax assets 5,242 5,457 Closing balance at 30 September - -
For
per
sona
l use
onl
y

Technology One Limited Notes to the consolidated financial statements
30 September 2017 (continued)
93
20 Contributed equity
(a) Share capital
2017
Shares
2016
Shares
2017
$'000
2016
$'000
Ordinary shares Fully paid 315,442,363 313,294,930 32,152 29,984
(b) Movements in ordinary share capital
Date Details
Number of
shares
$'000
1 Oct 2016 Opening balance 313,294,930 29,984 Exercise of options 2,147,433 2,168
30 Sep 2017 Closing balance 315,442,363 32,152
1 Oct 2015 Opening balance 310,634,422 28,459 Exercise of options 2,660,508 1,525
30 Sep 2016 Closing balance 313,294,930 29,984
For
per
sona
l use
onl
y

Technology One Limited Notes to the consolidated financial statements
30 September 2017 (continued)
94
20 Contributed equity (continued)
(c) Employee Share Option Plan
Information relating to the TechnologyOne Employee Share Option Plan, including details of options issued, exercised and lapsed during the financial year and options outstanding at the end of the financial year, is set out in note 32.
21 Reserves
(a) Other reserves
2017 $'000
2016 $'000
19,640 16,739
(728) (561) 15,775 22,17234,687 38,350
Share-based payments
Foreign currency translation Dividend reserve
(b) Nature and purpose of otherreserves
(i) Share-based paymentsThe reserve is used to record the value of equity benefits provided to employees, through share-based paymenttransactions and associated tax benefits.
(ii) Foreign currency translation
Exchange differences arising on translation of the foreign controlled entity are recognised in other comprehensive income as described in note 1(c) and accumulated in a separate reserve within equity. The cumulative amount is reclassified to the income statement when the net investment is disposed of.
(iii) Dividend reserve
The reserve records retained earnings set aside for the payment of future dividends.
For
per
sona
l use
onl
y
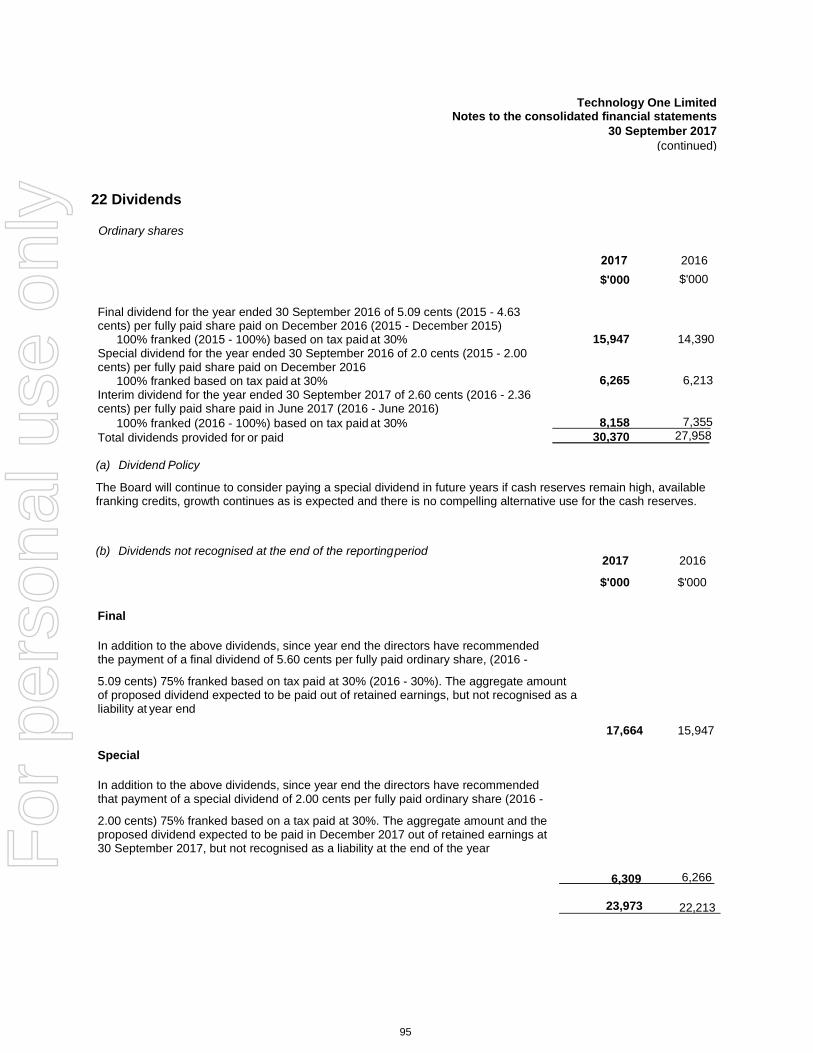
Technology One Limited Notes to the consolidated financial statements
30 September 2017 (continued)
95
22 Dividends
2017 $'000
2016 $'000
15,947 14,390
6,265 6,213
8,158 7,355 30,370 27,958
Ordinary shares
Final dividend for the year ended 30 September 2016 of 5.09 cents (2015 - 4.63 cents) per fully paid share paid on December 2016 (2015 - December 2015)
100% franked (2015 - 100%) based on tax paid at 30% Special dividend for the year ended 30 September 2016 of 2.0 cents (2015 - 2.00 cents) per fully paid share paid on December 2016
100% franked based on tax paid at 30% Interim dividend for the year ended 30 September 2017 of 2.60 cents (2016 - 2.36 cents) per fully paid share paid in June 2017 (2016 - June 2016)
100% franked (2016 - 100%) based on tax paid at 30% Total dividends provided for or paid
(a) Dividend Policy
The Board will continue to consider paying a special dividend in future years if cash reserves remain high, available franking credits, growth continues as is expected and there is no compelling alternative use for the cash reserves.
(b) Dividends not recognised at the end of the reporting period 2017
$'000
2016
$'000
Final
In addition to the above dividends, since year end the directors have recommended the payment of a final dividend of 5.60 cents per fully paid ordinary share, (2016 -
5.09 cents) 75% franked based on tax paid at 30% (2016 - 30%). The aggregate amount of proposed dividend expected to be paid out of retained earnings, but not recognised as a liability at year end
17,664 15,947
Special
In addition to the above dividends, since year end the directors have recommended that payment of a special dividend of 2.00 cents per fully paid ordinary share (2016 -
2.00 cents) 75% franked based on a tax paid at 30%. The aggregate amount and the proposed dividend expected to be paid in December 2017 out of retained earnings at 30 September 2017, but not recognised as a liability at the end of the year
6,309 6,266
23,973 22,213
For
per
sona
l use
onl
y

Technology One Limited Notes to the consolidated financial statements
30 September 2017 (continued)
96
22 Dividends (continued)
(c) Franked dividends (continued)
The franked portions of the final dividends recommended after 30 September 2017 will be franked out of existing franking credits or out of franking credits arising from the payment of income tax in the year ended 30 September 2018.
2017 $'000
2016 $'000
Franking account balance as at the end of the financial year at 30% (2016: 30%) (876) 678Franking credits that will arise from the payments of income tax 3,868 4,601
2,992 5,279
The above amounts represent the balance of the franking account as at the end of the reporting period, adjusted for:
(A) franking credits that will arise from the payment of the amount of the provision for income tax, and(B) franking debits that will arise from the payment of dividends recognised as a liability at the reporting date.
The impact on the franking account of the dividend recommended by the directors since the end of the reporting date, but not recognised as a liability at the reporting date, will be a reduction in the franking account of $7,705,607 (2016 - $9,519,690). Additional franking credits to partially frank dividends at 30 September 2017 will be generated by income tax payments up to 30 September 2018.
23 Key management personnel disclosures
(a) Key management personnel compensation
2017 $
2016 $
4,948,797 5,061,219
70,246 71,842 - 65,500
546,801 827,9885,565,844 6,026,549
Short-term employee benefits
Post-employment benefits Termination benefits Share-based payments
(b) Equity instrument disclosures relating to key managementpersonnelDetails of options provided as remuneration to KMP and shares issued on the exercise of such, together with terms and conditions can be found in the remuneration report. F
or p
erso
nal u
se o
nly

Technology One Limited Notes to the consolidated financial statements
30 September 2017 (continued)
97
24 Remuneration of auditors
During the year, the following fees were paid or payable for services provided by the auditor of the consolidated entity:
Ernst & Young
2017 $
2016 $
Audit and other assurance services Audit and review of financial statements 306,208 307,135
Other assurance services Compliance services1 593,130 146,353 Due diligence services - 5,555
Total remuneration for audit and other assurance services 899,338 459,043
Other services Taxation advice 134,550 31,690
Total remuneration of Ernst & Young 1,033,888 490,733
1 Compliance services relate to assurance of cloud software and hosting provided to customers of the Group.
25 Contingencies The Company had contingencies at 30 September 2017 in respect of:
Guarantees
At 30 September 2017, the Company had $6,478,061 (2016 - $6,801,304) in outstanding performance guarantees. The total available guarantee facility is $7,000,000 (2016 - $7,000,000). The Company also had unused foreign currency dealing limits of $950,576 (2016 - $1,253,365).
The parent entity, Technology One Limited, continues to support its subsidiaries in their operations, by way of financial support.
Earn Out
At 30 September 2017, the Company had $16,467,362 (2016 - $17,399,462) in earn out contingencies relating to the acquisitions during the 2016 year. This included $9,564,301 of earn out payments and $6,903,061 of contingent considerations. The valuation techniques and fair value of the consideration and the recording of the liability is outlined in note 28.
Brisbane City Council
During the period ended 30 September 2017, TechnologyOne received a claim for damages from Brisbane City Council (BCC) for AUD$50million. TechnologyOne has been open and transparent to the market from the outset and has made numerous disclosures on the ASX throughout the process. These disclosures were made on; 25th January 2017, 30th January 2017, 28th April 2017, 3rd May 2017, 23rd May 2017, 28th June 2017, 4th July 2017, 24th July 2017 and 28th July 2017. To reiterate, TechnologyOne has stated previously that BCC has wrongfully terminated the agreement and will pursue the matter and seek legal compensation.
TechnologyOne has engaged legal counsel in relation to the matter and made appropriate representations to its insurers, as it is required to do for any and all matters regardless of prospects. The matter is now being dealt with via the contract process. TechnologyOne remains confident of its legal and commercial position under the contract.
For
per
sona
l use
onl
y

Technology One Limited Notes to the consolidated financial statements
30 September 2017 (continued)
98
25 Contingencies (continued)
General Contingencies
TechnologyOne is a global business and from time to time in the ordinary course of business it receives enquiries from various regulators and government bodies. TechnologyOne cooperates fully with all enquiries and these enquiries do not require disclosure in their initial state, however should the company become aware that an enquiry is developing further or if any regulator or government action is taken against the group, appropriate disclosure is made in accordance with the relevant accounting standards.
As a global business, from time to time TechnologyOne is also subject to various claims and litigation from third parties during the ordinary course of its business. The directors of TechnologyOne have given consideration to such matters which are or may be subject to claims or litigation at year end and, unless specific provisions have been made, are of the opinion that no material contingent liability for such claims of litigation exists. The group had no other material contingent assets or liabilities
26 Commitments
(a) Operating lease commitments
Operating leases are entered into as a means of acquiring access to office property. Rental payments are generally fixed, but with inflation escalation clauses on which contingent rentals are determined. No renewal or purchase options exist in relation to operating leases and no operating leases contain restrictions on financing or other leasing activities.
There is a sublease which completed in 2017. The current year revenue is $245,181 (2016 - $1,529,512) and this has not been included in the numbers below.
2017 $'000
2016 $'000
Commitments for minimum lease payments in relation to non-cancellable operating leases are payable as follows: Within one year 7,144 8,175 Later than one year but not later than five years 17,245 22,645
Later than five years 64 319
24,453 31,139
For
per
sona
l use
onl
y
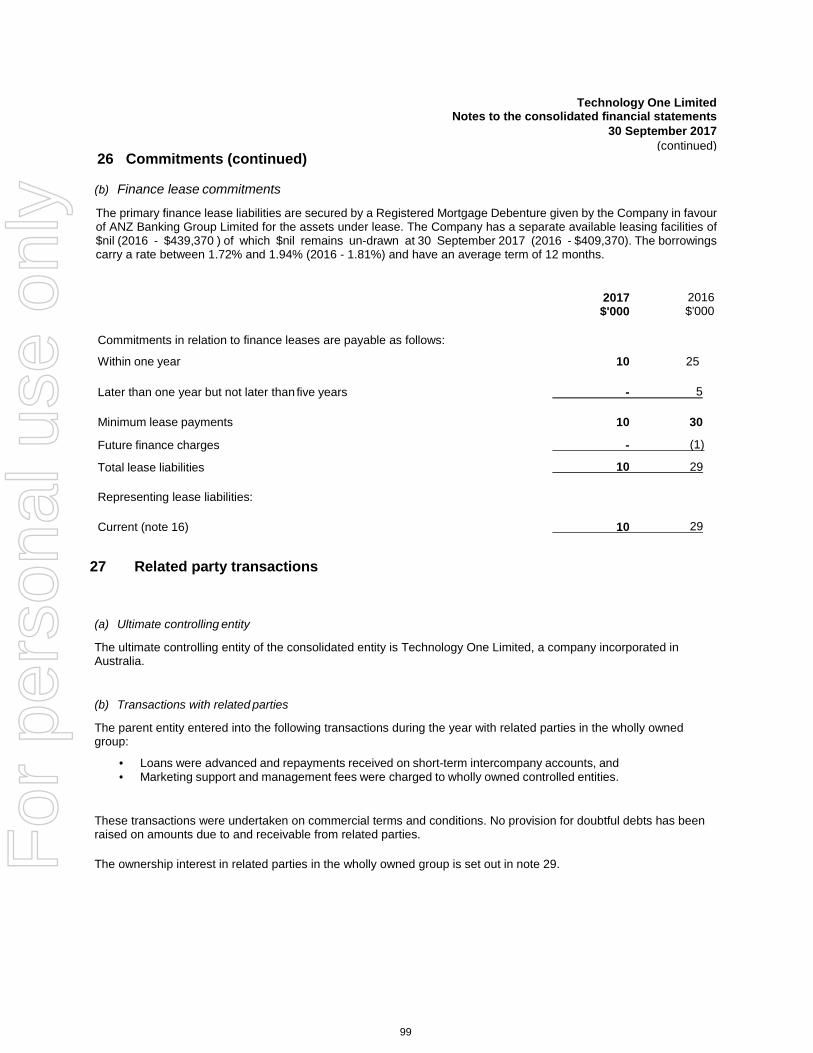
Technology One Limited Notes to the consolidated financial statements
30 September 2017 (continued)
99
26 Commitments (continued)
(b) Finance lease commitments
The primary finance lease liabilities are secured by a Registered Mortgage Debenture given by the Company in favour of ANZ Banking Group Limited for the assets under lease. The Company has a separate available leasing facilities of $nil (2016 - $439,370 ) of which $nil remains un-drawn at 30 September 2017 (2016 - $409,370). The borrowings carry a rate between 1.72% and 1.94% (2016 - 1.81%) and have an average term of 12 months.
2017 $'000
2016 $'000
Commitments in relation to finance leases are payable as follows:
Within one year 10 25
Later than one year but not later than five years - 5
Minimum lease payments 10 30
Future finance charges - (1)
Total lease liabilities 10 29
Representing lease liabilities:
Current (note 16) 10 29
27 Related party transactions
(a) Ultimate controlling entity
The ultimate controlling entity of the consolidated entity is Technology One Limited, a company incorporated in Australia.
(b) Transactions with related parties
The parent entity entered into the following transactions during the year with related parties in the wholly owned group:
• Loans were advanced and repayments received on short-term intercompany accounts, and• Marketing support and management fees were charged to wholly owned controlled entities.
These transactions were undertaken on commercial terms and conditions. No provision for doubtful debts has been raised on amounts due to and receivable from related parties.
The ownership interest in related parties in the wholly owned group is set out in note 29.For
per
sona
l use
onl
y

Technology One Limited Notes to the consolidated financial statements
30 September 2017 (continued)
100
28 Business combination
There were no business combinations in the 2017 year. Contingent consideration relating to the business combinations of ICON, DMS or JRA as set out in the prior year is classified as Level 3 (2017: $16.5m). The impact on the income statement during the period represents the unwinding of the contingent consideration. The inputs and valuation techniques are consistent with those in the prior year and as such, the amounts payable under the respective acquisition agreements have been discounted to present value.
The fair value of the estimate of the ICON contingent consideration of $4,974,233 was calculated based on the assumption that a maximum $5,000,000 earn out tranche may be payable three calendar years after acquisition and a discount rate of 1.54% based on relevant government bonds with terms to maturity. The contingent consideration is classified as Level 3.
The fair value of the estimate of the DMS contingent consideration of $3,123,158 was calculated based on the assumption that a maximum $3,000,000 earn out tranche and $150,000 DMS NZ tranches may be payable three calendar years after acquisition and a discount rate of 1.54% based on relevant government bonds with terms to maturity. The contingent consideration is classified as Level 3.
The fair value of the estimate of the JRA contingent consideration of $8,369,970 was calculated based on the assumption that a maximum $8,500,000 ($2,500,000 for earn out tranche, $1,000,000 for bonus tranche and $5,000,000 for the North American tranche) may be payable three calendar years after acquisition and a discount rate of 1.54% based on relevant government bonds with terms to maturity. The contingent consideration is classified as Level 3.
The potential undiscounted earn-out tranche amount payable under the Agreement is between $nil and $2,500,000 and is based on the earn out tranche Net Profit Before Tax (NPBT) divided by the earn-out tranche Target NPBT of
$6,300,000 multiplied by $5,000,000 less $2,500,000.
The earn-out tranche is payable 3 years after the completion of the acquisition.
TechnologyOne has agreed to pay the selling shareholders an additional bonus tranche based on JRA's 3 year cumulative actual NPBT Bonus Tranche divided by the Target NPBT of $6,300,000 multiplied by 33% of any amount above the Bonus tranche figure to a maximum of $1,000,000. The additional bonus tranche is payable 3 years after the completion of the acquisition.
TechnologyOne has agreed to pay the selling shareholders an additional North American tranche based on JRA's 3 year cumulative actual NPBT Bonus Tranche divided by the North American Target NPBT of $3,500,000, multiplied by $5,000,000 to a maximum of $5,000,000. The additional North American tranche is payable 3 years after the completion of the acquisition.
Reconciliation of Level 3 contingent consideration is set out below.
Balance at 30 September 2016
$'000
17,399 Payments (1,322) (Gains) / Losses recognised in income statement 390
16,467
ICON DMS JRA Total $'000 $'000 $'000 $'000
Current 4,974 3,123 - 8,097Non Current - - 8,370 8,370Total 4,974 3,123 8,370 16,467
For
per
sona
l use
onl
y
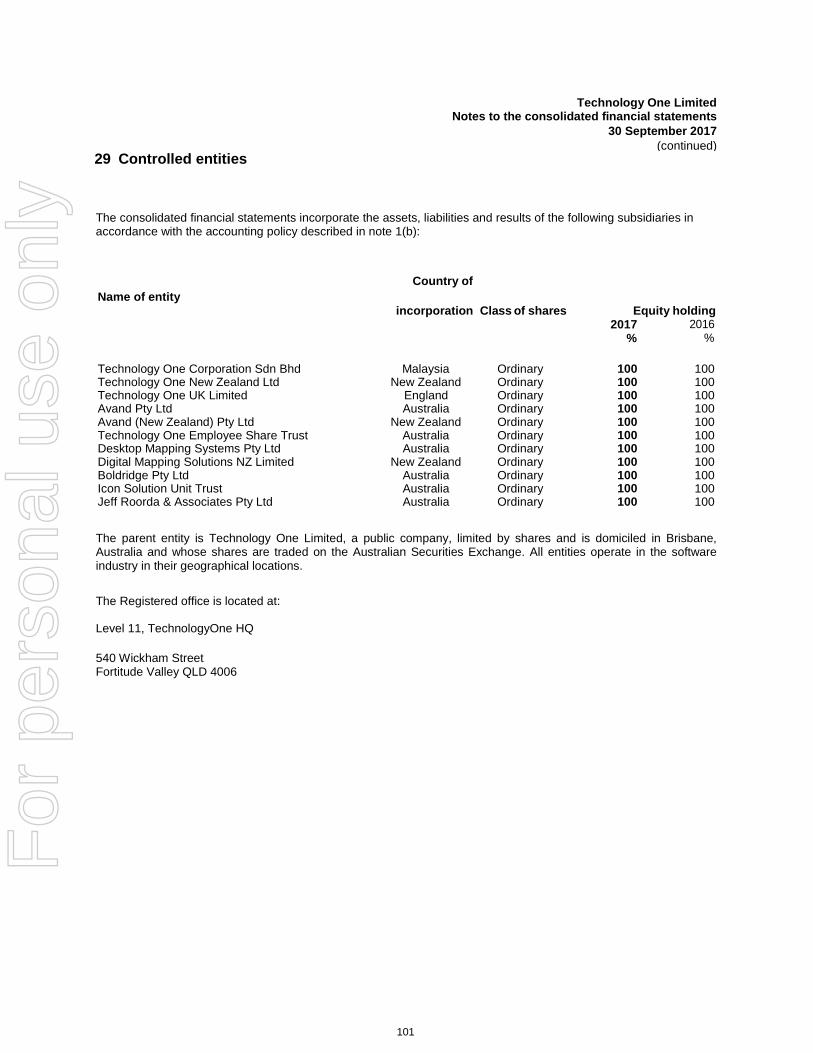
Technology One Limited Notes to the consolidated financial statements
30 September 2017 (continued)
101
29 Controlled entities
The consolidated financial statements incorporate the assets, liabilities and results of the following subsidiaries in accordance with the accounting policy described in note 1(b):
Name of entity Country of
incorporation Class of shares Equity holding 2017
% 2016
%
Technology One Corporation Sdn Bhd Malaysia Ordinary 100 100 Technology One New Zealand Ltd New Zealand Ordinary 100 100 Technology One UK Limited England Ordinary 100 100 Avand Pty Ltd Australia Ordinary 100 100 Avand (New Zealand) Pty Ltd New Zealand Ordinary 100 100 Technology One Employee Share Trust Australia Ordinary 100 100 Desktop Mapping Systems Pty Ltd Australia Ordinary 100 100 Digital Mapping Solutions NZ Limited New Zealand Ordinary 100 100 Boldridge Pty Ltd Australia Ordinary 100 100 Icon Solution Unit Trust Australia Ordinary 100 100 Jeff Roorda & Associates Pty Ltd Australia Ordinary 100 100
The parent entity is Technology One Limited, a public company, limited by shares and is domiciled in Brisbane, Australia and whose shares are traded on the Australian Securities Exchange. All entities operate in the software industry in their geographical locations.
The Registered office is located at:
Level 11, TechnologyOne HQ
540 Wickham Street Fortitude Valley QLD 4006
For
per
sona
l use
onl
y

Technology One Limited Notes to the consolidated financial statements
30 September 2017 (continued)
102
30 Reconciliation of profit after income tax to net cash inflow from operating activities
2017 $'000
2016 $'000
Profit for the period 44,494 41,344 Depreciation and amortisation 4,237 3,924 Non-cash employee benefits expense - share-based payments 1,576 1,496 Provision for onerous contract Transfers to / (from) provisions:
- 842
Employee entitlements (319) 1,139Doubtful debts (3) (216)
Net (gain) / loss on sale of non-current assets Movements in provision for:
179 1
Income tax payable (361) (294)Deferred income tax
Change in operating assets and liabilities: 3,379 1,479
Decrease / (increase) in trade debtors (10,461) (3,270) Decrease / (increase) in sundry debtors (1,440) 159 Decrease / (increase) in prepayments (2,470) (3,996) Decrease / (increase) in earned and unbilled revenue (5,818) (7,656) Decrease / (increase) in other assets 600 (283) Increase / (decrease) in trade creditors 5,932 833 Increase / (decrease) in other liabilities 286 816 Increase / (decrease) in unearned revenue 6,900 7,512
Increase / (decrease) in lease liability (269) (89)Net cash inflow / (outflow) from operating activities 46,442 43,741
For
per
sona
l use
onl
y

Technology One Limited Notes to the consolidated financial statements
30 September 2017 (continued)
103
2017 Cents
2016 Cents
14.18 13.26 14.10 13.11
44,494 41,344
2017 Number
2016 Number
313,865,453 311,780,703
1,637,750 3,595,835
31 Earnings per share
(a) Basic earnings per share
Basic earnings per share (cents per share) Diluted earnings per share (cents per share) Profit used for calculating basic and diluted earnings per share ($'000)
(b) Weighted average number of shares used as denominator
Weighted average number of ordinary shares used as the denominator in calculating basic earnings per share Adjustments for calculation of diluted earnings per share:
Options Weighted average number of ordinary and potential ordinary shares used as the denominator in calculating diluted earnings per share 315,503,203 315,376,538
There are no potentially dilutive share instruments not included in the calculation of diluted earnings per share.
There have been no transactions involving ordinary shares or potential ordinary shares that would significantly change the number of ordinary shares or potential ordinary shares outstanding between the reporting date and the date of completion of these financial statements.
32 Share-based payments
(a) Employee Option Plan
Options are granted to employees at the discretion of the Board based on the option plan approved by the Board.
TechnologyOne issues options with typically between 0% and 50% discount on the volume weighted average price for the 10 days prior to the grant date. The discount can be reduced or removed prior to vesting at the Board's discretion. The option can be withheld by the Executive Chairman for unsatisfactory performance for as long as it takes for the employee to rectify the performance matter.
The options typically vest if and when the employees satisfy the following conditions:
• The employee must be in the same or higher position at the time of exercise;• A successor must be in place before the last tranche of options can be exercised; and• Satisfactory performance on non-financial indicators as determined by the Executive Chairman.
The period available between vesting date and expiry date of each option is five years. There are no cash settlement alternatives.
Each option entitles the holder to purchase one share. Fair values of options granted as part of remuneration are based on values determined using the Black-Scholes option pricing model.
Set out below are summaries of options granted under the plan:
For
per
sona
l use
onl
y

Technology One Limited Notes to the consolidated financial statements
30 September 2017 (continued)
104
32 Share-based payments (continued)
(a) Employee Option Plan (continued)
Issue date Expiry dateExercise
price
Balance at start of the
period
Issued during the
period
Exercised during the
period
Forfeited during the
period
Balance at end of the
period
Vested & exercisable
at end of the period
Number Number Number Number Number Number2017
23-May-17 Oct-24 5.60$ - 247,373 - (57,614) 189,759 - 10-Mar-17 Oct-24 5.60$ - 22,516 - - 22,516 - 20-Feb-17 Oct-24 5.11$ - 151,863 - (50,621) 101,242 - 14-Feb-17 Oct-24 5.07$ - 50,000 - - 50,000 - 07-Feb-17 Oct-24 5.23$ - 50,000 - - 50,000 - 18-Oct-16 Oct-24 5.87$ - 195,804 - (195,804) - - 01-Oct-16 Oct-24 5.75$ - 1,725,828 (22,650) (221,415) 1,481,763 - 01-Jul-16 Jul-23 0.57$ 200,000 - 200,000 - 01-Jul-16 Jul-23 1.59$ 200,000 - (200,000) - - 01-Jul-16 Jul-23 0.68$ 200,000 - 200,000 - 01-Jul-16 Jul-23 0.48$ 60,000 - 60,000 - 01-Jul-16 Jul-23 1.89$ 50,000 - 50,000 - 01-Jul-16 Jul-23 1.03$ 200,666 - 200,666 - 01-Jul-16 Jul-23 1.16$ 16,650 - 16,650 - 01-Jul-16 Jul-23 0.53$ 150,000 - (50,000) 100,000 - 01-Jul-16 Jul-23 0.86$ 249,950 - 249,950 - 01-Jul-16 Jul-23 4.10$ 100,000 - (100,000) - - 01-Jul-16 Jul-23 1.59$ 12,500 - 12,500 -
11-Apr-16 Oct-23 4.80$ 317,211 - (84,590) 232,621 - 10-Oct-15 Oct-23 3.78$ 50,262 - (50,262) - - 01-Oct-15 Jul-22 3.03$ 100,000 - (50,000) (50,000) - - 01-Oct-15 Jul-22 1.89$ 50,000 - (50,000) - - 01-Jul-15 Jul-22 0.57$ 200,000 - (200,000) - - 01-Jul-15 Jul-22 1.59$ 200,000 - (200,000) - - 01-Jul-15 Jul-22 0.68$ 200,000 - (200,000) - - 01-Jul-15 Jul-22 0.48$ 50,000 - (50,000) - - 01-Jul-15 Jul-22 1.03$ 200,666 - (200,666) - - 01-Jul-15 Jul-22 1.16$ 16,650 - (16,650) - - 01-Jul-15 Jul-22 0.53$ 150,000 - (50,000) (50,000) 50,000 - 01-Jul-15 Jul-22 0.86$ 249,950 - (208,300) 41,650 41,650 01-Jul-15 Jul-22 1.59$ 12,500 - (12,500) - -
01-Oct-14 Jul-21 1.59$ 200,000 - (200,000) - - 14-Jul-14 Jul-22 1.34$ 167,000 - (167,000) - - 14-Jul-14 Jul-23 1.34$ 167,000 - 167,000 - 14-Jul-14 Jul-24 1.34$ 167,000 - 167,000 - 14-Jul-14 Jul-25 1.34$ 167,000 - 167,000 - 14-Jul-14 Jul-26 1.34$ 167,000 - 167,000 - 12-Jul-14 Jul-21 0.40$ 60,000 - (60,000) - - 01-Jul-14 Jul-21 1.03$ 74,000 - (74,000) - - 01-Jul-14 Jul-21 0.86$ 124,950 - (99,950) 25,000 25,000
12-Aug-13 Jul-20 1.03$ 4,000 - (4,000) - - 01-Jul-13 Jul-22 0.86$ 71,717 - (71,717) - -
01-May-09 Jul-22 0.36$ 55,000 - 55,000 55,000 10-Oct-08 Jul-20 0.41$ 210,000 - (210,000) - - 25-Aug-06 Aug-24 0.35$ 142,500 - 142,500 142,500
5,014,172 2,443,384 (2,147,433) (1,110,306) 4,199,817 264,150
Weighted average exercise price 1.35$ 5.68$ 1.07$ 4.08$ 3.28$ 0.48$
For
per
sona
l use
onl
y

Technology One Limited Notes to the consolidated financial statements
30 September 2017 (continued)
105
32 Share-based payments (continued)
(a) Employee Option Plan (continued)
Issue date Expiry dateExercise
price
Balance at start of the
period
Issued during the
period
Exercised during the
period
Forfeited during the
period
Balance at end of the
period
Vested & exercisable
at end of the period
Number Number Number Number Number Number2016
01-Oct-16 Jul-22 3.03$ 100,000 100,000 -01-Oct-16 Jul-22 1.89$ 50,000 50,000 -21-Sep-16 NA -$ 4,479 (4,479) - -04-Aug-16 NA -$ 4,479 (4,479) - -01-Jul-16 Jul-23 0.57$ 200,000 200,000 -01-Jul-16 Jul-23 1.59$ 200,000 200,000 -01-Jul-16 Jul-23 0.68$ 200,000 200,000 -01-Jul-16 Jul-23 0.48$ 60,000 60,000 -01-Jul-16 Jul-23 1.89$ 50,000 50,000 -01-Jul-16 Jul-23 1.03$ 200,666 200,666 -01-Jul-16 Jul-23 1.16$ 16,650 16,650 -01-Jul-16 Jul-23 0.53$ 150,000 150,000 -01-Jul-16 Jul-23 0.86$ 249,950 249,950 -01-Jul-16 Jul-23 4.10$ 100,000 100,000 -01-Jul-16 Jul-23 1.59$ 12,500 12,500 -
11-Apr-16 Oct-23 4.80$ 317,211 317,211 -10-Oct-15 Oct-23 3.78$ 50,262 50,262 -01-Jul-15 Jul-22 0.57$ 200,000 200,000 -01-Jul-15 Jul-22 1.59$ 225,000 (25,000) 200,000 -01-Jul-15 Jul-22 0.68$ 400,000 (200,000) 200,000 -01-Jul-15 Jul-22 0.48$ 50,000 50,000 -01-Jul-15 Jul-22 1.03$ 227,316 (26,650) 200,666 -01-Jul-15 Jul-22 1.16$ 16,650 16,650 -01-Jul-15 Jul-22 0.53$ 150,000 150,000 -01-Jul-15 Jul-22 0.86$ 249,950 249,950 -01-Jul-15 Jul-22 1.59$ 12,500 12,500 -
01-Oct-14 Jul-21 1.59$ 235,000 (35,000) 200,000 200,00001-Oct-14 Jul-21 1.59$ 12,500 (12,500) - -14-Jul-14 Jul-21 1.34$ 165,000 (165,000) - -14-Jul-14 Jul-22 1.34$ 167,000 167,000 -14-Jul-14 Jul-23 1.34$ 167,000 167,000 -14-Jul-14 Jul-24 1.34$ 167,000 167,000 -14-Jul-14 Jul-25 1.34$ 167,000 167,000 -14-Jul-14 Jul-26 1.34$ 167,000 167,000 -12-Jul-14 Jul-21 0.40$ 60,000 60,000 60,00001-Jul-14 Jul-21 0.57$ 200,000 (200,000) - -01-Jul-14 Jul-21 0.68$ 400,000 (400,000) - -01-Jul-14 Jul-21 0.48$ 50,000 (50,000) - -01-Jul-14 Jul-21 1.03$ 157,317 (66,667) (16,650) 74,000 74,00001-Jul-14 Jul-21 1.16$ 16,650 (16,650) - -01-Jul-14 Jul-21 0.53$ 150,000 (150,000) - -01-Jul-14 Jul-21 0.86$ 249,950 (125,000) 124,950 124,950
20-Dec-13 Jul-20 1.16$ 16,650 (16,650) - -12-Aug-13 Jul-20 1.03$ 4,000 - - 4,000 4,00012-Jul-13 Jul-20 0.40$ 60,000 (60,000) - -
01-Oct-12 Jul-19 0.86$ 108,300 (36,583) 71,717 71,71701-Oct-12 Jul-19 0.68$ 100,000 (100,000) - -12-Jul-12 Jul-19 0.40$ 60,000 (60,000) - -12-Jul-11 Aug-18 0.40$ 60,000 (60,000) - -
26-Nov-10 Jul-24 0.36$ 135,000 (135,000) - -01-May-09 Jul-22 0.36$ 1,090,000 (975,000) (60,000) 55,000 55,00010-Oct-08 Jul-20 0.41$ 210,000 210,000 210,00025-Aug-06 Aug-24 0.35$ 165,000 (22,500) 142,500 142,500
6,071,783 1,966,197 (2,660,508) (363,300) 5,014,172 942,167
Weighted average exercise price 0.78$ 1.91$ 0.57$ 0.80$ 1.35$ 0.79$
For
per
sona
l use
onl
y
Technology One Limited Notes to the consolidated financial statements
30 September 2017 (continued)
106
32 Share-based payments (continued)
(a) Employee Option Plan (continued)
At 30 September 2017 a total of 3,411,144 options (2016 - 3,178,068) were on offer to employees. The amount of options offered is in excess of options granted as certain options while offered will only be granted in a future period at the discretion of the Executive Chairman.
The weighted average share price at the date of exercise of options exercised during the year ended 30 September 2017 was $1.07 (2016 - $0.57).
The weighted average remaining contractual life of share options outstanding at the end of the period was 6.56 years (2016 - 6.27 years).
Fair value of options granted
The fair value of the equity-settled options is measured at the reporting date using the Black-Scholes option pricing model taking into account the terms and conditions upon which the instruments were granted.
The fair value of options granted during the year was between $0.68 - $1.27 (2016 – between $0.60 - $1.68).
The model inputs for options granted during the year ended 30 September 2017 included:
(I) Dividend yield between 1.6% and 1.9% (2016 - between 1.7% - 2.3%)(II) Expected volatility between 20.2% and 33.6% (2016 – between 11.3% - 20.2%)(III) Risk free interest rate between 1.5% and 2.0% (2016 – between 1.7% - 2.4%)(IV) Expected life of option 3.3 years (2016 - 6 years)(V) Option exercise price between $5.07 and $5.75(VI) Weighted average share price at grant date between $5.07 and $5.75 (2016 – between $3.89 - $5.13)
The expected volatility reflects the assumption that the historical volatility of a basket of similar companies over a period similar to the life of the options is indicative of future trends, which may also not necessarily be the actual outcome.
(b) Executive Performance Rights
After further market consultation, the company made the decision to return to issuing options instead of EPRs. The view is that the use of options under an LTI scheme for a growth company best aligns shareholder and executive interests. Please refer to section 3 of the remuneration report for further information.
(c) Expenses arising from share-based payment transactions
Total expenses arising from share-based payment transactions recognised during the year as part of employee benefit expense were as follows:
2017 $'000
2016 $'000
Options issued under employee option plan: Vested 1,993 1,591 Forfeited (417) (95)Total share-based payment expense 1,576 1,496
For
per
sona
l use
onl
y
Technology One Limited Notes to the consolidated financial statements
30 September 2017 (continued)
107
2017 2016 $'000 $'000
146,573 138,102 63,206 61,214
209,779 199,316
52,466 55,970 6,384 18,732
58,850 74,702
32,152 29,983 15,775 22,170 19,668 16,739 83,334 55,722
150,929 124,614
55,525 50,613
33 Parent entity financial information
(a) Summary financial information
The individual financial statements for the parent entity show the following aggregate amounts:
Balance sheet Current assets Non-current assets Total assets
Current liabilities Non-current liabilities Total liabilities
Shareholders' equity Contributed equity Dividend reserve Share option reserve Retained earnings
Profit or loss before tax for the year Total comprehensive income 54,798 50,268
The reserves balance is higher than Group due to the foreign currency translation reserve losses of $167,000 (2016 - loss of $345,000).
(b) Guarantees entered into by the parent entity
At 30 September 2017, the parent entity had $6,628,690 (2016 - $6,801,304) in outstanding performance guarantees. The total available guarantee facility is $7,000,000 (2016 - $7,000,000). The parent entity also had unused foreign currency dealing limits of $1,051,343 (2016 - $1,253,356).
The parent entity, Technology One Limited, continues to support its subsidiaries in their operations, by way of financial support.
(c) Contingent liabilities of the parent entity
At 30 September 2017, the Parent had $16,316,608 (2016 - $17,161,479) in earn out contingencies relating to the acquisitions during the year. This included $9,413,547 of earn out payments and $6,903,061 of contingent considerations. The valuation techniques and fair value of the consideration is outlined in note 28.
Please refer to note 25 in regards to the BCC contingent liability.
34 Events occurring after the reporting period
(a) Dividends
On 21 November, the directors of Technology One Limited declared a final dividend on ordinary shares in respect of the 2017 financial year. The total amount of the dividend is $17,664,000 and is 75% franked. There was also a special dividend declared for the 2017 financial year of $6,309,000 and this is also 75% franked.
No other matter or circumstance has occurred subsequent to period end that has significantly affected, or may significantly affect, the operations of the Company, the results of those operations or the state of affairs of the Company or economic entity in subsequent financial years.
For
per
sona
l use
onl
y

108
In accordance with a resolution of the directors of Technology One Limited, I state that:
In the opinion of the directors:
(a) the financial statements and notes set out on pages 60 to 107 are in accordance with the Corporations Act 2001, including:(i) giving a true and fair view of the consolidated entity's financial position as at 30 September 2017 and of its performance
for the year ended on that date; and(ii) complying with Australian Accounting Standards (including the Australian Accounting Interpretations) and the
Corporations Regulations 2001;(b) the financial statements and notes also comply with International Financial Reporting Standards as disclosed in note 1(a); and(c) there are reasonable grounds to believe that the Company will be able to pay its debts as and when they become due and
payable; and(d) this declaration has been made after receiving the declarations required to be made to the Directors in accordance with section
295A of the Corporations Act 2001 for the reporting year ended 30 September 2017.
On behalf of the Board of Directors
Adrian Di Marco
Director
Brisbane
21 November 2017
Technology One Limited Directors' declaration
30 September 2017
For
per
sona
l use
onl
y

A member firm of Ernst & Young Global LimitedLiability limited by a scheme approved under Professional Standards Legislation
Ernst & Young111 Eagle StreetBrisbane QLD 4000 AustraliaGPO Box 7878 Brisbane QLD 4001
Tel: +61 7 3011 3333Fax: +61 7 3011 3100ey.com/au
Auditor’s Independence Declaration to the Directors of TechnologyOne Limited
As lead auditor for the audit of Technology One Limited for the financial year ended 30 September2017, I declare to the best of my knowledge and belief, there have been:
a) no contraventions of the auditor independence requirements of the Corporations Act 2001 inrelation to the audit; and
b) no contraventions of any applicable code of professional conduct in relation to the audit.
This declaration is in respect of Technology One Limited and the entities it controlled during thefinancial year.
Ernst & Young
Brad TozerPartner21 November 2017
109
For
per
sona
l use
onl
y

A member firm of Ernst & Young Global LimitedLiability limited by a scheme approved under Professional Standards Legislation
Ernst & Young111 Eagle StreetBrisbane QLD 4000 AustraliaGPO Box 7878 Brisbane QLD 4001
Tel: +61 7 3011 3333Fax: +61 7 3011 3100ey.com/au
Independent Auditor's Report to the Shareholders of Technology OneLimited
Report on the Audit of the Financial Report
Opinion
We have audited the financial report of Technology One Limited (the Company) and its subsidiaries(collectively the Group), which comprises the consolidated statement of financial position as at 30September 2017, the consolidated statement of comprehensive income, consolidated statement ofchanges in equity and consolidated statement of cash flows for the year then ended, notes to thefinancial statements, including a summary of significant accounting policies, and the directors’declaration.
In our opinion, the accompanying financial report of the Group is in accordance with the CorporationsAct 2001, including:
a) giving a true and fair view of the consolidated financial position of the Group as at 30September 2017 and of its consolidated financial performance for the year ended on that date;and
b) complying with Australian Accounting Standards and the Corporations Regulations 2001.
Basis for Opinion
We conducted our audit in accordance with Australian Auditing Standards. Our responsibilities underthose standards are further described in the Auditor’s Responsibilities for the Audit of the FinancialReport section of our report. We are independent of the Group in accordance with the auditorindependence requirements of the Corporations Act 2001 and the ethical requirements of theAccounting Professional and Ethical Standards Board’s APES 110 Code of Ethics for ProfessionalAccountants (the Code) that are relevant to our audit of the financial report in Australia. We have alsofulfilled our other ethical responsibilities in accordance with the Code.
We believe that the audit evidence we have obtained is sufficient and appropriate to provide a basisfor our opinion.
Key Audit Matters
Key audit matters are those matters that, in our professional judgment, were of most significance inour audit of the financial report of the current year. These matters were addressed in the context ofour audit of the financial report as a whole, and in forming our opinion thereon, but we do not providea separate opinion on these matters. For each matter below, our description of how our auditaddressed the matter is provided in that context.
110
For
per
sona
l use
onl
y

A member firm of Ernst & Young Global LimitedLiability limited by a scheme approved under Professional Standards Legislation
We have fulfilled the responsibilities described in the Auditor’s Responsibilities for the Audit of theFinancial Report section of our report, including in relation to these matters. Accordingly, our auditincluded the performance of procedures designed to respond to our assessment of the risks ofmaterial misstatement of the financial report. The results of our audit procedures, including theprocedures performed to address the matters below, provide the basis for our audit opinion on theaccompanying financial report.
Measurement and Recognition of Revenue and Associated Assets and Liabilities
Why significant How our audit addressed the key audit matter
The Group contracts with its customers using writtencontracts which often encompass a number ofactivities (separately identifiable components) asreferred to in Note 1(d).
The process to recognise revenue, which included theallocation of revenue to the activities and theestimation and determination of when delivery orservice provision took place, involved significantjudgment by the Group. This judgment impacted thevalue of revenue recognised and unearned revenuethat has been recorded as a liability in theConsolidated Statement of Financial Position. Revenuerecognition for multiple element arrangements wasconsidered to be a key audit matter due to thecomplexity of contracts and the judgement required toallocate revenue amongst the respective contractedactivities.
Note 1(d) to the financial statements details theGroup’s revenue streams and the associatedaccounting policies. Revenue is disclosed in Note 5and associated assets in Note 9.
Our audit procedures addressed revenue from thefollowing business activities:
► Software licence fees;► Implementation and consulting services;► Project services;► Post sales customer support; and► Cloud service fees.
We considered the Group’s identification and separation ofthese activities and the allocation of the total contractvalue to these activities.
We also considered if the revenue recognition criteria usedby the Group was consistent with Australian AccountingStandards.
Our audit procedures for each of the revenue generatingactivities identified in signed customer contracts includedthe following:
Software licence fees
We read a sample of individual customer contracts anddetermined whether the risks and rewards associated withthe relevant licensed software passed to the customer inthe reporting period. We then assessed whether therecorded amount for the licence software fees agreed withthe determined contract value and whether any refundclauses or termination of convenience clauses should haveprevented revenue recognition.
Implementation and Consulting Services; andProject Services
For a sample of consulting service arrangements (time andmaterials) we assessed the Group’s controls associatedwith the recording of consulting days delivered and theapplication of contracted fee rates to these days.
111
For
per
sona
l use
onl
y

A member firm of Ernst & Young Global LimitedLiability limited by a scheme approved under Professional Standards Legislation
Why significant How our audit addressed the key audit matter
For a sample of fixed rate project agreements we assessedthe Group’s controls associated with the recognition ofrevenue and the calculation of the percentage ofcompletion of the project & its application to the agreedfee. For fixed rate project agreements we also consideredthe Group’s identification and measurement of onerouscontracts.
Where licence and optional services were sold together weassessed on a sample basis the Group’s assessment ofwhether the services sold with licences should berecognised separately.
Post Sales Customer Support
For a sample of contracts entered into during the currentperiod, we assessed whether the appropriate revenuerecognition criteria had been met.
For post sales customer support revenue billed annually(renewing customers) for a sample of customers wecompared the amount and timing of amounts recorded in2017 to the amounts and timing of revenue recorded inprior periods and obtained explanations from the Groupwhere significant differences were identified. We alsotested a sample of customers and determine whether theyhad consented to the renewal of their support.
We assessed whether the Group, had any legal orconstructive obligation at balance date, through its supportagreements, to provide general new software releases tocustomers and whether it was appropriate to recogniseamounts as revenue, related to this business activity upfront as described in note 1(d).
Cloud Service Fees
For a sample of significant service fee contracts we readindividual service contracts and assessed whether revenuerecognised was based upon the appropriate contract valueand the service period.
The above procedures also addressed the amounts ofrevenue deferred and recognised as a liability in theConsolidated Statement of Financial Position as at 30September 2017 for services to be provided in a futureperiod.
112
For
per
sona
l use
onl
y

A member firm of Ernst & Young Global LimitedLiability limited by a scheme approved under Professional Standards Legislation
Impairment Testing of Intangible Assets
Why significant How our audit addressed the key audit matter
The Group has recorded goodwill of $40 million andother intangibles of $7.5 million in its ConsolidatedStatement of Financial Position at 30 September2017. Each of the Group’s three cash generating units(CGU’s) contain goodwill and other intangibles. Theseare tested for impairment annually.
Note 12 to the financial statements discloses theassumptions used by the Group in testing its intangibleassets for impairment. It also sets out the Groups’CGU’s, the goodwill and other intangible assets.
The annual impairment assessment performed by theGroup was considered to be a key audit matter due tothe size of the asset’s carrying value and the degree ofestimation and assumptions involved in theassessment, specifically concerning the revenuegrowth and margin assumptions inherent in the futurediscounted cash flows.
We considered whether the Group’s impairment testingsatisfied the requirements of the relevant AustralianAccounting Standard. This included considering theidentification of CGU’s to which goodwill and other assetswere allocated.
The assumptions used in the impairment testing by theGroup and in the cash flow forecasts upon which it wasbased are summarised in Note 12 to the financialstatements. We evaluated these assumptions and forecastsby addressing mathematical accuracy, considering thereliability of the Group’s historical cash flow forecasts andapplying our knowledge of the business, corroborating ourwork with external information where possible.
We assessed the relevant disclosure in Note 12 of theFinancial Statements.
Information Other than the Financial Report and Auditor’s Report Thereon
The directors are responsible for the other information. The other information comprises theinformation included in the Group’s 2017 Annual Report other than the financial report, theremuneration report and our auditor’s report thereon. We obtained the Appendix 4E, Directors’Report and the Corporate Governance Statement that are to be included in the Annual Report, prior tothe date of this auditor’s report, and we expect to obtain the remaining sections of the Annual Reportafter the date of this auditor’s report.
Our opinion on the financial report does not cover the other information and we do not and will notexpress any form of assurance conclusion thereon, with the exception of the Remuneration Reportand our related assurance opinion.
In connection with our audit of the financial report, our responsibility is to read the other informationand, in doing so, consider whether the other information is materially inconsistent with the financialreport or our knowledge obtained in the audit or otherwise appears to be materially misstated.
If, based on the work we have performed on the other information obtained prior to the date of thisauditor’s report, we conclude that there is a material misstatement of this other information, we arerequired to report that fact. We have nothing to report in this regard.
Responsibilities of the Directors for the Financial ReportThe directors of the Company are responsible for the preparation of the financial report that gives atrue and fair view in accordance with Australian Accounting Standards and the Corporations Act 2001and for such internal control as the directors determine is necessary to enable the preparation of thefinancial report that gives a true and fair view and is free from material misstatement, whether due tofraud or error.
113
For
per
sona
l use
onl
y

A member firm of Ernst & Young Global LimitedLiability limited by a scheme approved under Professional Standards Legislation
In preparing the financial report, the directors are responsible for assessing the Group’s ability tocontinue as a going concern, disclosing, as applicable, matters relating to going concern and using thegoing concern basis of accounting unless the directors either intend to liquidate the Group or to ceaseoperations, or have no realistic alternative but to do so.
Auditor's Responsibilities for the Audit of the Financial Report
Our objectives are to obtain reasonable assurance about whether the financial report as a whole isfree from material misstatement, whether due to fraud or error, and to issue an auditor’s report thatincludes our opinion. Reasonable assurance is a high level of assurance, but is not a guarantee that anaudit conducted in accordance with the Australian Auditing Standards will always detect a materialmisstatement when it exists. Misstatements can arise from fraud or error and are considered materialif, individually or in the aggregate, they could reasonably be expected to influence the economicdecisions of users taken on the basis of this financial report.
As part of an audit in accordance with the Australian Auditing Standards, we exercise professionaljudgment and maintain professional scepticism throughout the audit. We also:
· Identify and assess the risks of material misstatement of the financial report, whether due tofraud or error, design and perform audit procedures responsive to those risks, and obtain auditevidence that is sufficient and appropriate to provide a basis for our opinion. The risk of notdetecting a material misstatement resulting from fraud is higher than for one resulting fromerror, as fraud may involve collusion, forgery, intentional omissions, misrepresentations, or theoverride of internal control.
· Obtain an understanding of internal control relevant to the audit in order to design auditprocedures that are appropriate in the circumstances, but not for the purpose of expressing anopinion on the effectiveness of the Group’s internal control.
· Evaluate the appropriateness of accounting policies used and the reasonableness of accountingestimates and related disclosures made by the directors.
· Conclude on the appropriateness of the directors’ use of the going concern basis of accountingand, based on the audit evidence obtained, whether a material uncertainty exists related toevents or conditions that may cast significant doubt on the Group’s ability to continue as a goingconcern. If we conclude that a material uncertainty exists, we are required to draw attention inour auditor’s report to the related disclosures in the financial report or, if such disclosures areinadequate, to modify our opinion. Our conclusions are based on the audit evidence obtained upto the date of our auditor’s report. However, future events or conditions may cause the Groupto cease to continue as a going concern.
· Evaluate the overall presentation, structure and content of the financial report, including thedisclosures, and whether the financial report represents the underlying transactions and eventsin a manner that achieves fair presentation.
· Obtain sufficient appropriate audit evidence regarding the financial information of the entitiesor business activities within the Group to express an opinion on the financial report. We areresponsible for the direction, supervision and performance of the Group audit. We remain solelyresponsible for our audit opinion.
114
For
per
sona
l use
onl
y

A member firm of Ernst & Young Global LimitedLiability limited by a scheme approved under Professional Standards Legislation
We communicate with the directors regarding, among other matters, the planned scope and timing ofthe audit and significant audit findings, including any significant deficiencies in internal control that weidentify during our audit.
We also provide the directors with a statement that we have complied with relevant ethicalrequirements regarding independence, and to communicate with them all relationships and othermatters that may reasonably be thought to bear on our independence, and where applicable, relatedsafeguards.
From the matters communicated to the directors, we determine those matters that were of mostsignificance in the audit of the financial report of the current year and are therefore the key auditmatters. We describe these matters in our auditor’s report unless law or regulation precludes publicdisclosure about the matter or when, in extremely rare circumstances, we determine that a mattershould not be communicated in our report because the adverse consequences of doing so wouldreasonably be expected to outweigh the public interest benefits of such communication.
Report on the Audit of the Remuneration Report
Opinion on the Remuneration Report
We have audited the Remuneration Report included in the directors' report for the year ended 30September 2017.
In our opinion, the Remuneration Report of Technology One Limited for the year ended 30 September2017, complies with section 300A of the Corporations Act 2001.
Responsibilities
The directors of the Company are responsible for the preparation and presentation of theRemuneration Report in accordance with section 300A of the Corporations Act 2001. Ourresponsibility is to express an opinion on the Remuneration Report, based on our audit conducted inaccordance with Australian Auditing Standards.
Ernst & Young
Brad TozerPartnerBrisbane21November 2017
115
For
per
sona
l use
onl
y