
Technology & Methods Seminar “Blast and Other Methods of Probabilistic Sequence Comparison”...
40
Technology & Methods Seminar “Blast and Other Methods of Probabilistic Sequence Comparison” Arcady Mushegian Bioinformatics Thursday, May 25, 1:00p.m. Classroom (1 st floor, Administration Building) Schedule with abstracts and previous presentation slides can be found on: K:\Weekly Seminar Schedule\Thursday -- Technology & Methods Information regarding previous seminars can be found at: http://research.stowers-institute.org/wiw/external/Seminars/index.htm
-
Upload
phoebe-long -
Category
Documents
-
view
218 -
download
0
Transcript of Technology & Methods Seminar “Blast and Other Methods of Probabilistic Sequence Comparison”...

Technology & Methods Seminar
“Blast and Other Methods of Probabilistic Sequence Comparison”
Arcady MushegianBioinformatics
Thursday, May 25, 1:00p.m.Classroom
(1st floor, Administration Building)
Schedule with abstracts and previous presentation slides can be found on:K:\Weekly Seminar Schedule\Thursday -- Technology & Methods
Information regarding previous seminars can be found at:http://research.stowers-institute.org/wiw/external/Seminars/index.htm

ProteomicsRooms 351-357

Over 2000 Samples Analyzed since Oct 2003
0
50
100
150
200
250
300
Abmay
r
Baum
ann
Coffman
Conaw
ay Du
Ger
ton
Krum
lauf
Jasp
erse
n Li
Rong_L
i
Train
or
Work
man Xie
Nu
mb
er
of
sa
mp
les
2003
2004
2005
2006

Protein List
Peptide MixtureCellsTissues
EmbryosDigestion
Proteins
High-Throughput Proteomics: MudPIT
2D Chromatography
Database MatchingMS/MS Spectrum
Data Analysis
Tandem Mass Spectrometry
LysisPurification

Complex Protein MixturesPeptide MixtureCells
Tissues Embryos
Digestion
Proteins
2D Chromatography
MS/MS Spectrum
Tandem Mass Spectrometry
LysisPurification
Database Matching
Data Analysis
Protein List

Complex Protein Mixtures Types of samples we deal with:
Whole cell lysates Membrane/Organelle preps Co-IPed proteins Affinity purified proteins
Any biochemically-sound protein mixture and appropriate negative controls
What we need to know about your samples: Details of prep:
Organism Amino acid sequence(s) Buffer
Concentration, Silver-stained gel, Western Blot Protein content or PTMs
Dat
abas
e
Chr
omat
oM
ass
Spec
Dat
a An
alys
is
Dig
estio
n
Drop off: -80°C Freezer (Hallway Room 351)
Quantities: low µg to 500µg

Sample form: Small starting volume (<50ul) can be digested directly Dried protein pellet after TCA-precipitation (PREFERRED)
Complex Protein Mixtures - Troubleshooting
RT: 0.00 - 20.02
0 1 2 3 4 5 6 7 8 9 10 11 12 13 14 15 16 17 18 19 20
Tim e (m in)
0
5
10
15
20
25
30
35
40
45
50
55
60
65
70
75
80
85
90
95
100
Re
lati
ve A
bu
nd
an
ce
0 .79
1.801.00
2.01 18.30
2.15
1.09 2.22
2.50
2.5718.262.82 2.96
3.023.43
3.50 6.94 7.236.303.79 6.23 7.828.41
8.7319.9319.219.01
12.62 15.1610.53 14.61 15.96 18.0816.5111.63
NL:1.11E9
Bas e Peak MS ScMcd1-Myc_Meta_Ti_101
RT: 0.00 - 117.08
0 10 20 30 40 50 60 70 80 90 100 110
Tim e (m in)
0
5
10
15
20
25
30
35
40
45
50
55
60
65
70
75
80
85
90
95
100
Re
lati
ve A
bu
nd
an
ce
97.63 107.9413.19 103.3395.7583.0074.50 112.4210.99 90.38
89.4213.8484.82
14.10
10.40 72.09
71.42
70.43
69.5168.86
68.60
65.99
65.40
64.8247.99
63.32
62.27
54.66 60.639.98
53.57
9.7652.2646.08
9.13 15.38
5.75 40.8240.27
5.26
34.054.57
22.6520.33 32.68
NL:4.29E9
Bas e Peak MS ScMcd1-Myc_Meta_Ti_102
RT: 0.00 - 117.00
0 10 20 30 40 50 60 70 80 90 100 110
Tim e (m in)
0
5
10
15
20
25
30
35
40
45
50
55
60
65
70
75
80
85
90
95
100
Re
lati
ve A
bu
nd
an
ce
84.10 116.6910.448.25 86.334.15 83.56 108.5299.4789.9480.03
3.38
7.2411.11
97.2279.2577.28 94.19 111.66
76.50
14.11
73.93
71.43
66.6865.36
63.2861.75
60.70
59.2952.75
52.58
52.33
44.36 51.0943.35
38.3837.6915.24 34.21
15.90 20.88 28.54
NL:4.27E9
Bas e Peak MS ScMcd1-Myc_Meta_Ti_103
RT: 0.00 - 117.02
0 10 20 30 40 50 60 70 80 90 100 110
Tim e (m in)
0
5
10
15
20
25
30
35
40
45
50
55
60
65
70
75
80
85
90
95
100
Re
lati
ve A
bu
nd
an
ce
3 .62 5.41 9.00 12.61
102.65
101.42 107.77114.87
112.4687.31
12.85
98.4895.58
90.0413.58
94.99
86.35
84.46
82.96
81.2676.39
74.89
73.5945.62 72.2470.17
67.5960.85
53.5652.57
53.72
54.1215.7645.16 51.93
23.9718.93 40.0435.5829.18
NL:4.28E9
Bas e Peak MS ScMcd1-Myc_Meta_Ti_104
RT: 0.00 - 117.03
0 10 20 30 40 50 60 70 80 90 100 110
Tim e (m in)
0
5
10
15
20
25
30
35
40
45
50
55
60
65
70
75
80
85
90
95
100
Re
lati
ve A
bu
nd
an
ce
0 .315.27
5.57 11.083.82
12.25
12.50
12.79
13.43
105.69104.01 110.85
97.55
115.2694.70
89.51
78.79 88.2676.0370.7552.70
67.5814.46 53.5419.57 60.6024.59 29.85 45.1234.98 39.99
NL:3.87E9
Bas e Peak MS ScMcd1-Myc_Meta_Ti_105
RT: 0.00 - 117.03
0 10 20 30 40 50 60 70 80 90 100 110
Tim e (m in)
0
5
10
15
20
25
30
35
40
45
50
55
60
65
70
75
80
85
90
95
100
Re
lati
ve A
bu
nd
an
ce
101.06 104.8696.94105.10 114.70
112.6594.62
111.38
105.99
92.73
15.50
91.20
90.43
15.70
90.27
89.40
10.19
11.379.6586.73
7.666.5586.38
77.3075.9671.2962.0649.10 83.4926.6523.03 44.19 54.5340.9230.43
NL:4.28E9
Bas e Peak MS ScMcd1-Myc_Meta_Ti_106
Problems with “Sticky Stuff”: Glycerol High Detergent (e.g. 2% SDS) DNA/RNA
Solutions: Keep as low as possible or dialyze out Methanol/Chloroform extraction Benzonase
RT: 0.00 - 116.97
0 10 20 30 40 50 60 70 80 90 100 110
Tim e (m in)
0
5
10
15
20
25
30
35
40
45
50
55
60
65
70
75
80
85
90
95
100
Re
lativ
e A
bu
nd
an
ce
62.49
89.81
62.84
39.52
47.81
44.6293.19
56.40
37.6763.14
52.16
15.16
58.1136.88
15.7773.68
103.6183.04
16.02 94.0888.3914.47 81.0065.38
74.5616.33 68.26 99.9526.60 35.7124.5513.89 104.382.67 4.38 109.83
NL:3.07E9
Base Peak MS ScMcd1-Myc_Meta_Ti_402
RT: 0.00 - 117.05
0 10 20 30 40 50 60 70 80 90 100 110
Tim e (m in)
0
5
10
15
20
25
30
35
40
45
50
55
60
65
70
75
80
85
90
95
100
Re
lativ
e A
bu
nd
an
ce
54.39
61.15
60.86
61.70
49.1042.2040.5233.81
77.4039.5312.6213.3011.79 47.766.05 58.59 67.15 80.0069.31 116.7944.8220.62 21.88 111.1285.8532.02 107.2999.7187.94
NL:1.63E9
Base Peak MS ScMcd1-Myc_Meta_Ti_405
RT: 0.00 - 116.96
0 10 20 30 40 50 60 70 80 90 100 110
Tim e (m in)
0
5
10
15
20
25
30
35
40
45
50
55
60
65
70
75
80
85
90
95
100
Re
lativ
e A
bu
nd
an
ce
39.72
54.25
60.68
60.85
40.47
45.69
44.5061.33
34.71
48.7320.98 58.3212.77 22.5312.02 67.036.32 32.85 115.4950.28 75.92 78.37 112.1882.45 89.21 106.3293.72
NL:3.23E9
Base Peak MS ScMcd1-Myc_Meta_Ti_404
RT: 0.00 - 117.05
0 10 20 30 40 50 60 70 80 90 100 110
Tim e (m in)
0
5
10
15
20
25
30
35
40
45
50
55
60
65
70
75
80
85
90
95
100
Re
lativ
e A
bu
nd
an
ce
54.86
39.77
61.77
45.12
46.42
43.18
35.97
62.38
31.5662.5646.78
50.8523.0114.0512.51 23.8214.858.17 58.53 115.10106.3226.07 67.93 82.0178.8116.40 102.4588.5275.03 91.16
NL:1.88E9
Base Peak MS ScMcd1-Myc_Meta_Ti_403
RT: 0.00 - 97.06
0 5 10 15 20 25 30 35 40 45 50 55 60 65 70 75 80 85 90 95
Tim e (m in)
0
5
10
15
20
25
30
35
40
45
50
55
60
65
70
75
80
85
90
95
100
Re
lativ
e A
bu
nd
an
ce
60.58
62.41
58.27
92.36
92.03
90.91
90.20
88.97
87.8773.7013.51 81.91 84.4680.1414.0712.37
78.6512.11 14.79
65.7311.20
66.66 73.2410.667.55
6.64 57.814.17
56.7616.1453.91
18.98 47.1126.92 36.1529.17 40.29
NL:1.44E9
Base Peak MS ScMcd1-Myc_Meta_Ti_406
RT: 0.00 - 20.05
0 1 2 3 4 5 6 7 8 9 10 11 12 13 14 15 16 17 18 19 20
Tim e (m in)
0
5
10
15
20
25
30
35
40
45
50
55
60
65
70
75
80
85
90
95
100
Re
lativ
e A
bu
nd
an
ce
3.45
3.962.85
4.02
4.22
2.71
4.29
4.35
2.302.22
4.421.71
1.64
1.51
1.444.49
4.561.38
4.831.311.03 5.07
5.24 18.705.49 14.65 17.4416.9116.14 19.3213.7013.0612.3110.619.639.256.24 7.28 8.64
NL:3.86E9
Base Peak MS ScMcd1-Myc_Meta_Ti_401
13 IDed Proteins 67 IDed Proteins
w/o Benzonase w/ Benzonase

Peptide MixtureCellsTissues
EmbryosDigestion
ProteinsLysis
Purification
Generating Peptides
2D Chromatography
MS/MS Spectrum
Tandem Mass Spectrometry
Database Matching
Data Analysis
Protein List

Generating PeptidesProteomic Surveying: Endoproteinase Lys-C + Trypsin
MKLSEVFEQE IDPVMQSLGY CCGRKLEFSP QTLCCYGKQL CTIPRDATYY SYQNRYHFCE KCFNEIQGES VSLGDDPSQP QTTINKEQFS KRKNDTLDPE LFVECTECGR KMHQICVLHH EIIWPAGFVC DGCLKKSART RKENKFSAKR LPSTRLGTFL DSMCRLELKL NSS

Proteomic Surveying: Endoproteinase Lys-C + Trypsin
MKLSEVFEQE IDPVMQSLGY CCGRKLEFSP QTLCCYGKQL CTIPRDATYY SYQNRYHFCE KCFNEIQGES VSLGDDPSQP QTTINKEQFS KRKNDTLDPE LFVECTECGR KMHQICVLHH EIIWPAGFVC DGCLKKSART RKENKFSAKR LPSTRLGTFL DSMCRLELKL NSS
PTMs: High Sequence Coverage
MSQAIAEKQP SQEVKMEAKM EVDQPEPADT QPEDISESKV EDCKMESTET EERSTELKTE IKEEEDQPST SATQSSPAPG QSKKKIFKPE ELRQALMPTL EALYRQDPES LPFRQPVDPQ LLGIPDYFDI VKSPMDLSTI KRKLDTGQYQ EPWQYVDDIW LMFNNAWLYN RKTSRVYKYC
Generating Peptides

• Sample is split into x aliquots
• Digest using x different proteases
• Analyze samples individually
• Interpret spectra using SEQUEST
MudPITMudPIT MudPIT
Trypsin Subtilisin Elastase
MacCoss et al. (2002) Proc Natl Acad Sci U S A. 99:7900-7905
Post-Translational Modifications: Triple/Multiple Digest
Generating PeptidesProteomic Surveying: Endoproteinase Lys-C + Trypsin
MKLSEVFEQE IDPVMQSLGY CCGRKLEFSP QTLCCYGKQL CTIPRDATYY SYQNRYHFCE KCFNEIQGES VSLGDDPSQP QTTINKEQFS KRKNDTLDPE LFVECTECGR KMHQICVLHH EIIWPAGFVC DGCLKKSART RKENKFSAKR LPSTRLGTFL DSMCRLELKL NSS
PTMs: High Sequence Coverage
MSQAIAEKQP SQEVKMEAKM EVDQPEPADT QPEDISESKV EDCKMESTET EERSTELKTE IKEEEDQPST SATQSSPAPG QSKKKIFKPE ELRQALMPTL EALYRQDPES LPFRQPVDPQ LLGIPDYFDI VKSPMDLSTI KRKLDTGQYQ EPWQYVDDIW LMFNNAWLYN RKTSRVYKYC
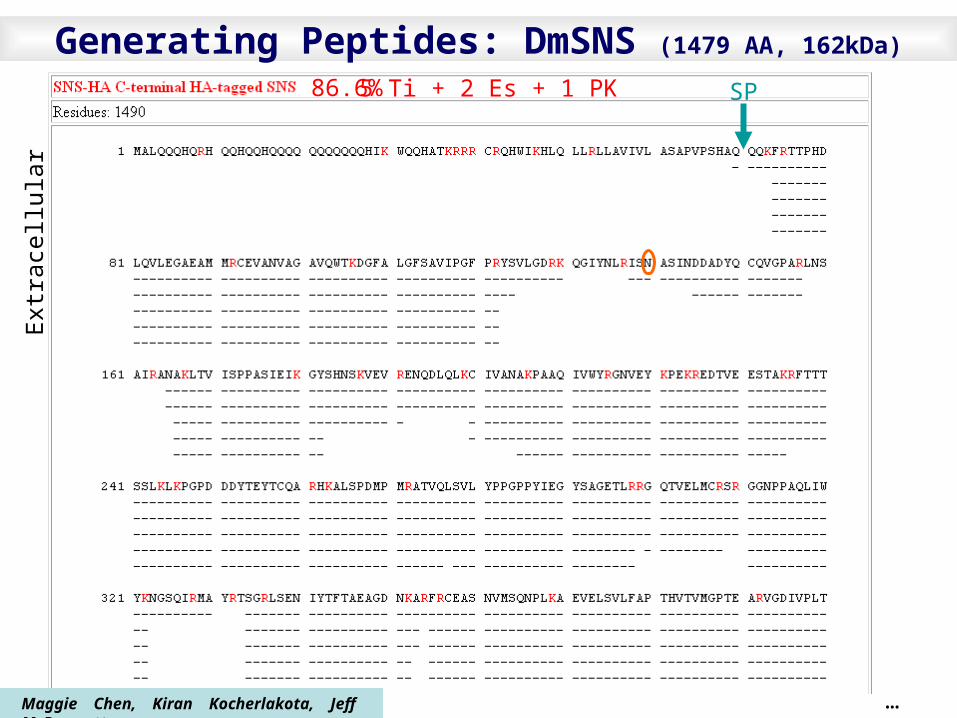
5 Ti + 2 Es + 1 PK 86.6% SP
Ext
race
llula
rGenerating Peptides: DmSNS (1479 AA, 162kDa)
Maggie Chen, Kiran Kocherlakota, Jeff McDermott …
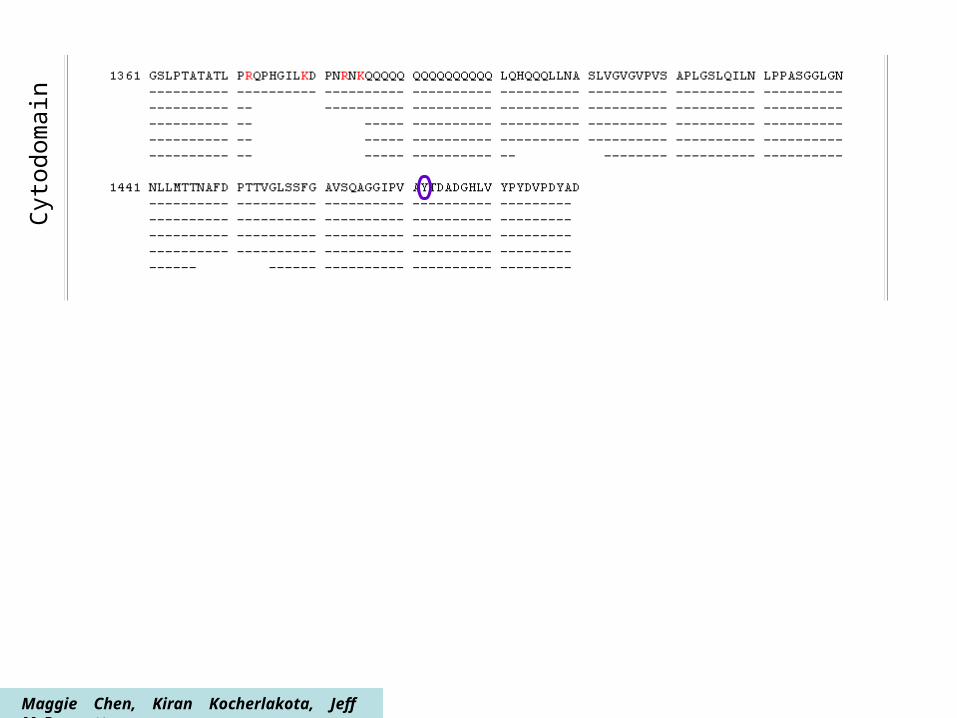
Cyt
odom
ain
Maggie Chen, Kiran Kocherlakota, Jeff McDermott

Generating Peptides - Troubleshooting
No tryptic peptides are obtained from particular protein Overdigestion with non-specific proteases No positively charged amino acids in peptides

Peptide MixtureCellsTissues
EmbryosDigestion
ProteinsLysis
Purification
Multidimensional Chromatography
MS/MS Spectrum
Tandem Mass Spectrometry
Database Matching
Data Analysis
2D Chromatography
Protein List

Small digest volumes (<200µl): 3-phase 100µm Fused Silica
SCX
Peptides
RP - C18
RP - C18
100µm FS
Multidimensional Chromatography
Peptides
100µm FS
wasteFiltered Unionwith 2µm Frit
250µm FS
250µm FS
SCX
RP - C18
RP - C18
250µm FS
Large digest volumes (>200µl): split-3-phase 250µm Fused Silica

HPLC
H2O MeCN NH4OAc
0 20 40 60 80 1000
20
40
60
Bu
ffer
(%
)
Time (min)
Multidimensional Chromatography• Cycle 1 – Reverse Phase Gradient
• Cycle 2_Step 1 – Salt Pulse
• Cycle 2_Step 2 – Reverse Phase Gradient
• Cycle 3_Step 1 – Increase Salt Pulse
• Cycle 3_Step 2 – Reverse Phase Gradient
2.4kV
Number of Cycles depends on Sample Complexity

Peptide MixtureCellsTissues
EmbryosDigestion
ProteinsLysis
Purification
Tandem Mass Spectrometry
Database Matching
Data Analysis
2D Chromatography
Tandem Mass Spectrometry
MS/MS Spectrum
Protein List

Tandem Mass Spectrometry
Hardware improvements for LTQ: Trapping efficiency (no rf field in ion injection axis), Ion capacity (linear configuration of mass analyzer -> larger volume), ~2x Detection efficiency (radial ejection of ions + 2 detectors) ~3x Ion ejection rate (while maintaining same resolution) Should significantly improve the number of detected peptides/proteins
Deca-XP vs LTQ(3D vs Linear Ion Trap)
Blackler et al. (2006) Anal. Chem.78:1337-13344

Tandem Mass SpectrometryDeca-XP vs LTQ
~2.5x more Protein IDs More Proteins that matter: not necessarily More spectra per protein (Quantitation, PTMs)
~10µg FLAG-tagged Mediator Prep
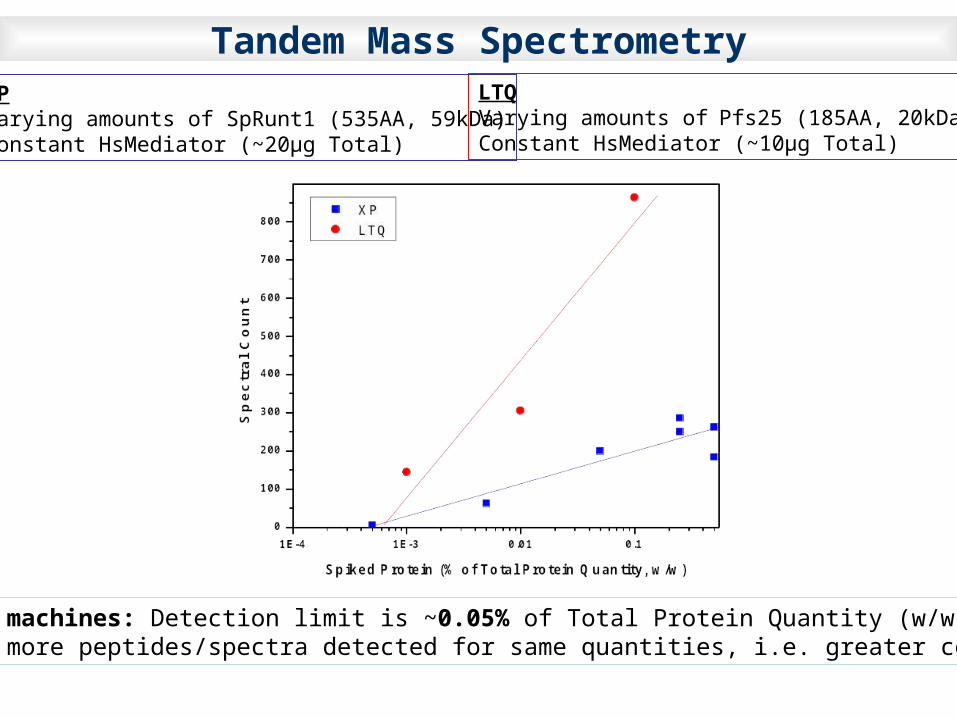
Both machines: Detection limit is ~0.05% of Total Protein Quantity (w/w) LTQ: more peptides/spectra detected for same quantities, i.e. greater confidence
LTQVarying amounts ofPfs25 (185AA, 20kDa)Constant HsMediator (~10µg Total)
XPVarying amounts of SpRunt1 (535AA, 59kDa)Constant HsMediator (~20µg Total)
Tandem Mass Spectrometry

Tandem Mass Spectrometry
The increase in number of spectra obtained from the LTQ results in: much larger files (x10) significantly increase in computational overhead (Storage and Search Time)
Blackler et al. (2006) Anal. Chem.78:1337-13344

Computational Overhead
Dan Thomasset

Computational Overhead
Dan Thomasset

Instrumentation Priorities
XP On-going Protein Identification Projects
LTQ1. Quantitation (isotopic labeling)2. PTMs3. Low Abundance Proteins4. New Protein Identification Projects
Peptide MixtureCellsTissues
EmbryosDigestion
ProteinsLysis
Purification
Data Analysis
2D Chromatography
Tandem Mass Spectrometry
Database MatchingMS/MS Spectrum
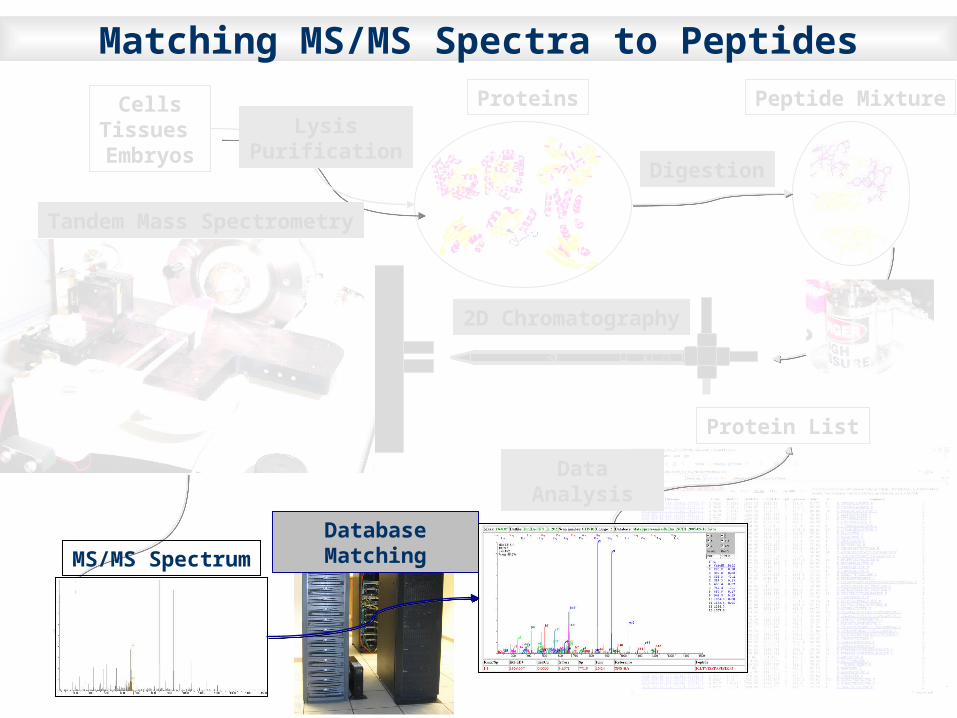
Matching MS/MS Spectra to Peptides
Protein List

Matching MS/MS Spectra to Peptides
Protein Sequence Databases: Need to be as comprehensive as possible (whole genomes) Need to include “custom” sequences Updates
Shuffled Sequences: Used to estimate False Discovery Rates (FDR)
ralCountTotalSpect
untSpectralCoShuffledxFDR
)_(2
Search engine: SEQUEST®

Peptide MixtureCellsTissues
EmbryosDigestion
ProteinsLysis
Purification
Data Analysis
2D Chromatography
Tandem Mass Spectrometry
MS/MS SpectrumDatabase Matching
Protein List
Data Analysis

FILTER
ASSEMBLEPARSE
SQTs
Filtering & Assembling Data: DTASelect
DTASelect
High-stringency Filtering Criteria to limit FDR: Cross-correlation score (XCorr) DeltaCN Peptide Length Peptide Ends
Through P: drive http://bioinfo/proteomics/
DTASelect.html (DTASelect-filter.txt)
Tabb et al. (2002) J Proteome Res 1: 21-26

COMPARE
Comparing Protein Lists: CONTRASTn Protein Lists
MERGE
Tabb et al. (2002) J Proteome Res 1: 21-26
MSAccessMSAccess
Text files
CONTRAST
Contrast.html (Contrast.txt)

COMPARE
Comparing Protein Lists: contrast-reportn Protein Lists
contrast-report
report.xls
Dan He
Mike Coleman

COMPARE
Comparing Protein Lists: contrast-reportn Protein Lists
contrast-report
report.xls
Dan He
Mike Coleman

Relative Abundance: NSAF
N
ii
kk
LengthuntSpectralCo
LengthuntSpectralCoNSAF
1
)/(
)/()(
Normalized Spectral Abundance Factor
Quantitative Information from MudPIT dataset? Sequence Coverage: high for small proteins / low for large proteins Spectral Count: large proteins contribute more peptides/spectra
Values between 0 and 1 Best approximation of protein levels in a sample Allows comparisons across multiple runs and across different instruments

Relative Abundance: NSAF
Erika Geisbrecht Mingan Shi
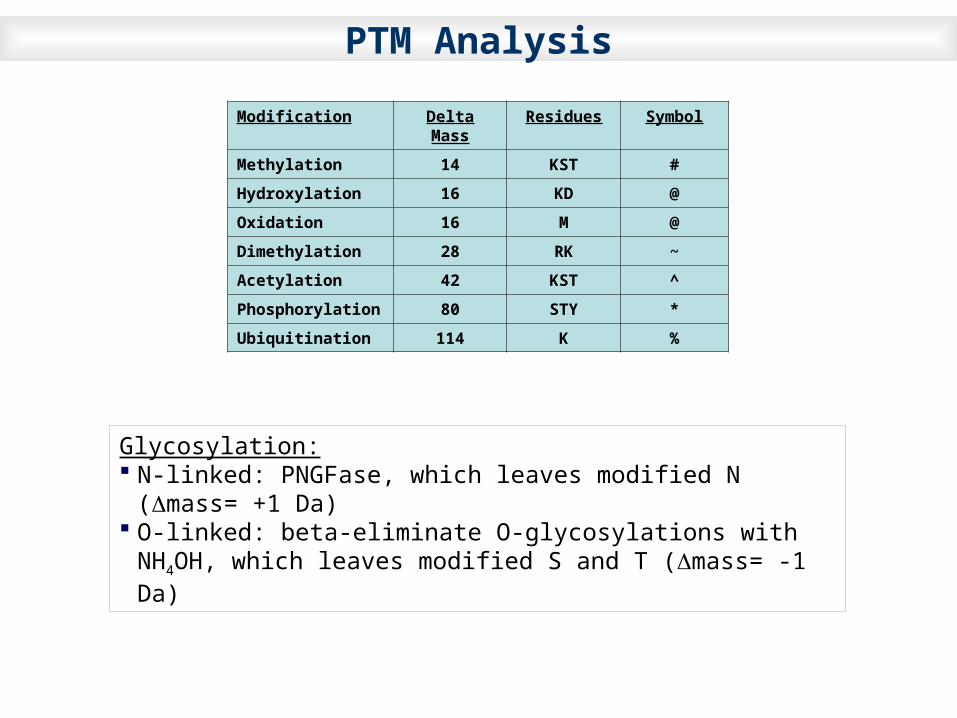
Modification Delta Mass Residues Symbol
Methylation 14 KST #
Hydroxylation 16 KD @
Oxidation 16 M @
Dimethylation 28 RK ~
Acetylation 42 KST ^
Phosphorylation 80 STY *
Ubiquitination 114 K %
PTM Analysis
Glycosylation: N-linked: PNGFase, which leaves modified N (mass= +1 Da) O-linked: beta-eliminate O-glycosylations with NH4OH, which
leaves modified S and T (mass= -1 Da)

PTM Analysis Flowchart

ptm-report
Mike Coleman

contrast-ptm
Mike Coleman

Time-line
Sear
ch
LC/L
C-M
S/M
S
Dig
estio
n
DTA
Sele
ct
1 w
eek
2 w
eeks
CO
NTR
AST
PTM
s R
esul
ts
3-6
Mon
ths
PTM
s Se
arch
es
1 M
onth


![RAJATON Y 7 — 2019 7:00p.m. 11Ê16a 7:00p.m. 11Ê23a 100 ... · RAJATON Y 7 — 2019 7:00p.m. 11Ê16a 7:00p.m. 11Ê23a 100 FINLANDJAPAN MIN-ONBt MIN-ONkllB 05-5") 155-636(Bt) 1-0.83980]](https://static.fdocuments.us/doc/165x107/60671f09218564308148ffd9/rajaton-y-7-a-2019-700pm-1116a-700pm-1123a-100-rajaton-y-7-a-2019.jpg)