Technology John McDonald M&A · PDF file05/08/17 Intel Corp. Technology Hardware Fixed Income...
27
Technology M&A Report Q2 2017 HYDE PARK CAPITAL Member FINRA/SIPC Investment Banking | Mergers & Acquisitions | Capital Raising Hyde Park Capital Advisors, LLC 701 N. Franklin Street Tampa, FL 33602 Tel: 813-383-0202 www.hydeparkcapital.com John Hill Senior Managing Director [email protected] (813) 383-0205 John McDonald Senior Managing Director [email protected] (813) 383-0206 Keith Hodgdon Managing Director [email protected] (813) 383-0208 Greg Bosl Vice President [email protected] (813) 597-2649 Jami Gold Vice President [email protected] (813) 383-0203 Charlie Hendrick Vice President [email protected] (813) 383-0207 Jeffrey Hendricks Vice President – Business Development [email protected] (678) 523-3073
-
Upload
truongcong -
Category
Documents
-
view
218 -
download
3
Transcript of Technology John McDonald M&A · PDF file05/08/17 Intel Corp. Technology Hardware Fixed Income...

Technology M&A Report
Q2 2017
HYDE PARK CAPITAL
Member FINRA/SIPC
Investment Banking | Mergers & Acquisitions | Capital Raising
Hyde Park Capital Advisors, LLC 701 N. Franklin Street
Tampa, FL 33602 Tel: 813-383-0202
www.hydeparkcapital.com
John Hill Senior Managing Director [email protected] (813) 383-0205 John McDonald Senior Managing Director [email protected] (813) 383-0206 Keith Hodgdon Managing Director [email protected] (813) 383-0208 Greg Bosl Vice President [email protected] (813) 597-2649 Jami Gold Vice President [email protected] (813) 383-0203 Charlie Hendrick Vice President [email protected] (813) 383-0207 Jeffrey Hendricks Vice President – Business Development [email protected] (678) 523-3073

HYDE PARK CAPITAL Investment Banking | Mergers & Acquisitions | Capital Raising
90%
100%
110%
120%
130%
140%
150%
Jun-16 Sep-16 Dec-16 Mar-17 Jun-17
S&P Global Information Technology Index Nasdaq S&P 500
Public Market Performance (LTM)
Select Technology Public Offerings (Q2 2017)
Market Performance by Sector
Source: S&P Capital IQ
2
Capital Markets Overview
The S&P Global Information Technology Index increased 34.1% during the twelve month period ended June 30, 2017, while the Nasdaq and the S&P 500 increased 26.3% and 15.2%, respectively.
IPO activity in the Technology industry increased during Q2 2017 after a slow 2016. Cloudera, Inc. (NYSE:CLDR), which operates a data management, machine learning, and analytics software platform, raised $225 million in the largest IPO of the quarter.
The Software-as-a-Service (SaaS), Software Bellwethers and Application Software (Horizontal) sectors were the industry’s leaders with respect to valuation during Q2 2017, trading at revenue multiples of 6.5x, 5.3x, and 5.2x, respectively.
Commentary
34.1%
15.2%
26.3%
Industry Sector 3 Months 12 months Revenue EBITDA
Software Bellwethers 4.4% 25.8% 5.3x 15.7x
Application Software (Horizontal) 4.8% 20.9% 5.2x 21.3x
Application Software (Vertical) 10.0% 18.8% 5.0x 18.5x
Software-as-a-Service (SaaS) 12.0% 25.1% 6.5x 39.5x
Data & Analytics 5.5% 18.7% 3.9x 17.3x
Infrastructure Services 2.7% 24.4% 4.1x 15.8x
Technology Hardware 0.0% 36.1% 1.1x 8.2x
IT Services 11.7% 18.7% 2.7x 13.7x
Internet 7.7% 33.2% 3.7x 19.7x
Resellers & Wholesalers 3.3% 30.8% 0.3x 9.4x
Median
Change in Stock Price Enterprise Value / LTM
Offer Date Issuer Industry Sector
Transaction
Type
Transaction
Value ($mm)
06/13/17 Apple, Inc. Technology Hardware Fixed Income $10,767
05/08/17 Intel Corp. Technology Hardware Fixed Income $7,090
05/04/17 GoDaddy, Inc. Internet Secondary $928
04/27/17 Cloudera, Inc. Internet IPO $225
04/06/17 Okta, Inc. Internet IPO $187
04/26/17 TrueCar, Inc. Internet Secondary $149
04/12/17 Yext, Inc. Internet IPO $116
05/24/17 Appian Corp. Software IPO $75
06/29/17 Tintri, Inc. Internet IPO $60
05/23/17 SMART Global Holdings, Inc. Technology Hardware IPO $58

HYDE PARK CAPITAL Investment Banking | Mergers & Acquisitions | Capital Raising
$53.0
$35.1
$22.3
$42.2
$47.6
$39.0
$42.4
$48.4$51.7
$47.0
$21.1 $21.5
$0
$10
$20
$30
$40
$50
$60
2007 2008 2009 2010 2011 2012 2013 2014 2015 2016 1H 2016 1H 2017
Deal Size Volume Value Volume Value Volume Value
Less than $100M 99 $3.3 75 $2.7 (24%) (18%)
$100 - $499M 43 $9.9 33 $7.0 (23%) (30%)
$500 - $1,000M 12 $7.9 16 $11.8 33% 50%
Total Middle Market 154 $21.1 124 $21.5 (19%) 2%
% of Total Market
Less than $100M 64% 16% 60% 13%
$100 - $499M 28% 47% 27% 32%
$500 - $1,000M 8% 37% 13% 55%
Total Middle Market 100% 100% 100% 100%
1H 2016 1H 2017 % Change
447
372
254
365 376
350
271
372 383
269
154
124
0
100
200
300
400
500
2007 2008 2009 2010 2011 2012 2013 2014 2015 2016 1H 2016 1H 2017
Middle Market M&A Transactions by Deal Size – Technology
U.S. Middle Market M&A Activity – Annual Trends: VOLUME U.S. Middle Market M&A Activity – Annual Trends: VALUE
Annual Middle Market M&A Activity – Technology
3
As detailed in the charts below, Middle Market M&A activity in the Technology industry fell during the first half of 2017 to 124 closed transactions, a 19% decline from the 154 transactions closed during the first half of 2016.
The total value of completed Middle Market M&A transactions
in the Technology industry increased by 2% during the first half of 2017 to $21.5 billion, up from $21.1 billion during the prior year period.
Transactions valued between $500 million and $1,000 million saw the largest increase in both deal volume (up 33%) and deal value (up 50%) compared to the prior year period.
Commentary
Source: S&P Capital IQ (middle market includes all closed deals with disclosed deal value between $10 million and $1 billion)
Less than $100M $100 - $499M $500 - $1,000MLess than $100M $100 - $499M $500 - $1,000M
To
tal T
ran
sact
ion
Vo
lum
e
To
tal T
ran
sact
ion
Val
ue
($ in
bil
lio
ns)
($ in billions)

HYDE PARK CAPITAL Investment Banking | Mergers & Acquisitions | Capital Raising
$11.2
$13.5$12.9
$11.8
$10.2
$13.1
$16.6
$10.9$10.2
$11.4
$14.6
$8.5
$13.0
$0.0
$2.0
$4.0
$6.0
$8.0
$10.0
$12.0
$14.0
$16.0
$18.0
Q2 '14 Q3 '14 Q4 '14 Q1 '15 Q2 '15 Q3'15 Q4'15 Q1 '16 Q2 '16 Q3 '16 Q4'16 Q1'17 Q2'17
93
84
98
93 94
82
114
83
71
52
63
52
72
0
20
40
60
80
100
120
Q2 '14 Q3 '14 Q4 '14 Q1 '15 Q2 '15 Q3'15 Q4'15 Q1 '16 Q2 '16 Q3 '16 Q4'16 Q1'17 Q2'17
Quarterly Middle Market M&A Activity – Technology
U.S. Middle Market M&A Activity – Quarterly Trends: VALUE U.S. Middle Market M&A Activity – Quarterly Trends: VOLUME
Middle Market M&A Transactions by Deal Size – Technology
4
Middle Market M&A activity in the Technology industry increased during Q2 2017 compared with Q2 2016. Deal volume rose 1% to 72 completed transactions in Q2 2017, while the total value of completed transactions increased 27% to $13.0 billion.
Transactions valued between $500 million and $1 billion saw the largest increase during Q2 2017, as deal volume increased 57% and total value of completed transactions jumped 71% compared with the prior year period.
The size of completed transactions increased during Q2 2017 as transactions valued between $100 million and $1 billion accounted for 43% of the completed deal volume, up from 38% during Q2 2016.
Source: S&P Capital IQ (middle market includes all closed deals with disclosed deal value between $10 million and $1 billion)
To
tal T
ran
sact
ion
Vo
lum
e
To
tal T
ran
sact
ion
Val
ue
($ in
bil
lio
ns)
Less than $100M $100 - $499M $500 - $1,000MLess than $100M $100 - $499M $500 - $1,000M
Commentary
($ in billions)
Deal Size Volume Value Volume Value Volume Value
Less than $100M 44 $1.4 41 $1.5 (7%) 8%
$100 - $499M 20 $4.3 20 $3.7 0% (13%)
$500 - $1,000M 7 $4.5 11 $7.8 57% 71%
Total Middle Market 71 $10.2 72 $13.0 1% 27%
% of Total Market
Less than $100M 62% 13% 57% 11%$100 - $499M 28% 42% 28% 29%$500 - $1,000M 10% 45% 15% 60%
Total Middle Market 100% 100% 100% 100%
Q2 2016 Q2 2017 % Change

HYDE PARK CAPITAL Investment Banking | Mergers & Acquisitions | Capital Raising
Recent M&A Activity – Technology
Select Announced M&A Transactions (Q2 2017)
5
Source: S&P Capital IQ.
Announced Date Target Buyer Industry
Enterprise
Value ($mm)
EV /
Revenue
EV /
EBITDA
06/29/17 Lapis Software Associates, LLC Scientific Games Corp. Software NA NA NA
06/28/17 PayLease, LLC Vista Equity Partners IT Services NA NA NA
06/28/17 Intrepid Pursuits, LLC Accenture plc Software NA NA NA
06/27/17 Night Flight Networks, LLC Innovativ Media Group, Inc. Internet NA NA NA
06/23/17 Synchronoss Technologies, Inc. Siris Capital Group Software $986.1 2.1x 18.2x
06/20/17 3SI Security Systems, Inc. LLR Partners Technology Hardware NA NA NA
06/16/17 Trooly, Inc. Airbnb, Inc. Internet NA NA NA
06/16/17 VRB Samsung Electronics Co., Ltd. Software NA NA NA
06/14/17 NexTraq, Inc. Michelin North America, Inc. Internet NA NA NA
06/13/17 ViaWest, Inc. Peak 10 Holding Corp. IT Services $1,675.0 NA NA
06/12/17 NextNine Ltd. Honeywell Intl., Inc. Software NA NA NA
06/08/17 Foodler, Inc. GrubHub, Inc. Software NA NA NA
06/08/17 Hexadite Ltd. Microsoft Corp. Internet NA NA NA
06/08/17 Sous, Inc. BlueCart, Inc. Software NA NA NA
06/06/17 Westcon Group, Inc. SYNNEX Corp. IT Services $921.2 NA 10.4x
06/05/17 Placed, Inc. Snap, Inc. Internet NA NA NA
06/02/17 Vyatta, Inc. AT&T, Inc. Software NA NA NA

HYDE PARK CAPITAL Investment Banking | Mergers & Acquisitions | Capital Raising
Announced Date Target Buyer Industry
Enterprise
Value ($mm)
EV /
Revenue
EV /
EBITDA
05/30/17The Yield Book Inc. /
Citigroup Index, LLCFTSE Intl. Ltd. Software $685.0 6.4x 14.9x
05/30/17 Xactly Corp. Vista Equity Partners Internet $532.7 5.5x NA
05/29/17 CardConnect Corp. First Data Corp. IT Services $716.3 1.2x 26.6x
05/23/17 GENBAND US, LLC Sonus Networks, Inc. Software $412.0 1.0x 17.5x
05/11/17 Active Corp. Garmin Ltd. Software NA NA NA
05/10/17 Dominion Web Solutions, LLCGoldman Sachs MBD /
Eurazeo Internet $680.0 NA NA
05/10/17 Craftsy, Inc. NBCUniversal Cable Entertainment Group Internet NA NA NA
05/10/17 Owlchemy Labs, LLC Alphabet, Inc. Software NA NA NA
05/09/17 LLamasoft, Inc. TPG Capital Software NA NA NA
05/03/17 Lexmark's Enterprise Software Business Thoma Bravo Software $1,350.0 0.3x NA
05/01/17 Angie's List, Inc. HomeAdvisor, Inc. Internet $574.4 1.8x 51.6x
05/01/17 Jive Software, Inc. Wave Systems Corp. Software $343.5 1.7x 69.1x
04/17/17 Wilcon Holdings, LLC Crown Castle Intl. Corp. IT Services $600.0 NA NA
04/17/17 American Traffic Solutions, Inc. Platinum Equity Technology Hardware NA NA NA
04/10/17 Xcerra Corp. Unic Capital Management Co., Ltd. Technology Hardware $463.1 1.4x 31.1x
04/10/17 RetailMeNot, Inc. Harland Clarke Holdings Corp. Internet $455.1 1.5x 14.8x
04/03/17 Telvent DTN, LLC TBG AG Software $900.0 4.2x NA
Recent M&A Activity – Technology
Select Announced M&A Transactions (Q2 2017)
6
Source: S&P Capital IQ.

HYDE PARK CAPITAL Investment Banking | Mergers & Acquisitions | Capital Raising
Q2 2016 Q2 2017
Q2 2016 Q2 2017
24
13
19
16
19
7
25
20
0 5 10 15 20 25 30
Technology Hardware
IT Services
Internet
Software*
$5.2
$1.8
$3.3
$2.7
$3.1
$0.3
$3.0
$3.8
$0.0 $1.0 $2.0 $3.0 $4.0 $5.0 $6.0
Technology Hardware
IT Services
Internet
Software*
M&A Activity by Technology Sector
% Change
% Change
U.S. Middle Market M&A Activity by Technology Sector: VALUE
7
U.S. Middle Market M&A Activity by Technology Sector: VOLUME
($ in millions)
24%
20%
30%
477%
68%
11%
86%
Source: S&P Capital IQ (includes all closed deals with disclosed deal value between $10 million and $1 billion). *Includes Enterprise Software and Infrastructure Software industry sectors.
26%

HYDE PARK CAPITAL Investment Banking | Mergers & Acquisitions | Capital Raising
Announced
Date Target Buyer Industry
Enterprise
Value ($mm)
06/28/17 PayLease, LLC Vista Equity Partners IT Services NA
06/23/17 Synchronoss Technologies, Inc. Siris Capital Group Software $986
06/22/17 Loci Controls, Inc. Turnbridge Capital Technology Hardware NA
06/21/17 ARI Network Services, Inc. True Wind Capital Internet $138
06/20/17 3SI Security Systems, Inc. LLR Partners Technology Hardware NA
06/07/17 Riskonnect, Inc. Thoma Bravo Internet NA
06/02/17 Sage Payment Solutions, Inc. GTCR Software $260
06/02/17By Light Professional IT
Services, Inc.Sagewind Capital IT Services NA
05/30/17 Xactly Corp. Vista Equity Partners Internet $533
05/10/17 Dominion Web Solutions, LLCGoldman Sachs MBD /
EurazeoInternet $680
05/09/17 LLamasoft, Inc. TPG Capital Software NA
05/05/17 Osurv, Inc. Tan Capital Partners Internet NA
05/03/17Lexmark's Enterprise Software
BusinessThoma Bravo Software $1,350
04/17/17 American Traffic Solutions, Inc. Platinum Equity Technology Hardware NA
04/12/17 Zyme Solutions, Inc. Insight Venture Partners Internet NA
04/12/17Bankruptcy Management
Solutions, Inc.Stone Point Capital Software NA
04/04/17 Global HR Research, LLC Renovo Capital Software $30
12
22
10
5
0
5
10
15
20
25
Software Internet IT Services Technology Hardware
Select Announced Private Equity Transactions (Q2 2017)
Financial Sponsors Industry Transactions
Private Equity Activity – Technology N
um
ber
of
Tra
nsa
ctio
ns
8
Financial sponsors were active across many sectors of the Technology industry during Q2 2017, as shown in the table to the right.
Several notable private equity backed deals were announced during the quarter, including: Thoma Bravo’s announced acquisition of Lexmark’s Enterprise Software Business for over $1.3 billion; Siris Capital Group’s proposed purchase of Synchronoss Technologies, Inc. for $986 million; and Vista Equity Partner’s announced acquisition of Xactly Corp. for $533 million.
During Q2 2017, financial sponsors were most active in the Internet and Software sectors, announcing 22 and 12 transactions, respectively.
Commentary
Source: S&P Capital IQ.

HYDE PARK CAPITAL Investment Banking | Mergers & Acquisitions | Capital Raising
90%
100%
110%
120%
130%
Jun-16 Sep-16 Dec-16 Mar-17 Jun-17
Application Software (Horizontal) S&P 500
90%
100%
110%
120%
130%
Jun-16 Sep-16 Dec-16 Mar-17 Jun-17
Application Software (Vertical) S&P 500
90%
100%
110%
120%
130%
140%
Jun-16 Sep-16 Dec-16 Mar-17 Jun-17
Software Bellwethers S&P 500
Industry Sector Overview – Recent Stock Price Performance
Application Software (Horizontal)
Commentary
9
Software Bellwethers
Application Software (Vertical)
Source: S&P Capital IQ.
The charts included on the following pages detail the recent stock price performance by sector for the leading public companies within the Technology industry for the 12-month period ended June 30, 2017. The shaded section represents Q2 2017.
During the 12-month period ending June 30, 2017, all sectors in the Technology industry had a positive performance, led by Technology Hardware, Internet and Value Added Resellers & Wholesalers which increased 36.1%, 33.2% and 30.8%, respectively.
All sectors within the Technology industry increased during Q2 2017. The IT Services, Application Software (vertical), and Internet sectors increased the most, rising 11.7%, 10.0% and 7.7%, respectively.
15.2%
25.8%
20.9%
15.2%
18.8%
15.2%

HYDE PARK CAPITAL Investment Banking | Mergers & Acquisitions | Capital Raising
90%
100%
110%
120%
130%
140%
Jun-16 Sep-16 Dec-16 Mar-17 Jun-17
Infrastructure Software S&P 500
90%
100%
110%
120%
130%
140%
150%
Jun-16 Sep-16 Dec-16 Mar-17 Jun-17
Technology Hardware S&P 500
90%
100%
110%
120%
130%
Jun-16 Sep-16 Dec-16 Mar-17 Jun-17
Data & Analytics S&P 500
90%
100%
110%
120%
130%
140%
Jun-16 Sep-16 Dec-16 Mar-17 Jun-17
Software-as-a-Service (SaaS) S&P 500
Industry Sector Overview – Recent Stock Price Performance
Infrastructure Software
Software-as-a-Service (SaaS)
10
Data & Analytics
Technology Hardware
Source: S&P Capital IQ.
24.4%
15.2%
15.2%
15.2%
15.2%
25.1% 18.7%
36.1%

HYDE PARK CAPITAL Investment Banking | Mergers & Acquisitions | Capital Raising
90%
100%
110%
120%
130%
140%
150%
Jun-16 Sep-16 Dec-16 Mar-17 Jun-17
Internet S&P 500
90%
100%
110%
120%
130%
Jun-16 Sep-16 Dec-16 Mar-17 Jun-17
IT Services S&P 500
Industry Sector Overview – Recent Stock Price Performance
IT Services
11
Internet
Source: S&P Capital IQ.
15.2%
15.2%
18.7% 33.2%
Value Added Resellers & Wholesalers
30.8%
15.2%
90%
100%
110%
120%
130%
140%
Jun-16 Sep-16 Dec-16 Mar-17 Jun-17
VARs & Wholesalers S&P 500

HYDE PARK CAPITAL Investment Banking | Mergers & Acquisitions | Capital Raising
Industry Sector Overview – Public Company Analysis
($ in millions, except per share)
12
Software Bellwethers
Source: S&P Capital IQ *Excluded from the average and median calculation.
Closing Price % of 52 Equity Enterprise
Company Ticker 6/30/17 Week High Value Value Revenue Gross Profit EBITDA Gross Profit EBITDA Revenue EBITDAGoogle, Inc. GOOG $908.73 92.0% $635,554 $547,052 $94,765 $57,480 $31,208 60.7% 32.9% 5.8x 17.5xMicrosoft Corp. MSFT $68.93 94.6% $541,945 $506,364 $87,247 $53,463 $28,800 61.3% 33.0% 5.8x 17.6xOracle Corp. ORCL $50.14 96.7% $211,440 $203,657 $37,728 $22,062 $14,669 58.5% 38.9% 5.4x 13.9xIBM Corp. IBM $153.83 84.2% $146,843 $179,055 $79,390 $37,381 $17,944 47.1% 22.6% 2.3x 10.0xSAP AG DB:SAP $104.78 95.3% $125,628 $126,459 $24,186 $16,919 $6,293 70.0% 26.0% 5.2x 20.1xCisco Systems, Inc. CSCO $31.30 90.5% $158,339 $122,835 $48,510 $30,778 $15,048 63.4% 31.0% 2.5x 8.2xsalesforce.com, Inc. CRM $86.60 94.1% $61,058 $60,374 $8,863 $6,475 $449 73.1% 5.1% 6.8x* 134.5x*HP, Inc. HPQ $17.48 89.3% $30,101 $30,701 $49,473 $9,094 $4,301 18.4% 8.7% 0.6x* 7.1x*
Average 92.1% $238,863 $222,062 $53,770 $29,207 $14,839 56.5% 24.8% 4.5x 14.5x
Median 93.0% $152,591 $152,757 $48,992 $26,420 $14,859 61.0% 28.5% 5.3x 15.7x
Enterprise Value /
LTM LTM Margins LTM

HYDE PARK CAPITAL Investment Banking | Mergers & Acquisitions | Capital Raising
Industry Sector Overview – Public Company Analysis
Communication Software
($ in millions, except per share)
13
Application Software (Horizontal)
Enterprise Software
Source: S&P Capital IQ *Excluded from the average and median calculation.
Closing Price % of 52 Equity Enterprise
Company Ticker 6/30/17 Week High Value Value Revenue Gross Profit EBITDA Gross Profit EBITDA Revenue EBITDA
Nuance Communications, Inc. NUAN $17.41 87.4% $4,972 $6,770 $1,971 $1,191 $414 60.4% 21.0% 3.4x 16.3x
BroadSoft, Inc. BSFT $43.05 88.9% $1,292 $1,196 $347 $252 $26 72.5% 7.5% 3.4x 45.8x
Synchronoss Technologies, Inc. SNCR $16.45 32.9% $717 $840 $477 $283 $54 59.3% 11.4% 1.8x 15.5x
MobileIron, Inc. MOBL $6.05 89.3% $531 $440 $168 $138 ($54) 81.9% (32.3%) 0.9x NA
Average 74.6% $1,878 $2,312 $741 $466 $110 68.5% 1.9% 2.9x 25.9x
Median 88.2% $1,004 $1,018 $412 $267 $40 66.5% 9.5% 3.4x 16.3x
Enterprise Value /
LTM LTM Margins LTM
Closing Price % of 52 Equity Enterprise
Company Ticker 6/30/17 Week High Value Value Revenue Gross Profit EBITDA Gross Profit EBITDA Revenue EBITDA
Oracle Corp. ORCL $50.14 96.7% $211,440 $206,463 $37,728 $22,062 $14,669 58.5% 38.9% 5.5x 14.1x
IBM Corp. IBM $153.83 84.2% $146,843 $179,055 $79,390 $37,381 $17,944 47.1% 22.6% 2.3x 10.0x
SAP SE DB:SAP $104.78 95.3% $125,628 $126,459 $24,186 $16,919 $6,293 70.0% 26.0% 5.2x 20.1x
Adobe Systems, Inc. ADBE $141.44 95.9% $71,000 $67,957 $6,526 $5,630 $2,141 86.3% 32.8% 10.4x* 31.7x
Intuit, Inc. NASDAQGS:INTU $132.81 92.4% $34,597 $33,504 $5,089 $4,306 $1,580 84.6% 31.0% 6.6x 21.2x
Constellation Software, Inc. TSX:CSU $521.99 93.6% $11,062 $10,937 $2,193 $822 $431 37.5% 19.6% 5.0x 25.4x
Sage Group plc LSE:SGE $8.94 85.2% $9,689 $10,112 $2,160 $2,016 $619 93.3% 28.7% 4.7x 16.3x
Open Text Corp. OTEX $31.54 89.6% $7,896 $10,067 $2,111 $1,521 $594 72.0% 28.1% 4.8x 16.9x
TOTVS S.A. BOVESPA:TOTS3 $9.12 90.2% $1,499 $1,625 $694 $416 $80 59.9% 11.5% 2.3x 20.3x
Average 91.5% $68,850 $71,798 $17,786 $10,119 $4,928 67.7% 26.6% 4.5x 19.6x
Median 92.4% $34,597 $33,504 $5,089 $4,306 $1,580 70.0% 28.1% 4.9x 20.1x
Enterprise Value /
LTM LTM Margins LTM

HYDE PARK CAPITAL Investment Banking | Mergers & Acquisitions | Capital Raising
Industry Sector Overview – Public Company Analysis
Human Capital Management (HCM)
($ in millions, except per share)
14
Application Software (Horizontal)
Marketing Software
Source: S&P Capital IQ
Closing Price % of 52 Equity Enterprise
Company Ticker 6/30/17 Week High Value Value Revenue Gross Profit EBITDA Gross Profit EBITDA Revenue EBITDA
salesforce.com, Inc. CRM $86.60 94.1% $61,058 $60,374 $8,863 $6,475 $449 73.1% 5.1% 6.8x 134.5x
Criteo SA CRTO $49.05 87.6% $3,249 $3,045 $1,915 $684 $179 35.7% 9.3% 1.6x 17.0x
HubSpot, Inc. HUBS $65.75 83.8% $2,339 $2,217 $294 $229 ($36) 77.9% (12.2%) 7.5x NA
Callidus Software, Inc. CALD $24.20 97.4% $1,471 $1,287 $216 $134 ($8) 61.7% (3.5%) 5.9x NA
Bazaarvoice, Inc. BV $4.95 80.7% $411 $352 $201 $125 ($5) 62.0% (2.4%) 1.7x NA
ChannelAdvisor Corp. ECOM $11.55 72.6% $298 $236 $115 $88 ($7) 76.1% (6.4%) 2.0x NA
Average 86.0% $11,471 $11,252 $1,934 $1,289 $95 64.4% (1.7%) 4.3x 75.8x
Median 85.7% $1,905 $1,752 $255 $181 ($6) 67.5% (3.0%) 4.0x 75.8x
Enterprise Value /
LTM LTM Margins LTM
Closing Price % of 52 Equity Enterprise
Company Ticker 6/30/17 Week High Value Value Revenue Gross Profit EBITDA Gross Profit EBITDA Revenue EBITDA
Paychex, Inc. PAYX $56.94 90.3% $20,646 $20,298 $3,151 $2,232 $1,367 70.8% 43.4% 6.4x 14.9x
Workday, Inc. WDAY $97.00 92.6% $19,452 $17,878 $1,702 $1,190 ($242) 69.9% (14.2%) 10.5x NA
The Ultimate Software Group, Inc. ULTI $210.06 93.1% $6,409 $6,334 $823 $505 $63 61.4% 7.6% 7.7x 101.0x
Paycom Software, Inc. PAYC $68.41 92.9% $4,037 $3,975 $359 $306 $79 85.3% 22.1% 11.1x 50.1x
Paylocity Holding Corp. PCTY $45.18 91.0% $2,319 $2,218 $284 $166 $17 58.6% 5.8% 7.8x 133.7x
Cornerstone OnDemand, Inc. CSOD $35.75 74.9% $2,004 $1,954 $435 $297 ($42) 68.3% (9.6%) 4.5x NA
Benefitfocus, Inc. BNFT $36.35 80.8% $1,089 $1,140 $243 $120 ($13) 49.3% (5.4%) 4.7x NA
Xactly Corp. XTLY $15.65 97.2% $487 $455 $97 $59 ($12) 61.3% (12.6%) 4.7x NA
Average 89.1% $7,055 $6,781 $887 $609 $152 65.6% 4.6% 7.2x 74.9x
Median 91.8% $3,178 $3,097 $397 $302 $2 64.8% 0.2% 7.1x 75.6x
Enterprise Value /
LTM LTM Margins LTM

HYDE PARK CAPITAL Investment Banking | Mergers & Acquisitions | Capital Raising
Industry Sector Overview – Public Company Analysis
PLM & Engineering Software
($ in millions, except per share)
15
Application Software (Horizontal)
Supply Chain & Logistics Software
Source: S&P Capital IQ *Excluded from the average and median calculation.
Closing Price % of 52 Equity Enterprise
Company Ticker 6/30/17 Week High Value Value Revenue Gross Profit EBITDA Gross Profit EBITDA Revenue EBITDA
Manhattan Associates, Inc. MANH $48.06 70.7% $3,430 $3,329 $598 $351 $202 58.8% 33.8% 5.6x 16.5x
The Descartes Systems Group, Inc. TSX:DSG $24.28 92.0% $1,859 $1,804 $209 $153 $70 72.9% 33.5% 8.6x 25.8x
Kinaxis, Inc. TSX:KXS $62.12 87.8% $1,623 $1,481 $121 $83 $20 68.7% 16.7% 12.2x 73.1x
SPS Commerce, Inc. SPSC $63.76 85.2% $1,105 $951 $200 $133 $21 66.5% 10.5% 4.8x 45.2x
Amber Road, Inc. AMBR $8.57 69.7% $231 $239 $75 $39 ($12) 51.7% (15.6%) 3.2x NA
Park City Group, Inc. PCYG $12.15 71.5% $243 $233 $18 $13 $4 72.7% 23.2% 13.3x 57.1x
American Software, Inc. AMSW.A $10.29 85.1% $304 $219 $106 $55 $14 51.9% 13.6% 2.1x 15.2x
SciQuest, Inc. SQI $51.15 94.8% $209 $214 $202 $68 $16 33.9% 8.0% 1.1x 13.2x
Average 82.1% $1,125 $1,059 $191 $112 $42 59.6% 15.5% 6.3x 35.1x
Median 85.1% $705 $595 $161 $76 $18 62.7% 15.1% 5.2x 25.8x
Enterprise Value /
LTM LTM Margins LTM
Closing Price % of 52 Equity Enterprise
Company Ticker 6/30/17 Week High Value Value Revenue Gross Profit EBITDA Gross Profit EBITDA Revenue EBITDA
Autodesk, Inc. ADSK $100.82 87.9% $22,339 $22,019 $2,005 $1,671 ($294) 83.3% (14.7%) 11.0x NA
Dassault Systèmes SE ENXTPA:DSY $89.55 91.9% $23,052 $21,096 $3,340 $2,836 $897 84.9% 26.9% 6.3x 23.5x
Synopsys, Inc. SNPS $72.93 95.2% $11,278 $10,564 $2,582 $2,070 $497 80.2% 19.3% 4.1x 21.2x
Ansys, Inc. ANSS $121.68 93.7% $10,739 $9,872 $1,016 $906 $455 89.2% 44.8% 9.7x 21.7x
Cadence Design Systems, Inc. CDNS $33.49 93.8% $9,539 $9,685 $1,845 $1,589 $408 86.1% 22.1% 5.2x 23.7x
PTC, Inc. NASDAQGS:PTC $55.12 91.5% $6,349 $6,794 $1,143 $814 $91 71.2% 7.9% 5.9x 75.0x*
Aspen Technology, Inc. AZPN $55.26 85.9% $4,347 $4,385 $473 $426 $218 90.0% 46.2% 9.3x 20.1x
Nemetschek SE XTRA:NEM $74.39 91.5% $2,864 $2,855 $382 $200 $83 52.2% 21.6% 7.5x 34.5x
AVEVA Group plc LSE:AVV $25.20 90.3% $1,616 $1,452 $270 $252 $65 93.4% 24.2% 5.4x 22.2x
Average 91.3% $10,236 $9,858 $1,451 $1,196 $269 81.2% 22.0% 7.2x 23.9x
Median 91.5% $9,539 $9,685 $1,143 $906 $218 84.9% 22.1% 6.3x 22.2x
Enterprise Value /
LTM LTM Margins LTM

HYDE PARK CAPITAL Investment Banking | Mergers & Acquisitions | Capital Raising
Industry Sector Overview – Public Company Analysis
Energy Software
($ in millions, except per share)
16
Application Software (Vertical)
Financial Software
Source: S&P Capital IQ *Excluded from the average and median calculation.
Closing Price % of 52 Equity Enterprise
Company Ticker 6/30/17 Week High Value Value Revenue Gross Profit EBITDA Gross Profit EBITDA Revenue EBITDA
Fidelity National Information Services, Inc. FIS $85.40 97.8% $28,310 $37,222 $9,315 $3,053 $2,383 32.8% 25.6% 4.0x 15.6x
Fiserv, Inc. FISV $122.34 96.3% $27,144 $31,474 $5,568 $2,591 $1,742 46.5% 31.3% 5.7x 18.1x
MSCI, Inc. MSCI $102.99 94.2% $9,727 $11,106 $1,173 $917 $587 78.1% 50.0% 9.5x* 18.9x
SS&C Technologies Holdings, Inc. SSNC $38.41 97.7% $7,957 $10,292 $1,565 $724 $556 46.2% 35.6% 6.6x 18.5x
Jack Henry & Associates, Inc. JKHY $103.87 97.6% $8,160 $8,167 $1,414 $609 $505 43.1% 35.7% 5.8x 16.2x
Black Knight Financial Services, Inc. BKFS $40.95 97.0% $2,784 $5,296 $1,042 $462 $350 44.3% 33.6% 5.1x 15.1x
Envestnet, Inc. ENV $39.60 95.5% $1,704 $1,950 $604 $170 $51 28.1% 8.5% 3.2x 38.1x*
Q2 Holdings, Inc. QTWO $36.95 91.2% $1,480 $1,398 $161 $79 ($19) 48.8% (11.6%) 8.7x NA
Bottomline Technologies, Inc. EPAY $25.69 90.6% $974 $1,013 $344 $188 $29 54.8% 8.5% 2.9x 34.6x*
Average 95.3% $9,804 $11,991 $2,354 $977 $687 47.0% 24.1% 5.2x 17.1x
Median 96.3% $7,957 $8,167 $1,173 $609 $505 46.2% 31.3% 5.4x 17.1x
Enterprise Value /
LTM LTM Margins LTM
Closing Price % of 52 Equity Enterprise
Company Ticker 6/30/17 Week High Value Value Revenue Gross Profit EBITDA Gross Profit EBITDA Revenue EBITDA
AVEVA Group plc LSE:AVV $25.20 90.3% $1,616 $1,452 $270 $252 $65 93.4% 24.2% 5.4x 22.2x
Pason Systems, Inc. TSX:PSI $14.88 86.5% $1,258 $1,135 $130 $72 $25 55.2% 18.9% 8.7x 46.1x
Silver Spring Networks, Inc. SSNI $11.28 73.2% $585 $469 $313 $138 ($12) 44.2% (3.9%) 1.5x NA
EnerNOC, Inc. ENOC $7.75 100.0% $229 $273 $399 $158 ($0) 39.5% (0.1%) 0.7x* NA
Average 87.5% $922 $832 $278 $155 $19 58.1% 9.8% 5.2x 34.2x
Median 88.4% $922 $802 $291 $148 $12 49.7% 9.4% 5.4x 34.2x
Enterprise Value /
LTM LTM Margins LTM

HYDE PARK CAPITAL Investment Banking | Mergers & Acquisitions | Capital Raising
Industry Sector Overview – Public Company Analysis
Healthcare IT
($ in millions, except per share)
17
Application Software (Vertical)
Public Sector / Non-Profit Software
Source: S&P Capital IQ *Excluded from the average and median calculation.
Closing Price % of 52 Equity Enterprise
Company Ticker 6/30/17 Week High Value Value Revenue Gross Profit EBITDA Gross Profit EBITDA Revenue EBITDA
Constellation Software, Inc. TSX:CSU $521.99 93.6% $11,062 $10,937 $2,193 $822 $431 37.5% 19.6% 5.0x 25.4x
Tyler Technologies, Inc. TYL $175.67 98.6% $6,838 $6,754 $776 $368 $168 47.4% 21.7% 8.7x 40.1x
Blackbaud, Inc. BLKB $85.75 92.5% $4,066 $4,409 $745 $402 $127 53.9% 17.0% 5.9x 34.8x
2U, Inc. TWOU $46.92 96.9% $2,202 $2,073 $223 $181 ($18) 81.0% (8.3%) 9.3x NA
NIC, Inc. EGOV $18.95 73.2% $1,252 $1,128 $323 $133 $84 41.1% 26.0% 3.5x 13.4x
Instructure, Inc. INST $29.50 98.0% $832 $793 $122 $87 ($49) 71.2% (40.5%) 6.5x NA
K12, Inc. LRN $17.92 84.6% $702 $533 $894 $333 $42 37.2% 4.7% 0.6x 12.7x
Average 91.1% $3,850 $3,804 $754 $332 $112 52.8% 5.8% 5.6x 25.3x
Median 93.6% $2,202 $2,073 $745 $333 $84 47.4% 17.0% 5.9x 25.4x
Enterprise Value /
LTM LTM Margins LTM
Closing Price % of 52 Equity Enterprise
Company Ticker 6/30/17 Week High Value Value Revenue Gross Profit EBITDA Gross Profit EBITDA Revenue EBITDA
Cerner Corp. CERN $66.47 95.9% $22,681 $22,699 $4,827 $4,116 $1,351 85.3% 28.0% 4.7x 16.8x
Veeva Systems, Inc. VEEV $61.31 90.1% $9,130 $8,466 $582 $401 $141 68.8% 24.3% 14.5x* 59.9x*
athenahealth, Inc. ATHN $140.55 94.0% $5,657 $5,843 $1,112 $567 $112 51.0% 10.1% 5.3x 52.0x*
Medidata Solutions, Inc. MDSO $78.20 95.8% $4,506 $4,408 $486 $367 $72 75.6% 14.9% 9.1x 60.9x*
Allscripts Healthcare Solutions, Inc. MDRX $12.76 84.1% $2,351 $4,014 $1,618 $795 $153 49.2% 9.5% 2.5x 26.2x
Inovalon Holdings, Inc. INOV $13.15 65.6% $1,961 $1,687 $433 $278 $81 64.1% 18.8% 3.9x 20.8x
HMS Holdings Corp. HMSY $18.50 77.1% $1,614 $1,644 $484 $170 $91 35.2% 18.8% 3.4x 18.1x
Quality Systems, Inc. QSII $17.21 98.1% $1,067 $1,046 $510 $286 $59 56.2% 11.5% 2.1x 17.8x
Press Ganey Holdings, Inc. PGND $74.49 88.5% $322 $367 $130 $64 $16 49.7% 12.1% 2.8x 23.5x
Average 87.7% $5,477 $5,575 $1,131 $783 $231 59.5% 16.4% 4.2x 20.5x
Median 90.1% $2,351 $4,014 $510 $367 $91 56.2% 14.9% 3.6x 19.4x
Enterprise Value /
LTM LTM Margins LTM

HYDE PARK CAPITAL Investment Banking | Mergers & Acquisitions | Capital Raising
Industry Sector Overview – Public Company Analysis
($ in millions, except per share)
18
Software-as-a-Service (SAAS)
Source: S&P Capital IQ *Excluded from the average and median calculation.
Closing Price % of 52 Equity Enterprise
Company Ticker 6/30/17 Week High Value Value Revenue Gross Profit EBITDA Gross Profit EBITDA Revenue EBITDAsalesforce.com, Inc. CRM $86.60 94.1% $61,058 $60,374 $8,863 $6,475 $449 73.1% 5.1% 6.8x 134.5x*Workday, Inc. WDAY $97.00 92.6% $19,452 $17,878 $1,702 $1,190 ($242) 69.9% (14.2%) 10.5x NAServiceNow, Inc. NOW $106.00 95.8% $17,617 $17,159 $1,501 $1,081 ($49) 72.0% (3.3%) 11.4x NAVeeva Systems, Inc. VEEV $61.31 90.1% $9,130 $8,466 $582 $401 $141 68.8% 24.3% 14.5x* 59.9xAtlassian Corporation Plc TEAM $35.18 92.8% $7,717 $7,213 $573 $470 ($9) 81.9% (1.6%) 12.6x* NAThe Ultimate Software Group, Inc. ULTI $210.06 93.1% $6,409 $6,334 $823 $505 $63 61.4% 7.6% 7.7x 101.0x*athenahealth, Inc. ATHN $140.55 94.0% $5,720 $5,929 $1,151 $595 $128 51.7% 11.1% 5.1x 46.4xGuidewire Software, Inc. GWRE $68.71 97.7% $5,170 $4,692 $474 $297 $25 62.7% 5.3% 9.9x 185.1x*Medidata Solutions, Inc. MDSO $78.20 95.8% $4,564 $4,468 $509 $387 $77 76.1% 15.1% 8.8x 58.2xPaycom Software, Inc. PAYC $68.41 92.9% $4,037 $3,975 $359 $306 $79 85.3% 22.1% 11.1x 50.1xProofpoint, Inc. PFPT $86.83 92.0% $3,681 $3,640 $410 $294 ($33) 71.7% (8.2%) 8.9x NARealPage, Inc. RP $35.95 94.0% $2,837 $2,898 $593 $342 $89 57.7% 15.0% 4.9x 32.7xLogMeIn, Inc. LOGM $104.50 84.3% $3,126 $2,859 $444 $371 $71 83.5% 16.0% 6.4x 40.2xRingCentral, Inc. RNG $36.55 93.7% $2,691 $2,542 $405 $307 ($12) 75.9% (3.0%) 6.3x NAHubSpot, Inc. HUBS $65.75 83.8% $2,339 $2,217 $294 $229 ($36) 77.9% (12.2%) 7.5x NACornerstone OnDemand, Inc. CSOD $38.06 87.7% $2,084 $2,051 $389 $265 ($54) 67.9% (13.9%) 5.3x NAEbix, Inc. EBIX $53.90 82.8% $1,753 $1,952 $306 $216 $111 70.4% 36.3% 6.4x 17.5xAlarm.Com Holdings, Inc. ALRM $37.63 97.7% $1,815 $1,826 $276 $171 $47 62.0% 17.0% 6.6x 38.8xZendesk, Inc. ZEN $31.86 64.3% $1,456 $1,624 $608 $338 $133 55.6% 21.8% 2.7x 12.2xCyberArk Software Ltd. CYBR $49.95 84.3% $1,795 $1,508 $229 $196 $42 85.6% 18.5% 6.6x 35.6xQ2 Holdings, Inc. QTWO $36.95 91.2% $1,480 $1,398 $161 $79 ($19) 48.8% (11.6%) 8.7x NAQualys, Inc. QLYS $40.80 92.0% $1,576 $1,331 $205 $160 $49 77.9% 23.9% 6.5x 27.2xCallidus Software Inc. CALD $24.20 97.4% $1,471 $1,287 $216 $134 ($8) 61.7% (3.5%) 5.9x NABenefitfocus, Inc. BNFT $36.35 80.8% $1,089 $1,140 $243 $120 ($13) 49.3% (5.4%) 4.7x NASPS Commerce, Inc. SPSC $63.76 85.2% $1,105 $951 $200 $133 $21 66.5% 10.5% 4.8x 45.2xBazaarvoice, Inc. BV $4.95 80.7% $411 $352 $201 $125 ($5) 62.0% (2.4%) 1.7x NA
Average 89.6% $6,599 $6,387 $835 $584 $40 68.4% 6.6% 6.9x 38.7x
Median 92.3% $2,764 $2,701 $407 $302 $34 69.4% 6.5% 6.5x 39.5x
Enterprise Value /
LTM LTM Margins LTM

HYDE PARK CAPITAL Investment Banking | Mergers & Acquisitions | Capital Raising
Industry Sector Overview – Public Company Analysis
($ in millions, except per share)
19
Data & Analytics
Source: S&P Capital IQ *Excluded from the average and median calculation.
Closing Price % of 52 Equity Enterprise
Company Ticker 6/30/17 Week High Value Value Revenue Gross Profit EBITDA Gross Profit EBITDA Revenue EBITDA
Splunk, Inc. SPLK $56.89 82.2% $7,708 $6,704 $1,006 $797 ($288) 79.2% (28.7%) 6.7x* NA
Pegasystems, Inc. PEGA $58.35 90.0% $4,691 $4,543 $795 $544 $81 68.4% 10.2% 5.7x 55.8x*
Tableau Software, Inc. DATA $61.27 91.3% $4,660 $3,706 $855 $752 ($98) 87.9% (11.4%) 4.3x NA
Teradata Corp. NYSE:TDC $29.49 88.5% $3,885 $3,282 $2,268 $1,150 $337 50.7% 14.9% 1.4x 9.7x
Verint Systems, Inc. VRNT $40.70 91.1% $2,550 $2,968 $1,078 $683 $103 63.3% 9.5% 2.8x 28.8x
Inovalon Holdings, Inc. INOV $13.15 65.6% $1,961 $1,687 $433 $278 $81 64.1% 18.8% 3.9x 20.8x
MicroStrategy, Inc. MSTR $191.67 92.5% $2,213 $1,594 $514 $420 $115 81.8% 22.4% 3.1x 13.8x
PROS Holdings, Inc. PRO $27.39 89.8% $838 $845 $155 $91 ($56) 58.7% (36.0%) 5.4x NA
Average 86.4% $3,563 $3,166 $888 $589 $34 69.3% (0.0%) 3.8x 18.3x
Median 89.9% $3,218 $3,125 $825 $613 $81 66.3% 9.9% 3.9x 17.3x
Enterprise Value /
LTM LTM Margins LTM

HYDE PARK CAPITAL Investment Banking | Mergers & Acquisitions | Capital Raising
Industry Sector Overview – Public Company Analysis
IT Operations & Management
($ in millions, except per share)
20
Data Storage
Infrastructure Services
Source: S&P Capital IQ *Excluded from the average and median calculation.
Closing Price % of 52 Equity Enterprise
Company Ticker 6/30/17 Week High Value Value Revenue Gross Profit EBITDA Gross Profit EBITDA Revenue EBITDA
VMware, Inc. VMW $87.43 89.2% $37,070 $30,585 $7,093 $6,040 $1,850 85.2% 26.1% 4.3x 16.5x
ServiceNow, Inc. NOW $106.00 95.8% $17,617 $17,159 $1,501 $1,081 ($49) 72.0% (3.3%) 11.4x* NA
Red Hat, Inc. RHT $95.75 95.0% $17,462 $16,574 $2,521 $2,150 $433 85.3% 17.2% 6.6x 38.3x
CA, Inc. NASDAQGS:CA $34.47 94.3% $14,305 $14,462 $4,036 $3,463 $1,258 85.8% 31.2% 3.6x 11.5x
Citrix Systems, Inc. CTXS $79.58 83.0% $12,549 $12,592 $3,422 $2,919 $1,011 85.3% 29.6% 3.7x 12.5x
Arista Networks, Inc. ANET $149.79 91.9% $11,166 $10,162 $1,222 $782 $287 64.0% 23.5% 8.3x 35.4x
Micro Focus International plc LSE:MCRO $29.49 84.9% $6,878 $8,491 $1,325 $1,185 $500 89.4% 37.7% 6.4x 17.0x
F5 Networks, Inc. FFIV $127.06 85.0% $8,416 $7,402 $2,056 $1,714 $626 83.3% 30.4% 3.6x 11.8x
Pegasystems, Inc. PEGA $58.35 90.0% $4,691 $4,543 $795 $544 $81 68.4% 10.2% 5.7x 55.8x
Software AG XTRA:SOW $43.75 88.4% $3,332 $3,232 $932 $706 $271 75.8% 29.1% 3.5x 11.9x
NetScout Systems, Inc. NTCT $34.40 89.4% $3,196 $3,054 $1,162 $817 $227 70.3% 19.6% 2.6x 13.4x
New Relic, Inc. NEWR $43.01 94.9% $2,224 $2,018 $263 $213 ($49) 81.0% (18.8%) 7.7x NA
Progress Software Corp. PRGS $30.89 95.1% $1,500 $1,366 $404 $353 $129 87.4% 31.8% 3.4x 10.6x
Radware Ltd. RDWR $17.54 95.7% $764 $594 $197 $161 $1 81.7% 0.3% 3.0x 949.6x*
Average 90.9% $10,084 $9,445 $1,924 $1,581 $470 79.6% 18.9% 4.8x 21.3x
Median 90.9% $7,647 $7,946 $1,274 $949 $279 82.5% 24.8% 3.7x 13.4x
Enterprise Value /
LTM LTM Margins LTM
Closing Price % of 52 Equity Enterprise
Company Ticker 6/30/17 Week High Value Value Revenue Gross Profit EBITDA Gross Profit EBITDA Revenue EBITDA
Iron Mountain, Inc. IRM $34.36 82.8% $8,946 $15,062 $3,700 $2,051 $1,157 55.4% 31.3% 4.1x 13.0x
NetApp, Inc. NTAP $40.05 92.8% $11,254 $8,326 $5,519 $3,390 $904 61.4% 16.4% 1.5x 9.2x
Brocade Communications Systems, Inc. BRCD $12.61 99.3% $5,227 $5,479 $2,382 $1,522 $361 63.9% 15.2% 2.3x 15.2x
Box, Inc. BOX $18.24 87.2% $2,355 $2,251 $426 $309 ($117) 72.5% (27.4%) 5.3x NA
CommVault Systems, Inc. CVLT $56.45 95.7% $2,632 $2,182 $651 $565 $10 86.9% 1.6% 3.4x 213.7x*
Barracuda Networks, Inc. CUDA $23.06 86.4% $1,235 $1,039 $353 $269 $38 76.2% 10.8% 2.9x 27.3x
Carbonite, Inc. CARB $21.80 88.6% $597 $594 $216 $152 $11 70.6% 5.3% 2.8x 51.7x
Average 90.4% $4,607 $4,991 $1,892 $1,180 $338 69.6% 7.6% 3.2x 23.3x
Median 88.6% $2,632 $2,251 $651 $565 $38 70.6% 10.8% 2.9x 15.2x
Enterprise Value /
LTM LTM Margins LTM
HYDE PARK CAPITAL Investment Banking | Mergers & Acquisitions | Capital Raising
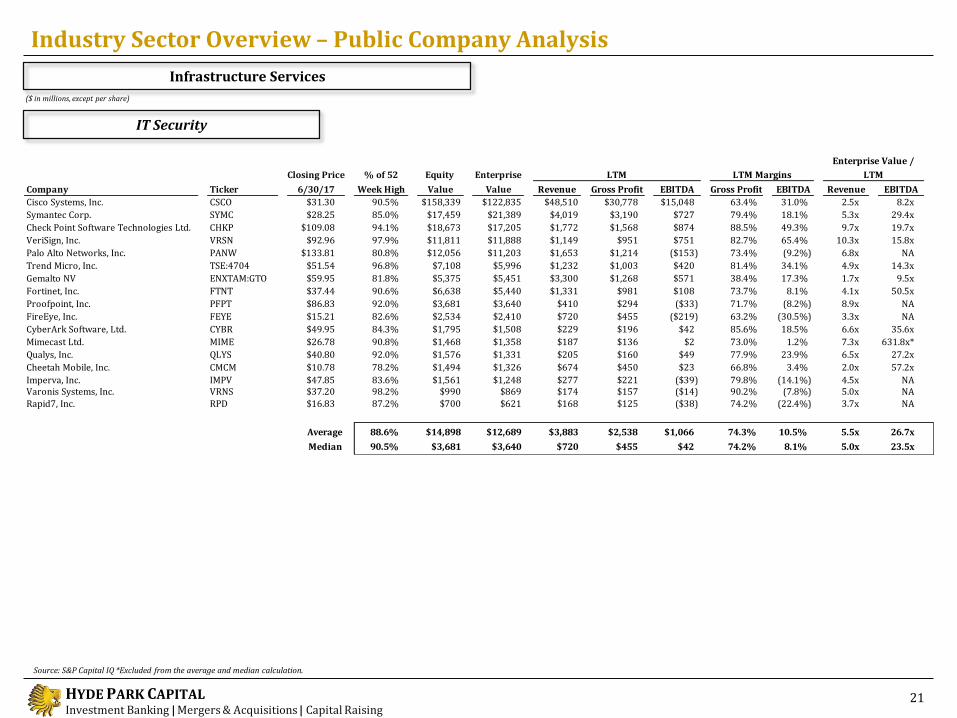
Industry Sector Overview – Public Company Analysis
IT Security
($ in millions, except per share)
21
Infrastructure Services
Source: S&P Capital IQ *Excluded from the average and median calculation.
Closing Price % of 52 Equity Enterprise
Company Ticker 6/30/17 Week High Value Value Revenue Gross Profit EBITDA Gross Profit EBITDA Revenue EBITDA
Cisco Systems, Inc. CSCO $31.30 90.5% $158,339 $122,835 $48,510 $30,778 $15,048 63.4% 31.0% 2.5x 8.2x
Symantec Corp. SYMC $28.25 85.0% $17,459 $21,389 $4,019 $3,190 $727 79.4% 18.1% 5.3x 29.4x
Check Point Software Technologies Ltd. CHKP $109.08 94.1% $18,673 $17,205 $1,772 $1,568 $874 88.5% 49.3% 9.7x 19.7x
VeriSign, Inc. VRSN $92.96 97.9% $11,811 $11,888 $1,149 $951 $751 82.7% 65.4% 10.3x 15.8x
Palo Alto Networks, Inc. PANW $133.81 80.8% $12,056 $11,203 $1,653 $1,214 ($153) 73.4% (9.2%) 6.8x NA
Trend Micro, Inc. TSE:4704 $51.54 96.8% $7,108 $5,996 $1,232 $1,003 $420 81.4% 34.1% 4.9x 14.3x
Gemalto NV ENXTAM:GTO $59.95 81.8% $5,375 $5,451 $3,300 $1,268 $571 38.4% 17.3% 1.7x 9.5x
Fortinet, Inc. FTNT $37.44 90.6% $6,638 $5,440 $1,331 $981 $108 73.7% 8.1% 4.1x 50.5x
Proofpoint, Inc. PFPT $86.83 92.0% $3,681 $3,640 $410 $294 ($33) 71.7% (8.2%) 8.9x NA
FireEye, Inc. FEYE $15.21 82.6% $2,534 $2,410 $720 $455 ($219) 63.2% (30.5%) 3.3x NA
CyberArk Software, Ltd. CYBR $49.95 84.3% $1,795 $1,508 $229 $196 $42 85.6% 18.5% 6.6x 35.6x
Mimecast Ltd. MIME $26.78 90.8% $1,468 $1,358 $187 $136 $2 73.0% 1.2% 7.3x 631.8x*
Qualys, Inc. QLYS $40.80 92.0% $1,576 $1,331 $205 $160 $49 77.9% 23.9% 6.5x 27.2x
Cheetah Mobile, Inc. CMCM $10.78 78.2% $1,494 $1,326 $674 $450 $23 66.8% 3.4% 2.0x 57.2x
Imperva, Inc. IMPV $47.85 83.6% $1,561 $1,248 $277 $221 ($39) 79.8% (14.1%) 4.5x NAVaronis Systems, Inc. VRNS $37.20 98.2% $990 $869 $174 $157 ($14) 90.2% (7.8%) 5.0x NARapid7, Inc. RPD $16.83 87.2% $700 $621 $168 $125 ($38) 74.2% (22.4%) 3.7x NA
Average 88.6% $14,898 $12,689 $3,883 $2,538 $1,066 74.3% 10.5% 5.5x 26.7x
Median 90.5% $3,681 $3,640 $720 $455 $42 74.2% 8.1% 5.0x 23.5x
Enterprise Value /
LTM LTM Margins LTM

HYDE PARK CAPITAL Investment Banking | Mergers & Acquisitions | Capital Raising
Industry Sector Overview – Public Company Analysis
PCs, Servers & Components
($ in millions, except per share)
22
Electronic Manufacturing Services
Technology Hardware
Source: S&P Capital IQ *Excluded from the average and median calculation.
Closing Price % of 52 Equity Enterprise
Company Ticker 6/30/17 Week High Value Value Revenue Gross Profit EBITDA Gross Profit EBITDA Revenue EBITDA
Apple, Inc. AAPL $144.02 91.9% $772,516 $804,130 $220,457 $84,686 $69,715 38.4% 31.6% 3.6x 11.5x
Samsung Electronics Co., Ltd. KOSE:A005930 $2,075.55 98.5% $309,256 $261,549 $181,252 $75,649 $46,603 41.7% 25.7% 1.4x 5.6x
International Business Machines Corp. IBM $153.83 84.2% $146,843 $179,055 $79,390 $37,381 $17,944 47.1% 22.6% 2.3x 10.0x
Hewlett-Packard Co. HPQ $17.48 89.3% $30,101 $30,701 $49,473 $9,094 $4,301 18.4% 8.7% 0.6x 7.1x
Xerox Corp. XRX $28.73 69.4% $7,286 $11,496 $10,610 $4,197 $1,490 39.6% 14.0% 1.1x 7.7x
NCR Corp. NCR $40.84 81.8% $5,175 $8,897 $6,577 $1,819 $872 27.7% 13.3% 1.4x 10.2x
Lenovo Group, Ltd. SEHK:992 $0.63 87.6% $6,960 $7,344 $43,035 $6,106 $963 14.2% 2.2% 0.2x 7.6x
Pitney Bowes, Inc. PBI $15.10 78.1% $2,830 $5,331 $3,399 $1,875 $747 55.2% 22.0% 1.6x 7.1x
Diebold, Inc. DBD $28.00 87.9% $2,006 $3,697 $3,910 $933 $246 23.9% 6.3% 0.9x 15.1x*
ScanSource, Inc. SCSC $40.30 89.7% $1,032 $1,083 $3,528 $366 $109 10.4% 3.1% 0.3x 9.9x
Average 85.8% $128,400 $131,328 $60,163 $22,211 $14,299 31.6% 15.0% 1.3x 8.5x
Median 87.7% $7,123 $10,196 $26,822 $5,151 $1,227 33.0% 13.7% 1.2x 7.7x
Enterprise Value /
LTM LTM Margins LTM
Closing Price % of 52 Equity Enterprise
Company Ticker 6/30/17 Week High Value Value Revenue Gross Profit EBITDA Gross Profit EBITDA Revenue EBITDA
Flextronics International, Ltd. FLEX $16.31 91.8% $8,909 $10,064 $23,863 $1,653 $1,228 6.9% 5.1% 0.4x 8.2x
Jabil Circuit, Inc. JBL $29.19 92.1% $5,485 $6,940 $18,471 $1,443 $1,257 7.8% 6.8% 0.4x 5.5x
Sanmina-SCI Corp. SANM $38.10 92.4% $2,960 $2,924 $6,738 $519 $347 7.7% 5.1% 0.4x 8.4x
TTM Technologies, Inc. TTMI $17.36 92.1% $1,898 $2,645 $2,575 $445 $393 17.3% 15.3% 1.0x 6.7x
Celestica, Inc. TSX:CLS $13.56 88.4% $1,947 $1,616 $6,133 $438 $257 7.1% 4.2% 0.3x 6.3x
Plexus Corp. PLXS $52.57 89.5% $1,810 $1,564 $2,560 $255 $178 10.0% 7.0% 0.6x 8.8x
Benchmark Electronics, Inc. BHE $32.30 93.8% $1,608 $1,076 $2,328 $212 $135 9.1% 5.8% 0.5x 8.0x
Average 91.4% $3,517 $3,833 $8,953 $709 $542 9.4% 7.0% 0.5x 7.4x
Median 92.1% $1,947 $2,645 $6,133 $445 $347 7.8% 5.8% 0.4x 8.0x
Enterprise Value /
LTM LTM Margins LTM

HYDE PARK CAPITAL Investment Banking | Mergers & Acquisitions | Capital Raising
Industry Sector Overview – Public Company Analysis
Storage and Network Components
($ in millions, except per share)
23
Communications Equipment
Technology Hardware
Source: S&P Capital IQ *Excluded from the average and median calculation.
Closing Price % of 52 Equity Enterprise
Company Ticker 6/30/17 Week High Value Value Revenue Gross Profit EBITDA Gross Profit EBITDA Revenue EBITDA
Western Digital Corp. WDC $88.60 93.3% $24,830 $32,241 $17,746 $5,268 $3,505 29.7% 19.8% 1.8x 9.2x
Pure Storage, Inc. PSTG $12.81 84.6% $2,547 $2,011 $771 $502 ($160) 65.1% (20.8%) 2.6x NA
Average 88.9% $13,689 $17,126 $9,258 $2,885 $1,672 47.4% (0.5%) 2.2x 9.2x
Median 88.9% $13,689 $17,126 $9,258 $2,885 $1,672 47.4% (0.5%) 2.2x 9.2x
Enterprise Value /
LTM LTM Margins LTM
Closing Price % of 52 Equity Enterprise
Company Ticker 6/30/17 Week High Value Value Revenue Gross Profit EBITDA Gross Profit EBITDA Revenue EBITDA
Cisco Systems, Inc. CSCO $31.30 90.5% $158,339 $122,835 $48,510 $30,778 $15,048 63.4% 31.0% 2.5x 8.2x
QUALCOMM, Inc. QCOM $55.22 77.1% $82,305 $84,250 $23,243 $13,897 $7,881 59.8% 33.9% 3.6x 10.7x
Harris Corp. HRS $109.08 95.4% $13,651 $17,562 $7,366 $2,344 $1,579 31.8% 21.4% 2.4x 11.1x
Juniper Networks, Inc. JNPR $27.88 90.1% $10,803 $9,953 $5,113 $3,160 $1,141 61.8% 22.3% 1.9x 8.7x
Netgear, Inc. NTGR $43.10 70.9% $1,463 $1,102 $1,342 $409 $144 30.5% 10.7% 0.8x 7.7x
ADTRAN, Inc. ADTN $20.65 86.9% $1,008 $910 $665 $299 $52 45.0% 7.8% 1.4x 17.6x*
Average 85.1% $44,595 $39,435 $14,373 $8,481 $4,307 48.7% 21.2% 2.1x 9.3x
Median 88.5% $12,227 $13,758 $6,240 $2,752 $1,360 52.4% 21.9% 2.2x 8.7x
Enterprise Value /
LTM LTM Margins LTM

HYDE PARK CAPITAL Investment Banking | Mergers & Acquisitions | Capital Raising
Industry Sector Overview – Public Company Analysis
IT Consulting & Other Services
($ in millions, except per share)
24
Data & Transaction Processing
IT Services
Source: S&P Capital IQ
Closing Price % of 52 Equity Enterprise
Company Ticker 6/30/17 Week High Value Value Revenue Gross Profit EBITDA Gross Profit EBITDA Revenue EBITDA
Accenture plc ACN $123.68 96.3% $81,904 $79,341 $34,189 $10,799 $5,804 31.6% 17.0% 2.3x 13.7x
Cognizant Technology Solutions Corp. CTSH $66.40 97.4% $40,421 $37,356 $13,831 $5,444 $2,714 39.4% 19.6% 2.7x 13.8x
Cap Gemini S.A. ENXTPA:CAP $103.23 93.0% $18,486 $20,157 $13,237 $3,543 $1,670 26.8% 12.6% 1.5x 12.1x
Wipro, Ltd. WIPRO $4.00 89.4% $19,474 $16,390 $8,495 $2,452 $1,684 28.9% 19.8% 1.9x 9.7x
CACI International, Inc. CACI $125.05 92.4% $3,126 $4,357 $4,331 $1,410 $377 32.5% 8.7% 1.0x 11.6x
Syntel, Inc. SYNT $16.96 35.0% $1,426 $1,798 $951 $364 $259 38.2% 27.2% 1.9x 6.9x
ManTech International Corp. MANT $41.38 90.9% $1,599 $1,507 $1,629 $236 $125 14.5% 7.7% 0.9x 12.0x
Unisys Corp. UIS $12.80 76.6% $642 $628 $2,818 $620 $187 22.0% 6.6% 0.2x 3.4x
Computer Task Group, Inc. CTG $5.59 88.4% $87 $77 $316 $58 $7 18.4% 2.3% 0.2x 10.8x
Average 84.4% $18,574 $17,957 $8,866 $2,769 $1,425 28.0% 13.5% 1.4x 10.4x
Median 90.9% $3,126 $4,357 $4,331 $1,410 $377 28.9% 12.6% 1.5x 11.6x
Enterprise Value /
LTM LTM Margins LTM
Closing Price % of 52 Equity Enterprise
Company Ticker 6/30/17 Week High Value Value Revenue Gross Profit EBITDA Gross Profit EBITDA Revenue EBITDAPayPal Holdings, Inc. PYPL $53.67 97.3% $65,249 $56,321 $11,273 $5,271 $2,173 46.8% 19.3% 5.0x 25.9x
First Data Corp. FDC $18.20 95.7% $16,365 $37,472 $7,851 $4,688 $2,750 59.7% 35.0% 4.8x 13.6xFidelity National Information Services, Inc. FIS $85.40 97.8% $28,310 $37,222 $9,315 $3,053 $2,383 32.8% 25.6% 4.0x 15.6x
Fiserv, Inc. FISV $122.34 96.3% $27,144 $31,474 $5,568 $2,591 $1,742 46.5% 31.3% 5.7x 18.1xGlobal Payments, Inc. GPN $90.32 96.6% $14,452 $18,014 $4,070 $1,986 $1,096 48.8% 26.9% 4.4x 16.4x
Total System Services, Inc. TSS $58.25 96.1% $10,775 $13,587 $4,615 $1,245 $907 27.0% 19.6% 2.9x 15.0xBroadridge Financial Solutions, Inc. BR $75.56 96.9% $9,160 $10,157 $3,771 $986 $660 26.1% 17.5% 2.7x 15.4x
Jack Henry & Associates, Inc. JKHY $103.87 97.6% $8,160 $8,167 $1,414 $609 $505 43.1% 35.7% 5.8x 16.2xACI Worldwide, Inc. ACIW $22.37 93.3% $2,640 $3,243 $1,011 $576 $137 57.0% 13.6% 3.2x 23.6x
Average 96.4% $20,251 $23,962 $5,432 $2,334 $1,605 43.1% 24.9% 4.3x 17.8x
Median 96.6% $14,452 $18,014 $4,615 $1,986 $1,096 46.5% 19.5% 4.4x 16.2x
Enterprise Value /
LTM LTM Margins LTM

HYDE PARK CAPITAL Investment Banking | Mergers & Acquisitions | Capital Raising
Industry Sector Overview – Public Company Analysis
($ in millions, except per share)
25
Internet
Source: S&P Capital IQ *Excluded from the average and median calculation.
Online Content and Search
Closing Price % of 52 Equity Enterprise
Company Ticker 6/30/17 Week High Value Value Revenue Gross Profit EBITDA Gross Profit EBITDA Revenue EBITDA
Akamai Technologies, Inc. AKAM $49.81 69.5% $8,748 $8,548 $2,382 $1,562 $707 65.6% 29.7% 3.6x 12.1x
Box, Inc. BOX $18.24 87.2% $2,355 $2,251 $426 $309 ($117) 72.5% (27.4%) 5.3x NA
Laboratorios Farmaceuticos ROVI, S.A. ROVI $19.48 91.0% $0 $4 $291 $166 $37 57.0% 12.8% NA 0.1x
Average 82.6% $3,701 $3,601 $1,033 $679 $209 65.0% 5.0% 4.4x 6.1x
Median 87.2% $2,355 $2,251 $426 $309 $37 65.6% 12.8% 4.4x 6.1x
Enterprise Value /
LTM LTM Margins LTM
Software & Services
Closing Price % of 52 Equity Enterprise
Company Ticker 6/30/17 Week High Value Value Revenue Gross Profit EBITDA Gross Profit EBITDA Revenue EBITDA
Amazon.com, Inc. AMZN $968.00 95.2% $470,690 $470,758 $142,573 $50,734 $12,221 35.6% 8.6% 3.3x 38.5xpriceline.com, Inc. PCLN $1,870.52 97.1% $93,595 $96,510 $11,014 $10,624 $4,168 96.5% 37.8% 8.8x 23.2x
Netflix, Inc. NFLX $149.41 89.5% $65,818 $67,842 $9,510 $3,192 $645 33.6% 6.8% 7.1x 105.2x*
eBay, Inc. EBAY $34.92 95.7% $39,355 $41,567 $9,059 $7,014 $2,935 77.4% 32.4% 4.6x 14.2x
Expedia, Inc. EXPE $148.95 95.2% $22,996 $24,382 $9,058 $7,443 $1,102 82.2% 12.2% 2.7x 22.1x
GODaddy Inc. GDDY $42.42 95.9% $3,617 $4,125 $1,904 $1,224 $207 64.3% 10.9% 2.2x 19.9x
Cimpress N.V. CMPR $94.53 90.7% $2,963 $4,015 $2,050 $1,063 $173 51.9% 8.4% 2.0x 23.2xShutterfly, Inc. SFLY $47.50 87.0% $1,661 $1,854 $1,144 $571 $140 49.9% 12.2% 1.6x 13.2x
Etsy, Inc. ETSY $15.00 93.5% $1,717 $1,452 $380 $250 $28 65.8% 7.4% 3.8x 51.4x
Average 93.3% $78,046 $79,167 $20,744 $9,124 $3,453 61.9% 12.4% 4.0x 25.7x
Median 95.2% $22,996 $24,382 $9,058 $3,192 $645 64.3% 8.4% 3.3x 22.6x
Enterprise Value /
LTM LTM Margins LTM
e-Commerce
Closing Price % of 52 Equity Enterprise
Company Ticker 6/30/17 Week High Value Value Revenue Gross Profit EBITDA Gross Profit EBITDA Revenue EBITDA
Google, Inc. GOOG $908.73 92.0% $629,637 $538,879 $99,275 $59,747 $32,253 60.2% 32.5% 5.4x 16.7xFacebook, Inc. FB $150.98 96.5% $443,089 $410,783 $30,288 $26,178 $16,355 86.4% 54.0% 13.6x* 25.1x
Yahoo!, Inc. AABA $54.48 94.9% $51,886 $46,323 $5,409 $2,450 $261 45.3% 4.8% 8.6x 177.6x*
Scripps Networks Interactive, Inc. SNI $68.31 81.9% $8,904 $12,117 $3,440 $2,342 $1,545 68.1% 44.9% 3.5x 7.8xTwitter, Inc. TWTR $17.87 70.8% $12,683 $10,458 $2,483 $1,578 $85 63.6% 3.4% 4.2x 122.8x*
IAC/InterActiveCorp. IAC $103.24 95.6% $8,165 $8,507 $3,082 $2,384 $432 77.4% 14.0% 2.8x 19.7x
WebMD Health Corp. WBMD $58.65 90.2% $3,141 $3,152 $701 $446 $182 63.7% 25.9% 4.5x 17.4xYelp, Inc. YELP $30.02 69.2% $2,347 $1,861 $752 $690 $33 91.7% 4.3% 2.5x 57.0x*
Average 86.4% $144,981 $129,010 $18,179 $11,977 $6,393 69.5% 23.0% 4.5x 17.3x
Median 91.1% $10,794 $11,287 $3,261 $2,363 $347 65.9% 20.0% 4.2x 17.4x
Enterprise Value /
LTM LTM Margins LTM

HYDE PARK CAPITAL Investment Banking | Mergers & Acquisitions | Capital Raising
Industry Sector Overview – Public Company Analysis
Technology Value Added Resellers
($ in millions, except per share)
26
Technology Wholesalers
Resellers and Wholesalers
Source: S&P Capital IQ.
Closing Price % of 52 Equity Enterprise
Company Ticker 6/30/17 Week High Value Value Revenue Gross Profit EBITDA Gross Profit EBITDA Revenue EBITDA
CDW Corp. CDW $62.53 94.3% $10,285 $13,758 $14,190 $2,355 $1,083 16.6% 7.6% 1.0x 12.7xPresidio, Inc. PSDO $14.31 87.4% $1,041 $1,952 $2,842 $581 $203 20.4% 7.1% 0.7x 9.6x
Insight Enterprises, Inc. NSIT $39.99 75.2% $1,445 $1,811 $5,794 $788 $210 13.6% 3.6% 0.3x 8.6xePlus, Inc. PLUS $74.10 91.1% $1,039 $1,100 $1,329 $287 $98 21.6% 7.4% 0.8x 11.2x
PC Connection, Inc. CNXN $27.06 88.8% $724 $659 $2,791 $376 $88 13.5% 3.2% 0.2x 7.5x
Average 87.3% $2,907 $3,856 $5,389 $877 $336 17.1% 5.8% 0.6x 9.9x
Median 88.8% $1,041 $1,811 $2,842 $581 $203 16.6% 7.1% 0.7x 9.6x
Enterprise Value /
LTM LTM Margins LTM
Closing Price % of 52 Equity Enterprise
Company Ticker 6/30/17 Week High Value Value Revenue Gross Profit EBITDA Gross Profit EBITDA Revenue EBITDAArrow Electronics, Inc. ARW $78.42 97.6% $7,173 $9,624 $24,111 $3,155 $1,083 13.1% 4.5% 0.4x 8.9xSYNNEX Corp. SNX $119.96 91.3% $4,756 $5,555 $15,014 $1,419 $604 9.4% 4.0% 0.4x 9.2x
Avnet, Inc. AVT $38.88 75.5% $5,048 $5,414 $26,281 $3,194 $990 12.2% 3.8% 0.2x 5.5xTech Data Corp. TECD $101.00 95.9% $3,631 $5,055 $27,936 $1,460 $441 5.2% 1.6% 0.2x 11.5x
ScanSource, Inc. SCSC $40.30 89.7% $1,032 $1,083 $3,528 $366 $109 10.4% 3.1% 0.3x 9.9x
Average 90.0% $4,328 $5,346 $19,374 $1,919 $1,372 10.1% 2.9% 0.3x 9.0x
Median 91.3% $4,756 $5,414 $24,111 $1,460 $604 10.4% 3.0% 0.3x 9.2x
Enterprise Value /
LTM LTM Margins LTM

HYDE PARK CAPITAL Investment Banking | Mergers & Acquisitions | Capital Raising
Member FINRA/SIPC
Recent Transactions
HYDE PARK CAPITAL Investment Banking | Mergers & Acquisitions | Capital Raising Integrity | Expertise | Results
Hyde Park Capital Advisors, LLC 701 N. Franklin Street
Tampa, FL 33602 Tel: 813-383-0202
www.hydeparkcapital.com
has been acquired by
a portfolio company of
has been acquired by
has been acquired by
a part of
MTS Markets International Inc.has been acquired byhas been recapitalized by
Minera del Norte S.A. de C.V.
has been acquired byhas been acquired by has been recapitalized by
&
has been acquired byhas received a growth
equity investment from
has been acquired by has been acquired byhas been recapitalized by
&
has been acquired byhas been acquired by
John Hill Senior Managing Director [email protected] (813) 383-0205 John McDonald Senior Managing Director [email protected] (813) 383-0206 Keith Hodgdon Managing Director [email protected] (813) 383-0208 Greg Bosl Vice President [email protected] (813) 597-2649 Jami Gold Vice President [email protected] (813) 383-0203 Charlie Hendrick Vice President [email protected] (813) 383-0207 Jeffrey Hendricks Vice President [email protected] (678) 523-3073