
Technology, Globalisation and Multinationalsesocialsciences.org/eBook/eBook_Siddharthan.pdf ·...
102
Technology, Globalisation and Multinationals The Asian Experience N S Siddharthan 2015 The One-stop Portal for Social Scientists
Transcript of Technology, Globalisation and Multinationalsesocialsciences.org/eBook/eBook_Siddharthan.pdf ·...

Technology,
Globalisation and
Multinationals
The Asian Experience
N S Siddharthan 2015
The One-stop Portal for Social Scientists

1 Poverty essay 2014
Technology, Globalisation and Multinationals The Asian Experience
N S Siddharthan

1 Poverty essay 2014
Published by eSocialSciences for N. S. Siddharthan
E-book: January 2016 www.esocialsciences.org
This lecture series has been edited by Padma Prakash for IRIS Knowledge Foundation.
The copyright for this volume remains with the author.
Comments may be sent to: [email protected]

1 Poverty essay 2014
Contents
I - A Short Tour of Chapters 1
II - Foreign Direct Investment and Industrial Organisation 5
III - Foreign Direct Investment: Main Determinants 13
IV - Foreign Direct Investment, Technology And Productivity Spillovers 31
V - Determinants of R&D: Lessons from Literature 40
VI - Foreign Direct Investments in Research and Development 56
VII - Global Technology Spillovers 63
VIII - MNE, Information Technology and Exports 69
IX - FDI: Impact on growth, employment and poverty 80
X - University – Industry Collaborations: Asian Experience 87

1 Technology, Globalisation and Multinationals, The Asian Experience
This collection on Technology, Globalisation and Multinationals: The Asian Experience deals with issues relating to foreign direct investments (FDI); technology spillovers from FDI; in-house research and development (R&D) activities by enterprises; FDI in R&D; global technology spillovers; technology and trade, information technology (IT) and outsourcing; universities, academic institutions and industry relationships. There are several excellent books dealing with many of these issues. For example in the case of FDI and multinational enterprises we have outstanding works by Caves (2007) and Dunning (2008). Likewise, on globalisation of innovations we have a comprehensive volume by Reddy (2011). However, this volume differs from the earlier studies in one important respect. These earlier studies have presented exhaustive and comprehensive survey of literature on these issues. In contrast, here I do not intend to present a comprehensive survey, instead will concentrate on selected studies published in mainstream journals and discuss in-depth the data, methodology and findings of these selected studies. Presented here is an in-depth analysis of some of the important studies in these areas from which we draw appropriate conclusions and implications. The volume will concentrate mainly on Asian studies. However, benchmark studies dealing with Europe and the US will not be ignored. This volume is mainly based on my lectures to the post graduate students (MSc) of the Madras School of Economics on Industrial Organisation and Multinational Enterprises.Classical theories of international trade and economics were not able to explain several features of the 20th century trade and investment patterns. This necessitated the use of Industrial Organisation theories in analysing the global trade and investment patterns. For example, the international trade theory (H-O theory), predicted that resource endowments of countries would influence exports and import patterns of a country. Thus a country enjoying surplus capital would export capital intensive goods and import labour intensive goods. This prediction of the theory also appealed to common sense. However, when Leontief tested this theory with data he had drawn from the US exports and imports, he found the US exports were labour intensive and imports were capital intensive despite the fact that the US is a capital abundant country. This phenomenon is called Leontief Paradox.
IA Short Tour of Chapters

2A Short Tour of Chapters / N S Siddharthan
The second paradox relates to foreign direct investments (FDI). The ruling theory of international economics predicts capital to flow from capital rich to capital poor countries. However, during the second half of the 20th century, most of the FDI flows were among the developed countries. Very little FDI went to the developing world. Multinationals were mutual invaders, they mainly invested in countries that were home of other multinationals. Recently they have started investing in Asian countries in general and China in particular. China, India and ASEAN countries are more developed compared to other developing countries and have also developed their own multinationals. This paradox, namely, capital flowing from one developed country to other developed country, needs to be analysed and explained.The third paradox refers to technology flows. Payments for technology purchases like licensing fees, royalties and lump sum payments for technology purchases have also been happening mainly among countries that are technologically advanced. Thus for most of the third quarter of the 20th century more almost 90 per cent of the technology payments were made by developed countries. The developing countries hardly imported technology. Thus the developing countries and in particular African and some South American countries neither received any FDI nor arms length technology transfer.Studies on multinational enterprises (MNEs) and FDI mainly use the industrial organisation framework to analyse the determinants and consequences of FDI inflows and outflows. The main framework used is the Structure – Conduct – Performance (SCP) framework. Therefore the volume will begin with a brief introduction to this framework, its strength and limitations (Chapter 2). In the next chapter (Chapter 3) the SCP framework will be used to analyse the determinants of FDI. In this context the role of intangible assets and transactions costs in explaining FDI flows (Caves 2007) and the Ownership – Location – Internalisation (OLI) paradigm (Dunning 2008) will be discussed. The chapter will also survey selected studies dealing with the determinants of inter-industry differences in FDI and inter-country differences in FDI. Towards the end it will also discuss inter-state difference in FDI inflows within a country. Most of the developing countries have been inviting FDI and offering concessions to MNEs mainly to benefit from technology and productivity spillovers that could improve the performance of the domestic firms. However, several studies show that the spillovers are not automatic. Furthermore, while some local firms benefit from spillovers, certain other firms could become victims of MNEs entry. It is important to identify and analyse the characteristics of firms that could gain from the entry of MNEs and those that could become victims. Moreover, the policies of the host countries could also play a crucial role in promoting spillovers. The next chapter (Chapter 4) analyses the role of local technological capabilities, in-house R&D, corporate governance of the MNE affiliates, vertical and horizontal linkages in influencing spillovers. In recent years Asia has emerged as the main manufacturing hub of the world. Productivity of several enterprises located in Asian countries has overtaken the productivities of European and the US

3 Technology, Globalisation and Multinationals, The Asian Experience
firms. This has resulted in the emergence of Asian multinationals. Towards the end the chapter will discuss this emerging phenomenon.Another important aspect of the globalisation of technology development is the phenomenon of FDI in R&D. In recent times MNEs have been investing in R&D units in host country locations including China and India. Before analysing the determinants and impact of FDI in R&D it would be useful to discuss the determinants of R&D first. (Chapter 5) is devoted to an analysis of the determinants of R&D. The chapter begins by presenting the well known Schumpeterian paradigm and goes on to analyse the research findings on the relative importance of market structure, appropriability and technological opportunity in determining in-house R&D expenditures and innovative activities. It also deals with the issue of the relationship between creating technology in-house and/or purchasing technology from other firms including acquiring technology intensive firms. Towards the end it examines issues relating to R&D collaborations between different units.A few decades earlier most multinationals conducted their R&D in their respective home countries. If at all they undertook any R&D in the host countries it was to make minor modifications to suit the host country market, tastes and preferences. Recent years have witnessed a huge change in the location of R&D units. Currently it is common to establish R&D units in host countries. What is the main motive for establishing R&D units in foreign countries? Is the motive to acquire and increase firms’ scientific technological capabilities or to perform adoptive research to suit the local market conditions? Why are MNEs establishing R&D units in China and India that are not related to their manufacturing activities in these countries? These issues will be discussed in (Chapter 6). There is also an emerging phenomenon of mass collaborations and peer production. Websites like ‘InnoCentive solver’s community have more than 300,000 people belonging to 200 countries. They solve R&D problems of several large corporations. Towards the end, the chapter will also refer to these developments.Several studies show that host country firms benefit by FDI through technology and productivity spillovers. Some studies analyse the characteristics of firms that benefit by FDI spillovers and firms that become victims due to the presence of MNEs. In addition, MNEs operating in host countries could also benefit by spillovers from other MNEs and host country firms. As is well known, MNEs establish production and R&D facilities in different countries. In this context, it is important to know whether the MNE as a whole benefits by spillovers or they are confined to local host country units? If the benefit accrue to all the units belonging to an MNE, then does the breadth of MNE involvement in different countries matter? In other words, is it true that more the countries the MNE invests better it is for its knowledge accumulation? What about the depth of MNE involvement in a country in terms of investment intensity? Does the host country intellectual property regulations and protection influence technology and productivity spillovers? (Chapter 7) deals with these questions. It also discusses technology sharing through trade.

4A Short Tour of Chapters / N S Siddharthan
The neoclassical theories of trade, by and large, assume that all the firms in a country are homogenous, use same technologies and export. Thus it ignores firm specific characteristics and proprietary resources in influencing exports. Knowledge is assumed to be freely available and technology known to all the enterprises. In contrast to this the neo-Schumpeterian theories emphasise technological differences and firm specific advantages. (Chapter 8) will discuss exports by firms as distinct from exports by countries and bring to light ownership advantages of technology and brand names. It will also discuss the role of information technology in influencing trade and outsourcing. (Chapter 9) deals with another important issue that has also become an electoral issue in several countries. They relate to the role of FDI and the kind of technology transferred by MNEs and its impact on growth, employment and poverty reduction. What kind of FDI contributes to growth? What is the role of domestic institutional and policy constraints? Does the kind of technology brought by MNEs contribute to employment or harm employment prospects? Does FDI inflow contribute to poverty reduction? Some of these issues are contentious. (Chapter 9) examines the available empirical evidence and attempts to answer these questions.(Chapter 10) deals with university–industry collaborations. Several philosophical and ideological issues are involved in discussing university–industry collaborations. A fundamental issue is whether it is proper for academics to indulge in commercial activities and do business? Will collaboration with industry activities adversely affect the academic standards, namely, teaching and research? Or is it a win-win situation for both institutions? What is the role of universities in the introduction of new products and processes? The chapter will attempt to answer some of these questions. There are also several issues from the Industry side. They relate to the nature of R&D performed by the industrial firms, complementary or competitive relationship between university research and in-house R&D. They also relate to the nature of the entrepreneur, educational and professional qualifications and the role of business environment. Finally, I will throw some light on the role of government and state policy in promoting collaborations. Literature in this area is rich and the chapter will present some of the research findings for Asia. In particular the chapter will concentrate on studies conducted for China, Japan, Korea, Malaysia and India.
References
Caves, R.E. (2007): Multinational Enterprise and Economic Analysis, (Third Edition), Cambridge Survey of Economic Literature, Cambridge University Press, Cambridge.
Dunning, John H. (2008): Multinational Enterprises and the Global Economy, (Second Edition), Addison-Wesley Publishing Company, Reading, UK.
Reddy, Prasada. (2011): Global Innovation in Emerging Economies, Routledge, New York and Oxon, i-xxv, 1-294.

1 Technology, Globalisation and Multinationals:The Asian Experience
In theory we expect capital to flow from capital rich to capital poor countries. Likewise, technology should also flow from technology rich to technology poor countries. However, in practice, this does not happen. Most foreign direct investments (FDI) originate from and flow to developed countries. Developed countries also account for the bulk of the technology payments for purchase of technology. Section I discusses this paradox of developed and capital rich countries accounting for the bulk of FDI and technology inflows. Section II presents the need to use the main industrial organisation paradigm, namely the Structure – Conduct – Performance (SCP) paradigm for explaining the determinants of FDI. Section III discusses the limitations of the CSP paradigm.
II Multinationals: Mutual Invaders The neoclassical economic theory expects capital to flow from capital rich to capital poor countries. Paradoxically as shown in Tables 1 and 2, foreign direct investments (FDI) have been flowing from one capital rich to another capital rich country. Till 2007, more than two thirds of FDI flows emanated from developed countries and went to developed countries and only a small amount went to developing countries. Likewise, technology flows (as measured by royalty and technical fee payments) have also been flowing among technologically developed countries. About 88 per cent of technology payments are made by developed countries. Developing countries have not been prominent purchasers of technology.
IIForeign Direct Investment and Industrial Organisation
5

2Foreign Direct Investment and Industrial Organisation / N S Siddharthan
Table 1: FDI Stock by Region (in million US $)
1990 2000 2007 2010 2013
FDI inward stock
World 1,941,252 5,786,700 15,210,560 19,140,603 25,464,173
Developed economies1,412,605 3,987,624 10,458,610 12,501,589 16,053,149
(72.8) (68.9) (68.8) (65.32) (63.04)
Developing economies528,638 1,738,255 4,246,739 5,951,203 8,483,009
(27.2) (30.0) (27.9) (31.1) (33.31)
China20,691 193,348 327,087 578,818 956,793
(1.1) (3.3) (2.2) (3.2) (3.76)
Hong Kong China201,653 455,469 - 1,097,620 1,443,947
(10.4) (7.9) - (5.7) (5.67)
India1,657 17,517 76,226 197,939 226,748
(0.1) (0.3) (0.5) (1.03) (0.89)
Source: percentage share of the FDI inward and outward flow to the world total is given in the parenthesis
Source: UNCTAD (2008, 14)
Table 2: FDI Flows by Region (in million US $)
2005 2006 2007 2010 2013
FDI inflow
World 958,697 1,411,018 1,833,324 1,243,671 1,451,965
Developed economies611,283 940,861 1,247,635 601,906 565,626
(63.8) (66.7) (68.1) (48.39) (38.96)
Developing economies316,444 412,990 499,747 573,568 778,372
(33.0) (29.3) (27.3) (46.1) (53.61)
Asia210,026 272,890 319,333 357,846 426,355
(21.9) (19.3) (17.4) (28.8) (29.36)
China72,406 72,715 83,521 106,736 123,911
(7.6) (5.2) (4.6) (8.6) (8.53)
India7,606 19,662 22,950 24,640 28,199
(0.8) (1.4) (1.3) (2.0) (1.94)
Source: percentage share of the FDI inward and outward flow to the world total is given in the parenthesis
Source: UNCTAD (2008, 14)
6
3 Technology, Globalisation and Multinationals:The Asian Experience
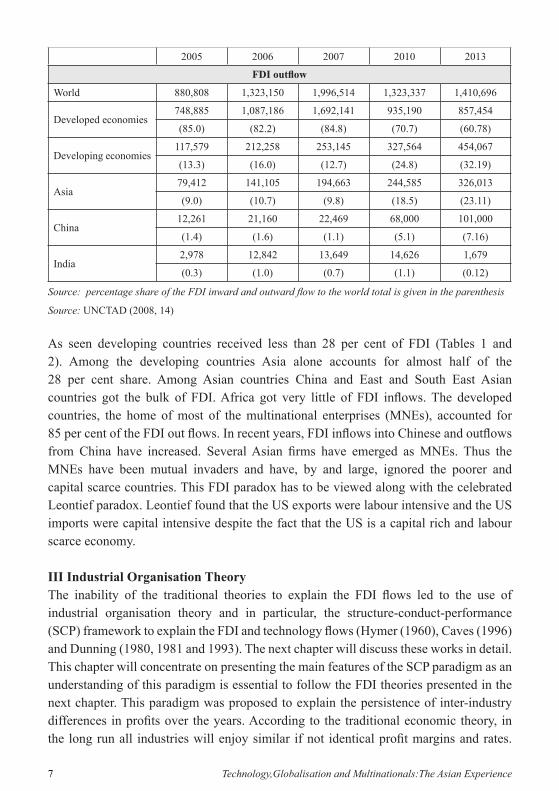
2005 2006 2007 2010 2013
FDI outflow
World 880,808 1,323,150 1,996,514 1,323,337 1,410,696
Developed economies748,885 1,087,186 1,692,141 935,190 857,454
(85.0) (82.2) (84.8) (70.7) (60.78)
Developing economies117,579 212,258 253,145 327,564 454,067
(13.3) (16.0) (12.7) (24.8) (32.19)
Asia79,412 141,105 194,663 244,585 326,013
(9.0) (10.7) (9.8) (18.5) (23.11)
China12,261 21,160 22,469 68,000 101,000
(1.4) (1.6) (1.1) (5.1) (7.16)
India2,978 12,842 13,649 14,626 1,679
(0.3) (1.0) (0.7) (1.1) (0.12)
Source: percentage share of the FDI inward and outward flow to the world total is given in the parenthesis
Source: UNCTAD (2008, 14)
As seen developing countries received less than 28 per cent of FDI (Tables 1 and 2). Among the developing countries Asia alone accounts for almost half of the 28 per cent share. Among Asian countries China and East and South East Asian countries got the bulk of FDI. Africa got very little of FDI inflows. The developed countries, the home of most of the multinational enterprises (MNEs), accounted for 85 per cent of the FDI out flows. In recent years, FDI inflows into Chinese and outflows from China have increased. Several Asian firms have emerged as MNEs. Thus the MNEs have been mutual invaders and have, by and large, ignored the poorer and capital scarce countries. This FDI paradox has to be viewed along with the celebrated Leontief paradox. Leontief found that the US exports were labour intensive and the US imports were capital intensive despite the fact that the US is a capital rich and labour scarce economy.
III Industrial Organisation TheoryThe inability of the traditional theories to explain the FDI flows led to the use of industrial organisation theory and in particular, the structure-conduct-performance (SCP) framework to explain the FDI and technology flows (Hymer (1960), Caves (1996) and Dunning (1980, 1981 and 1993). The next chapter will discuss these works in detail. This chapter will concentrate on presenting the main features of the SCP paradigm as an understanding of this paradigm is essential to follow the FDI theories presented in the next chapter. This paradigm was proposed to explain the persistence of inter-industry differences in profits over the years. According to the traditional economic theory, in the long run all industries will enjoy similar if not identical profit margins and rates.
7

4Foreign Direct Investment and Industrial Organisation / N S Siddharthan
Profit margins (also referred to as price-cost margins) reflect monopoly power of the industry. Profit rates, that is, rate of return on capital invested, reflect the profitability from the point of view of the investor. It is argued that an industry enjoying higher profit margins will attract the entry of new firms and that would bring down the profits due to expansion of supply. Likewise, an industry enjoying lower profits would experience firms leaving that industry to other more profitable industries. This phenomenon of entry and exit of firms would equalise profits across all industries. However, in practice this did not happen and some industries continued to enjoy higher profit margins and rates. Bain (1956) attributed the persistence of profit differences across industries to the presence of entry and exit barriers. The SCP paradigm extended this logic to give a more comprehensive explanation.The S-C-P paradigm brings out clearly the mutual causation and the resultant interdependence among the variables representing market structure, conduct and performance of industries. The paradigm is usually explained with the help of a flowchart. Chart 1 states that the conduct of firms as seen by the expenditures on R&D, technology imports, advertisement, expenditures on skilled manpower, and investment in plant and machinery create a certain type of market structure characterised by buyer and seller concentration, entry conditions (including entry barriers), product differentiation and threshold minimum size economies. Both these sets of structure and conduct variables influence industrial performance as indicated by profit rates and margins, growth, productivity and international orientation.However, the relationship between structure, conduct and performance is not unidirectional, that is, from conduct and structure to performance. Performance would
8

5 Technology, Globalisation and Multinationals:The Asian Experience9
also influence conduct and structure. Higher profit margins and higher productivity would induce higher investment in technology, advertisement and physical capital formation, as these expenditures have to be financed from profits. R&D and other expenditures on innovation are also influenced by market structure (Schumpeter, 1942).In addition, the conduct variables themselves mutually influence each other. Investment depends on innovative activities (Deiaco et a1. 1990). In-house R&D and import of technology are also related to each other [Odagiri (1983), Siddharthan (1988)]. In other words, most of these variables are endogenous to the system in the sense that by themselves they determine and are themselves determined by other variables in the system [Schmalensee (1989, p. 954)]. In fact there are not many predetermined variables that one could find in the system. Expenditures on variables relating to technology and investment listed in the first box (conduct) are also considered to be entry barrier variables. Thus industries characterised by heavy investments on these items could enjoy high profits as new firms cannot enter these industries without undertaking heavy investments in technology and physical capital. On the other hand in industries where these expenditures are not significant, the entry of new units would be easy. Firms that operate in concentrated industries with high entry barriers erected through spending on technology and heavy investments will enjoy monopoly power and higher profits. If the monopoly power created in the home country through investments in technology, physical investments, introduction of new products and the consequent benefits from brand names could be exploited in a foreign location, then that could be a driver of FDI. This will be discussed in the next chapter in some depth. The rest of this chapter will deal with the methodological and data limitations of the SCP paradigm.
IV Limitations of SCP paradigmIt is important to be aware of the limitation of the SCP paradigm before using it to analyse FDI. The main limitation of the paradigm is that there are no exogenous variables in the system. All the variables are endogenous to the system. From econometric estimation point of view, this could create problems in specifying equations wherein the independent variables are not exogenous to the system but exogenous to that particular equation. Some studies have circumvented this problem by introducing lagged variables (Delorme, Klein, Kmerschen, and Voeks, 2002).Most of the earlier studies concentrated on analysing inter-industry differences in profits using structure and conduct variables (Comanor and Wilson (1967) and Khalizadeh-Shirazi 1974). The choice of the variables depended on their availability. During the 1960s most of the conduct variables like R&D, and other technology variables were not available. Only advertisement intensity (advertisement as a proportion of sales) was available. All the earlier studies explaining profits, included advertisement intensity
6Foreign Direct Investment and Industrial Organisation / N S Siddharthan
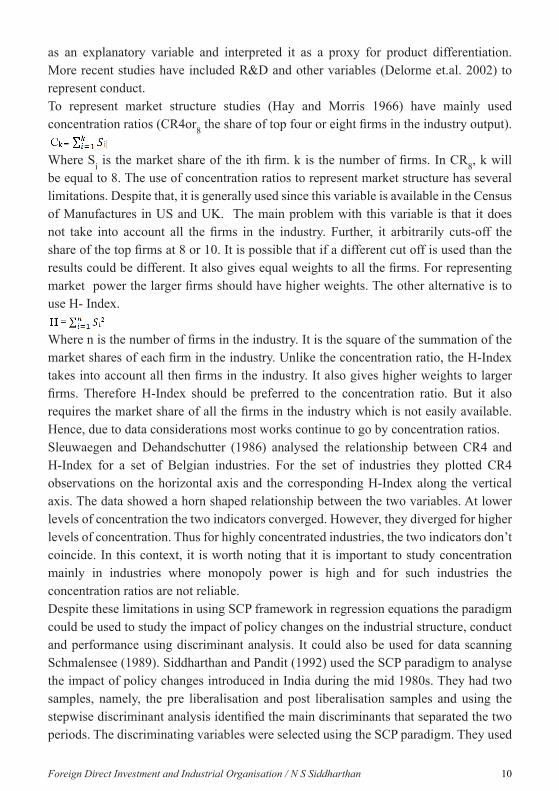
as an explanatory variable and interpreted it as a proxy for product differentiation. More recent studies have included R&D and other variables (Delorme et.al. 2002) to represent conduct.To represent market structure studies (Hay and Morris 1966) have mainly used concentration ratios (CR4or8 the share of top four or eight firms in the industry output).
Where Si is the market share of the ith firm. k is the number of firms. In CR8, k will be equal to 8. The use of concentration ratios to represent market structure has several limitations. Despite that, it is generally used since this variable is available in the Census of Manufactures in US and UK. The main problem with this variable is that it does not take into account all the firms in the industry. Further, it arbitrarily cuts-off the share of the top firms at 8 or 10. It is possible that if a different cut off is used than the results could be different. It also gives equal weights to all the firms. For representing market power the larger firms should have higher weights. The other alternative is to use H- Index.
Where n is the number of firms in the industry. It is the square of the summation of the market shares of each firm in the industry. Unlike the concentration ratio, the H-Index takes into account all then firms in the industry. It also gives higher weights to larger firms. Therefore H-Index should be preferred to the concentration ratio. But it also requires the market share of all the firms in the industry which is not easily available. Hence, due to data considerations most works continue to go by concentration ratios.Sleuwaegen and Dehandschutter (1986) analysed the relationship between CR4 and H-Index for a set of Belgian industries. For the set of industries they plotted CR4 observations on the horizontal axis and the corresponding H-Index along the vertical axis. The data showed a horn shaped relationship between the two variables. At lower levels of concentration the two indicators converged. However, they diverged for higher levels of concentration. Thus for highly concentrated industries, the two indicators don’t coincide. In this context, it is worth noting that it is important to study concentration mainly in industries where monopoly power is high and for such industries the concentration ratios are not reliable.Despite these limitations in using SCP framework in regression equations the paradigm could be used to study the impact of policy changes on the industrial structure, conduct and performance using discriminant analysis. It could also be used for data scanning Schmalensee (1989). Siddharthan and Pandit (1992) used the SCP paradigm to analyse the impact of policy changes introduced in India during the mid 1980s. They had two samples, namely, the pre liberalisation and post liberalisation samples and using the stepwise discriminant analysis identified the main discriminants that separated the two periods. The discriminating variables were selected using the SCP paradigm. They used
10
7 Technology, Globalisation and Multinationals:The Asian Experience
the following discriminants – size of the units, capital output ratio, skill intensity, profit margins, import and export intensities, borrowings, entry of new units, investment rate, growth of output, R&D, labour productivity and employment growth. These variables figure in the Chart 1 of this chapter. In their results technology variables emerged as important discriminants. In other words, during the regime of industrial licences and permits, the main entry barrier was the industrial licence. But during the liberalised regime technology expenditures emerged as important entry barrier variables. This is further reinforced by the other finding, namely, the rate of entry of new units was much higher in the liberalised regime and it was an important discriminant.The next chapter will discuss the main determinants of FDI. In doing so some of the concepts introduced in this chapter will be utilised in analysing inter-industry and inter-country FDI flows.
References
Bain, J S. (1956). Barriers to New Competition,. Harvard University Press.,Cambridge MA
Caves, R.E. (1996) ‘Multinational Enterprise and Economic Analysis’, (Second Edition), Cambridge Survey of Economic Literature, Cambridge University Press, Cambridge.
Comanor, W S and T A Wilson. (1967). ‘Advertising Market Structure and Performance’, Review of Economics and Statistics, 49, 423-40.
Deiaco, E., E. Hornell and G. Vickery. (1990).. Technology and Investment: Crucial Issues for the 1990’s, Pinter Publishers, London.
Delorme, Charles D., Peter G Klein, David R. Kmerschen, and Lisa Ford Voeks. (2002).‘Structure, Conduct and Performance: A simultaneous equations approach’, Applied Economics, 35, 13-20
Dunning, John H. (1980). ‘Toward an Eclectic Theory of International Production’, Journal of International Business Studies, vol. 11, no. 1 (Spring-Summer), pp. 9-31.
Dunning, John H. (1981) International Production and the Multinational Enterprise, Allen & Unwin: London.
Dunning, John H. (1993). Multinational Enterprises and the Global Economy, Addison-Wesley Publishing Company, Reading, UK.
Hymer, S.H. (1960) The International Operations of National Firms: A Study of Direct Investment, Ph.D. Thesis MIT, Published by MIT Press in 1976.
Khalizadeh-Shirazi, L. (1974) ‘Market Structure and Price-Cost Margins in the UK Manufacturing Industries’, Review of Economics and Statistics, 56, 67-76.
Odagiri, Hiroyuki. (1983). R&D expenditure, royalty payments and sales growth in Japanese manufacturing corporations, The Journal of Industrial Economics, Vol. 32, No.1, 61-67.
Schmalensee, R. (1989) Inter-industry studies of structure and performance, in R. Schmalensee and R. Willing(eds.), Handbook of Industrial Organization, North-Holland, Amsterdam.
Schumpeter, J.A. (1942). Capitalism, Socialism, and Democracy, Harper, New York.
Siddharthan, N.S. (1988). In-house R&D imported technology firm size: Lessons from Indian experience, The Developing Economies, Vol. 26, No.3, 212-21.
11

8Foreign Direct Investment and Industrial Organisation / N S Siddharthan
Siddharthan, N.S. and Ajit K. Dasgupta. (1983). ‘Entry barriers to exports and inter-industry differences in profitability’, The Developing Economies, Vol. 21, 14-23.
N.S. Siddharthan and B.L. Pandit. (1992). ‘Deregulations, Entry and Industrial Performance: Impact of Recent Policy Changes’ Indian Economic Review, Special Number, 377-384.
Sleuwaegen, Leo and Wim Dehandschutter. (1986). ‘The critical choice between the concentration ratio and the H-index in assessing industry performance’, The Journal of Industrial Economics, 35(2), 193-208.
12

1 Technology, Globalisation and Multinationals:The Asian Experience
As discussed in the last chapter, in theory we expect capital to flow from capital rich to capital poor countries, and likewise technology should also flow from technology rich to technology poor countries. However, in practice this does not happen. Most foreign direct investments (FDI) flow to developed countries. Developed countries also account for the bulk of the technology payments for purchase of technology. Section I discusses this paradox of developed and capital rich countries accounting for the bulk of FDI and technology inflows. Section II presents the main paradigm used for explaining the determinants of FDI. Empirical studies explaining FDI flows are classified under two sets – those dealing with inter-industry distribution of FDI in a given country, and those that deal with inter-country distribution of FDI inflows. Section III surveys select studies devoted to analysing inter-industry differences in multinational share while Section V discusses the determinants of inter-country differences in FDI flows. In explaining inter-country differences location advantages assume importance. Section IV discusses the impact of agglomeration on the decision to invest by MNEs. Section VI presents location advantages within a country, in particular China and India. Section VII brings out the main conclusions of the chapter.
I Multinationals: Mutual Invaders – Product Cycle ExplanationAs seen from Tables 1 and 2, presented in Chapter 2, till recently developing countries received less than 28 per cent of FDI. Among the developing countries, Asia alone accounted for almost half of the 28 per cent share. Among Asian countries China and East and South East Asian countries got the bulk of FDI. Africa got very little of FDI inflows. The developed countries, the home of most of the multinational enterprises (MNEs), accounted for 85 per cent of the FDI out flows. Thus the MNEs have been mutual invaders and have, by and large, ignored the poorer and capital scarce countries. This FDI paradox has to be viewed along with the celebrated Leontief paradox. Leontief found that the US exports were labour intensive and the US imports were capital intensive. The neoclassical trade theory would expect it to be the other way round as the US is a capital rich and labour scarce economy.During the late 1960s and 1970s it was fashionable to explain this FDI paradox by using
IIIForeign Direct Investment: Main Determinants
13

2Foreign Direct Investment: Main Determinants / N S Siddharthan
the product life cycle theory (Vernon 1966, 1979; Dasgupta and Siddharthan 1985). The theory asserts that the life cycle of a product is marked by a sequence of well-defined stages which differ from one another with respect to rate of growth in product, technology and market characteristics; and that these differences could affect the choice between exporting the product and producing abroad by means of FDI. It is argued that in the initial stage of introduction, a new product tends to be relatively non-standardised; not only the product specification but also the technology of its production may vary over a wide range, leading to a high degree of uncertainty in production. On the other hand, since both technology and product are new, the producing firm enjoys a certain monopolistic advantage by virtue of product differentiation, and is also likely to be skill labour intensive. During this phase it is reasonable to assume that the firm will tend to produce at home and would export to exploit its monopolistic or pioneering advantage. This first phase could also be termed as the export stage of the product life cycle. Investing abroad in order to produce such a product abroad, it is argued, is difficult; nor is there normally any particular incentive to do so.During the second or maturing stage of the product cycle, both product and process characteristics tend to become less flexible, and the innovating firm may be expected to make a more long-term commitment to given product standards and a definite well-specified technology of production. It is at this stage that firms could face a powerful threat to their existing export markets, which may be appropriated by free riders through imitation or stealth. Threat, suggests Vernon (1966), is at this stage a more reliable stimulus to action than opportunity; and it may induce firms to embark on direct investment in foreign countries in order to setup production facilities there. In general, therefore, one would expect that FDI to be greater in industries whose product as well as the production technology are in the process of becoming stabilised but have not yet become entirely standardised. Since the threat mainly comes from other technologically developed countries, FDI is likely to flow mainly to other developed countries.Once the product becomes standardised with a stable and well-known technology, to hold on to monopolistic advantage through product differentiation ceases to be a viable option for the firm. FDI for producing such products abroad is also no longer attractive: the relevant choice now is between domestic production and international trade. In making the choice, classical comparative and cost considerations are likely to be important, more than in the case of products at an earlier stage of the product cycle. The product life cycle theory appeared to explain both the Leontieff Paradox and the FDI paradox. The US exports of products that are in the initial stage of the product cycle are technology and skill intensive and ought not to be classified as labour intensive. Likewise FDI flows to developed countries are in response to the threat from technologically advanced enterprises. Nevertheless, in recent times, this theory has not been in use. This is mainly because the product life cycles of several products belonging
14

3 Technology, Globalisation and Multinationals:The Asian Experience
to micro electronics, information and communication technology, and biotechnology industries have been very short – in some cases as short as one year. For these short cycle products each stage might not lost for more than a few months and consequently the theory appeared to be less relevant.
II Ownership-Location-Internalisation (OLI) Paradigm Currently the framework developed by Dunning (1980, 81, 93), namely, Ownership – Location – Internalisation (OLI) paradigm is extensively used to analyse the determinants of FDI flows. This paradigm is discussed in detail in standard text books, therefore it will not be discussed in detail here. However, the broad outline will be presented. The paradigm argues that when a MNE invests and launches manufacturing activities in a foreign location, it faces several disadvantages like its lack of familiarity with the legal and other frameworks of the host country, customs, language and attitudes of the local population. However, the advantages arising out of the ownership of the intangible assets like technology, brand name and goodwill could more than outweigh the disadvantages. In other words, the paradigm emphasis the ownership advantages of intangible assets. These assets include, technology – R&D and patents held, brand name, goodwill, specialised skills, and in particular, marketing and management skills. In the previous chapter (Chapter 2) they were referred to as entry barriers. These ownership advantages could be exploited through exports, market transfers (transfer of patents against royalty and technical fee payments to third parties, licensing of brand name, etc.) and/or FDIThe choice between market transfer and FDI for taking advantage of and profiting from the ownership of intangible assets will depend on the internalisation advantages. If the internalisation advantages are large and substantial then FDI would be the preferred mode. On the other hand if there are not much internalisation advantages then licensing of the intangible asset to third parties would be preferred. The internalisation advantages in turn would depend on transaction costs. Several factors could influence transaction costs. Information asymmetry is normally attributed as an important cause of high transaction costs. It is argued that in several cases there could be information gap between the technology creator and the enterprise buying the technology. In many cases it is not possible to communicate the advantages of using the new technology without actually disclosing the technology. Under these conditions it is argued that FDI or intra-firm technology transfer would be a better option. Nevertheless, given the high protection of intellectual property ensured in the current World Trade Organisation (WTO) regime, disclosing the contents of the new technology might not pose problems. Furthermore, in several cases the technology owned by the MNE could be new and still evolving and therefore could not be codified. In such cases designs and drawing could not be transferred to unrelated parties as the drawings don’t exist. In such cases also transactions
15
4Foreign Direct Investment: Main Determinants / N S Siddharthan
costs would be high and internalisation advantages substantial. Moreover, tacit nature of the technology could also increase the transaction costs. In many cases the buying firm might also be interested in the brand name and the goodwill associated with it. Transfer of brand name could result in its misuse resulting in damages to the firm’s goodwill. In all these instances it is argued that the transaction costs would be high resulting in FDI flows. By and large, the technology creating firm would like to appropriate the benefits of technology created. If the transfer of technology and brand name reduces appropriability then FDI will be the main mode of exploiting the new technology. The recent WTO regime has increased appropriability by improving patent protection and to that extent arm’s length transfer of technology to unrelated third parties could also increase. Nevertheless, due to appropriability constraints, in high tech goods intra-firm trade dominate (Siddharthan and Kumar 1990).Having decided to invest abroad based on ownership and internalisation advantages, the MNE should take the next important decision, namely, where or in which country to invest. This decision will depend on the location advantages of the prospective host country. In this context it is important to distinguish between two types of FDI, namely, market seeking and efficiency seeking FDI as the determinants of the two types are different. Market seeking FDI is mainly attracted by the size of the market (size of the country and membership of the regional union), and growth of income of the host country. This type of investment is also referred to as tariff jumping FDI. In recent years, thanks to the WTO regulations, and the consequent reduction in tariffs and disappearance of quotas and other import restrictions, the importance of the market seeking investment has been on the decline.Efficiency seeking FDI, on the other hand, depends on different set of variables. In this case the MNE invests abroad not merely to exploit the host market. It invests because in its view it is more efficient to manufacture in the host country than in the home country. One of the location advantages could be cheap labour. However, in several empirical studies low wages has not emerged as an important determinant. On the other hand physical infrastructure indicators like transport, telecommunication, electricity, port facilities have emerged important. In addition institutional infrastructure and governance variables such as the absence of corruption, customs, legal dispute settlements, and the rule of law have turned out to be very important. In what follows some of these studies will be reviewed in detail. Furthermore, technological status of the country, intangible assets of the host country firms like brand name and goodwill, trade and openness of the host country economy and trade and macro policies of the government have also emerged important in some of the studies.The relationship between the developer of a new technology and the manufacturer of the product using the new technology could also be studied using the OLI framework. In
16

5 Technology, Globalisation and Multinationals:The Asian Experience17
this context Chen (2010) developed an analytical framework and discussed several cases of products where the designing is done by one firm and fabrication by another firm. They could be located in different countries. The study cited the following examples – integrated circuits, engine manufacturers and automobile assemblers. Chen (2010) used diagrammatic representation to explain the model. The results show that if both the costs of using market for R&D output and production output are low then it would result in contractual co-marketing. However, if the cost of using market for the R&D output is low but the cost of using market for production of the product is high then it would result in technology licensing. If it is other way round, namely, if the cost of using market for R&D output is high but low for product output then it would result in product outsourcing. Foreign direct investment would take place if both costs, namely, the use of market for R&D output and production, are high.
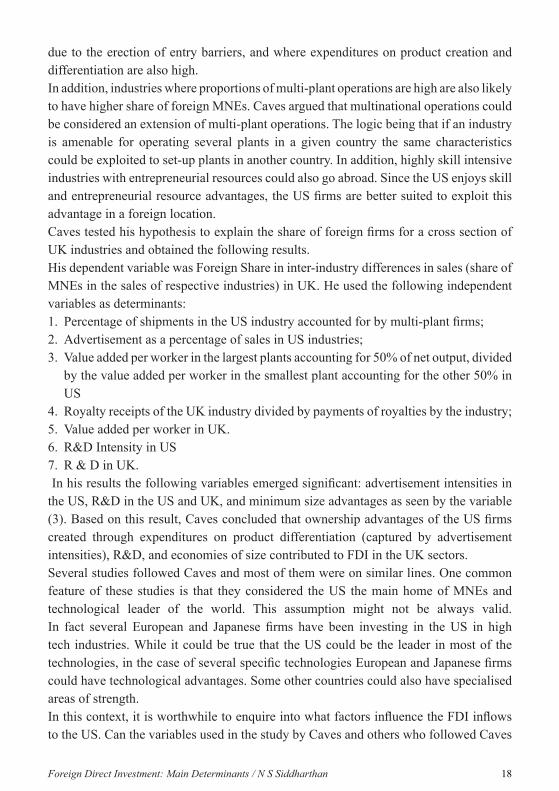
III Determinants of Industrial Distribution of FDIThe pioneering study by Caves (1974) resulted in a series of studies on the industrial distribution of FDI in the host countries. The study by Caves answers the important question, namely, why does the share of multinationals high (share in terms of sales turnover of the industry) in some industries and low in others? In the empirical part Caves considers two host countries – Canada and UK. In order to understand the factors influencing higher share of foreign (Caves mainly considers investment by the US MNEs) firms in some industries compared to the rest, he argues that it is vital to examine the industrial organisation (market structure and conduct) variables in the home country rather than the host country. Before Caves, it was the seminal work of Hymer that emphasised the role of Industrial Organisation variables. Caves reasoning places major emphasis on the ownership of the intangible assets of the MNE. Large firms in the US – the home country of most MNES, have created a market structure through heavy investments in R&D, product differentiation and product and process creation and have also been able to erect other entry barriers through heavy advertisement and physical investments resulting in minimum economies of size advantages. As a result of these investments in technology and plant and machinery the US firms have been reaping monopolistic advantages and enjoying higher profits in their home (US) market. By investing in foreign countries, the large US firms hope to exploit their intangible assets created at home in the host country location. Based on this argument, Caves suggests that firms operating in the US industries that are characterised by high expenditures on R&D, advertisement and enjoying minimum economies of size would be the ones that are most likely to invest abroad. Therefore, to understand the industrial distribution of the share of foreign firms in the UK or Canada, it is important to examine the structure, conduct and performance of the home country (US) industries. Foreign MNEs share in the UK industries will be high in sectors where the US sectors are highly concentrated
6Foreign Direct Investment: Main Determinants / N S Siddharthan
due to the erection of entry barriers, and where expenditures on product creation and differentiation are also high.In addition, industries where proportions of multi-plant operations are high are also likely to have higher share of foreign MNEs. Caves argued that multinational operations could be considered an extension of multi-plant operations. The logic being that if an industry is amenable for operating several plants in a given country the same characteristics could be exploited to set-up plants in another country. In addition, highly skill intensive industries with entrepreneurial resources could also go abroad. Since the US enjoys skill and entrepreneurial resource advantages, the US firms are better suited to exploit this advantage in a foreign location. Caves tested his hypothesis to explain the share of foreign firms for a cross section of UK industries and obtained the following results.His dependent variable was Foreign Share in inter-industry differences in sales (share of MNEs in the sales of respective industries) in UK. He used the following independent variables as determinants:1. Percentage of shipments in the US industry accounted for by multi-plant firms;2. Advertisement as a percentage of sales in US industries;3. Value added per worker in the largest plants accounting for 50% of net output, divided
by the value added per worker in the smallest plant accounting for the other 50% in US
4. Royalty receipts of the UK industry divided by payments of royalties by the industry; 5. Value added per worker in UK.6. R&D Intensity in US7. R & D in UK. In his results the following variables emerged significant: advertisement intensities in the US, R&D in the US and UK, and minimum size advantages as seen by the variable (3). Based on this result, Caves concluded that ownership advantages of the US firms created through expenditures on product differentiation (captured by advertisement intensities), R&D, and economies of size contributed to FDI in the UK sectors. Several studies followed Caves and most of them were on similar lines. One common feature of these studies is that they considered the US the main home of MNEs and technological leader of the world. This assumption might not be always valid. In fact several European and Japanese firms have been investing in the US in high tech industries. While it could be true that the US could be the leader in most of the technologies, in the case of several specific technologies European and Japanese firms could have technological advantages. Some other countries could also have specialised areas of strength. In this context, it is worthwhile to enquire into what factors influence the FDI inflows to the US. Can the variables used in the study by Caves and others who followed Caves
18

7 Technology, Globalisation and Multinationals:The Asian Experience
explain FDI in the US? What role does intangible assets like product differentiation, R&D and size advantages play in explaining inter-industry differences in foreign share in the US? Lall and Siddharthan (1982) analysed the inter-industry differences in the share of FDI in the US industries. They argued that the strong US bias in the existing studies under the assumption that the US is the technological leader for all technologies is not valid. There are differences in the courses of innovations between the US and Europe. There are differences in technology and marketing strength and several other countries enjoy specialised areas of strength. They suggested that for FDI inflows into the US, intangible assets might not be important. On the other hand, inter-industry differences in the effective rates of protection erected by the US could explain the differences in foreign share in FDI. They obtained the following results: Their dependent variable was inter-industry differences in foreign share in US industries. In their study all the independent variables were based on the US data. They used the following determinants1. Advertisement intensity (Advertisement to sales ratio in the respective US industries)2. R & D intensity3. Four firm concentration ratio4. Multi-plant Operations5. Wage rate6. Skill Intensity – ratio of non-production workers to production workers7. Minimum Economies of Size8. Dummy for Consumer Goods9. Effective Rates of ProtectionIn their results, only two variables emerged significant – multi-plant operations and effective rates of protection. Based on the results they argued that the European and Japanese firms have been investing in the US mainly due to the protectionist measures adopted by the US. In the absence of these measures, the foreign firms would have preferred to export to the US rather than invest.Kumar (1987, 1990) using Indian data (1978-81) analysed the differential impact of ownership advantages on FDI and arm’s length technology inflows. In analysing inter industry differences in foreign share and licensing of technology against royalty and technical fee payments, he introduced variables representing both ownership of intangible assets and location advantages. He argued that the ownership of intangible assets would influence FDI and not licensing. On the other hand variables that influenced inter industry differences in licensing will not influence FDI (foreign share). He estimates separate equations for inter-industry differences in FDI (foreign share) and licensing (Share of licensing payments to sales). He used the following independent variables:1. Advertisement intensity2. Skill – used two variables to represent skill: non-production workers to total work
19

8Foreign Direct Investment: Main Determinants / N S Siddharthan
force and earnings of high salaried employees to total earning bill3. Capital sales ratio4. Average capital per firm in the industry5. Imports to local production6. Effective rates of protection7. Dummy for consumer goods8. Dummy for core industries as defined by the governmentIn his results, variables representing intangible assets like advertisement, skill intensities etc., are important for FDI (FS) and not for licensing. On the other hand, variables representing capital intensities and the core sector are important for licensing and not for FDI. Another noteworthy feature of the results is the negative sign for R&D for FS and positive sign for licensing. There is a strong complementary relationship between technology imports and in-house R&D activities. MNEs, however, prefer to perform their R&D in the home countries. By and large, this was the case during 1970s and early 1980s. In recent years there has been a dramatic change in the scene as discussed in the chapter dealing with R&D.
IV Locations Advantages and FDI InflowsSeveral studies consider investment climate and business environment as important factors influencing the location advantages of a host country. In this context a study of the World Bank (Batra et al 2003) identified several general constrains to operation and growth of firms in the host countries. These were the perceptions of the enterprises. The survey used a uniform core questionnaire for enterprises in eighty countries there by providing a basis for inter country comparison for investment climate and investment environment. I will mainly examine the results for two countries namely, India and China as they are comparable in size. About 60 per cent of the enterprises considered corruption as an important constraint for operations in India. Only 31 per cent considered corruption important for China. A majority of the enterprises considered infrastructure and policy instability important constraints for India. However, financing was considered a major constraint for China. In the survey most enterprises did not consider judiciary, crime and taxes important constraints for both India and China. As per this study corruption, infrastructure and policy instability were the main drawbacks of India compared to China. While policy makers in India and other developing countries have been emphasising infrastructure and fiscal measures for attracting FDI, they have not been sufficiently emphasising corruption and governance indicators. It is vital to find out the role of the governance variables and in particular corruption in attracting FDI. One of the earliest studies to test for the relevance of corruption in hindering the inflow of FDI was by Wei (2000). The study analysed the determinants of the bilateral stocks of FDI from
20

9 Technology, Globalisation and Multinationals:The Asian Experience
12 source countries to 45 host countries. The source countries include the US, Japan, Germany, UK, France Canada and Italy. The dependent variable was inward FDI. The following regression equation was estimated.
Where the dependent variable is the stock of bilateral FDI in logarithm in 1993 from source country i to host country j. Taxj and Corruptionj denote host country j’s tax rate on foreign corporations and its corruption level, respectively. X is a vector of control variables other than tax and corruption, namely, tax credit, political stability, GDP, population, distance between the two countries, linguistic ties between countries and wage rates. Most of these variables are normally included in the standard gravity models. The gravitation models argue that FDI inflows will also depend on the size and growth of the host country economy and the distance between the home and host country. The distance in addition to the actual distance between the home and host country would also include the cultural and linguistic distance between the two countries. Wei (2000) argues and shows that a 100/γ1 percentage point changes in tax rate and 1/ γ2 change in the rating of corruption would produce the same amount of change in the stock of FDI. (γ1 and γ2 the coefficients of tax and corruption). Using the tobit model estimates Wei shows that a one-step increase in the corruption level is equivalent to a rise in the tax rate by 7.53 percentage points. The statistical results clearly show the importance of corruption in influencing FDI inflows. The coefficient of corruption has a negative sign indication that countries with high levels of corruption deter FDI inflows. Wei argues that corruption acts as a tax except that the revenue goes to individuals and not to the government. Therefore in a corrupt country, any tax concessions offered by the government would be more than compensated by the prevailing level of corruption. Among the gravity variables, linguistic ties emerged important indicating home countries prefer to invest in countries with strong linguistic ties. On the other hand, physical (geographic) distance was significant only in the absence of OECD dummy and wage rates. This could reflect the strong trade and investments links among the European countries. In addition the size of market as represented by GDP and population also influenced FDI inflows. Wage rate had a positive sign indicating that FDI went to high wage skill intensive sectors.The presence of corruption, however, is only one aspect of bad governance. Good/bad governance is influenced by several other aspects like rule of law, political instability and violence, regulatory burden, governance effectiveness, voice and accountability. Globerman and Shapiro (2002) while analysing FDI inflows introduced governance index (principal component of the above mentioned variables) in addition to the variables used by Wei. In addition they also introduced human development index and an education index. Furthermore, they estimated the model separately for a sample of
21

10Foreign Direct Investment: Main Determinants / N S Siddharthan
less developed countries. They estimated the following equation:
WhereFDI Inflows averaged 1995-97GDP – Real GDP average 1994-96HDI – combines GDPCI, EDUCI & LIFEI ave. 1995-97GDPCI – GDP/capita indexEDUCI – Combining adult literacy, primary and sec enrolment rates.LIFEI – Life expectancy at birthGII – First principal component of LAW, INSTAB, REG, GOV, GRAFT, VOICE LAW – Rule of law indexINSTAB – Political instability and violence indexREG – Regulatory burden indexGOV – Government effectiveness indexGRAFI – Corruption indexVOICE – Voice and accountabilityThe following variables emerged significant with positive signs in both versions, namely, full sample and the sample consisting of only developing countries - Ln GDP, GII, EDUC, REG. The interactive variable Ln x GDP xGII, was significant only for the full sample.Their results highlight the importance of good governance and regulatory index in influencing FDI inflows. In addition the education index of the host country is also important in influencing the location of FDI. They suggest that the presence of rampant corruption and bad governance deters FDI inflows and this cannot be offset by fiscal and other incentives. There is evidence to show that the presence of corruption can alter the nature of FDI flows. Cuervo-Cazurra (2006) showed that corruption not only results in a reduction in FDI but also in a change in the country of origin of FDI. In particular corruption in the host country results in relatively less FDI from countries that have signed the OECD convention against bribery and corruption, but in relatively more FDI from countries with high levels of corruption. FDI from the latter does not contribute to technology
22

11 Technology, Globalisation and Multinationals:The Asian Experience
transfer or transfer of other intangible assets. They mainly contribute to tax avoidance and round tripping. In the study corruption indicators were taken from World Bank publications. The following model was estimated:
Following variables were used: HCC, Host country corruption – 0-5 (0 low), OECD Country, HCHC, home country with high corruption 1-0 variable, Ln GDP, Population, In Distance, Landlocked (0 none, 1 one of the countries, 2 both countries), Island (0, 1, 2), CB (Common Border, dummy), CL (common language, dummy),CC (Common colony, dummy), ECL (ever colonial line, dummy),Rtrade (restrictions on trade – 1 low 5 high), RFDI (restrictions on FDI – 1 very low 5 high).Their results showed that after controlling for the variables normally used in the gravity models and other control variables, countries with high levels of corruption gets less FDI in general and less FDI from technologically advanced OECD countries. However, they tend to get FDI from countries that are also known for high levels of corruption. The non OECD countries that have reputation for corruption are not likely to possess the state of the art technologies and are unlikely to be leaders in the production of new products or processes. Therefore FDI from such countries are not likely to enhance productivity or technical efficiency of the host country firms. Thus countries with high levels of corruption miss out on two features: receive less FDI in general and from technologically developed countries in particular. In addition most of the variables
23

12Foreign Direct Investment: Main Determinants / N S Siddharthan
used in gravity models emerged significant. Countries with larger GDP and population got more FDI. Furthermore, neighbours invested more among themselves, so were the countries that were part of the same colonial empire, and countries that shared the same official language.Another important issue in this area is whether FDI displaces (crowds out) domestic investments or aids domestic investments? Does the role of governance influence this behaviour? Morrissey and Udomkerdmongkol, (2012), based on data for 46 developing countries for the period 1996-2009 show that governance influences the relation between FDI and domestic investment. In their model they consider private investment as a function of FDI, growth of real output, public investment and governance indicators. They measure all the variables as a percentage of GDP. They consider the following five governance indicators – voice and accountability, political stability and absence of violence, regulatory quality, rule of law and control of corruption. In their results the coefficient of FDI was consistently negative and significant. They conclude that FDI does crowd out private investment. However, when FDI is used along with (in a multiplicative form) political stability and absence of violence, and rule of law the coefficient turns positive and significant. Thus good governance makes FDI complementary to domestic private investment. But in countries where governance indicators are poor FDI crowds out private investment.
V Location Choice: Agglomeration 1 The literature on FDI inflows favouring industrial clusters is rich. Statistical results from several studies focusing on developing economies strongly buttress the argument that foreign investors are inclined to favour such locations that could minimize information costs and offer a variety of agglomeration economies (He Canfei 2002). Belderbos and Carree (2002) analyse the location choices by Japanese electronics manufacturers in China’s regions and provinces during 1990-1995 and confirm the major impact of regions in promoting industry, and Japanese keiretsu-specific agglomeration benefits. Export-oriented plants are more responsive than local-market-oriented plants to Japanese-type (keiretsu) agglomeration and the presence of seaports, but appear less responsive to regional demand and region-specific incentives. Tuan and Linda (2003) find that with given distance from the core, firms prefer sites with higher firm agglomeration. It may also influence the sectoral pattern of FDI across countries or inter-country distribution of a particular sector’s FDI flows (Eaton, Lipsey and Safarian 1994). Evidence in favour of MNEs and regional clusters in the Chinese pharmaceutical industry was given by Zhang and Bulcke (2008).Wei (1999) analyses the determinants of the regional distribution of FDI within China
1 This section is based on my introduction to the special issue of the journal Science, Technology and Society (2012), on Agglomeration, Technology Clusters and Networks
24

13 Technology, Globalisation and Multinationals:The Asian Experience
and finds that there exists a long-term relationship between the spatial distribution of FDI and a number of regional characteristics. Provinces with a higher level of international trade, lower wage rates, more R&D manpower, higher GDP growth rates, quicker improvement in infrastructure, more rapid advances in agglomeration, more preferential policies and closer ethnic links with overseas Chinese attract relatively more FDI. Similarly, Jianping (1999) examines the agglomeration effects of the location of U.S. and Japanese manufacturing firms within China’s 30 administrative regions during the period 1981-1996. The empirical results indicate that agglomeration effects exist in both countries’ site choices, though they are varied in degree by sectors owing to firms’ nature and country’s preference. Likewise for Indonesia, Syamwil et al. (2000) analyse regional changes in the spatial pattern of Japanese manufacturing industries and the effect of deregulation of foreign investment during 1984-94. They use the data of 560 Japanese manufacturing industries in Indonesia. The result of this study indicates continuous regional concentration in the core region of Java and that markets, agglomeration and infrastructure continue to be the main reasons for the location of Japanese manufacturing industries in the region. Evidence from developed economies also displays the favouring of strong linkages between FDI and agglomeration (Ford and Strange 1999). Agglomeration economies, local industry output, educational attainment and English language ability have significantly positive effects on the location decision of firms investing abroad, whereas wage levels, unionization, and local industry productivity all had significantly negative effects.
Other Agglomeration AdvantagesHead et al. (1995) argue that firms in the same industry may be drawn to the same locations because proximity generates positive externalities or ‘agglomeration effects,’ and that chance events and government inducements can have a lasting influence on the geographical pattern of manufacturing. Their study examines the location choices of 751 Japanese manufacturing plants built in the United States since 1980 and its findings indicate that industry-level agglomeration benefits play an important role in location decisions. In yet another study Head and Ries (1996) find that `attractive’ cities, i.e., those with good infrastructure and an established industrial base, gained most and that agglomeration effects greatly magnified the direct impact of policy. Some recent studies have stressed the importance of intra-industry linkages. For example, Braunerhjelm and Swenson (1996) find the overseas operation of Swedish firms to be positively affected by the host countries’ large production in the industry of the investing firm. The effect of agglomeration was strongest in the technologically more advanced industries. Other studies have emphasized the role of the existing Japanese firms in attracting other Japanese firms to the same location (Head et al. 1995).
25

14Foreign Direct Investment: Main Determinants / N S Siddharthan
For the Indian automobile sector Odaka and Siddharthan (2008) show that auto-component units located in the clusters (in particular Chennai and Delhi clusters) perform much better in terms of productivity, profits, growth and indicators like low inventories compared to firms that were operating from non-cluster areas. In other words units operating from clusters enjoyed cost and technology advantages. For the IT sector several studies show cluster advantages in Bangalore.
VI Location Advantages Within a Country – A Study of India and China2 FDI and Inter-Province Differences in ChinaIt is well known that China is an important destination for FDI inflows. However, most of the provinces in China do not attract FDI. In China, by and large, provinces belonging to the Eastern Zone have been attracting FDI and they also happen to be the provinces enjoying higher per capita income (see Yao and Zhang 2001). The provinces belonging to the Western Zone have not been attracting FDI and they also happen to be the poorer provinces. In particular, the provinces that got high FDI also enjoyed high per capita income. These provinces also enjoyed better socio economic indicators.In his study analysing the determinants of inter-province differences of FDI flows in China, Siddharthan (2009) mainly followed the logic of earlier studies that analysed the inter-country differences in FDI flows using location advantages of countries. In particular, inter-country studies mainly used governance indicators and infrastructure (including human infrastructure) variables as determinants as determinants of FDI. The study selected five variables as main determinants of inter province differences in per capita FDI inflows in China. They are:1. per capita income of the province;2. per capita trade (total exports and imports) representing the international orientation
of the province; 3. Per capita electricity consumption;4. freight by roads and railways;5. Expenditure on social services representing the quality of life and social infrastructure.
These variables could also represent governance indicators.The dependent variable was per capita FDIIn his Generalised Least Square Estimates based on a time series – cross section pooled data set for the period 2000 to 2003 (four years) and for a cross section of 30 provinces all the variables -turned out to be significant. In particular, socio-economic indicators that were found to be significant in the inter-country differences in FDI inflows also emerge significant in explaining inter-regional differences in FDI inflows in China.
2 This is a revised version of my paper originally published in India’s Economic Future: Education, Technol-ogy, Energy and Environment, (2009), edited Manmohan Aggarwal, Social Science Press, New Delhi, Pages 71-102.)
26
15 Technology, Globalisation and Multinationals:The Asian Experience
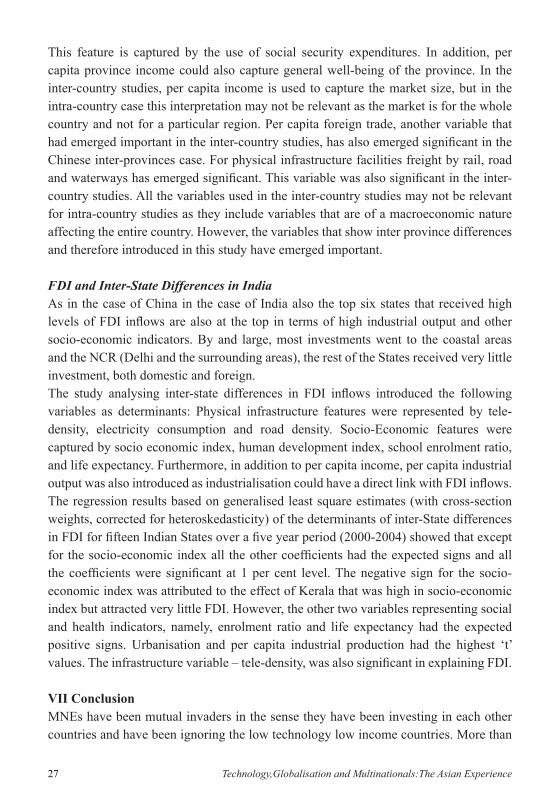
This feature is captured by the use of social security expenditures. In addition, per capita province income could also capture general well-being of the province. In the inter-country studies, per capita income is used to capture the market size, but in the intra-country case this interpretation may not be relevant as the market is for the whole country and not for a particular region. Per capita foreign trade, another variable that had emerged important in the inter-country studies, has also emerged significant in the Chinese inter-provinces case. For physical infrastructure facilities freight by rail, road and waterways has emerged significant. This variable was also significant in the inter-country studies. All the variables used in the inter-country studies may not be relevant for intra-country studies as they include variables that are of a macroeconomic nature affecting the entire country. However, the variables that show inter province differences and therefore introduced in this study have emerged important.
FDI and Inter-State Differences in IndiaAs in the case of China in the case of India also the top six states that received high levels of FDI inflows are also at the top in terms of high industrial output and other socio-economic indicators. By and large, most investments went to the coastal areas and the NCR (Delhi and the surrounding areas), the rest of the States received very little investment, both domestic and foreign. The study analysing inter-state differences in FDI inflows introduced the following variables as determinants: Physical infrastructure features were represented by tele-density, electricity consumption and road density. Socio-Economic features were captured by socio economic index, human development index, school enrolment ratio, and life expectancy. Furthermore, in addition to per capita income, per capita industrial output was also introduced as industrialisation could have a direct link with FDI inflows. The regression results based on generalised least square estimates (with cross-section weights, corrected for heteroskedasticity) of the determinants of inter-State differences in FDI for fifteen Indian States over a five year period (2000-2004) showed that except for the socio-economic index all the other coefficients had the expected signs and all the coefficients were significant at 1 per cent level. The negative sign for the socio-economic index was attributed to the effect of Kerala that was high in socio-economic index but attracted very little FDI. However, the other two variables representing social and health indicators, namely, enrolment ratio and life expectancy had the expected positive signs. Urbanisation and per capita industrial production had the highest ‘t’ values. The infrastructure variable – tele-density, was also significant in explaining FDI.
VII ConclusionMNEs have been mutual invaders in the sense they have been investing in each other countries and have been ignoring the low technology low income countries. More than
27

16Foreign Direct Investment: Main Determinants / N S Siddharthan
two thirds of FDI outflows emerged from developed countries and they also went to developed countries. FDI mainly occurred when the large corporations attempted to exploit their ownership advantages of technology, brand names and goodwill in a foreign location. The decision to invest abroad to produce the product rather than licensing out the ownership of intangible assets to third parties was mainly dependent on transaction costs and internalisation advantages. MNEs also tended to invest in countries that posed a technological threat to their ownership advantages. Hence, FDI flowing into other technologically advanced countries. In the pre-WTO regime tariff jumping and market seeing FDI were prominent. However, in the current WTO regime efficiency seeking FDI has become more important. Efficiency seeking FDI is mainly determined by location advantages. For location advantages variables used in the gravity models like the size of the market, geographical proximity, linguistic and cultural affinity and familiarity with legal systems played a leading role. In addition, the role of infrastructure in the host countries has emerged crucial. In addition to physical infrastructure, human infrastructure, skill intensity of the workforce, and above all good governance as exemplified by the absence of corruption and violence, enforcement of rule of law, and maintenance of relatively stable policies resulted in larger FDI inflows. Countries having good governance indicators FDI aids domestic private investment. In poorly governed countries FDI crowds out private investment.Within a country also FDI went to provinces/states that enjoyed better physical infrastructure like electricity, transport, telecommunication networks and urbanisation, and better human capital in terms of life expectancy and education. The poorer states with inferior infrastructure and poor human capital indicators attracted very little investment.
References
Batra, Geeta; Daniel Kaufmann and Andrew H. W. Stone. (2003): Investment Climate Around the World: Voices of the Firms from the World Business Environment Survey, The World Bank, Washington DC. i-ix, pp. 1-154.
Belderbos, Rene and Martin Carree. (2002). ‘The location of Japanese investments in China: agglomeration effects, keiretsu, and firm heterogeneity’. Journal of the Japanese and International Economies, Vol. 16, Issue 2, pp. 194-211.
Braunerhjelm, Pontus and Roger Swenson. (1996). ‘Host country characteristics and agglomeration in foreign direct investment’, Applied Economics, Vol.28, pp. 833-40.
Caves, R.E. (1974). ‘Causes of Direct Investment: Foreign Firms’ Share in Canadian and UK Manufacturing Industries’, Review of Economics and Statistics, Vol. 56, pp. 272-93.
Caves, R.E. (1996). Multinational Enterprise and Economic Analysis, (Second Edition), Cambridge Survey of Economic Literature, Cambridge University Press, Cambridge.
Chen, Shih-Fen S. (2010). ‘A general TCE model of international business institutions: Market failure and reciprocity’, Journal of International Business Studies, Vol. 41, pp. 935-959
28
17 Technology, Globalisation and Multinationals:The Asian Experience
Cuervo-Cazurra, Alvaro. (2006). ‘Who cares about corruption?”, Journal of International Business Studies, Vol. 37, Issue 6, pp. 807-822.
Dunning, John H. (1980). ‘Toward an Eclectic Theory of International Production’, Journal of International Business Studies, Vol. 11, Issue. 1 (Spring-Summer), pp. 9-31.
Dunning, John H. (1981). International Production and the Multinational Enterprise, Allen & Unwin: London.
Dunning, John H. (1993). Multinational Enterprises and the Global Economy, Addison-Wesley Publishing Company, Reading, UK.
Eaton, Curtis B., Richard G.Lipsey and A. Edward Safarian. (1994). ‘The theory of multinational plant location: agglomeration and disagglomerations’, Economic Growth and Policy Program, Canada Institute of Advanced Research, Canada.
Globerman, Steven and Daniel Shapiro. (2002). ‘Global foreign direct investment flows: The role of governance infrastructure’, World Development, Vol. 30, Issue 11, pp. 1899-1919.
He, Canfei (2002). ‘Information Costs, Agglomeration Economies and the Location of Foreign Direct Investment in China’, Regional Studies. December; Vol. 36, Issue 9, pp. 1029-36.
Head, K., J. Ries, and D. Swenson. (1995). ‘Agglomeration Benefits and Location Choice: Evidence from Japanese Manufacturing Investments in the United States.’ Journal of International Economics, Vol.38, pp. 223-247.
Head, K., and J. Ries. (1996). ‘Inter-city competition for foreign investment: static and dynamic effects of China’s incentive areas’, Journal of Urban Economics, Vol. 40, Issue 1, pp. 38-60
Jianping, Ding. (1999). ‘Agglomeration effects in manufacturing location - are there any country’s preferences?’ Economia Internazionale, Vol. 52, Issue 1, pp. 59-78
Kumar, Nagesh. (1987). `Intangible Assets, Internationalisation and Foreign Production: Direct Investments and Licensing in Indian Manufacturing’, Weltwirtschaftliches Archiv, 123-325-45.
Kumar, Nagesh (1990): Multinational Enterprises in India, Routledge, London and New York.
Lall, S. and Siddharthan, N. S. (1982). ‘The monopolistic advantages of multinationals: Lessons from foreign investment in the US’, Economic Journal, Vol. 92, pp. 668-683.
Morrissey, Oliver and Manop Udomkerdmongkol. (2012). ‘Governance, Private Investment and Foreign Direct Investment in Developing Countries’, World Development, Volume 40, Issue 3, pp. 437–445.
Okada, Aya and N.S. Siddharthan. (2008). ‘Automobile Clusters in India: Evidence from Chennai and the National Capital Region’, in Akifumi Kuchiki and Masatsugu Tsuji (eds.) The Flowchart Approach to Industrial Cluster Policy, London: Palgrave-Macmillan, pp. 109-144. (Chapter 5).
Siddharthan, N.S. and Kumar, Nagesh. (1990). ‘The determinants of inter-industry variations in the proportion of intra-firm trade: The behaviour of US multinationals’, Weltwirtschaftliches Archiv, Vol. 126, pp. 581-591.
Syamwil, Indra Budiman and Paul Hidehiko Tanimura. (2000). `The Spatial Distribution of Japanese Manufacturing Industries in Indonesia’, Review of Urban and Regional Development-Studies. July; Vol. 12, Issue 2, pp. 120-36.
Tuan, Chyau; Ng, and F.Y. Linda. (2003). ‘FDI facilitated by agglomeration economies: evidence from manufacturing and services joint ventures in China’, Journal of Asian Economics. January; Vol. 13, Issue 6, pp. 749-65.
Wei, Shang-Jin. (2000). ‘How taxing is corruption on international investors?’, The Review of Economics and Statistics, Vol. 82, Issue 1, pp. 1-11.
29

18Foreign Direct Investment: Main Determinants / N S Siddharthan
Wei, Yingqi. (1999). ‘The Regional Distribution of Foreign Direct Investment in China’, Regional Studies, Vol. 33, Issue 9, pp. 857-67.
Yao, Shujie and Zongyi Zhang. (2001). ‘Regional growth in China under economic reform’ The Journal of Development Studies, Vol. 38, Issue 2, pp. 167-186.
Zhang, Haiyan and Daniel van Den Bulcke. (2008). ‘China’s pharmaceutical industry: multinational enterprises and regional agglomeration’, in S. R. Hashim and N. S. Siddharthan ed, High Tech Industries, Employment and Global Competitiveness, Routledge, London, New Yoark and New Delhi, 2008, pp. 97-120.
30

1 Technology, Globalisation and Multinationals:The Asian Experience
Most developing countries have been inviting foreign direct investments (FDI) and have been offering concessions to multinational enterprises (MNEs) mainly to benefit from technology and productivity spillovers that could improve the performance of the domestic firms. However, several studies show that the spillovers are not automatic. Furthermore, while some local firms benefit from spillovers, certain other firms could become victims of MNEs entry. It is important to identify and analyse the characteristics of firms that could benefit from the entry of MNEs and those that could become victims. Moreover, the policies of the host countries could also play a crucial role in promoting spillovers. This chapter analyses the roles of local technological capabilities, in-house R&D, corporate governance of the MNE affiliates, vertical and horizontal linkages in influencing spillovers. In this context, the experience of Eastern European countries and China could be different, as government owned enterprises dominated their economies. The chapter will also cover literature in this area and draw appropriate lessons. Section I discusses the role of technology gap and in-house R&D in facilitating spillovers. Section II analyses the importance of ownership structure of the enterprises in attracting spillovers. Section III makes further distinctions in examining spillovers, namely, horizontal and vertical spillovers. When a country liberalises is rules regarding FDI inflows, spillovers need not happen immediately. In the initial years spillovers could even be negative. However, over a period they could become positive and emerge significant. Section IV presents the spillover dynamics. Section V deals with the recent phenomenon of Asia emerging as the main manufacturing hub of the world. Currently in several sectors the Asian firms enjoy higher productivities and are on the technological frontier. The concluding section brings out the main lessons from the literature survey.
I Technology Gap, In-house R&D and FDI SpilloversSome of the earlier studies on FDI spillovers introduced the concept of technology gap while explaining spillovers. In particular they argued that FDI spillovers would occur mainly to local firms whose productivity gap in relation to MNEs is small. Large technology gaps would indicate that the technologies used by local firms and MNEs are very different and local firms with outdated technology would not be able to gain by the
IV Foreign Direct Investment, Technology And Productivity Spillovers
31

2Foreign Direct Investment, Technology And Productivity Spillovers / N S Siddharthan
presence of MNE investment. In this context, the concepts of technology paradigms and trajectories are used. Technological paradigm shifts refers to major changes that alter the manufacturing configurations. Examples of paradigm changes include introduction of biotechnology, information and communications technology. In the established industries also there could be paradigm changes like the shift from batch system of production to conveyor belt method of production in the automobile industry, and change from cross ply tyres to radial tyres (Narayanan 1998). In developing countries R&D is not directed towards paradigm changes. Instead they import a technological paradigm and introduce changes to suit the market and resource conditions that give them trajectory advantages. In case the technological paradigm of the local firm is very different from that of the MNE, there can be no spillovers. The local firm may have to change its plant and machinery and the manufacturing configurations. This is a costly process and therefore many firms would delay the change. On the other hand, in case the local enterprise is in the same paradigm – smaller technological gap, spillovers will be easy.Kokko et al (1996) analysed the determinants of labour productivity (value added per worker) of 159 Uruguay manufacturing plants for the period 1988-90. They considered the following variables as determinants – capital labour ratio, plant capacity utilisation, royalty payments per employee, labour quality, size of the plant in relation to industry, foreign plant share in the industry, and the gap variable. They considered the foreign plant share in the industry representative of the spillover variable. A positive sign of the coefficient of the variable would indicate a positive spillover and a negative sign, a negative spillover. The gap variable measured the technology gap between locally owned and foreign owned firms. For locally owned plants that are less productive than foreign plants they measured the variable as a ratio of labour productivity of foreign owned plants by local plants. It is the inverse of this ratio for cases where the productivity of the local plants is more than the foreign plants.They further divided their sample into two groups – units with large technology gaps and units with small gaps - and fitted separate regression equations for each group. Their results showed that for the sample of firms with small productivity gaps, all the determinants turned out to be significant and in particular foreign ownership (share of foreign plants) was very important with a positive sign. However, with units with large productivity gaps the spillover variable was not important. In addition for the unit with large gaps, labour quality, and technology payments made were also not important. Based on these results, they concluded that only units with small technology gaps benefited from FDI spillovers. Technology acquisition could be either through in-house R&D expenditures or through purchase of technology against royalty and technical fee payments. Kokko et al ignored the in-house R&D efforts and considered only technology payments.
32

3 Technology, Globalisation and Multinationals:The Asian Experience
It would be useful to directly introduce the technological status of the firms in analysing the productivity spillovers and test for the importance of in-house R&D expenditures in facilitating spillovers. Kathuria (2002) based on a sample of 487 Indian manufacturing firms belonging to 24 three digit industries for the period 1989-90 to 96-97, argued and found that spillovers greater in the case of firms that spend more on in-house R&D. In this context he considered spillovers from two sources – first, spillovers from FDI (Spill1) and the second, spillovers from disembodied technology imports (Spill2). Following earlier studies he used the share of foreign firms’ sales in total industry sales to represent FDI spillovers, and foreign disembodied technological expenditures as a ratio of sales to represent the second. He also divided the sample into two groups – scientific firms and others. Scientific firms belonged to sectors that were relatively heavy spenders on R&D. In addition to introducing spillovers 1 and 2, he introduced an interaction variable wherein spillovers 1 and 2 were multiplied by in-house R&D. He also introduced the following control variables: imports, exports, technology imports, capital goods imports, and R&D all introduced as a percentage of sales turnover. Furthermore, firm’s growth and fixed investments were also introduced. Kathuria (2002) found significant differences in the determinants of productivity between scientific firms and the rest. FDI spillovers were significant for scientific firms but not for the rest. However, when FDI spillovers were used with R&D intensity in a multiplicative form the variable emerged significant for both set of firms. The import of capital goods was not important for either sets of firms; technology imports affected the second set negatively while it was not significant for the scientific firms. Based on these results Kathuria concluded that FDI spillovers depended on the in-house R&D activities of the local firms. Firms without in-house R&D units would not benefit from MNE investments. Even when the gap variable was introduced, the interaction variable, namely, FDI spillovers multiplied by R&D, emerged significant with a positive sign thereby re-emphasising the importance of R&D for spillovers.The importance of technological capabilities of local firms and in particular, their in-house R&D activity has also been highlighted in studies involving Chinese data. Hu et al (2005) drawn from a sample of large and medium enterprises in China for the period 1995-1999 found that technology transfer become more productive when the firm is also engaged in in-house R&D. In addition to foreign technology transfer they also introduced domestic technology transfer. This is an important addition to the existing literature. Technology transfer, both foreign and domestic was measured by a firm’s expenditure on disembodied technology purchased from a foreign (domestic) provider, such as patent licensing fees and payments for blueprints of technology. The impact of foreign and domestic technology transfer on firm productivity is largely conditional on interaction with in-house R&D. The coefficient of import of foreign technology had a negative sign – similar to Kathuria’s. However, the interaction term, namely, interaction
33

4Foreign Direct Investment, Technology And Productivity Spillovers / N S Siddharthan
of foreign technology with in-house R&D was positive and significant. Most developing countries and in particular India, placed several restrictions on FDI and technology transfer before they liberalised their economies in the early 1990s. Furthermore, liberalisation is an ongoing process and certainly not a one shot phenomenon. Under these circumstances, FDI spillovers, if any, need not be uniform over the years. Immediately after liberalisation, FDI and its spillover need not be much. However, over the years it could pick-up and increase. Studies that use the standard panel data techniques like fixed-effect models cannot capture the trend in spillovers over a period as the regression coefficients are averages over the sample period. Siddharthan and Lal (2004) estimated separate labour productivity function for each year (1993-2000) for a cross-section sample of Indian enterprises. They introduced the gap variable and spillover variable as represented by labour productivity of foreign firms in the respective industry. They also employed control variables like the relative size of the firms, capital intensity, advertisement intensity, import of technology, capital goods imports and export intensities. They estimated the following equation:
VAL is value added divided by the wages and salaries bill of the locally owned Indian firms; VALF, the industry averages of value added divided by the wages and salaries bill of MNE affiliates in India; GAP is equal to VALijt/VALFjt; MS, the market share, is sales turnover of the given Indian firm; MSF, the market share of MNE affiliates in the given industry; COR, capital output ratio of the Indian firm; AD, advertisement expenditures of the Indian firm as a ratio of sales turnover of the Indian firm; EXPORT, exports to sales ratio of the Indian firm; IMPTECH, technology imports, royalty and technical fee payments as a ratio of sales turnover of the Indian firm; and IMPCAP, import of capital goods as a ratio of sales turnover of the Indian firm.
It is important to note that all α coefficients have a time subscript indicating that they can change every year. The hypothesis is that the coefficient of the spill over variable, namely, α3t, will change over the years in a predictable way.
34

5 Technology, Globalisation and Multinationals:The Asian Experience35
In their results, the gap variable turned out to be significant for all the years. In the case of spillovers, the value of the spillover coefficient (α3t) was low in 1993 (0.654) and it increased rapidly over the years and reached a peak of 1.557 in 1998 and stabilised thereafter. Their results clearly showed a strong trend in the coefficient of the spillover variable. They, therefore, advocated against pooling of time-series and cross-section data to estimate the labour productivity function. For the sake of comparison they also estimated fixed and random effect models using pooled data. In these equations also the spillover variable and the gap variable was significant, however, since the estimated coefficients were averaged over the years, the increasing trend over the years that is crucial for understanding of the liberalisation process was not visible.
II Ownership Structure and SpilloversThere is evidence to show that corporate governance and ownership structure of MNEs, their affiliates and the behaviour of local firms could also influence spillovers. Javorcik et al (2008) argue that the ownership structure in foreign investment projects affect the extent of vertical and horizontal spillovers. Affiliates of joint ventures may face lower costs of finding local suppliers of intermediaries compared to wholly owned subsidiaries and consequently could outsource more. This could lead to higher productivity spillovers in the local supply sector (vertical spillovers). MNEs are known not to transfer sophisticated technology to partially owned affiliates. This could force the joint venture local partners to network with local producers resulting in horizontal spillovers. They estimated the following equation:ΔlnTFPi t=β0+β1ΔHor izon ta l_sha red j t+β2ΔHor izon ta l_100%_fore ign j t+β3ΔVer t i ca l_
sharedjt+β4ΔVertical_100%_foreignjt+β5ΔConcentrationjt+β5ΔlnImportsjt+αj+αr+αt+uit (3)
Where TFP is the total factor productivity of each firm in the sample estimated by the following flexible tranlog specification.
Where Yit stands for a firm’s output, Mit, Kit and Lit and represent production inputs: materials, capital and labour.Their results based on a sample of European (including Eastern Europe) enterprises suggest that ownership pattern does influence productivity spillovers. In particular they found joint ventures contribute to positive productivity spillovers to upstream sectors. No such spillovers were found for wholly owned subsidiaries. In fact in their regressions (the dependent variable was total factor productivity of enterprises) the coefficient of wholly owned foreign firms was negative. Other aspects of ownership structure of both MNEs and local firms could also influence productivity spillovers. In China and India several firms are owned by the government

6Foreign Direct Investment, Technology And Productivity Spillovers / N S Siddharthan
(in India they are called public sector enterprises) and there are reasons to believe that spillovers need not be uniform for the two groups. Furthermore, in the case of China, FDI inflows consist of investments from OECD countries and from overseas Chinese. The technology bases of these two sources are not the same and therefore, they could also influence the spillovers. Buckley et al (2002) for a sample of Chinese enterprises considered separately the ownership advantages of overseas Chinese firms and OECD firms. They also distinguished government owned enterprises from the rest. They estimated the following multi equation model:
Where p, h, n and e represent the form of spillovers-p denotes productivity, h development of high-tech products, n development of new products, and e export intensity, while d, s and c represent all Chinese domestically-owned firms, SOEs (State owned enterprises) and COEs (collectively [privately] owned enterprises) respectively. KL, capital labour ratio, RI, R&D intensity, LQ, labour quality and FS, firm size.In their econometric study explaining labour productivity of domestic enterprises, they did not find FDI from overseas Chinese contributing to productivity changes. On the other hand, FDI from developed OECD countries contributed significantly to increases in productivity of local non-government enterprises. There were no spillovers to government enterprises. In other words, spillovers are not automatic and not all FDIs results in spillovers. They depend on the sources of FDI and ownership pattern of the local firms.
III Vertical and Horizontal SpilloversMost works on FDI spillovers concentrate on spillovers within the industry (intra-industry). They test whether the presence of MNEs in a given industry influences the productivity of local firm in the same industrial sector. However, spillovers could also be in the downstream and upstream industries. In recent years some studies have appeared to test this phenomenon. Bitzer et al (2008) mainly concentrate on this aspect of spillovers. Their paper examines the vertical linkages for productivity spillovers using comparable data for a number of OECD countries. It investigates whether OECD countries and Central and East European countries benefit differently from inward FDI. The panel consisted of 17 countries over the period 1989-2993. If the finding was in favour of differences among these two set of countries, then it would have implications for developing countries like India and China. They found important differences in spillovers to domestic firms between OECD countries and East and Central European
36

7 Technology, Globalisation and Multinationals:The Asian Experience
countries. In the case of OECD countries the horizontal spillover coefficient was significant at 1 per cent level, while for the East European countries it was significant only at 10 per cent level. However, there was very little difference between the two groups with regard to vertical spillovers. This result has implications for developing countries. Most developing countries, while giving special concessions for MNEs, expect the presence of foreign firms with superior technology to enable the local firms to modernise and become globally competitive. However, reduced spillovers to local firms in East Europe could also be due to a technological gap between the local firms and MNEs. It is possible that most of the East European firms operated in the earlier technological paradigm where scope of spillovers is low.
IV Spillover DynamicsIt is possible that spillovers may not occur or may even be negative in the short-run, but could turn beneficial in the long run. If the technological gap is large, the management of the local firm would be forced to change the manufacturing configuration, introduce major changes in the unit and allot a great deal of management’s time for technology acquisition and modernisation. These activities could result in a negative spillover resulting in a negative productivity growth in the short-run. However, once the unit shifts to a new paradigm, the productivity growth could become large and impressive. Liu (2008) for an unbalanced panel consisting of 17,675 manufacturing firms over a period of 5 years from 1995 to 1999 found evidence of FDI spillovers raising the long-term productivity growth of Chinese units. They observed that in the short-run the spillovers had a negative effect on the productivity growth of the Chinese units, but in the long run it resulted in a higher growth rate of productivity. Taken together, the overall impact on growth of productivity was positive and substantial. Furthermore, in the long run in addition to horizontal spillovers, backward linkages (vertical spillovers) were the most important channels through which domestic firms benefited most. This finding is also very important as backward linkages and vertical spillovers could benefit a larger set of enterprises and not merely those belonging to that particular sector.
V Emergence of Asia as Global Manufacturing Hub The studies surveyed in this chapter mainly deal with a decade old data. However, in recent years, manufacturing activities even in high technology industries have been shifting to Asian countries. Asia in general and China in particular has emerged as the main manufacturing hub of the world. The competitive advantage has shifted to Asian countries. Under these conditions, Asian manufacturing firms are more likely to be in the frontier than the MNEs from Europe and the US. Some of the unpublished studies
37

8Foreign Direct Investment, Technology And Productivity Spillovers / N S Siddharthan
for India using frontier production functions show that in most sectors the Indian firms are at the frontier. In such cases the spillover has to be from Indian and Chinese firms to the MNEs. Even in the case of non-export intensive industries like industrial machinery, a study by Keshari (2013) show in the case of India that out of the top five firms that are near the frontier, three of them are Indian firms. In the case export intensive sectors like pharmaceuticals and automobiles more domestic firms would be in the frontier.Furthermore, several Asian firms have started investing in other countries including Europe and the US. They have also been acquiring foreign firms. All these indicate the increasing competitiveness of the Asian firms.
VI Lessons from LiteratureWhether an enterprise benefits from spillover or not depends on the technology and productivity gap between the local firm and the MNE. Firms that have large technology gaps may not be able to benefit from FDI spillovers and could even become victims . However, if they invest resources to change the manufacturing configuration and modernise their unit, in the long run they could gain substantially. Furthermore, whether an enterprise gains from MNEs presence or becomes a victim depends on the local enterprises R&D base. Enterprises that invest in R&D and having a good technological base are likely to benefit from the presence of MNEs. Additionally, firms with high R&D spending also benefit from import of technology through royalty and technical fee payments. India and several other developing countries started liberalising their economies during the last decade or two. Till then they exercised strict control over FDI and regulated the activities of MNEs. However, liberalisation is a continuing process and immediately after the first act of liberalisation productivity spillover need not occur. During the initial stages of liberalisation spillovers are likely to be modest and would increase over the years. This trend in increase in spillovers cannot be captures if one uses pooled time-series and cross-section techniques as the regression coefficients vary with time in a predictable way.Spillovers also depend on corporate governance and ownership structure. Some studies report that joint ventures results in greater spillovers compared to wholly owned subsidiaries. Furthermore, technology and productivity spillovers are more in the case of FDI from developed countries that are technologically advanced. With regard to benefits to the local firms, evidence from China show that government owned firms received very little spillovers compared to other private Chinese firms.It is also important to take into account dynamics in spillover. In the short-run spillovers could be modest and even negative, however, in the long-run spillovers could be substantial and beneficial. In the long-run innovative firms from developing countries cannot depend only on
38

9 Technology, Globalisation and Multinationals:The Asian Experience
spillovers to emerge globally competitive. Instead they should evolve strategies to emerge as global leaders in their own right. For example, successful Indian firms did not wait for spillovers to take place. They had a positive strategy to tackle the entry of foreign firms with advanced technology. Some Indian firms entered into a series of non-equity strategic alliances with several MNEs and Indian firms. Such strategic alliances seem to have enabled these Indian firms to enhance their productivity and emerge competitive in several sectors like IT, automobiles, electronics, drugs and pharmaceuticals. The manufacturing base has shifted from the US and Europe to Asia in general and in particular, China and ASEAN countries. If a study is conducted using frontier production function, it could find in several cases the Asian firms in the frontier and not MNEs from developed countries. This success has been achieved partly by inviting MNEs and benefiting from spillovers in the initial stages. However, later the Asian firms overtook the MNEs from OECD countries as a result of their investments in R&D and collaborations with domestic universities and research laboratories.
References
Bitzer, Jürgen, Ingo Geishecker and Holger Görg. (2008). ‘Productivity spillovers through vertical linkages: Evidence from 17 OECD countries’, Economic Letters, Vol. 99, Issue 2, pp. 328-331.
Buckley, Peter J.; Jeremy Clegg and Chenjqi Wang. (2002). ‘The impact of inward FDI on the performance of Chinese manufacturing firms’, Journal of International Business Studies, Vol. 33, Issue 4, pp. 637-655.
Hu, Albert G. Z., Gary H. Jefferson, and Qian Jinchang. (2005). ‘R&D and Technology Transfer: Firm-Level Evidence from Chinese Industry’, The Review of Economics and Statistics, November 2005, Vol. 87, Issue 4, pp. -780–786.
Javorcik, Beata Smarzynska and Mariana Spatareanu. (2008). ‘To share or not to share: Does local participation matter for spillovers from foreign direct investment?’, Journal of Development Economics, Vol. 85, Issues 1-2, pp.194-217.
Kathuria, Vinish. (2002). ‘Liberalisation, FDI and productivity spillovers – an analysis of Indian manufacturing firms’, Oxford Economic Papers, Vol. 54, pp. 688-718.
Keshari, Pradeep Kumar. (2013). ‘Technological determinants of firm-level technical efficiency in the Indian machinery industry’, Innovation and Development, Vol. 3, Issue 2, pp. 223-238.
Kokko, Ari, Ruben Tansini and Mario C. Zejan. (1996). ‘Local technological capability and productivity spillovers from FDI in the Uruguayan manufacturing sector’, Journal of Development Studies, Vol. 32, Issue 4, pp. 602-611.
Liu, Zhiqiang. (2008). ‘Foreign directinvestment and technology spillovers: Theory and evidence’, Journal of Development Economics, Vol. 85, Issues 1-2, pp. 176-193.
Narayanan, K. (1998). ‘Technology Acquisition, De-regulation and Competitiveness: A Study of the Indian Automobile Industry’, Research Policy, Vol. 27 No.3 pp. 215-28.
Siddharthan, N. S. and K. Lal. (2004). ‘Liberalisation, MNE and Productivity of Indian Enterprises’, Economic and Political Weekly, Review of Industry and Management, Vol. 39, Issue 5, pp. 448-452.
39
1 Technology, Globalisation and Multinationals:The Asian Experience
Based on a survey of literature, this chapter highlights some of the important issues relating to Research and Development activities. The chapter begins with the traditional Schumpeterian paradigm emphasising the role of market structure and size of the enterprise in influencing innovative activities (Section I). It identifies three sets of factors, namely, appropriability, technological opportunity and diffusion that determine R&D. Section II analyses the relative importance of the three sets of factors and shows that technological opportunity, (which is mainly the result of university and government funded research,) and diffusion are much more important than appropriability in determining innovative activities of firms. Hence, overemphasis on stricter intellectual property protection aimed at increasing appropriability could be counter-productive. In this context, it refers to the new Internet revolution that has ushered in peer production and mass collaborations.Another important issue discussed in this chapter relates to the relationship between technology imports and in-house R&D efforts. Sometimes the matter is also posed in terms of either, “make or buy option” or “make and buy decision”. If in-house R&D and technology imports are substitutes then technology imports will stand in the way of in-house R&D efforts. On the other hand, if they complement each other then imports of technology becomes an important input to in-house R&D efforts. Section IV discusses these issues. The section also considers the option available to low R&D spending firms in terms of buying R&D units rather than merely importing technology. The R&D behaviour during economic downturn is discussed in Section V.In recent years R&D collaborations, that is, collaborations between R&D units, universities, and research institutions have assumed importance. Several R&D units network with other units and university departments. It is important to find out the nature and characteristics of units that network and the consequences of networking to the units and other institutions. Section VI examines the issues arising out of R&D cooperation between institutions. The section discusses the benefits of collaborations and the associated problems like appropriability, division of costs and difficulties involved in promoting mutual trust. The section also analyses the nature of collaborations between universities and in-house R&D units and the benefits that accrue to them. In addition to formal collaboration between units, there have also been informal collaborations, and
V Determinants of R&D: Lessons from Literature 1
40
1 Revised and enlarged version of the paper originally published as: N S Siddharthan, ‘Determinants of R&D: Lessons from Literature’, in S R Hashim, K S Chalapati Rao, K V K Ranganathan and M R Murthy (eds), Indian Industrial Development and Globalisation, Academic Foundation, New Delhi, 2008, (pp383-408)

2Determinants of R&D: Lessons from Literature / N S Siddharthan
the type and consequences of such collaborations are also investigated. Section V draws some lessons from the literature survey.
I Market Structure and Research & Development (R&D) ActivitiesNeoclassical economics, by and large, ignored R&D activities and issues relating to technological creation and change. As pointed out by Schumpeter (1942), neoclassical economic theory mainly dealt with price competition at the cost of quality competition and sales efforts. However, Schumpeter stressed on the fact that in capitalist reality what counts is competition from the new commodity, the new technology, the new source of supply, and the type of organisation. One of the important reasons for economists’ obsession with price competition and neglect of innovative activities is due to their hostility to monopolistic market structures and large-scale businesses. This is mainly due to their fascination with the elegant result the neoclassical theorists derived, namely, that monopoly prices are higher and output lower compared to perfect competition. But this inference is valid only if the method and organisation of production in the monopoly and perfect competition market structures are the same. On the contrary, as emphasised by Schumpeter:
Actually, however, there are superior methods available to the monopolists which either are not available at all to a crowd of competitors or are not available to them readily (Schumpeter 1942, p. 100).
Accordingly in the Schumpeterian paradigm, market structure is an important determinant of innovative activities. In a perfectly competitive market structure, in the long run, all the firms are expected to earn only normal profits. Under these conditions, firms will not have a surplus to invest in innovative activities. Hence, perfect competition is incompatible with the introduction of new products and processes. On the other hand, under monopoly, firms earn super normal profits, which could be used to develop new products and processes. In the Schumpeterian paradigm, the monopolist gets a reward for taking the risk of introducing new products and processes in the form of monopoly rents. However, the monopoly position is not a safe cushion to relax as other firms would soon catch-up and start competing by introducing other products. Hence, the monopolist has to continuously spend on R&D to keep ahead of other potential competitors. Nevertheless, Schumpeter did not formulate a linear relation between market concentration and innovative activities. The second important determinant in the Schumpeterian paradigm is the influence of the size of the firm on its R&D activities. Size of the firm has two distinct, though related influences on R&D. The first, relates to the existence of minimum economies of size. Most R&D units, to be effective, need minimum threshold investment levels below which no worthwhile technology will either be produced or commercialised. As distinct from minimum size economies, R&D units also enjoy scale economies. The existence of scale economies imply that R&D expenditures of firms need not increase in proportion to firm size but could increase less than proportionately to the increase in size. Consequently, R&D intensity or R&D expenditures divided by size would decrease with
41

3 Technology, Globalisation and Multinationals:The Asian Experience
size. Hence, the size variable captures two effects, namely, the threshold effect and the scale effect. It is not possible to capture both effects in a single equation by introducing size as a determinant of R&D, as the coefficient of size is positive in one case and could be negative in the other case.While introducing the role of market structure on R&D, most studies used seller concentration ratios (the ratio of the top four or eight firms in the output of the product/industry) as a proxy for market structure. These studies also hypothesised a linear relationship between seller concentration ratios and R&D. Farber (1981) departed from this practice and introduced buyer concentration ratios in addition to seller concentration ratios in determining inter-industry differences in R&D.Farber (1981) argues that buyer market structure could also affect the nature of competition in the industry. His main thesis is that the interaction between the buyer and seller market structures would have maximum influence in determining R&D intensities in a given industry. In his model he considers R&D, advertisement intensity and seller concentration ratios as endogenous variables and estimates the model using two stage least squares method.The following equation was estimated:
Where, π, profit; BCR, buyer concentration ratio; SCR, seller concentration ratio; A/S, advertisement to sales ratio; R&D/N, R&D expenditures per person; KR, product of minimum efficient scale of plant and the industry asset to value of shipment ratio; DUR product durability; CE chemical and electrical; M moderate and high tech based on growth of patents with sales. CDR ratio of average value added per worker in plants supplying the bottom 50 per cent of the industry sales divided by the average value added per worker for the largest 50 per cent of the plants. When CDR is less than .80 MES20 is equal to minimum efficient scale of the largest plants otherwise MES20=0.RBFS, average firm size of industries buying from industry i relative to the average firm size in industry i. Representing monopsony power.His statistical results show the crucial role played by the interaction variable, namely, the interaction of seller and buyer market structures. R&D intensities are high in market structures, which are dominated by both oligopsony and oligopoly. The main reason for this result is the role played by appropriability in determining investments in R&D. The market structure where there are few buyers and few sellers ensures maximum appropriability. By and large, industries like aeronautics, pharmaceuticals, some segments of information and communication technology sector, and certain segments of automotives are R&D intensive. In all these products there are a few firms producing high tech components which are sold to a small group of assemblers who market the final product. In most cases the component manufactures and the dominant companies that buy the components have long-term strategic relationships; and in several cases the final product manufacturers and the high tech component suppliers undertake joint R&D. These R&D intensive sectors that are dominated by oligopoly and oligopsony enable firms to collaborate in R&D and produce new designs and products. In most of
42

4Determinants of R&D: Lessons from Literature / N S Siddharthan
these sectors technological change is very fast and the end-product manufacturing firm buys most of their components and other inputs instead of manufacturing them in-house. Consequently, the value addition of the final product producing firm is not high. In cases where about 80 per cent of the inputs are bought from other firms, the quality of the final product and the technological change in the sector would depend on the changes in the design and the quality of the inputs and components. These characteristics of the sector compel the manufacturers of the final product to actively collaborate with the component and input manufacturers in developing new designs and products. If there are large number of sellers and very few buyers, such strategic relationships between buyers and sellers are not possible as there are too many sellers. In these kinds of markets, the sellers could sell standardised goods and the buyers would buy them at arm’s length. For example, in automotive industry, some of the components could be high tech that needs active collaboration between the automobile producer and the component-manufacturing firm, while some of the components like ball bearings could be standardised and produced by many firms. Likewise, in a market structure where there are large number of buyers and very few sellers’, active collaboration and high R&D spending is not possible.
II Appropriability, Technological Opportunity and DiffusionAppropriability is only one of determinants of R&D. There are other factors that could be of importance like technological opportunity and diffusion. To test for the relative importance of the various determinants of R&D that have been identified in literature, it is important to consider all the relevant variables in the same equation. Furthermore, it is desirable to use firm level data rather than the industry level aggregates as firms within an industry differ substantially with regard to R&D.In this context. Cohen and Levinthal (1989) argue that R&D not only generates new technologies but also enhances the firm’s ability in assessing and exploiting existing technology. Firms also invest in R&D in order to successfully utilise external information. External knowledge or outside information could be targeted ones like commissioned research. Knowledge developed by competitors, material suppliers and down stream industries would also positively influence in-house R&D spending. External knowledge could also be less targeted, like knowledge developed by universities and publicly funded research labs. Knowledge developed by equipment suppliers and university and government funded labs could be considered as those providing technological opportunity. They provide the input for the firm’s R&D. Cohen and Levinthal (1989) analysed the determinants of R&D intensities (R&D expenditure as a percentage of sales turnover) of firms. They considered a comprehensive set of variables representing appropriability, technology developed by users, government and universities. Furthermore, in order to examine the relative importance of basic and applied research done by the research institutions in influencing the firm’s R&D behaviour, they separately considered applied research in areas such as computer science, material technology, equipment technology, agricultural science, material science, medical science and metallurgy. Among basic sciences they considered biology, chemistry, mathematics and physics.
43

5 Technology, Globalisation and Multinationals:The Asian Experience44
Their econometric results showed that while appropriability is important in determining R&D spending by firms, technological opportunity is even more important. Furthermore, among the technological opportunity variables, those representing basic sciences emerge more important than the applied ones. The only exception among the applied sciences was computer science. Likewise, university and government funded research turned out to be very important in determining firm’s R&D. Moreover, values of regression coefficients were uniformly higher for basic sciences.Jefferson et al (2006) investigated the determinants of firm level R&D intensity for 20,000 large, medium and small Chinese enterprises for the years 1995-1999. Using a three equation model they explained R&D intensity, R&D output (ratio of new product sales to total sales) and performance (productivity and profitability). Their results showed that R&D performers are mainly capital intensive large firms. They are mainly concentrated among state owned enterprises and share holding companies, and least concentrated among foreign and overseas enterprises. R&D intensity is influenced by size, market concentration and profitability. They also found a robust association between R&D intensity and new products. The results also show significant returns to new product sales. In their study, state owned enterprises are not efficient in knowledge production; however, once they acquired knowledge they are efficient in utilising it. There are certain other factors that also influence in-house expenditures on R&D. One of them is related to impact on R&D on the firm’s performance. Firms that find R&D contributing to their productivity and stock valuation would be motivated to spend more on R&D. Furthermore, expenditures on R&D also depend on the corporate governance. In particular, it will depend on stock ownership pattern, debt structure of the firm and its relationship with the banks. These aspects have been analysed by Hosono et al (2004) in depth. They examined the effect of R&D on stock market performance and total factor productivity growth. For a sample of Japanese firms they found the effect of R&D and market valuation to be positive and significant for the 1990s. During 1980s the effect on stock valuation was positive but the effect on productivity was real. With regard to corporate governance, their study shows that the shareholdings ratio of large shareholders and the leverage ratios are positively correlated with R&D. However, the share of bank loans is negatively correlated with R&D. This result is as expected as the banks are known to have a short horizon. There is also evidence that innovative activities are more in industrial clusters than in stand-alone units (Cainelli and Liso, 2005).If technological opportunities and spillovers were important, it would be useful to know that under what conditions firms gain by them and what types of firms gain. Several studies have shown that productivity of firms depend not only on its own R&D effort but also on spillovers or pool of scientific knowledge accessible to it. These and related issues were analysed by Kafouros and Buckley (2008). In particular, they seek answer to the following question: When do firms utilise successfully external knowledge to create additional value, and when do they fail to do so? Their data set consists of 138 UK firms for the period 1995-2002. Their study shows that the answer to the question would depend on whether the firm in question is high tech or low tech. High tech firms enjoy good returns on their R&D while the pay-off for the low tech one is lower. In the case of intra-industry spillovers (impact of R&D done by their intra-industry rivals) also
6Determinants of R&D: Lessons from Literature / N S Siddharthan
the high tech firms gain more. In fact their study shows that low-tech firm could even have negative spillovers. This they attribute to the limited ability of the low-tech firms to draw on external scientific knowledge. Likewise, inter-industry spillovers are also higher for high tech firms. High tech firms not only benefit from their own R&D, but also from R&D done by other firms. Furthermore, R&D productivity also depend on the size of the firms, here again larger firms benefited more than the smaller ones. Nevertheless, the contribution of spillovers to smaller firms is more than the contribution of their own R&D. This they attribute to the adaptive nature of R&D performed by the smaller firms.The important role played by technological opportunity and university research in influencing in-house R&D expenditures raise several questions regarding policies that aim to promote appropriability at the cost technological opportunity like strengthening the patent regimes. The World Trade Organisation (WTO) regime has substantially increased the level of intellectual property protection and has made it mandatory for the member nations to introduce product and process patenting and has also increased the duration of the patents. All these measures were demanded by large corporations during the 1980s and 1990s. More recent studies have shown that increased patent protection need not necessarily contribute to more innovative activities. For instance, Allred and Park (2007) based on a detailed study of pharmaceutical industry (an industry wherein patenting is considered very important), found that while increased patent protection could potentially increase domestic patenting by developed country firms, it could adversely affect the patenting of developing country firms. This, in their view, could lead to North-South conflicts, in that stronger patent system may have opposite effects on Northern and Southern innovations and diffusion.In recent years, several corporations have found patenting and enhanced protection counterproductive even for Northern firms. As emphasised by Tapscott and Williams (2006), several companies have started opening their doors to the world and have started sharing their resources that they once closely guarded and considered proprietary. Examples include IBM opting for Linux a open source platform, Procter & Gamble, Boeing, Dow, DuPont and others registering with and using InnoCentive network to solve R&D problems. Several pharmaceutical giants have abandoned their proprietary R&D projects to support open collaborations such as the SNP Consortium and Alliance for Cellular Signalling, and many bio-tech firms have voluntarily placed their DNA related work on open websites. These were the very firms that were demanding stricter patent protection during the 1980s. The change in the attitudes of large corporation relating to protection of intellectual property and favouring open systems is mainly due to the significant role played by technological opportunity in furthering innovations. University and government funded research in basic and applied sciences have been the main raw material for in-house R&D. If the results of these researches become proprietary, then firms will be deprived of the materials out of which new products and processes could be developed. Some pharmaceutical firms have also been working on DNA related research. But by treating their results as closely guarded secrets, they stand in the way of further development of science. On the contrary, if they allow others to build on their research, technological opportunities would grow for R&D. In any case, profits for firms come mainly from
45

7 Technology, Globalisation and Multinationals:The Asian Experience
new products and processes and not from scientific research. By giving access to their scientific research the firms gain.There is another aspect to this debate that is also important. If the university and academic research output is an important input for in-house R&D units, then it could be argued that the patents of the firms are based not only on their own in-house R&D but also on academic research. However, academic scholars who prefer publication of their results in professional journals have no share on the revenue emanating from the patents. The patents system under these circumstances appears unfair to academic scholars. On the positive side there is evidence that widespread use of web, Internet and information and communication technologies have encouraged firms to be more open and seek wider collaboration from unrelated third parties. This has encouraged peer production and mass participations in R&D (Tapscott and Williams 2006).
III In-house R&D and Technology ImportsThe relationship between in-house R&D and technology imports has been a much-discussed issue in literature (Odagiri 1983, Siddharthan 1988, 1992). In particular it is important to know whether technology imports complements or substitutes in-house R&D efforts. To put it differently, is the decision to undertake R&D and import technology, a make (perform your own R&D) or buy (import technology) decision or make and buy decision? If it turns out to be a make or buy decision, R&D and technology imports would be substitutes. However, if it emerges as a make and buy decision, then they are complementary. Odagiri (1983) hypothesised a negative relationship between in-house R&D and technology imports indicating a substitution relationship. He argued in favour of make or buy proposition. When he tested the proposition for a set of Japanese companies, to his surprise he found the relationship to be positive - supporting a complementary relationship in favour of the make and buy proposition. In the next step, he classified the sample firms into firms that do innovative research and those that do adaptive research. He found a positive relationship in the sample consisting of firms doing adaptive research, but a negative relationship for the sample consisting of firms doing innovative research. Based on these results he concluded that importing technology stands in the way of innovative R&D but not for firms performing adaptive research. In developing countries most firms do mainly adaptive research and therefore one could expect a complementary relationship for these firms. Siddharthan (1988) for a cross-section of Indian industries and firms for the period (1982-85) analysed the role of technology imports, firm size and age in determining in-house R&D expenditures as a ratio of sales turnover. While doing so he argued that the public (government owned) and private sector firms should not be clubbed as their behaviour relating to R&D and its determinants could be very different. He therefore considered them separately. His study shows a positive relationship between the private sector firms R&D and technology imports while no such relationship has been found for the public sector (government) firms. For the private sector the positive relationship between technology imports and R&D is particularly strong for units operating in electronics and textiles. However, the relationship is not strong for firms in chemical industries. This he attributed
46
8Determinants of R&D: Lessons from Literature / N S Siddharthan
to the weak intellectual property protection regime that India followed during the early 1980s. For both public and private sector firms, the relationship between firm size and R&D has emerged ‘U’ shaped indicating that both very small and very large firms spend more on R&D relative to their size. This result is mainly because the nature of R&D performed by the small and large firms is not comparable. The nature and scope of the two sets of R&D are different and in particular the scope of the small firm’s R&D is more modest. Furthermore, very small firms have to spend more on R&D relative to the size due to threshold levels in R&D and their expenditures need not increase in proportion to the increase in their size due to the presence of economies of scale in R&D. Technology transfer could be of two types, first, intra-firm transfer through foreign direct investments and second, inter-firm transfer at arm’s length. It would be worthwhile to analyse the relationship between the two modes of transfer and R&D. For a sample of Indian firms, Siddharthan (1992) found both foreign equity participation (intra-firm transfer of technology) and royalty and technical fees (limp-sum payments) were positively related to in-house R&D expenditures and were statistically significant. This indicates that both types of technology imports are complementary to in-house R&D expenditures. This result is in accordance with the hypothesis as the Indian firms do mainly adaptive R&D and for this technology imports is the main input. The results further showed that older firms spend more on R&D than the newer firms. While discussing the importance of adaptive R&D, it is important to introduce the concept of technological paradigms and trajectories. Technological paradigm refers to major changes that alter the manufacturing configurations. Examples of paradigm changes include introduction of biotechnology, information and communications technology. Even in established industries, there can be paradigm changes like the shift from batch system of production to conveyor belt method of production in the automobile industry, and change from cross ply tyres to radial tyres. Indian R&D is not directed towards paradigm changes. Instead, they import a technological paradigm and introduce changes to suit the market and resource conditions that give them trajectory advantages. For R&D that is aimed at technological trajectory advantages import of a new technological paradigm is necessary as the trajectories are built on the paradigm. Sasidharan and Kathuria (2011) analysed the relationship between FDI and R&D for the post liberalisation period in India. They unbalanced panel data for 1,843 Indian manufacturing firms operating during the period 1994–2005 and corrects for the self-selection problem by using a Heckman-two step procedure. Their analysis, involving full sample, did not give a clear picture of the impact of FDI on the innovation strategies of domestic firms. However, interesting results did emerge, when analysis was carried out according to different sub-samples—based on foreign-ownership and technology intensity of the industry. FDI and R&D were found to be complements when sample was divided on the bases of equity ownership. FDI inflow induced foreign-owned firms in high tech industries and firms in minority ownership to invest in R&D.A complementary relationship was found for foreign equity participation (intra-firm transfer of technology) and in-house R&D was found for a sample of small and medium enterprises (SMEs) from India. Pradhan (2010) studied the R&D behavior of Indian manufacturing SMEs for the period 1991-2008. His data was from Proves data set that
47
9 Technology, Globalisation and Multinationals:The Asian Experience
contained financial information for about 9200 manufacturing enterprises, of which he classified about 4071 units as MSEs based on their capital stock. He found virtually all the major R&D intensive SMEs were from high technology-based industries. The pharmaceutical sector dominated the list, followed by electrical & optical equipment, chemicals & chemical products and machinery & equipment. He found foreign firms have been relocating their R&D units to India and Indian SMEs have benefitted from that. In addition to standard variables like the size and age of the firm, profits and exports, he found foreign equity participation (intra-firm disembodied technology transfer) and import of components (embodied technology transfer) statistically significant in determining in-house R&D expenditures of Indian SMEs. SMEs that were affiliated to Indian business groups also spent more on R&D. So far the debate on the relationship between R&D spending and technology imports has been confined to licensing of technology. Some of the firms that spend less on R&D have been adopting another method of acquiring technology, namely, acquiring R&D intensive firms. This route is also gaining importance. Blonigen and Taylor (2000) discuss this option in depth. Their paper examines empirical evidence on the relationship between R&D intensity and acquisition activity in the US electronic equipment industry. They found a significant inverse relationship between R&D intensity and acquisition activities. They also present cases of such acquisitions where the chief executives of the firms clearly state that they acquired the firm in question as it is R&D intensive while their own firm was not and the acquisition was a strategy to get access to the R&D output of the firm.
IV R&D Behaviour and Economic DownturnDuring economic downturn several firms cut down on their R&D and other expenditures. However, there are also some firms that increase their R&D expenditures. Daniele Archibugi, Andrea Filippetti, and Marion Frenz (2013), analyse the differences in behaviour between the firms that reduce R&D spending and those that increased their spending. In explaining these differences in behaviour, they take recourse to the Schumpeterian concepts of ‘creative accumulation’ and ‘creative destruction’. Creative accumulation refers to minute incremental changes in technology introduced by firms that give them technological trajectory advantages. Creative destruction refers to R&D conducted to achieve major paradigm shifts in technology resulting in new products and processes.
V R&D CollaborationsWhile acquiring technology, the options of a firm are not limited to make in-house and/or buy from another firm. Firms could also try R&D collaborations. In recent years R&D collaborations between firms and between firms and universities have increased manifold. There are several advantages in R&D collaboration. Some R&D projects involve huge costs and the outcome of the project is uncertain. Collaboration could address these issues to the benefit of both units. However, there are also important concerns like appropriability, division of costs and problems involved in mutual trust and confidence among collaborating units. Becker and Dietz (2004) addressed several
48

10Determinants of R&D: Lessons from Literature / N S Siddharthan
of these issues. Their results are based on a sample of 2048 German manufacturing firms. They estimate two sets of equations, the first, dealing with the determinants of R&D and the second, determinants of R&D cooperation. They found R&D cooperation very important in determining in-house R&D expenditures. That is, firms that choose collaborative R&D also spend more on in-house R&D. With regard to appropriability and R&D spending, firm specific measures have not emerged important but the laws relating to appropriability are important. Furthermore, firms that are internationally oriented spend more on R&D compared to domestic oriented firms. Among technological opportunity variables, R&D conducted by suppliers and competitors have a significant impact on in-house R&D spending. In short, in-house R&D spending mainly depends on R&D collaborations with other units, technological opportunities emanating from R&D performed by competitors and suppliers, and international orientation of the firm. Furthermore, they found simultaneity in the relationship between in-house R&D and R&D collaborations. They seem to reinforce each other. The study also shows some unexpected results. While technological opportunities arising from customers and competitors encourage in-house R&D efforts, they adversely affect R&D collaboration. On the other hand, technological opportunities coming from universities and scientific research have a positive influence on collaborations. Furthermore, they found larger firms going in for R&D collaborations. Thus size has a positive relation with R&D collaborations but a negative relation with R&D intensities.Several other studies have also found a positive relationship between firm size and R&D collaborations and joint ventures. Hernan et al. (2003) for a sample of more than 5000 European firms found firm size important in positively influencing R&D joint ventures. They also found R&D intensity of respective sectors significant in influencing the formation of joint ventures in R&D. Furthermore, they found that joint ventures are more likely to emerge in sectors where technological knowledge diffuses fast. In other words, when intellectual property rights are more successfully protected, firms have less incentive to form research joint ventures. Seen in conjunction with the earlier results, this shows that a strong intellectual property regime stands in the way of R&D and joint venture research collaboration. But technology creation depends on these two, namely, in-house R&D and research joint ventures. Hence, beyond a point strengthening the intellectual property regime will prove to be counter productive.Lopez (2008) revealed evidence in favour of spillovers in R&D cooperation based on a sample of 2581 Spanish manufacturing firms. The study also showed that R&D cooperative agreements have multiple partners. Two thirds of the firms in question have cooperation agreements with more than two partners, and about one third with more than three partners. Incoming spillovers have a positive and significant impact on the probability of cooperation. However, the level of legal protection in the country has a negative effect on cooperation. Furthermore, as in the earlier studies firm size also plays an important role in promoting R&D cooperation.For R&D purposes, firms not only collaborate with other firms but also with universities and research institutions. Beers et al. (2008) investigated the determinants of R&D collaborations with public knowledge institutions in Finland and the Netherlands. They found some differences in their results regarding collaboration practices of foreign and
49

11 Technology, Globalisation and Multinationals:The Asian Experience
domestic firms in Finland and the Netherlands, but the behaviour of the domestic firms turned out to be more or less similar. In particular, the results showed that foreign firms in the Netherlands are less likely to collaborate with public knowledge institutions than the domestic firms. However, this was not so for the Finland sample. In both countries, incoming knowledge spillovers influenced positively the probability to cooperate with universities and public funded knowledge institutes. Moreover, the impetus for collaboration turned out to be for acquisition of basic knowledge than for applied knowledge. This was particularly relevant for the Netherlands. Most studies use either a dummy variable that takes a value one for units that have R&D collaboration and zero for firms that have no collaboration; some studies also take the number of collaborations as a dependent variable. Nagassi (2004) in contrast used the budget spent on R&D collaboration as the measurement of collaboration in his study based on a sample of French firms. He considered R&D cooperation and innovation to be a function of industry and firm specific characteristics. Some of the results of the study confirm the findings of earlier studies like the importance of size and R&D intensity of the units in promoting collaboration. On the other hand, unlike earlier studies, Nagassi did not find spillovers and technological opportunity conducive for collaborations. With regard to industry level variables, firms functioning in industries that have higher level of FDI inflows went in for more R&D collaborations. When it came to commercial success of innovations, the results didn’t indicate a major role for collaborations. Instead, the results gave a more important role to other factors like size, human capital, market share and R&D intensity.While the studies surveyed so far have given weight to R&D cooperation, some other studies have underplayed the importance of R&D cooperation and have given greater importance to the role of regional spillovers. For example, Fritsch and Franke (2004) investigated the impact of knowledge spillovers and R&D cooperation on innovative activities in three German regions. They used patenting by firms as indicators of innovative activities. They found substantial regional differences with regard to productivities of R&D activities. Furthermore, they found the R&D spillovers from other R&D units operating in the same region the main cause of the regional differences. More importantly, they found R&D cooperation played only a minor role as a medium for R&D spillovers. Consequently, they concluded that agglomeration effects dominate over R&D cooperation effects.While discussing R&D collaborations between in-house units and universities, government labs and other firms, in addition to analysing the determinants of cooperation, it is equally important to examine the impact of various collaborations. Guellec and Potterie (2004) estimated the long-term impact of various sources of knowledge on multifactor productivity growth for 18 countries during the period 1980-1998. They found private business funding of university research does not result in higher productivity growth. Based on this result, they suggest that it is preferable for universities to keep control of their research agenda and universities should do what they are good at, namely, basic research. The results suggest that government should fund basic and innovative research at universities and research labs, which become the basic inputs of in-house R&D research. Nevertheless, R&D units should collaborate
50

12Determinants of R&D: Lessons from Literature / N S Siddharthan
among themselves. Further research is needed to verify this interesting result.Belderbos et al (2004), while analysing the impact of R&D collaboration, took into account the differences in the collaborating partners and the differential impact. They considered the following: partners, competitors, suppliers, customers, universities and research institutes. For this purpose they used a large sample of Dutch innovating firms collected by Community Innovation Survey 1996 and 1998. The study showed that R&D cooperation with suppliers tends to be more of an incremental nature mainly focussed on reducing input costs and increasing labour productivity. Cooperation with universities is mainly aimed at creating novel products and improving productivity of innovative sales. Cooperation with competitors is entered into with more than one objective and they have been resulting in increases in both labour productivity and innovative sales. In contrast, customer cooperation does not seem to influence productivity. So far the discussion has been confined to formal R&D collaborations. Several firms collaborate with their suppliers and consumers and even undertake joint product/process development without a formal agreement. Bonte and Keilbach (2005) based on a survey data on German innovative firms found that more than 70 per cent of their sample firms are engaged in collaborative innovation activities with their suppliers, but only 3 per cent of them are engaged in formal R&D collaborations with their suppliers/customers. They cite earlier studies on German firms that also showed that informal exchange of technical knowledge to be the most important mode of innovation collaboration. The study showed that while appropriability conditions are important for both (informal and formal) types of R&D cooperation, legal measures like patents and copy rights does not enhance cooperation. They further find that firms that have been engaging in R&D continuously have a higher probability of cooperating informally. Before entering into a formal R&D collaboration, the firms need to work on the details of appropriability terms. The process is costly. This partly explains the popularity of informal collaborations and sharing of technical knowledge that is more flexible. It is important to find out the nature of firms that are likely to collaborate with universities and what type of firms gain most through such collaborations. It has been argued that several large corporations have large R&D units that could do innovative research. However, smaller firms lack these facilities and therefore they are the ones who are most likely to approach university departments for collaboration. Motohashi (2005) for a sample of Japanese firms distinguished between complementarity and substitution effects of university industry collaborations. The study showed that firms with higher level of technological capacities in terms of R&D intensity and number of patents are likely to collaborate with the universities. Furthermore, firms that have R&D collaboration with external parties are more likely to tie-up with universities. With regard to the size and age of the enterprise the study showed that smaller and younger firms are more likely to collaborate than the large and older ones. The results relating to the impact of university industry collaborations showed that university professors in Japan are changing their mind set and are actively participating in the commercialisation of their inventions. There are several entrepreneurial technology firms that would like to collaborate with larger firms. The question here is finding out the research standard and suitability of
51

13 Technology, Globalisation and Multinationals:The Asian Experience
an entrepreneurial R&D firms seeking collaboration. Katila and Mang (2003)attempt to find answers to this problem, namely, when the entrepreneurial companies should collaborate during product development. They found that companies that have filed patents have a better chance of entering into successful collaborations. This is because, while filing for patents the company also reveals its technological capability and the character of its innovations.They hypothesise and find that firms that have applied for patents in the project, have higher R&D intensity, prior collaboration experience with a partner tend to collaborate more. Some studies (Eraydin 2005) have found that the intensity of their global and local linkages promotes innovativeness. Networks formed with global suppliers and customers also contribute to the formation of industrial clusters, they in turn lead to more networks. Essentially, studies show three main motives for R&D collaboration: cost and risk sharing, learning from partners, and absorptive capacity of the firm. In this context, Lopez (2008) found that the complementarities between partners in a cooperative agreement would also depend on the knowledge base within the firm. Likewise, the absorptive capacity will also depend on its own R&D and knowledge base. VI Lessons from LiteratureDuring the last decade, the importance of intellectual property protection and the role of appropriability have occupied a central place in most of the discussions on R&D. The developing countries have enacted laws to enhance intellectual property protection in accordance with the WTO guidelines. It was, more or less, assumed that enhanced intellectual property protection would facilitate investments in R&D and the world would be better off. However, the results of our survey do not support this view. The results show that investments in R&D depend much more on technological opportunity and diffusion, and therefore sole emphasis on appropriability and strengthening patent protection could be counterproductive. Diffusion and patent protection are negatively related and the results of the survey clearly show that diffusion contributes much more to investments in R&D than appropriability. The most important factor contributing to investments in R&D is technological opportunity, which is created by university and government aided research. Innovations, in addition to depending on in-house R&D efforts also depend on R&D cooperation and collaboration with other units including universities. Furthermore, units that have been collaborating with other science and technology establishments tend to invest more in their in-house R&D units. Here again, appropriability and enhanced patent protection does not play a significant role in fostering R&D collaborations. Stricter laws have become a stumbling block forcing the units to forge informal collaborations to bypass the strict regulations. In this context, several studies show the crucial role of agglomerations in promoting investments in R&D. Units are much more innovative if they belong to an agglomeration compared to stand alone units. Some studies emphasise the importance of regional and knowledge spillovers. Clusters have several advantages, like availability of trained personnel, spillovers, and better infrastructure facilities. Among these factors, studies
52

14Determinants of R&D: Lessons from Literature / N S Siddharthan
emphasise spillovers and diffusion arising out of frequent contacts among personnel. This has encouraged firms to forge informal collaborations with units in the same agglomeration. The relationship between in-house R&D and technology imports has been discussed in literature at length. In order to understand the relationship, it is important to distinguish between developments in technological paradigms (new manufacturing configurations) and incremental technological trajectory changes introduced to adapt the new paradigm to suit the market and resource conditions. Studies surveyed show that R&D units in developing countries mainly perform adaptive R&D and enjoy technological trajectory advantages. For them technology imports are necessary to perform R&D and reap trajectory benefits. Thus import restrictions on technology imports imposed by earlier import substitution regimes adversely affect innovative activities. Several multinationals have set-up R&D units in developing countries like China and India, either as stand-alone units or jointly with research institutions and R&D units in these countries. The obvious motivation is that in the perception of the MNE it is more efficient to perform that kind of R&D in India and China than in the home country. The host countries also benefit from them in terms of spillovers and opportunities for international networking. The benefits of FDI in R&D to host country institutions and firms, as well as, the costs involved have not yet been analysed in detail. Future research should concentrate in this important area. The traditional notion of an R&D unit acting in secrecy, possessive of its research findings and inventions, and jealously guarding its intellectual property is fast changing. The emerging trends are in favour of networking with other units and institutions, participate in open source platforms, take advantage of peer production/creation and benefit from increased technological opportunity. Evidence indicates a change in the emphasis - from increasing appropriability through tougher patent laws to enhancing technological opportunity.
References
Allred, Brent B. and Walter G Park. (2007). ‘Patent rights and innovative activity: evidence from National and firm-level data”’ Journal of International Business Studies, Vol. 38, Issue 6, pp. 878-900.
Archibugi, Daniele; Andrea Filippetti; and Marion Frenz. (2013). ‘Economic crisis and innovation: Is destruction prevailing over accumulation?’ Research Policy, Vol. 42, pp. 303– 314.
Becker, Wolfgang and Jurgen Dietz. (2004). ‘R&D cooperation and innovation activities of firms – evidence for the German manufacturing industry’, Research Policy, Vol. 33, pp. 209-223.
Beers, Cees van, Elina Berghäll and Tom Poot. (2008). ‘R&D internationalization, R&D collaboration and public knowledge institutions in small economies: Evidence from Finland and the Netherlands’, Research Policy Vol. 37, Issue 2, pp. 294-308.
Belderbos, Rene. (2001). ‘Overseas innovation by Japanese firms: an analysis of patents and subsidiary data’Research Policy, Vol. 30, pp. 313-332.
Belderbos, Rene, Martin Carree and Boris Lokshin. (2004). ‘Cooperative R&D and firm performance’ Research Policy, Vol. 33, pp. 1477-1492.
53
15 Technology, Globalisation and Multinationals:The Asian Experience
Blonigen, Bruce A. and Christopher T. Taylor. (2000). ‘R&D intensity and acquisitions in high technology industries: Evidence from the US electronic and electrical equipment industries’ Journal of Industrial Economics, Vol. 48, Issue 1, pp. 47-70.
Bonte, Werner and Max Keilbach. (2005). ‘Concubinage or marriage? Informal and formal cooperation for innovation’ International Journal of Industrial Organisation, Vol. 23, pp. 279-302.
Cainelli, Giulio and Nicola De Liso. (2005). ‘Innovation in Industrial Districts: Evidence from Italy’ Industry and Innovation, Vol. 12, Issue 3, pp. 383-398.
Cohen, W. M. and Levinthal, D. A. (1989). ‘Innovation and learning: The two faces of R&D’, The Economic Journal, Vol. 99, pp. 569-96.
Eraydin, Ayda and Bilge Armatli-Koroglu. (2005). ‘Innovation, Networking and the New Industrial Clusters: The Characteristics of Networks and Local Innovation Capabilities in the Turkish Industrial Clusters’, Entrepreneurship and Regional Development, July 2005, Vol. 17, Issue 4, pp. 237-66.
Farber,S. (1981). ‘Buyer market structure and R&D effort: A simultaneous equations model’, Review of Economics and Statistics, Vol. 62, pp. 336-45.
Fritsch, Michael and Grit Franke. (2004). ‘Innovation, regional knowledge spillovers and R&D cooperation’, Research Policy, Vol. 33, pp. 245-255.
Guellec, Dominique and Bruno Van Pottelsberghe de la Potterie. (2004). ‘From R&D to productivity growth: do the institutional setting and the source of funds of R&D matter?’, Oxford Bulletin of Economics and Statistics, Vol. 66, Issue 1, pp. 353-378.
Hegde, Deepak and Diana Hicks. (2008). ‘The maturation of global corporate R&D: Evidence from the activity of U.S. foreign subsidiaries’ Research Policy, Vol. 37, Issue 3, pp. 390-406.
Hernan, Roberto, Pedro L. Martin and Georges Siotis. (2003 ‘An empirical evaluation of the determinants of research joint venture formation’, Journal of Industrial Economics, Vol. 51, Issue 1, pp. 75-89.
Hosono, Kaoru, Masayo Tomiyama and Tsutomu Miyagawa. (2004). ‘Corporate governance and research and development: evidence from Japan’, Economics of Innovation and New Technology, Vol. 13, Issue. 2, pp. 141-164.
Ito, Banri and Ryuhei Wakasugi. (2007). ‘What factors determine the mode of overseas R&D by multinationals? Empirical evidence’ Research Policy. Vol. 36, Issue 8, pp. 1275-1287.
Jefferson, Gary H.; Bai Huamao; Guan Xiaojing and Andyu Xiaoyun. (2006). ‘R&D performance in Chinese Industry’ Economics of Innovation and New Technology, Vol. 15, Issues 4-5, pp. 345-366.
Kafouros, Mario I. and Peter J. Buckley. (2008). ‘Under what conditions do firms benefit from the research efforts of other organizations?’, Research Policy, Vol. 37, Issue 2, pp. 225-239.
Katila, Riitta and Paul Y. Mang. (2003). ‘Exploiting technological opportunities: the timing of collaborations’Research Policy, Vol. 32, pp. 317-332.
Kuemmerle, Walter. (1999). ‘The drivers of foreign direct investment into research and development: An empirical investigatio’ Journal of International Business Studies, Vol. 30, Issue 1, pp. 1-24.
Kumar, Nagesh and Aradhna Aggarwal. (2005). ‘Liberalization, outward orientation and in-house R&D activity of multinational and local firms: A quantitative exploration for Indian manufacturing’, Research Policy, Vol. 34, pp. 441-460.
Kurokawa, Sam; Santoshi Iwata and Edward B. Roberts. (2007). ‘Global R&D activities of Japanese MNCs in the US: A triangulation Approach’ Research Policy, Vol. 36, pp. 3-36.
54

16Determinants of R&D: Lessons from Literature / N S Siddharthan
Lopez, Alberto. (2008). “Determinants of R&D cooperation: Evidence from Spanish manufacturing firms”, International Journal of Industrial Organisation, Vol. 26, Issue 1, pp. 113-136.
Motohashi, Kazuyuki. (2005). ‘University-industry collaborations in Japan: The role of new technology-based firms in transforming the National Innovation System’, Research Policy, Vol. 34, pp. 583-594.
Negassi, S. (2004). ‘R&D Co-operation and Innovation - A Micro-econometric study of French firms’ Research Policy, Vol. 33, 365-384.
Odagiri, H. (1983). “R&D expenditure, royalty payments and sales growth in Japanese manufacturing corporations”, Journal of Industrial Economics, Vol. 32, 61-67.
Pradhan, Jaya Prakash. (2011). ‘R&D strategy of small and medium enterprises in India’ Science, Technology and Society, Vol. 16, Issue 3, 373-395
Sasidharan, Subash and Vinesh Kathuria. (2011). ‘Foreign Direct Investment and R&D: Substitutes or Complements—A Case of Indian Manufacturing after 1991 Reforms’, World Development. Vol. 39, Issue 7, pp. 1226-1239.
Schumpeter, J.A. (1942). Capitalism, Socialism, and Democracy, Harper, New York.
Shimizutani, Satoshi and Yasuyuki Todo. (2008). ‘What determines overseas R&D activities? The case of Japanese multinational firms”’ Research Policy, Vol. 37, Issue 3, pp. 530-544.
Siddharthan, N. S. (1988) ’In-house R&D, imported technology and firm size:lessons from Indian experience’, Developing Economies, Vol. 26, pp. 212-221.
_ (1992). ‘Transaction costs, technology transfer and in-house R&D: A study of the Indian private corporate sector’, Journal of Economic Behavior and Organisation, Vol. 18, pp. 265-271.
Tapscott, Don and Anthony D. Williams. (2006). Wikinomics: How Mass Collaboration Changes Everything, Atlantic Books, London. Pp. 1-324.
55

1 Technology, Globalisation and Multinationals:The Asian Experience
Till recently multinationals conducted most of their R&D in their respective home countries. If at all they established R&D units in host countries, it was to adapt their technology and products to the host country environment and market. During the 1980s several firms established R&D units in technologically advanced countries to take advantage of the technological and research environment in the host countries. In more recent years they have also been setting up R&D units in developing countries. Since the early 1990s Multinationals have started establishing their R&D units in developing countries like China and India.Two motives are usually identified for starting R&D units in developing host countries: access to market and access to science. There is evidence to believe that the rationale of access to science need not be confined to setting-up of units in developed countries. Countries like China and India also have some advantages and contribute to knowledge development. Studies have found the access to science motive equally important for establishing R&D units in China and India. Reddy (2011) has minutely surveyed innovations systems in India, China, Brazil and South Africa and has listed the important multinationals that have set-up R&D units in these countries. Texas Instruments was one of the very first to start the R&D unit in Bangalore, India in 1985. This was followed by Hewlett-Packard during early 1990s. By the end of 1999, there were 196 global R&D units in India. This figure increased to 370 in 2007. Currently there are more than 700 global R&D units in India. Reddy (2011) lists the following important global R&D units in India: Caterpillar, Cisco Systems, Daimler Chrysler, Du Pont, General Electric, IBM, Intel, Lucent, Microsoft, Oracle, Philips, SAP, and GE’s John F. Welch Technology Centre. Many of them, like Motorola established their R&D centre in India first and later on in China. Reddy studies each one of these labs in detail and presents excellent case studies. Their main motivation to set-up units in India was the presence of Indian Institute of Technologies (IITs) and the Indian Institute of Science (IISc). China has more than 700 global R&D units. However, Reddy (2011) is not sure whether all of them are actively engaged in global R&D. This is mainly because almost all foreign firms with R&D units also have manufacturing and other facilities in China. Under these conditions it is difficult to find out whether they are performing global R&D in China. Furthermore, many of the R&D units declared strategic by the Chinese press are not listed in the parent company website as global R&D units. This is in contrast to the Indian units, where they figure as global units in the parent’s website. Unlike China, in India most of the foreign R&D units are stand-alone units which actively participate in their parent company’s global technology development venture. Firms performing
VI Foreign Direct Investments in Research and Development
56
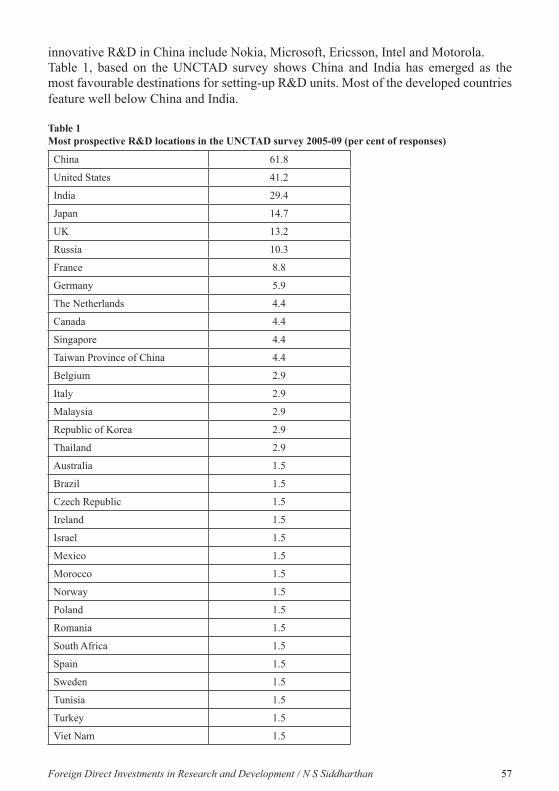
2Foreign Direct Investments in Research and Development / N S Siddharthan
innovative R&D in China include Nokia, Microsoft, Ericsson, Intel and Motorola.Table 1, based on the UNCTAD survey shows China and India has emerged as the most favourable destinations for setting-up R&D units. Most of the developed countries feature well below China and India.
Table 1Most prospective R&D locations in the UNCTAD survey 2005-09 (per cent of responses)
China 61.8
United States 41.2
India 29.4
Japan 14.7
UK 13.2
Russia 10.3
France 8.8
Germany 5.9
The Netherlands 4.4
Canada 4.4
Singapore 4.4
Taiwan Province of China 4.4
Belgium 2.9
Italy 2.9
Malaysia 2.9
Republic of Korea 2.9
Thailand 2.9
Australia 1.5
Brazil 1.5
Czech Republic 1.5
Ireland 1.5
Israel 1.5
Mexico 1.5
Morocco 1.5
Norway 1.5
Poland 1.5
Romania 1.5
South Africa 1.5
Spain 1.5
Sweden 1.5
Tunisia 1.5
Turkey 1.5
Viet Nam 1.5
57

3 Technology, Globalisation and Multinationals:The Asian Experience
By and large, two motives have been identified in literature for MNEs investments in R&D in a foreign location – access to market and access to science (Li and Yue 2005). It was, more or less, assumed that FDI in R&D flows to developed countries would be motivated by access to science, while to developing countries would be for access to markets. However, this generalisation is no longer true. China and India have also been attracting science seeking FDI. For example, the Indian R&D activities of General Electric have been in very diverse areas like aircraft engines, consumer durables and medical equipment. Furthermore, pharmaceutical companies such as Astra-Zeneca, Eli Lily, GlaxoSmithKline, Novartis, Pfizer and Sanofi-Aventis all run research activities in India.Kuemmerle (1999) was one of the first to analyse this emerging phenomenon of FDI in R&D. However, during the early 1990s FDI in R&D was mainly confined to the developed countries and in particular, to the US. He identified two motives for investing in R&D in host countries. The first, to exploit the technological developments made in the home country. Technology developed in the home country might have to be modified to suit the market and resource conditions of the host country. Hence, the need for performing R&D. This motive, he called, ‘Home Base Exploiting’ (HBE) R&D. The second motive, which could be more relevant to R&D investments in the US and other technologically advanced countries, is to expose the home country firms to the host country’s technological environment and enjoy spillovers. This kind of investment in R&D in the host country is mainly meant to increase or add to the intangible assets of the firm. Kuemmerle (1999) termed this motive as ‘Home Base Augmenting’ (HBA) R&D. The main drivers for HBA investments were technological collaboration and spillovers from existing R&D units in the host country, universities and research institutions, and industrial and technological clusters. His paper identifies the main determinants of the choice between HBE and HBA investments. Kuemmerle found the differential R&D spending relative to the GDP between the home and host countries and the skill levels of population between the countries as important determinants in deciding in favour of HBA R&D investments. While these variables might explain the FDI in R&D to developed and technologically advanced countries, they cannot explain flows to developing countries as most developing countries have lower R&D spending and lower levels of skill intensity. Nevertheless, in recent years the developing countries have emerged as the main host countries and it is important to explain this phenomenon. Shimizutani and Todo (2008) tried a variant of HBA and HBE hypothesis for Japanese FDI in R&D. They made a distinction between R and D. They considered basic and applied research as R, and design and development as D. This distinction is somewhat similar to that of HBA and HBE distinction. The purpose of their study was to analyse the determinants of location choice of Japanese overseas FDI in R&D. They found that FDI in R&D would more likely to be of R type if the host country R&D expenditures to GDP was high. For D type of investments this variable would not be relevant. Based on a sample during the period 1996-2001, they found R type of investment in technology frontier countries and in some newly industrialised countries like South Korea. On the other hand they attribute the underlying factor for the rapid increase in R&D investments
58

4Foreign Direct Investments in Research and Development / N S Siddharthan
in China to the country’s local market based on brisk economic growth. They also found that Japanese firms performed R type of R&D in countries where Japanese subsidiaries have been investing heavily in R&D. The host country’s GDP had a positive impact on both types of R&D. Furthermore, the probability of performing R&D of both types was negatively related to the distance of the country from Japan. Kurokawa et al (2007) analysed the determinants of Japanese investments in R&D in the US. Even though the paper dealt with investments in the US, some of the variables that they have introduced could be relevant in explaining investments in developing countries as well. In fact they could be considered as host country variables rather than US variables. To Kurokawa et al, if the objective of setting-up of the R&D unit was to strengthen their R&D capabilities where some of the technologies of the host country could be more advanced, take advantage of the better technological environment in the host country, employ and utilise researchers in the host country, monitor technologies in the host country, and to create global R&D synergies then the unit is classified as HBA unit. On the other hand if the objective was to respond to the needs of the host country market and establish an integrated system from R&D, production to sales, then it is of the HBE type. The study showed that the choice of HBA would depend on the importance given to R&D alliance, namely, collaborative R&D projects with local firms, universities and research institutions. It would also depend on the method of evaluation of R&D personnel and autonomy granted to R&D units. These very same factors could emerge important for investments in developing countries like China and India and similar questions could be asked from units established in developing countries.Patents granted based on overseas innovations could also be considered to analyse overseas R&D activities. Belderbos (2001) examines the patents of 231 large and medium Japanese electronic good manufacturing firms to analyse the determinants of R&D activities of Japanese subsidiaries. His dependent variable is the number of patents granted based on overseas innovations during 1990-93. The results showed that R&D intensity of the firm measured by patents to sales ratio, internationalisation of their manufacturing operation, size and export intensities are significant determinants. He concluded that these results support both HBA and HBE hypothesis. MNEs operating in the host countries could be classified under four heads: (1) those which have only manufacturing units with no R&D facilities, (2) those conducting R&D at the manufacturing plant without a separate R&D unit, (3) those conducting R&D at the plant site and also having a separate R&D unit, and (4) those conducting R&D solely at the research laboratory. Ito and Wakasugi (2007) examine the factors affecting the choice of R&D functions among Japanese affiliates. They consider the second type as support oriented R&D and the next two types (3 and 4) as knowledge sourcing R&D. They found propensity to export is an important factor in deciding to establish an R&D unit. Parent firms with large R&D establishments tended to establish R&D units in the host country. The host country’s technological capabilities, like the royalty receipts of the host country as a percentage of GDP and proportion of researchers in the work force also strongly contributed to the establishment of R&D units. In particular the technological status contributed to establishing a knowledge sourcing R&D unit.Most studies agree that FDI in R&D will flow to countries that are capable of contributing
59

5 Technology, Globalisation and Multinationals:The Asian Experience60
to the technological development of the home country enterprise. The problem is one of identifying the variables that represent the technological strength of the country. In this context, the paper by Hegde and Hicks (2008) in addition to the general variables used in earlier studies, introduced certain science and technology variables as determinants. The paper dealt with the globalisation of the US corporate R&D and analysed the relevance of foreign market size, science and technological capabilities of the host countries and the R&D atmosphere in the host countries. Their primary interest was the relationship between the overseas R&D activities of the US firms and host country attributes. In this context they distinguish between initiation of foreign R&D and its intensity and they measure them using both expenditure and patent data. They capture the technological strength of the host country by the number of USPTO patents invented in the host country and not assigned to US companies or inventors. In analysing the determinants, in addition to the size and technological strength of the host country, they also introduce the national output of scientific and engineering articles published in professional forums. This variable measures the world-class scientific enterprise in the host country. They found all the three variables significant in explaining US overseas R&D investments. They also used industry dummies and found the electronics and computers industry, and in the traditional sectors transport, metals, and industrial machinery important. The introduction of the three new science and technology determinants, they claim, explains the emerging R&D investments in China and India. In 1990 China and India accounted for only 0.1 per cent of FDI in R&D. This figure increased to 2.3 per cent in 2003. During this period, China and India increased their science and engineering publication output from about 4.5 to 7.2 per cent while Europe’s numbers hovered around half the total share of non-U.S. articles. They conclude that public investments in science and technology institutions are more likely to attract investments in R&D than manufacturing investments.Håkanson and Nobel (2000), consider investments in R&D in foreign countries “reverse technology transfer”. Their study is based on a questionnaire survey of foreign R&D units of Swedish multinationals. Their paper is devoted to analysing the incidence and determinants of technology transfer from foreign subsidiaries to Sweden. They found the amount of what they call the ‘technology knowledge’ form the subsidiaries in foreign countries to the home country very impressive. Almost half the units in their sample benefited from knowledge transfer. They found factors like inimitability, that is, technologies involving long development times and difficult to observe, and appropriability of R&D results. Certain other characteristics that could hinder imitations like tacit nature, high team dependence and characteristics that are difficult to articulate also have high transaction costs. Team work in particular, stands in the way of reverse technology transfer. They conclude that technologies that result in products that are difficult to imitate and that require long development times are more likely to be transferred than other ones.Mass Collaborations, strategic alliances, open source and peer productionProspects of informal R&D collaborations have opened up new opportunities and several innovations in collaboration modes and methods. Quite a few MNEs have started sourcing ideas relating to new products and processes from sources outside
6Foreign Direct Investments in Research and Development / N S Siddharthan
their company (Tapscott and Williams 2006). For example, currently Procter & Gamble sources 50 per cent of their new product and service ideas from outside the company. These companies register on the InnoCentive network to solve their R&D problems for a cash reward. They pose their R&D problems in the network and announce cash rewards to technologists who can come with a convincing solution. A number of academics from countries like China and India have been participating and benefiting from these newly emerging schemes. From the MNEs point of view, they can tap the global scientific and technological talent without having to employ them. Firms such as Boeing, Dow, DuPont, etc are also using InnoCentive. However, in order to tap the global talent, the MNE would have to make some of their closely guarded secrets and intellectual property public. They don’t mind doing this, as the returns resulting from mass participation are more than the costs of sharing their intellectual property. Abandoning their proprietary R&D projects to support open collaborations has become popular with some of the leading pharmaceutical companies. These were the very companies that were actively advocating stricter intellectual property protection during the 1980s. The pharmaceutical majors have been supporting SNP Consortium and Alliance for Cellular Signalling – two important projects wedded to open source databases. The most important reason for this major change in the attitude of the MNEs is the ongoing web revolution. Tapscott and Williams (2006) argue that internet has drastically cut down transaction costs, thereby substantially reducing internalisation advantages, which has made outsourcing and networking more profitable compared to performing all R&D in-house. They therefore prefer “open innovations” (Tether and Tejar 2008). In this context, universities, government funded research labs, private research organisations and consultants are clubbed together and referred to as specialist knowledge providers by Tether and Tejar (2008). They found that most of the firms that sought knowledge from external knowledge providers have impressive in-house R&D units and the firms did not consider specialist knowledge providers as competitors - substituting their in-house R&D work. Instead, they complemented their in-house R&D efforts. In fact mainly firms with first-rate R&D base networked with research laboratories and individuals. Thus open innovations involve actively seeking and assessing external ideas that is practiced primarily by firms with a high-quality in-house R&D unit. Firms like Proctor and gamble have been opting for open innovations and have benefited by peer production. Tapscott and Williams (2006) cite several examples of well-known firms that have embraced open sources and peer production. For example, IBM’s choice of Linux – open source software is well known. IBM spends about $100 million on Linux per annum. The other example is that of BMW, another R&D intensive firm releasing a digital design kit on its website to encourage interested customers to design new telematic features for future models like GPS navigation systems. In fact, BMW hosts a “virtual innovation agency” on its website where small and medium sized business can submit ideas. Likewise Intel and its academic partners have agreed to an Intel’s open collaborative research agreement, which grants nonexclusive IP rights to all parties. Similarly, many bio-tech firms have voluntarily placed their DNA related work on the open websites. Tapscott and Williams (2006) consider open platforms mass collaborations in action, which extends productive capacity of business without
61

7 Technology, Globalisation and Multinationals:The Asian Experience
having to incur huge fixed costs. In this context they cite examples of eBay, Google, and Amazon. With open platforms partners can add value to the platform in addition to building new business.
References
Cantwell, John and Ram Mudambi. (2000). ‘The Location of MNE R&D Activity: The Role of Investment Incentives’, Management International Review, Vol. 40, No. 1, International Management ofTechnology: Theory, Evidence and Policy , pp. 127-148
Håkanson, Lars and Robert Nobel. (2000). ‘Technology Characteristics and Reverse Technology Transfer’, Management International Review, Vol. 40, No. 1, International Management of Technology: Theory, Evidence and Policy, pp. 29-48
Hegde, Deepak and Diana Hicks. (2008). ‘The maturation of global corporate R&D: Evidence from the activity of U.S. foreign subsidiaries’, Research Policy, Vol. 37, Issue 3, pp. 390-406.
Ito, Banri and Ryuhei Wakasugi. (2007). ‘What factors determine the mode of overseas R&D by multinationals? Empirical evidence’, Research Policy. Vol. 36, Issue 8, pp. 1275-1287.
Kuemmerle, Walter. (1999). ‘The drivers of foreign direct investment into research and development: An empirical investigation’ Journal of International Business Studies, Vol. 30, Issue 1, pp. 1-24.
Kurokawa, Sam; Santoshi Iwata and Edward B. Roberts. (2007). ‘Global R&D activities of Japanese MNCs in the US: A triangulation Approach’, Research Policy, Vol. 36, pp. 3-36.
Reddy, P. (1997). ‘New trends in globalization of corporate R&D and implications for innovation capability in host countries: a survey from India’, World Development, 25(11), 1821-1837.
Reddy, Prasada. (2011). Global Innovation in Emerging Economies, Routledge, New York and Oxon, i-xxv, 1-294.
Todo, Yasuyuki and Satoshi Shimizutani. (2008). ‘Overseas R&D Activities and Home Productivity Growth: Evidence from Japanese Firm-Level Data’, The Journal of Industrial Economics, Vol. 56, No. 4, pp. 752-777
62
1 Technology, Globalisation and Multinationals:The Asian Experience
The relationship between productivity (both labour and total factor productivity) of firms and their in-house R&D spending is now fairly established across countries and industries. However, certain other questions remain. Does R&D expenditure undertaken by MNEs in foreign locations (host countries) influence productivities in the home country? In case it does influence the productivity of mother firms, what kind of R&D in foreign countries promote productivities of the home country units? Do productivities of firms also depend on trade? Is it important to have an in-house R&D unit to benefit from technology spillovers from trade? These issues will be analysed in this chapter.
I Overseas R&D and domestic productivityThe Japanese experience (Todo and Shimizutani 2008), shows that overseas innovative R&D by Japanese firms contribute to the productivity of the parent company but not the adaptive overseas R&D activities. The paper uses panel data on Japanese multinationals in manufacturing investing in R&D overseas for the period 1996-2002. They classify overseas R&D activities into two types: one, innovative, that is, activities aimed at the world market and two, adaptive, that is, activities targeted towards the host country market. They study the impact of both types of overseas R&D activities on the total factor productivity of the parent firm and also the return on return on domestic R&D. Their sample consists of Japanese firms that had at least one subsidiary overseas. Their unbalanced panel of Japanese manufacturing MNEs consisted of 597 firms for the period 1996-2002. The results show that overseas R&D activities in general did not influence the total factor productivities of parent companies. However, overseas innovative R&D activities influenced the productivity of parent companies. Furthermore, overseas R&D activities of high tech industries influenced the productivities of Japanese home firms rather than firms operating in low tech industries. Thus, there were major advantages in investing in innovative R&D abroad, especially in high tech industries as they contributed to the productivity of the parent firm.
II Global Knowledge ReservoirsSeveral studies show that host country firms benefit by FDI through technology and
VIIGlobal Technology Spillovers
63

2Global Technology Spillovers / N S Siddharthan
productivity spillovers. Some studies analyse the characteristics of firms that benefit by FDI spillovers and firms that become victims due to the presence of MNEs. In addition, MNEs operating in host countries could also benefit by spillovers from other MNEs and host country firms. As is well known, MNEs establish production and R&D facilities in different countries. In this context, it is important to know whether the MNE as a whole benefits by spillovers, or they are confined to local host country units? If the benefit accrue to all the units belong to the MNE, then does the breadth of MNE involvement in different countries matter? In other words, is it true that more the countries the MNE invests in, the better it is for its knowledge accumulation? What about the depth of MNE involvement in a country in terms of investment intensity? Does the host country’s intellectual property regulations and protection influence technology and productivity spillovers? The study by Kafouros, Buckley, and Clegg (2012), analyses several of these issues. In particular, it clearly shows how the network of MNE subsidiaries influences the productivity of the whole group. They model productivity as a function of the knowledge originating from 18 countries and 28 industries. Thus, their analysis involves a whole range of countries, industries and MNEs. They considered 114 UK MNEs that had 1122 subsidiaries in overseas locations. The unbalanced sample covered 10 year period (1995-2004) and had 1020 observations (an average of 9 observations per firm). The dependent variable was the labour productivity of the entire MNE group. To measure the level of MNEs international breadth they use the number of countries in which the MNE operates as an indicator. To capture international depth they use the ratio of foreign assets to total assets or foreign sales to total sales. Their results show that knowledge accumulated by subsidiaries enhances the performance of the entire group. In this context, both the breadth and depth of foreign investments are important. With regard to IPR regimes, the study reveals that weak IPR regimes increase the performance of MNEs by enabling them to exploit external ideas. This finding is contrast to earlier arguments advocating strict IPR regimes. They find MNEs undertaking more R&D in countries where intellectual property protection is weak. Earlier works emphasised mainly international depth, that is, share of subsidiary sales to total sales. This shows that international breath, that is, having subsidiaries in several countries across continents is equally important. Furthermore, benefits of spillovers are more from countries with weak IPRs.
III Imports and Technology TransferTechnology transfer can also take place through imports, in particular, imports from R&D intensive countries. This could happen mainly due to imports of technology intensive capital goods and import related learning effects (Keller 1998). Acharya and Keller (2009) explain inter-country total factor productivity differences in terms of domestic technological change and international technology transfer through imports.
64

3 Technology, Globalisation and Multinationals:The Asian Experience
Their results are based on a sample of 22 manufacturing industries in 17 industrialised countries for the period 1973-2002. Their results clearly show that domestic R&D has an important influence on productivity. However, the effect of international technology transfer on productivity far exceeds that of domestic R&D. In addition geographic proximity also contributed to technology transfer and productivity increases. Canada benefits more from US R&D and the European Union nations benefit from each other R&D. Augier, Cadot and Dovis (2013), analyse the impact of imports on the productivity of Spanish firms. Their data covers an unbalanced sample of 3462 Spanish firms for the period 1991-2002. They first estimate the total factor productivity of the firms. In the second stage they regress the total factor productivity with the firm’s decision to import. They use a difference-in-difference estimator to make sure that superior performance of importers is indeed due to importing. The results show that without controlling the interaction with firm characteristics the effect of decision to import on total factor productivity was weak. However, when importing decision was interacted with skilled labour it became significant. Thus they argue that high technology imports cannot be absorbed without an endowment of skilled labour force.Saripalle (2014) argues that in high tech industries like electronics, the high tech components are not readily available to all the firms. Some of the components are sold mainly to the affiliates of MNEs intra-firm. Furthermore, one of the functions of the R&D unit of the enterprise is to identify the sources of high tech components for import and use. Thus enterprises without R&D units will not be in a position to identify and import appropriate high tech components. However, standardised components could be imported by all firms. But standardised components will not contribute to productivity. Under these circumstances labour productivity would increase only if the importing firm also had an R&D unit. Import of standardised inputs will not contribute to labour productivity. Based on a sample of 266 electronic enterprises operating in India for the period 2002 – 2012 and using panel data methods, she estimated regressions wherein labour productivity was the dependent variable. In addition to the standard determinants, she also used imports of components and R&D as separate variables and also in the multiplicative form. Coefficients of these variables when used separately had negative signs. However, the coefficient of the multiplicative term had a positive sign. This according to her clearly reveals the complementary relationship between in-house R&D and import of sophisticated components. There is also evidence to show that lot of trade in R&D intensive components is not through open market but intra-firm, that is among the affiliates (Siddharthan and Kumar 1990). Pradhan (2011) showed the complementary relation between in-house R&D and import of high tech components for a sample of Indian small and medium firms. He considered the R&D intensity of firms as a function of the age and size of the firm, disembodied
65

4Global Technology Spillovers / N S Siddharthan
(against royalty and technical fees) and embodied (machinery) technology purchases, import of components, exports, MNE and business group affiliations and some industry specific variables. The study found the import of components to be a very important determinant of SMEs R&D intensities. He concludes that the SMEs learn considerably from the purchase of components and other inputs from technologically advanced countries. Likewise, even for SMEs the foreign equity participation was important for determining in-house R&D expenditures.
IV Strategic Alliances 1
Several Indian firms that have done well in the global market in high tech sectors like IT software and pharmaceuticals have been entering into long term non-equity strategic alliances with several MNEs. Their motive has been to promote technology sharing and trade. Several studies in recent years have demonstrated the importance of networks and strategic alliances to the competitive success of firms. The case for non-equity strategic alliances appears especially persuasive for software firms. As stated by Siddharthan and Nollen (2010), alliances enable firms to gain access to complementary resources that are difficult to build organically, and they lend legitimacy and status, which is especially important for new and small firms. The strategic attributes that a foreign partner brings, especially marketing and technology, bolster firm growth, especially for firms that are deficient in these attributes (Luo 2002), as Indian firms are. Collaborations can result in technological innovation and the creation of new products and services via knowledge sharing. Several empirical studies support these theoretical claims. Alliances, networking, or cooperative agreements were found to contribute to the performance and competitive success of a firm in several studies (Dyer & Nobeoka 2000; Chetty & Holm 2000; Eriksson & Chetty 2003; Forsgren & Johansson 1992, Riccaboni & Pammoli 2002). In the software industry, alliances and networking are commonplace. From the standpoint of Indian software firms, non-equity alliances are typically vertical downstream alliances. The Indian firm is frequently an outsourced supplier of customised software services for an American producer of software platforms installed for end-user customers. They are supply chain partnerships whose motives are cooperative specialisation and market access (Contractor 2005). Accordingly, many Indian software firms have large numbers of alliances, often for market access reasons, but also for technology reasons (Siddharthan & Nollen 2004). International alliances are overrepresented as a business practice among the Indian firms. Indian software firms have more alliances (this includes joint ventures, M&As, and outsourcing agreements) with multinational corporations than would be expected by the number of these firms compared to all firms in the industry.
66
1 This section is based on my paper, Siddharthan and Nollen 2010.

5 Technology, Globalisation and Multinationals:The Asian Experience67
Siddharthan and Nollen (2010) study analysed the determinants of growth and profits of Indian and Chinese IT software firms. For the Indian software firms, non-equity strategic alliance was the most important variable influencing their growth and profits. This variable was not significant for the Chinese sample. On the other hand, the performance of Indian software firms was better if they had more non-equity alliances. This was the central feature of the growth and profitability performance of Indian software firms. Alliances are common among these firms. In the sample for this study, 69 per cent of the firms had them, and those firms with alliances average more than five of them. The alliances were typically either marketing or technology alliances, which can contribute both to growth and profit. One more alliance contributes two percentage points to the firm’s growth rate and one percentage point to the firm’s profit margin, according to the estimated coefficients; each is more than a 6 per cent gain from the average. The websites of the US firms acknowledge the strategic alliances with the Indian software firms. They even classify them as bronze, silver, gold and platinum alliances. Bronze alliances are mainly marketing alliances. However, gold and platinum alliances are technology sharing alliances. They allow the Indian firms to build satellite programmes on the US firms’ platforms and integrate them with their overall product. They also allow consultancy and joint R&D activities.The content of the alliances, and the roles that the Indian and foreign alliance partners play, are similar across firms. A typical alliance is one in which the foreign partner provides a packaged software product or a suite of standard software services, and the Indian company provides customised software services to implement or integrate the foreign partner’s product into the customer’s business setting. To do so, the Indian software company accomplishes a range of tasks, ranging from programming to design (modification of the standard product) to systems integration, and in some cases, strategic consulting. (In a few cases, technology alliances have no immediate third-party customer, and instead the Indian and foreign software companies jointly create new software products.) The Indian firms obtain inclusion in the western firm’s collection of alliances based on the cost and quality of their software services. The foreign alliances are usually overlapping: typically an Indian software company has some alliances with the same foreign partners as other Indian companies. And the Indian company also has multiple alliances with several foreign firms in the same business area (for example, in e-commerce, data management, and supply chain management). Indian software firms are small by international standards, they don’t enjoy a large domestic market, and they lack international marketing know-how and domain knowledge specific to international customers. Given these limitations they could not have entered the global market via the FDI route. Under these conditions they opted for networking with several international firms and forged strategic alliances, created dyadic relationships, and succeeded in generating value that could not have been accomplished

6Global Technology Spillovers / N S Siddharthan
by either firm acting alone. The multinational firms in turn took advantage of internet technology and established knowledge sharing relationships with Indian firms for mutual benefit.
References
Acharya R.C. and W. Keller. (2009). Technology transfer through imports’, Canadian Journal of Economics / Revue Canadienne d’Economique, Vol. 42, No. 4.1411-1418.
Augier, Patricia, Olivier Cadot, Marion Dovis. (2013). ‘Imports and TFP at the firm level: the role of absorptive capacity’, Canadian Journal of Economics, 46(3), pp956-981.
Chetty, Sylvie and Desiree Blankenburg Holm. (2000). ‘Internationalisation of small to medium-sized manufacturing firms: a network approach’, International Business Review, 9(1), 77-93.
Contractor, Farok. 2005. ‘Alliance Structure and Process: Will the Two Research Streams Ever Meet in Alliance Research?’ European Management Review, Vol. 2, pp. 123-129
Dyer, Jeffery H. and Kentaro Nobeoka. (2000). ‘Creating and Managing a High-performance Knowledge-sharing Network: The Toyota Case’, Strategic Management Journal, Vol. 21, 345-367.
Eriksson, Kent and Sylvie Chetty. (2003). ‘The Effect of Experience and Absorptive Capacity on Foreign Market Knowledge’, International Business Review, Vol. 12, 573-695.
Forsgren, M. and J. Johanson. (1992). ‘Managing Internationalisation in Business Networks’. In: Forsgren, M. and J. Johanson, Editors, 1992. Managing networks in international business Gordon and Breach Science Publishers, Amsterdam, pp. 1–16.
Kafouros, Mario I., Peter J. Buckley, Jeremy Clegg. (2012). ‘The effects of global knowledge reservoirs on the productivity of multinational enterprises: The role of international depth and breadth’, Research Policy 41 (2012) 848– 861.
Keller, Wolfgang. (1998). ‘Are international R&D spillovers trade-related? Analyzing spillovers among randomly matched trade partners,’ European Economic Review 42, 1469–81.
Pradhan, Jaya Prakash. (2011). ‘R&D strategy of small and medium enterprises in India’ Science, Technology and Society, 16(3), 373-395.
Riccaboni, Massimo and Pammolli, Fabio. (2002).’On Firm Growth in Networks’, Research Policy. December 2002; 31(8-9): 1405-16.
Saripalle, Madhuri (2014). ‘Labor productivity, trade and R&D in the Electronics industry’ http://fgks.in/event/2014_Papers/Madhuri.pdf
Siddharthan, N S and Nagesh Kumar. (1990). ‘The determinants of inter-industry variations in the proportion of intra-firm trade: the behaviour of US multinationals’, Weltwirtschaftliches Archiv, Journal of the Kiel Institute of World Economics, Federal Republic of Germany, Vol. 126(3), September 1990, 581-591.
Siddharthan, N S and Stanley Nollen. (2010). ‘The performance of Indian and Chinese software firms’, in N S Siddharthan and K Narayanan (Eds), (2010) Indian and Chinese Enterprises: Global trade, Technology and Investment regimes, Routledge, New Delhi and London, 74-101.
Todo, Yasuyuki and Satoshi Shimizutani. (2008). ‘Overseas R&D Activities and Home Productivity Growth: Evidence from Japanese Firm-Level Data’, The Journal of Industrial Economics, Vol. 56, No. 4, pp. 752-777.
68

1 Technology, Globalisation and Multinationals:The Asian Experience
I Neo-Schumpeterian Theories of TradeThe classical and neoclassical theories of trade concentrated trade between countries and attributed gains from trade to comparative cost advantages and resources endowments. In particular, they stressed that labour and capital endowments would get reflected in the country exports and imports. Thus they predicted that capital rich countries would export capital intensive goods and import labour intensive goods. However, as seen from the celebrated “Leontief Paradox” during the 1950s the US, a capital rich country, exported mainly labour intensive goods and imported capital intensive goods. This finding necessitated a closer look at received trade theory. Furthermore, the theory assumed that knowledge is free and technology is known to all the manufacturing firms. The neoclassical economists ignored proprietary nature of technology and the need to invest in R&D and technology acquisition. In addition, they assumed that firms are homogeneous and the resource advantages of countries are reflected in the firm’s behaviour. That is, all the firms have equal access to technology and relevant information regarding markets and enjoy equal goodwill among the consumers. Within a country all the firms are like. Under these conditions, firms do not matter and what matters are the country and the country characteristics.The neo-Schumpeterian trade theorists (Dosi et al 1990) questioned virtually all the assumptions of the neoclassical trade model and attempted to build an alternative paradigm. To begin with, they argued that countries don’t export but firms export. This distinction should not matter if all the firms in a given country are like. But the neo-Schumpeterian economists argued that all firms in a country are not alike and that they don’t have equal access to technology. Therefore, from the point of view of knowledge and technology, firms are heterogeneous. Furthermore, even in a given industry firms are not alike. In a wide range of industries from music systems to garments, firms have been dissimilar. The coexistence of high-tech and low-tech firms in the same industry has been sustained by market segmentation. The low-tech firms cater to a very different set of consumers and markets. Consequently there are mobility barriers that prevent low tech firms in the given industry from moving up the value ladder and enjoying the higher returns experienced by the larger high tech firms. Here it is important to note that there are no entry barriers as both types of firms exist in the industry, but there are mobility barriers (Porter 1979). There are strategic groups within an industry; and mobility barriers prevent firms from moving from one strategic group to another. In the literature the strategic groups in an industry has been identified as MNEs, local firms that have
VIII MNE, Information Technology and Exports
69

2MNE, Information Technology and Exports / N S Siddharthan
non-equity strategic alliances with MNEs and stand-alone local firms (Siddharthan and Nollen 2004). In terms of knowledge and technology, these three groups of firms would differ. The MNEs would enjoy the benefits of their global R&D units, their global brand names and could network with their affiliates in other countries. The opposite is the case with stand-alone local firms.Under these circumstances, firm specific resources matter for trade. Therefore these studies advocate inter-firm, inter-industry and inter-country studies, unlike the neoclassical models that used mainly inter-country studies. For this reason, firm level studies are advocated in explaining exports and imports. In this context, it is further argued that in the case of most high tech industries, exports and imports are dominated by intra-firm trade rather than inter-firm trade (Siddharthan and Kumar 1990). In high-tech and medium-tech goods more than 80 per cent of the world trade is intra-firm. Only in the case of low-tech goods the market prevails. What is more, international trade has been growing mainly in high-tech sector and trade in the traditional low-tech sectors has been either stagnant or even declining (Lall 1999).
II Neo-Technology Theories and ExportsWe take Rodriguez et al (2005) as an illustration of the neo-Schumpeterian models explaining trade. They assume that every firm is heterogeneous and argue that each firm possess resource that other firms cannot easily imitate. The ownership advantages of specialised resources enables the firm to earn abnormal profits and maintain them. They consider R&D, innovations and patents as examples of technology resource. The firm specific technology resources lead to competitive advantage and that enables exports. Thus in their model, technology acquisition by a firm is an important determinant of its exports. In this context they explain exports by a firm in two stages: the first, the decision to export which is a zero – one decision, and the second, how much to export or export intensity. The second question is relevant only for the firms that have taken a decision to export.The results presented by them based on a survey of business strategies of Spanish firms for the two models, namely, decision to export and export intensities are similar except for R&D intensity. R&D intensity does not seem to influence the decision to export, but determines export intensity. Nevertheless, product and process innovations, patents and other technology related variables influence both the decision to export and export intensities. Moreover, the exporting firms also happen to be larger ones. Even after controlling for these variables, MNEs exported more than the local firms. The study clearly shows that firm specific technology variables play a major part in determining exports and technology is proprietary and the endowment of intangible assets are not uniform among firms. Firms differ with regard to knowledge and technology endowments and these endowments give them a competitive advantage in exports. While the neoclassical economists took the resource endowments as given, the neo-Schumpeterian economists argue and show that technology related endowments are created and acquired by the firm and they are mostly proprietary. In this context, exports of a firm depend on its in-house R&D as well as on technology and export spillovers. That is, the impact of industry R&D and the exports of the
70

3 Technology, Globalisation and Multinationals:The Asian Experience
industry as a whole could also influence a given firm’s exports operating in that industry. Furthermore, spillover itself would depend on technological base of the firms. Thus, as shown by Barriost et al (2003), firms with a good R&D base benefited more from R&D spillovers from industry. MNEs benefited more from spillovers than local firms.The neo-technology theories (Ponser 1961, Krugman 1979) developed mainly to explain the exports of technologically advanced countries stress the role of technology gap in determining a country’s international trade pattern. Several empirical studies conducted for developed countries found technology factors important in explaining exports. For example, Gruber, Metha and Vernon (1967) found technology factor important for US exports and industries with relatively high ‘research effort’ tend to export more; Caves et al (1980) for Canada found R&D intensity an important determinant of exports; Soete (1981, 87) found the export performance of the OECD countries influenced by their share of patents; Sveikauskus (1983), found technology to be a more important factor in explaining US competitiveness than skill and capital intensity; similar results were found by Hughes (1986) for UK. However, there are problems in directly applying neo-technology theories to developing countries. By and large, the theory assumes that new technology is mainly created in the developed countries and gets diffused to the developing countries. The gap between creation and diffusion creates possibilities of trade. It is possible that developing countries are at a disadvantage in exporting high tech goods. Nevertheless, in medium and low tech goods, firms from developing countries could perform R&D and develop technological trajectory advantages. Innovations in developing countries may not result in technological paradigm shifts but could results in technological trajectory shifts. Kumar and Siddharthan (1994) show that technological activities of firms from developing countries like India would be important in explaining their export performance in low and medium technology industries. Based on an analysis of inter-firm variations in export behaviour of Indian enterprises in 13 industries with data for a three year panel (1988-90), they conclude that firm’s technology expenditures significantly influence the export behaviour of medium and low technology industries. However, in the high technology industries, Indian firms were unable to enter the world market based on their own technology efforts.
III MNE, Technology and ExportsWhile discussing the role of technology in promoting exports it is important to discuss the role of MNEs. Most studies conducted for the pre liberalisation period in India found MNEs and their Indian affiliates concentrating on the Indian market and exporting less. In this background Aggarwal (2002) found that during the liberalised regime in India MNE affiliates in India performed distinctly better than the local firms in the export market. Furthermore, MNE affiliates had a greater competitive advantage in high tech than in medium and low tech industries. However, the evidence was not strong enough during the initial period of liberalisation to suggest that Indian has been attracting efficiency seeking FDI. Aggarwal concludes that India’s competitive advantage still lies in low tech industries. Important studies on the role of MNEs in promoting exports appeared soon after the
71

4MNE, Information Technology and Exports / N S Siddharthan
publication by Willmore (1992) based on Brazilian data. However, the results from these studies (Aggarwal, 2002; Buck, Filatotchev, Demina, and Wright, 2000; Kumar and Siddharthan, 1994; Patibandla, 1995; and Willmore, 1992, Athukorala, Javasuriya, and Oczkowski, 1995; Bonaccorsi, 1992; Katsikeas, Leondidou, and Morgan, 2000; Wagner, 2001) have not been unambiguous. Furthermore, as concluded by Aulach, Kotabe, & Teegen (2000, p. 343) empirical explanations are “inconsistent and contradictory”. However, recent studies based on Indian data find MNE affiliation and technology variables significant in explaining exports. For example Narayanan (2008) found foreign equity participation, capital intensity and size important in explaining exports for a sample of IT firms operating in India. But other technology variables like R&D and arm’s length purchase of technology were not important. One of the reasons for the conflicting results could be that most of the studies have merely introduced MNE as a dummy variable or another variable in addition to the variables representing firm characteristics like size, R&D, technology licensing, skill and advertisement. These equations assume that MNEs and other firms’ exports behaviours are alike with regard to the firm level variables. That is, the slope coefficients of these variables will not differ between MNEs and other firms. This assumption is questionable as the export behaviour of the affiliates of MNEs is determined differently from that of other companies and particularly so in high technology industries in developing countries. Siddharthan and Nollen (2004) argue that MNE affiliates behave differently from other firms and that the magnitude and sign of the coefficients of some determinants of exports will differ between the MNEs and other firms. Therefore they advocated fitting separate equations for MNEs and the rest. They further argue and show that some of the variables that determine the export performance of MNE affiliates are different from those that apply to licensees and domestic firms, and that the direction and magnitude of other export determinants differ across these groups of firms.The main argument is presented in Diagram 1. Firms in high tech industries in developing countries consists of roughly three strategic groups – MNEs and their affiliates, firms that license technology from foreign firms, and local firms that do not have equity and/or licensing arrangements with foreign firms. The three strategic groups of firms export behaviour differ with regard to the main determinants of exports.In the developing economies, the technology paradigm is mainly imported. The import of technology could be either intra-firm through FDI, or licensing of technology against royalty and technical fee payments, and it could also be embodied technology imports – technology embodied in machinery, components and materials. These are mentioned in the left box. The right hand side box mentions strategic groups. Intra-firm imports correspond to MNEs, licensing of technology relates to LIC. The “Domestic” ones will be mainly importing embodied technology in the form of machinery, materials and components. Nevertheless, it should be noted that MNEs can also license technology and import components. Likewise licensees can also import components and machinery. The right box also lists firm characteristics that are considered in literature as determinants of exports. These are size, age, skill, technology and goodwill. The main argument is that the sign of the coefficients of these variables would differ between the three strategic groups.
72

5 Technology, Globalisation and Multinationals:The Asian Experience73
For example, while size is an advantage for exports for domestic firms, the size of the Indian MNE affiliate need not be an advantage for the MNE. For export advantage the size of the MNE that matters, and not the size of the Indian subsidiary or affiliate. Likewise, the advertisement expenditures of the Indian subsidiary might not matter for global exports but the global brand name and goodwill of the MNE that would matter. Also the global R&D of the MNE would matter more than the technological expenditures of the local affiliate. Therefore, the values and signs of the coefficient of these variables could differ between the MNE affiliates and other firms.Siddharthan and Nollen (2004) estimated three separate equations for the three strategic groups of firms, namely, MNE and their affiliates, licensees and domestic firms for a cross-section of IT firms operating from India for the years 1994-98. Their study shows that for the information technology firms in India, the explanation of export performance depends in part on the firm’s foreign collaboration and on the amount and type of technology that it acquires from abroad. For affiliates of MNEs, both explicit technology transfer from purchases of licenses and payments of royalties, and tacit technology transfer received from foreign ownership contribute to greater export intensity. They do so independently, without a complementary interaction to further boost export performance. In contrast, the explanation of export performance for strictly domestic firms that have neither a foreign equity stake nor foreign licenses is different. For these firms, more imports of raw materials and components as a source of product quality improvement contribute to more exports of products, as does larger size of firm and greater capital intensity. These export determinants for domestic firms are unimportant for MNE

6MNE, Information Technology and Exports / N S Siddharthan
affiliates, because the foreign ownership influence in the MNE affiliates makes them less necessary. In addition to the IT sector, the Indian pharmaceutical sector has also emerged as an important export oriented sector. Goldar (2013) shows after the introduction of the more restrictive patent regime in India (after 1995) the export intensities of the Indian pharmaceutical firms increased substantially. Furthermore, the rapid increase in export intensities was accompanied by increases in R&D intensities. The R&D intensities during the mid-1990s were about 2 per cent and it increased to about 6 per cent during 2008-09. Likewise the export intensities also increased from about 18 per cent in mid 1990s to about 39 per cent during 2008-09. For the econometric analysis, Goldar (2013) uses Capital Line data set for the period 1999 – 2011. He considered 319 firms. He used two estimation procedures – Tobit specification and Cox Proportional Hazard Model. For explaining export intensities, he used R&D intensity as a separate variable as well as R&D intensity multiplied with technical efficiency as a separate interactive variable. Both were significant indicating that the increased R&D intensities were responsible for the increase in exports. The results also showed that the impact of R&D intensity would also depend on the level of productivity already reached by the firm. Thus the firms that were nearer the frontier gained more by their R&D activities. Foreign equity participation also increased exports. Vyas, Narayanan and Ramanathan (2013) brought another dimension to the determinants of exports and the role of R&D, namely, the impact of mergers and acquisitions (M&A). They also deal with the Indian pharmaceutical sector. They argue that acquisitions can enhance specific intangible assets like production skills, brand names and better management capabilities. These influence the export behaviour of domestic firms and promote their degree of internationalisation. In their econometric methods they use two methods of estimation, namely, Tobit, and Double Specification Model. While analysing the determinants of exports, in addition to M&A they also introduce several firm specific variables like size, technological effort and imports. They found M&A important in explaining exports. Foreign equity consistently had a negative sign and was significant. Thus it is Indian firms that exported and not MNE affiliates. R&D and the import of materials also emerged significant in explaining exports.In recent years, Indian firms have also undertaken investments overseas and have emerged as Indian MNEs. The outward foreign direct investments (OFDI) by Indian MNEs have also contributed to exports. Narayanan and Bhat (2010) shows that Indian IT MNEs differ from the rest of the Indian IT firms in their intrinsic characteristics including export behaviour. In particular, the Indian MNEs had higher export intensities and were technologically more advanced compared to others. In their full sample while explaining decisions to export (Probit equations) and export intensities (Tobit and Truncation equations), when the Indian MNE dummy was introduced, it emerged positive and significant indicating that Indian OFDI firms exported more. Furthermore, the results of the Indian OFDI subsample differed in certain respects from the full sample. By and large, the results indicate that the export intensities of Indian OFDI MNEs depended on size (larger firms exported more), capital intensity, and the skill content of their work force.
74

7 Technology, Globalisation and Multinationals:The Asian Experience
The studies discussed so far have been concentrating on export behaviour of MNEs. However, as per the OLI paradigm discussed in Chapter 2, there are several ways of internationalisation and exports is only one of them. The firm could source materials from abroad, invest abroad (FDI) and also invest in R&D abroad. All the four modes need to be considered together. Furthermore, do SMEs behave differently from large firms with regard to their foreign activities? Hollenstein (2005), for a sample of Swiss firms analysed the factors determining the choice of a specific international strategy, namely, exports, distribution of goods in a foreign location, FDI and FDI in R&D. They present cross section estimates of two models. In model I, they distinguish between two groups of international firms, namely, firms that merely export (X) and firms in addition to exporting are also engaged in other activities in foreign location (FA). They estimate the probability of belonging to X or FA with firms confined to purely domestic activities as the reference point. In Model II, FA is subdivided into three groups: (1) Firms which are engaged abroad in distributive/other activities or local production/procurement. (2) Firms active abroad through distributive/ other activities and production/procurement. (3) Firms which, in addition to distributive/other activities and/or production/procurement, also do some R&D in foreign countries. The study showed a marked increase in the Swiss SMEs investments in other countries. It further shows that while size of the firm in important for internationalisation, its importance should not be overemphasised as size is important only up to a threshold of 200 employees. With regard to the use of OLI paradigm with regard to export only strategy (X) O advantages were important. Smaller firms went abroad for production and R&D collaboration mainly due to location disadvantages in the home country. This was also partly true for larger firms also. Furthermore, with regard to internationalisation, smaller firms relayed mainly on incremental innovations while larger firms depended on a larger knowledge base that enabled them to produce more fundamental innovations. With regard to internationalisation SMEs behaved differently from larger firms.In the same country different states/provinces could have different business environment and that could affect the export behaviour of domestic firms and MNEs. This is particularly true of China where institutional environment differs significantly across regions. In particular, there are important regional differences in the operation of free market mechanism (operation of market determined prices and protectionist policies followed by local governments) and institutional developments like development of market intermediaries, laws relating to consumer protection and intellectual property protection. Gerald Yong Gao, Janet Y Murra, Masaaki Kotabe, and Jiangyong Lu (2010) address these issues in influencing exports based on longitudinal data of 18,644 domestic private enterprises and foreign wholly owned subsidiaries in China from 2001 to 2005. They take into account firm specific, industry specific and region specific characteristics. They estimate separate equations for decision to export and export intensities for domestic firms and MNEs separately. Specific variables cost factors like production and selling costs affected all the firms with regard to the decision to export and export intensities – they had a negative sign indicating higher the costs lower the exports. However, when it came to technology variables like R&D and introduction of new
75

8MNE, Information Technology and Exports / N S Siddharthan
products, they influenced the exports of domestic firms and MNEs differently. R&D intensity was significant only for domestic firms and not for MNEs. In the case of the introduction of new products, it had a positive sign for domestic firms but a negative sign for MNEs. It could be MNEs did most of its R&D in the home country and not in China. Furthermore, the MNEs did not export new products from China. In the case of industry specific and region specific variables (industry export orientation, free market mechanism and intermediate institutions), there was no difference between the export behaviour of domestic firms and MNEs and all the variables were significant with a positive sign. This result prompted the authors to conclude that regional differences in free market mechanism and creation of institutions matter for exports for all firms and regions that have been protectionist and that does not have the legal institutions in place will not invite export oriented units.
IV Born Global EnterprisesSome of the young scholars who studied in the US and Europe and also worked for some time in those countries, decide to return to their home countries and start new enterprises. Filatotchev, Igor, Xiaohui Liu, Trevor Buck and Mike Wright (2009), analyse the export performance of firms started by the Chinese returning entrepreneurs from OECD countries. They call these enterprises as “born global” enterprises as they are started with an intention of going global. It is common to term the phenomenon of students from developing countries migrating to developed countries for higher studies and later, employment as “brain drain”. Filatotchev et al prefer to call them “brain circulation” rather than “brain drain” as these students go to OECD countries to study, gain experience by working in their enterprise and return to China to start enterprises. According to them “born global” companies create sustainable competitive advantage based on unique technologies and innovation which they source worldwide. They also enjoy advantages in superior R&D activities due to their research experience in developed countries. These companies are also knowledge intensive companies. Using a unique, hand-collected dataset of 711 SMEs from Zhongguancun Science Park in China, the paper argues that export orientation and performance depend on:
• The development of capabilities through R&D and technology transfer • Entrepreneurial characteristics, such as the founder‘s international background and
global networks. • Presence of a returnee entrepreneur• R & D intensity• Global networks – deals with contact with people in foreign markets and membership
of foreign associations.• Entrepreneurs knowledge transfer from abroad• Previous internalisation experience of entrepreneurTheir results showed that export orientation of the sample firms depended on firm size, returnee entrepreneur, global networks, knowledge transfer, and the interaction term of R&D intensity with returnee entrepreneur.
76

9 Technology, Globalisation and Multinationals:The Asian Experience
V Information Technology and ExportsSeveral authors have suggested that information technology (IT) in general and internet in particular would make developing countries producers and exporters of goods rather than mere materials. IT and internet technologies have drastically reduced transaction costs and MNEs could easily locate and source components, undertake R&D and marketing in different countries. Business to Business (B2B) commerce would benefit component manufacturers from developing and newly industrialising countries. The IT using factory differs significantly from non-IT using factory. Brynjolfsson and Hitt (2000) analyse the main differences between the IT using and other factories. They term them as old and new factories. They produce the Table to sharply bring out the differences.
Table 1
Principles of the "old" factory Principles of the "new" factory
Designated equipment Flexible computer-based equipment
Large inventories Low inventories
Pay tied to amount produced All operators paid same flat rate
Thorough final inspection by quality assurance Operators responsible for quality
Raw materials made in-house All materials out sourced
Narrow job functions Flexible Job Responsibilities
Areas separated by machine type Areas organised in work cells
Functional groups work independently Concurrent engineering
Vertical communication flow Line rationalisation
Several management layers Few management layersSource: Brynjolfsson and Hitt (2000)
As seen from the table in almost all the activities ranging from equipment, inventory, labour deployment, material sourcing and management the IT using factory differs drastically from the non-IT using one. In sum, introduction of IT enables the firm to introduce frequent changes in the product design and range, benefits from low inventory holdings, successful out sourcing and more efficient work force achieved by flexible responsibilities coupled with fewer management layers. The drastic changes introduced by IT give competitive advantage to the IT using factory and could enable higher exports.Clarke (2008) analysed the relation between export behaviour and internet access in low and middle income countries in Eastern Europe and Central Asia. In the study, firm level data has been used mainly for small and medium enterprises. After controlling for the firm size, sector of operation, foreign ownership and the level of competition in the domestic market the study found internet access an important determinant of both the decision to export (probit and logit models) and the share of exports in output (tobit model). These results are noteworthy as the sample consists of small and medium firmsThere is evidence to show that even in traditional low tech industries like garments, the use of IT could promote exports. Lal (2006) analysed the role of IT in promoting
77
10MNE, Information Technology and Exports / N S Siddharthan
exports of garment manufacturing units in Delhi, India. The sample firms used the following IT tools: (1) Integrated Management Information System, (2) Computer-Aided-Design (CAD) integrated with Marker Maker System, (3) CAD integrated with high-resolution scanner used for embroidery work on fashion clothes, and (4) Email and internet. The study found that the level of IT adoption significantly influenced exports even after controlling for other variables like firm size. In addition to promoting exports, there is evidence to show that use of IT can also influence outsourcing. Abramovsky and Griffith (2006) show that IT investment is an important factor driving outsourcing and off shoring decisions. They analyse variations in IT investments across firms within an industry in influencing the level of outsourcing and off shoring services. The results based on UK data set, suggests that establishments that use the Internet outsource about 10.6 per cent more than those that do not.
References
Abramovsky, Laura and Rachel Griffith. (2006). ‘Outsourcing and Offshoring of Business Services: How Important is ICT?’, Journal of European Economic Association, Vol. 4, Issues 2-3, pp. 594-601.
Aggarwal, Aradhna. (2002). ‘Liberalisation, Multinational Enterprises and Export Performance : Evidence from Indian Manufacturing’ , Journal of Development Studies, Vol. 38, Issue 3, pp. 119-137.
Athukorala, P. Jayasuriya, S. and Oczkowski, E. (1995). ‘Multinational firms and export performance in developing countries: some analytical issues and new empirical evidence’, Journal 0f Development Economics, February, Vol. 46, Issue 1, pp. 109-122.
Aulach, Preet S., Kotabe, Michael and Teegen, Hildy. 2000. ‘Export Strategies and Performance of Firms from Emerging Economies’, Academy of Management Journal, Vol. 43, No.2, pp.342–61.
Barriost, Salvador; Holger Gorg and Eric Strobl. (2003). ‘Explaining firms’ export behaviour: R&D, spillovers and the destination market’, Oxford Bulletin of Economics and Statistics, Vol. 65, Issue 4, pp. 475-496
Bonaccorsi, Andrea. (1992). ‘On the relationship between firm size and export intensity’,”Journal of International Business Studies, Vol. 23, Issue 4, pp. 605-635.
Brynjolfsson, Erik and Lorin M. Hitt. (2000). ‘Beyond Computation: Information Technology, Organizational Transformation and Business Performance’, The Journal of Economic Perspectives, Vol. 14, No. 4 (Autumn, 2000), pp. 23-48.
Buck, Trevor, Igor Filatotchev, Natalia Demina and Mike Wright. 2000. ‘Exporting Activity in Transitional Economies: an Enterprise-Level Study’, Journal of Development Studies, Vol.37, No.2 (Dec.), pp.44–66.
Caves, Richard E. et al. (1980). Competition in the Open Economy: A Model Applied to Canada, Cambridge, Mass: Harvard University Press.
Clarke, George R.G. (2008). ‘Has the internet increased exports for firms from low and middle-income countries’, Information Economics and Policy, Vol. 20, Issue 1, pp. 16-37.
Dosi, G., Keith Pavitt and Luc Soete. (1990). The Economics of Technical Change and International Trade, London: Harvester Wheatsheaf.
Gerald Yong Gao, Janet Y Murra, Masaaki Kotabe, and Jiangyong Lu. (2010). ‘A strategy tripod perspective on export behaviours: Evidence from domestic and foreign firms based in an emerging economy’, Journal of International Business Studies, Vol. 41, pp. 377–396.
Goldar, Bishwanath. (2013). “R&D intensity and exports: a study of Indian pharmaceutical firms”, Innovation and Development, Vol. 3, Issue 2, pp. 151-167.
78

11 Technology, Globalisation and Multinationals:The Asian Experience
Gruber, William H, Dileep Mehta, and Raymond Vernon. (1967). ‘The R&D factor in international trade and investment of US industries”’ Journal of Political Economy, Vol. 75, pp. 20-37.
Hughes, Kirsty. (1986). Exports and Technology, Cambridge University Press, Cambridge.
Katsikeas, Constantine S., Leonidas C. Leondidou and Neil A. Morgan. (2000). ‘Firm-level export performance assessment: Review, Evaluation, and Development’, Journal of the Academy of Marketing Science, Vol.28, No.4, pp.493–511.
Krugman, Paul. (1979). ‘A model of innovation, technology transfer and the world distribution of income”’ Journal of Political Economy, Vol. 87, pp. 253-66.
Kumar, Nagesh and N.S. Siddharthan. (1994). ‘Technology, firm size and export behaviour in developing countries: The case of Indian enterprises’, The Journal of Development Studies, Vol. 31, pp. 289-309.
Lal, K. (2006). ‘ICTs and Export Performance: The Case of Garment Manufacturing Enterprises in India’, in: Maximo Torero and Joachim von Braun (Eds.), Information and Communication Technologies for Development and Poverty Reduction: The Potential of Telecommunications, Baltimore: Johns Hopkins University Press, pp. 207-233.
Lall, S. (1999). ‘India’s manufactured exports: Comparative structure and prospects’, World Development, Vol. 27, Issue 10, pp. 1769-1786.
Narayanan, K. (2008). ‘Technology Acquisition and Competitiveness: Evidence from Indian IT Industry’, (In S. R. Hashim and N. S. Siddharthan ed, High Tech Industries, Employment and Global Competitiveness, Routledge, London, New York and New Delhi, 2008, pp. 70-96).
Patibandla, M. (1995). ‘Firm size and export behaviour: An Indian case study’, The Journal of Development Studies, Vol. 31, pp.868-82.
Ponser, Michael V. (1961). ‘International trade and technical change’, Oxford Economic Papers, Vol. 13, pp. 11-37.
Porter, Michael E. (1979). ‘The Structure within Industries and Companies’ Performance’, Review of Economics and Statistics, Vol. 61, pp. 214-27.
Rodriguez, Jose Lopez and Rafael M. Garcia Rodriguez. (2005). ‘Technology and export behaviour: A resource- based view approach’, International Business Review, Vol. 14, pp. 539-557.
Siddharthan, N.S. and Nagesh Kumar. (1990). ‘The determinants of inter-industry variations in the proportion of intra-firm trade: The behaviour of US multinationals’, Weltwirtschaftliches Archiv, Vol. 126, pp. 581-591.
Siddharthan, N. S. and Stanley Nollen. (2004). “MNE affiliation, firm size and exports revisited: A study of information technology firms in India”, The Journal of Development Studies, Vol. 40, Issue 6, pp. 148-170.
Soete, Luc. (1981). ‘A general test of technological gap theory’, Weltwirtschaftliches Archiv, 117, pp. 638-59.
_ (1987). ‘The Impact of Technological Innovation on International Trade Patterns: The Evidence Reconsidered’, Research Policy, Vol. 16, pp. 101-130.
Sveikauskus, L. (1983). “Science and technology in US foreign trade”, the Economic Journal, Vol. 93, pp. 542-54.
Vyas, Vidhisha, K Narayanan and A Ramanathan. (2013). ‘Mergers and acquisitions, technological efforts and exports: a study of pharmaceutical sector in India’, Innovation and Development, Vol. 3, Issue 2, pp. 169-186.
Wagner, Joachim. (1995). ‘Exports, Firm Size, and Firm Dynamics’, Small Business Economics, Vol. 7, Issue 1, pp. 29-39.
Willmore, Larry. (1992). ‘Transnationals and foreign trade: Evidence from Brazil’, Journal of Development Studies, Vol. 28, Issue 2, pp. 314-35.
79

1 IX FDI: Impact on growth, employment and poverty
There is consensus in literature on the positive impact of foreign direct investments (FDI) in facilitating technology and productivity spillovers to local firms and in improving the global competitiveness of the host country enterprises. However, evidence of the impact of FDI on the growth of per capita income, employment and poverty reduction has been mixed. Several explanations have been offered for the non-equivocal results. They range from theoretical deficiencies, sample problems involved in analysing international cross-section of countries with different policy regimes and histories, differences in stages of development, and appropriate econometric methods for testing. In this chapter it is proposed to present a select sample of empirical studies that deal with these issues.
I. Impact of FDI on Economic GrowthOne set of studies (Bhagwati 1978; Balasubramanyam, Salisu and Sapsford 1996) argue that the impact of FDI on growth would depend on the trade regime of the country. In particular, import substitution regimes introduce distortions in exchange rates and attract rent seeking and tariff jumping FDI that does not contribute to growth and welfare. They equate export led strategies (EP) with effective exchange rates and consider it as trade neutral. In contrast in the import substitution (IS) strategy, effective exchange rates on imports would exceed effective exchange rate on exports and is biased towards import substitution. As a consequence, the IS strategy would provide widespread incentives for rent seeking and directly unproductive profit seeking FDI activities. Under these circumstances FDI would enhance private returns without increasing social returns. On the other hand, trade liberalisation would promote allocative efficiency by reorienting investments in sectors where the country had resource advantages. In their econometric study, they analysed the determinants of the growth of real GDP for 46 countries for the period 1970-85. They divided the sample into two groups – EP and IS countries. FDI used as a ratio of GDP was significant only for the EP countries. Borensztein, De Gregorio and Lee (1998), introduce another important dimension to the debate on FDI and growth. Following endogenous growth theories they argue that the rate of technological progress is the main determinant of the growth of income. Since MNEs possess advanced knowledge, they are in a better position to transfer technology both in the form of intangible and tangible capital. However, the introduction of new technology would depend on the skill content of the workforce. Therefore, FDI would mainly benefit countries that are rich in human capital. They used a panel data for two decades (1970-79 and 1980-89) for 69 developing countries. In their equation explaining
IX FDI: Impact on growth, employment and poverty
80

2This is a dummy copy to give you and idea of typeface and typesize. / Siddharthan
GDP per capita growth rate, they use schooling and FDI as two separate variables and both were not significant. However, when they were used in a multiplicative form the variable was significant. This result made them conclude that FDI would contribute to growth rate only in the presence of the skill variable as they are complementary. Some scholars argue that all FDI does not contribute to the growth of GDP. Only FDI in manufacturing contribute to growth. Wang (2009) argues that capital formation and technological change are the main engines of growth. However, FDI in manufacturing sectors alone qualify for this. Based on 12 Asian countries for the period 1987-97 Wang analyses the impact of FDI in six sectors on growth. The sectors are agriculture, manufacturing, construction, finance, services and others. Of these six sectors only FDI in manufacturing was significant in influencing growth. FDI in other five sectors were not important and some of them even had a negative sign. In addition to manufacturing FDI, domestic investments and human capital also contributed to growth. Based on these results the paper argued that if different sector-level FDI contributed differently to economic growth, the aggregation could blur the actual growth effect and lead to ambiguous results. Wang also found FDI more efficient than domestic investment for promoting growth of the 12 Asian countries. In another study, Wang and Wong (2009) further differentiate the impact of FDI on growth based on Greenfield investments and mergers and acquisitions (M & A). Using a sample of 84 countries from 1987 to 2001, they found M&A contributing to growth only if it was accompanied by human capital (average years of secondary schooling). Unlike M&A, Greenfield investment was significant in all the equations.The impact of FDI on growth could also depend on institutional constraints. Frequent changes in government, business regulations, policy instability could affect the impact of FDI on growth. The paper by Vadlamannati, Chaitanya and Tamazian, (2009) aims to identify the relative importance of host country reforms and institutional constraints on growth effects of FDI after controlling for other key determinants. They study 80 developing countries from Africa, Latin America and Asia for the period 1980 – 2006. Their dependent variable is the growth rate of output per worker. Their results showed that in addition to FDI inflows, economic reforms index also turned out to be highly significant.Thus the impact of FDI on growth would depend on several factors ranging from the nature of the policy regime, the skill content of the labour force, sectoral composition of FDI inflows –manufacturing, agriculture and services, Greenfield investments and mergers and acquisitions. The impact is not automatic.
II FDI, Technology and EmploymentStudies relating to FDI and employment concentrate on two main issues, namely, the impact of FDI outflows on the employment of the home country and the employment prospect of the FDI inflows for the host country. The first one is related to the fears of losing jobs due to shifting of manufacturing out of the country and the second related to the concern the FDI inflows would come with inappropriate technology resulting in allocative inefficiency and consequent unemployment. In what follows, we will consider impact of FDI inflows first and the impact of outflows next.
81

3 IX FDI: Impact on growth, employment and poverty
The negative effects of the MNE entry into a developing country could be due to two reasons – inappropriate technology (in particular labour saving technology) developed by the MNE in its home country and transferred to the host country, and the exit of some of the domestic firms due to the entry of MNE with superior technology and marketing skills. On the other hand, it is also argued that one should not merely examine the direct employment effects of the entry of MNE, but should also consider the indirect effects and spillover effects. Karlsson, Lundin, Sjöholm and He (2009) used the Chinese data compiled by the National Bureau of Statistics of China for the period 1998 -2004 to analyse the impact of FDI on the growth of employment. In their growth of employment equation, MNE dummy and the dummy for private sector enterprises had a positive sign indicating higher employment contribution of these two groups. However, when the lagged employment variable was introduced the coefficient of the MNE and private sector firms turned negative. These were the OLS estimates. In their Heckman Two-Step estimates, they found the survival rate of the MNEs and private firms positive and significant. They concluded that the MNEs contributed to higher employment growth because of their higher survival rate. MNEs also contributed to employment because of their propensity to export more. For China this aspect was important as it depended heavily on exports.For studying the impact of FDI on employment for China, Liu (2012) used the time series co-integration method to analyse. The motivation for the paper was because MNEs in China accounted for 28 per cent of value added in the industrial sector (in 2006), accounted for about 58 per cent of total exports, and contributed to 11 per cent of local employment. The study showed that FDI contributed to employment only for the industrial and tertiary sectors and not to agriculture. It is worth noting that as seen in the previous section FDI contributed to growth mainly in the manufacturing sector. The paper concludes that in the long run FDI would play a notable role in the transition of labour force from the primary to secondary and later on to the tertiary sectors. While the labour surplus developing countries were concerned about the impact of FDI inflows on the growth of employment, the developed countries were worried about the impact of FDI outflows to cheap labour countries on their (home) employment creation. It was felt that with FDI outflows to developing countries, employment would also shift to them. In fact this is an important electoral issue in the US. The Democrats in particular, have been arguing in favour of withdrawing tax and fiscal concessions offered to US firms that have shifted part of their productions abroad. As against this there have also been arguments that state that in a globalised world it would not be possible to produce all good including components in one location. Manufacturing units will have to be located in countries based on location advantages. Therefore, opposition to FDI outflows is short sighted and would harm the interests of the home country (in this case the US) firms. If the home country firms become non-competitive due to restrictions placed on foreign operations, then they would lose their world market share and that could adversely affect the domestic employment. There were widespread fears in Europe that transferring of low tech manufacturing jobs to cheap labour countries would result in deindustrialisation and unemployment in Europe. In this context, the study by Navaretti, Castellani, and Disdier, (2010) shows that
82
4This is a dummy copy to give you and idea of typeface and typesize. / Siddharthan
for France and Italy there were no adverse impacts. In fact productivity and employment increased in the medium run. The paper examines the impact of outward FDI onemployment, gross output, and value added, total factor productivity of what the authors call the economic activities maintained at home by the investing firms. They estimated a multinominal logit model and computed propensity scores for three possible scenes, namely, 1. Not investing abroad, 2. Investing in developing countries and 3. Investing in developed countries. They use ATT (average treatment on treated) and DiD (difference and difference) estimators. For both France and Italy they find no negative effect on investing abroad on firm performance. For Italy, they find a significant increase in total factor productivity of the Italian (home country) firms three years after investing in a less developed country. Employment dropped slightly (not statistically significant) immediately after investment but recovered fast and after three years was higher by 8 per cent compared to the controlled group.European investments abroad could be to expand business and penetrate distant markets. The firms could retain their core areas of competence at home and shift only non-core areas to foreign locations. This will not reduce employment at home. Federico and Minerva (2008) analysed the impact of outward FDI on local employment for Italy. The analysis was carried out for the period 1996-2001 covering 103 Italian administrative provinces and 12 manufacturing industries. They found that employment in provinces that specialised in a single industry did not grow. On the other hand employment in provinces with diversified industries (they took the inverse of H index) grew faster. With regard to OFDI, outward investment to the world and to developed countries contributed positively to employment growth. The coefficient of investment to less developed countries was not statistically significant in explaining employment growth.
III FDI and PovertyKalirajan and Singh (2010) argue that the gap between the actual and potential performance of an economy emanates from its structural and institutional rigidities. These rigidities stand in the way of the economy from utilising appropriate technology and other resources efficiently. These rigidities also limit the country’s access to modern technology and appropriate FDI inflows. In this context, effective liberalisation is expected to remove some of the rigidities and improve performance. However, some critics argue that liberalisation would increase income inequalities and could also increase absolute poverty. Kalirajan and Singh (2010) study the impact of liberalisation introduced in India and the impact of FDI inflows on poverty. The paper deals with the determinants of inter-state differences in poverty reduction in India. For poverty measurement they use the data supplied by the Indian Planning Commission and consider change in poverty between two points, 1993-94 to 1999-2000. The emphasis is on poverty reduction rather than on poverty levels. They have a 4 simultaneous equations model – dependent variables are rate of poverty reduction, share of industry in the state domestic product, share of agriculture in the state domestic product, and the approved FDI as a share of state domestic product. Their results show that FDI by itself does not directly contribute to the reduction of poverty. However, FDI contributes to the share of industries in income and the share
83
5 IX FDI: Impact on growth, employment and poverty84
of industrial sector contributes to poverty reduction. This finding is in conformity with the earlier results presented in the earlier sections of this chapter, namely, only FDI in manufacturing contributes to growth and employment.Zhang (2006) argues based on the Chinese data that FDI helps in reducing adverse external shocks like the Asian financial crisis and thereby helps the poor. The study also found a positive relationship between FDI and corporate governance. MNEs in China were also more aware of environmental issues and labour standards as they are important for their customers in developed countries. Furthermore, FDI has also been helping in the management of safety nets and in particular delivery to the poor. The study is based on three cross-section samples for three five year sub periods – 1984-88, 1989-93 and 1994-98. The paper says, “To avoid potential problems of time-series data with nonstationarity, cointegration, and autocorrelation, we use average values of all variables for three sub periods rather than fifteen years of time series”. It is not clear as to why this was resorted to as appropriate methods are available to tackle all these issues. The paper found FDI contributing to the overall growth of income after controlling for other variables.Another important issue relates to the impact of FDI on regional imbalance within a country. In the case of China there have been fears that after liberalisation the regional inequalities have worsened. In this context Wei, Yao, and Liu, (2009), cite two sets of studies, one set suggesting high growth rates of coastal areas due to FDI and the neglect of other provinces, and the other set suggesting that from 1980 FDI has promoted regional equality and reduced poverty. The paper uses β and σ convergence to estimate the link of FDI inflow to China’s regional inequalities. The paper reports that during 1979–2003, real per capita GDP of China increased more than eight-fold, registering an average annual growth of 9.41 per cent, while that of the east, central, and western provinces were 10.17 per cent, 8.5 per cent, and 8.05 per cent, respectively. Based on their convergence analysis they conclude that FDI is an important factor favouring economic growth, but it is unevenly distributed across the regions. They blame the uneven distribution of FDI across the regions rather than FDI for regional disparities. To encourage regional disparities they advocate encouraging FDI in regions that are deficient rather than reducing FDI. The results of the study do not warrant this conclusion. For this it is important to analyse the causes of inter-regional disparities in FDI before coming to a firm conclusion.
IV ConclusionsStudies surveyed in this chapter show that the relationship between FDI inflows and economic growth is a complex one. It to a large extent would depend on the nature of economic regime and economic policies practiced by the government. In particular, a regime that distorted the exchange rates would attract mainly rent seeking FDI and that would not contribute to growth. Moreover, skill intensity of workforce is an important determinant. Only in the presence of a skilled work force would FDI contribute to growth. Furthermore, the nature of FDI, namely, whether Greenfield or acquisitions would also matter. In addition institutional constraints also play a crucial role.With regard to FDI and employment, some of the studies done for China show MNEs

6This is a dummy copy to give you and idea of typeface and typesize. / Siddharthan
in China have a higher chance of survival and they also dominate the exports. The combination of these two factors contributed to employment. FDI contribution to employment would also depend on whether it went to manufacturing or other sectors. By and large, FDI in manufacturing sector contributed to employment. In contrast to this, governments and policy makers in Europe and the US were concerned about the impact of outward FDI from these countries and in particular to low wage countries. However, empirical studies do not support this concern. In a globalised atmosphere it is not advisable to produce all products and components in a single country. Locating some of the non-core activities in other countries mainly improved the competitiveness of the local firms and enhanced the employment opportunities. Regarding the impact of FDI on poverty, results of the studies surveyed suggest that FDI in manufacturing has a positive impact on the reduction of poverty. FDI could also reduce the impact of the external shocks like the Asian financial crisis on the poor. The Chinese studies show that it could also manage safety nets better. However, it could also increase regional disparities. It tends to go to regions that are already high on socio-economic indicators.
References
Balasubramanyam, V. N. , M. A. Salisu and D. Sapsford. (1996). ‘Foreign direct investment and growth in EP and IS countries’, Economic Journal, Vol. 106, pp. 92-105.
Bhagwati, J. N. (1978). Anatomy and Consequences of Exchange Control Regimes, Vol. i, No. 10, Studies in International Economic Relations, New York: National Bureau of Economic Research.
Borensztein, E, J. De Gregorio and J. W. Lee. (1998). ‘How does foreign direct investment affect economic growth?’, Journal of International Economics, Vol. 45, Issue 1, pp. 115-135.
Chao-Hsi, Huang, Kai-Fang Teng, and Pan-Long Tsai. (2010). ‘Inward and outward foreign direct investment and poverty: East Asia vs. Latin America’, Rev World Econ, Vol. 146, pp. 763–779.
Federico, Stefano and Minerva Gaetano Alfredo. (2008). ‘Outward FDI and Local Employment Growth in Italy’, Review of World Economics, Vol. 144, Issue 2, pp. 296-324.
Kalirajan, Kaliappa and Kanhaiya Singh. (2010). ‘Economic liberalisation strategies and poverty reduction across Indian States’, Asian-Pacific Economic Literature, Journal compilation © 2010 Crawford School of Economics and Government, The Australian National University and Blackwell Publishing Asia Pvt Ltd.
Karlsson, Sune, Nannan Lundin, Fredrik Sjöholm and Ping He. (2009). ‘Foreign Firms and Chinese Employment’, The World Economy, pp. 178 – 201.
Liu, Liyan. (2012). ‘FDI and Employment by Industry: A Co-Integration Study’, Modern Economy, Vol. 3, pp. 16-22.
Navaretti, Giorgio Barba, Davide Castellani, and Anne-Ce´lia Disdier. (2010). ‘How does investing in cheap labour countries affect performance at home? Firm-level evidence from France and Italy’, Oxford Economic Papers, Vol. 62, pp. 234–260.
Vadlamannati, Krishna Chaitanya and Artur Tamazian. (2009). ‘Growth effects of FDI in 80 developing economies: the role of policy reforms and institutional constraints’, Journal of Economic Policy Reform, Vol. 12, Issue 4, pp. 299-322.
85

7 IX FDI: Impact on growth, employment and poverty
Wang, Miao. (2009) ‘Manufacturing FDI and economic growth: evidence from Asian economies’, Applied Economics. Vol. 41, pp. 991-1002.
Wang, Miao and M. C. Sunny Wong. (2009).’ “What Drives Economic Growth? The Case of Cross-Border M&A and Greenfield FDI Activities’, Kyklos, Vol. 62, Issue 2, pp. 316-330.
Wei, Kailei, Shujie Yao, and Aying Liu (2009). ‘Foreign Direct Investment and Regional Inequality in China’, Review of Development Economics, Vol. 13, Issue 4, pp. 778–791.
Zhang, Kevin Honglin. (2006). ‘Does International Investment Help Poverty Reduction in China?’, The Chinese Economy, Vol. 39, No. 3, May–June, pp. 79 – 90.
86
1 Technology, Globalisation and Multinationals:The Asian Experience
Literature on the relationships and collaborations between universities, government aided research institutions and industrial enterprises is very rich. However, most of the studies deal with the European and the US experience. Universities in these countries have a history of collaboration with industrial ventures and several high tech industrial clusters have developed around the universities. In recent years, universities from Asian countries have also started developing links with industrial firms and in-house R&D units. In addition, they have also been collaborating with other universities and government aided research institutions. This paper will concentrate on discussing some of the Asian research studies published in professional journals.Literature in the area of university – industry collaborations has raises several issues:
• Why should universities collaborate with commercial enterprises? Till recently a widely held view in India and other Asian countries (also in some European countries) was that it is not the business of a professor to dabble in business. Academics should confine themselves with teaching and conducting basic research. They are paid only for academic activities and not for indulging in commercial activities to earn extra income.
• What is the impact of commercial collaborations on the quality of academic research and teaching?
• Is this a win-win situation for both institutions? The findings of some of the studies for European countries and the US show a
positive impact of university – industry collaborations for both. What about the Asian experience? This paper will discuss this in some detail.
A related issue deals with the characteristics of firms that decide to collaborate with universities and research institutions.
• Are they R&D intensive firms or firms that prefer to outsource their R&D rather than perform them in-house?
• Do their managements differ compared to non-collaborating firms? • Are they lead by technologists? • From the universities point of view, is there a need to change the legal structure for
effective collaborations? • What kind of research institutional structure is needed to facilitate collaborations? • Finally, how important is the role of the government? For example it is frequently argued that the Bayh-Dole Act of the US (that gave university
X University – Industry Collaborations: Asian Experience
87

2University – Industry Collaborations: Asian Experience / N S Siddharthan
and scientists the right to intellectual property of products and processes created using government grants) gave a boost to patents filled by universities. China has enacted similar acts that in some respects are more generous to the scientists than the Bayh- Dole Act.
I The Chinese Experience The Chinese government considered university research crucial for the development of new products and processes that would make the Chinese industry internationally competitive. To facilitate this China enacted several laws. In this section, we survey three studies on China. The first deals with the changes in the laws and their contribution to national innovative capacity. The second study examines the details of university – industry linkages, namely, linkages with domestic, Asian and western universities, and their impact on the introduction of new products and processes. The third study discusses issues relating to heterogeneous quality of Chinese universities and the problems posed by the gap in the quality of research and teaching among Chinese universities. It argues that university – industry collaborations have increased the gap among Chinese universities.Hu and Mathews (2008) reveal the strong role played by the Chinese universities in building China’s national innovative capacity. They argue that China relies heavily on universities for innovative activity and enterprises spun-off from universities are the main source of innovative activities. These university spin-off ventures are either wholly owned by universities or operated jointly with other entities. They give examples of university affiliated enterprises such as Lenovo, Huawei Technologies (main telecommunications equipment producer), Semiconductor Manufacturing International (Shanghai) Corporation, and Positec Power Tools. The main point to note is the creation and role of university affiliated enterprises. The study shows that by 2004, 52 per cent of all the university and research labs affiliated enterprises are in advanced technology fields and they produce more than 80 per cent of the total revenue. The university established science parks employ more than 100,000 persons in 1200 R&D centres supported 5500 high tech companies. The study by Hu, Li and Hughes (2012) discusses the following important questions relating to the Chinese universities collaborations with the Chinese industry.
• Do the universities contribute to basic, cutting-edge research that result in ground-breaking new technology?
• To what extent are the universities relevant in the diffusion and assimilation of imported frontier technology?
• Is there any difference between collaborating with domestic and foreign universities?
They argue that these questions are important as in their view most of Chinese R&D are spent on development rather than on basic and applied research. They quote the Second National R&D Resources Survey which reveals that about 83 per cent of gross R&D expenditure and 99 per cent of total industrial R&D expenditure in China was spent on development in 2009. They note the rapid increase in research papers published in areas
88

3 Technology, Globalisation and Multinationals:The Asian Experience
of science and technology but point out the below average citations per paper compared to papers published by the US and European scholars. Thus the average citations per Chinese articles was 5.87 while it was more than 10 for the US and European papers.They argue that the Chinese version of the Bayh-Dole Act introduced in 1999, allowing universities to own inventions that were funded by the government went far beyond the US Act in rewarding academic inventors. This has resulted in a rapid increase in the transfer of knowledge to industries from the universities. Furthermore as stated by them the Law on Science and Technology Progress introduced in 2007 specified that ‘IPR rights of invention patents, copyright of computer software, ownership rights of electronic circuit and new biological variety obtained under S&T funding projects sponsored by fiscal finance or S&T program will be granted to the Investigators of the project according to law, except those related to national security, national interest and major public interest’. The econometric part of the paper has two dependent variables: First, the proportion of sales accounted for by products which were ground-breaking at the world level, and, second, the products that were new to China or to the firm. The data set contains 802 firms and more than 90 per cent of them have innovated in their products. Their results showed that cooperation with other organisations, cooperation with domestic universities, intramural R&D expenditures, positively influenced innovation diffusions (the second dependent variable); they did not influence novel innovations. Firm size was not important in influencing innovations. In their regression results, the novel innovations (the first dependent variable) were mainly determined by collaborations with universities from newly industrialised countries, from developed countries like EU, Japan and US, and universities from other countries. Firm size had a negative sign. In sum, novel inventions crucially depended on collaboration with world class universities. The Chinese firms have been collaborating with foreign universities and such collaborations have paid off and have made Chinese goods globally competitive. It is also important to note that most of these innovative firms were not large firms. On the other hand, diffusion of inventions depended on collaboration with domestic universities. Thus university collaborations played a vital role in making Chinese firms globally competitive.University – industry linkages could also have some negative consequences and spillovers. A study by Hong (2008) shows that in the case of China less favoured regions have been further left behind due to shortage of local university resources and the roles of different provinces in the National Innovation Systems. The study further revealed that dramatic increase in patent co-applications by university and firms have been mainly confined to a few provinces in China. Furthermore, the study showed that many less favoured regions did not succeed in building up their knowledge transfer networks with universities and in all probability they would be further left behind in their innovation capabilities and economic performance. In sum, university – industry collaborations in China plays a crucial role in making the Chinese goods globally competitive. Collaborations in foreign universities have enabled Chinese firms to introduce new products and processes. Collaboration with domestic Chinese universities has accelerated diffusion of technology. Conversely, they have also increased regional and inter-university disparities.
89

4University – Industry Collaborations: Asian Experience / N S Siddharthan
II The Japanese Experience In order to enhance global competitiveness of Japanese firms in high tech industries and promote active collaboration between universities and public sector laboratories, Japan enacted the “Strengthening Industrial Technology Bill” which was passed by the legislature in April 2000. The new law allowed the faculty in national universities to assume management positions in companies established to develop their technologies, to work after office hours with pay, and to take up to three years off to commercialise discoveries and then return to their faculty positions (Lehrer and Asakawa 2004). Japanese lawmakers also allowed universities to set up their own technology licensing organisations. In 2004, a ‘radical’ change was introduced in Japan through the National University Incorporation Law which granted the national universities (NUs) autonomy from government. This law intends to promote greater organisational diversity and distinctiveness, more active and socially engaged institutions, and may also have promoted greater inter-university competition and networking with industry thereby laying the foundation for “entrepreneurial universities” (Woolgar 2007).In addition to enacting laws conferring autonomy to the universities and intellectual property rights to the scientists, Japan also encouraged industrial clusters. The Industrial Cluster Project (ICP) of Japan promotes autonomous development of regional universities, supports R&D and networking with universities and other research institutions and enterprises. Nishimura and Okamuro (2011), evaluate the impact of the policy to promote clusters, R&D and networking. Their research is based on data collected from a survey of industrial units in 2009. To begin with they use a probit model to analyse the determinants of the use of ICP. In the next stage, based on propensity scores they deploy difference-in-difference (DiD) models to analyse the degree of industry-university-government collaborations before and after participation in ICP. Further, they use Heckman’s two-step procedure and the negative binomial model to examine the effect of support programs on firm performance. Their sample consisted of 322 users and 189 non users.Their results showed that firms that used ICP facilities were more R&D intensive, employed more labour per firm and participated more in academic societies and trade associations. The sample firms revealed that their main motivation to participate in ICP programme was to benefit from R&D support and facilitation for networking with university and other research institutions. Their DiD estimation of network formation clearly showed that the firms overwhelmingly enhanced the collaboration with other firms, universities and government institutions after joining ICP. In particular, they found that the users are more likely to enter into collaborative agreements with universities than non-users. Significantly, more than 70 per cent of the university collaborators were located in the cluster.Another feature of the Japanese industrial scene is the emergence of several new high tech enterprises popularly called “start-ups”. Some of these enterprises have been collaborating with universities and other research units since their inception or factoring in university collaborations while launching the enterprises. Okamuro, Kato and Honjo (2011) analysed the determinants of R&D cooperation in Japanese start-ups. In their econometric work, they had two dependent variables –1. Cooperation with
90

5 Technology, Globalisation and Multinationals:The Asian Experience91
universities and 2. Cooperation with other firms. They classified the determinants in to three groups – founder, firm and industry specific characteristics. Under founder specific characteristics they included education levels of the founder, prior experience in innovations, patents, work and managerial experience. In addition they also included the experience of the founder in academic associations and societies. Firm specific characteristics include firm size, R&D intensity, nature of the firm, namely, independent firm or a subsidiary/affiliate, and reasons for location – technological and other reasons. Industry characteristics include degree of appropriability and technological opportunity. For the collaboration with universities founder specific characteristic variables like university qualifications of entrepreneurs, past innovation records and membership of academic associations emerged important determinants. For collaboration with other firms, innovation record and patent records turned out to be significant. Thus the only common variable that was significant for both was the innovation record of the founder. In the case of firm specific characteristics only R&D emerged important for both collaborations. Among the industry specific characteristics appropriability was important for collaboration with universities. None of the industry specific variables tried emerged significant in explaining collaboration with firms.
III The Korean and Malaysian Experience The study by Eom and Lee (2010) analyses the main determinants and the impact of university – industry and government research laboratories collaborations. For this purpose it makes use of the Korean Innovation Survey data. The Korean Technology Transfer Promotion Law of 2001 resulted in the establishment of Technology Licensing Offices in all Public Universities. These offices are in-charge of technology transfer and training of officials. The enactment of the law of Industrial Education and Industry – University Cooperation in 2003, resulted in the establishment of Industry – University Cooperation Foundation in 2004. These laws gave a boost to university cooperation with industry.Their sample consisted of 538 firms out of which they classified 388 firms as innovative firms and 150 firms as non-innovative. They estimated separate equations to determine Industry – University cooperation and Industry – government aided laboratory cooperation. None of the firm specific characteristics like R&D, size etc., turned out to be important in explaining cooperation. Mainly regional dummies and membership of industrial conglomerates (CHAEBOL) were important. For the impact on patent types they considered three dependent variables – new product innovation, product improvement and process innovation. The study found the size of the firm and R&D intensity important for product innovation and process innovation. University – industry collaboration was significant mainly for new product innovation.Rasiah and Chandran (2009) analysed the drivers of University – Industry collaborations in Malaysia. Their paper shows that that the R&D activities of some of the Malaysian universities play a notable role in driving firm level innovations. The government has been following explicit policies since early 1990s to promote collaborations. They have set-up Technology Development Corporations to encourage university – industries collaborations and have stepped-up R&D resources considerably. The paper
6University – Industry Collaborations: Asian Experience / N S Siddharthan
uses a probit model to analyse the drivers of collaborations. Their sample consisted of 150 firms from automobiles, electronics and biotechnology sectors – the sectors that mainly had collaborations with universities. Their results showed that R&D intensive firms collaborated more with universities. Thus, the two were not substitutes; they went together. Research intensive universities having access to multiple channels university innovative activities collaborated more. However, the small and medium R&D intensive firms collaborated more. Large firms didn’t. As seen from these results, the Malaysian experience has not been very different from that of other Asian countries like China, Korea and Japan.
IV The International ExperiencePerkmann et al (2013) recently reviewed the literature on university – industry relationships with emphasis on academic engagements and commercialisation. They were concerned with what they termed as knowledge related collaborations by academic researchers with non-academic organisations. In addition to formal research collaborations like collaborative research, contract research, and consulting, they also considered informal activities like providing ad hoc advice and networking with practitioners. Their main research question related to the antecedents and consequences of academic engagements with industry. In particular, they discuss the extent and type of academic engagement, the determinants and consequences to the universities and other stake holders. Their main findings based on a survey of 36 papers published in scholarly journals like Research Policy, Journal of Technology Transfer, Innovision and others, and are summarised below -
• Male academics are significantly more likely to engage with industry• Seniority is often positively related to collaboration. More experienced researchers
are likely to have larger networks, and more likely to find potential partners in the private sector
• Previous experience with commercialisation, patenting or venture creation increases the likelihood of academics’ participation in collaborative activities
• The best and most successful scientists are also those who engage most with industrial partners. There does not seem to be a conflict between good academic research and industrial collaboration. They are not substitutes.
• Commercialisation is undertaken mainly by better quality research departments.• Most authors find that faculty with industrial support publish at least as many
scientific articles as their colleagues, if not more• Academics with industry exposure support more students.
These findings are based on a survey of international literature. It is important to note that the Asian literature survey presented in this paper is more or less in agreement with the international literature. These findings are also valid for Asia.
92

7 Technology, Globalisation and Multinationals:The Asian Experience
V The Indian SceneUnlike other leading Asian countries like China, Japan and Korea, Indian educational institutions collaborations with industry has not resulted in the introduction of new products. They are mainly confined to collaboration in introducing courses and training programmes that would help the universities to produce graduates who could be absorbed by the industry. One of the complaints of the Indian industry is that the Indian universities do not train graduates who could be readily absorbed by the industry. Academic scholars have also been acting as consultants to several industrial enterprises. But these consultancies are not aimed at creating new products. The study by Joseph and Abraham (2009) uses firm level data and covers different manufacturing industries in four of the most industrialised states in India. It throws light on a number of issues relating to university – industry relations. The sectors identified by the study include information technology, chemicals including pharmaceuticals and biotech firms, automobiles, textiles and clothing and machine tools. The following four states were included: Maharashtra, Bangalore, Tamil Nadu and Delhi. The survey covered 460 firms and 735 professors/scientists. The universities covered in the survey were either purely technical universities or technical/science departments in general universities. The survey covered a large number of engineering colleges and research institutions.Their results suggested that universities and publically funded research laboratories did not play an important role as sources of information either in terms of suggesting new projects or help in completing the existing ones. They mainly got information and ideas from firm’s manufacturing operations and customers. Incidents of interaction with universities were also low; hardly 10 per cent of firms reported any interaction with universities and research laboratories. The firms that interacted with universities and research institutions stated that they approached them for mainly to help in quality control and help in using their equipments for testing and other purposes. Firms with stronger R&D base preferred to collaborate with research institutions rather than universities. More than 96 per cent of the firms surveyed (both collaborating and non-collaborating firms) claimed that they have introduced new products. However, most of them turned out to be new products only for the firm in question and not for the country or the world. There could be several reasons for this low level of collaborations and absence of introduction of new products that are new to the country and the world. India has not enacted laws to facilitate university-industry collaborations. In India, by and large, the output of government-sponsored research is considered the property of the government and the researcher has very little say in its commercialisation and application. In this context, the Indian Cabinet gave its nod for a bill - Protection and Utilisation of Public Funded Intellectual Property Bill 2008 (October 30, 2008) - giving scientists share in the intellectual property. This bill has been modelled on the Bayh-Dole Act in the US which spurred applied research in the US universities. The proposed bill allocates one third each of the royalty receipts to the scientists, the research institution, and to the funding agencies. Earlier, the entire sum went to the funding agencies. However, this bill has not yet been passed by the Parliament. Despite the absence of a legal framework, some of the government departments have been following the policy of allocating one third of
93

8University – Industry Collaborations: Asian Experience / N S Siddharthan
the benefits to the scientists.For an effective and productive collaboration between universities and industry, Indian universities should improve their quality to international standards. While some Indian institutions have world class standards, several universities have poor faculty standards. In many universities even senior professors have poor publication records. In order to improve faculty standards, publications in mainstream professional peer reviewed journals should be insisted upon for fresh appointments and promotions. Furthermore, importance should also be given to citations of the work in other peer reviewed scientific journals. Currently no Indian institution figures in the top 200 universities in the world. As seen from the Appendix, among the top 200 universities 27 universities from Asia figure - China 7; Japan 7; Korea 5; Israel 3; Hong Kong 2; Taiwan 2; Malaysia 1. As seen from international rankings, Indian universities and institutions are not on par with our Asian competitors. One of the important reasons for this could be the publication record of Indian academic institutions. As per international criterion only publications that are included in the citation index are considered as professional publications. In India, UGC and other organisations don’t insist on this. They only demand refereed publications. This has resulted in a proliferation of refereed journals with irregular publications and poor quality. Other Asian countries insist on international norms for evaluation of their faculty. Furthermore, Indian Universities do not rely on citation records of their faculty for promotions and appointments. Unless the Indian standards are on par with world standards, Indian institutions will lag behind. Some of the Indian institutes are of world standard. However, they are not included in the ranking of universities as their coverage of disciplines is not broad enough to be classified as universities. They focus on few select disciplines and do not have a strong graduate programme.World rankings also depend on international faculty and students. Several Asian countries, including China, consciously employ international faculty. Here too, India lags behind. Regarding collaboration with industry and academic organisation, Indian institutions have just started initiating them.India has done very well in terms of quantity at the cost of quality. Indian universities are very heterogeneous in nature. Even the best do not figure in the top 200 world universities. To achieve international standards, India needs to emphasise publication record of the faculty in mainstream professional journals and give importance to citations. Global knowledge sharing is also important and India should make their faculty and students more international as the other successful Asian countries have done. It is also argued that the universities are under severe financial constraint and very little is spent on research. Even the library budget is poor. Therefore, if one considers research output per rupee or dollar spent on research, then the performance of Indian universities could be considered above average. In this context university-industry collaborations would to some extent ease the financial constraints.Nevertheless, India does have world class science and technology institutions like the Indian Institute of Science. However, they will not figure in the international university ranking due to two reasons. First, they do not concentrate on graduate or under-graduate teaching. Second, they do not offer wide variety of disciplines like universities: from
94
9 Technology, Globalisation and Multinationals:The Asian Experience
medicine – technology – natural sciences – social sciences. These two factors mainly keep them out of university ranking. On the other hand, these specialised institutions attract multinationals to set-up R&D units in India (FDI in R&D) to take advantage of the presence of these institutions and in particular the Indian Institute of Science (Reddy 1997, 2011).
VI ConclusionsStudies surveyed in this chapter clearly show that university – industry relationships have been mutually beneficial. Firms from China, Japan and Korea that collaborated with universities were more innovative, introduced new products, developed new processes and emerged globally competitive. Universities also benefited. Academic excellence and industrial collaborations went together. One did not stand in the way of the other. In fact universities that enjoyed high ranking were the ones that collaborated with industry more. However, for successful commercialisation of research output and for fruitful collaboration with the industry, the governments should enact new laws that would give freedom to the universities and grant intellectual property to the faculty that created the property. China, Japan and Korea have been enacting such laws and have been benefiting from collaborations and research output. Universities from these countries also occupied high global ranks. In this respect India has been lagging behind. Not a single Indian university/academic institution finds a place in the top two hundred universities. This is mainly because the Indian authorities and the UGC, unlike the leading Asian countries and developed countries, have not been insisting on publications in mainstream journals, that is, journals that are included in the citation index for appointments and promotion in faculty positions. Importance is also not given to citations. India has also not enacted appropriate laws to encourage commercialisation of products and processes created by researchers. India should urgently introduce university reforms to reap benefits from research and development. The budget allocation for research should also be increased substantially to obtain world class results. Industries could play an important role in providing funds for research and development.
References
AICTE-CII Survey of Industry linked Technical Institutes. (2013).
Eom, Boo-Young and Keun Lee. (2010). ‘Determinants of industry–academy linkages and, their impact on firm, performance: The case of Korea as a latecomer in knowledge industrialization’, Research Policy, Vol. 39, pp. 625-639.
Fu, Xiaolan, Jizhen Li and Alan Hughes. (2012). ‘Intra- and Inter-national University-Industry Linkage and Innovation in Emerging Economies: Evidence from China’, ideas.repec.org
Hu, Mei-Chih and John A. Mathews. (2008). ‘China’s National Innovative Capacity’, Research Policy, Vol. 37, Issue 9, pp. 1465-1479.
Hong, Wei (2008). ‘Decline of the center: The decentralizing process of knowledge transfer of Chinese universities from 1985 to 2004’, Research Policy, Vol. 37, Issue 4, pp. 580-595.
Joseph , K. J., and Vinoj Abraham. (2009). ‘University-Industry Interactions and Innovation in India: Patterns, Determinants, and Effects in Select Industries’, Seoul Journal of Economics, Vol. 22, Issue 4, pp. 467-498.
95

10University – Industry Collaborations: Asian Experience / N S Siddharthan
Lehrer, Mark and Kazuhiro Asakawa. (2004). ‘Rethinking the public sector: idiosyncrasies of biotechnology commercialisation as motors of national R&D reform in Germany and Japan’, Research Policy, Vol. 33, Issues 6-7, pp. 921-938.
Nishimura, Junichi and Hiroyuki Okamuro. (2011). ‘Subsidy and networking: The effects of direct and indirect support programs of the cluster policy’, Research Policy, Vol. 40, pp. 714–727.
Okamuro, Hiroyuki, Masatoshi Kato, and Yuji Honjo. ( 2011). ‘Determinants of R&D cooperation in Japanese start-ups’, Research Policy, Vol. 40, pp. 728–738.
Perkmann, Markus, Valentina Tartari, Maureen McKelvey, Erkko Autio, Anders Broström, Pablo D’Este, Riccardo Fini, Aldo Geuna, Rosa Grimaldi, Alan Hughes, Stefan Krabel, Michael Kitson, Patrick Llerena, Franceso Lissoni, Ammon Salter, and Maurizio Sobrero. (2013). ‘Academic engagement and commercialisation: A review of the literature on university–industry relations’, Research Policy, Vol. 42, pp. 423– 442.
Rasiah Rajah and Chandran Govindaraju V.G.R. (2009). ‘University-industry collaboration, R&D, Automotives, Biotechnology, Electronics, Malaysia’, Seoul Journal of Economics, Vol. 22, Issue 4, pp. 529-550.
Reddy, P. (1997). ‘New trends in globalization of corporate R&D and implications for innovation capability in host countries: a survey from India’, World Development, Vol. 25, Issue 11, pp. 1821-1837.
Reddy, Prasada. (2011). Global Innovation in Emerging Economies, Routledge, New York and Oxon, i-xxv, pp. 1-294.
Woolgar, Lee. (2007). ‘New institutional policies for university–industry links in Japan’, Research Policy, Vol. 36, Issue8, pp. 1261-1274.
Appendix
Criteria of World Universities
(http://www.topuniversities.com/university-rankings)
• 40 per cent Peer Review: Composite score drawn from peer review (which is divided into 5 subject areas)
• 5 per cent International Faculty: Score based on international faculty International Outlook
• 5 per cent International Students: Score based on proportion of international students
• 10 per cent Recruiter Review: Score based on responses to recruiter survey Graduate Employability
• Teaching Quality Research Quality Criteria Student Faculty: Score based on student/faculty ratio
• Citations per Faculty: Score based on research performance factored against the size of the research body Indicator Times Higher Education Survey Ranking Bodies Weight 20 per cent 20 per cent Criteria
• 20 per cent Articles published in Nature and Science Research Output 20 per cent Articles in Science Citation Index-expanded, Social Science Citation Index, and Arts & Humanities Citation Index
• 20 per cent Staff of an institution winning Nobel Prizes and Fields Medals Quality of Faculty Size of Institution Quality of Education Criteria Academic performance with respect to the size of an institution Highly cited researchers in 21 broad subject categories Alumni of an institution winning Nobel Prizes and Fields Medals Indicator Shanghai Jiao Tong World University Ranking Bodies Weight 20 per cent 10 per cent 10 per cent Criteria
• Quantity and Quality of Research Quantity and Quality of Researchers Criteria 100 Number of recognitions/awards/ stewardship conferred by national and international learned and professional bodies With balanced distribution of staff with >20 years’ experience, 10-20 years and <10 years’ experience Research Experience At RM 50, 000/staff/year of which at least 20 per cent is from international sources and 20 per cent from private sector
96

11 Technology, Globalisation and Multinationals:The Asian Experience
Ranking of Indian Universities
222 Indian Institute of Technology Delhi (IITD)
233 Indian Institute of Technology Bombay (IITB)
295 Indian Institute of Technology Kanpur (IITK)
313 Indian Institute of Technology Madras (IITM)
346 Indian Institute of Technology Kharagpur (IITKGP)
401 Indian Institute of Technology Roorkee (IITR)
441 University of Delhi
Asian Universities among the Top 200
24 National University of Singapore (NUS)
26 University of Hong Kong
32 The University of Tokyo
34 The Hong Kong University of Science and Technology
35 Kyoto University
35 Seoul National University
39 The Chinese University of Hong Kong
41 Nanyang Technological University (NTU)
46 Peking University
48 Tsinghua University
55 Osaka University
60 KAIST - Korea Advanced Institute of Science & Technology
66 Tokyo Institute of Technology
75 Tohoku University
82 National Taiwan University (NTU)
88 Fudan University
99 Nagoya University
104 City University of Hong Kong
107 Pohang University of Science And Technology (POSTECH)
114 Yonsei University
123 Shanghai Jiao Tong University
133 Kyushu University
97

12University – Industry Collaborations: Asian Experience / N S Siddharthan
141 Hebrew University of Jerusalem
144 Hokkaido University
145 Korea University
161 The Hong Kong Polytechnic University
162 Sungkyunkwan University
165 Zhejiang University
167 Universiti Malaya (UM)
174 University of Science and Technology of China
175 Nanjing University
183 Technion - Israel Institute of Technology
193 Keio University
196 Tel Aviv University
199 National Tsing Hua University
Total number 27 - China 7; Japan 7; Korea 5; Israel 3; Hong Kong 2; Taiwan 2; Malaysia 1.
98