Technology, Energy Efficiency and Environmental Externalities in the Cement Industry - AIT, Thailand
117
A S I A N I N S T I T U T E 1 9 5 9 O F T E C H N O L O G Y TECHNOLOGY, ENERGY EFFICIENCY AND ENVIRONMENTAL EXTERNALITIES IN THE CEMENT INDUSTRY School of Environment, Resources and Development Asian Institute of Technology Bangkok - Thailand
-
Upload
vishal-duggal -
Category
Documents
-
view
651 -
download
3
Transcript of Technology, Energy Efficiency and Environmental Externalities in the Cement Industry - AIT, Thailand
ASIA
NIN
STITUTE
19 5 9
OF TECH
NO
LOG
Y
TECHNOLOGY, ENERGY EFFICIENCY AND ENVIRONMENTAL EXTERNALITIES
IN THE CEMENT INDUSTRY
School of Environment, Resources and DevelopmentAsian Institute of Technology
Bangkok - Thailand
TECHNOLOGY, ENERGY EFFICIENCY AND
ENVIRONMENTAL EXTERNALITIES IN THE CEMENT INDUSTRY
Raw MaterialsPreparation
Clinker Production
- Dry Process √- Wet Process- Semi-wet Process- Semi-dry Process
Finishing
Energy Flow
Cement Industry(Dry Process)
Raw Materials(Limestone, Alumina, Iron oxide,
other minor constituents, etc.Limestone usually mined on site)
Crushing & Preblending
Screening & Milling
Finished PackagedCement
Packaging and Shipping
Mixing with gypsum andFinish grinding
Proportioning &Blending
Drying
Screening & Milling
Burning in the Kiln
Clinker Cooling
70°C
Stack(650°C)
Electricity(Blower)
Heated Air(250°C)
Fluegases
Energy (Fuel)(3-4MJ/kg)
Stack(350°C)
Electricity
Electricity
Electricity
Electricity
Fluegases
Electricity(30 kWh/ton)
Electricity(1.5 kWh/ton)
23.5-34.5kWh/ton
23-30 kWh/ton3-4MJ/kg
ToStack
Electricity &Energy (Fuel)
Electricity
Exhaust(250°C)
Dust (1150°C)
Raw Materials(Limestone, Alumina, Iron oxide,
other minor constituents, etc.Limestone usually mined on site)
Crushing & Preblending
Screening & Milling
Finished PackagedCement
Packaging and Shipping
Mixing with gypsum andFinish grinding
Proportioning &Blending
Drying
Screening & Milling
Burning in the Kiln
Clinker Cooling
Effluent Flow &Emissions
Dust
Dust
Dust
HeatedAir
ToStack
Waste
ToStack
Fluegases
Dust (to disposal system)
Exhaust
Fluegases
Dust
ToStack
* The dotted line represents Wet Process only
Brahmanand Mohanty
School of Environment, Resources and Development Asian Institute of Technology
Bangkok - Thailand

Technology, Energy Efficiency and Environmental Externalities in the Pulp and Paper Industry © Asian Institute of Technology, 1997 Edited by Brahmanand Mohanty Published by School of Environment, Resources and Development Asian Institute of Technology P.O. Box 4, Pathumthani 12120 Thailand e-mail: [email protected] NOTICE Neither the Swedish International Development Cooperation Agency (Sida) nor the Asian Institute of Technology (AIT) makes any warranty, expressed or implied, or assume any legal liability for the accuracy, completeness, or usefulness of any information, appratus, product, or represents that its use would not infringe privately owned rights. Reference herein to any trademark, or manufacturer, or otherwise does not constitute or imply its endorsement, recommendation, or favoring by Sida or AIT. ISBN 974 - 8256 – 70--7 Printed in India by All India Press, Pondicherry.

FOREWORD The use of fossil fuels leads to the emission of so-called "Green House Gases (GHG)", a concept which comprises carbon dioxide, nitrous oxides, sulfur oxides, etc. In recent years, a good deal of research has provided enough material to put forward the claim that a big increase in the concentration of carbon dioxide in the atmosphere would lead to a rise in the average global temperature, with negative consequences for the global climate. This claim has been confirmed by the United Nations Intergovernmental Panel on Climate Change (IPCC) in its second scientific assessment published in 1996. Global warming can have catastrophic impact on human and global security: island nations and low lying coastal regions would be permanently drowned by the rise in the level of the oceans brought on by the melting of polar ice; drought would become widespread; and desertification would expand and accelerate. Persistent famines, mass migrations and large-scale conflict would be the result. Agriculture, food and water security, and international trade would come under severe strain. Until recently, industrialized countries have accounted for most of the emission of the GHG, in particular carbon dioxide, because their economic development has been very strongly based on the use of fossil fuels. However, the same dynamic has also led to a situation where the newly industrializing countries of Asia and Latin America (the strong South) are today contributing significantly to the emission of carbon dioxide. This tendency will spread to and encompass an increasing number of developing countries unless both the industrialized and the developing countries jointly agree on implementing the measures to halt and then reverse the global trend towards a rapid rise in the emission of carbon dioxide. That is the central purpose of the IPCC, which has succeeded in obtaining commitments from most of the industrialized countries to reduce their emissions of carbon dioxide. At the 1995 meeting in Berlin of the Conference of the Parties (CoP) to the United Nations Climate Convention, it was decided to initiate negotiations to strengthen the emission-reduction measures by the industrialized countries, as well as countries of Eastern Europe and the Former Soviet Union. The final negotiations are planned to take place at the December 1997 meeting in Kyoto of the CoP, which ought to result in legal instruments to ensure that the agreed measures are being fulfilled. The fossil fuel generated climate problem is very complex, with strong vested interests and special alliances. There is still considerable skepticism in the developing world about the need for measures to counter global warming, in particular in the strong South, which in no way wants to jeopardize its own rapid economic development. It is therefore imperative to find innovative solutions, both technical and institutional, to the climate problem, which are
acceptable to both the North and the South. Meeting this challenge calls for inter alia research programs that tackle the technological, techno-economic and policy problems in promoting the transition to decreasing use of fossil fuels, increasing energy efficiency and fuel substitution, and carbon recycling systems of energy production and use. The Asian Regional Research Programme on Energy, Environment and Climate (ARRPEEC) is part of this global effort, which Sida is very pleased to have initiated and is fully supporting. The ARRPEEC comprises technological, techno-economic and policy research on energy efficiency, fuel substitution and carbon recycling in the principal economic sectors of East, Southeast and South Asian countries. M R Bhagavan Senior Research Adviser, Department for Research Cooperation Swedish International Development Cooperation Agency, Sida
PREFACE Industries have always played a crucial role in the socio-economic development of a country. They have contributed primarily to increased prosperity, greater employment and livelihood opportunities. On the other hand, industries are accused of accelerating the consumption of scarce fossil fuels and of polluting the local, regional, and global environment by releasing solid, liquid and gaseous pollutants to their surroundings. Experiences gained worldwide have shown that these impacts of industries on resource use and the environment can be contained through more efficient production processes and adoption of cleaner technologies and procedures. Thus, fossil fuel consumption can be cut down drastically and waste generation can be avoided or minimized to the lowest possible level. Regulatory regimes introduced in several countries have led the industries to adopt appropriate measures. Some countries have adopted economic instruments to reflect the true cost of goods and services by internalizing the environmental costs of their input, production, use, recycling and disposal. The improvement of production system through the use of technologies and processes that utilize resources more efficiently and achieve “more with less” is an important pathway towards the long-term sustenance of industries. It is in this context that a research project was undertaken by the Asian Institute of Technology (AIT), with the support of the Swedish International Development Cooperation Agency (Sida). The project entitled “Development of Energy Efficient and Environmentally Sound Industrial Technologies in Asia” was launched with the specific objective to enhance the synergy among selected Asian developing countries in their efforts to grasp the mechanism and various aspects related to the adoption and propagation of energy efficient and environmentally sound technologies. Three energy intensive and environmentally polluting industrial sub-sectors (cement, iron & steel, and pulp & paper) and four Asian countries of varying sizes, political systems and stages of development (China, India, Philippines, Sri Lanka) were selected in the framework of this study. To enhance in-country capacity building in the subject matter, collaboration was sought from reputed national institutes who nominated experts to actively participate in the execution of the project. The activities undertaken in the first phase of the project were the following:
- Evaluation of the status of technologies in selected energy intensive and environmentally polluting industries;
- Identification of potential areas for energy conservation and pollution abatement in these industries;
- Analysis of the technological development of energy intensive and polluting industries in relation with the national regulatory measures;
- Identification of major barriers to efficiency improvements and pollution abatement in the industrial sector.
Based on the initial guidelines prepared at AIT under the leadership of Dr. X. Chen, discussions were held with the experts from the national research institutes (NRIs) of the four participating countries. The outcomes of these meetings were used as a basis for the preparation of country reports which were presented at two project workshops held at

Manila in May 1995 and at Bangkok in November 1995. On the basis of the reports submitted, cross-country comparison reports were prepared at AIT and additional relevant information was sought from the NRIs to bridge some of the gaps found in their respective reports. This is the third of the four volumes of documents which have resulted from this interactive research work between AIT and the NRIs. This volume on “Technology, energy efficiency and environmental externalities in the pulp and paper industry” covers a description of the paper manufacturing process, and the energy and environmental aspects associated with it. Then there is a cross-country comparison of the pulp and paper sector in the four countries, followed by individual country reports prepared by the four NRIs. The first five chapters were prepared by Dr. B. Mohanty and Dr. Uwe Stoll with the assistance of research associates figuring in the Project Team. Sincere thanks are extended to all the members of the Project Team including the supporting staff, past and present, for their active participation and contribution to the project. The enthusiasm and dynamism of Dr. X. Chen during the execution of the first phase and the understanding and leadership provided by Dr. C. Visvanathan in the crucial completion period of the project are acknowledged here. The project would have never seen the light of the day without the support of Sida. Finally, appreciations are due to two individuals who have actually conceived the Asian Regional Research Programme on Energy, Environment and Climate (ARRPEEC) and provided constant support and encouragement to this specific project under the overall program: Dr. M.R. Bhagawan, Senior Research Adviser at Sida, and Dr. S.C. Bhattacharya, Professor at AIT. Brahmanand Mohanty Asian Institute of Technology June, 1997

PROJECT TEAM Faculty Members (Asian Institute of Technology - School of Environment, Resources and Development)
- Dr. Xavier Chen, Energy Program (Until February 1996) - Dr. Brahmanand Mohanty, Energy Program - Dr. Uwe Stoll, Environmental Engineering Program (Until January 1996) - Dr. C. Visvanathan, Environmental Engineering Program (From January 1996)
Research Associates (Asian Institute of Technology - School of Environment, Resources and Development)
- Ms. Nahid Amin - Ms. Lilita B. Bacareza - Mr. Z. Khandkar - Mr. Aung Naing Oo - Mr. K. Parameshwaran
National Research Institutes
- Institute for Techno-Economics and Energy System Analysis, Tsinghua University, Beijing, China (Prof. Qiu Daxiong)
- Energy Management Centre, Ministry of Power, New Delhi, India (Mr. S. Ramaswamy)
- Department of Energy, Manila, Philippines (Mr. C.T. Tupas) - Energy Conservation Fund, Ministry of Irrigation, Power and Energy, Colombo,
Sri Lanka (Mr. U. Daranagama) Research Fellows
- Dr. Wu Xiaobo, School of Management, Zhejiang University, China (January-June 1996)
- Ms. Wang Yanjia, Tsinghua University, China (May-November 1996) - Mr. Anil Kumar Aneja, Thapar Corporate R&D Centre, India (May-November
1996) - Ms. Marisol Portal, National Power Corporation, Philippines (May-November
1996) - Mr. Gamini Senanayake, Industrial Services Bureau of North Western Province,
Sri Lanka (May-November 1996)
Table of Contents
1. GENERAL.................................................................................................................................. 1
2. PROCESS DESCRIPTION ...................................................................................................... 2 2.1 CEMENT KILN ....................................................................................................................... 4 2.2 CEMENT KILN PROCESSES .................................................................................................... 5
2.2.1 Wet Process................................................................................................................. 5 2.2.2 Semi-wet Processes ..................................................................................................... 7 2.2.3 Semi-dry Process......................................................................................................... 7 2.2.4 Dry Process................................................................................................................. 8
3. ENERGY ISSSUES IN THE CEMENT INDUSTRY .......................................................... 10 3.1 TYPICAL ENERGY CONSUMPTION PATTERNS ..................................................................... 10 3.2 ENERGY EFFICIENCY MEASURES........................................................................................ 13
3.2.1 Short Term Measures ................................................................................................ 13 3.2.2 Medium Term Measures............................................................................................ 14
3.2.2.1 Measures on Processed Materials and Products ....................................................... 14 3.2.2.2 Changes and Modifications in Sub-Processes .......................................................... 14 3.2.2.3 Recovery of Waste Heat ........................................................................................... 16
3.2.3 Long Term Measures................................................................................................. 17 3.2.3.1 Conversion from Wet to Dry Process....................................................................... 17 3.2.3.2 Cogeneration ............................................................................................................ 18 3.2.3.3 Computer-Controlled System ................................................................................... 18
3.3 NEW ENERGY EFFICIENT TECHNOLOGIES FOR CEMENT MANUFACTURING ...................... 18 3.3.1 Suspension Preheating Technology .......................................................................... 20 3.3.2 Suspension Preheating/Precalcination Technology.................................................. 20
3.4 CONCLUDING REMARKS ..................................................................................................... 21
4. ENVIRONMENTAL POLLUTION AND MANAGEMENT.............................................. 22 4.1 SOURCES AND CHARACTERISTICS OF POLLUTANTS ........................................................... 22
4.1.1 Water Pollution ......................................................................................................... 22 4.1.2 Air Pollution.............................................................................................................. 22
4.1.2.1 Particulates ............................................................................................................... 23 4.1.2.2 Gaseous Substances.................................................................................................. 26
4.1.3 Solid Waste................................................................................................................ 26 4.2 CURRENT POLLUTION ABATEMENT STRATEGY AND TECHNOLOGIES ............................... 26
4.2.1 Air Pollution Control ................................................................................................ 26 4.2.1.1 Dust Collecting Devices ........................................................................................... 26 4.2.1.2 Gaseous Emission Control........................................................................................ 29
4.2.2 Water Pollution Control............................................................................................ 29 4.2.3 Solid Waste Disposal................................................................................................. 30
4.2.3.1 Landfill ..................................................................................................................... 30 4.3 OTHER ENVIRONMENTAL CONSIDERATIONS IN CEMENT INDUSTRY ................................. 30
4.3.1 Noise Pollution.......................................................................................................... 31 4.3.2 Reduction of Ground Vibrations ............................................................................... 32 4.3.3 Raw Materials Resources and Site Restoration ........................................................ 32 4.3.4 Utilization of Waste Materials as Raw Material and Fuel in Cement Industry........ 32
4.4 CONCLUDING REMARKS ..................................................................................................... 35
5. CROSS-COUNTRY COMPARISON OF THE CEMENT SECTOR ................................ 36 5.1 INTRODUCTION ................................................................................................................... 36 5.2 OVERVIEW OF THE INDUSTRY............................................................................................. 36
5.2.1 Role in National Economy ........................................................................................ 36 5.2.2 Share in Total Energy Consumption ......................................................................... 36 5.2.3 Trends of Production................................................................................................. 37 5.2.4 Mills and Capacities ................................................................................................. 38
i
5.3 CHARACTERISTICS OF THE PARAMETERS AFFECTING ENERGY EFFICIENCY...................... 40 5.3.1 Process Mix............................................................................................................... 42 5.3.2 Average Kiln Size ...................................................................................................... 42 5.3.3 Energy Consumption by Type ................................................................................... 43 5.3.4 Awareness on Energy Conservation ......................................................................... 43
5.4 CHARACTERISTICS OF THE PARAMETERS AFFECTING POLLUTION ABATEMENT MEASURES44 5.4.1 Causes for the Pollution Problems ........................................................................... 45 5.4.2 Current Pollution Control Strategies........................................................................ 45
5.4.2.1 Pollution Control Strategies in China....................................................................... 45 5.4.2.2 Pollution Control Strategies in India ........................................................................ 45 5.4.2.3 Pollution Control Strategies in Philippines............................................................... 46 5.4.2.4 Pollution Control Strategies in Sri Lanka................................................................. 46
5.4.3 Comparison of Effluent and Emission Characteristics ............................................. 46 5.5 POTENTIAL FOR ENERGY EFFICIENCY IMPROVEMENTS...................................................... 48
5.5.1 Measures on Structure of the Industry ...................................................................... 48 5.5.2 Potential of Energy Conservation Measures ............................................................ 48
5.6 POTENTIAL FOR POLLUTION ABATEMENT.......................................................................... 49 5.7 CONCLUSION....................................................................................................................... 50
6. PROFILE OF IRON AND STEEL INDUSTRY IN ASIAN INDUSTRIALIZING COUNTRIES........................................................................................................................... 52 6.1 COUNTRY REPORT: CHINA.................................................................................................. 52
6.1.1 Introduction............................................................................................................... 52 6.1.2 Technological Trajectory of China’s Cement Industry............................................. 52
6.1.2.1 Higher Growth Rate of Production........................................................................... 54 6.1.2.2 Rapid Increase of Small Size Cement Plants............................................................ 54 6.1.2.3 Production Satisfies the Internal Demand ................................................................ 54 6.1.2.4 Better Production Quality and Low Energy Intensity .............................................. 54 6.1.2.5 Coal as the Main Fuel............................................................................................... 56
6.1.3 Evolution of Energy Efficiency in the Cement Industry ............................................ 58 6.1.4 Environmental Externalities of Technological Development in the Cement Industry60 6.1.5 Potential for Energy Efficiency Improvement and Pollution Abatement through
Technological Change ............................................................................................. 66 6.1.6 Status of Application of New Technologies for Energy Efficiency Improvement and
Pollution Abatement ................................................................................................ 69 6.1.7 Conclusions ............................................................................................................... 71
6.2 COUNTRY REPORT: INDIA................................................................................................... 73 6.2.1 Introduction............................................................................................................... 73 6.2.2 Technological Trajectory of India’s Cement Industry .............................................. 73
6.2.2.1 Current Scenario....................................................................................................... 73 6.2.2.2 Structure of the Cement Industry.............................................................................. 75
6.2.3 Evolution of Energy Efficiency in the Cement Industry of India............................... 75 6.2.3.1 Process Technology Profile ...................................................................................... 77 6.2.3.2 Plant Size .................................................................................................................. 77 6.2.3.3 Thermal Energy Consumption.................................................................................. 78 6.2.3.4 Electrical Energy Consumption................................................................................ 78 6.2.3.5 Domestic Manufacture of Cement Machinery & Equipment ................................... 79
6.2.4 Environmental Externalities...................................................................................... 84 6.2.5 Status of Application of New Technologies............................................................... 85
6.2.5.1 Status of the Development of Technology in India .................................................. 85 6.2.5.2 Particulate Pollution and Abatement ........................................................................ 88 6.2.5.3 Status of Research and Development ....................................................................... 93
6.3 COUNTRY REPORT: PHILIPPINES......................................................................................... 94 6.3.1 Introduction............................................................................................................... 94 6.3.2 Technological Trajectory of the Philippine Cement Industry ................................... 94
6.3.2.1 Production Capacity ................................................................................................. 94
ii

6.3.2.2 Plant Development ................................................................................................... 95 6.3.3 Evolution of Energy Efficiency in the Philippine Cement Industry........................... 96 6.3.4 Environmental Externalities of the Cement Industry in the Philippines ................... 98
6.3.4.1 Environmental Standards for Pollution Control and Abatement .............................. 98 6.3.4.2 Pollution Control Equipment.................................................................................... 99
6.3.5 Potential for Energy Efficiency Improvement and Pollution Abatement through Technological Change ............................................................................................. 99
6.3.6 Status of Application of New Technologies............................................................. 101 6.3.7 Concluding Remarks ............................................................................................... 101
BIBLIOGRAPHY ...................................................................................................................... 102
iii

General 1
1. GENERAL
Rapid industrialization and infrastructure development in Asian developing countries has led to higher cement consumption, and eventually increased production requirement. Though the production increased mainly due to extended plant capacities and introduction of new factories, little attention was paid to efficient energy utilization and environmental pollution control in the cement industry of Asian countries. Cement is a highly energy intensive product. In a cement factory, the energy bill normally accounts for 20-25% of the total production cost. The major energy consuming areas in cement industry are the high-temperature processes; almost 55-85% of the energy input of the final product is consumed in the high-temperature kiln. Advanced technologies for waste heat recovery and rationalization of energy use could offer significant energy saving opportunities in cement industry which is ever exploding due to the rapid global infrastructure development, especially in developing countries. This document addresses the cement production technologies in use, various measures for efficient utilization of energy, major sources of pollution, and the techniques and practices in vogue to abate pollution in the cement industry to the best possible extent. It further discusses about other environmental problems such as noise pollution, ground vibration etc., which are serious concerns for the environmentalists in developed countries, as well as the possibilities of utilization of waste from other industries by the cement industry. Finally, country reports on the cement industry for four Asian developing countries, namely, P.R. China, India, the Philippines and Sri Lanka, which are preceded by a cross-country comparison of the industry.
2 Technology, Energy Efficiency and Environmental Externalities of the Cement Industry
2. PROCESS DESCRIPTION
The principal raw materials for cement manufacturing are: - limestone (quarried from the mine, near which the plant is usually located), - silica and alumina from clay, shale or sand, and - iron from iron ore or steel mill scale.
The major processes involved in production are:
- excavation of limestone (quarrying) - crushing of limestone - preparation of other raw materials - grinding of raw materials in the raw mill - storage of raw meal in a raw meal silo - blending of limestone powder to control CaCO3 percentage - burning of raw meal to form clinker - grinding the clinker with gypsum in cement mill - storage of cement in silo - packing and distribution of cement
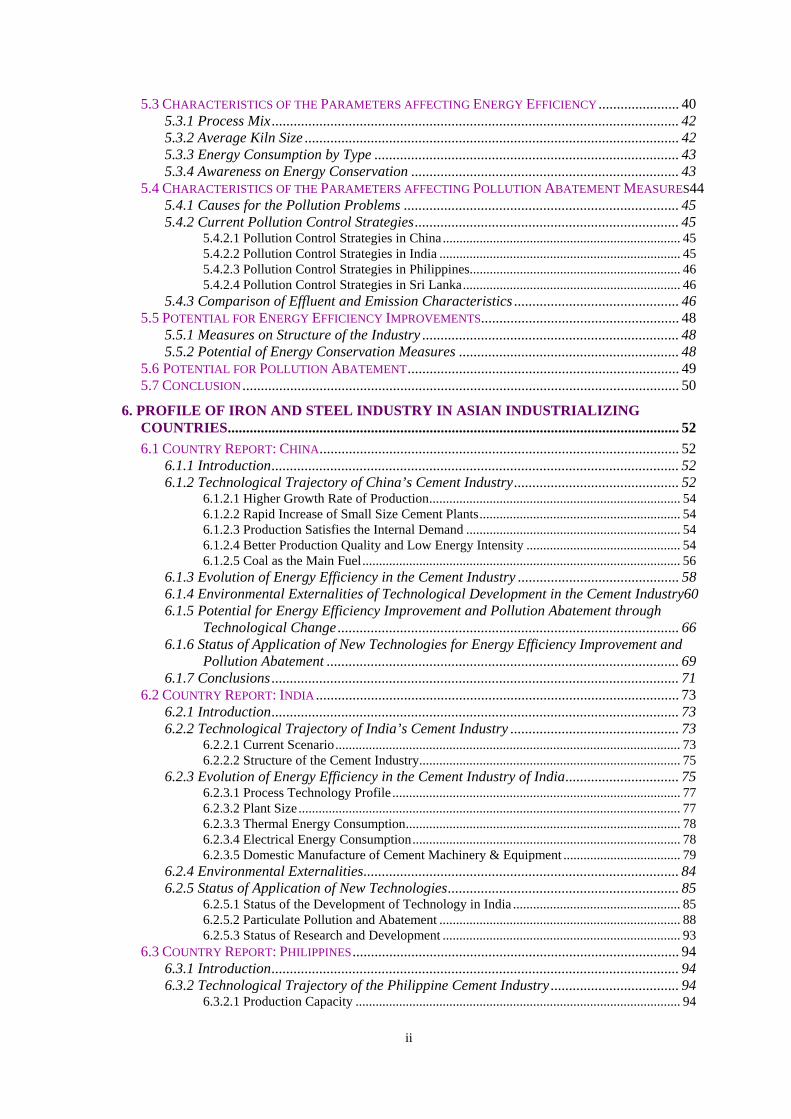
The kiln feed is prepared by proportioning, grinding and blending the raw materials into a consistent and homogeneous composition so that, after mild heating to drive off any water and CO2 available in the limestone (CaCO3), one obtains typically 64% calcium oxide (CaO), 22% silicon dioxide (SiO2), 3.5% aluminum oxide (Al2O3), and 3.0% iron ore (as Fe2O3) (Sell, 1992). These raw materials are processed at very high temperatures so they react by solid-solid reactions to form clinker which consists of four major compounds as shown in Table 2.1. The exact proportions of these final products determine the cement characteristics; for example, the hardening time, the early strength and the final strength.
Table 2.1. Portland cement clinker compounds
Chemical name Mineral phase name
Chemical formula Cement chemists
designation
Percentage in ordinary cement
Tricalcium Silicate Alite 3CaO.SiO2 C3S 45 Diacalcium Silicate Belite 2CaO.SiO2 C2S 25 Tricalcium Aluminate Celite 3CaO.Al2O3 C3A 11 Tetracalcium Alumino-ferrite Iron 4CaO.Al2O3.Fe2O3 C4AF 8
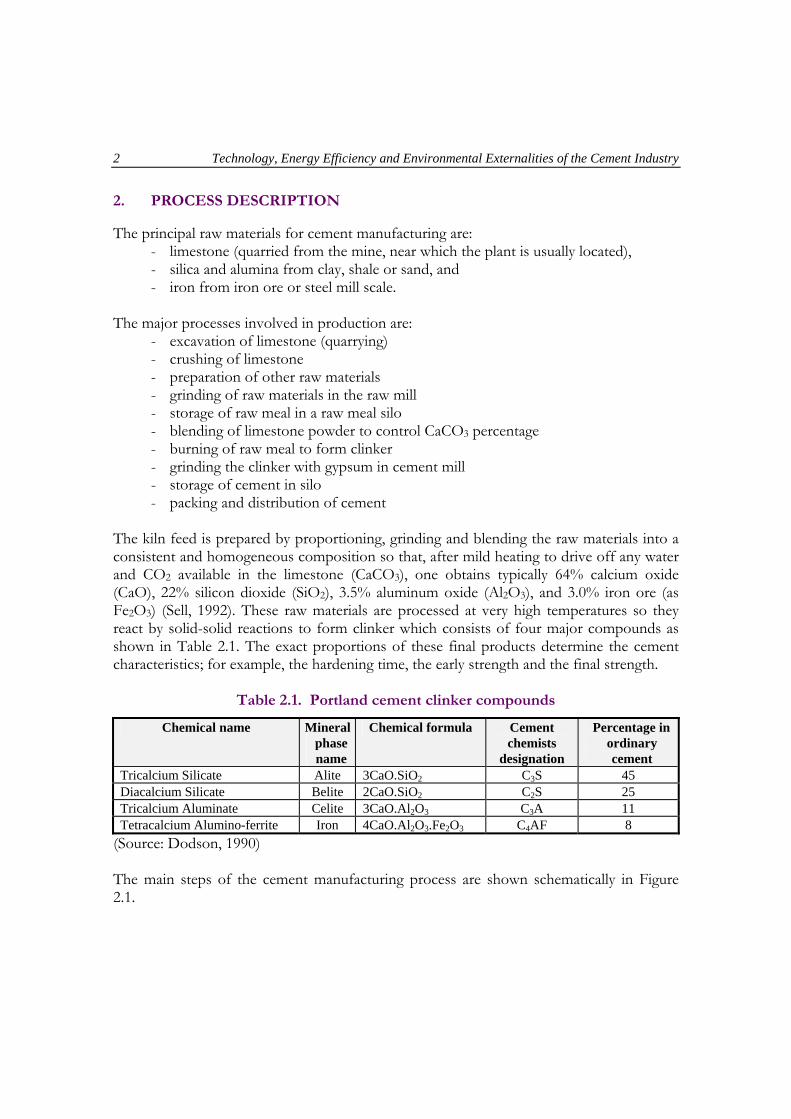
(Source: Dodson, 1990) The main steps of the cement manufacturing process are shown schematically in Figure 2.1.
Process Description 3
Fig. 2.1. Steps in the manufacture of Portland cement

4 Technology, Energy Efficiency and Environmental Externalities of the Cement Industry
The largest volume of raw material is CaCO3 or comparable materials (such as oyster shells in locations where appropriate). The CaCO3 as mined is often in chunks up to 750 mm in diameter. These must be crushed to about 10 mm, and then mixed with the sand, shale,
and other ingredients for further grinding to about 60µm in diameter. Frequently, the initial crushing is done at the quarry, prior to transport to the cement plant. After grinding,
depending upon the exact process, water may be added. The mixture is then taken to some high-temperature processing unit known as rotary kiln for conversion to cement clinker.
The clinker must be cooled before further processing. Then it is either stored, sold or transported (to individual grinding mills), or is ground at the plant with gypsum and other possible additives to a fine powder of finished cement. The cement is either packaged or
sold in bulk to the distributors. 2.1 Cement Kiln
The Cement kilns are large; up to 230 m in length and 8 m in diameter; inclined at an angle of three to six degrees, and lined with temperature-resistant refractory brick. They rotate at about 50 to 70 revolutions per hour in the older generation plants, and 170 to 180 in the more modern ones. The feed material is introduced at the elevated end and is moved slowly by the rotation of the kiln down towards the firing end, where heat is applied by a flame of coal, gas, oil or a combination of these fuels. Coal is most widely used as the kiln fuel nowadays. Several distinct thermal zones exist in the kiln. At the elevated end where the feed is introduced, is a drying and preheating zone in which the material reaches a temperature of about 800oC. This is followed by the calcining zone where carbon dioxide is driven off the limestone, converting it to free lime at a material temperature close to 1000oC. The chemical reaction taking place in this zone is as follows:
CaCO3 ⇑ CaO + CO2 By the time the calcination is complete, the free lime enters the intermediate zone where temperature prevails in the range of 1000 - 1200oC and the basic oxide (CaO) reacts with silica (SiO2) and alumina (Al2O3) as shown:
Al2O3 + CaO ⇑ CaO.Al2O3 (mono-calcium aluminate)
2CaO + CaO.Al2O3 ⇑ 3CaO.Al2O3 (tri-calcium aluminate)
SiO2 + 2CaO ⇑ 2CaO.SiO2 (di-calicium silicate)
2CaO + Fe2O3 ⇑ 2CaO.Fe2O3
2CaO.Fe2O3 + 2CaO + Al2O3 ⇑ 4CaO.Al2O3.Fe2O3
Process Description 5
Next is the sintering zone where, at a temperature of about 1300oC, sintering of the materials begins. While sintering, di-calcium silicate gets saturated with the remaining free lime and forms tri-calcium silicate.
2CaO.SiO2 + CaO ⇑ 3CaO.SiO2 (tri-calcium silicate) By the time the materials reach the flame area, they are white hot (1425 -1550oC). In a semi-liquid state at this stage, they acquire a greenish black color and form nodules about 25 mm in diameter which, on cooling, is referred to as clinker. After this extremely hot area, the temperature drops, and the clinker starts to cool. The materials then finally drop out of the kiln onto a cooler, through which large volume of relatively cool air is passed. The air from the cooler, rather than being wasted, is channeled into the kiln as combustion air for the flame. This air, in traversing the kiln, becomes turbulent, and often picks up some of the finer raw material particles which become entrained in the air stream. The air simultaneously transfers heat to the back end of the kiln. Before the air can exit the kiln, it is passed through a dense curtain of chains that serves two purposes:
- removes some of the entrained dust, and - acts as a mechanism for heat transfer in order to retain heat as much as possible
within the kiln. The air, after leaving the kiln, is ducted to an electrostatic precipitator for particulate removal, and then to the stack. The clinker is then conveyed to the finish-grinding section where about five percent of gypsum is added to it. The mixture is finely ground in ball or tube mills, close-circuited with air separators, to give finished cement. The cement is conveyed to the storage silos, usually by pneumatic conveyors. 2.2 Cement Kiln Processes
There are four basic types of cement kilns currently in use: wet process, semi-wet process, semi-dry process, and dry process. Of these, the dry process is the most energy efficient and most commonly used technology nowadays. 2.2.1 Wet process
Worldwide, a considerable proportion of cement clinker is still produced by the wet process wherein the raw materials are prepared and mixed with the aid of water (30-40%) and fed into the upper end of the kiln as a slurry. Wet process is particularly useful when the raw materials contain a significant amount of moisture as quarried. This process has the advantage of uniform feed blending, but requires more energy than the other types of kilns, since the water must be evaporated during the process. Similar process reactions as

6 Technology, Energy Efficiency and Environmental Externalities of the Cement Industry
described in section 2.1 lead to the formation of clinker. A typical wet-process rotary kiln is shown in Figure 2.2.
Fig. 2.2. Diagram of a typical wet procvess rotary kiln
Fig. 2.3. Diagram of a typical preheater system
Process Description 7
2.2.2 Semi-wet processes
Semi-wet cement processing employs grate-kiln methods (Figure 2.3). In the semi-wet cement manufacturing process the raw materials prepared by wet processing are first mechanically dewatered - preferably with filter presses - and then fed in the form of nodules to a drying unit. This drying unit may be the third compartment of a traveling grate preheater. Nowadays, a dispersion dryer or impact dryer is preferably installed ahead of the preheater or precalciner kiln. In cases where former wet kilns have been converted into one-stage or two-stage preheater kilns on this principle, impact dryers have hitherto been employed. Advantages of grate-kiln systems include:
- a controlled feed rate - no flushing of materials into the kiln - no segregation of raw materials due to differential shapes and densities - avoidance of fluidization of the materials - minimal dusting - production of uniform clinker - low energy requirement (70% of that required for modern long wet kiln), and - ability to use higher-alkali feeds than many other processing techniques.
2.2.3 Semi-dry process
In the semi-dry process, nodules or pellets (approximately 12% water) formed from raw meal with the aid of water are used. The traveling grate preheater kiln continues to be available as a technically well developed pyro-processing unit. Kilns of this type, however, suffer from some disadvantages inherent in the system, such as:
- relatively high initial cost and operating expenses associated with kiln outputs, - specific quality requirements of the raw materials (grate process requires nodules to
be consistent in size and composition which is often very difficult to achieve), - relatively high overall heat consumption (only the exhaust air from the cooler is
available for drying the materials during grinding), - restrictions as to the use of low-grade fuels, and - inability to apply precalcination.
Because of these drawbacks, this system has lost the weight it once possessed. However it is reported that several of the newer installations in the United States do employ grate-kiln methods (Sell, 1992). Depending upon the local conditions, in certain situations, they are deemed preferable to preheater systems.

8 Technology, Energy Efficiency and Environmental Externalities of the Cement Industry
2.2.4 Dry process
A long kiln similar to that used in the wet process can also be used for a dry process. Dry process consumes significantly less energy and can often handle particulate emission problems more easily. Moreover, there are dry processing techniques far superior to the dry kiln which already consumes less energy than the wet process. Newer cement plants use the dry process in which the raw material is fed to the kiln as dry powder. In the most recently erected plants, preheater and precalciner units have been added to improve the thermal efficiency of the process by using hot kiln gases to pre-heat and pre-calcine the feed before it enters the kiln. The preferable dry processing method is by a suspension preheater system as shown in Figure 2.4. The finely ground dry raw materials are fed into the preheater at the top, counter-current to the air flow. This air flow originates in the cooler and thus has been heated by traversing through the cooler and also a short rotary kiln section before being ducted to the preheater. Hence, it is sufficiently hot to not only preheat, but also partially calcine the incoming materials. The physical arrangement of a series of cyclones on the preheater is such that the hot air and the feed can have intimate contact in a series of stages for maximum heat transfer and optimum efficiency. The addition of a flash calciner, a stationary furnace interposed between the rotary kiln and the suspension preheater, increases the amount of calcination that occurs within the preheater, thus increasing the potential capacity of the rotary kiln. When the raw mill has passed all the stages, it is heated up to 800°C and is extensively calcined before entering the kiln. The temperature of the hot gas drops to 300°C from 1000°C. The hot particulate feed, after passing through the preheater and the flash calciner, enters a short rotary kiln where it undergoes clinkerization. The rational behind accomplishing only this last stage of the processing within the kiln is better economy, particularly in terms of energy conservation. In addition, most of the dust generated can be retained within the preheater, cutting back the dust problems to a great extent. Shaft kilns (Figure 2.5) constitute another dry processing technique, used to some extent in Europe. Shaft kilns have lower thermal and power requirements per ton of clinker produced than those of rotary kilns and are comparable to the preheater systems. Their major disadvantages are the small capacity and a less uniform product, primarily as a result of tunneling of the gases through the load.

Process Description 9
Fig. 2.4 Diagram of a shaft kiln
Fig. 2.5 Diagram of grate-kiln process

10 Technology, Energy Efficiency and Environmental Externalities of the Cement Industry
3. ENERGY ISSSUES IN THE CEMENT INDUSTRY
3.1 Typical Energy Consumption Patterns
The cement manufacturing processes consume two types of primary energy: thermal energy provided by coal, natural gas or oil, and mechanical energy converted from electricity. The thermal energy accounts for about 87% of the total primary energy and is mainly used in clinker production. Typical thermal energy and electricity consumptions of cement manufacturing processes are given in Table 3.1.
Table 3.1. Specific thermal energy and electricity consumption for cement
Process Thermal Energy (GJ/ton) Electricity (kWh/ton) Wet Process 5.02-5.43 70-125 Semi-wet Process 3.15-3.86 70-125 Dry Process 2.88-3.40 110-125 Semi-dry Process 3.10-3.50 110-125
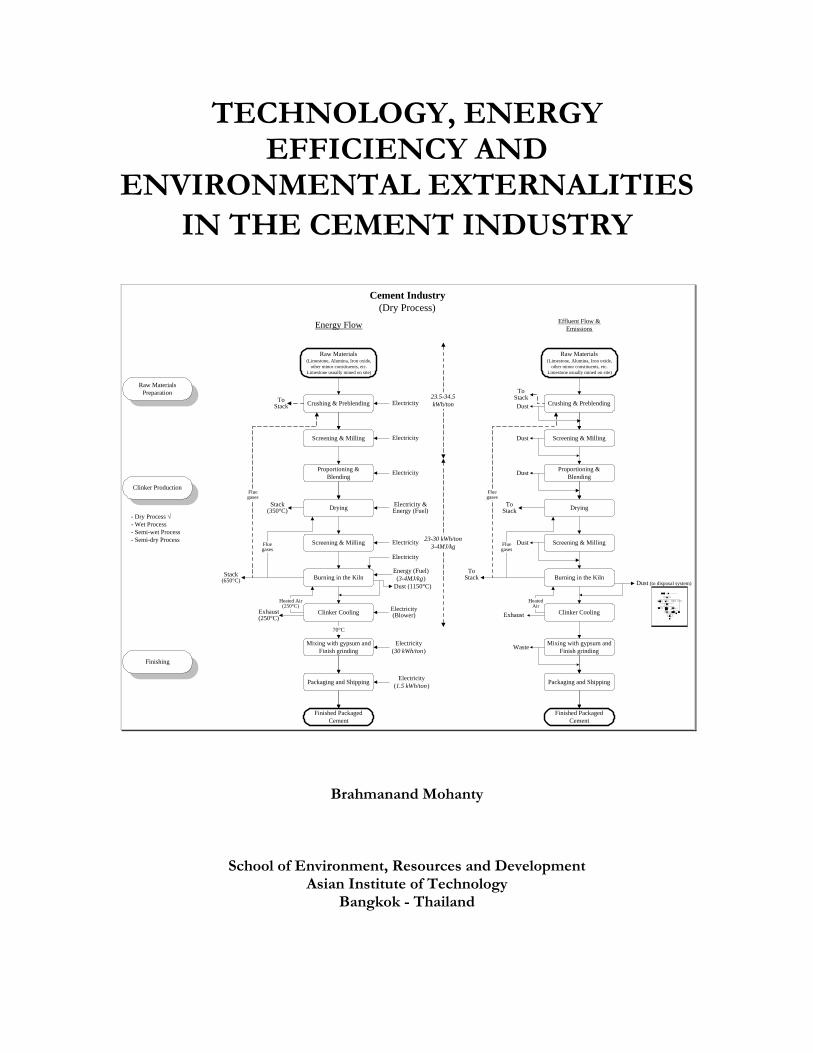
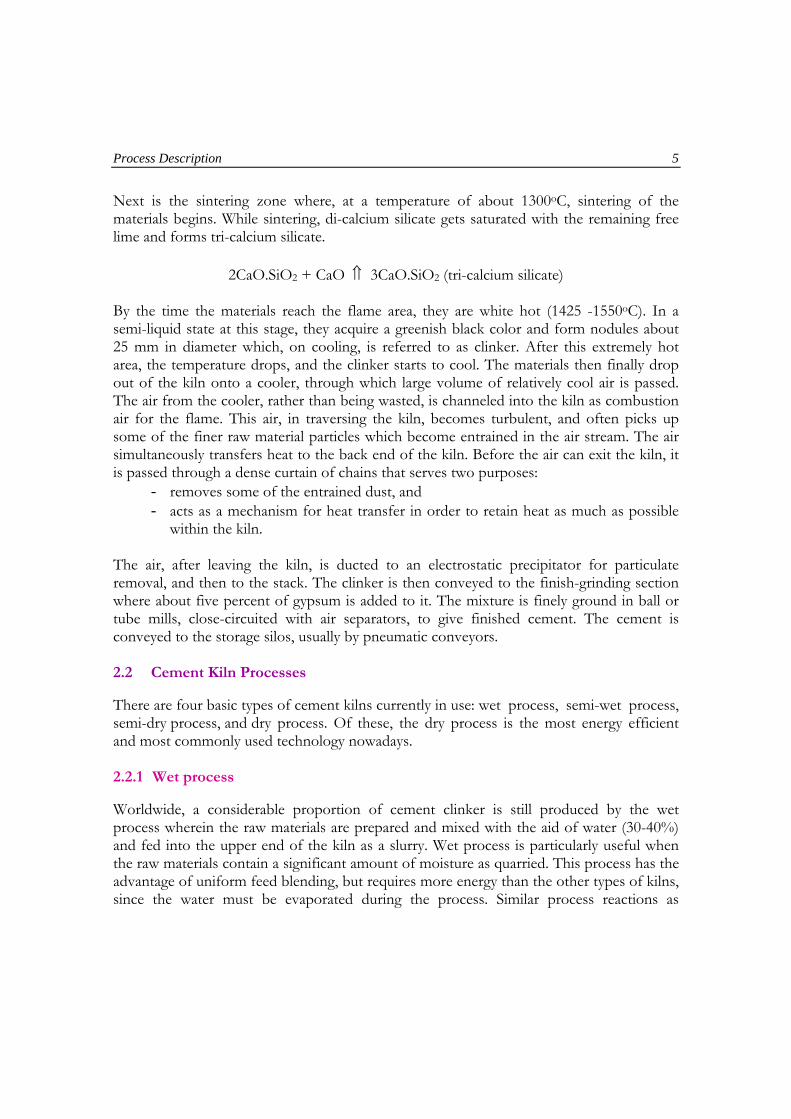
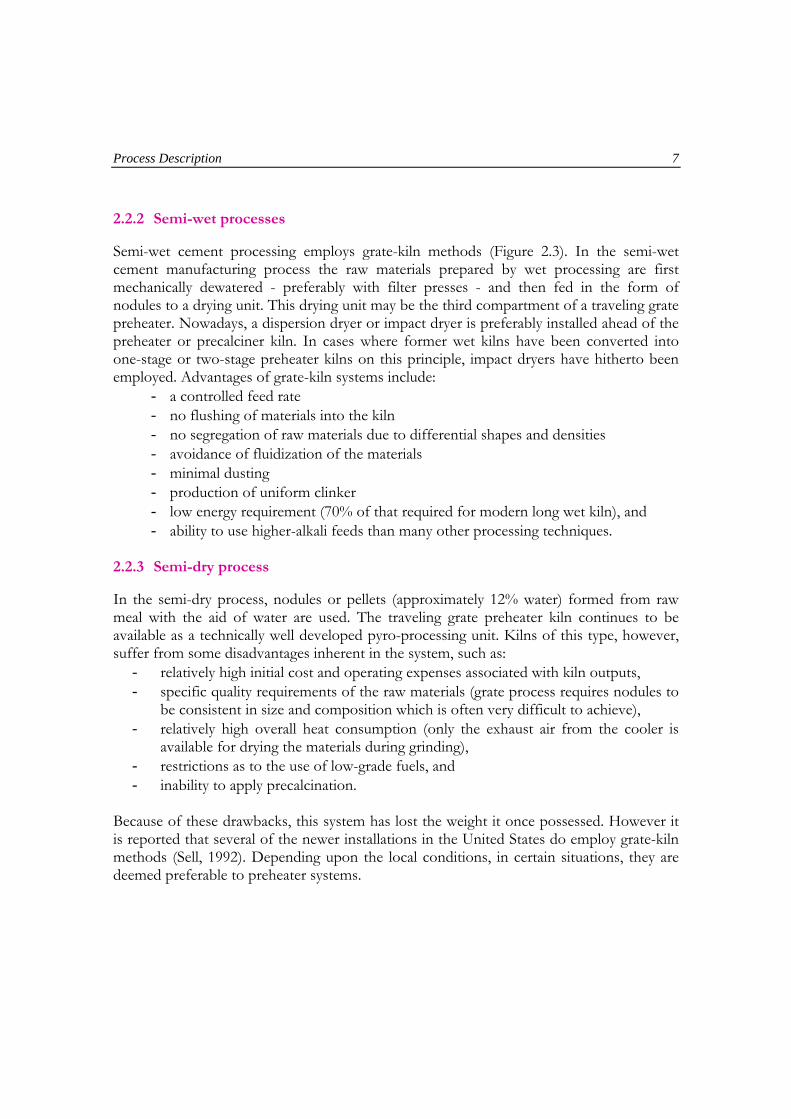
The secondary energy sources used in cement production are kiln exhaust gas and hot air from clinker cooler. A process flow diagram showing the various sources of energy used in the cement manufacturing process is given in Figures 3.1a & 3.1b. Secondary heat contained in the hot kiln exhaust gas is utilized primarily in pre-drying and preheating the raw materials before their introduction into the kiln and raw mill. The waste heat contained in the exhaust air from the clinker cooler too serves to preheat combustion air and also to dry and preheat the raw materials before they enter the raw mill and kiln. The two most energy-intensive phases in cement manufacturing are clinker production and grinding. The clinker production process consumes mainly thermal energy in the form of coal, oil or gas, while grinding consumes mainly electrical energy. Typical specific energy consumption values for different cement manufacturing processes are shown in Figure 3.2. For the best available technology of dry process production with cyclone preheater and precalciner, the specific energy consumption is 3.05 MJ/kg of clinker. However, some cement mills in developing countries are still utilizing the wet process with obsolete technologies and consuming up to 8 MJ/kg of clinker.
Energy Issues in the Cement Industry 11
* T he dotte d lin e re pres ents We t Pro ces s on ly
Fig. 3.1a. Flow diagram s of a typical dry process cement plant
12 Technology, Energy Efficiency and Environmental Externalities of the Cement Industry
* Th e dot ted l ine re pres ents Wet Proc ess only
Fig 3.1b.Flow diagram of a typical wet process cement plant

Energy Issues in the Cement Industry 13
0
1
2
3
4
5
6
7
Wet process Semi-wet process Dry process Semi-dry process
MJ/
kg o
f Cem
ent
Raw materials preparation Clinker production Finishing Others
4%
82%
6.5%7.5%
5.5%
8.9%
75.5%
10.1%
23%
55%
11%
11%
20.2%
60%
9.3%
10.5%
Figure 3.2. Typical specific energy consumption for cement manufacturing
3.2 Energy Efficiency Measures
The utilization of as much secondary energy sources as possible and the reduction of the primary purchased energy are the objectives of energy conservation measures in the cement industry. These measures can be classified according to the level of energy savings and types of investments involved as follows. 3.2.1 Short term measures
Some of the basic energy saving measures that can be readily implemented in the short term without major investments are:
- inspection to encourage conservation activity - training program for operating energy intensive equipment such as crusher,
grinding mill, pneumatic separator, vibrating screen, etc. - replacement of worn-out parts of crusher and grinding machines - controlling the slurry water at optimum level (for wet process) ( reduction of moisture content by 5% can save 338 MJ/ton of clinker) - controlling the combustion air (10% reduction in excess air can save 34-85 MJ/ton of clinker) - controlling the composition of raw materials (the fluctuation encountered in the composition of the raw materials fed to a
cement kiln is generally compensated by an over-baking which leads to energy losses)
- plugging of all air leakage
14 Technology, Energy Efficiency and Environmental Externalities of the Cement Industry
- ensuring the uninterrupted operation of the kiln
hen not in use. - insulation enhancement of kiln
0-15% can be achieved by adopting these short term easures in developing countries.
3.2.2 Medium term measures
logies as well as recovery of aterials and waste heat with moderate capital expenditures.
3.2.2.1 Measures on processed materials and products
aller size dust can be removed by electrostatic precipitators, bag filters or et scrubbers.
thout changing the character f the ordinary Portland cement as a general purpose cement.
3.2.2.2 Changes and modifications in sub-processes
The water content of slurry can be reduced by any the following means:
acity by about 1.5% and reduce the energy consumption by 68 MJ/ton of clinker)
- power factor improvement of electric motors - turning off motors and heaters w
Energy savings of the order of 1m
These include switching to new and more efficient technom
(i) Installation of dust collection system
The high velocity gases passing through the kiln carry along a large portion of dust, thus losing materials as well as energy due to the extra raw material that has to be processed for the same amount of output. Each percentage of material loss will consume additional energy of about 42 MJ/ton of clinker. Larger size dust particles can be removed by cyclones and smw (ii) Diversification of cement products
The blending of certain materials like granulated slag, fly ash and pozzolans with the cement makes it possible to produce more cement from the same amount of clinker, and as a result, the fuel consumption per ton of cement can be reduced. About 20% of clinker can be replaced by fly ash and up to 25% by blast furnace slag wio
(i) Reduction of water content of slurry
- addition of chemicals of slurry thinners - using proper filters so that slurry is dewatered mechanically - preheating the slurry by utilizing the secondary energy sources
(each percentage of water reduction in the slurry will increase the kiln cap
Energy Issues in the Cement Industry 15
the total fuel can be replaced by low grade fuel being utilized for the
(iii) e in clinker grinding system: vertical roller mills to replace tube and ball
rease the efficiency of
ball mills. The specific electricity consumption of different systems are given in able 3
Table 3.2. Specific electricity consumption of cement g
(ii) Installation of dual firing system
The reaction at the kiln takes place at two stages, firstly at a lower temperature range of 800-900°C (which is called calcination) and then at a higher temperature range of 1300-1500°C (termed as burning). Low grade fuels can be used in the lower temperature range combustion so that fuels with higher calorific values can be replaced. Depending on the ystem, 20-25% ofs
calcination phase.
Changmills
Upgradation of equipment such as jaw-crusher to gyratory crusher, ball mill to vertical oller mill (VRM), worm gears to helical and spiral gears, etc., can incr
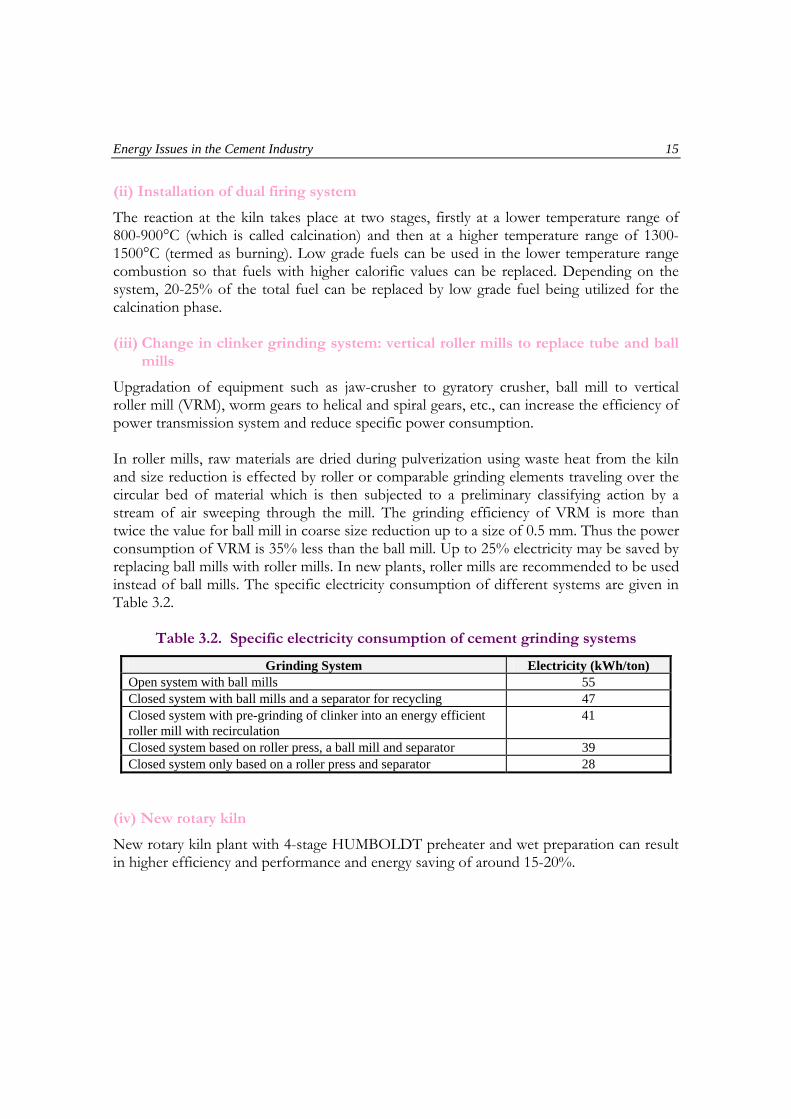
power transmission system and reduce specific power consumption. In roller mills, raw materials are dried during pulverization using waste heat from the kiln and size reduction is effected by roller or comparable grinding elements traveling over the circular bed of material which is then subjected to a preliminary classifying action by a stream of air sweeping through the mill. The grinding efficiency of VRM is more than twice the value for ball mill in coarse size reduction up to a size of 0.5 mm. Thus the power consumption of VRM is 35% less than the ball mill. Up to 25% electricity may be saved by replacing ball mills with roller mills. In new plants, roller mills are recommended to be used instead of T .2.
rinding systems
Grinding System Electricity (kWh/ton) Open system with ball mills 55 Closed system with ball mills and a separator for recycling 47 Closed system with pre-grinding of clinker into an energy efficient roller mill with recirculation
41
Closed system based on roller press, a ball mill and separator 39 Closed system only based on a roller press and separator 28
(iv) New rotary kiln
ew rotary kiln plant with 4-stage HUMBOLDT preheater and wet preparN ation can result higher efficiency and performance and energy saving of around 15-20%. in
16 Technology, Energy Efficiency and Environmental Externalities of the Cement Industry
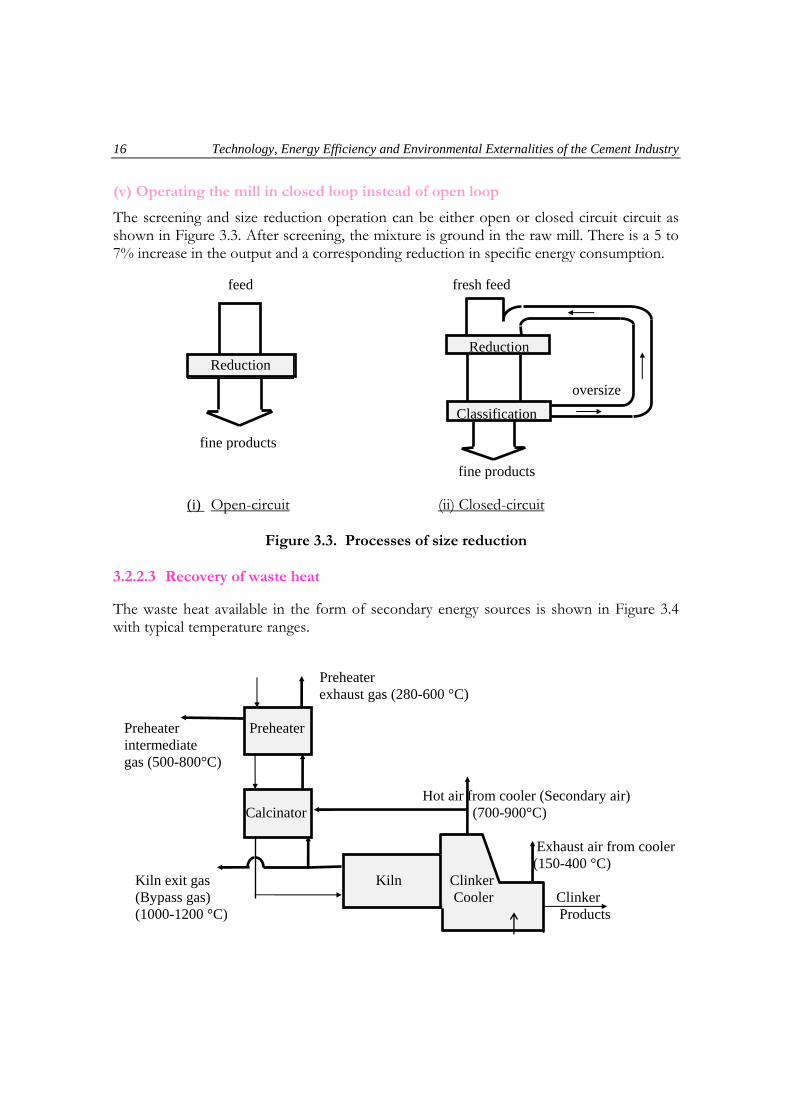
(v) Operating the mill in closed loop instead of open loop
The screening and size reduction operation can be either open or closed circuit circuit as hown in Figure 3.3. After screening, the mixture is ground in the raw mill. There is a 5 ts o % increase in the t and a corresponding reducti fic energy consumption.
)
7 outpu on in speci
(i
fine products
fine products
Reduction
Classification
fresh feedfeed
oversize
Reduction
Open-circuit (ii) Closed-circuit
. Process s of size reduction
form of secondary energy sources is shown in Figure 3.4 ith typical temperature ranges.
exhaust gas (280-600 °C)
Preheater
econdary air)
m cooler
(1000
Figure 3.3 e
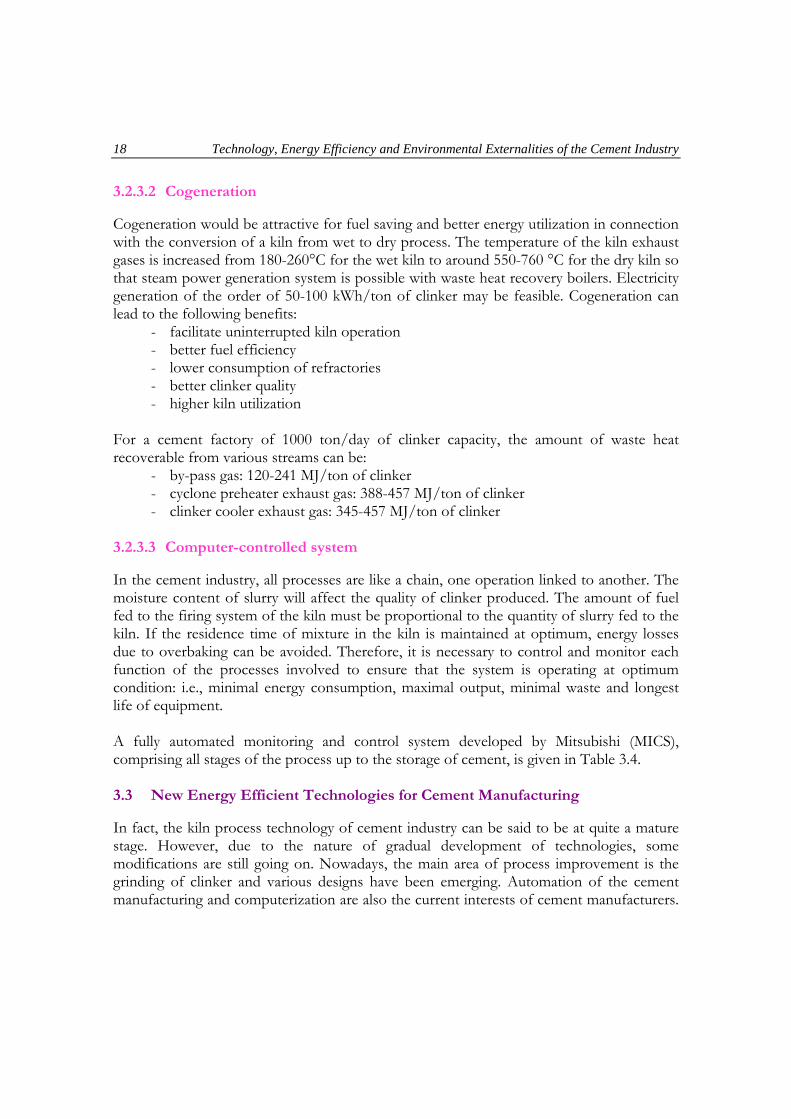
3.2.2.3 Recovery of waste heat
The waste heat available in the w
Preheater Preheater intermediate
gas (500-800°C) Hot air from cooler (S
Calcinator (700-900°C)
Exhaust air fro (150-400 °C) Kiln exit gas Kiln Clinker (Bypass gas) Cooler Clinker
-1200 °C) Products

Energy Issues in the Cement Industry 17
Figure 3.4. Availability of waste heat at different temperature levels
ator and kiln, and the exhaust air from the cooler can b
licable for blast furnace slag, coal, etc.)
- to generate electricity using Organic Rankine Cycle (ORC)
of clinker capacity, the amount of waste heat recov
er - clinker cooler exhaust gas: 345-457 MJ/ton of clinker.
ns in the oduction process to increase the efficiency of the industry are discussed below.
3.2.3.1 Conversion from wet to dry process
terials. The estimated energy savings due to the rocess changes are given in Table 3.3.
The exhaust gases from preheater, calcin
e used for the following purposes: - to dry the raw materials (app- to by-pass to precalcinator - to generate steam (36-108 MJ/ton clinker), and
For a cement factory of 1000 ton/day
erable from various streams can be: - by-pass gas: 120-241 MJ/ton of clinker - cyclone preheater exhaust gas: 388-457 MJ/ton of clink
3.2.3 Long term measures
Different long term energy efficiency measures concerning major modificatiopr
Conversion of wet process to dry process can lead to better energy efficiency and an increase in clinker output. The conversion may be either full or partial depending upon the characteristics of the available raw map
Table 3.3. Energy saving due to process changes (MJ/kg clinker)
Action Taken Initia cess l Pro New Process Energy Saving Replace Wet Dry with preheater 1.8-5.0 Convert Wet Dry with preheater 1.8-4.0 Convert Wet Dry 0.8-1.6 Replace Wet Semi-wet with step-type preheater up to 3.0 Convert Wet Semi-wet with step-type preheater up to 2.5 Replace Wet Wet with spray dryer up to 2.5 Convert Wet Wet with spray dryer up to 2.0 Replace Dry Dry with preheater 0.9-2.0 Convert Dry Dry with preheater 0.9-1.5 Note: - iln to 550 tpd, 4-
- tpd 4-stage preheater/pre-calciner conversion (estimated rate of return 20%).
Investment cost of about US$ 10 million for 440 tpd wet kstage preheater conversion (estimated rate of return: 17%). Investment cost of about US$ 95 million for 1500 tpd wet kiln to 4300
18 Technology, Energy Efficiency and Environmental Externalities of the Cement Industry
3.2.3.2 Cogeneration
Cogeneration would be attractive for fuel saving and better energy utilization in connection with the conversion of a kiln from wet to dry process. The temperature of the kiln exhaust gases is increased from 180-260°C for the wet kiln to around 550-760 °C for the dry kiln so that steam power generation system is possible with waste heat recovery boilers. Electricity generation of the order of 50-100 kWh/ton of clinker may be feasible. Cogeneration can lead to the following benefits:
- facilitate uninterrupted kiln operation - better fuel efficiency - lower consumption of refractories - better clinker quality - higher kiln utilization
For a cement factory of 1000 ton/day of clinker capacity, the amount of waste heat recoverable from various streams can be:
- by-pass gas: 120-241 MJ/ton of clinker - cyclone preheater exhaust gas: 388-457 MJ/ton of clinker - clinker cooler exhaust gas: 345-457 MJ/ton of clinker
3.2.3.3 Computer-controlled system
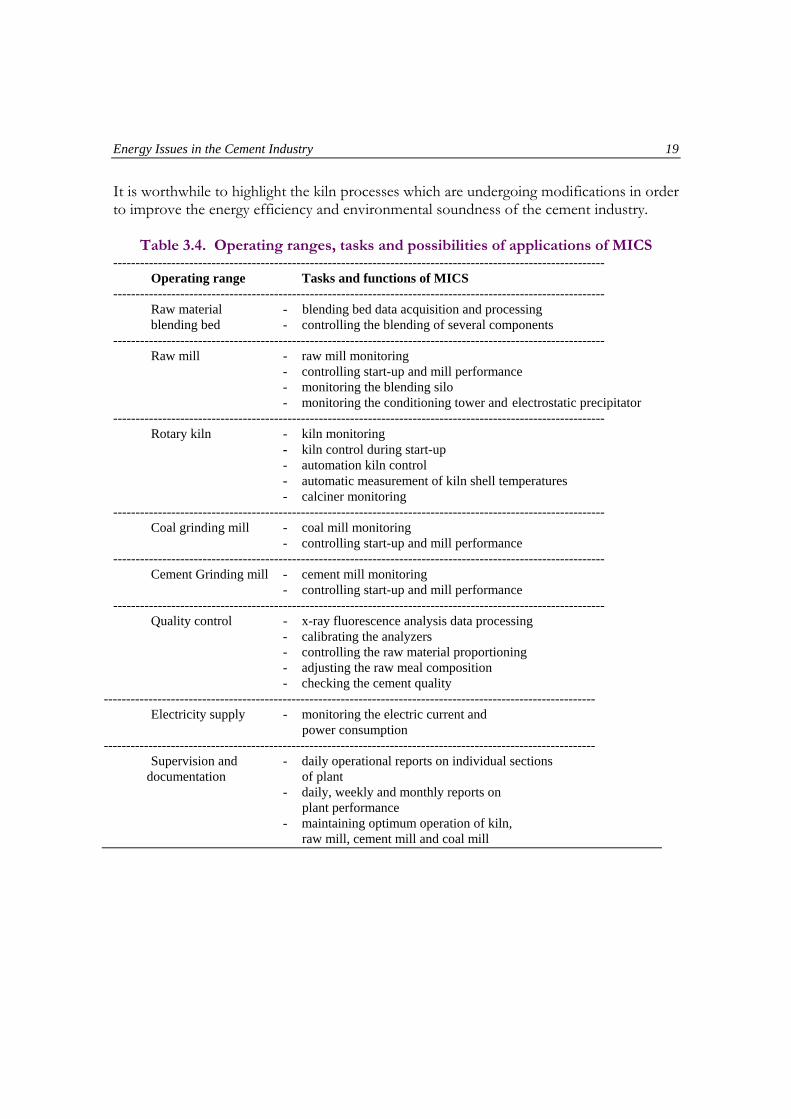
In the cement industry, all processes are like a chain, one operation linked to another. The moisture content of slurry will affect the quality of clinker produced. The amount of fuel fed to the firing system of the kiln must be proportional to the quantity of slurry fed to the kiln. If the residence time of mixture in the kiln is maintained at optimum, energy losses due to overbaking can be avoided. Therefore, it is necessary to control and monitor each function of the processes involved to ensure that the system is operating at optimum condition: i.e., minimal energy consumption, maximal output, minimal waste and longest life of equipment. A fully automated monitoring and control system developed by Mitsubishi (MICS), comprising all stages of the process up to the storage of cement, is given in Table 3.4. 3.3 New Energy Efficient Technologies for Cement Manufacturing
In fact, the kiln process technology of cement industry can be said to be at quite a mature stage. However, due to the nature of gradual development of technologies, some modifications are still going on. Nowadays, the main area of process improvement is the grinding of clinker and various designs have been emerging. Automation of the cement manufacturing and computerization are also the current interests of cement manufacturers.
Energy Issues in the Cement Industry 19
It is worthwhile to highlight the kiln processes which are undergoing modifications in order to improve the energy efficiency and environmental soundness of the cement industry.
Table 3.4. Operating ranges, tasks and possibilities of applications of MICS
-------------------------------------------------------------------------------------------------------------- Operating range Tasks and functions of MICS
-------------------------------------------------------------------------------------------------------------- Raw material - blending bed data acquisition and processing blending bed - controlling the blending of several components
-------------------------------------------------------------------------------------------------------------- Raw mill - raw mill monitoring
- controlling start-up and mill performance - monitoring the blending silo
- monitoring the conditioning tower and electrostatic precipitator --------------------------------------------------------------------------------------------------------------
Rotary kiln - kiln monitoring - kiln control during start-up - automation kiln control - automatic measurement of kiln shell temperatures - calciner monitoring
-------------------------------------------------------------------------------------------------------------- Coal grinding mill - coal mill monitoring
- controlling start-up and mill performance --------------------------------------------------------------------------------------------------------------
Cement Grinding mill - cement mill monitoring - controlling start-up and mill performance
-------------------------------------------------------------------------------------------------------------- Quality control - x-ray fluorescence analysis data processing
- calibrating the analyzers - controlling the raw material proportioning - adjusting the raw meal composition - checking the cement quality --------------------------------------------------------------------------------------------------------------
Electricity supply - monitoring the electric current and power consumption --------------------------------------------------------------------------------------------------------------
Supervision and - daily operational reports on individual sections documentation of plant - daily, weekly and monthly reports on plant performance - maintaining optimum operation of kiln, raw mill, cement mill and coal mill

20 Technology, Energy Efficiency and Environmental Externalities of the Cement Industry
3.3.1 Suspension preheating technology
The suspension system attached to the kiln consists of up to six cyclones (usually four or five). The mixture of raw material is fed into the top stage which gradually moves through the cyclones until it enters the rotary kiln. The hot kiln exit gases simultaneously move in the opposite direction and the highly turbulent mixing action between the feed and gases promotes efficient heat exchange, sufficient to induce 40-50% calcination of the raw feed by the time it enters the rotary kiln. A large amount of secondary heat is recovered which helps to lower the specific primary energy consumption to around 3.15 MJ/kg of clinker. 3.3.2 Suspension preheating/precalcination technology
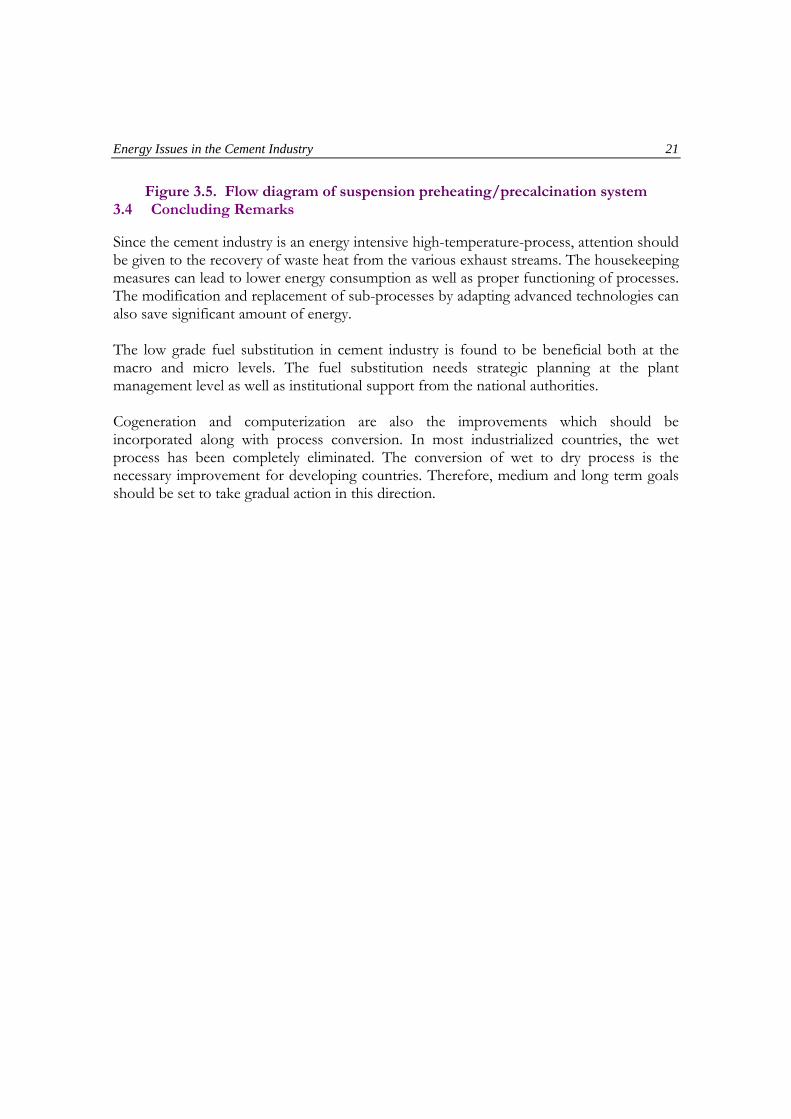
This system consists of a four stage suspension preheater, a furnace for precalcination and a rotary kiln. The preheated mixture is precalcinated in the furnace before entering the kiln. As a result, the raw mix is substantially calcined (up to a maximum of 85-90%) by the time it enters the kiln. The specific energy consumption is about 3.15 MJ/kg of clinker and the advantage is up to two-third of the total fuel requirements can be replaced by low grade fuels. The flow diagram of suspension preheating/precalcination system is shown in Figure 3.5. Induced draft fan Raw material Material flow Gas flow Precalcination furnace Secondary air duct Burners Kiln burner Kiln Product Cooler
Energy Issues in the Cement Industry 21
Figure 3.5. Flow diagram of suspension preheating/precalcination system 3.4 Concluding Remarks
Since the cement industry is an energy intensive high-temperature-process, attention should be given to the recovery of waste heat from the various exhaust streams. The housekeeping measures can lead to lower energy consumption as well as proper functioning of processes. The modification and replacement of sub-processes by adapting advanced technologies can also save significant amount of energy. The low grade fuel substitution in cement industry is found to be beneficial both at the macro and micro levels. The fuel substitution needs strategic planning at the plant management level as well as institutional support from the national authorities. Cogeneration and computerization are also the improvements which should be incorporated along with process conversion. In most industrialized countries, the wet process has been completely eliminated. The conversion of wet to dry process is the necessary improvement for developing countries. Therefore, medium and long term goals should be set to take gradual action in this direction.
22 Technology, Energy Efficiency and Environmental Externalities of the Cement Industry
4. ENVIRONMENTAL POLLUTION AND MANAGEMENT
4.1 Sources and Characteristics of Pollutants
4.1.1 Water pollution
The largest part of the water used in cement manufacturing is essentially non polluting. Process water is evaporated and most cooling water is not contaminated. The water pollution problems originating from cement plants are generally directly related to dust collection and/or dust disposal. The main sources are:
- raw material washing and beneficiation - produces high pH and alkalinity, total dissolved and suspended solids
- process water - only in the event of spillage - dust control - uses wet scrubbers to collect kiln dust from effluent gases. - dust leaching - dry dust is mixed in a slurry and placed in a clarifier for settling,
the under flow of which is returned to the kiln. The overflow containing high pH, alkalinity, suspended solids, dissolved solids, potassium and sulfate is discharged. This constitutes the most severe water pollution problem in the industry.
- dust disposal - collected dust is mixed into slurry and fed into a pond for solid settling. Settled solids are not recovered and the overflow (leachate) is discharged.
Only in exceptional cases, seepage water from dumps or stockpiles will have to be considered. The process water used in cement manufacturing is required for conditioning the exit gases or for the treatment of the raw meal in wet-process and grate preheater kilns. As this water evaporates into the atmosphere, it is therefore not discharged as waste water. 4.1.2 Air pollution
Among the pollution problems associated with cement industry, air pollution is undoubtedly the most significant one. Making 1 ton of cement requires the grinding of about 2.5 tons of raw materials, intermediate products and solid fuels to a dust-like fineness. Furthermore, even with heat-saving methods, about 100-110 kg of coal equivalent (with a flame temperature of over 1500oC) is needed per ton of cement. Depending on the process employed and the degree of sophistication of a cement plant, the manufacture of 1 kg of cement gives rise to between 6 and 14 m3 of exhaust air and gas. These quantities of air and gas have to be cleaned before being discharged into the atmosphere. Besides the particulate emissions, these gaseous pollutants play an important part in the air pollution. The gases from the kilns are generally identified as CO, CO2 and nitrogen oxides. Oxides of sulfur are either absent or present only as a trace quantity depending on the sulfur content of the coal used and also because sulfur oxides are absorbed in the kiln during the clinkering process. Hydrocarbons and other organic identities in the exit gases are absent if coal is used as the fuel.

Environmental Pollution and Management 23
4.1.2.1 Particulates
While there are various sources of dust generation in a cement plant, the kiln generates the largest quantities of dust and gases. It is well known that the nature and quantity of dust and gases from kilns depend on the characteristics of raw materials, fuel, process, burning conditions, kiln dimensions, system used, etc., which in turn govern the choice of the dust collection system and its efficiency. The largest air pollutants in cement plants are the particulate emissions, which consist of carbonates, silicates, aluminates, fluorides and alkali halides, emitted through gasses at temperature of 120-350oC. The chemical characteristics of the pollutants reflect the raw-mix composition and fuel quality. The use of lower grade raw materials leads to generation of kiln dust richer in SiO2 and alkali halides. The use of lower grade limestone also leads to relatively higher quantities of particulate matter and the particles in this case are relatively small. 4.1.2.2 Gaseous Substances
Beside the airborne emissions (dusts), every combustion process gives rise to gaseous emission. The nature and quantity of the gases produced are specifically bound up with the process in question and depend on the fuels, the combustion atmosphere and the temperature. In firing systems involving direct contact between combustion gases and solid feed material, the initial materials employed are moreover to be rated among the principal influencing factors. The exit gases from cement kilns consist mainly of nitrogen oxides, carbon dioxide, oxygen and water vapor. In addition, they may contain small amounts of sulfur dioxide, nitrogen oxides, carbon monoxide and organic hydrocarbons. For product quality and process economy, the burning of cement clinker normally requires an oxidizing atmosphere and a temperature of over 1500oC in the kiln, so that the exit gases contain only harmless amounts of carbon monoxide and hydrocarbons, if at all. Gaseous chlorine and fluorine compounds are not emitted, because they are combined with the alkaline kiln feed. Highly volatile compounds may eventually be released independently of burning process. (i) Sulfur dioxide
Sulfur is introduced with the raw materials and fuels in the cement burning process. The sulfur compounds in the fuel first of all form SO2. If the raw materials contain pyrite or organic sulfides, some of these sulfides will oxidize to SO2 at temperatures as low as 450-600oC, corresponding to the top stages in a preheater. Here, the absorption of SO2 is extremely low, and a substantial part passes out of the kiln system. In these cases, therefore, the kiln exit gases will always contain SO2. The sulfur dioxide formed by dissociation and combustion reacts chiefly with alkalis of the raw materials, giving rise to the formation of alkali sulfate which is incorporated in the clinker or the dust and thus discharged from the kiln system. In addition, sulfur dioxide reacts with calcium oxide from the calcimined raw meal to give calcium sulfate in an oxidizing kiln atmosphere. This reaction is not confined
24 Technology, Energy Efficiency and Environmental Externalities of the Cement Industry
to the kiln itself, but continues in the conditioning tower and grinding/drying plant, in which the fresh reactive surface area formed in the grinding process strongly promotes this reaction in the presence of water vapor. If sulfuric or organically combined sulfur is present and the excess air is insufficient, SO2 may be released even at relatively low temperatures from the preheater of the kiln plant. The emission of SO2 can, however, be reduced by passing the gas through a grinding/drying mill to a conditioning tower. The cement burning process and grinding process are thus function as ideal desulfurising systems in which well in excess of 90 percent of SO2 is retained. That is why it is generally possible to use fuels with high sulfur content in the cement industry without harmful consequences to the environment. The introduction of a minimum amount of sulfur for combining the raw material alkalis as sulfate is indeed desirable to achieve better product quality. (ii) Nitrogen oxides
NO formation takes place by means of two mechanisms. By the first mechanism, the thermal NO is formed in the kiln burning zone from the content of nitrogen in the atmosphere. The quantity is determined mainly by temperature and excess oxygen. By the second mechanism, the fuel NO is formed. In this instance, the content of volatiles and nitrogen in the fuel, as well as excess oxygen are the deciding factors. The fuel NO formation is of secondary importance in the burning zone as the temperature at this point is so high that considerable thermal NO is formed anyway. With secondary firing, as in precalciners, the fuel NO is of importance. The emissions of nitrogen oxides from the cement manufacturing process are much more difficult to reduce. For reasons of quality, the cement kiln has to be operated with high combustion temperatures and excess air; under these conditions the nitrogen oxide formed is more particularly the thermal NO. Gas measurements carried out in various parts of the world have revealed widely differing amounts of NOx emission from cement kilns, ranging from about 150 to over 1000 ppm (Kroboth et al. 1987). As opposed to what had been found with SO2 emission, there was no ascertainable elimination of NOx in conditioning tower or grinding/drying plants associated with the kilns. The reduced concentrations of NOx measured in those installations was entirely due to dilution with process air. A large number of short-term and long-term investigations have meanwhile revealed that the following factors are of qualitative importance to nitrogen oxide formation during the clinker burning process: the fuel used, the design and operation of precalcining system or the secondary firing methods employed, the characteristic properties of secondary fuels, the burnability of the feed material, the flame temperature, the flame shape, the burner or its setting, and the excess air factor. The variations in the NOx content of the cleaned gas discharged from a kiln plant, as determined in long-term measurements, are plotted in Figures 4.1.a and 4.1.b. During the course of the day as represented in Figure 4.1.a the kiln functioned trouble-free, producing clinker with between 0.7 and 1.2 percent of free lime. The NOx emission behavior of the same kiln over a long period is shown in Figure 4.1.b.

Environmental Pollution and Management 25
Fig. 4.1a. Daily variation of NO emissions of a rotary kiln
Fig. 4.1b. Daily variation of NO emissions of a rotary kiln (over a long period)
26 Technology, Energy Efficiency and Environmental Externalities of the Cement Industry
4.1.3 Solid waste
The major solid waste from cement industry is the dust collected from the air pollution control equipment. In addition, used refractories are also to be disposed of.
4.2 Current Pollution Abatement Strategy and Technologies
4.2.1 Air pollution control
Pollution abatement in cement industry involves mainly prevention of air and water protection. By early 1980’s the average specific heat consumption for cement manufacture steadily decreased due to the change over to energy-saving preheater kilns and to waste heat utilization techniques. In contrast with the heat consumption, the specific electric power consumption slightly increased. This is due, among other factors, to the newly built coal grinding plants and to the increasingly stringent requirements to be fulfilled by environmental protection. Thus, these factors should be considered when deciding the environmental standards. The overall dust emission values can be steadily reduced with the aid of advances in dedusting technology and of process engineering changes. It has been proved that the dust emission levels can be reduced not only during normal plant operation, but more particularly also during start-up and shut-down (Kroboth et al, 1987). For example, in the case of grate pre-heater kilns, the auxiliary chimney as a source of emission has been eliminated. Instead, while the grate is stopped, the hot kiln exit gases are so conditioned with added air and water that even during heating-up and cooling-down of the kiln they can be dedusted in the kiln’s dust collecting unit. A remarkable decrease in dust emissions in the vicinity of cement plant can be attained by elimination of the so-called diffuse dust sources. For this, enclosed buildings and silos for clinker storage have to be build up. 4.2.1.1 Dust collecting devices
It is the physical characteristics, such as total dust load, particle size distribution, bulk density, electrical resistivity and gas volume which normally determine the selection of suitable and efficient collection system, as some of these characteristics limit the power input and collection efficiency. Dedusting equipment in the form of filtering or of electrostatic precipitating units to reduce dust emission is employed in the cement industry. Inertia-force separators are now used only for pre-cleaning purposes, e.g., for protection of fans, or are integrally incorporated in the filter or precipitator systems. Formerly, cyclone collectors were considered adequate for both kiln stack and cooler stack (principal particulate emission sources) because they prevented nuisance dust-fall conditions. Now, however, opacity and discharge weight require more efficient collection equipment. Fabric filters are generally used for the dedusting of primary crushing operations, materials handling, raw meal blending and silo discharge operations, whereas grinding and drying installations (including those for coal) are dedusted with electrostatic precipitators or with
Environmental Pollution and Management 27
fabric filters. The latter appear to be better suited to cope with transitional and upset conditions because their functioning is independent of the conditioning of the dust-laden gases. For this reason, it is preferable to use fabric filters in every practicable case. Experience in the cement industry shows that electrostatic precipitators and fabric filters of equally advanced technical development and suitable design perform equally well with regard to dust collection efficiency, but not with regard to their behavior in coping with special dusts, high temperatures and varying conditions of plant operation. In view of these considerations, electrostatic precipitators have been adopted world-wide for cleaning the kiln exit gas, whereas for cleaning the air discharged from clinker coolers the dedusting equipment currently used comprises granular bed filters, fabric filters or electrostatic precipitators. The gaseous discharge from a dry process kiln contains insufficient moisture for satisfactory ESP operation unless it has been used to dry the raw material. Its temperature may be too high, in which case the gases must first be cooled by air dilution, radiation from cooling loops, or humidification. After humidification, dry process kiln gases can be controlled by ESP. Bag collectors may be preferred if the gas cooling has been accomplished by air dilution (which increases the gas volume requiring treatment) or by radiation. For wet process kilns, the ESP has general acceptance. There are, moreover, clinker cooling systems which do not produce exhaust air, namely, rotary coolers and planetary coolers. Furthermore, grate coolers embodying the so-called duo-therm operating system with intermediate cooling, which do not discharge exhaust air into the atmosphere either, have proved their suitability. The emission of heavy metals can be kept to very low values by means of high-efficiency dust collecting equipment and suitable process control. (i) Cyclone separators
Cyclone separators (mechanical precipitation) utilize a centrifugal force generated by a spinning gas stream to separate the particulate matter from the carrier gas (Rao, 1994). It can be used at high temperature and is suitable where coarse particles are present. Particulates are removed from kiln gases by electrostatic precipitators or fabric bag collectors, either of which may be preceded by cyclone collectors. Scrubbers have had very little applications because of the problems in handling particulates which react with water. (ii) Fabric filters
Because of the modest dimensions, better maintenance possibilities, greater reliability and lower capital cost, fabric filter systems operating with compressed air (reverse-pulse) cleaning have gained wide acceptance. Filters with low-pressure or reverse-flow cleaning are now seldom used. While fabric filters have no rivals in the dedusting of air from materials handling equipment, bins and silos, they have, in experience so far gained, not proved satisfactory in conjunction with kiln plants because of the peak temperatures that occur, the special
28 Technology, Energy Efficiency and Environmental Externalities of the Cement Industry
properties of kiln dusts and the critical conditions associated with start-up and change-over operations. Fabric filters have indeed been used, in a very few cases, for cleaning the gases from heat-economizing preheater kilns. With these kiln systems difficulties arise mainly on account of the very sticky fine dust particles which rapidly choke the filter fabric, resulting in high resistance, heavy power consumption and reduced throughput rates. The air pressure used for filter cleaning is limited by the stresses that the fabric can resist. Investigations show that the rate of wear rises with increasing air pressure in reverse-pulse cleaning. Furthermore, for reasons of cleaning and manipulation there are limits to the size of the filter bags. For these reasons, the fabric filters used in conjunction with big kilns, with well in excess of 100,000 cubic meters of exit gas to be treated per hour, comprise thousands of individual bags. On account of this, capital cost and expenditure on repairs are high. Besides, such filters are difficult to monitor in continuos operation. It is virtually impossible, with such large numbers of bags, to pinpoint a defective bag and change it promptly. (iii) Electrostatic precipitator
The fundamental principle of electrostatic precipitation has remained unchanged for many years. In matters of detail, however, there have been important developments, in recent years. As a result, not only has the precipitation in continuos operation been improved, but also the operational reliability under abnormal service conditions. Changes in precipitator design, such as greater duct width (wider collector electrode spacing) and new shapes and materials for the discharge electrodes and collector electrodes, have resulted in a lowering of cleaned gas dust contents and yielded advantages in terms of capital cost and maintenance and repair expenses. The technological optimization of the dust-laden gas admission and conditioning procedures by means of control systems and process computers, the use of microprocessors for precipitator voltage control and rapping, and the use of pulse generators have helped to achieve better dedusting during transitional operating conditions. The most difficult dedusting conditions in the cement industry often occur in connection with cyclone preheater kilns. The standard solution for such a kiln, which is usually operated with exit gas utilization, consists in cleaning the exit gas in an electrostatic precipitator preceded by a conditioning tower. Since operation with conditioning towers requires much maintenance, especially with unfavorable dust resistivity, when exit gas temperatures of 130oC and lower have to be attained, solutions have been devised comprising separate precipitators for the kiln and mill. In order to reduce cost it has been endeavored in some cases, by making use of pulse generators, to manage with only one precipitator despite the absence of a cooling tower (Kroboth et al., 1987). ESPs are sensitive to gas charecteristics (such as temperature) and to voltage variation. Baghouse is generally regarded as more reliable in this respect. The overall costs of the two systems are similar; the choice of system will depend on the flue gas charecteristics and local considerations.
Environmental Pollution and Management 29
4.2.1.2 Gaseous emission control
Careful control of excess air in both kiln and calciner is necessary to keep the SO2 and NO concentration at minimum. To achieve low NO concentration, a high precalciner and low burning zone temperature should be used. If the kiln feed contains pyrites, SO2 emission is unavoidable. If the required limits for SO2 and NO concentrations cannot be achieved within the actual production process, other documented methods must be used, e.g. the NH3 injection in preheater bottom to remove NO, and lime or limestone scrubbing to remove SO2, as is practiced in thermal power plants. The required particulate removal from the kiln and clinker cooler exhausts is 99.9% of all particulates and 95.5% of particulates that are less than 10 microns in size (PM10). These removal efficiencies are to be achieved at least 95% of the time that the plant is operating. In operational terms, these requirements correspond to an emission level of 50 mg/Nm3 particulates under full load conditions. This level is based on values that are routinely achieved in well run plants (World Bank, 1995). The following points summarize the key production and control practices that will lead to compliance with emission requirements:
- give reference to the dry process, - adopt the following pollution prevention measures to minimize air emissions:
- install equipment covers for crushing, grinding and milling operations, - use adjustable conveyors to minimize drop distances, - wet down intermediate and finished product storage files, - use low NOx burners with optimum level of excess air, - use low sulfur fuels in the kiln.
- operate control systems to achieve the required emission levels. 4.2.2 Water pollution control
In general, the environmental protection problems associated with water are minor ones in the cement industry. However, statuary requirements restricting the extraction of water from available sources or requiring separate treatment of cooling and surface water may involve substantial capital expenditure (Kroboth et al., 1987). For leaching, the main treatment and control method involves segregation of dust-contact streams and neutralization with stack gases followed by sedimentation with recycling and reuse of wastewater. Devices employed include:
- cooling towers or ponds to reduce the temperature of cooling process waters - settling ponds to reduce the concentration of suspended solids - contaminant ponds to dispose of waste kiln dust - clarifiers to separate solids in dust-leaching operations.
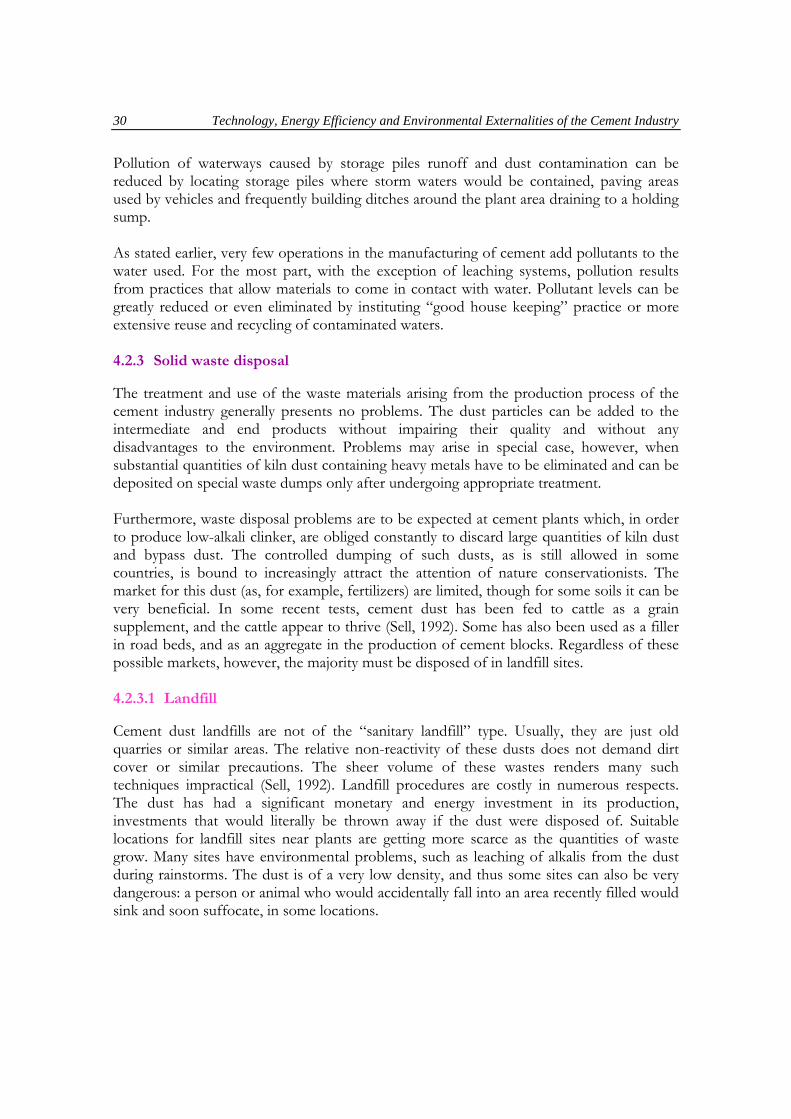
30 Technology, Energy Efficiency and Environmental Externalities of the Cement Industry
Pollution of waterways caused by storage piles runoff and dust contamination can be reduced by locating storage piles where storm waters would be contained, paving areas used by vehicles and frequently building ditches around the plant area draining to a holding sump. As stated earlier, very few operations in the manufacturing of cement add pollutants to the water used. For the most part, with the exception of leaching systems, pollution results from practices that allow materials to come in contact with water. Pollutant levels can be greatly reduced or even eliminated by instituting “good house keeping” practice or more extensive reuse and recycling of contaminated waters. 4.2.3 Solid waste disposal
The treatment and use of the waste materials arising from the production process of the cement industry generally presents no problems. The dust particles can be added to the intermediate and end products without impairing their quality and without any disadvantages to the environment. Problems may arise in special case, however, when substantial quantities of kiln dust containing heavy metals have to be eliminated and can be deposited on special waste dumps only after undergoing appropriate treatment. Furthermore, waste disposal problems are to be expected at cement plants which, in order to produce low-alkali clinker, are obliged constantly to discard large quantities of kiln dust and bypass dust. The controlled dumping of such dusts, as is still allowed in some countries, is bound to increasingly attract the attention of nature conservationists. The market for this dust (as, for example, fertilizers) are limited, though for some soils it can be very beneficial. In some recent tests, cement dust has been fed to cattle as a grain supplement, and the cattle appear to thrive (Sell, 1992). Some has also been used as a filler in road beds, and as an aggregate in the production of cement blocks. Regardless of these possible markets, however, the majority must be disposed of in landfill sites. 4.2.3.1 Landfill
Cement dust landfills are not of the “sanitary landfill” type. Usually, they are just old quarries or similar areas. The relative non-reactivity of these dusts does not demand dirt cover or similar precautions. The sheer volume of these wastes renders many such techniques impractical (Sell, 1992). Landfill procedures are costly in numerous respects. The dust has had a significant monetary and energy investment in its production, investments that would literally be thrown away if the dust were disposed of. Suitable locations for landfill sites near plants are getting more scarce as the quantities of waste grow. Many sites have environmental problems, such as leaching of alkalis from the dust during rainstorms. The dust is of a very low density, and thus some sites can also be very dangerous: a person or animal who would accidentally fall into an area recently filled would sink and soon suffocate, in some locations.
Environmental Pollution and Management 31
4.3 Other Environmental Considerations in Cement Industry
4.3.1 Noise pollution
Noise sources which have a considerable effect on the overall noise emission are distributed throughout the plant: the quarry with its mobile machines and crushers which operates only in day time, the cement grinding plants, the rotary kiln with its grate or planetary cooler, the gas discharge outlet and vehicular traffic in the cement plant. With regard to noise control measures in the plant, a distinction is to be drawn between primary and secondary measures. Primary measures are applied at the machines or other sources of noise themselves. These are essentially design arrangements, e.g., relating to teeth of gear systems, fan blades, etc., which can be applied only in new or replacement of machinery. Suppliers’ guarantees relating to noise emission are now a normal requirement associated with any order for equipment. It is furthermore advisable to opt for relatively quiet working methods, e.g., the use of electric motors instead of internal combustion engines, water-cooled instead of air-cooled engines, low heights of fall of materials being stockpiled, adequate cushioning material to reduce impact and rushing noises, and avoidance of locating several noise machines in close proximity to one another. Secondary measures such as sound attenuators (silencers), acoustic enclosures, acoustic walls, etc., reduce sound propagation, as do appropriate structural measures. They are more particularly suitable for subsequent improvements. Drawbacks associated with their use, besides extra operating expense due to pressure loss or the need for forced heat dissipation, may include inconvenience in operating, maintaining and repairing the machinery affected by these acoustic arrangements. In connection with all such measures, the cost factor which progressively increases with the degree of sound level reduction achieved, should be critically examined. 4.3.2 Reduction of ground vibrations
As with noise, problems with adjacent residents may also arise in connection with ground vibrations in cases where the distance between residential buildings and the cement works or the quarry diminishes. Vibrations are generated by shock-like or impact-like actions such as blasting, combination of materials by drop-weights, discharge of clinker from silos, periodic excitation due to roller mills or out-of-balance rotors. The geological condition of the subsoil is an important factor governing the propagation of body waves as well as the frequency composition of the vibrations. In the absence of precise information on geological conditions, on account of the large number of factors involved, it is not possible to predict vibration nuisance - as contrasted with noise nuisance - at some considerable distance from the source. With blasting, the

32 Technology, Energy Efficiency and Environmental Externalities of the Cement Industry
intensity of the vibration emission can to some extent be controlled by the technique employed (number and spacing of blast holes, amount of explosive fired, depth of holes, sequenced delay-action firing), and propagation by the direction in which quarrying advances. 4.3.3 Raw material resources and site restoration
Quarrying the raw materials needed for cement manufacture involves intervention in nature and the landscape. Because people have developed a higher awareness to environmental and nature conservation, it has in many developed countries become increasingly difficult to extend existing quarries or indeed to start new ones. All the same, conservation and the need to secure raw material resources must not be regarded as two exclusive aims. Contrary to the popular opinion, the natural reserves of limestone, marl, chalk and sand are not inexhaustible, particularly in relation to the sitting of cement plants. To make arrangements for the long-term supply of mineral raw materials in the requisite quantities and at acceptable cost is an important economic necessity. Besides the demands of the natural conservation the demands of maintaining a supply of raw materials must therefore always be given due consideration. The cement industry strives to compensate for the unavoidable intervention in the nature and the landscape by appropriate action to ensure landscape preservation and site restoration. In deciding how the site is to be restored and what its subsequent utilization will be, there are many viewpoints to be considered. The natural features of the quarry are especially important. The quarrying operations should be so conducted that the mineral deposits can be utilized as fully as possible. Based on this principle, it can be analyzed what potential there exists for subsequent utilization and for what purposes the sites can be practicably and meaningfully used in each particular case. Some of the possible utilization paths are:
- agricultural and forestry; - industrial use; - municipal use; - traffic and transportation; - leisure and recreational use.
Besides utilization for specific purposes, planned natural restoration has been gaining in importance in recent years. For this purpose, worked-out quarry sites are intentionally “given over to nature” within the planning context, so that suitable habits for animal and plant life (biotopes) can develop. These may be pools or ponds and marshy areas or tips, slopes and escarpments, as well as edge zones, offering undisturbed living conditions for many species of plants and animals.
Environmental Pollution and Management 33
4.3.4 Utilization of waste as raw material and fuel in cement industry
Because of the special features of the cement burning process - the strongly alkaline feed material, kiln charge and kiln dust, oxidizing kiln atmosphere, temperature distribution in the burning system, and the intimate contact between the solids and gases in the kiln - it is possible, on the one hand, to employ waste materials as fuel and, on the other hand, to add waste materials to the raw mix or the cement. The cement industry can thus make an important contribution to the disposal of wastes arising from other sectors of industry. The use of waste materials as “junk fuel” (waste-derived fuel) in the clinker burning process is subject to limits due to requirements of environmental compatibility, product quality, and economy in relation to primary fuels. Such materials may be fired in a finely ground condition or in lump form. The feed-in points for these fuels are the main firing system in the precalciner or the riser duct of the cyclone preheater, the kiln inlet or the hot gas compartment of a grate preheater kiln, or as an inter-ground admixture to the kiln feed meal. The kiln inlet (feed end) can be used for this purpose only in plants equipped with preheaters. The waste-derived fuels fed into the system at this point are mostly in the form of coarse lumps. They may consist of scrap motor tires, rubber shreds, shredded household refuse, compacted refuse, or textile and wood wastes. However, finely divided waste materials such as acid sludge, low-grade coal and oil shale may also be fed in here. As numerous measurements have shown, with proper process control the firing of these waste-derived fuels does not cause any increase in emission of environmentally relevant pollutants. Emission of dioxins and furans have received special attention because they have been identified in the stack gases from number of solid waste incinerators. However, survey of test results from trial burns at cement kilns indicates that emissions of dioxins and furans from these facilities are not significant. When dioxins and furans have been observed, they appear to be three orders of magnitude less than those reported for municipal incinerators. Moreover, there is no change in dioxin or furan emissions due to the use of waste-derived fuels. If waste materials with a high sulfur or chloride content are used as fuels, attention must be paid not only to the quality of the clinker and cement produced, but also more particularly to the process engineering requirements of kiln control. It is advantageous to carry out an emission prognosis to ascertain what quantities of waste-derived fuels can permissibly be used. The waste-derived fuels currently used in USA and European cement plants are primarily waste oils and spent organic solvents from the following industries: paint and coatings, auto and truck assembly, solvent reclamation, ink and printing, cosmetics, toy, medical and electronics. The following environmental and economical benefits can be achieved when wastes are destroyed in a cement kiln:

34 Technology, Energy Efficiency and Environmental Externalities of the Cement Industry
- combustion gas temperature and residence time in kilns are much greater than
those encountered in commercial incinerators. The sustained high combustion gas temperatures, combined with intense turbulence ensure efficient destruction of even stable organic compounds. The gas in the burning zone of a kiln reaches 2000oC for a period of approximately three seconds, while an incinerator achieves its maximum temperature for about half that time.
- the kiln contents are alkaline and can trap hydrogen chloride formed during
combustion of chlorinated wastes. Most of sulfur oxides are similarly trapped as calcium sulfate.
- ash resulting from incombustible material such as metals in waste becomes
incorporated in the clinker, eliminating disposal problems. - there is no significant change in emissions from cement kilns when waste-
derived fuels are used, and new emissions from the operation of an incinerator are not added to the atmosphere when waste-derived fuels are used to replace fossil fuel in an existing cement kiln.
- replacement of imported fuel or conservation of non-renewable resources by
waste-derived fuels for coal, coke and natural gas. - a reduction in manufacturing costs through the recovery of the energy value of
wastes which would otherwise be lost. Waste fuels typically have a heat value of 24 GJ/t which is somewhat less than coal but are available at a fraction of the cost.
In connection with the conversion of coal-fired power stations to environmentally innocuous firing methods rapidly increasing quantities of fly-ash and gypsum are becoming available from the flue gas desulfurization treatment now applied in many parts of the world. Due to the lack of adequate dumping spaces and also because of their content of various environmentally relevant substances that can be washed or leached out, the disposal of these materials is encountering major difficulties. Under certain conditions the cement industry can contribute to solving these problems. Thus, in a number of countries the requirement applicable to fly-ash and flue gas gypsum and to their use in cement manufacture have been embodied in national codes and standards.

Environmental Pollution and Management 35
4.4 Concluding Remarks
Since air pollution is a major concern, priority in the cement industry is to minimize the increase in ambient particulate levels by reducing the mass load emitted from the stacks, from fugitive emissions, and from other sources. Collection and recycling of dust in kiln gases is required to improve the efficiency of the operation and to reduce the atmospheric emissions. NOx levels should be controlled by adjustment of the kiln burner and use of an optimum level of excess air. For control of fugitive particulate emissions, ventilation system should be used in conjunction with hoods and enclosures covering transfer points. Drop distances should be minimized by use of adjustable conveyors. Mechanical systems such as cyclones trap the larger particulates in kiln gases and act as preconditioner for downstream collection devices. Electrostatic precipitators and fabric filter system are the principal options for collection and control of fine particulates. Storage and waste areas should be wetted-down to reduce dust generation from these sources. Appropriate storm-water and run-off control system should be provided to minimize the quantities of suspended materials carried off-site. Alkali dust removed from the kiln gases is normally disposed of as solid waste, but it may be possible to reuse a portion for agricultural liming.

36 Technology, Energy Efficiency and Environmental Externalities of the Cement Industry
5. CROSS-COUNTRY COMPARISON OF THE CEMENT SECTOR
5.1 Introduction
The cement demand has been increasing in the developing countries along with the rapid development of infrastructure. In the favor of abundant resources, the developing countries have been producing cement without taking much care of the process energy consumption. As a capital intensive industry, the main difference between the industrialized economies and developing countries is the average size of the mills. The small mills predominate in developing countries with 1.5 to 2 times higher specific energy consumption in comparison with the industrialized countries. Besides the scale of the mills, there are various other factors which lead to the inefficiency of energy use in the cement industry. Production of cement involves a lot of grinding of raw materials, intermediate products and fuel to pulverized form, and generates air pollutants. As the industry in this region still operate with obsolete technologies, the wet process dominates as the process technology in some of the countries, which creates water pollution in addition to the air pollution problems. As for the case of energy, mill size also plays a role in the inefficiency of pollution abatement This paper presents a comparative study of the cement industries in China, India, the Philippines and Sri Lanka to point out the major causes of energy inefficiency and pollution problems, and to identify the improvements and potential application of energy efficient and environmentally sound technologies. 5.2 Overview of the Industry
5.2.1 Role in the national economy
In 1989, the Indian cement industry accounted for 1.8% of total output of manufacturing economy and 0.23% of the gross domestic product. 5.2.2 Share in total energy consumption
In 1990, energy consumption of Chinese cement industry accounted for 6.6% of the total industrial energy consumption and 3.5% of total national energy consumption. In 1990, Indian cement industry had a share of over 10% of the industrial sector’s coal consumption and over 6% of the industrial sector’s electricity consumption.
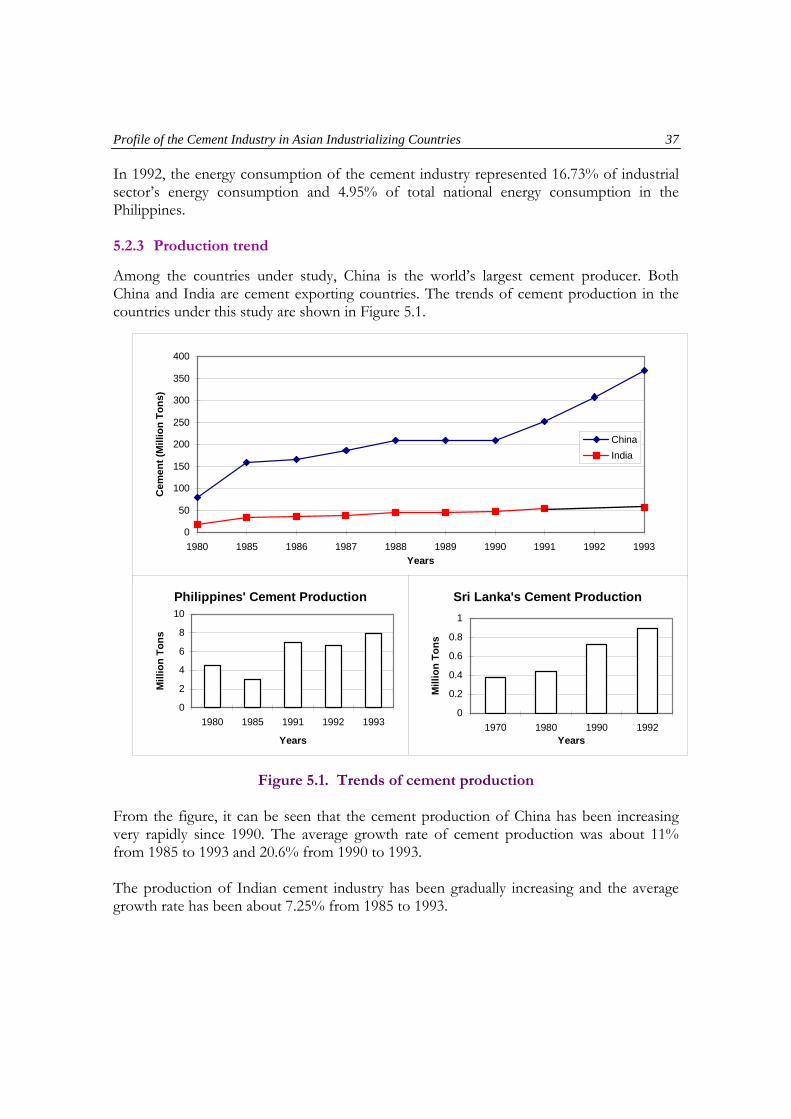
Profile of the Cement Industry in Asian Industrializing Countries 37
In 1992, the energy consumption of the cement industry represented 16.73% of industrial sector’s energy consumption and 4.95% of total national energy consumption in the Philippines. 5.2.3 Production trend
Among the countries under study, China is the world’s largest cement producer. Both China and India are cement exporting countries. The trends of cement production in the countries under this study are shown in Figure 5.1.
0
50
100
150
200
250
300
350
400
1980 1985 1986 1987 1988 1989 1990 1991 1992 1993Years
Cem
ent (
Mill
ion
Tons
)
ChinaIndia
Philippines' Cement Production
0
2
4
6
8
10
1980 1985 1991 1992 1993
Years
Mill
ion
Tons
Sri Lanka's Cement Production
0
0.2
0.4
0.6
0.8
1
1970 1980 1990 1992Years
Mill
ion
Tons
Figure 5.1. Trends of cement production From the figure, it can be seen that the cement production of China has been increasing very rapidly since 1990. The average growth rate of cement production was about 11% from 1985 to 1993 and 20.6% from 1990 to 1993. The production of Indian cement industry has been gradually increasing and the average growth rate has been about 7.25% from 1985 to 1993.
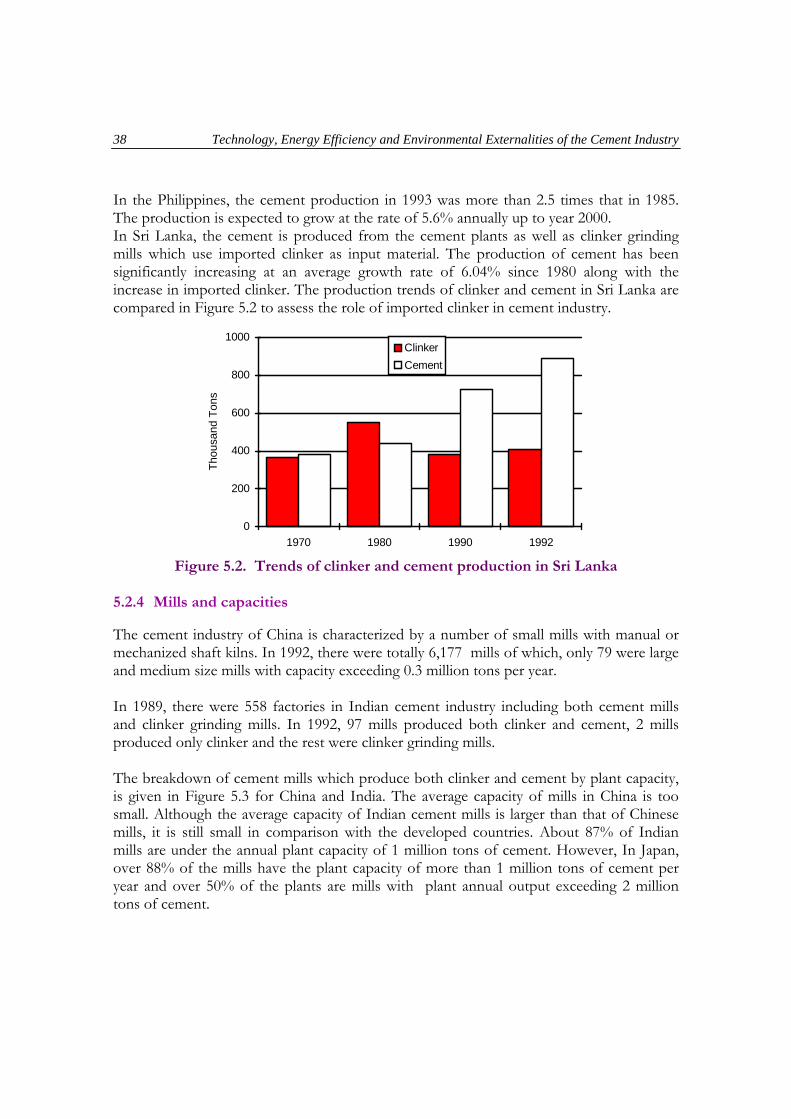
38 Technology, Energy Efficiency and Environmental Externalities of the Cement Industry
In the Philippines, the cement production in 1993 was more than 2.5 times that in 1985. The production is expected to grow at the rate of 5.6% annually up to year 2000. In Sri Lanka, the cement is produced from the cement plants as well as clinker grinding mills which use imported clinker as input material. The production of cement has been significantly increasing at an average growth rate of 6.04% since 1980 along with the increase in imported clinker. The production trends of clinker and cement in Sri Lanka are compared in Figure 5.2 to assess the role of imported clinker in cement industry.
Thou
sand
Ton
s
0
200
400
600
800
1000
1970 1980 1990 1992
ClinkerCement
Figure 5.2. Trends of clinker and cement production in Sri Lanka
5.2.4 Mills and capacities
The cement industry of China is characterized by a number of small mills with manual or mechanized shaft kilns. In 1992, there were totally 6,177 mills of which, only 79 were large and medium size mills with capacity exceeding 0.3 million tons per year. In 1989, there were 558 factories in Indian cement industry including both cement mills and clinker grinding mills. In 1992, 97 mills produced both clinker and cement, 2 mills produced only clinker and the rest were clinker grinding mills. The breakdown of cement mills which produce both clinker and cement by plant capacity, is given in Figure 5.3 for China and India. The average capacity of mills in China is too small. Although the average capacity of Indian cement mills is larger than that of Chinese mills, it is still small in comparison with the developed countries. About 87% of Indian mills are under the annual plant capacity of 1 million tons of cement. However, In Japan, over 88% of the mills have the plant capacity of more than 1 million tons of cement per year and over 50% of the plants are mills with plant annual output exceeding 2 million tons of cement.

Profile of the Cement Industry in Asian Industrializing Countries 39
There are 18 cement plants in the Philippines with a total capacity of 7.4 and 9.5 million tons of clinker and cement per year respectively, leading to an average plant capacity of about 5.5 million tons of cement per year.
1.28%
98.72%
>0.3 <0.3
China
4%
2.1%7.2%
46.4%
40.2%
2-2.5 1.5-2 1-1.5 0.5-1 <0.5
India
Figure 5.3. Breakdown of mills in China and India by capacity
(million tons of cement/year)
There are 5 cement mills in Sri Lanka, two of which are clinker grinding factories producing 409 and 891 million tons of clinker and cement respectively in 1992. The plant utilization factors for China, India and the Philippines are compared in Figure 5.4. The low utilization factors are mainly due to old equipment employed.
Util
izat
ion
(%)
65
70
75
80
85
90
China * India Philippines Sri Lanka
86
76
83
79
* 1991 data
Figure 5.4. Plant utilization factors in 1993
In China, the number of small mills (<0.3 million tons of cement/year) has been increasing very rapidly since 1970 until 1987. The trends of share of small mills in total production is given in Figure 5.5. Although the cement production has been significantly increasing since 1990 (Figure 5.1), the share of small mill remained constant. Therefore, it can be said that

40 Technology, Energy Efficiency and Environmental Externalities of the Cement Industry
there has been a slowdown in the growth of small mills at the cost of medium and large-size plants.
% o
f Tot
al P
rodu
ctio
n
0
10
20
30
40
50
60
70
80
90
1970 1980 1985 1986 1987 1988 1989 1990 1991
Figure 5.5. Share of small mills in Chinese cement production In India, the small units in private sector and large mills in public sector have been growing in parallel. The shares of private sector and public sector in total cement production are given in Table 5.1.
Table 5.1. Shares of private and public sectors in India (% of total production)
1977 1983 1991 1992 Private Sector 90.08 83.90 89.80 89.60 Public Sector 9.92 16.10 10.20 10.40
5.3 Characteristics of the Parameters affecting Energy Efficiency
The major parameters which affect the specific energy consumption of the cement industry are:
- Control on raw material mixing - Process mix (dry, wet, semi) - Degree of precalcination - Level of waste heat recovery - Product mix, etc.
The specific energy consumption of the cement industries in selected countries are shown in Figure 5.6. It can be seen that the specific energy consumption of Chinese cement industry is nearly twice as much that of former west Germany. The trends of specific energy consumption in selected countries are shown in Figure 5.7.

Profile of the Cement Industry in Asian Industrializing Countries 41
0
1
2
3
4
5
6
7
China Philippines Japan
MJ/
kg o
f Cem
ent
Figure 5.6. Specific energy consumption of cement industry
MJ/
kg o
f Cem
ent
0
1
2
3
4
5
6
7
8
1980 1985 1986 1987 1988 1989 1990 1991 1992 1993
China India Philippine Japan
Figure 5.7. Trends of specific energy consumption
The curve of specific energy consumption of Chinese cement industry is quite flat. Although the specific energy consumption of Indian industry has been decreasing, it has become slower in the recent years and still remain higher than that of developed countries. To understand the major causes of inefficiency in cement industries of the countries under this study, some parameters which have influences on the energy consumption are compared.
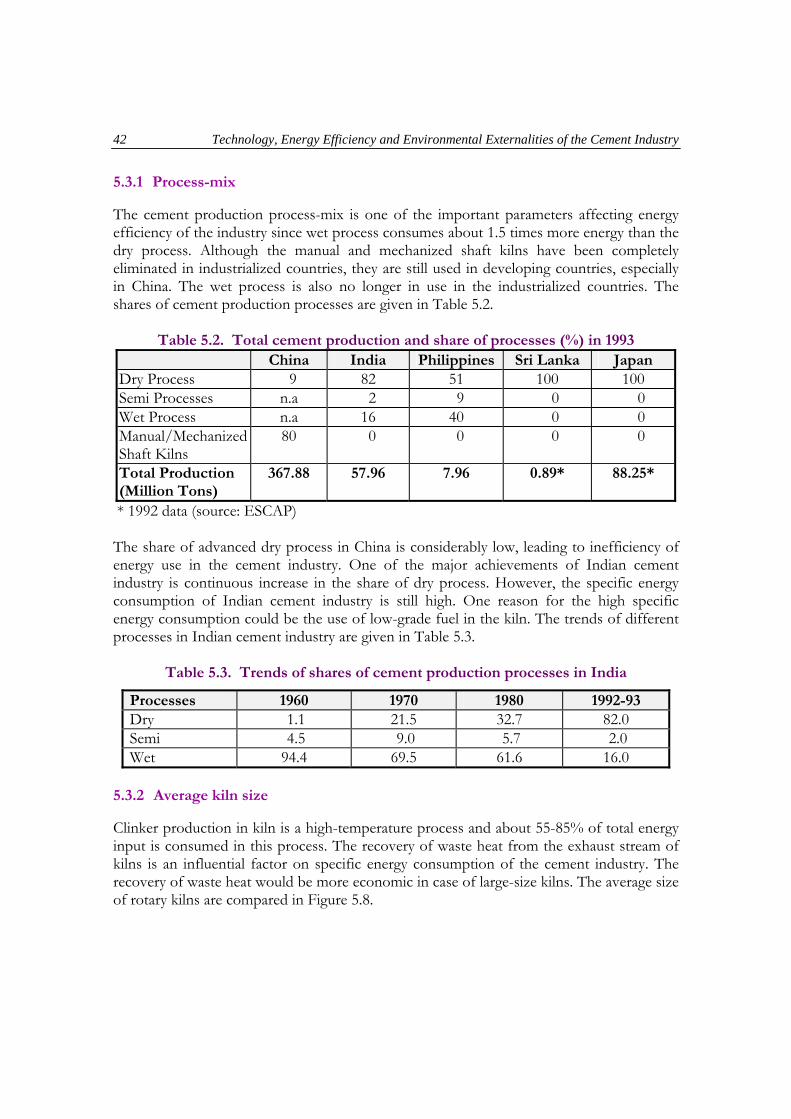
42 Technology, Energy Efficiency and Environmental Externalities of the Cement Industry
5.3.1 Process-mix
The cement production process-mix is one of the important parameters affecting energy efficiency of the industry since wet process consumes about 1.5 times more energy than the dry process. Although the manual and mechanized shaft kilns have been completely eliminated in industrialized countries, they are still used in developing countries, especially in China. The wet process is also no longer in use in the industrialized countries. The shares of cement production processes are given in Table 5.2.
Table 5.2. Total cement production and share of processes (%) in 1993 China India Philippines Sri Lanka Japan
Dry Process 9 82 51 100 100 Semi Processes n.a 2 9 0 0 Wet Process n.a 16 40 0 0 Manual/Mechanized Shaft Kilns
80 0 0 0 0
Total Production (Million Tons)
367.88 57.96 7.96 0.89* 88.25*
* 1992 data (source: ESCAP) The share of advanced dry process in China is considerably low, leading to inefficiency of energy use in the cement industry. One of the major achievements of Indian cement industry is continuous increase in the share of dry process. However, the specific energy consumption of Indian cement industry is still high. One reason for the high specific energy consumption could be the use of low-grade fuel in the kiln. The trends of different processes in Indian cement industry are given in Table 5.3.
Table 5.3. Trends of shares of cement production processes in India
Processes 1960 1970 1980 1992-93 Dry 1.1 21.5 32.7 82.0 Semi 4.5 9.0 5.7 2.0 Wet 94.4 69.5 61.6 16.0
5.3.2 Average kiln size
Clinker production in kiln is a high-temperature process and about 55-85% of total energy input is consumed in this process. The recovery of waste heat from the exhaust stream of kilns is an influential factor on specific energy consumption of the cement industry. The recovery of waste heat would be more economic in case of large-size kilns. The average size of rotary kilns are compared in Figure 5.8.
Profile of the Cement Industry in Asian Industrializing Countries 43
'000
Ton
s of
Clin
ker/y
r
0
200
400
600
800
1000
1200
China India Japan
90
240
1000
Figure 5.8. Average capacity of rotary kilns
The vertical kilns are no longer in use in Japan. The average size of vertical kilns is 30 thousand tons of clinker per kiln per year in both China and India. 5.3.3 Energy consumption by type
The specific consumption of two types of energy sources, thermal energy and electricity, are given in Table 5.4 for selected countries by different processes.
Table 5.4. Specific thermal and electrical energy consumption
China India Philippines Sri Lanka Japan Thermal Energy (MJ/kg Clinker) Dry Process 4.85 3.8-4.4 4.2 4.35 3.0 Wet Process 6.04 5.9-6.8 7.5 - - Mechanized Shaft Kiln Process 4.90 n.a - - - Electricity (kWh/ton cement) 110 120-130 130 130 96
Although the dry process predominates in Indian cement industry, the higher specific thermal energy consumption of dry process would be one of the major causes of high overall specific energy consumption. The specific electricity consumption of developing countries is significantly higher than that of industrialized countries. In fact, the higher electricity consumption is due to the inefficient grinding of raw materials and clinker. 5.3.4 Awareness on energy conservation
Some of the energy conservation measures which have already taken place are summarized in the Table 5.5.
44 Technology, Energy Efficiency and Environmental Externalities of the Cement Industry
The table shows that, some advanced technologies have already been implemented in the developing countries. However, the dissemination rate of these technologies is quite low in comparison with the industrialized countries.
Table 5.5. Energy conservation measures already undertaken
Country Energy Conservation Measures China - Closing and converting manual vertical kilns to mechanized kilns
- Premix control of raw materials and fuel - Raw material ingredient and uniformity control - Improving raw material grinding facilities - Conversion of wet process kilns to semi or dry process kilns with suspension preheating systems - Introduction of precalciner facilities - Computer controlled kiln operation - Improving clinker grinding facilities
India - Installation of raw material composition control equipment - Improving the raw materials and clinker grinding - Computer controlled fuel feeding - Installation of high efficiency burners - Installation of secondary firing system - Waste heat recovery through cogeneration boilers - Improving house-keeping measures - Dust recycling system - Power factor improvements - Combustion control - Installation of logic controller for sequential starting and process optimization - Introduction of precalciner facilities - Installation of high pressure roller mills
Philippines
- Fuel switching from bunker oil to coal - Conversion of direct to indirect firing system - Rehabilitation of small capacity kilns to achieve rated output - Installation of precalciner - Rehabilitation of clinker cooler
Sri Lanka - Insulation improvement and house-keeping
5.4 Characteristics of the Parameters Affecting Pollution Abatement Measures
In new , environmental concerns are for air pollutants such as dust, SOx and NOx. The cement industry being very capital intensive, many plants continue to use the old wet
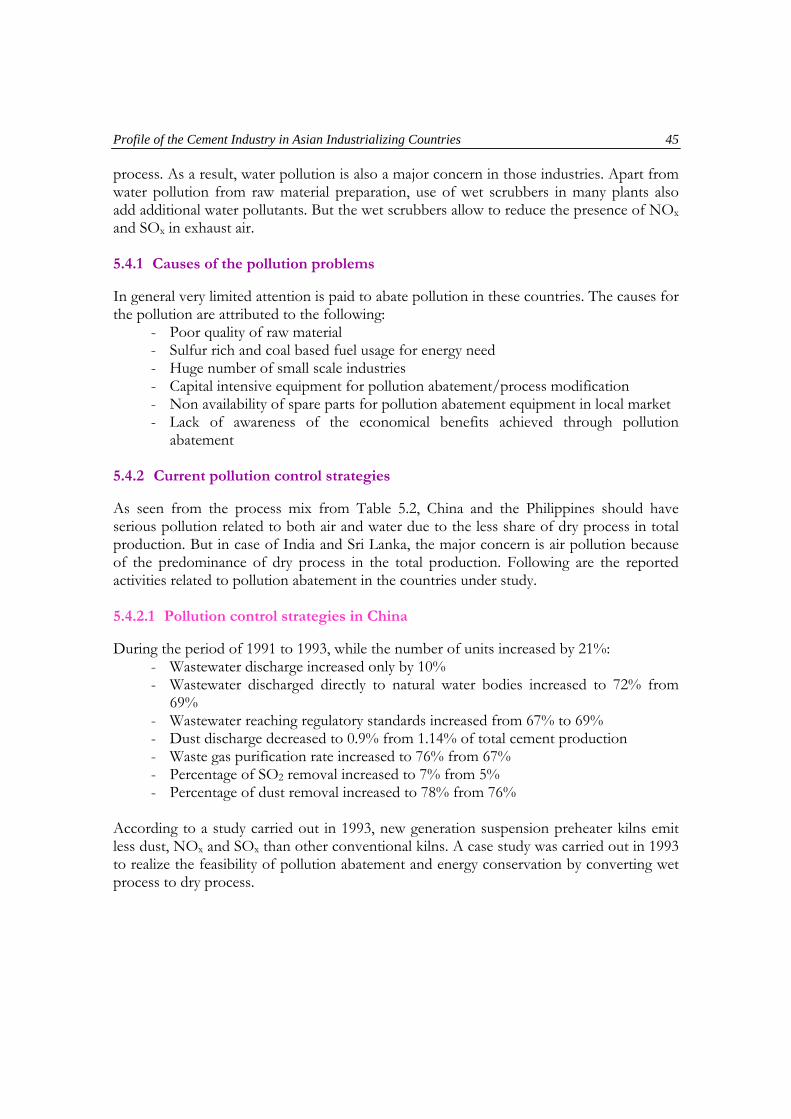
Profile of the Cement Industry in Asian Industrializing Countries 45
process. As a result, water pollution is also a major concern in those industries. Apart from water pollution from raw material preparation, use of wet scrubbers in many plants also add additional water pollutants. But the wet scrubbers allow to reduce the presence of NOx and SOx in exhaust air. 5.4.1 Causes of the pollution problems
In general very limited attention is paid to abate pollution in these countries. The causes for the pollution are attributed to the following:
- Poor quality of raw material - Sulfur rich and coal based fuel usage for energy need - Huge number of small scale industries - Capital intensive equipment for pollution abatement/process modification - Non availability of spare parts for pollution abatement equipment in local market - Lack of awareness of the economical benefits achieved through pollution
abatement 5.4.2 Current pollution control strategies
As seen from the process mix from Table 5.2, China and the Philippines should have serious pollution related to both air and water due to the less share of dry process in total production. But in case of India and Sri Lanka, the major concern is air pollution because of the predominance of dry process in the total production. Following are the reported activities related to pollution abatement in the countries under study. 5.4.2.1 Pollution control strategies in China
During the period of 1991 to 1993, while the number of units increased by 21%: - Wastewater discharge increased only by 10% - Wastewater discharged directly to natural water bodies increased to 72% from
69% - Wastewater reaching regulatory standards increased from 67% to 69% - Dust discharge decreased to 0.9% from 1.14% of total cement production - Waste gas purification rate increased to 76% from 67% - Percentage of SO2 removal increased to 7% from 5% - Percentage of dust removal increased to 78% from 76%
According to a study carried out in 1993, new generation suspension preheater kilns emit less dust, NOx and SOx than other conventional kilns. A case study was carried out in 1993 to realize the feasibility of pollution abatement and energy conservation by converting wet process to dry process.

46 Technology, Energy Efficiency and Environmental Externalities of the Cement Industry
5.4.2.2 Pollution control strategies in India
Different emission standards were set up considering the location and capacity of the plants. To meet these emission standards, advanced dust collection systems such as electrostatic precipitator and fabric filters are used. Following were identified as some constraints for pollution abatement:
- Poor quality of coal - Non availability of the spare parts for pollution control equipment - Non availability of trained man power - Problems in installing new dust collectors due to layout constraints - The ash content of coal varies from 22-45 %, leading to high concentration of CO
emission which in turn creates the danger of explosion in ESPs - Frequent voltage fluctuations and unscheduled power cuts affect ESP operation.
5.4.2.3 Pollution control strategies in the Philippines
Environmental protection regulation was published in 1978, which includes air quality, water quality and noise level control. Regulations in the Philippines are not stringent as those in Taiwan and Japan. About 24% of the production units in the industry have no dust collector. Absence of dust collectors is very common in crusher and raw material drier sections. In early 80’s all cement plants were converted to coal firing system. 5.4.2.4 Pollution control strategies in Sri Lanka
All mills are provided with ESPs and fabric filters for removal and recycling arrangements for dust but no stand-by units are available. So during maintenance of the equipment, dust is discharged into the atmosphere without any control. 5.4.3 Comparison of effluent and emission characteristics
A comparison of water consumption and quantity and characteristics of wastewater with German standards is made in Table 5.6. In most cases, data are not available even though it is an important polluting industry. Especially India and Sri Lanka do not have any data related to water pollution. It can be attributed to diminishing trend of wet process in India and non availability of wet process in Sri Lanka. A similar comparison for air emission is shown in Table 5.7. Even though data are available related to air pollution, comparison is not possible in most cases because of the different basis. Though dust emission standards in India and Philippine are very close to each other, they are ten times higher than the German regulatory standards.
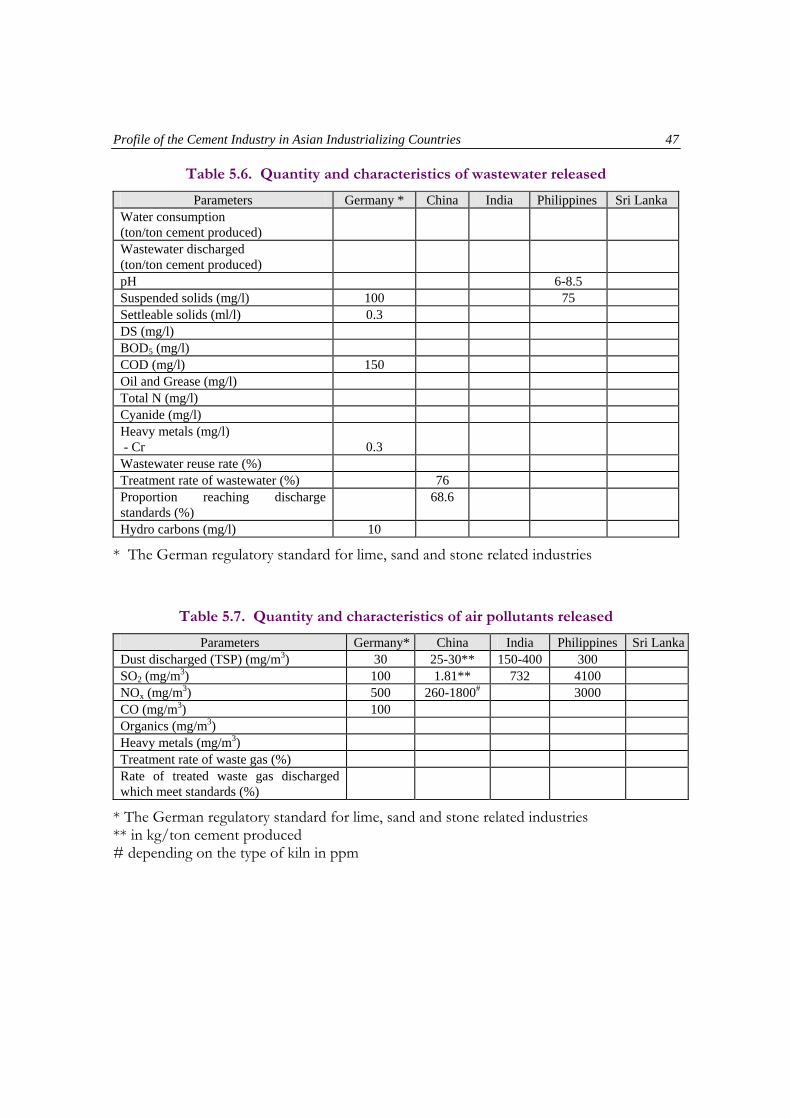
Profile of the Cement Industry in Asian Industrializing Countries 47
Table 5.6. Quantity and characteristics of wastewater released
Parameters Germany * China India Philippines Sri Lanka Water consumption (ton/ton cement produced)
Wastewater discharged (ton/ton cement produced)
pH 6-8.5 Suspended solids (mg/l) 100 75 Settleable solids (ml/l) 0.3 DS (mg/l) BOD5 (mg/l) COD (mg/l) 150 Oil and Grease (mg/l) Total N (mg/l) Cyanide (mg/l) Heavy metals (mg/l) - Cr
0.3
Wastewater reuse rate (%) Treatment rate of wastewater (%) 76 Proportion reaching discharge standards (%)
68.6
Hydro carbons (mg/l) 10
* The German regulatory standard for lime, sand and stone related industries
Table 5.7. Quantity and characteristics of air pollutants released
Parameters Germany* China India Philippines Sri LankaDust discharged (TSP) (mg/m3) 30 25-30** 150-400 300 SO2 (mg/m3) 100 1.81** 732 4100 NOx (mg/m3) 500 260-1800# 3000 CO (mg/m3) 100 Organics (mg/m3) Heavy metals (mg/m3) Treatment rate of waste gas (%) Rate of treated waste gas discharged which meet standards (%)
* The German regulatory standard for lime, sand and stone related industries ** in kg/ton cement produced # depending on the type of kiln in ppm

48 Technology, Energy Efficiency and Environmental Externalities of the Cement Industry
5.5 Potential for Energy Efficiency Improvements
5.5.1 Measures on the structure of the industry
One of the major energy conservation measures in Japan was the closing of small and medium sized low productivity plants. As a capital intensive industry, the closure of all small plants and installation of large mills is not a feasible solution for developing countries. However, the future expansion of mills should be done in a planned manner. The growth of inefficient small mills should be restricted, especially in China, to achieve the lower specific energy consumption of the industry. Since the cement industry requires great amount of raw materials, the transportation cost and geographical condition of a particular country would greatly influence the selection of a mill capacity. The future mills should be equipped with energy efficient technologies. The privatization of some inefficient public mills could also help to improve the energy efficiency of the cement industry in developing countries. 5.5.2 Potential of energy conservation measures
The present standard of a modern energy efficient cement plant in developed countries consists of the following process technologies:
- raw meal preparation using roller presses and/or vertical mills with high efficiency separators and with dryer system based on heat recovery from the cyclone tower.
- clinker burning in a short rotary kiln with 5-6 stages preheater cyclone towers and precalciner. Clinker heat should be recovered as secondary and tertiary preheated combustion air for the kiln and the precalciner respectively.
- cooling of clinker in a grate cooler. - grinding of clinker in a modern semi-finish or finish system consisting of roller
presses, high efficiency separator and a final ball mill. As horizontal technologies, the use of low grade fuel, higher level of waste heat recovery and cogeneration can be seen in a modern cement mill. Therefore, the potential of energy savings can be estimated by assuming that all the facilities would be upgraded to the best available technologies mentioned above. However, the applications of new and energy efficient technologies are site specific and detail feasibility studies should be carried out on a case by case basis. The potential of major energy conservation measures for the countries under this study are given in Table 5.8.
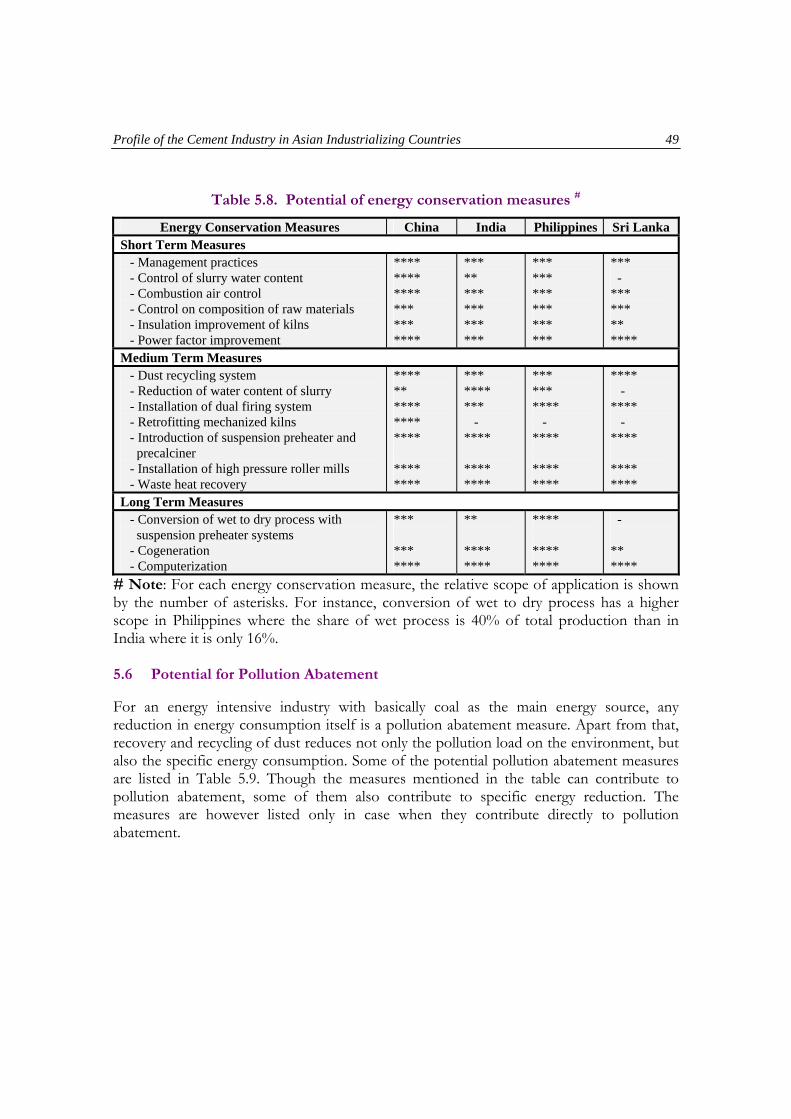
Profile of the Cement Industry in Asian Industrializing Countries 49
Table 5.8. Potential of energy conservation measures #
Energy Conservation Measures China India Philippines Sri Lanka Short Term Measures
- Management practices - Control of slurry water content - Combustion air control - Control on composition of raw materials - Insulation improvement of kilns - Power factor improvement
**** **** **** *** *** ****
*** ** *** *** *** ***
*** *** *** *** *** ***
*** - *** *** ** ****
Medium Term Measures - Dust recycling system - Reduction of water content of slurry - Installation of dual firing system - Retrofitting mechanized kilns - Introduction of suspension preheater and precalciner - Installation of high pressure roller mills - Waste heat recovery
**** ** **** **** **** **** ****
*** **** *** - **** **** ****
*** *** **** - **** **** ****
**** - **** - **** **** ****
Long Term Measures - Conversion of wet to dry process with suspension preheater systems - Cogeneration - Computerization
*** *** ****
** **** ****
**** **** ****
- ** ****
# Note: For each energy conservation measure, the relative scope of application is shown by the number of asterisks. For instance, conversion of wet to dry process has a higher scope in Philippines where the share of wet process is 40% of total production than in India where it is only 16%. 5.6 Potential for Pollution Abatement
For an energy intensive industry with basically coal as the main energy source, any reduction in energy consumption itself is a pollution abatement measure. Apart from that, recovery and recycling of dust reduces not only the pollution load on the environment, but also the specific energy consumption. Some of the potential pollution abatement measures are listed in Table 5.9. Though the measures mentioned in the table can contribute to pollution abatement, some of them also contribute to specific energy reduction. The measures are however listed only in case when they contribute directly to pollution abatement.
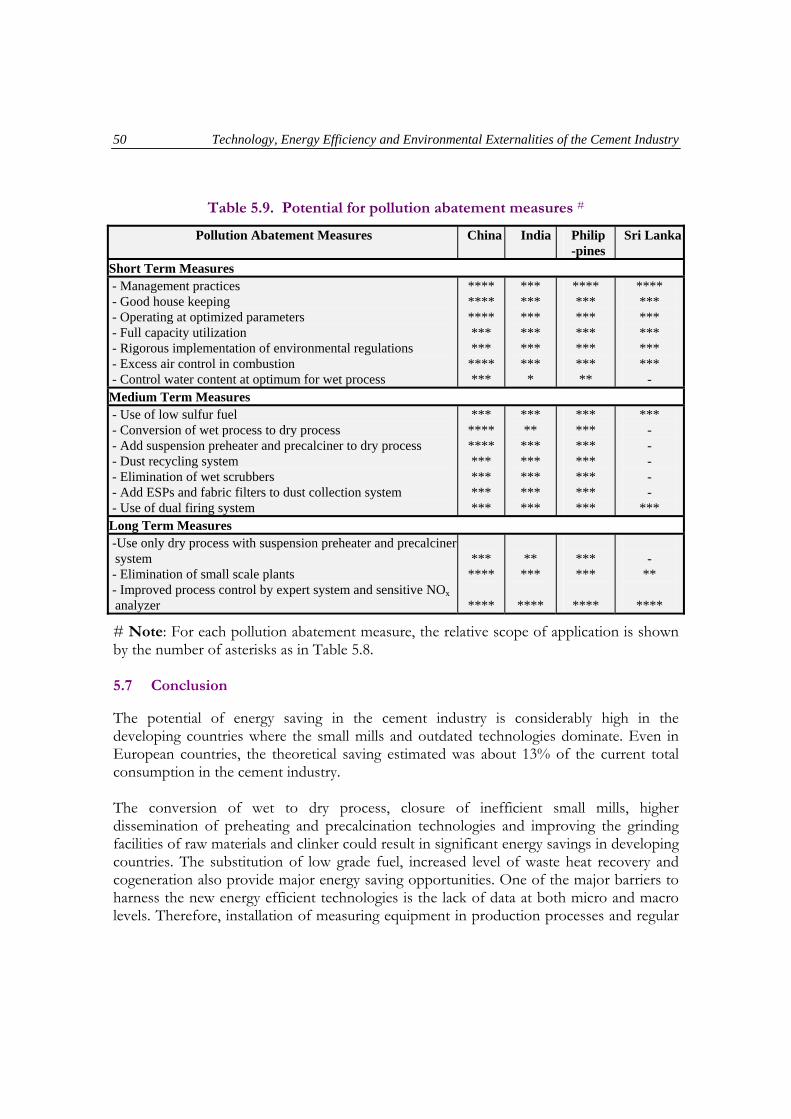
50 Technology, Energy Efficiency and Environmental Externalities of the Cement Industry
Table 5.9. Potential for pollution abatement measures #
Pollution Abatement Measures China India Philip -pines
Sri Lanka
Short Term Measures - Management practices - Good house keeping - Operating at optimized parameters - Full capacity utilization - Rigorous implementation of environmental regulations - Excess air control in combustion - Control water content at optimum for wet process
**** **** **** *** ***
**** ***
*** *** *** *** *** ***
*
**** *** *** *** *** *** **
**** *** *** *** *** ***
- Medium Term Measures - Use of low sulfur fuel - Conversion of wet process to dry process - Add suspension preheater and precalciner to dry process - Dust recycling system - Elimination of wet scrubbers - Add ESPs and fabric filters to dust collection system - Use of dual firing system
*** **** **** *** *** *** ***
*** **
*** *** *** *** ***
*** *** *** *** *** *** ***
*** - - - - -
*** Long Term Measures -Use only dry process with suspension preheater and precalciner system
- Elimination of small scale plants - Improved process control by expert system and sensitive NOx analyzer
***
****
****
**
***
****
*** ***
****
-
**
****
# Note: For each pollution abatement measure, the relative scope of application is shown by the number of asterisks as in Table 5.8. 5.7 Conclusion
The potential of energy saving in the cement industry is considerably high in the developing countries where the small mills and outdated technologies dominate. Even in European countries, the theoretical saving estimated was about 13% of the current total consumption in the cement industry. The conversion of wet to dry process, closure of inefficient small mills, higher dissemination of preheating and precalcination technologies and improving the grinding facilities of raw materials and clinker could result in significant energy savings in developing countries. The substitution of low grade fuel, increased level of waste heat recovery and cogeneration also provide major energy saving opportunities. One of the major barriers to harness the new energy efficient technologies is the lack of data at both micro and macro levels. Therefore, installation of measuring equipment in production processes and regular

Profile of the Cement Industry in Asian Industrializing Countries 51
acquisition and updating of data would be the first step to improve the energy efficiency of the cement industry. As far as the national authorities are concerned, the required cooperative actions to improve energy efficiency in cement industry are the followings: provide information about projects where new energy efficient technologies have been implemented successfully; create a better condition for technology transfer from industrialized countries and set up dissemination strategies for each efficient technology.
52 Technology, Energy Efficiency and Environmental Externalities of the Cement Industry
6. PROFILE OF THE CEMENT INDUSTRY IN SELECTED ASIAN COUNTRIES
This section evaluates the current status and technological trajectory of the cement industries in four Asian countries, namely China, India, the Philippines and Sri Lanka. 6.1 COUNTRY REPORT: CHINA
6.1.1 Introduction
China is a developing country with a huge population. In recent years, China’s economy and the people’s living standard have increased very rapidly. The high economic growth caused a high demand for energy and the primary energy consumption increased by 85% from 1985 to 1993, with an average annual growth rate of 4.9%. The building material industry is known as a big energy consumer and its total energy consumption has amounted to 119 million tce, representing over 10% of the total energy consumption of China in 1990. The energy consumption by cement manufacturing is about 35% of the building material industry. It has high energy intensity per unit product and low energy efficiency of equipment. The discharge of waste gas, residues and water is 910,500 million m3, 3.09 million tons (Mt) and 252.56 Mt, respectively. It is very important to improve production technologies and aggrandize energy efficiency for the reduction of environmental pollution. 6.1.2 Technological trajectory of China’s cement industry
China’s first cement plant was built in 1889 just 18 years after the first Portland cement plant of the USA started its operations. The manual shaft kiln was adopted in the plant. By the 1930s, most existing plants with waste heat recovery generation kilns moved in from Japan, and by the 1950s, the wet process (identified with the technological development of the world at that time) had been adopted in most cement plants. A small number of cement plants adopted the Libor kilns, also considered to be an advanced technology. Meanwhile, the country started to manufacture complete sets of wet process equipment for export to other countries. It is said that by the end of the first Five-Year planning period, China was at par with the developed countries in terms of technology in the cement industry. In the international level, the technology for suspension preheating (SP) kilns was being perfected. Two difficult problems, the adaptability of strong basic material and the recovery of waste dust, had been solved with the new technology. SP kilns with high thermal efficiency was developed and the first large SP kiln which produced 1800 tons clinker per day was built up in 1965. This had a larger capacity than the long wet kiln developed in 1970. From then on, the dry process has been adopted in the production of cement, and due to the keen competition in the cement industry in the 1970s, the mechanized shaft kilns in the developed countries were finally eliminated.

Profile of the Cement Industry in China 53
As opposed to the technological trends of cement production in the first world, China had been developing small cement plants with shaft kilns since the second Five-Year Plan, and most of these were manually-operated shaft kilns. The technological gap between the advanced nations of the world and China became increasingly wider. Brought about by this situation, the Chinese government has done a lot both in the development of the building material industry and improvement of energy efficiency since the 1980s. After 1985, China has become the biggest cement producing country in the world. From the following tables one can follow the development trajectory of the country’s cement industry and its characteristics. 6.1.2.1 Higher growth rate of production
Tables 6.1.1 and 6.1.2 show the GDP and cement production growth rates, respectively. The cement production grew at an average rate of about 11% from 1985 to 1993, higher than that of the GDP (about 9.2%).
Table 6.1.1. The index and growth rate of GDP from 1978 to 1993 in China
Year GDP Index GDP growth rate (%) Year GDP Index GDP growth rate (%)1978 100.0 1988 251.3 11.4 1979 107.6 7.6 1989 262.2 4.3 1980 116.0 7.8 1990 272.4 3.9 1985 187.4 12.9 1991 294.2 8.0 1986 203.3 8.5 1992 334.2 13.6 1987 225.6 11.0 1993 379.0 13.4
Source: Statistical Yearbook of China, 1994 (The growth rate is calculated from the index)
Table 6.1.2. Cement production (Mt)
Year Production Growth rate (%) Year Production Growth rate (%) 1960 15.65 1987 186.25 12.06 1965 16.34 4.4 1988 210.14 12.83 1970 25.75 57.6 1989 210.29 0.07 1975 46.26 79.7 1990 209.71 -0.3 1980 79.86 72.6 1991 252.61 20.46 1985 159.55 99.8 1992 308.22 22.01 1986 166.06 4.08 1993 367.88 19.36
Source: Statistical Yearbook of China, 1994
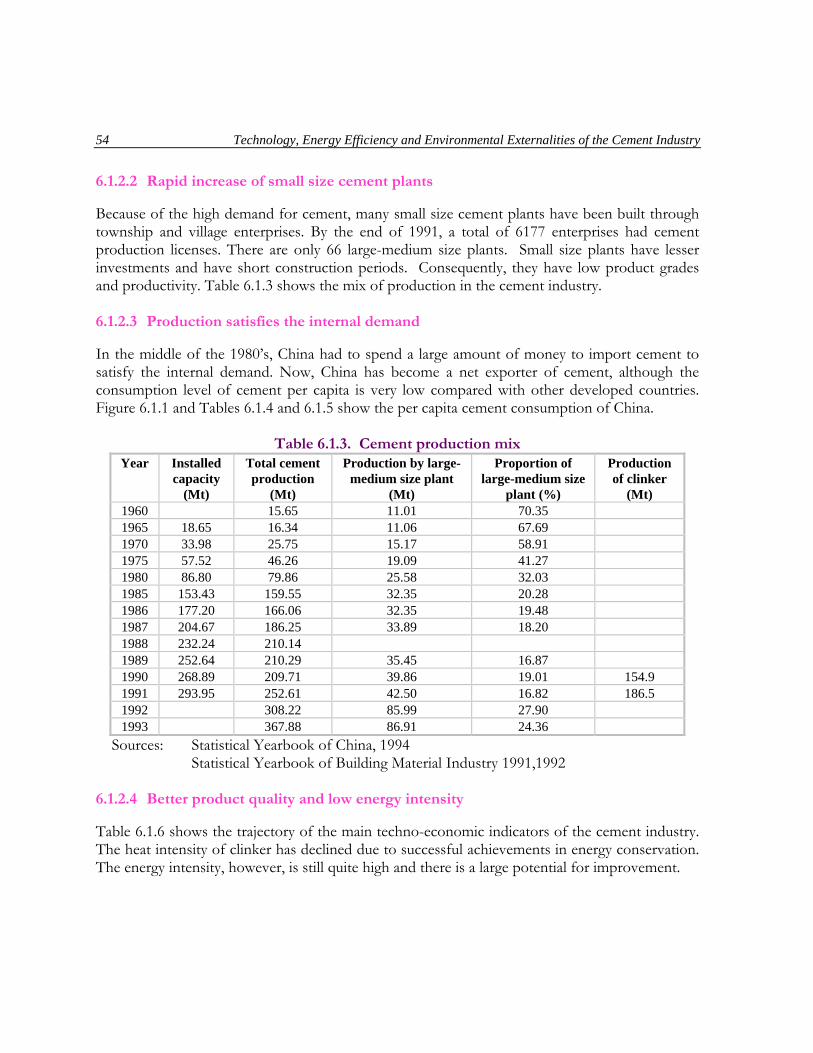
54 Technology, Energy Efficiency and Environmental Externalities of the Cement Industry
6.1.2.2 Rapid increase of small size cement plants
Because of the high demand for cement, many small size cement plants have been built through township and village enterprises. By the end of 1991, a total of 6177 enterprises had cement production licenses. There are only 66 large-medium size plants. Small size plants have lesser investments and have short construction periods. Consequently, they have low product grades and productivity. Table 6.1.3 shows the mix of production in the cement industry. 6.1.2.3 Production satisfies the internal demand
In the middle of the 1980’s, China had to spend a large amount of money to import cement to satisfy the internal demand. Now, China has become a net exporter of cement, although the consumption level of cement per capita is very low compared with other developed countries. Figure 6.1.1 and Tables 6.1.4 and 6.1.5 show the per capita cement consumption of China.
Table 6.1.3. Cement production mix Year Installed
capacity (Mt)
Total cement production
(Mt)
Production by large-medium size plant
(Mt)
Proportion of large-medium size
plant (%)
Production of clinker
(Mt) 1960 15.65 11.01 70.35 1965 18.65 16.34 11.06 67.69 1970 33.98 25.75 15.17 58.91 1975 57.52 46.26 19.09 41.27 1980 86.80 79.86 25.58 32.03 1985 153.43 159.55 32.35 20.28 1986 177.20 166.06 32.35 19.48 1987 204.67 186.25 33.89 18.20 1988 232.24 210.14 1989 252.64 210.29 35.45 16.87 1990 268.89 209.71 39.86 19.01 154.9 1991 293.95 252.61 42.50 16.82 186.5 1992 308.22 85.99 27.90 1993 367.88 86.91 24.36
Sources: Statistical Yearbook of China, 1994 Statistical Yearbook of Building Material Industry 1991,1992 6.1.2.4 Better product quality and low energy intensity
Table 6.1.6 shows the trajectory of the main techno-economic indicators of the cement industry. The heat intensity of clinker has declined due to successful achievements in energy conservation. The energy intensity, however, is still quite high and there is a large potential for improvement.
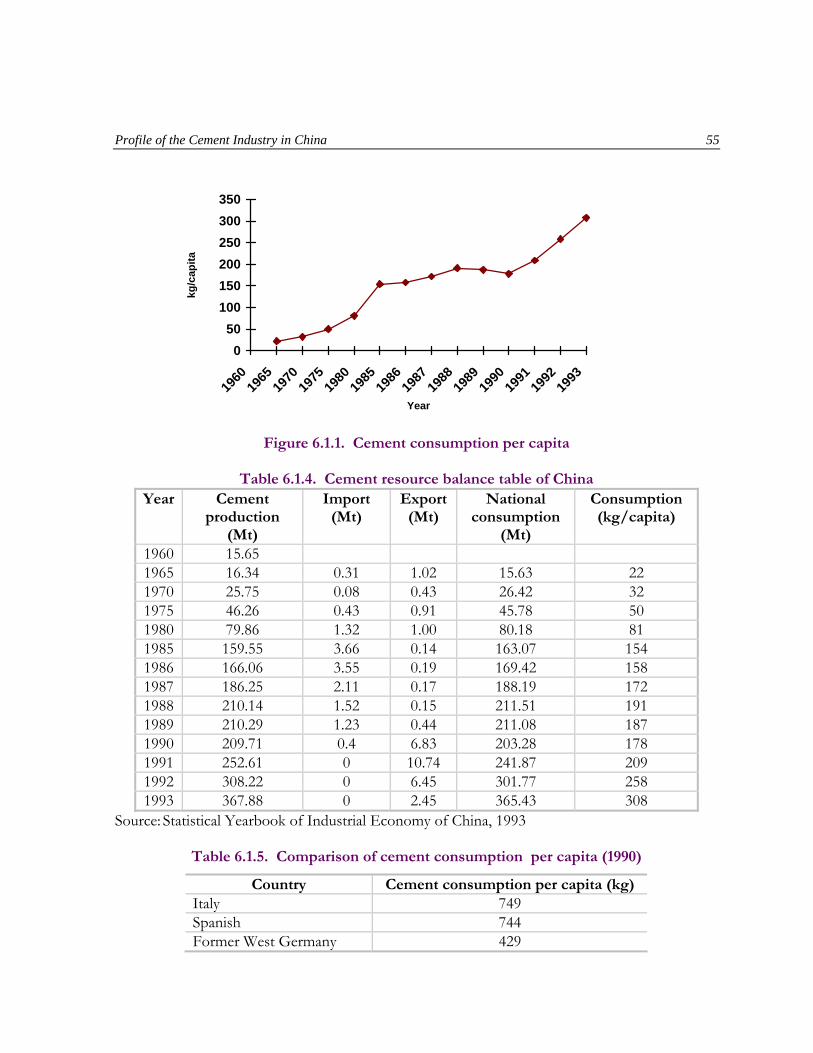
Profile of the Cement Industry in China 55
050
100150200250300350
1960
1965
1970
1975
1980
1985
1986
1987
1988
1989
1990
1991
1992
1993
Year
kg/c
apita
Figure 6.1.1. Cement consumption per capita
Table 6.1.4. Cement resource balance table of China
Year Cement production
(Mt)
Import (Mt)
Export (Mt)
National consumption
(Mt)
Consumption (kg/capita)
1960 15.65 1965 16.34 0.31 1.02 15.63 22 1970 25.75 0.08 0.43 26.42 32 1975 46.26 0.43 0.91 45.78 50 1980 79.86 1.32 1.00 80.18 81 1985 159.55 3.66 0.14 163.07 154 1986 166.06 3.55 0.19 169.42 158 1987 186.25 2.11 0.17 188.19 172 1988 210.14 1.52 0.15 211.51 191 1989 210.29 1.23 0.44 211.08 187 1990 209.71 0.4 6.83 203.28 178 1991 252.61 0 10.74 241.87 209 1992 308.22 0 6.45 301.77 258 1993 367.88 0 2.45 365.43 308
Source: Statistical Yearbook of Industrial Economy of China, 1993
Table 6.1.5. Comparison of cement consumption per capita (1990)
Country Cement consumption per capita (kg) Italy 749 Spanish 744 Former West Germany 429
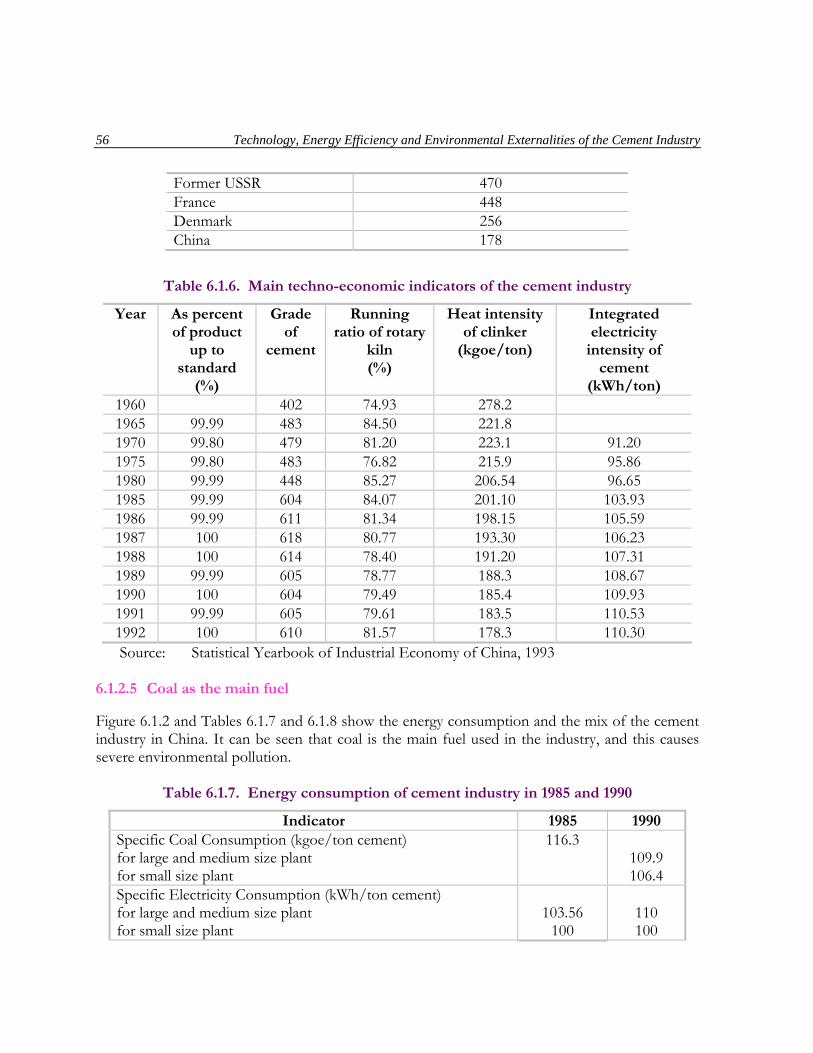
56 Technology, Energy Efficiency and Environmental Externalities of the Cement Industry
Former USSR 470 France 448 Denmark 256 China 178
Table 6.1.6. Main techno-economic indicators of the cement industry
Year As percent of product
up to standard
(%)
Grade of
cement
Running ratio of rotary
kiln (%)
Heat intensity of clinker
(kgoe/ton)
Integrated electricity
intensity of cement
(kWh/ton) 1960 402 74.93 278.2 1965 99.99 483 84.50 221.8 1970 99.80 479 81.20 223.1 91.20 1975 99.80 483 76.82 215.9 95.86 1980 99.99 448 85.27 206.54 96.65 1985 99.99 604 84.07 201.10 103.93 1986 99.99 611 81.34 198.15 105.59 1987 100 618 80.77 193.30 106.23 1988 100 614 78.40 191.20 107.31 1989 99.99 605 78.77 188.3 108.67 1990 100 604 79.49 185.4 109.93 1991 99.99 605 79.61 183.5 110.53 1992 100 610 81.57 178.3 110.30
Source: Statistical Yearbook of Industrial Economy of China, 1993 6.1.2.5 Coal as the main fuel
Figure 6.1.2 and Tables 6.1.7 and 6.1.8 show the energy consumption and the mix of the cement industry in China. It can be seen that coal is the main fuel used in the industry, and this causes severe environmental pollution.
Table 6.1.7. Energy consumption of cement industry in 1985 and 1990
Indicator 1985 1990 Specific Coal Consumption (kgoe/ton cement) for large and medium size plant for small size plant
116.3
109.9 106.4
Specific Electricity Consumption (kWh/ton cement) for large and medium size plant for small size plant
103.56
100
110 100
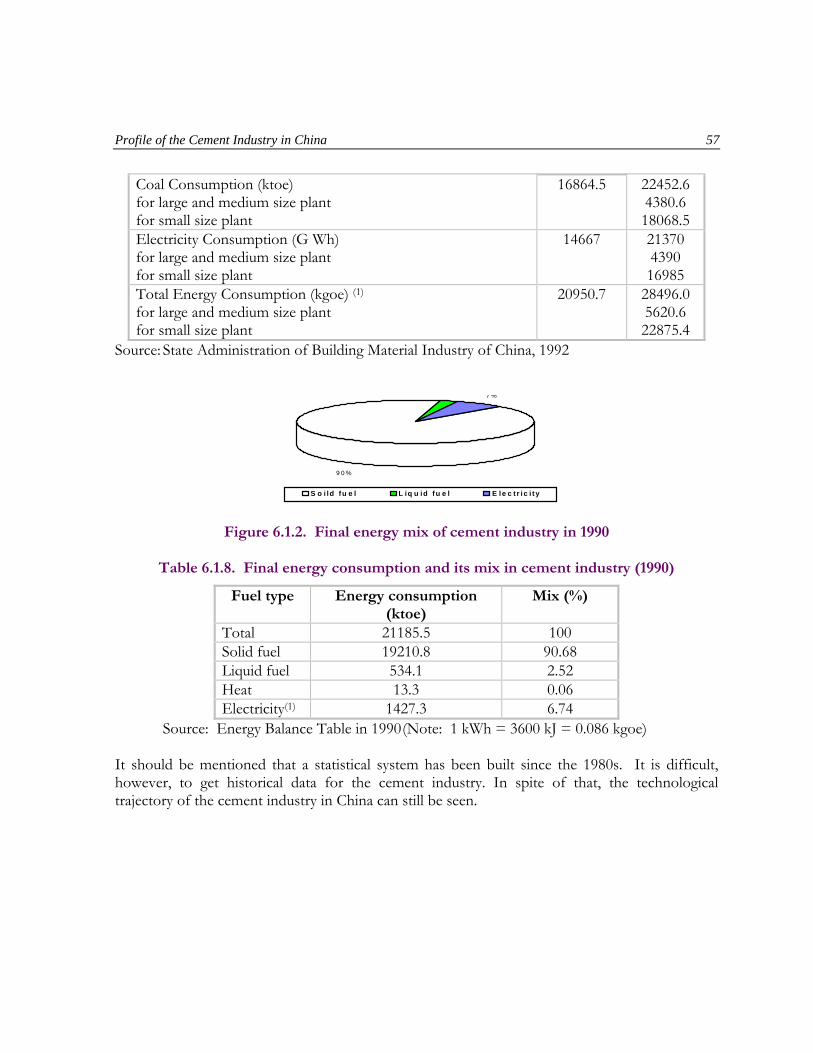
Profile of the Cement Industry in China 57
Coal Consumption (ktoe) for large and medium size plant for small size plant
16864.5
22452.6 4380.6 18068.5
Electricity Consumption (G Wh) for large and medium size plant for small size plant
14667
21370 4390 16985
Total Energy Consumption (kgoe) (1)
for large and medium size plant for small size plant
20950.7 28496.0 5620.6 22875.4
Source: State Administration of Building Material Industry of China, 1992
9 0 %
% 7 %
S o i ld fu e l L iq u id fu e l E le c t r ic i ty
Figure 6.1.2. Final energy mix of cement industry in 1990
Table 6.1.8. Final energy consumption and its mix in cement industry (1990)
Fuel type Energy consumption (ktoe)
Mix (%)
Total 21185.5 100 Solid fuel 19210.8 90.68 Liquid fuel 534.1 2.52 Heat 13.3 0.06 Electricity(1) 1427.3 6.74
Source: Energy Balance Table in 1990 (Note: 1 kWh = 3600 kJ = 0.086 kgoe) It should be mentioned that a statistical system has been built since the 1980s. It is difficult, however, to get historical data for the cement industry. In spite of that, the technological trajectory of the cement industry in China can still be seen.

58 Technology, Energy Efficiency and Environmental Externalities of the Cement Industry
6.1.3 Evolution of energy efficiency in the cement industry
Table 6.1.9 shows the energy intensity of cement manufacturing in selected countries.
Table 6.1.9. Comparison of specific energy consumption with developed countries
Country Year Heat intensity (kgoe/ton
clinker)
Electricity intensity
(kWh/ton cement)
Integrated energy intensity
(kgoe/ton cement)
Japan
1980 1985 1988 1990 1991
84.2 77.5 70.9 70.4 70.2
124 114 103
102.2 102.6
94.9 87.3 79.8 79.1 79.0
Former West Germany
1980 1988 1990
76.9 72.4 62.7
104 109 104
85.8 81.8 71.7
China (for large and medium size plant)
1980 1985 1988 1990
144.3 140.0 133.9 129.8
96.65 103.9 107.3 109.9
146.2 145.6 140.0 140.7
Source: State Administration of Building Material Industry of China, 1992 The reasons for the low energy efficiency can be identified in the following aspects: • Outdated production process in enterprises
Figure 6.1.3 shows the process mix of large and medium-size cement plants. The water content of mixing raw material is about 24-28% in the rotary kiln wet process, but it is only 7-14% in the dry process. A large amount of heat must be used for evaporating water, so the energy intensity of wet process is 30% higher than the dry process (Table 6.1.10). In some developed countries like Japan and the former West Germany, the wet process has already been eliminated in favor of the dry process.
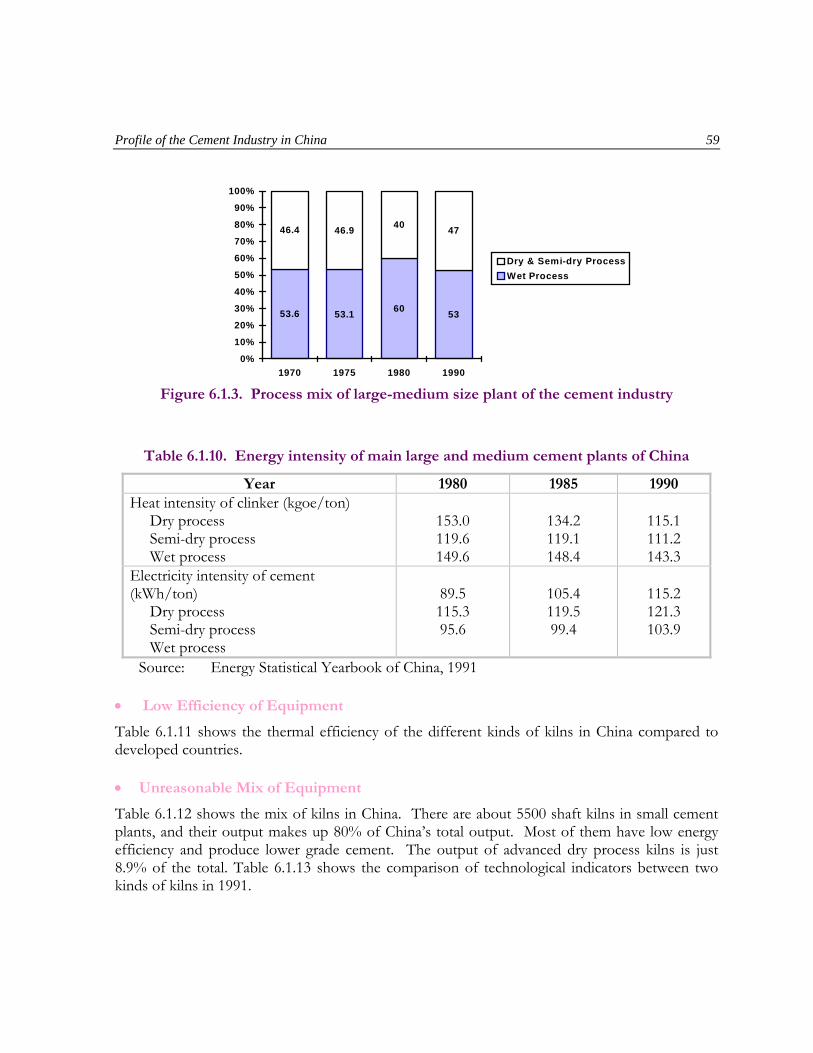
Profile of the Cement Industry in China 59
0%
10%
20%
30%
40%
50%
60%
70%
80%
90%
100%
1970 1975 1980 1990
53.6 53.1 60 53
46.9 40 4746.4
Dry & Semi-dry ProcessWet Process
Figure 6.1.3. Process mix of large-medium size plant of the cement industry
Table 6.1.10. Energy intensity of main large and medium cement plants of China
Year 1980 1985 1990 Heat intensity of clinker (kgoe/ton) Dry process Semi-dry process Wet process
153.0 119.6 149.6
134.2 119.1 148.4
115.1 111.2 143.3
Electricity intensity of cement (kWh/ton) Dry process Semi-dry process Wet process
89.5 115.3 95.6
105.4 119.5 99.4
115.2 121.3 103.9
Source: Energy Statistical Yearbook of China, 1991 • Low Efficiency of Equipment
Table 6.1.11 shows the thermal efficiency of the different kinds of kilns in China compared to developed countries. • Unreasonable Mix of Equipment
Table 6.1.12 shows the mix of kilns in China. There are about 5500 shaft kilns in small cement plants, and their output makes up 80% of China’s total output. Most of them have low energy efficiency and produce lower grade cement. The output of advanced dry process kilns is just 8.9% of the total. Table 6.1.13 shows the comparison of technological indicators between two kinds of kilns in 1991.
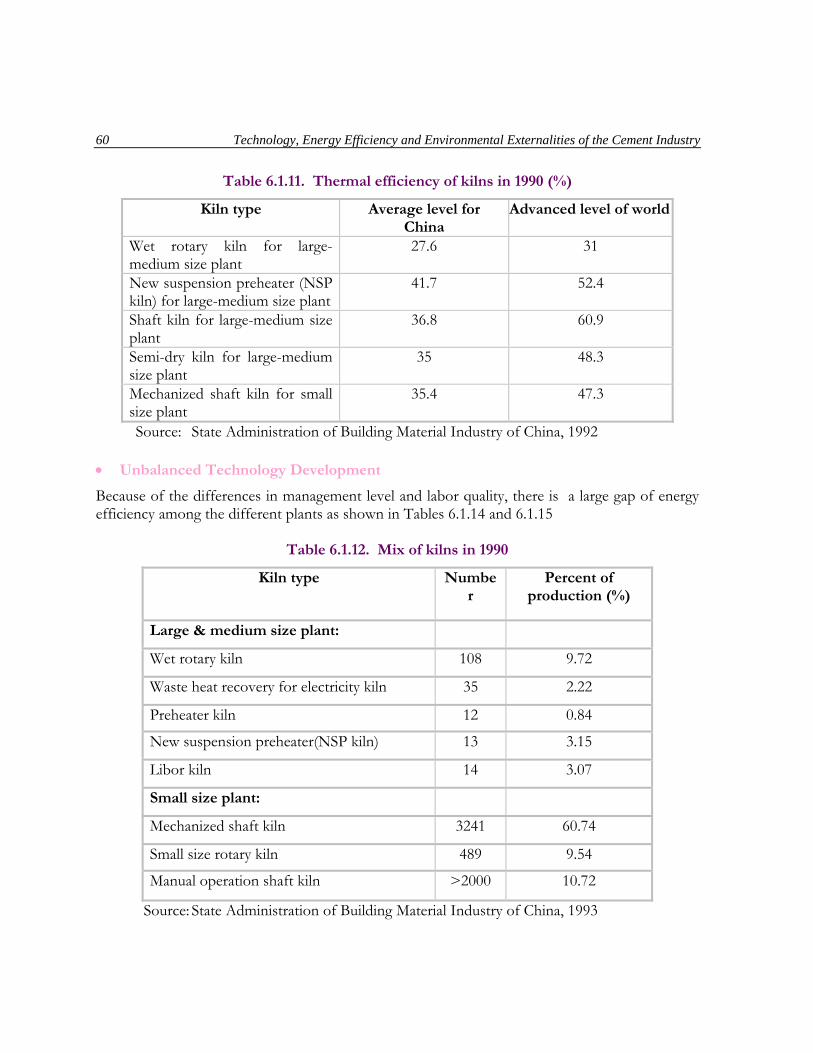
60 Technology, Energy Efficiency and Environmental Externalities of the Cement Industry
Table 6.1.11. Thermal efficiency of kilns in 1990 (%)
Kiln type Average level for China
Advanced level of world
Wet rotary kiln for large-medium size plant
27.6 31
New suspension preheater (NSP kiln) for large-medium size plant
41.7 52.4
Shaft kiln for large-medium size plant
36.8 60.9
Semi-dry kiln for large-medium size plant
35 48.3
Mechanized shaft kiln for small size plant
35.4 47.3
Source: State Administration of Building Material Industry of China, 1992 • Unbalanced Technology Development
Because of the differences in management level and labor quality, there is a large gap of energy efficiency among the different plants as shown in Tables 6.1.14 and 6.1.15
Table 6.1.12. Mix of kilns in 1990
Kiln type Number
Percent of production (%)
Large & medium size plant:
Wet rotary kiln 108 9.72
Waste heat recovery for electricity kiln 35 2.22
Preheater kiln 12 0.84
New suspension preheater(NSP kiln) 13 3.15
Libor kiln 14 3.07
Small size plant:
Mechanized shaft kiln 3241 60.74
Small size rotary kiln 489 9.54
Manual operation shaft kiln >2000 10.72
Source: State Administration of Building Material Industry of China, 1993

Profile of the Cement Industry in China 61
• Small Scale Equipment
Due to the economies of scale, the use of advanced technologies to improve energy efficiency may not be beneficial to the small scale firms. Table 6.1.16 shows the difference of capacity per kiln between China and Japan. Table 6.1.13. Comparison of technological indicators between two kinds of kilns in 1991
(capacity > 88 k ton/kiln)
Revolving kiln for Large-medium size
plant
Vertical kiln for Medium-small size
plant
Average
Qualified ratio of product (%) 99.99 99.99 99.99 Clinker grade (#) 595 569 580 Cement grade (#) 476 428 449 Energy use (toe/ton cement) 143.7 114.0 127.0 Coal use in clinker making (toe/ton clinker) 132.3 103.5 116.0 Electricity use (kWh/ton cement) 111.78 91.17 99.96 Kiln number (sets) 435 1438 Production per hour (ton/hour) 5705.2 7744.0 Running ratio (%) 85.04 68.97 Productivity (ton/employee) 211.47 161.79 180.21
Source: Statistical Reference of National Building Material Industry, 1991
Table 6.1.14. Specific energy use of different kilns in China (kgoe/ton clinker)
Kiln type Average level Advanced level Gap Wet rotary kiln 152.2 145.4 6.8 Waste heat recovery generator kiln
174.5 139.0 35
Shaft-preheater kiln 160.7 153.9 6.8 Cyclone preheater 186.1 157.7 28.4 Suspension preheater kiln 188.21 162.72 25.48 Inner hollow kiln 293.45 230.64 62.81 Libor kiln 211.05 188.81 22.24 Mechanized kiln 199.81 142.65 57.16 Semi-mechanized kiln 229.71 147.58 82.13 Manual operation kiln 283.48 208.70 74.78
Source: State Administration of Building Material Industry of China, 1993 6.1.4 Environmental externalities of technological development
An investigation of industrial pollution in 1985 identified 13 industrial sub-sectors as major sources of pollution, with individual waste discharges of over 100 Bm3. The rate of total waste gas emissions amounted to 6128.32 Bm3/year, or 88.4% of the national total waste gas emissions (Table 6.1.18). Among these industrial sectors, the building materials industry ranks second after
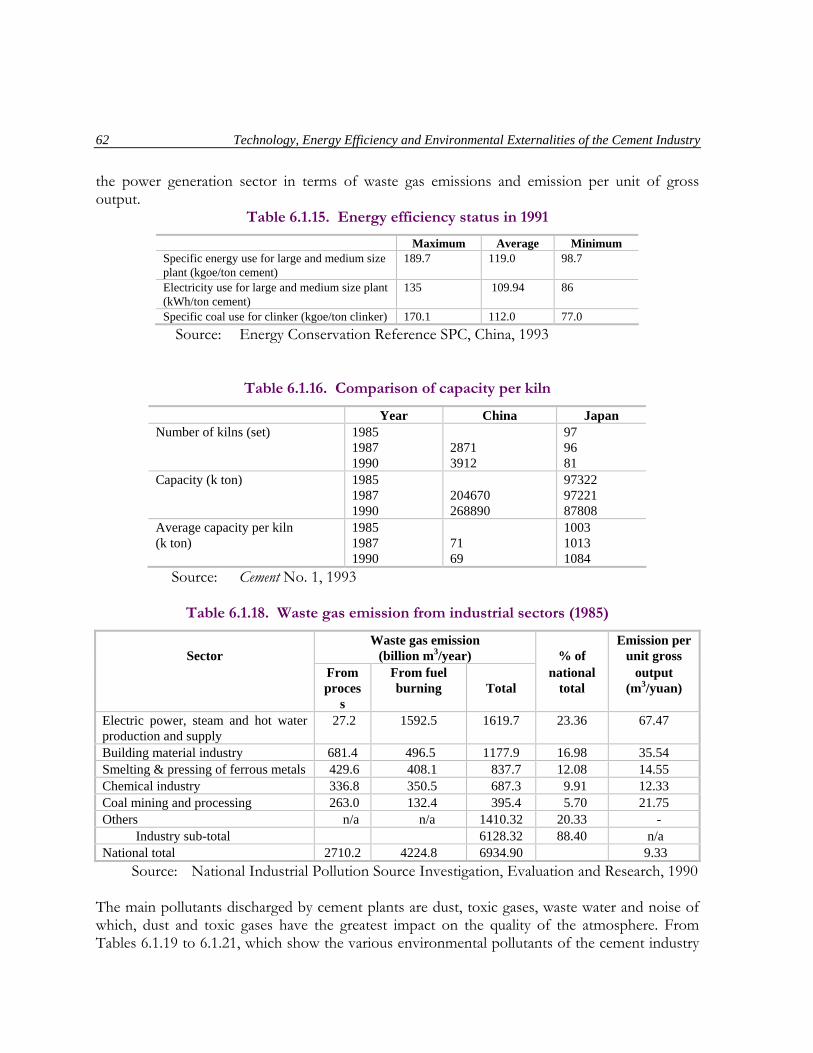
62 Technology, Energy Efficiency and Environmental Externalities of the Cement Industry
the power generation sector in terms of waste gas emissions and emission per unit of gross output.
Table 6.1.15. Energy efficiency status in 1991
Maximum Average Minimum Specific energy use for large and medium size plant (kgoe/ton cement)
189.7 119.0 98.7
Electricity use for large and medium size plant (kWh/ton cement)
135 109.94 86
Specific coal use for clinker (kgoe/ton clinker) 170.1 112.0 77.0 Source: Energy Conservation Reference SPC, China, 1993
Table 6.1.16. Comparison of capacity per kiln
Year China Japan Number of kilns (set) 1985
1987 1990
2871 3912
97 96 81
Capacity (k ton) 1985 1987 1990
204670 268890
97322 97221 87808
Average capacity per kiln (k ton)
1985 1987 1990
71 69
1003 1013 1084
Source: Cement No. 1, 1993
Table 6.1.18. Waste gas emission from industrial sectors (1985)
Sector
Waste gas emission (billion m3/year)
% of
Emission per unit gross
From proces
s
From fuel burning
Total
national total
output (m3/yuan)
Electric power, steam and hot water production and supply
27.2 1592.5 1619.7 23.36 67.47
Building material industry 681.4 496.5 1177.9 16.98 35.54 Smelting & pressing of ferrous metals 429.6 408.1 837.7 12.08 14.55 Chemical industry 336.8 350.5 687.3 9.91 12.33 Coal mining and processing 263.0 132.4 395.4 5.70 21.75 Others n/a n/a 1410.32 20.33 - Industry sub-total 6128.32 88.40 n/a National total 2710.2 4224.8 6934.90 9.33
Source: National Industrial Pollution Source Investigation, Evaluation and Research, 1990 The main pollutants discharged by cement plants are dust, toxic gases, waste water and noise of which, dust and toxic gases have the greatest impact on the quality of the atmosphere. From Tables 6.1.19 to 6.1.21, which show the various environmental pollutants of the cement industry
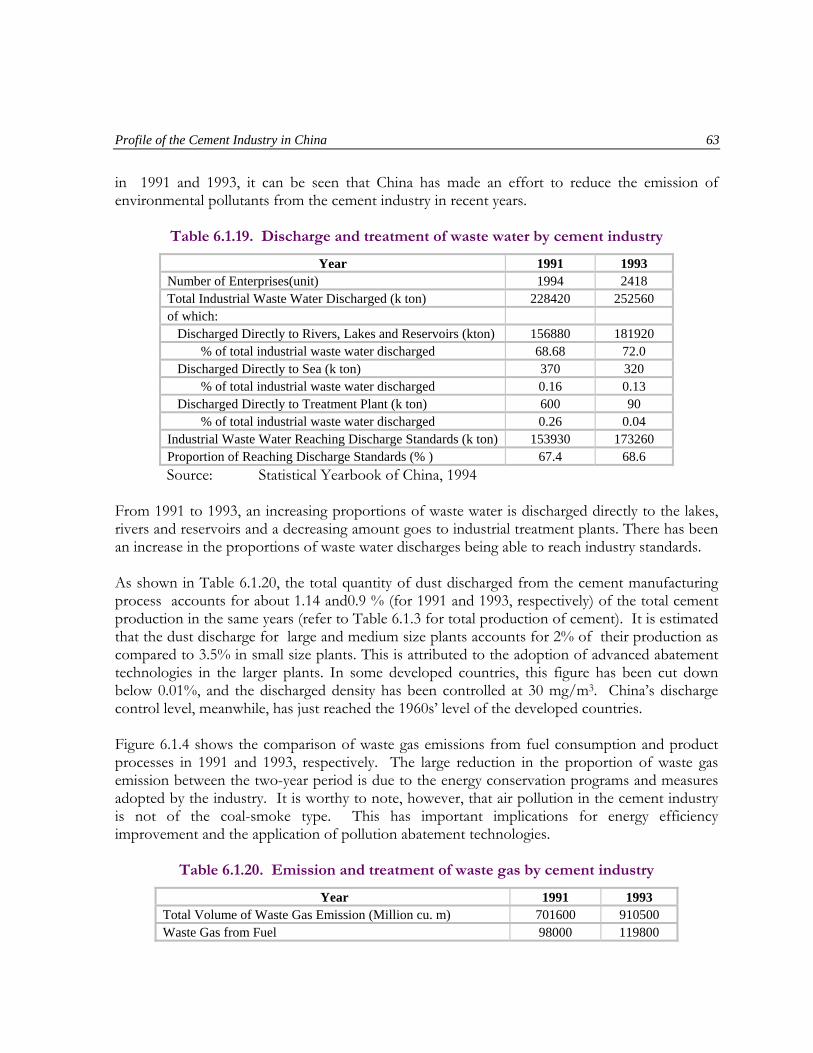
Profile of the Cement Industry in China 63
in 1991 and 1993, it can be seen that China has made an effort to reduce the emission of environmental pollutants from the cement industry in recent years.
Table 6.1.19. Discharge and treatment of waste water by cement industry
Year 1991 1993 Number of Enterprises(unit) 1994 2418 Total Industrial Waste Water Discharged (k ton) 228420 252560 of which: Discharged Directly to Rivers, Lakes and Reservoirs (kton) 156880 181920 % of total industrial waste water discharged 68.68 72.0 Discharged Directly to Sea (k ton) 370 320 % of total industrial waste water discharged 0.16 0.13 Discharged Directly to Treatment Plant (k ton) 600 90 % of total industrial waste water discharged 0.26 0.04 Industrial Waste Water Reaching Discharge Standards (k ton) 153930 173260 Proportion of Reaching Discharge Standards (% ) 67.4 68.6
Source: Statistical Yearbook of China, 1994 From 1991 to 1993, an increasing proportions of waste water is discharged directly to the lakes, rivers and reservoirs and a decreasing amount goes to industrial treatment plants. There has been an increase in the proportions of waste water discharges being able to reach industry standards. As shown in Table 6.1.20, the total quantity of dust discharged from the cement manufacturing process accounts for about 1.14 and0.9 % (for 1991 and 1993, respectively) of the total cement production in the same years (refer to Table 6.1.3 for total production of cement). It is estimated that the dust discharge for large and medium size plants accounts for 2% of their production as compared to 3.5% in small size plants. This is attributed to the adoption of advanced abatement technologies in the larger plants. In some developed countries, this figure has been cut down below 0.01%, and the discharged density has been controlled at 30 mg/m3. China’s discharge control level, meanwhile, has just reached the 1960s’ level of the developed countries. Figure 6.1.4 shows the comparison of waste gas emissions from fuel consumption and product processes in 1991 and 1993, respectively. The large reduction in the proportion of waste gas emission between the two-year period is due to the energy conservation programs and measures adopted by the industry. It is worthy to note, however, that air pollution in the cement industry is not of the coal-smoke type. This has important implications for energy efficiency improvement and the application of pollution abatement technologies.
Table 6.1.20. Emission and treatment of waste gas by cement industry
Year 1991 1993 Total Volume of Waste Gas Emission (Million cu. m) 701600 910500 Waste Gas from Fuel 98000 119800

64 Technology, Energy Efficiency and Environmental Externalities of the Cement Industry
in which: Soot and Dust Removed 68800 88400 Removed Ratio (%) 70.2 73.8 Waste Gas in the Process of Production 603800 790600 in which: Gas Purified 404700 599800 Purified Ratio (%) 67.0 75.9 Proportion of Waste Gas from Fuel (%) 14.0 13.2 Proportion of Waste Gas from Process (%) 86.0 86.8 Industrial SO2 Discharged (ton) 560000 666703 Industrial SO2 Removed (ton) 30000 48373 SO2 Removed Ratio (%) 5.36 7.26 Industrial Soot Discharged (ton) 260000 392669 Industrial Soot Removed (ton) 470000 756125 Soot Removed Ratio (%) 64.38 65.82 Industrial Dust Discharged (ton) 2890000 3353936 Industrial Dust Removed (ton) 9220000 12193140 Dust Removed Ratio (%) 76.14 78.38
Source: Statistical Yearbook of China, 1994
Table 6.1.21. Production, use and treatment of waste residue in cement making
Year 1991 1993 Industrial Waste Residue Produced ( k ton) 2030 3090 Industrial Waste Residue Used ( k ton) 1610 2650 Industrial Waste Residue Stored ( k ton) 80 40 Industrial Waste Residue Handled ( k ton) 390 390 Industrial Waste Residue Discharged ( k ton) 80 100 Industrial Waste Residue Discharged ratio (%) 3.94 3.24 Total Volume of Industrial Waste Residue Accumulated (k ton) 19120 19270 Areas of Industrial Residue Dumps (k sq. m) 730 390
Source: Statistical Yearbook of China, 1994.
from Fuel 14%
from Process
86%
from Fuel 13%
from Process
87%
1991 1993
Figure 6.1.4. Proportion of waste gas emissions from fuel burning and processes From a study conducted in 1993, the pollution emission rates for different kilns from 259 firms were determined (Table 6.1.22). According to the type of kiln being employed, the quantity of pollutants contained in the exhaust gases vary. Table 6.1.23 shows the composition of NOX in exhausted gases from the different types of kilns.
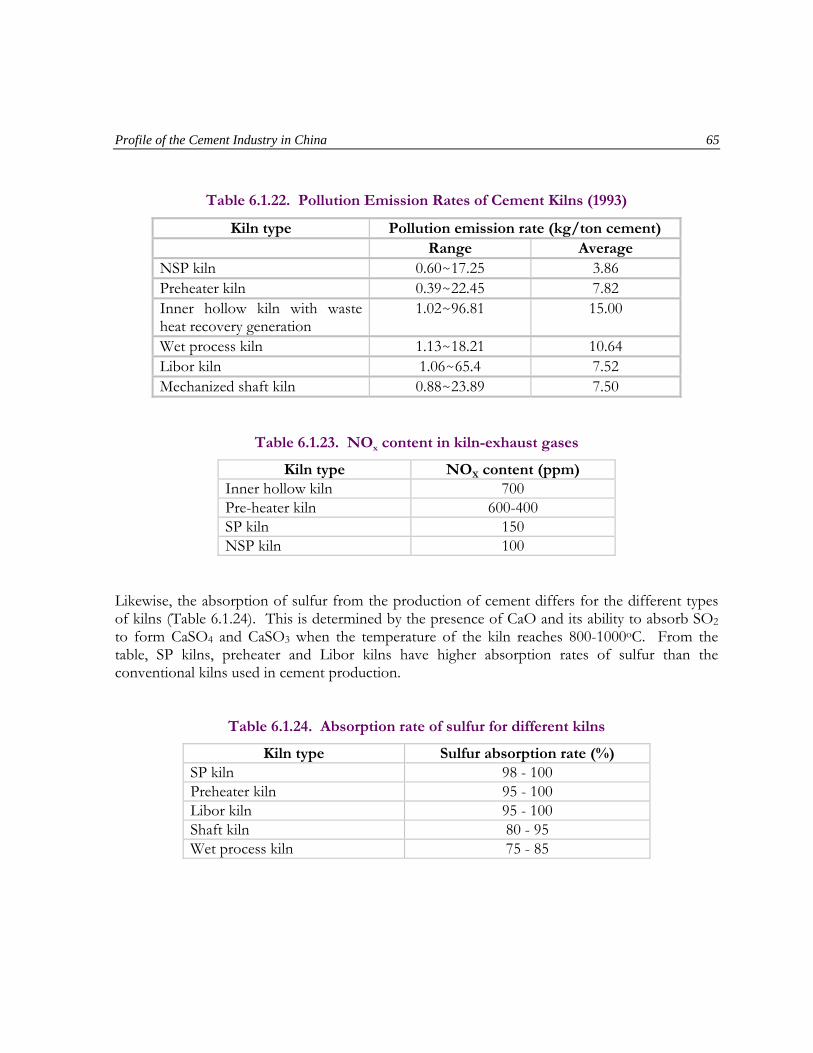
Profile of the Cement Industry in China 65
Table 6.1.22. Pollution Emission Rates of Cement Kilns (1993)
Kiln type Pollution emission rate (kg/ton cement) Range Average
NSP kiln 0.60~17.25 3.86 Preheater kiln 0.39~22.45 7.82 Inner hollow kiln with waste heat recovery generation
1.02~96.81 15.00
Wet process kiln 1.13~18.21 10.64 Libor kiln 1.06~65.4 7.52 Mechanized shaft kiln 0.88~23.89 7.50
Table 6.1.23. NOx content in kiln-exhaust gases
Kiln type NOX content (ppm) Inner hollow kiln 700 Pre-heater kiln 600-400 SP kiln 150 NSP kiln 100
Likewise, the absorption of sulfur from the production of cement differs for the different types of kilns (Table 6.1.24). This is determined by the presence of CaO and its ability to absorb SO2 to form CaSO4 and CaSO3 when the temperature of the kiln reaches 800-1000oC. From the table, SP kilns, preheater and Libor kilns have higher absorption rates of sulfur than the conventional kilns used in cement production.
Table 6.1.24. Absorption rate of sulfur for different kilns
Kiln type Sulfur absorption rate (%) SP kiln 98 - 100 Preheater kiln 95 - 100 Libor kiln 95 - 100 Shaft kiln 80 - 95 Wet process kiln 75 - 85

66 Technology, Energy Efficiency and Environmental Externalities of the Cement Industry
6.1.5 Potential for energy efficiency improvement and pollution abatement through technological changes
In order to estimate the potential for energy efficiency improvement and pollution abatement through technological changes, a case study was conducted on a large size plant in China. In March 1980, 2 wet process kilns with dimensions of ∅ 2.7/3.1×95m were built up with an annual clinker capacity of 170,000 tons. An equivalent of an annual cement capacity of 260,000 tons was generated. Expansion on the two kilns was carried out in 1983 and 1986, to enlarge the dimension of kilns to ∅ 3.3/2.7/3.1×95m. This led to an additional 46,000 tons of clinker, equivalent to 50,000 tons of cement. Thus, 310,000 tons of cement was produced. In 1987, a 600 ton/day wet process kiln (No. 3) was built, with dimensions of ∅ 3.5×145m. This produced 193,000 tons of clinker per year, equivalent to 300,000 tons of cement. The total annual clinker production generated by the enterprise was 410,000 tons, equivalent to 610,000 tons of cement. In order to change the old technology and improve on energy conservation and environmental protection measures, a two-step rehabilitation program has been made. This was based on the rules of comprehensive planning and multiple-step implementation issued by the State Administration of the Building Material Industry. The first-step rehabilitation adopted the hybrid method: the mixture of raw material slurry and raw powder after being dried and crushed, is fed together into a preheating system, for energy conservation and the balance of the main machines and equipment capacities. The energy conservation technical rehabilitation project on kilns 1 and 2 started in March 1993, and was finished in October 1994. After rehabilitation, the kiln with the two-step preheater and calciner was able to produce 1,000 tons of clinker per day, 300,000 tons of clinker per year, or an equivalent to 450,000 tons of cement. The energy conservation and environment protection technical rehabilitation project on kiln 3 will begin in 1996. One 2000 ton/day production line with a remarkably advanced technology for energy conservation and environmental protection is adopted for the project. The dimension of the kiln is ∅ 4×56m with a five-step preheater/ precalciner. It will result in an addition of 400,000 tons of clinker. After the project is commissioned, heat consumption can be reduced from 144.2 kgoe to 73.1 kgoe per ton of clinker (a reduction of 49.2%), electricity consumption can be reduced from 108 kWh to 105 kWh per ton of cement, or a reduction of 3 kWh. The dust emission can be reduced from 6.16 kg to 0.45 kg per ton of cement. NOx toxic gas emissions can be reduced from 2.01 kg to 0.875 kg per ton of clinker, and sulfur dioxide emissions can be reduced from 0.79 kg to 0.09 kg per ton of clinker. Table 6.1.25 shows the comparison between three typical technologies of cement production. It can be seen that energy conservation and pollution abatement can be realized through technological change.

Profile of the Cement Industry in China 67
Table 6.1.25. Comparison of techno-economic indicators in selected kilns
Process Wet process Semi-dry process Dry process Kiln type ∅3.5×145m long
kiln ∅3.5×54m with two-step preheater and calciner
∅4×56m with five-step preheater and precalciner
Capacity Clinker production (ton/day) Cement production (kton/year)
600 240
1000 360
2000 716
Heat consumption (kJ/kg clinker) (kgoe/ton clinker)
6068 145.6
4389 105
3093 73.5
Electricity use (kWh/ton cement) 108 109 105 Dust discharge (ton/year) From raw material to kiln From cement mill to packaging Total Discharge per ton of clinker (kg) Discharge per ton of cement (kg)
357.5 373.5 731 1.85 3.04
324.7 373.5 692.8 1.27 1.92
268.02 74.25
342.27 0.44 0.48
Toxic gas emission NOx (kg/day) (kg/ton clinker) SO2 (kg/day) (kg/ton clinker)
1209.6
2.01 474.48
0.79
1193.0
1.19 328.56 0.328
1750 0.875 180 0.09
Update investment (kyuan RMB) Average investment per ton of cement (yuan RMB/ton cement)
61885 171.9
132563 185.1
Shaft kilns in small cement plants are the main energy consumers in China. The average energy intensity of the cement clinker in mechanized shaft kilns is 115.5 kgoe/ton for the fuel and 99 kWh/ton for electricity. Another case study has been done to estimate the potential for energy conservation of shaft kilns. Table 6.1.26 shows the results of a typical shaft kiln testing. By using some effective measures such as pre-watering, pre-homogenizing, and so on, energy intensity can be reduced from 108.9 kgoe to 87.7 kgoe per ton of clinker. Table 6.1.27 shows a typical Libor kiln heat consumption. Besides the clinker reaction heat and heat consumption for material water evaporation (items 1 & 2, respectively), heat expenditures occur in the waste gas fan, stovepipe, kiln surface and cooler. Through effective measures, such as the use of advanced thermal insulation material, seal technology for calcine system, etc., energy intensity can be reduced from 138.70 kgoe to 113.74 kgoe per ton of clinker. From the foregoing discussion, it is evident that the energy-savings potential of China’s cement industry is quite considerable. The principal measures to consider are presented in Table 6.1.28 and as follows:

68 Technology, Energy Efficiency and Environmental Externalities of the Cement Industry
Table 6.1.26. Heat expenditures of shaft kiln
Expenditure item Heat expenditure (kgoe/ton clinker)
As percent of total (%)
1. Clinker reaction heat 36.74 33.74 2. Heat consumption for material water evaporation 16.92 15.54 3. Heat carried off by clinker cooler 3.48 3.2 4. Heat carried off by waste gas fan 12.18 11.18 5. Heat lost from stovepipe 2.22 2.04 6. Heat carried off by incomplete burning 29.34 26.95 7. Heat lost from surface of kiln 6.03 5.54 8. Heat carried off by cooling water 1.03 0.95 9. Others 0.94 0.86 Total 108.90 100
Table 6.1.27. Heat expenditures of libor kiln
Expenditure item Heat expenditure (kgoe/ton clinker)
As percent of total (%)
1. Clinker reaction heat 37.75 27.2 2. Heat consumption for material water evaporation 13.27 9.6 3. Heat carried off by clinker cooler 3.27 2.4 4. Heat carried off by waste gas fan 30.21 21.8 5. Heat lost from stovepipe 15.21 11.0 6. Heat carried off by CO emission 0.36 0.2 7. Heat lost from surface of kiln 15.38 11.1 8. Heat carried off by waste gas cooler 19.21 13.8 9. Heat carried off by fry ash 0.33 0.2 10. Heat consumption for fry ash water evaporation and decomposition
2.06 1.5
11. Heat carried off by cool water 1.14 0.8 12. Others 0.59 0.4 Total 138.70 100
Table 6.1.28. Technical and economic analysis of integrated energy-saving measures for China’s cement industry
Item Potential of energy saving
(k toe)
Unit investment in energy saving
(yuan/toe) Comprehensive innovation of mechanized shaft kilns
3577 551
Substituting dry process for wet process 623 843 Substituting wet grind and dry roast for wet process
441 871

Profile of the Cement Industry in China 69
Integrated innovation of wet process kilns 182 593 Renewal of inner hollow kilns 1855.7 1684 Innovation of kilns with vertical shaped preheater
70 910
Innovation of labor kilns 98 1454 Innovation of grind machines 1620 1232 Total 11400
Source: Cheng Ming , 1993 (1) Comprehensive energy-conserving innovation on mechanized shaft kiln Using a combination of measures such as pre-watering, raw material mixing, pre-homogenizing, and integrated kiln reconstruction, can reduce energy intensity by 25%. (2) Substituting the wet process with the dry process Substituting the wet process with the dry process can considerably improve energy efficiency by reducing the cement clinker energy intensity by about 50%. (3) Substituting the wet process with wet grinding and dry burning Based on the wet process, adding mechanical dewatering equipment can reduce the water content in raw material, thus reducing the energy consumption and increasing output. According to the data from demonstration projects, energy intensity can be decreased by 40%, and cement output increased by 30%. (4) Integrated renewal of the wet process kiln The cement plants which have to use the wet process can still save about 20% of their energy consumption by using various energy-saving measures and integrated renewal of the wet process kiln. (5) Renewal of inner hollow kiln The inner hollow kiln is a small-scale, highly energy-intensive rotary kiln that needs to be either upgraded or rejected. There are various types of small-scale rotary kilns in China, totaling about 400 units. Their renovation can save energy and increase cement output. Taking a plant as an example of renovation, the average clinker output per hour for one kiln before renewal was 4.5 tons, and energy intensity was 286 kgce/ton. After renewal, the output per hour became 12.5 tons and the energy intensity of clinker was 136 kgce/ton. 6.1.6 Status of application of new technologies for energy efficiency improvement and pollution abatement
From the point of view of energy efficiency improvement and pollution abatement, the dry process is the best to adopt in cement manufacturing. Because of limited capital, however, it is
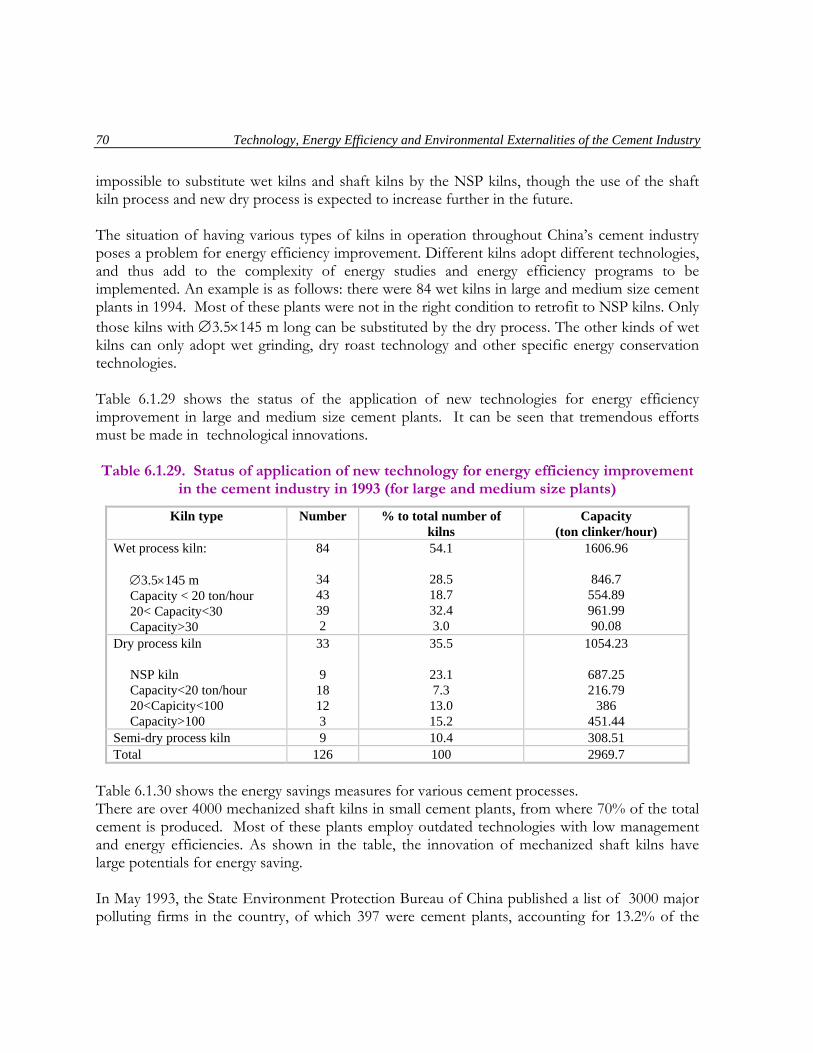
70 Technology, Energy Efficiency and Environmental Externalities of the Cement Industry
impossible to substitute wet kilns and shaft kilns by the NSP kilns, though the use of the shaft kiln process and new dry process is expected to increase further in the future. The situation of having various types of kilns in operation throughout China’s cement industry poses a problem for energy efficiency improvement. Different kilns adopt different technologies, and thus add to the complexity of energy studies and energy efficiency programs to be implemented. An example is as follows: there were 84 wet kilns in large and medium size cement plants in 1994. Most of these plants were not in the right condition to retrofit to NSP kilns. Only those kilns with ∅3.5×145 m long can be substituted by the dry process. The other kinds of wet kilns can only adopt wet grinding, dry roast technology and other specific energy conservation technologies. Table 6.1.29 shows the status of the application of new technologies for energy efficiency improvement in large and medium size cement plants. It can be seen that tremendous efforts must be made in technological innovations. Table 6.1.29. Status of application of new technology for energy efficiency improvement
in the cement industry in 1993 (for large and medium size plants)
Kiln type Number % to total number of kilns
Capacity (ton clinker/hour)
Wet process kiln: ∅3.5×145 m Capacity < 20 ton/hour 20< Capacity<30 Capacity>30
84
34 43 39 2
54.1
28.5 18.7 32.4 3.0
1606.96
846.7 554.89 961.99 90.08
Dry process kiln NSP kiln Capacity<20 ton/hour 20<Capicity<100 Capacity>100
33
9 18 12 3
35.5
23.1 7.3
13.0 15.2
1054.23
687.25 216.79
386 451.44
Semi-dry process kiln 9 10.4 308.51 Total 126 100 2969.7
Table 6.1.30 shows the energy savings measures for various cement processes. There are over 4000 mechanized shaft kilns in small cement plants, from where 70% of the total cement is produced. Most of these plants employ outdated technologies with low management and energy efficiencies. As shown in the table, the innovation of mechanized shaft kilns have large potentials for energy saving. In May 1993, the State Environment Protection Bureau of China published a list of 3000 major polluting firms in the country, of which 397 were cement plants, accounting for 13.2% of the

Profile of the Cement Industry in China 71
total number of firms. This shows that pollution from the cement industry is a serious problem due to the serious impact on the environment. 6.1.7 Conclusions
From the above discussion, some main conclusions can be briefly summarized as follows: - China is the biggest cement-producing country in the world, while the cement
industry holds an important position in the national economy. - The cement industry is a highly energy-intensive and polluting industry. - The energy intensity of cement manufacturing in China is 1.78 times higher as that of
Japan, and 1.96 higher than Germany. The energy-savings potential of China’s cement industry is quite considerable.
- The industry is characterized by outdated technologies both in the production process and equipment. New technologies have large market potentials in China.
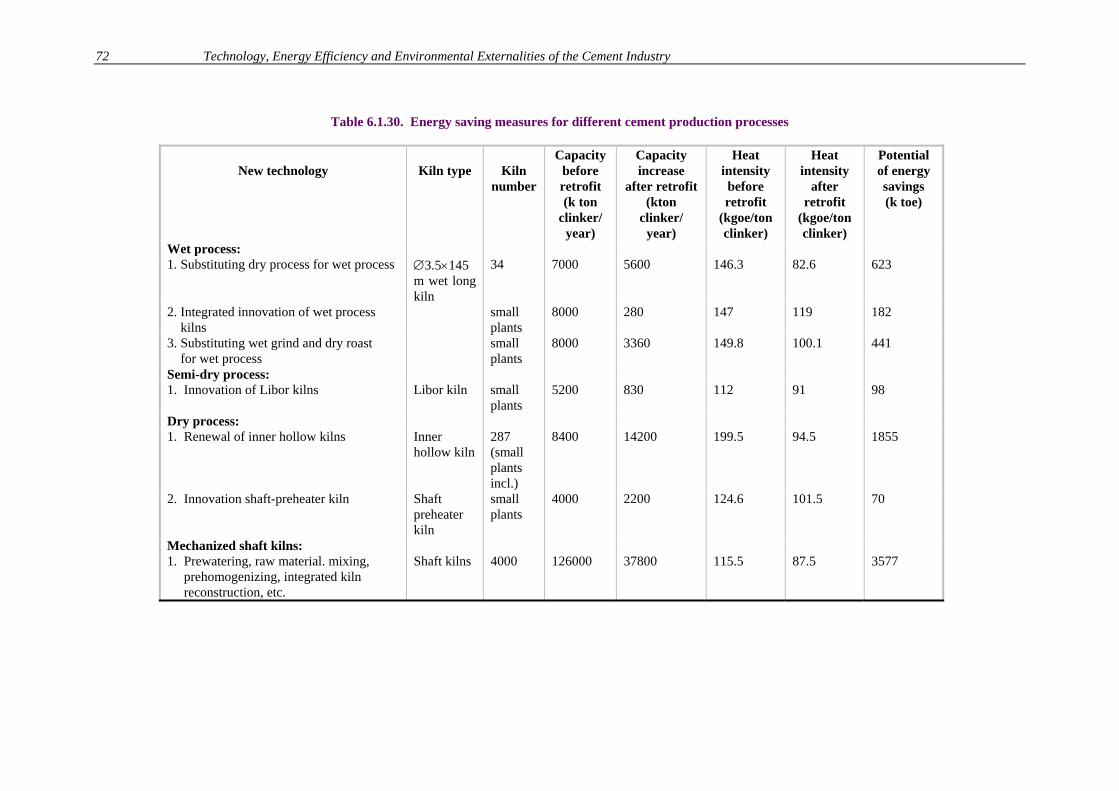
72 Technology, Energy Efficiency and Environmental Externalities of the Cement Industry
Table 6.1.30. Energy saving measures for different cement production processes
New technology
Kiln type
Kiln number
Capacity before retrofit (k ton
clinker/ year)
Capacity increase
after retrofit (kton
clinker/ year)
Heat intensity before retrofit
(kgoe/ton clinker)
Heat intensity
after retrofit
(kgoe/ton clinker)
Potential of energy savings (k toe)
Wet process: 1. Substituting dry process for wet process
∅3.5×145 m wet long kiln
34 7000 5600 146.3 82.6 623
2. Integrated innovation of wet process kilns
smallplants
8000 280 147 119 182
3. Substituting wet grind and dry roast for wet process
smallplants
8000 3360 149.8 100.1 441
Semi-dry process: 1. Innovation of Libor kilns Libor kiln small
plants 5200 830 112 91 98
Dry process: 1. Renewal of inner hollow kilns Inner
hollow kiln 287 (small plants incl.)
8400 14200 199.5 94.5 1855
2. Innovation shaft-preheater kiln Shaft preheater kiln
small plants
4000 2200 124.6 101.5 70
Mechanized shaft kilns: 1. Prewatering, raw material. mixing, prehomogenizing, integrated kiln reconstruction, etc.
Shaft kilns 4000 126000 37800 115.5 87.5 3577
Profile of the Cement Industry in India 73
6.2 COUNTRY REPORT: INDIA
6.2.1 Introduction
The Indian cement industry is a highly energy-intensive and polluting industry, whose production at present includes 13 varieties of cement, three of which comprise more than 95% of the total production. Currently, the country exports cement to its neighboring countries, and it has the advantage of being the resource base for the cement-importing countries in the region. The industry, however, has not yet kept pace with the advances in science and technology taking place in the world. It is saddled with old plants and machinery designed during those periods of cheap energy, and while the growth of energy conservation efforts has gained momentum in the developed countries, efforts in India are still at its infancy stage with more focus on housekeeping measures. The upheavals in the world energy market in the 1970s and the country’s gradual decontrol of cement in the 1980s, however, have spurred some technology improvements in the industry. While the industry is setting itself to meet the increasing demands for construction materials, it has also responded to the global calls for environmental protection and consciousness through the adoption of clean technologies at the plant level. Various constraints exist, however, and again, India’s cement industry is characterized as infant in terms of the adoption of environment-friendly and clean technologies. This section aims to assess the status of technologies in the energy-intensive and polluting cement industry by presenting the existing technological and environmental conditions in the industry. The latter part identifies the potential areas of energy conservation and pollution reduction in the industry with use of energy-efficient and environmentally sound technologies. 6.2.2 Technological trajectory of India’s cement industry
6.2.2.1 Current scenario
At present, the Indian cement industry produces thirteen varieties of cement, three of which comprise more than 95% of the total production. These are ordinary Portland cement, Portland pozzolana cement and Portland slag cement. This total production is derived from cement plants whose number has been growing over all these years (Figure 6.2.1). As a high-value added industry, it’s growth rate and contribution to the Indian economy is quite significant. It is estimated that the newer cement plants that compare well to world standards in terms of productivity and production costs, would be able to export about 5 million tons (Mt) per annum by 1996-1997. Table 6.2.1 summarizes the performance of the cement industry from 1973 to 1989. The technology for cement manufacture in the country has changed substantially during the past three to four decades. While plants based on the wet process were established in the 1950s and early 1960, those using the dry process have been set up thereafter. Dry process cement plants, which are less energy- intensive, now account for over 90% of installed capacity. Precalcinator technology has also been introduced in India, resulting in a significant decrease in the specific energy consumption. Three indicators (value added - VA, thermal, and power) for the cement industry are shown in Table 6.2.2.
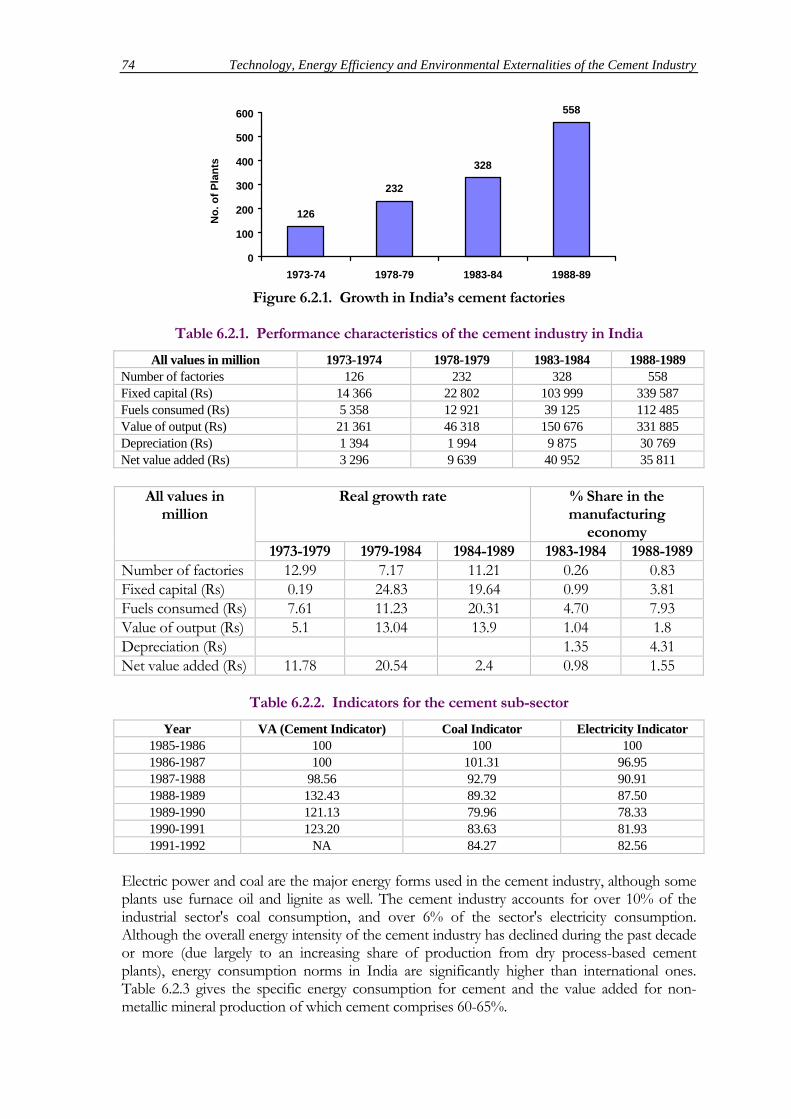
74 Technology, Energy Efficiency and Environmental Externalities of the Cement Industry
126
232
328
558
0
100
200
300
400
500
600
1973-74 1978-79 1983-84 1988-89
No.
of P
lant
s
Figure 6.2.1. Growth in India’s cement factories
Table 6.2.1. Performance characteristics of the cement industry in India
All values in million 1973-1974 1978-1979 1983-1984 1988-1989 Number of factories 126 232 328 558 Fixed capital (Rs) 14 366 22 802 103 999 339 587 Fuels consumed (Rs) 5 358 12 921 39 125 112 485 Value of output (Rs) 21 361 46 318 150 676 331 885 Depreciation (Rs) 1 394 1 994 9 875 30 769 Net value added (Rs) 3 296 9 639 40 952 35 811
All values in million
Real growth rate % Share in the manufacturing
economy 1973-1979 1979-1984 1984-1989 1983-1984 1988-1989
Number of factories 12.99 7.17 11.21 0.26 0.83 Fixed capital (Rs) 0.19 24.83 19.64 0.99 3.81 Fuels consumed (Rs) 7.61 11.23 20.31 4.70 7.93 Value of output (Rs) 5.1 13.04 13.9 1.04 1.8 Depreciation (Rs) 1.35 4.31 Net value added (Rs) 11.78 20.54 2.4 0.98 1.55
Table 6.2.2. Indicators for the cement sub-sector
Year VA (Cement Indicator) Coal Indicator Electricity Indicator 1985-1986 100 100 100 1986-1987 100 101.31 96.95 1987-1988 98.56 92.79 90.91 1988-1989 132.43 89.32 87.50 1989-1990 121.13 79.96 78.33 1990-1991 123.20 83.63 81.93 1991-1992 NA 84.27 82.56
Electric power and coal are the major energy forms used in the cement industry, although some plants use furnace oil and lignite as well. The cement industry accounts for over 10% of the industrial sector's coal consumption, and over 6% of the sector's electricity consumption. Although the overall energy intensity of the cement industry has declined during the past decade or more (due largely to an increasing share of production from dry process-based cement plants), energy consumption norms in India are significantly higher than international ones. Table 6.2.3 gives the specific energy consumption for cement and the value added for non-metallic mineral production of which cement comprises 60-65%.
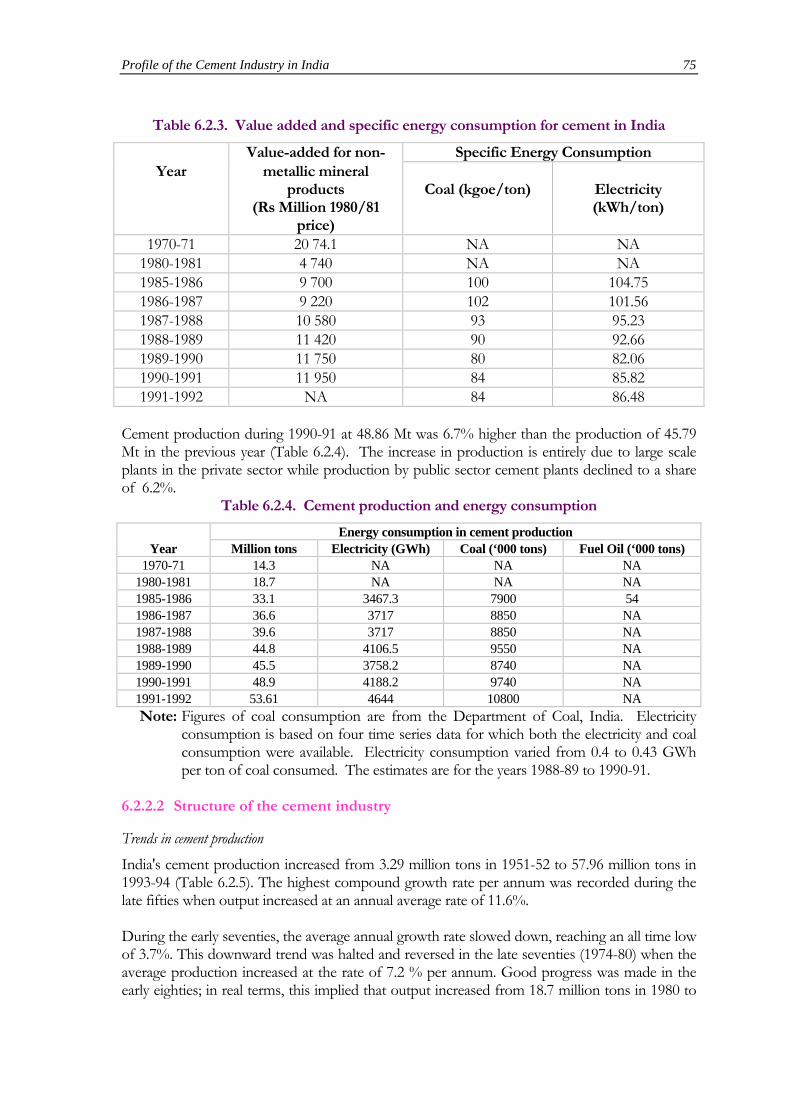
Profile of the Cement Industry in India 75
Table 6.2.3. Value added and specific energy consumption for cement in India
Value-added for non- Specific Energy Consumption Year metallic mineral
products (Rs Million 1980/81
price)
Coal (kgoe/ton)
Electricity (kWh/ton)
1970-71 20 74.1 NA NA 1980-1981 4 740 NA NA 1985-1986 9 700 100 104.75 1986-1987 9 220 102 101.56 1987-1988 10 580 93 95.23 1988-1989 11 420 90 92.66 1989-1990 11 750 80 82.06 1990-1991 11 950 84 85.82 1991-1992 NA 84 86.48
Cement production during 1990-91 at 48.86 Mt was 6.7% higher than the production of 45.79 Mt in the previous year (Table 6.2.4). The increase in production is entirely due to large scale plants in the private sector while production by public sector cement plants declined to a share of 6.2%.
Table 6.2.4. Cement production and energy consumption
Energy consumption in cement production Year Million tons Electricity (GWh) Coal (‘000 tons) Fuel Oil (‘000 tons)
1970-71 14.3 NA NA NA 1980-1981 18.7 NA NA NA 1985-1986 33.1 3467.3 7900 54 1986-1987 36.6 3717 8850 NA 1987-1988 39.6 3717 8850 NA 1988-1989 44.8 4106.5 9550 NA 1989-1990 45.5 3758.2 8740 NA 1990-1991 48.9 4188.2 9740 NA 1991-1992 53.61 4644 10800 NA
Note: Figures of coal consumption are from the Department of Coal, India. Electricity consumption is based on four time series data for which both the electricity and coal consumption were available. Electricity consumption varied from 0.4 to 0.43 GWh per ton of coal consumed. The estimates are for the years 1988-89 to 1990-91.
6.2.2.2 Structure of the cement industry
Trends in cement production India's cement production increased from 3.29 million tons in 1951-52 to 57.96 million tons in 1993-94 (Table 6.2.5). The highest compound growth rate per annum was recorded during the late fifties when output increased at an annual average rate of 11.6%. During the early seventies, the average annual growth rate slowed down, reaching an all time low of 3.7%. This downward trend was halted and reversed in the late seventies (1974-80) when the average production increased at the rate of 7.2 % per annum. Good progress was made in the early eighties; in real terms, this implied that output increased from 18.7 million tons in 1980 to

76 Technology, Energy Efficiency and Environmental Externalities of the Cement Industry
30 million tons in 1985. This upward trend continued and production reached 45 Mt by 1989-90. In essence, the decade of the seventies witnessed a slowing down in production. This adverse trend was halted and reversed during the eighties. The performance in 1991-92 was indeed remarkable; production increased by almost 4.5 million tons over the previous year’s record of 49 million tons. Trends in capacity The cement industry witnessed an increase in production at an average rate of 11.6% per annum in the late fifties. Production increased from 4.8 million tons in 1955-56 to 7.97 million tons in 1960-61. The following year, a target for additional installed capacity was 16 million tons, though the achieved production was only 9.3 million tons, or just 58% of the planned production. The production performance was comparatively better during the subsequent years. In 1984-85, against a target of 34.5 million tons, a production of 30.1 million tons was achieved. In 1989-90, achievement was 45.41 million tons which exceeded the target of 45.0 million tons. Thereafter, achievements have been in excess of 95% of the target.
Table 6.2.5. Cement industry trends in capacity, production, and capacity utilization (Mt) (inclusive of mini-cement plants)
Year Installed Capacity Actual Production Capacity Utilization (%) 1950-1951 3.75 3.29 88 1960-1961 9.30 7.97 86 1968-1969 14.98 12.24 82 1980-1981 26.99 18.56 67 1990-1991 64.36 48.90 76 1991-1992 66.59 53.61 81 1992-1993 70.19 54.08 77 1993-1994 76.88 57.96 76 Source : Basic Data for Cement Industry (May 1995): Cement Manufacturers'
Association The relation between installed capacity and production has shown an almost continuous downward trend. During the initial years, capacity utilization fluctuated between 88% and 96%. However, from 1956 onwards, capacity utilization declined, reaching an all time low of 67% in the years 1980-81 and 1986-87. During the 60's, capacity utilization fluctuated between 83%-90%, between 73-80% in the 1980's and finally, between 67% and 75% for the period of 1980-90. The share of the public sector in India’s cement production is shown in Table 6.2.6.
Table 6.2.6. Distribution of capacity and production by ownership
1977 1983 1991 1992 C P C P C P C P Share of Public Sector (%) 11.46 9.92 17.40 16.10 15.50 10.20 14.70 10.40 Share of Private Sector (%) 88.54 90.08 82.60 83.90 84.50 89.80 85.30 89.60 Total (Mt) 21.67 19.17 36.2 25.70 61.31 50.60 64.84 50.70 Source: Indian Cement Industry Statistics (relevant years). C: capacity and P: Production In 1977, out of a total production of 19.17 million tons, the public sector accounted for approximately 10%, the rest being produced by the private sector. The contribution of small units in the private sector continues to remain marginal. Between 1970 and 1991, production
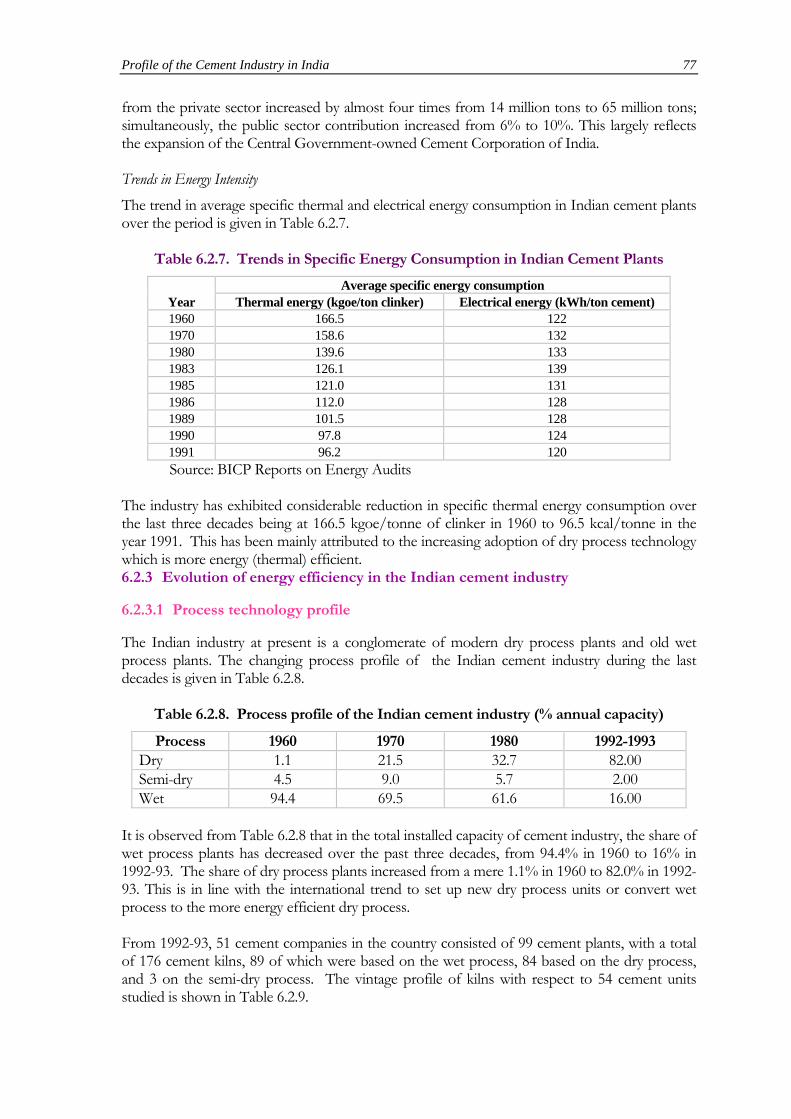
Profile of the Cement Industry in India 77
from the private sector increased by almost four times from 14 million tons to 65 million tons; simultaneously, the public sector contribution increased from 6% to 10%. This largely reflects the expansion of the Central Government-owned Cement Corporation of India. Trends in Energy Intensity The trend in average specific thermal and electrical energy consumption in Indian cement plants over the period is given in Table 6.2.7.
Table 6.2.7. Trends in Specific Energy Consumption in Indian Cement Plants
Average specific energy consumption Year Thermal energy (kgoe/ton clinker) Electrical energy (kWh/ton cement) 1960 166.5 122 1970 158.6 132 1980 139.6 133 1983 126.1 139 1985 121.0 131 1986 112.0 128 1989 101.5 128 1990 97.8 124 1991 96.2 120
Source: BICP Reports on Energy Audits The industry has exhibited considerable reduction in specific thermal energy consumption over the last three decades being at 166.5 kgoe/tonne of clinker in 1960 to 96.5 kcal/tonne in the year 1991. This has been mainly attributed to the increasing adoption of dry process technology which is more energy (thermal) efficient. 6.2.3 Evolution of energy efficiency in the Indian cement industry
6.2.3.1 Process technology profile
The Indian industry at present is a conglomerate of modern dry process plants and old wet process plants. The changing process profile of the Indian cement industry during the last decades is given in Table 6.2.8.
Table 6.2.8. Process profile of the Indian cement industry (% annual capacity)
Process 1960 1970 1980 1992-1993 Dry 1.1 21.5 32.7 82.00 Semi-dry 4.5 9.0 5.7 2.00 Wet 94.4 69.5 61.6 16.00
It is observed from Table 6.2.8 that in the total installed capacity of cement industry, the share of wet process plants has decreased over the past three decades, from 94.4% in 1960 to 16% in 1992-93. The share of dry process plants increased from a mere 1.1% in 1960 to 82.0% in 1992-93. This is in line with the international trend to set up new dry process units or convert wet process to the more energy efficient dry process. From 1992-93, 51 cement companies in the country consisted of 99 cement plants, with a total of 176 cement kilns, 89 of which were based on the wet process, 84 based on the dry process, and 3 on the semi-dry process. The vintage profile of kilns with respect to 54 cement units studied is shown in Table 6.2.9.
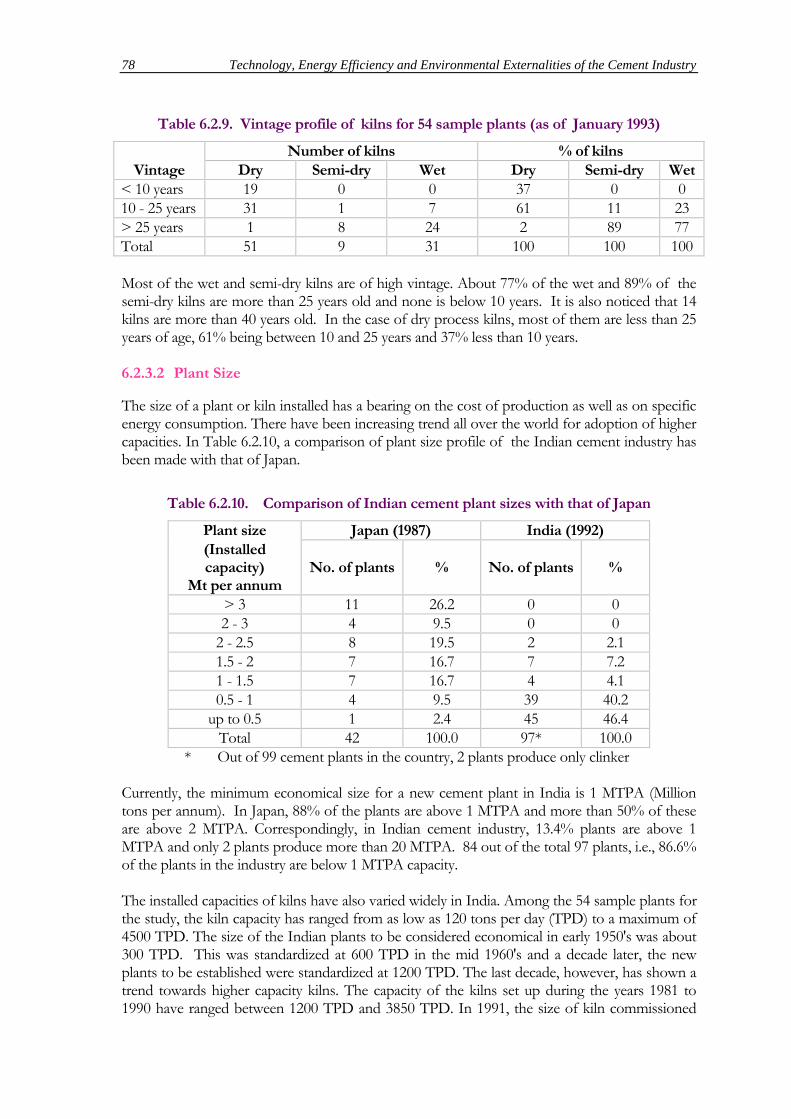
78 Technology, Energy Efficiency and Environmental Externalities of the Cement Industry
Table 6.2.9. Vintage profile of kilns for 54 sample plants (as of January 1993)
Number of kilns % of kilns Vintage Dry Semi-dry Wet Dry Semi-dry Wet
< 10 years 19 0 0 37 0 0 10 - 25 years 31 1 7 61 11 23 > 25 years 1 8 24 2 89 77 Total 51 9 31 100 100 100 Most of the wet and semi-dry kilns are of high vintage. About 77% of the wet and 89% of the semi-dry kilns are more than 25 years old and none is below 10 years. It is also noticed that 14 kilns are more than 40 years old. In the case of dry process kilns, most of them are less than 25 years of age, 61% being between 10 and 25 years and 37% less than 10 years. 6.2.3.2 Plant Size
The size of a plant or kiln installed has a bearing on the cost of production as well as on specific energy consumption. There have been increasing trend all over the world for adoption of higher capacities. In Table 6.2.10, a comparison of plant size profile of the Indian cement industry has been made with that of Japan.
Table 6.2.10. Comparison of Indian cement plant sizes with that of Japan
Plant size Japan (1987) India (1992) (Installed capacity)
Mt per annum
No. of plants
%
No. of plants
%
> 3 11 26.2 0 0 2 - 3 4 9.5 0 0
2 - 2.5 8 19.5 2 2.1 1.5 - 2 7 16.7 7 7.2 1 - 1.5 7 16.7 4 4.1 0.5 - 1 4 9.5 39 40.2
up to 0.5 1 2.4 45 46.4 Total 42 100.0 97* 100.0
* Out of 99 cement plants in the country, 2 plants produce only clinker Currently, the minimum economical size for a new cement plant in India is 1 MTPA (Million tons per annum). In Japan, 88% of the plants are above 1 MTPA and more than 50% of these are above 2 MTPA. Correspondingly, in Indian cement industry, 13.4% plants are above 1 MTPA and only 2 plants produce more than 20 MTPA. 84 out of the total 97 plants, i.e., 86.6% of the plants in the industry are below 1 MTPA capacity. The installed capacities of kilns have also varied widely in India. Among the 54 sample plants for the study, the kiln capacity has ranged from as low as 120 tons per day (TPD) to a maximum of 4500 TPD. The size of the Indian plants to be considered economical in early 1950's was about 300 TPD. This was standardized at 600 TPD in the mid 1960's and a decade later, the new plants to be established were standardized at 1200 TPD. The last decade, however, has shown a trend towards higher capacity kilns. The capacity of the kilns set up during the years 1981 to 1990 have ranged between 1200 TPD and 3850 TPD. In 1991, the size of kiln commissioned
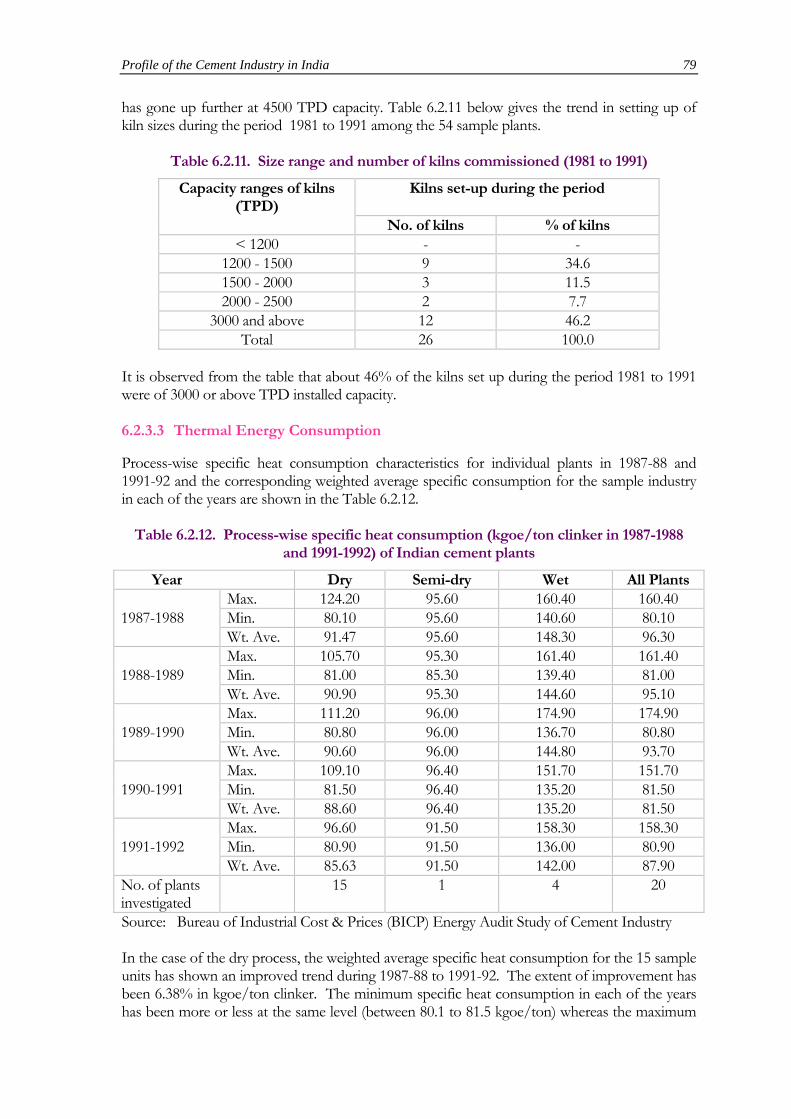
Profile of the Cement Industry in India 79
has gone up further at 4500 TPD capacity. Table 6.2.11 below gives the trend in setting up of kiln sizes during the period 1981 to 1991 among the 54 sample plants.
Table 6.2.11. Size range and number of kilns commissioned (1981 to 1991)
Capacity ranges of kilns (TPD)
Kilns set-up during the period
No. of kilns % of kilns < 1200 - -
1200 - 1500 9 34.6 1500 - 2000 3 11.5 2000 - 2500 2 7.7
3000 and above 12 46.2 Total 26 100.0
It is observed from the table that about 46% of the kilns set up during the period 1981 to 1991 were of 3000 or above TPD installed capacity. 6.2.3.3 Thermal Energy Consumption
Process-wise specific heat consumption characteristics for individual plants in 1987-88 and 1991-92 and the corresponding weighted average specific consumption for the sample industry in each of the years are shown in the Table 6.2.12.
Table 6.2.12. Process-wise specific heat consumption (kgoe/ton clinker in 1987-1988 and 1991-1992) of Indian cement plants
Year Dry Semi-dry Wet All Plants Max. 124.20 95.60 160.40 160.40 1987-1988 Min. 80.10 95.60 140.60 80.10 Wt. Ave. 91.47 95.60 148.30 96.30 Max. 105.70 95.30 161.40 161.40 1988-1989 Min. 81.00 85.30 139.40 81.00 Wt. Ave. 90.90 95.30 144.60 95.10 Max. 111.20 96.00 174.90 174.90 1989-1990 Min. 80.80 96.00 136.70 80.80 Wt. Ave. 90.60 96.00 144.80 93.70 Max. 109.10 96.40 151.70 151.70 1990-1991 Min. 81.50 96.40 135.20 81.50 Wt. Ave. 88.60 96.40 135.20 81.50 Max. 96.60 91.50 158.30 158.30 1991-1992 Min. 80.90 91.50 136.00 80.90 Wt. Ave. 85.63 91.50 142.00 87.90 No. of plants investigated
15 1 4 20
Source: Bureau of Industrial Cost & Prices (BICP) Energy Audit Study of Cement Industry In the case of the dry process, the weighted average specific heat consumption for the 15 sample units has shown an improved trend during 1987-88 to 1991-92. The extent of improvement has been 6.38% in kgoe/ton clinker. The minimum specific heat consumption in each of the years has been more or less at the same level (between 80.1 to 81.5 kgoe/ton) whereas the maximum
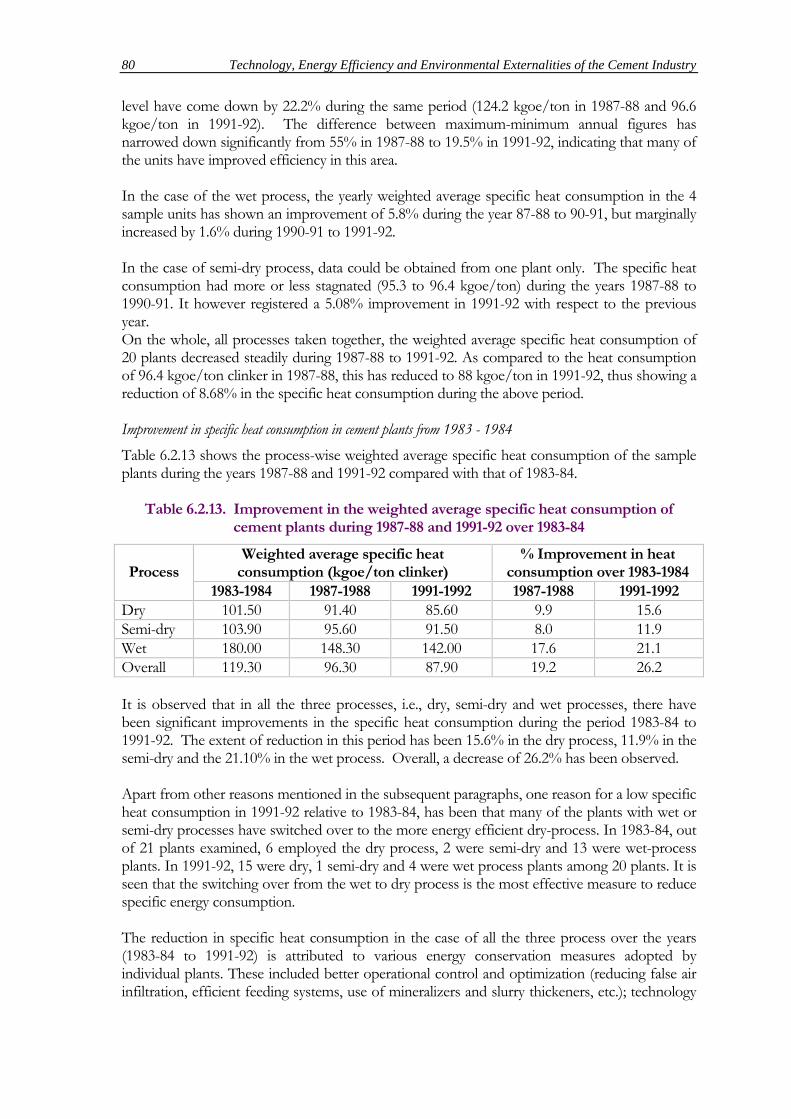
80 Technology, Energy Efficiency and Environmental Externalities of the Cement Industry
level have come down by 22.2% during the same period (124.2 kgoe/ton in 1987-88 and 96.6 kgoe/ton in 1991-92). The difference between maximum-minimum annual figures has narrowed down significantly from 55% in 1987-88 to 19.5% in 1991-92, indicating that many of the units have improved efficiency in this area. In the case of the wet process, the yearly weighted average specific heat consumption in the 4 sample units has shown an improvement of 5.8% during the year 87-88 to 90-91, but marginally increased by 1.6% during 1990-91 to 1991-92. In the case of semi-dry process, data could be obtained from one plant only. The specific heat consumption had more or less stagnated (95.3 to 96.4 kgoe/ton) during the years 1987-88 to 1990-91. It however registered a 5.08% improvement in 1991-92 with respect to the previous year. On the whole, all processes taken together, the weighted average specific heat consumption of 20 plants decreased steadily during 1987-88 to 1991-92. As compared to the heat consumption of 96.4 kgoe/ton clinker in 1987-88, this has reduced to 88 kgoe/ton in 1991-92, thus showing a reduction of 8.68% in the specific heat consumption during the above period. Improvement in specific heat consumption in cement plants from 1983 - 1984 Table 6.2.13 shows the process-wise weighted average specific heat consumption of the sample plants during the years 1987-88 and 1991-92 compared with that of 1983-84.
Table 6.2.13. Improvement in the weighted average specific heat consumption of cement plants during 1987-88 and 1991-92 over 1983-84
Process
Weighted average specific heat consumption (kgoe/ton clinker)
% Improvement in heat consumption over 1983-1984
1983-1984 1987-1988 1991-1992 1987-1988 1991-1992 Dry 101.50 91.40 85.60 9.9 15.6 Semi-dry 103.90 95.60 91.50 8.0 11.9 Wet 180.00 148.30 142.00 17.6 21.1 Overall 119.30 96.30 87.90 19.2 26.2 It is observed that in all the three processes, i.e., dry, semi-dry and wet processes, there have been significant improvements in the specific heat consumption during the period 1983-84 to 1991-92. The extent of reduction in this period has been 15.6% in the dry process, 11.9% in the semi-dry and the 21.10% in the wet process. Overall, a decrease of 26.2% has been observed. Apart from other reasons mentioned in the subsequent paragraphs, one reason for a low specific heat consumption in 1991-92 relative to 1983-84, has been that many of the plants with wet or semi-dry processes have switched over to the more energy efficient dry-process. In 1983-84, out of 21 plants examined, 6 employed the dry process, 2 were semi-dry and 13 were wet-process plants. In 1991-92, 15 were dry, 1 semi-dry and 4 were wet process plants among 20 plants. It is seen that the switching over from the wet to dry process is the most effective measure to reduce specific energy consumption. The reduction in specific heat consumption in the case of all the three process over the years (1983-84 to 1991-92) is attributed to various energy conservation measures adopted by individual plants. These included better operational control and optimization (reducing false air infiltration, efficient feeding systems, use of mineralizers and slurry thickeners, etc.); technology
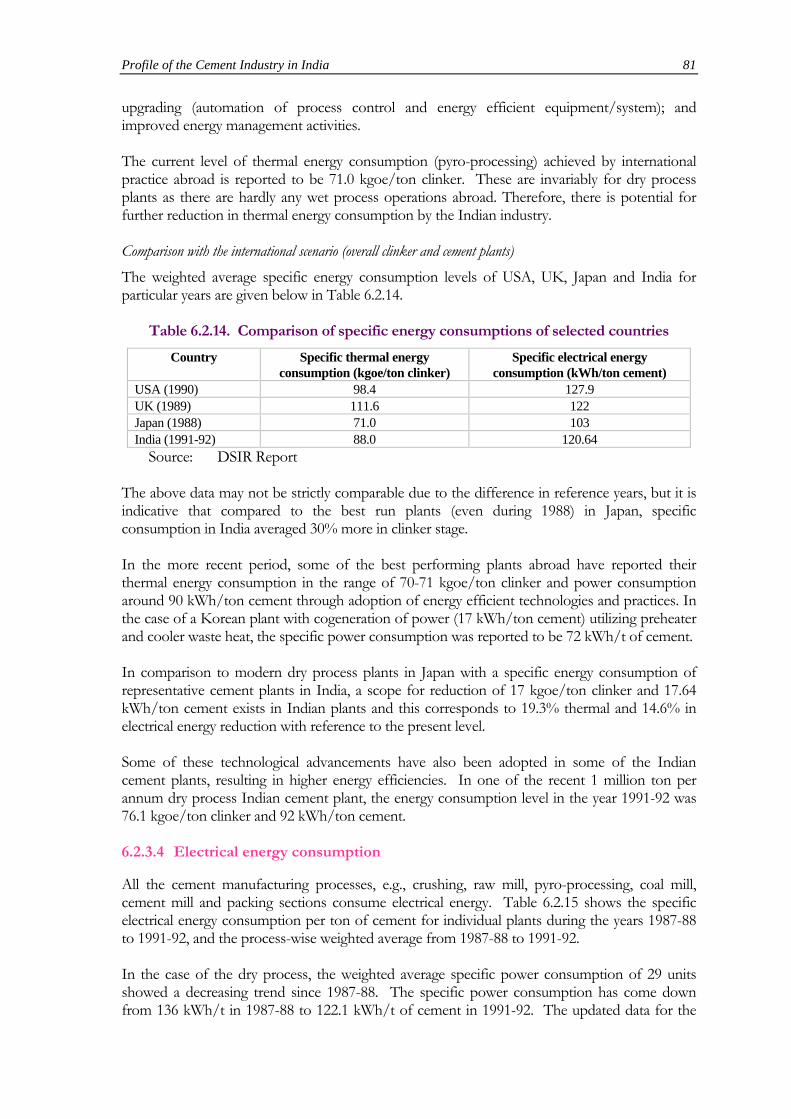
Profile of the Cement Industry in India 81
upgrading (automation of process control and energy efficient equipment/system); and improved energy management activities. The current level of thermal energy consumption (pyro-processing) achieved by international practice abroad is reported to be 71.0 kgoe/ton clinker. These are invariably for dry process plants as there are hardly any wet process operations abroad. Therefore, there is potential for further reduction in thermal energy consumption by the Indian industry. Comparison with the international scenario (overall clinker and cement plants) The weighted average specific energy consumption levels of USA, UK, Japan and India for particular years are given below in Table 6.2.14.
Table 6.2.14. Comparison of specific energy consumptions of selected countries
Country Specific thermal energy consumption (kgoe/ton clinker)
Specific electrical energy consumption (kWh/ton cement)
USA (1990) 98.4 127.9 UK (1989) 111.6 122 Japan (1988) 71.0 103 India (1991-92) 88.0 120.64
Source: DSIR Report The above data may not be strictly comparable due to the difference in reference years, but it is indicative that compared to the best run plants (even during 1988) in Japan, specific consumption in India averaged 30% more in clinker stage. In the more recent period, some of the best performing plants abroad have reported their thermal energy consumption in the range of 70-71 kgoe/ton clinker and power consumption around 90 kWh/ton cement through adoption of energy efficient technologies and practices. In the case of a Korean plant with cogeneration of power (17 kWh/ton cement) utilizing preheater and cooler waste heat, the specific power consumption was reported to be 72 kWh/t of cement. In comparison to modern dry process plants in Japan with a specific energy consumption of representative cement plants in India, a scope for reduction of 17 kgoe/ton clinker and 17.64 kWh/ton cement exists in Indian plants and this corresponds to 19.3% thermal and 14.6% in electrical energy reduction with reference to the present level. Some of these technological advancements have also been adopted in some of the Indian cement plants, resulting in higher energy efficiencies. In one of the recent 1 million ton per annum dry process Indian cement plant, the energy consumption level in the year 1991-92 was 76.1 kgoe/ton clinker and 92 kWh/ton cement. 6.2.3.4 Electrical energy consumption
All the cement manufacturing processes, e.g., crushing, raw mill, pyro-processing, coal mill, cement mill and packing sections consume electrical energy. Table 6.2.15 shows the specific electrical energy consumption per ton of cement for individual plants during the years 1987-88 to 1991-92, and the process-wise weighted average from 1987-88 to 1991-92. In the case of the dry process, the weighted average specific power consumption of 29 units showed a decreasing trend since 1987-88. The specific power consumption has come down from 136 kWh/t in 1987-88 to 122.1 kWh/t of cement in 1991-92. The updated data for the
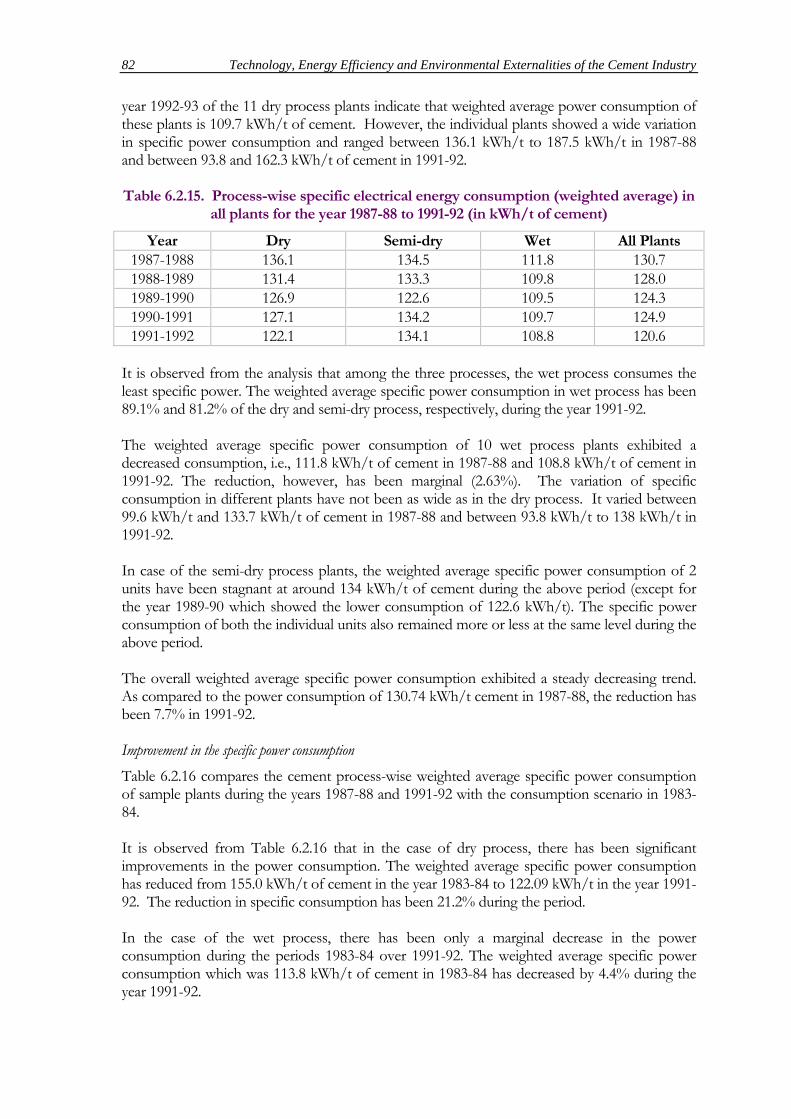
82 Technology, Energy Efficiency and Environmental Externalities of the Cement Industry
year 1992-93 of the 11 dry process plants indicate that weighted average power consumption of these plants is 109.7 kWh/t of cement. However, the individual plants showed a wide variation in specific power consumption and ranged between 136.1 kWh/t to 187.5 kWh/t in 1987-88 and between 93.8 and 162.3 kWh/t of cement in 1991-92. Table 6.2.15. Process-wise specific electrical energy consumption (weighted average) in
all plants for the year 1987-88 to 1991-92 (in kWh/t of cement)
Year Dry Semi-dry Wet All Plants 1987-1988 136.1 134.5 111.8 130.7 1988-1989 131.4 133.3 109.8 128.0 1989-1990 126.9 122.6 109.5 124.3 1990-1991 127.1 134.2 109.7 124.9 1991-1992 122.1 134.1 108.8 120.6
It is observed from the analysis that among the three processes, the wet process consumes the least specific power. The weighted average specific power consumption in wet process has been 89.1% and 81.2% of the dry and semi-dry process, respectively, during the year 1991-92. The weighted average specific power consumption of 10 wet process plants exhibited a decreased consumption, i.e., 111.8 kWh/t of cement in 1987-88 and 108.8 kWh/t of cement in 1991-92. The reduction, however, has been marginal (2.63%). The variation of specific consumption in different plants have not been as wide as in the dry process. It varied between 99.6 kWh/t and 133.7 kWh/t of cement in 1987-88 and between 93.8 kWh/t to 138 kWh/t in 1991-92. In case of the semi-dry process plants, the weighted average specific power consumption of 2 units have been stagnant at around 134 kWh/t of cement during the above period (except for the year 1989-90 which showed the lower consumption of 122.6 kWh/t). The specific power consumption of both the individual units also remained more or less at the same level during the above period. The overall weighted average specific power consumption exhibited a steady decreasing trend. As compared to the power consumption of 130.74 kWh/t cement in 1987-88, the reduction has been 7.7% in 1991-92. Improvement in the specific power consumption Table 6.2.16 compares the cement process-wise weighted average specific power consumption of sample plants during the years 1987-88 and 1991-92 with the consumption scenario in 1983-84. It is observed from Table 6.2.16 that in the case of dry process, there has been significant improvements in the power consumption. The weighted average specific power consumption has reduced from 155.0 kWh/t of cement in the year 1983-84 to 122.09 kWh/t in the year 1991-92. The reduction in specific consumption has been 21.2% during the period. In the case of the wet process, there has been only a marginal decrease in the power consumption during the periods 1983-84 over 1991-92. The weighted average specific power consumption which was 113.8 kWh/t of cement in 1983-84 has decreased by 4.4% during the year 1991-92.
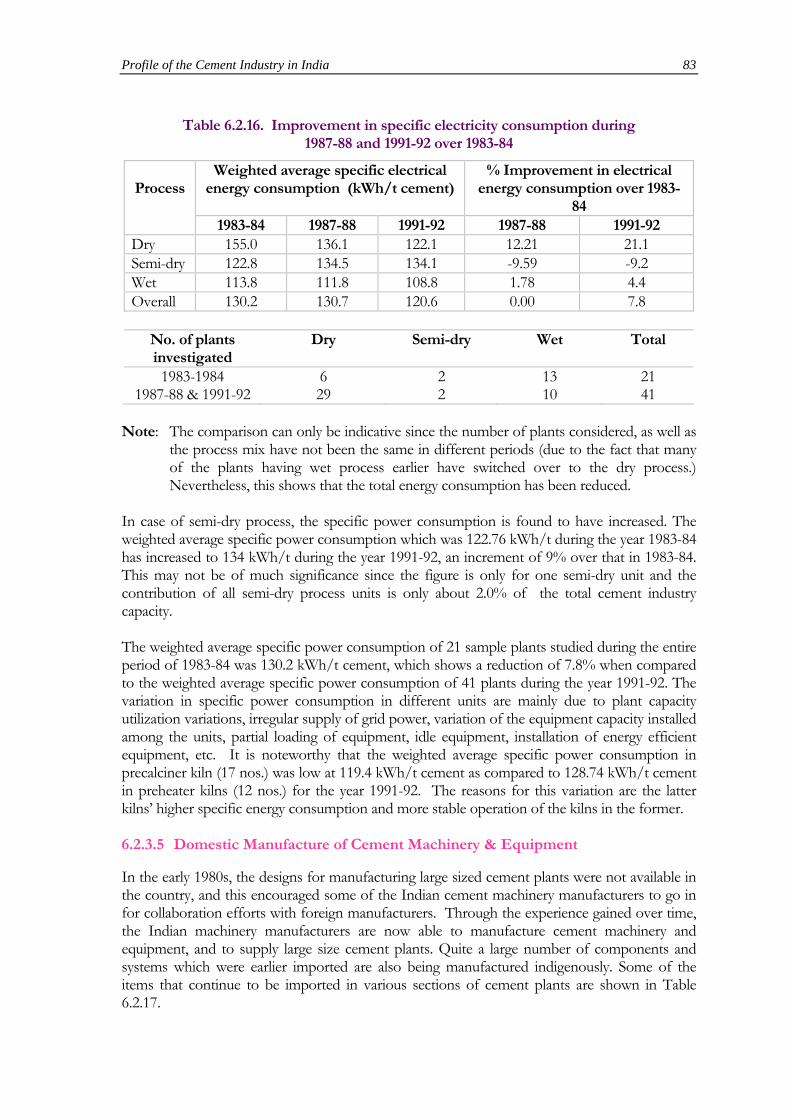
Profile of the Cement Industry in India 83
Table 6.2.16. Improvement in specific electricity consumption during
1987-88 and 1991-92 over 1983-84
Process
Weighted average specific electrical energy consumption (kWh/t cement)
% Improvement in electrical energy consumption over 1983-
84 1983-84 1987-88 1991-92 1987-88 1991-92
Dry 155.0 136.1 122.1 12.21 21.1 Semi-dry 122.8 134.5 134.1 -9.59 -9.2 Wet 113.8 111.8 108.8 1.78 4.4 Overall 130.2 130.7 120.6 0.00 7.8
No. of plants investigated
Dry Semi-dry Wet Total
1983-1984 6 2 13 21 1987-88 & 1991-92 29 2 10 41
Note: The comparison can only be indicative since the number of plants considered, as well as
the process mix have not been the same in different periods (due to the fact that many of the plants having wet process earlier have switched over to the dry process.) Nevertheless, this shows that the total energy consumption has been reduced.
In case of semi-dry process, the specific power consumption is found to have increased. The weighted average specific power consumption which was 122.76 kWh/t during the year 1983-84 has increased to 134 kWh/t during the year 1991-92, an increment of 9% over that in 1983-84. This may not be of much significance since the figure is only for one semi-dry unit and the contribution of all semi-dry process units is only about 2.0% of the total cement industry capacity. The weighted average specific power consumption of 21 sample plants studied during the entire period of 1983-84 was 130.2 kWh/t cement, which shows a reduction of 7.8% when compared to the weighted average specific power consumption of 41 plants during the year 1991-92. The variation in specific power consumption in different units are mainly due to plant capacity utilization variations, irregular supply of grid power, variation of the equipment capacity installed among the units, partial loading of equipment, idle equipment, installation of energy efficient equipment, etc. It is noteworthy that the weighted average specific power consumption in precalciner kiln (17 nos.) was low at 119.4 kWh/t cement as compared to 128.74 kWh/t cement in preheater kilns (12 nos.) for the year 1991-92. The reasons for this variation are the latter kilns’ higher specific energy consumption and more stable operation of the kilns in the former. 6.2.3.5 Domestic Manufacture of Cement Machinery & Equipment
In the early 1980s, the designs for manufacturing large sized cement plants were not available in the country, and this encouraged some of the Indian cement machinery manufacturers to go in for collaboration efforts with foreign manufacturers. Through the experience gained over time, the Indian machinery manufacturers are now able to manufacture cement machinery and equipment, and to supply large size cement plants. Quite a large number of components and systems which were earlier imported are also being manufactured indigenously. Some of the items that continue to be imported in various sections of cement plants are shown in Table 6.2.17.
84 Technology, Energy Efficiency and Environmental Externalities of the Cement Industry
Table 6.2.17. Item imported for various sections in Indian cement plants
------------------------------------------------------------------------------------------------------------------------ Crushing Wear resistant liners for crushers, few mechanical components
of the crusher. Raw mill Vertical roller mill systems mill drive. Blending and kiln Feeding system for kiln (Dry Process) Burning and cooling Parts of preheater, precalciner Coal Coal Grinding Weighing and feeding systems. Cement Grinding Special lubrication systems. Automation & Control system Computerized process control/monitoring systems, on line
analyses, advance instrumentation, etc. ------------------------------------------------------------------------------------------------------------------------ 6.2.4 Environmental Externalities
There is an increasing realization all over the world for the abatement of environmental pollution. This is apparent from the stringent emission limits as stipulated by the several governments world wide for compliance by the respective manufacturing industries. The cement industry is one among the industries creating high pollution and is covered by such regulations. In India, the above aspects have gained considerable importance and momentum in line with the rapidly progressing industrialization and modernization. The cement industry in particular has set itself for a rapid progress to meet the ever increasing demand for construction materials. It is therefore imperative to improve the environmental conditions in the existing plants and projected plants of the cement industry. Cement manufacturing may contribute significantly to air pollution in the vicinity of the work, as large quantities of pulverized materials are handled at each stage of manufacturing, from the crushing of raw materials to final packaging of cement. Such pollution results from the emission of dust. In addition to above, a cement plant also produces noise and gaseous emissions, i.e., NOX and SO2. However, emission of gaseous pollutants like NOX and SO2 is generally very less and is of minor importance. Cement plants do not significantly contribute to the national and global pollution. The impact of pollution due to cement plants on environment is local, i.e., it is generally limited to a distance of 10 km maximum from its place of installation. The regulations issued in various countries until now are all primarily intended to bring air pollution under control within the vicinity, as well as inside the factory. The dominating environmental problem in the Indian cement plants is the emission of dust to the atmosphere. The production of cement, irrespective of the technique adopted (dry, semi-dry, and wet) results in dust generation, and hence, pollution. However, dust generation is most intense in the dry process. Taking into account the air pollution by the cement industry, emission standards have
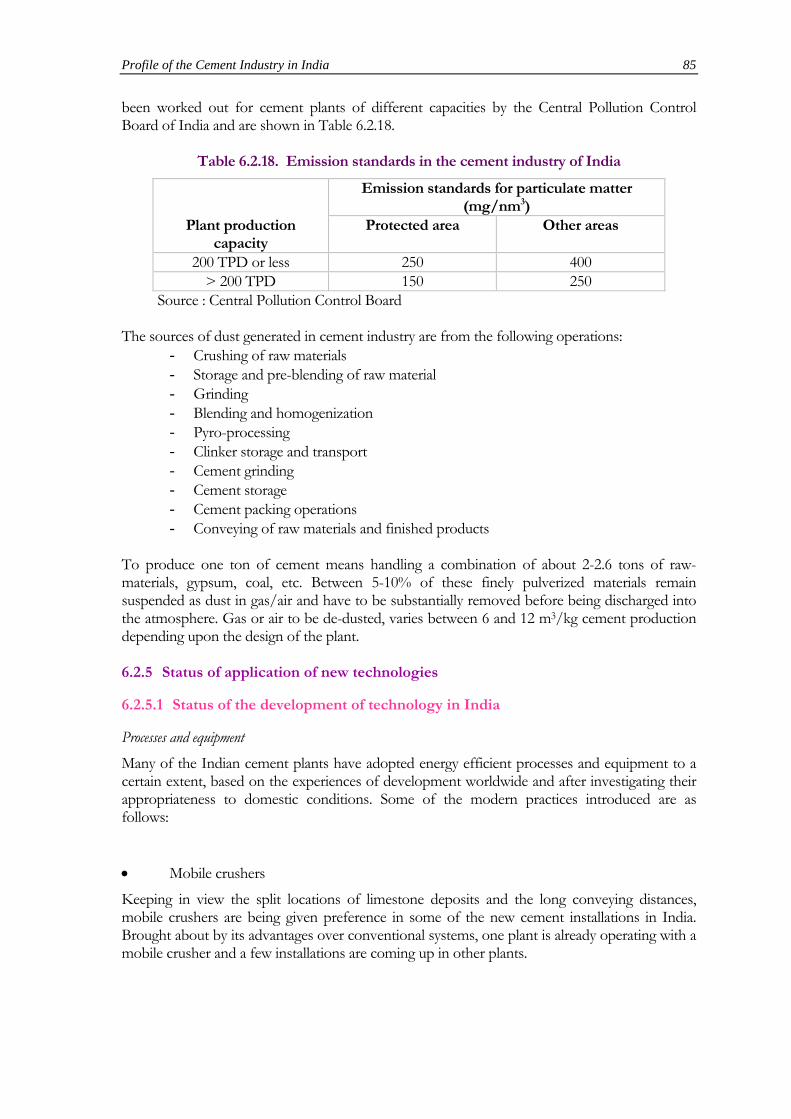
Profile of the Cement Industry in India 85
been worked out for cement plants of different capacities by the Central Pollution Control Board of India and are shown in Table 6.2.18.
Table 6.2.18. Emission standards in the cement industry of India
Emission standards for particulate matter (mg/nm3)
Plant production capacity
Protected area Other areas
200 TPD or less 250 400 > 200 TPD 150 250
Source : Central Pollution Control Board The sources of dust generated in cement industry are from the following operations:
- Crushing of raw materials - Storage and pre-blending of raw material - Grinding - Blending and homogenization - Pyro-processing - Clinker storage and transport - Cement grinding - Cement storage - Cement packing operations - Conveying of raw materials and finished products
To produce one ton of cement means handling a combination of about 2-2.6 tons of raw-materials, gypsum, coal, etc. Between 5-10% of these finely pulverized materials remain suspended as dust in gas/air and have to be substantially removed before being discharged into the atmosphere. Gas or air to be de-dusted, varies between 6 and 12 m3/kg cement production depending upon the design of the plant. 6.2.5 Status of application of new technologies
6.2.5.1 Status of the development of technology in India
Processes and equipment Many of the Indian cement plants have adopted energy efficient processes and equipment to a certain extent, based on the experiences of development worldwide and after investigating their appropriateness to domestic conditions. Some of the modern practices introduced are as follows: • Mobile crushers
Keeping in view the split locations of limestone deposits and the long conveying distances, mobile crushers are being given preference in some of the new cement installations in India. Brought about by its advantages over conventional systems, one plant is already operating with a mobile crusher and a few installations are coming up in other plants.

86 Technology, Energy Efficiency and Environmental Externalities of the Cement Industry
• Gyratory crushers A few plants are operating with gyratory crushers, though its acceptability is still limited mainly due to capacity considerations. • Vertical roller mills In the 54 sample plants studied, the number of vertical roller mills installed in the Raw Meal Grinding and Coal Mill Sections are given in Table 6.2.19.
Table 6.2.19. Adoption of vertical roller mills vis-à-vis ball mills
Section/Mill Dry Semi-dry Wet Mixed Total Raw Meal Grinding Ball mill 20 2 19 2 43 Vertical roller 10 - - - 10 Coal Mill Ball mill 9 1 16 - 26 Vertical roller 6 - - - 6
From the table, it is seen that all the wet and semi dry process plants utilize ball mills only in the raw meal grinding as well as in coal mill sections. In the case of the dry process plants, a number of plants operate with vertical roller mills. In the raw meal grinding section, 33% of the plants have vertical roller mills and in the coal mill section, 40% of the plants are operating with vertical roller mills. • Tandem mills
These mills have been well accepted and introduced in many Indian cement plants. • High pressure grinding rolls (roller press)
Two plants have already installed roller presses for raw materials grinding after realizing the benefits of increased productivity and reduction in energy consumption. • Dust collecting equipment
The emission of dust particles causes loss of energy as well as loss in production, which otherwise can be recycled through insufflation and re-utilized in cement manufacture. For kiln flue gases, coal mill vent air and cement mill exit air Electro-Static Precipitators (ESPs) of latest technology are being installed. For venting out the excess hot air from the cooler, high-temperature ESPs are being considered. The introduction of these ESPs can result in conserving energy during cement manufacture. For transfer points of conveying system, cassette-type bag dust collectors have also been accepted in some of the plants. • Precalcination technology and 5/6-stage suspension preheater
Many of the new installations have come up with precalciner kiln which have resulted in reduced kiln dimensions. The use of precalcinator also enables the utilization of high ash coals which is a significant advantage under the Indian conditions.
Profile of the Cement Industry in India 87
Similarly, installation of 5-stage preheater precalciner system has also led to pressure drops which give a thermal energy saving of 30-40 kcal/kg clinker, thereby promoting energy conservation. Further addition of the sixth stage can bring additional energy saving of 15-20 kcal/kg clinker. The analysis of kilns set up during the period between 1981 and 1991 have shown that out of 27 dry process kilns installed during this period, 15 have incorporated precalcination technology, 8 are operating with 5 stage preheater ,and one plant has gone for 6th stage preheater. Low pressure cyclones have also been well accepted in all the new installations. Instrumentation, process control and computerization With the increase in size of the cement units and consequently, the large magnitude of material handling and movement, it has become essential to go in for a reasonable extent of automation in the cement industry. Most of the modern dry process cement plants in the country are presently equipped with advanced instrumentation and process control systems with either micro-processor based control systems or complete computerized controls. Almost all one million ton per annum cement plants in the country have gone for the use of micro computer/computer for process monitoring and control, data acquisition, supervision and management information system. Eight cement plants in India have installed computerized expert systems for on-line kiln operations. The Indian cement industry has been able to develop the necessary capability towards application engineering and maintenance of these sophisticated automation systems and these are likely to find greater application in the future capacities. With more than 50 organizations throughout the world supplying different types of automation systems, the selection of the most appropriate automation and computerized control system becomes a very difficult task. With this kind of a scenario, it is important that some kind of standardization is attempted on the use of such automation system based on their operational experience. Moreover, with the high technological status of the computer industry, both from software and hardware angle in the country, greater efforts should be directed towards indigenization of these systems. In addition to advanced process and operational control, the use of infrared type shell temperature scanners have found wider application with the advent of high capacity kilns. These computerized scanning systems are presently available with an integrated software package for complete refractory management which can monitor and predict refractory conditions resulting in substantial reduction of downtime due to refractory failures. In addition to the wide use of computers for on-line process control in the cement industry, computers have also found significant application in the area of quality control. The use of XRF analyzers with on-line computers has helped in automating raw material preparation in order to maintain uniform quality of raw meal feed to the kiln. Recently, the use of Neutron Activation Technique has also been reported for both on-line bulk analysis as well as off-line elemental analysis and these systems are available with real-time computers which enable immediate corrective action. Comprehensive computerization in the manufacturing process and conversion of existing plants to modem control methods, by utilizing analytical instrumentation are on the move worldwide. Computer-based systems have been installed to maintain control over the blending process in many countries. The present maintenance practices in cement plants have shown that considerable production time is lost due to unplanned and unscheduled maintenance stoppages. The condition monitoring systems (CMS) now in vogue, predict problems likely to arise and
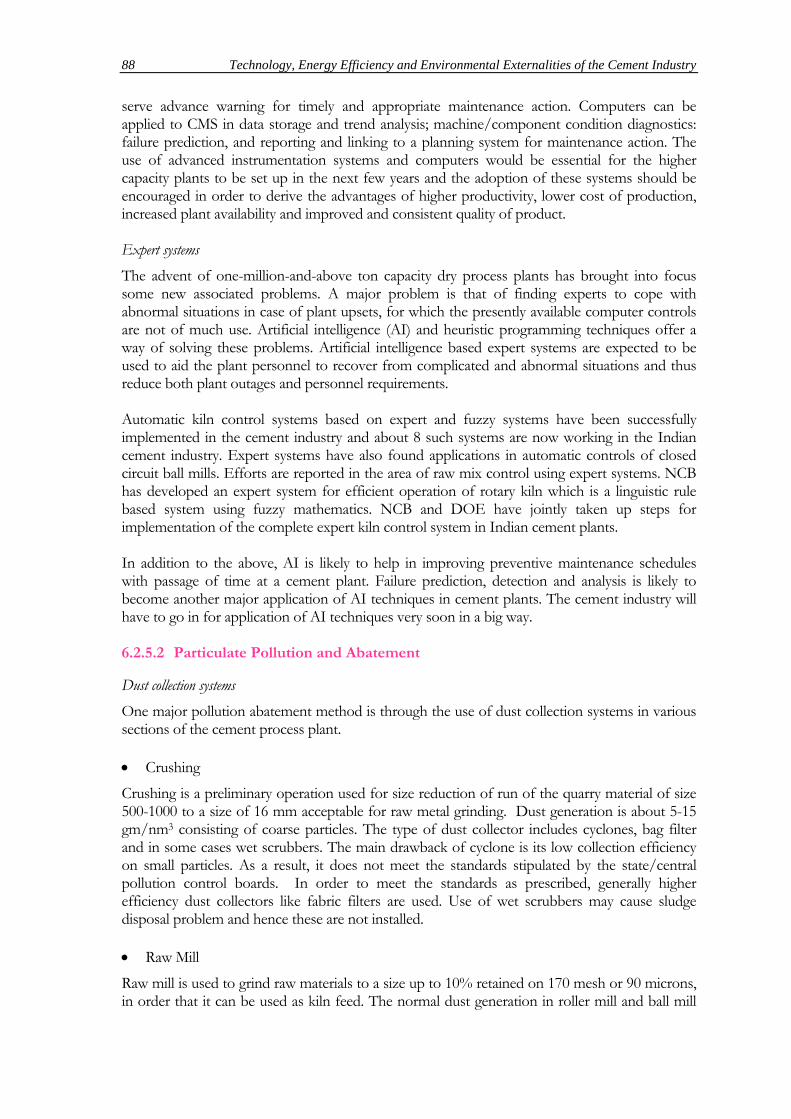
88 Technology, Energy Efficiency and Environmental Externalities of the Cement Industry
serve advance warning for timely and appropriate maintenance action. Computers can be applied to CMS in data storage and trend analysis; machine/component condition diagnostics: failure prediction, and reporting and linking to a planning system for maintenance action. The use of advanced instrumentation systems and computers would be essential for the higher capacity plants to be set up in the next few years and the adoption of these systems should be encouraged in order to derive the advantages of higher productivity, lower cost of production, increased plant availability and improved and consistent quality of product. Expert systems The advent of one-million-and-above ton capacity dry process plants has brought into focus some new associated problems. A major problem is that of finding experts to cope with abnormal situations in case of plant upsets, for which the presently available computer controls are not of much use. Artificial intelligence (AI) and heuristic programming techniques offer a way of solving these problems. Artificial intelligence based expert systems are expected to be used to aid the plant personnel to recover from complicated and abnormal situations and thus reduce both plant outages and personnel requirements. Automatic kiln control systems based on expert and fuzzy systems have been successfully implemented in the cement industry and about 8 such systems are now working in the Indian cement industry. Expert systems have also found applications in automatic controls of closed circuit ball mills. Efforts are reported in the area of raw mix control using expert systems. NCB has developed an expert system for efficient operation of rotary kiln which is a linguistic rule based system using fuzzy mathematics. NCB and DOE have jointly taken up steps for implementation of the complete expert kiln control system in Indian cement plants. In addition to the above, AI is likely to help in improving preventive maintenance schedules with passage of time at a cement plant. Failure prediction, detection and analysis is likely to become another major application of AI techniques in cement plants. The cement industry will have to go in for application of AI techniques very soon in a big way. 6.2.5.2 Particulate Pollution and Abatement
Dust collection systems One major pollution abatement method is through the use of dust collection systems in various sections of the cement process plant. • Crushing
Crushing is a preliminary operation used for size reduction of run of the quarry material of size 500-1000 to a size of 16 mm acceptable for raw metal grinding. Dust generation is about 5-15 gm/nm3 consisting of coarse particles. The type of dust collector includes cyclones, bag filter and in some cases wet scrubbers. The main drawback of cyclone is its low collection efficiency on small particles. As a result, it does not meet the standards stipulated by the state/central pollution control boards. In order to meet the standards as prescribed, generally higher efficiency dust collectors like fabric filters are used. Use of wet scrubbers may cause sludge disposal problem and hence these are not installed. • Raw Mill
Raw mill is used to grind raw materials to a size up to 10% retained on 170 mesh or 90 microns, in order that it can be used as kiln feed. The normal dust generation in roller mill and ball mill
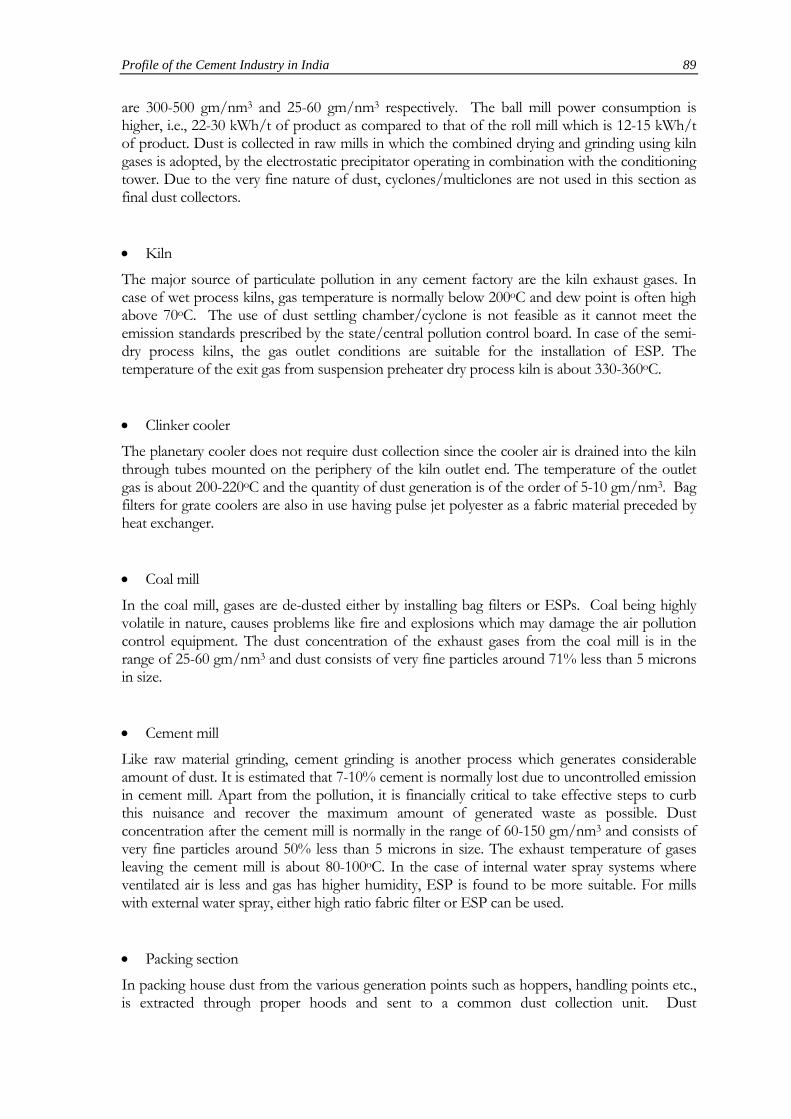
Profile of the Cement Industry in India 89
are 300-500 gm/nm3 and 25-60 gm/nm3 respectively. The ball mill power consumption is higher, i.e., 22-30 kWh/t of product as compared to that of the roll mill which is 12-15 kWh/t of product. Dust is collected in raw mills in which the combined drying and grinding using kiln gases is adopted, by the electrostatic precipitator operating in combination with the conditioning tower. Due to the very fine nature of dust, cyclones/multiclones are not used in this section as final dust collectors. • Kiln
The major source of particulate pollution in any cement factory are the kiln exhaust gases. In case of wet process kilns, gas temperature is normally below 200oC and dew point is often high above 70oC. The use of dust settling chamber/cyclone is not feasible as it cannot meet the emission standards prescribed by the state/central pollution control board. In case of the semi-dry process kilns, the gas outlet conditions are suitable for the installation of ESP. The temperature of the exit gas from suspension preheater dry process kiln is about 330-360oC. • Clinker cooler
The planetary cooler does not require dust collection since the cooler air is drained into the kiln through tubes mounted on the periphery of the kiln outlet end. The temperature of the outlet gas is about 200-220oC and the quantity of dust generation is of the order of 5-10 gm/nm3. Bag filters for grate coolers are also in use having pulse jet polyester as a fabric material preceded by heat exchanger. • Coal mill
In the coal mill, gases are de-dusted either by installing bag filters or ESPs. Coal being highly volatile in nature, causes problems like fire and explosions which may damage the air pollution control equipment. The dust concentration of the exhaust gases from the coal mill is in the range of 25-60 gm/nm3 and dust consists of very fine particles around 71% less than 5 microns in size. • Cement mill
Like raw material grinding, cement grinding is another process which generates considerable amount of dust. It is estimated that 7-10% cement is normally lost due to uncontrolled emission in cement mill. Apart from the pollution, it is financially critical to take effective steps to curb this nuisance and recover the maximum amount of generated waste as possible. Dust concentration after the cement mill is normally in the range of 60-150 gm/nm3 and consists of very fine particles around 50% less than 5 microns in size. The exhaust temperature of gases leaving the cement mill is about 80-100oC. In the case of internal water spray systems where ventilated air is less and gas has higher humidity, ESP is found to be more suitable. For mills with external water spray, either high ratio fabric filter or ESP can be used. • Packing section
In packing house dust from the various generation points such as hoppers, handling points etc., is extracted through proper hoods and sent to a common dust collection unit. Dust
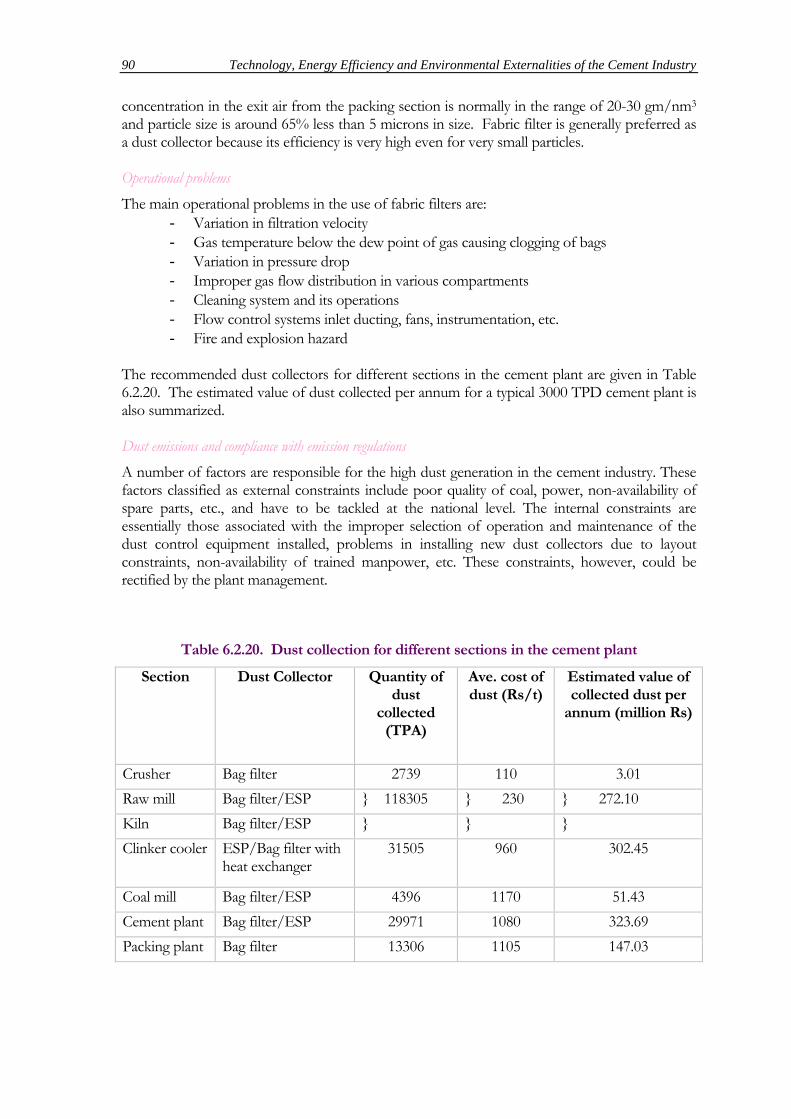
90 Technology, Energy Efficiency and Environmental Externalities of the Cement Industry
concentration in the exit air from the packing section is normally in the range of 20-30 gm/nm3 and particle size is around 65% less than 5 microns in size. Fabric filter is generally preferred as a dust collector because its efficiency is very high even for very small particles. Operational problems The main operational problems in the use of fabric filters are:
- Variation in filtration velocity - Gas temperature below the dew point of gas causing clogging of bags - Variation in pressure drop - Improper gas flow distribution in various compartments - Cleaning system and its operations - Flow control systems inlet ducting, fans, instrumentation, etc. - Fire and explosion hazard
The recommended dust collectors for different sections in the cement plant are given in Table 6.2.20. The estimated value of dust collected per annum for a typical 3000 TPD cement plant is also summarized. Dust emissions and compliance with emission regulations A number of factors are responsible for the high dust generation in the cement industry. These factors classified as external constraints include poor quality of coal, power, non-availability of spare parts, etc., and have to be tackled at the national level. The internal constraints are essentially those associated with the improper selection of operation and maintenance of the dust control equipment installed, problems in installing new dust collectors due to layout constraints, non-availability of trained manpower, etc. These constraints, however, could be rectified by the plant management.
Table 6.2.20. Dust collection for different sections in the cement plant
Section Dust Collector Quantity of dust
collected (TPA)
Ave. cost of dust (Rs/t)
Estimated value of collected dust per
annum (million Rs)
Crusher Bag filter 2739 110 3.01 Raw mill Bag filter/ESP } 118305 } 230 } 272.10 Kiln Bag filter/ESP } } } Clinker cooler ESP/Bag filter with
heat exchanger 31505 960 302.45
Coal mill Bag filter/ESP 4396 1170 51.43 Cement plant Bag filter/ESP 29971 1080 323.69 Packing plant Bag filter 13306 1105 147.03
Profile of the Cement Industry in India 91
External constraints There is a wide variation in the quality of coal received by the cement plants for use in the production process. The ash content of the coal varies from 22-45% and the calorific value from 3000-5000 kcal/kg coal. The variation in the coal used frequently leads to improper combustion and control of air flow, resulting in high concentration of CO in the exit which in turn creates the danger of an explosion in the ESP. Instances are not unknown in cement manufacture when the CO concentration goes up to as high as 0.2-0.6% in the air as a result of high dust emissions. For proper operations of the ESP equipment, there must be a continuous and regular supply of power. Long duration of low voltage fluctuations and unscheduled power cuts adversely affect the efficiency of precipitators in controlling and regulating emissions. These problems can be gotten rid of when plants are equipped with captive power units of sufficient capacity so as to enable ESP to perform effectively. A common problem faced by the cement plants in controlling pollution is the non-availability of spare parts. In the case of fabric filters, non-availability of filter media is a major constraint. In the coal mills section of the plant, there should always be an ample stock of spare bags which is not always possible because in the case of pulse jet filters, the bags have to be imported. Also, fiber glass fabrics are not indigenously manufactured and have to be imported at a great expense. Internal constraints High dust emission in a cement plant is either due to the absence of efficient dust collectors or due to the improper maintenance and operation. Most of the dust collectors have been reported to be inefficiently operated. It has been found that 63% of ESPs installed in the kiln section emit more than 250 mg/nm3 which is undesirable. In the wet process of cement production, the de-dusting of kiln gases is a serious problem because of its partially calcined nature. Reports of investigations indicate that the chemical nature of dust generated by the wet process varies widely. There are various techniques presently available for controlling kiln dust in the wet process of manufacture such as insufflation, scoop method, mixing with slurry, nodulization and feeding in the kiln. The technique generally adopted, however, depends on the nature of dust generated, plant layout, etc. It is necessary to train manpower in the industry to maintain a clean environment. Programs can be initiated with the objective of training personnel in the monitoring of dust emission-related instrumentation and environmental improvement. The state-wise distribution of major cement factories and their pollution control status is given in Table 6.2.21.
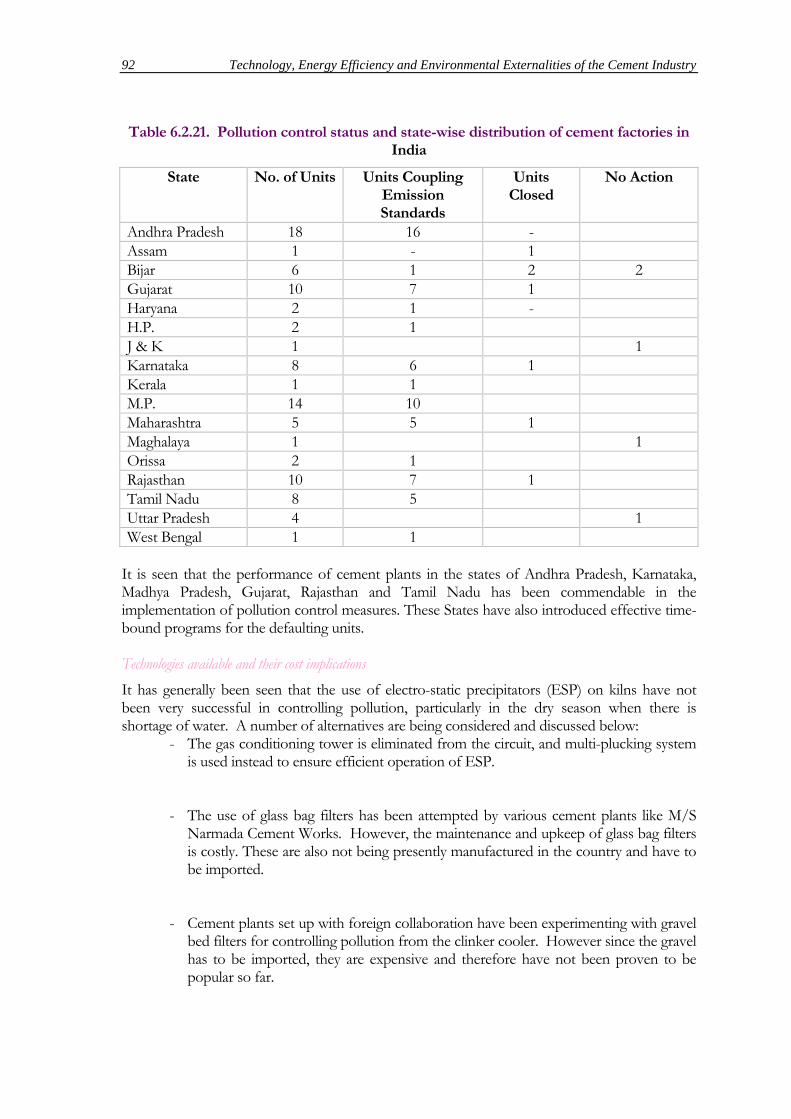
92 Technology, Energy Efficiency and Environmental Externalities of the Cement Industry
Table 6.2.21. Pollution control status and state-wise distribution of cement factories in India
State No. of Units Units Coupling Emission Standards
Units Closed
No Action
Andhra Pradesh 18 16 - Assam 1 - 1 Bijar 6 1 2 2 Gujarat 10 7 1 Haryana 2 1 - H.P. 2 1 J & K 1 1 Karnataka 8 6 1 Kerala 1 1 M.P. 14 10 Maharashtra 5 5 1 Maghalaya 1 1 Orissa 2 1 Rajasthan 10 7 1 Tamil Nadu 8 5 Uttar Pradesh 4 1 West Bengal 1 1
It is seen that the performance of cement plants in the states of Andhra Pradesh, Karnataka, Madhya Pradesh, Gujarat, Rajasthan and Tamil Nadu has been commendable in the implementation of pollution control measures. These States have also introduced effective time-bound programs for the defaulting units. Technologies available and their cost implications It has generally been seen that the use of electro-static precipitators (ESP) on kilns have not been very successful in controlling pollution, particularly in the dry season when there is shortage of water. A number of alternatives are being considered and discussed below:
- The gas conditioning tower is eliminated from the circuit, and multi-plucking system is used instead to ensure efficient operation of ESP.
- The use of glass bag filters has been attempted by various cement plants like M/S
Narmada Cement Works. However, the maintenance and upkeep of glass bag filters is costly. These are also not being presently manufactured in the country and have to be imported.
- Cement plants set up with foreign collaboration have been experimenting with gravel
bed filters for controlling pollution from the clinker cooler. However since the gravel has to be imported, they are expensive and therefore have not been proven to be popular so far.
Profile of the Cement Industry in India 93
- Despite the use of ESP for dusting kiln, high emission of CO gas have been detected in the past. ESP has not been successful due to large fluctuations in the quality of coal received. Cement plants have installed bed-blending systems to achieve a certain level of homogenization of the coal received and limit the effect of variation in ash content. The system is expensive, costing around Rs.100 to 150 million.
- The ability of ESP's to control pollution has been severely curtailed by frequent
failures in the supply of electricity as well as voltage fluctuations. 6.2.5.3 Status of Research and Development
Only a few manufacturing units have established in-house research and development (R&D) facilities. In most of the units, R&D is confined to testing and quality control purposes only. Out of the 54 sample units for study, only 3 units have given details of R & D projects done by them. The nature of projects undertaken by R&D, specifically related to energy economics are as follows :
- Evaluation of various techniques for moisture reduction in wet process plants for achieving fuel economy
- Evaluation of grinding aids for improved clinker grinding and energy saving - Use of mineralizers and fixtures in manufacture of clinker for fuel economy - Study on using lignite as fuel - Optimizing the process parameters for kiln and mills.
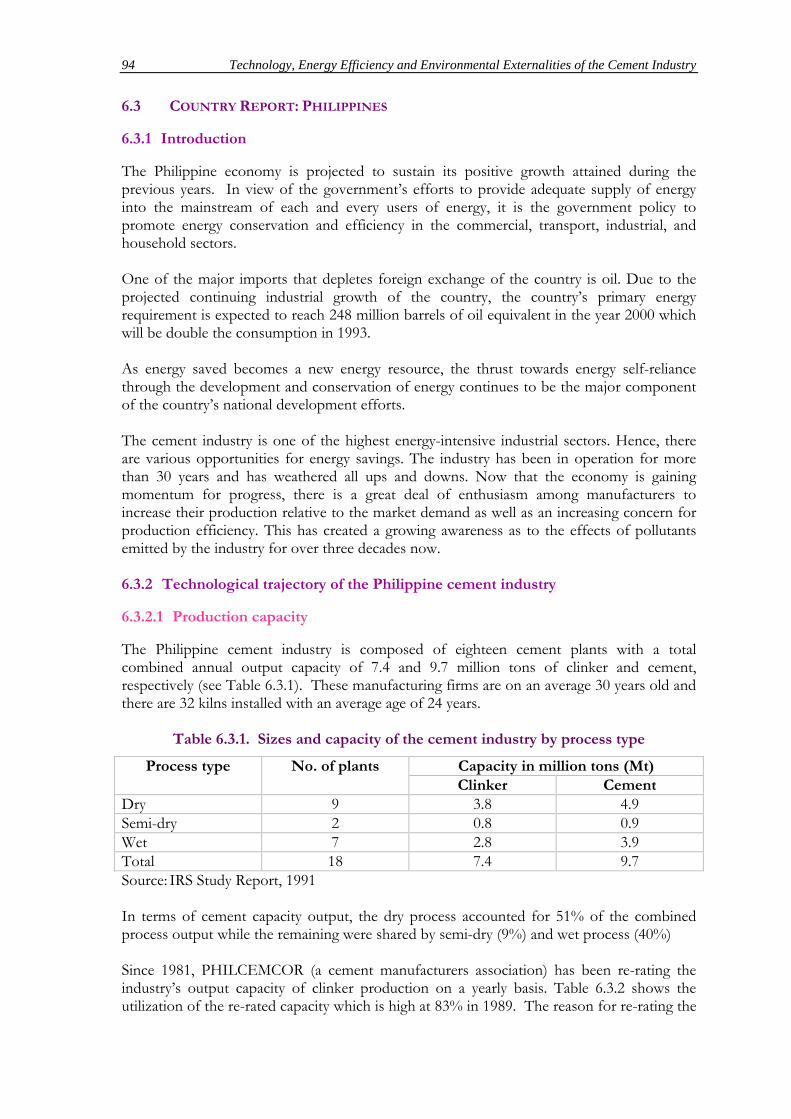
94 Technology, Energy Efficiency and Environmental Externalities of the Cement Industry
6.3 COUNTRY REPORT: PHILIPPINES
6.3.1 Introduction
The Philippine economy is projected to sustain its positive growth attained during the previous years. In view of the government’s efforts to provide adequate supply of energy into the mainstream of each and every users of energy, it is the government policy to promote energy conservation and efficiency in the commercial, transport, industrial, and household sectors. One of the major imports that depletes foreign exchange of the country is oil. Due to the projected continuing industrial growth of the country, the country’s primary energy requirement is expected to reach 248 million barrels of oil equivalent in the year 2000 which will be double the consumption in 1993. As energy saved becomes a new energy resource, the thrust towards energy self-reliance through the development and conservation of energy continues to be the major component of the country’s national development efforts. The cement industry is one of the highest energy-intensive industrial sectors. Hence, there are various opportunities for energy savings. The industry has been in operation for more than 30 years and has weathered all ups and downs. Now that the economy is gaining momentum for progress, there is a great deal of enthusiasm among manufacturers to increase their production relative to the market demand as well as an increasing concern for production efficiency. This has created a growing awareness as to the effects of pollutants emitted by the industry for over three decades now. 6.3.2 Technological trajectory of the Philippine cement industry
6.3.2.1 Production capacity
The Philippine cement industry is composed of eighteen cement plants with a total combined annual output capacity of 7.4 and 9.7 million tons of clinker and cement, respectively (see Table 6.3.1). These manufacturing firms are on an average 30 years old and there are 32 kilns installed with an average age of 24 years.
Table 6.3.1. Sizes and capacity of the cement industry by process type
Process type No. of plants Capacity in million tons (Mt) Clinker Cement
Dry 9 3.8 4.9 Semi-dry 2 0.8 0.9 Wet 7 2.8 3.9 Total 18 7.4 9.7 Source: IRS Study Report, 1991 In terms of cement capacity output, the dry process accounted for 51% of the combined process output while the remaining were shared by semi-dry (9%) and wet process (40%) Since 1981, PHILCEMCOR (a cement manufacturers association) has been re-rating the industry’s output capacity of clinker production on a yearly basis. Table 6.3.2 shows the utilization of the re-rated capacity which is high at 83% in 1989. The reason for re-rating the
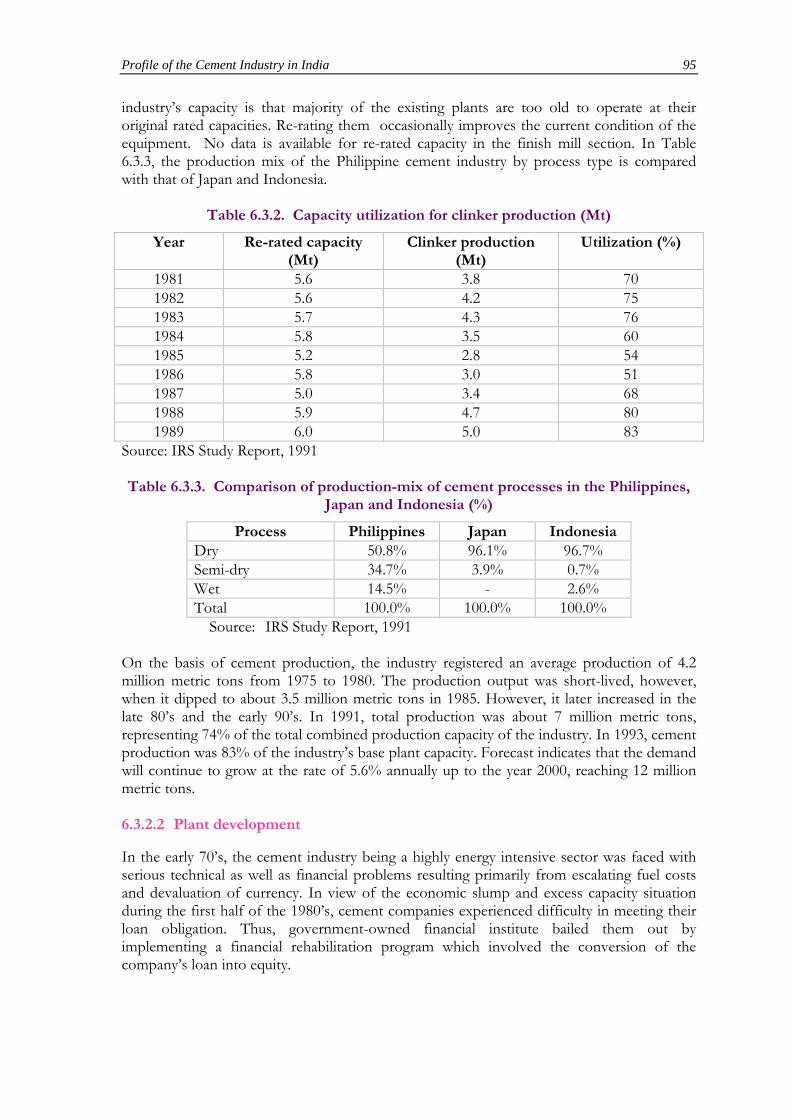
Profile of the Cement Industry in India 95
industry’s capacity is that majority of the existing plants are too old to operate at their original rated capacities. Re-rating them occasionally improves the current condition of the equipment. No data is available for re-rated capacity in the finish mill section. In Table 6.3.3, the production mix of the Philippine cement industry by process type is compared with that of Japan and Indonesia.
Table 6.3.2. Capacity utilization for clinker production (Mt)
Year Re-rated capacity (Mt)
Clinker production (Mt)
Utilization (%)
1981 5.6 3.8 70 1982 5.6 4.2 75 1983 5.7 4.3 76 1984 5.8 3.5 60 1985 5.2 2.8 54 1986 5.8 3.0 51 1987 5.0 3.4 68 1988 5.9 4.7 80 1989 6.0 5.0 83
Source: IRS Study Report, 1991 Table 6.3.3. Comparison of production-mix of cement processes in the Philippines,
Japan and Indonesia (%)
Process Philippines Japan Indonesia Dry 50.8% 96.1% 96.7% Semi-dry 34.7% 3.9% 0.7% Wet 14.5% - 2.6% Total 100.0% 100.0% 100.0%
Source: IRS Study Report, 1991 On the basis of cement production, the industry registered an average production of 4.2 million metric tons from 1975 to 1980. The production output was short-lived, however, when it dipped to about 3.5 million metric tons in 1985. However, it later increased in the late 80’s and the early 90’s. In 1991, total production was about 7 million metric tons, representing 74% of the total combined production capacity of the industry. In 1993, cement production was 83% of the industry’s base plant capacity. Forecast indicates that the demand will continue to grow at the rate of 5.6% annually up to the year 2000, reaching 12 million metric tons. 6.3.2.2 Plant development
In the early 70’s, the cement industry being a highly energy intensive sector was faced with serious technical as well as financial problems resulting primarily from escalating fuel costs and devaluation of currency. In view of the economic slump and excess capacity situation during the first half of the 1980’s, cement companies experienced difficulty in meeting their loan obligation. Thus, government-owned financial institute bailed them out by implementing a financial rehabilitation program which involved the conversion of the company’s loan into equity.

96 Technology, Energy Efficiency and Environmental Externalities of the Cement Industry
One of the milestones of the Philippine cement industry is the issuance of the Letter of Instruction no. 752 and 1094 in 1980, which states among others the switching of fuel from bunker oil to coal in the existing plants. This was done in order to lessen the industry’s dependence on crude oil as energy source. To put further relief to these manufacturing companies from other financial obligations, the government on the same token, liberalized importation of coal. To date, all cement manufacturing plants have converted to coal. With the industry’s cement demand steadily climbing up since 1988, the government launched the Cement Industry Rehabilitation program whose aim is to provide adequate supply of cement in the local market. With the outdated processes and aging equipment, without a major rehabilitation effort, it is possible that the current production may fail to meet the demand in the coming years. Some developmental/rehabilitation projects adopted by some of the cement firm are:
- installation of additional equipment; - conversion from direct to indirect firing system; - improvement of existing facility; - rehabilitation of small capacity kilns to achieve rated output; - conversion of semi-dry process to dry process; - installation of precalciner to increase plant capacity; and - rehabilitation of clinker cooler to increase kiln capacity.
6.3.3 Evolution of energy efficiency in the Philippine cement industry
There are three types of processes employed by the industry. These are the wet, dry and semi-dry processes. The technologies employed in the Philippines are outdated, resulting in high fuel and electricity consumption. For instance, the average heat consumption of the industry is 1200 kcal/kg clinker, while the average specific power (electricity) consumption is 129 kWh/ton cement, much higher than that in the industrialized countries. The Philippine cement industry is heavily dependent on the following types of energy sources: coal, petcoke, bunker oil and electricity. For thermal usage, Table 6.3.4 shows that shares of local coal was 52% and the remaining amount came from imported coal (22%), petcoke (7%), fuel oil(18%) and others (1%).
Table 6.3.4. Share of fuel consumption (%)
Year Local coal Imported coal
Petcoke Fuel oil Others
1991 59.0 27.0 4.0 9.0 1.0 1992 50.7 17.3 8.8 22.5 0.7 1993 47.0 21.0 9.0 23.0 0.3 1994 52.0 22.0 7.0 18.0 1.0
Source: IRS Study Report, 1991 Energy audits conducted by the Office of Energy Affairs for the “Sectors Study report for the Cement Industry” in 1989 reported that in the wet process, energy input is relatively much higher at 85% compared to the dry process which is only 75%. This is understandable owing to the fact that in the wet process, water in the slurry accounts for 40% more of the input energy (see Table 6.3.5).

Profile of the Cement Industry in India 97
Table 6.3.5. Energy usage in the cement industry
Total Energy Input (%) Dry Wet Mechanical Power Drive 24 12.1 Process Heating 74.5 85.4 Transport/Out-of Plant Equipment
0.5 1.2
Lighting/Air Conditioning 1 1.3 Total 100 100
Source: Sectoral Study for the Cement Industry, 1989. Table 6.3.6 shows that the wet process specific energy consumption is very high, ranging from 141.03 to 188.05 kgoe/ton cement compared to the acceptable international standard range which is 94.88 to 102.57 kgoe/ton cement. However, in the dry process the specific energy consumption shows sign of potential for improvement. It attained the highest specific energy consumption at 122.23 kgoe/ton-cement down to 103.43 kgoe/ton-cement while the acceptable level was from 68.38-105.13 kgoe/ton-cement.
Table 6.3.6. Average specific energy use by process type in the Philippines
Process 1991 1992 1993 1994 Dry 112.83 122.23 103.43 68.38 - 105.13Semi-dry 150.44 159.84 141.03 - Wet 141.03 197.45 188.05 94.88 - 102.57Average 135.05 159.84 144.45 From the study conducted in 1991 to 1993, the specific electrical power consumption of the industry averages 130 kWh/ton cement. In comparison with its Asian neighbors, the Philippine cement industry was lagging behind in efficiency improvement (see Table 6.3.7). This indicates that the cement sector is operating quite inefficiently.
Table 6.3.7. Specific electrical energy consumption of the Philippines in comparison with other Asian countries, 1993
SPC, kWh/ton cement Thailand Japan Korea Taiwan Indonesia Malaysia Philippines
85 96 107 108 114 114 130
Source: PHILCEMCOR,1994 For the same period, the specific power consumption (SPC) by process type indicates that the semi-dry process has an SPC of 157 kWh/ton cement, followed by the dry process at 142 kWh/ton cement and the wet process at 105 kWh/ton cement (see Table 6.3.8).
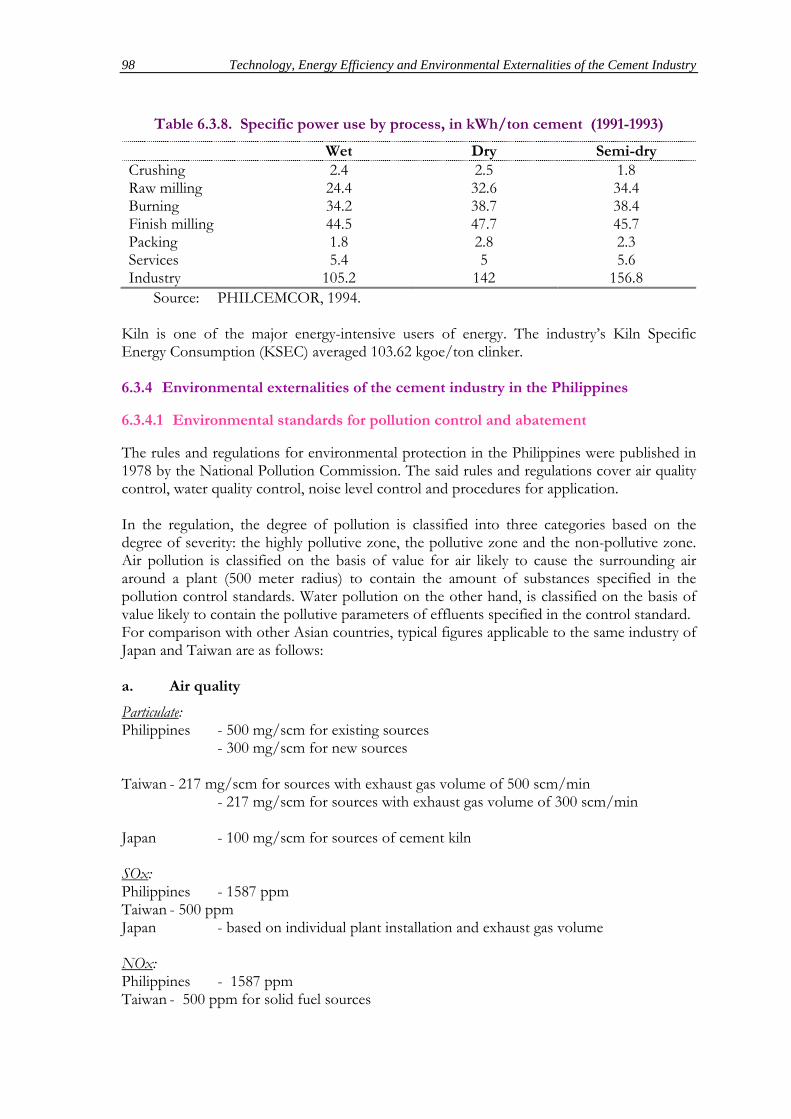
98 Technology, Energy Efficiency and Environmental Externalities of the Cement Industry
Table 6.3.8. Specific power use by process, in kWh/ton cement (1991-1993)
Wet Dry Semi-dry Crushing Raw milling Burning Finish milling Packing Services Industry
2.4 24.4 34.2 44.5 1.8 5.4
105.2
2.5 32.6 38.7 47.7 2.8 5
142
1.8 34.4 38.4 45.7 2.3 5.6
156.8 Source: PHILCEMCOR, 1994. Kiln is one of the major energy-intensive users of energy. The industry’s Kiln Specific Energy Consumption (KSEC) averaged 103.62 kgoe/ton clinker. 6.3.4 Environmental externalities of the cement industry in the Philippines
6.3.4.1 Environmental standards for pollution control and abatement
The rules and regulations for environmental protection in the Philippines were published in 1978 by the National Pollution Commission. The said rules and regulations cover air quality control, water quality control, noise level control and procedures for application. In the regulation, the degree of pollution is classified into three categories based on the degree of severity: the highly pollutive zone, the pollutive zone and the non-pollutive zone. Air pollution is classified on the basis of value for air likely to cause the surrounding air around a plant (500 meter radius) to contain the amount of substances specified in the pollution control standards. Water pollution on the other hand, is classified on the basis of value likely to contain the pollutive parameters of effluents specified in the control standard. For comparison with other Asian countries, typical figures applicable to the same industry of Japan and Taiwan are as follows: a. Air quality
Particulate: Philippines - 500 mg/scm for existing sources - 300 mg/scm for new sources Taiwan - 217 mg/scm for sources with exhaust gas volume of 500 scm/min - 217 mg/scm for sources with exhaust gas volume of 300 scm/min Japan - 100 mg/scm for sources of cement kiln SOx: Philippines - 1587 ppm Taiwan - 500 ppm Japan - based on individual plant installation and exhaust gas volume NOx: Philippines - 1587 ppm Taiwan - 500 ppm for solid fuel sources

Profile of the Cement Industry in India 99
Japan - 350 ppm for sources with exhaust gas volume < 100,000 scm/min The air quality standard in the Philippines is considered to be mild compared to other countries. However, in consideration of the accumulated amount of pollutants by which the environment may be much affected in the near future, the present air quality standards should be changed to some extent. b. Water quality
The present water quality standards include a lot of quality parameters to be monitored. However, only a few quality parameters which are considered to be applicable to the cement industry are shown below. pH: Philippines - 6.0 - 8.5 for class “D” water Taiwan - 5.0 - 9.0 Japan - 6.0 - 8.5 for class “D” water Temperature: Philippines - 40OC Taiwan - Max. rise shall not exceed 4OC Japan - No provision c. Suspended solids
Philippines - 75 mg/1 (75 ppm) for class “D” water Taiwan - 300 ppm Japan - 100 ppm for class “D” water Almost all wastes from a cement plant is usually discharged from a water cooling pond. The wastewater, therefore, is discharged substantially from the cement plant with no special pollutants, except for a few suspended solids. 6.3.4.2 Pollution control equipment
Table 6.3.9 shows the type of dust collectors installed by the cement industry. Some 24 percent of the total number of production sections in the industry have no dust collector equipment. A few dust collectors are installed in the crusher and raw material drier sections. Most cement plant operators believe that these sections do not emit much dust. Actually, a lot of fine particles is produced in these sections and some are discharged into the atmosphere. Therefore dust collectors with high efficiency should be immediately installed especially in the drier section.

100 Technology, Energy Efficiency and Environmental Externalities of the Cement Industry
Table 6.3.9. Distribution of dust collectors installed in the Philippine cement industry (# of cement plants)
Application Area
Electro-static section
Bag filter precipitator
Multi- cylone
Single cylone
Number of installations
Crusher Drier Raw Mill Kiln Cooler Cement Mill Packing House Percent (%)
1 4 6 10 0 2 0
19.3
4 2 5 2 0 4 17 37
0 0 0 1 15 0 0
14.3
2 10 0 3 1 1 0 5
10 - 6 1 1 - -
24.4
Source: IRS study for the cement sector, 1991. 6.3.5 Potential for energy efficiency improvement and pollution abatement through technological change
The list of energy efficiency projects undertaken by the cement industry shows a varying degree of application in stages. These include maintenance program to mid-range capital investment such as combustion control and waste heat recovery system. Likewise, the long-range program of coal conversion for cement plants which started in 1980 is completed. From the study report on cement industry by the Office of Energy Affairs in 1989, there is considerable scope for application of various energy efficiency technologies identified and this is discussed below with the corresponding estimated energy savings. Combustion Control For kiln process operation, combustion control systems are indispensable for energy efficient operations. From the survey conducted, flue gas analysis was prevalently used. In some of the plants audited, combustion control system are likewise utilized. However, the need for improvement in terms of additional controls and instrumentation has been identified. The potential savings from the technology was estimated to reach 5113 kgoe annually. This represents 0.2% of the industry’s total consumption for 1988. Cogeneration System Cogeneration is the simultaneous production of electricity and thermal energy from a single energy source. In the case of dry process plants, the higher temperature levels permit installation of the waste heat recovery boilers and turbo generators for in-plant generation. The estimated potential saving for this type of technology is 20968 kgoe annually, representing 0.8% of the industry’s 1988 level of energy consumption. Process Conversion In the case of the wet process plant, conversion to the dry process is a major step in reducing fuel consumption while increasing production capacity. The potential saving was estimated at 102,571 kgoe annually representing 4.2% of the industry’s 1988 level of consumption. Waste Heat Utilization
Profile of the Cement Industry in India 101
An example of the waste heat recovery employed in the industry is the use of hot air from the clinker cooler to heat secondary air to kiln or for drying of raw feed materials. Proper insulation of ducts and hot portions in the system are likewise employed. In line with this, most plants use high quality refractories and better quality insulation to reduce heat losses. Waste heat recovery from kiln system, however, has not been adopted yet. The estimated saving for this type of the technology is 6898 kgoe annually, representing 0.3% of the 1988 energy consumption of the industry. Coal and Waste Fuel Utilization All cements plants have converted to coal firing system since the early 80’s. Although problems of the consistency of coal quality and price are encountered, coal utilization is still viewed as an acceptable energy conservation measure over other liquid fuels. Aside from this, other resources such as rubber tires, rice-hulls, and other combustible wastes are also being utilized. Of the 18 cement plants, four have utilized these waste fuels as supplementary energy source. A new technology using Suspension preheater with Precalciner (SPP) and vertical roller mill is popular in the cement industry of many countries. This technology can reduce the present heat and electricity consumption of the industry by as much as 50% 6.3.6 Status of Application of New Technologies
As of June 1990, there were thirteen cement firms adopting various rehabilitation and/or improvement projects. The production output in 1990 increased by 50% in reference to the 1988 output after improvement/rehabilitation projects were completed. These projects are:
- Installation of kiln with a capacity of 2000 tons per day. - Conversion of direct fired system to indirect fired systems - Improvement/upgrading of existing facility to increase capacity from 1000 tons to
1750 ton/day/unit - Total rehabilitation to achieve rated capacities of small kilns. - Installation of Precalciner to increase plant capacity to 2,700 tons/day. - Rehabilitation of clinker cooler to increase kiln output capacity to 1600 tons/day.
6.3.7 Concluding Remarks
There is a tremendous opportunity for improving the efficiency of energy utilization in the cement industry not only because of its big share in the energy consumption but also because the sector consists of relatively manageable number and sizes of energy-consuming equipment facilities compared to the other sectors. Technologies to improve the efficiencies at the end-user level have been identified, and to some extent, are already being appreciated by the industry. Relieving the increasing burden of energy cost by achieving greater energy efficiency will undoubtedly contribute significantly to lower production cost and enhanced competitiveness of the industry.
102 Technology, Energy Efficiency and Environmental Externalities of the Cement Industry
BIBLIOGRAPHY Sections 1-4 Asian Productivity Organization, 1982. “Energy Conservation in the Cement Industry-Some Experiences”, Tokyo. Bhattacharya, D., 1991. “Assessment of Energy Consumption Pattern Through Energy Analysis of Cement Industry”, Energy Management, January-March, pp. 5-9. Bonn, W., and Lang, Th., 1987. “Burning process (Kiln systems; material cycles; refractory lining; coating problems)”, Process technology of cement manufacturing, Proceedings of VDZ-kongress ‘85, Bauverlag GmbH, Berlin pp. 368 - 384. Braig, H., 1987. “Measures for reducing the noise emission from a cement plant”, Process technology of cement manufacturing, Proceedings of VDZ-kongress ‘85, Bauverlag GmbH, Berlin pp. 625 - 628. Bush, C.W., 1979. “The Decision for Cogeneration at Riverside Cement”, ICS Proceedings. Canadian Portland Cement Association, 1989. “Resources recovery: the cement kiln solution”. Dodson, V.H., 1990. “Concrete admixtures”, Structural engineering series, Van Nostrand Reinhold, New York. Fassbender, A. G., Mcgee, M. M. and Yanase, Y., 1983. “Energy Efficient Industrial Technology in Europe and Japan”, Noyes Data Corporation, Park Ridge, New Jersey, U.S. Fog, M.H. and Nadkarni, K.L., 1983. “Energy Efficiency and Fuel Substitution in the Cement Industry with Emphasis on Developing Countries”, World Bank Technical Paper. George, R.G., 1981. “Designing a Pyroprocessing System for Cement”, ICS Proceedings. Gilliland, J., 1973. “Air pollution control in Portland cement industry”, Industrial air pollution control, edited by Kenneth Noll and Joseph Duncan, Ann Arbor Science Publishers inc., Michigan, USA pp. 195 -202. Gordon, M., 1986. “Cost Effective Energy Reduction in the Cement Sector”, Energy Management Focus, Issue No. 7, p. 26-28. Jhansen, V., Egeløv, A.H., and Eiriksson, A.O., 1987. “Emission of Nox and SO2 from cement clinker burning”, Process technology of cement manufacturing, Proceedings of VDZ-kongress ‘85, Bauverlag GmbH, Berlin pp. 634 - 637. Katsuki, M.H. and Yano, M., 1985. “Automatic Kiln Control with the Aid of a Process Computer”, Process Technology of Cement Manufacturing, p. 548-552, Tokyo, Japan. Kirchner, G., 1987. “Behavior of heavy metals during cement clinker burning”, Process technology of cement manufacturing, Proceedings of VDZ-kongress ‘85, Bauverlag GmbH, Berlin pp. 637 - 641. Kreft, W. and Schütte, R., 1987. “Influence on nitrogen oxide emission of the operating parameters of the cement burning process”, Process technology of cement manufacturing, Proceedings of VDZ-kongress ‘85, Bauverlag GMBH, Berlin pp. 645 - 649.
Profile of the Cement Industry in India 103
Kroboth, K. and Xeller, H., 1987. “Developments in environmental protection in the cement”, Process technology of cement manufacturing, Proceedings of VDZ-kongress ‘85, Bauverlag GMBH, Berlin pp. 600 - 621. Kuklis, A. and Mcintyer, G.T., “Adaptation of Automation in the Cement, Salt, and Iron Industries in South-Central United State”. Labahn, O. and Kohlhaas, B., 1983. “Cement Engineers’ Handbook”, 4th ed., Bauverlag GmbH, Wiesbaden and Berlin. Misgra, J.C., Srivastava, V.K., and Narang, K.C., 1979. “Characterization of kiln dust and exit gases from cement plants”, Process technology of cement manufacturing, Proceedings of VDZ-kongress ‘77, Bauverlag GMBH, Berlin pp. 550 -554. Nemerow, N.L., 1978. “Industrial water pollution: origins, characteristics and treatment”, Addison-Wesley Publishing Company Inc., Reading, Massachusetts, pp. 569 - 571. Overcash, M.R., 1986. “Techniques for Industrial Pollution Prevention A Compendium for Hazardous and Nonhazardous Waste Minimization”, Translated by Michelle L. DeHertogh, Lewis Publishers, Inc. Rao, C.S., 1994. “Environmental Pollution Control Engineering”, Wiley Eastern Limited New Age International Limited, New Delhi. ISBN 81-224-0301-8 Rodenhäuser, F., and Herchenbah, H., 1987. “Reduction of pollutant gas emission from cement plants”, Process technology of cement manufacturing, Proceedings of VDZ-kongress ‘85, Bauverlag GMBH, Berlin pp. 668 - 671. Sahni, S.K., 1989. “Energy Audit and Conservation in Cement Plants”, Energy Management, April-June. Sell, N.J., 1992. “Industrial pollution control issues and techniques”, Van Nostrand Reinhold, New York, pp. 219 - 238. Stearn, E.W., 1980. “Cement Producers Move to Alternate Fuels”, Rock Products. Stoll, U., and Amin, N., 1995. “Pulp and paper industry pollution control and management”, Proceedings of the workshop on Development of Energy Efficient and Environmentally Sound Industrial Technologies in Asia, May 29 - 31, 1995, Manila, Philippine. Tripathy, S.C., Roy, M.C. and Balasubramanian, R., 1992. “Energy Auditing Kit for Cement Industries”, Energy Convers. Mgmt, Vol. 33, No. 12, pp. 1037-1078. UNEP, 1990. “Energy Conservation in Indian Cement Industry”, Industry and Environment Program, April-June, Vol. 13, No. 2, pp. 61. UNEP, 1994. “Cleaner production”, Industry and Environment, Vol 17 No 4, October - December 1994. United Nations, New York, 1990. “Environmental impacts assessment, Guidelines for industrial for development”, ESCAP - Environmental and Development Series, Economic and Social Commission for Asia and Pacific, Bangkok, Thailand.

104 Technology, Energy Efficiency and Environmental Externalities of the Cement Industry
USEPA, 1991. “Pollution Prevention”, United States Environmental Protection Agency. Watson, D., 1980. “Low-Grade Fuels and Their Use in Cement Manufacture”. Wahyu, H, and Abudurrachman, A.,1993. “Energy Auditing in Large Industries- A Case Study in Cement Industry”, Technical Report, AAECP/Energy Project Phase II, RDCAP LIPI Bandung. Widianto, W., 1989. “Thermal Performance Modeling of Cement Industries (A Case Study in Indonesia)”, AIT Thesis No. ET-89-16, Asian Institute of Technology, Bangkok, Thailand. World Bank, 1995. Industrial Pollution Prevention & Abatement Handbook, the World Bank in colloboration with United Nations Industrial Development Organization and United Nations Environment Programme, Preliminary Version. SECTION 5: Economic and Social Commission for Asia and the Pacific (ESCAP), 1993. “Statistical Yearbook for Asia and the Pacific”, United Nations Publication. Energy Management Centre, 1995. “Technological Trajectory, Energy Efficiency and Environmental Externalities of the cement Industry in India”, Ministry of Power, India, Paper presented in the Second SAREC Regional Workshop in Manila, Philippines, 29 & 30 May, 1995. Habitan, A. P., 1995. “Technological Trajectory, Energy Efficiency and Environmental Externalities of the cement Industry in the Philippines”, Energy Efficiency Division, Department of Energy, Philippines, Paper presented in the Second SAREC Regional Workshop in Manila, Philippines, 29 & 30 May, 1995. Ministry of Irrigation, Power and Energy, 1995. “Technological Trajectory, Energy Efficiency and Environmental Externalities of the cement Industry in Sri Lanka”, Paper presented in the Second SAREC Regional Workshop in Manila, Philippines, 29 & 30 May, 1995. Mohanty, Brahmanand. and Aung Naing Oo, 1995. “Energy Saving Opportunities and Potential in the cement Industry”, Asian Institute of Technology, Bangkok, Thailand. Stoll, Uwe. and K. Parameswaran, 1995. “Environmental Impact of Cement Industry and Pollution Control Measures”, Asian Institute of Technology, Bangkok, Thailand. Yanjia, Wang., 1995. “Technological Trajectory, Energy Efficiency and Environmental Externalities of the cement Industry in P.R. China”, Paper presented in the Second SAREC Regional Workshop in Manila, Philippines, 29 & 30 May, 1995. Worrell, E., R.F.A. Cuelenaere, K. Blok and W.C. Turkenbrg , 1994. “Energy Consumption by Industrial Process in the European Union”, Energy, Vol. 19, No. 11. SECTION 6.1 ADB, 1992. National Response Strategy for Globe Climate Change: PRC, ADB TR1690-PRC Cao Chen, Innovation of Wet Process Kiln Cement No. 1. 1992. Chen Ming, 1992. 150 Case Studies of Energy Conservation of Building Material Industry, Chinese Building Material Industry Press ISBN 7-80090-032-0/TU.5, 1992
Profile of the Cement Industry in India 105
Chen Shaocai, Decrease Coal Consumption and Increase Output of Libor Kiln Cement No. 3. 1993 Fu Zicheng, Energy Saving Potential in Cement Clinker Calcine Cement No. 12. 1990. Guo Zhuncai et al., 1993. Technological Advancement of Cement and Concrete, Chinese Building Material Industry Press ISBN 7-80090-071-1/TB.10, 1993. Huang Youfen, 1994. Environmental Pollution and Control of Cement Industry Cement Technology No. 2. 1994. Orlemann, J. A., Jutze, G. A., et al., 1983. Fugijiye Dust Control Technology, NOYES DATA CORPORATION, China Environment Science Press, ISBN 7-80010-490-7/X.267, 1989. National Industrial Pollutant Investigation Office, 1990. National Industrial Pollution Sources Investigation Evaluation and Research, China Environment Science Press, ISBN 7-80010-700-0/X.386, 1990. Wan Quancheng, 1988. Atmosphere Implementation of Cement Plant Waste Gas Emission Cement Technology No. 1. 1988. Yin Qinshan et al, 1993. Energy Conservation Technology of Cement Industry, Chinese Building Material Industry Press ISBN 7-80090-089-4/TB.22, 1993. Zhu Zupei, 1992. Technological Innovation of China’s Cement Industry Cement technology No. 1. 1992. SECTION 6.2 CMA, 1995. Basic Data for Indian Cement Industry - Publication of Cement Manufacturers Association (CMA), May 1995. Cost benefit analysis of dust control equipment in cement industry, CBCP Publication. Centre for Monitoring Indian Economy, 1995. various issues, 1995. Development Council for Cement Industry, Reports of the years 1992-93 to 1996-97. Report of the expert group on utilization of fly ash in cement industry, CBCP Publication. BICP, 1994. Report on Energy Audit of the cement industry conducted by the Bureau of Industrial Costs & Prices (BICP), Ministry of Industries, Government of India, March 1994. Report on pollution control implementation in cement industry, CBCP Publication. Report on utilization and conservation of energy. Summary volume prepared for Inter-Ministerial Working Group on Energy, 1983. TEDDY Hand Book, 1995. Workshop on assessment of energy use pattern in Indian Cement Industry, jointly organized by BICP and National Council for Cement & Building Materials (NCCBM).
The Asian Institute of Technology (AIT) is an autonomous international academic institution located in Bangkok, Thailand. It’s main mission is the promotion of technological changes and their management for sustainable development in the Asia-Pacific region through high-level education, research and outreach activities which integrate technology, planning and management. AIT carried out this Asian Regional Research Programme in Energy, Environment and Climate (ARRPEEC), with the support of the Swedish International Development Cooperation Agency (Sida). One of the projects under this program concerns the Development of Energy Efficient and Environmentally Sound Industrial Technologies in Asia. The objective of this specific project is to enhance the synergy among selected developing countries in their efforts to adopt and propagate energy efficient and environmentally sound technologies. The industrial sub-sectors identified for in-depth analysis are iron & steel, cement, and pulp & paper. The project involves active participation of experts from collaborating institutes from four Asian countries, namely China, India, the Philippines, and Sri Lanka. The technological trajectories, energy efficiency and environmental externalities of the pulp and paper industry in the four Asian countries are presented in this document (Volume I). Other related publications based on this research finding include: Volume I Technology, Energy Efficiency and Environmental Externalities in the
Cement Industry Volume II Technology, Energy Efficiency and Environmental Externalities in the
Iron & Steel Industry Volume IV Regulatory Measures and Technological Changes in the Cement, Iron
& Steel, and Pulp & Paper Industries An assessment of the implementation of energy efficient and environmentally sound industrial technologies among the selected countries is presented in a separate “Cross-Country Comparison” Report.
ASIA
NIN
STITUTE
19 5 9
OF TECH
NO
LOG
Y