Technology-based Evaluation for Smart Grids · Technology-based Evaluation for Smart Grids ......
48
Technology-based Evaluation for Smart Grids Yan Zheng Shanghai Jiao Tong University, China 2014.05
Transcript of Technology-based Evaluation for Smart Grids · Technology-based Evaluation for Smart Grids ......
Technology-based Evaluation for Smart Grids
Yan Zheng Shanghai Jiao Tong University, China
2014.05
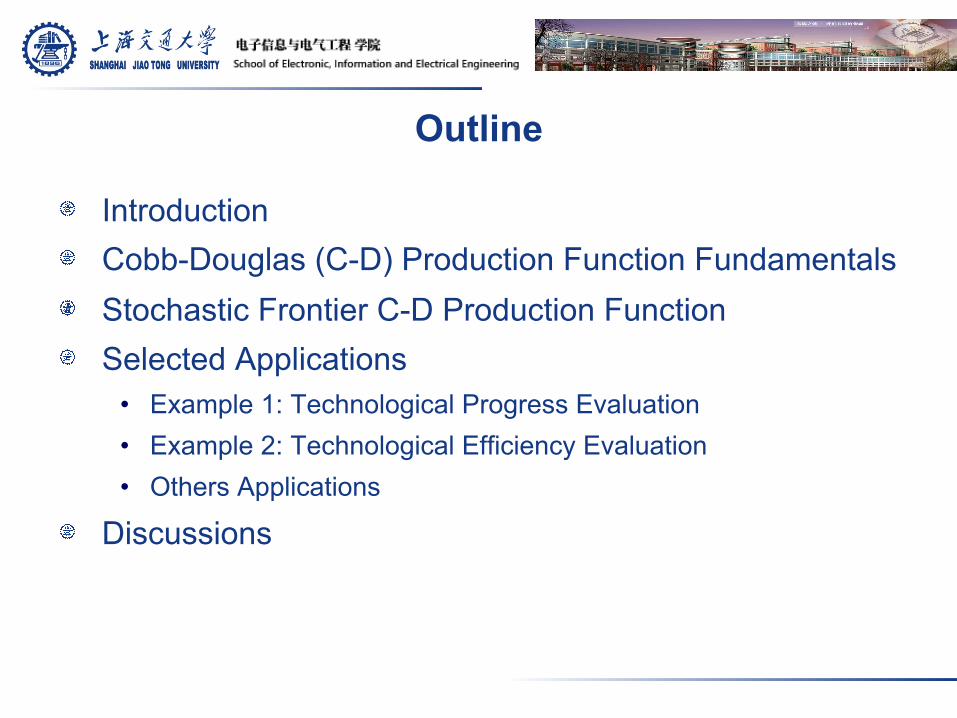
Outline
! Introduction ! Cobb-Douglas (C-D) Production Function Fundamentals ! Stochastic Frontier C-D Production Function ! Selected Applications
• Example 1: Technological Progress Evaluation • Example 2: Technological Efficiency Evaluation • Others Applications
! Discussions
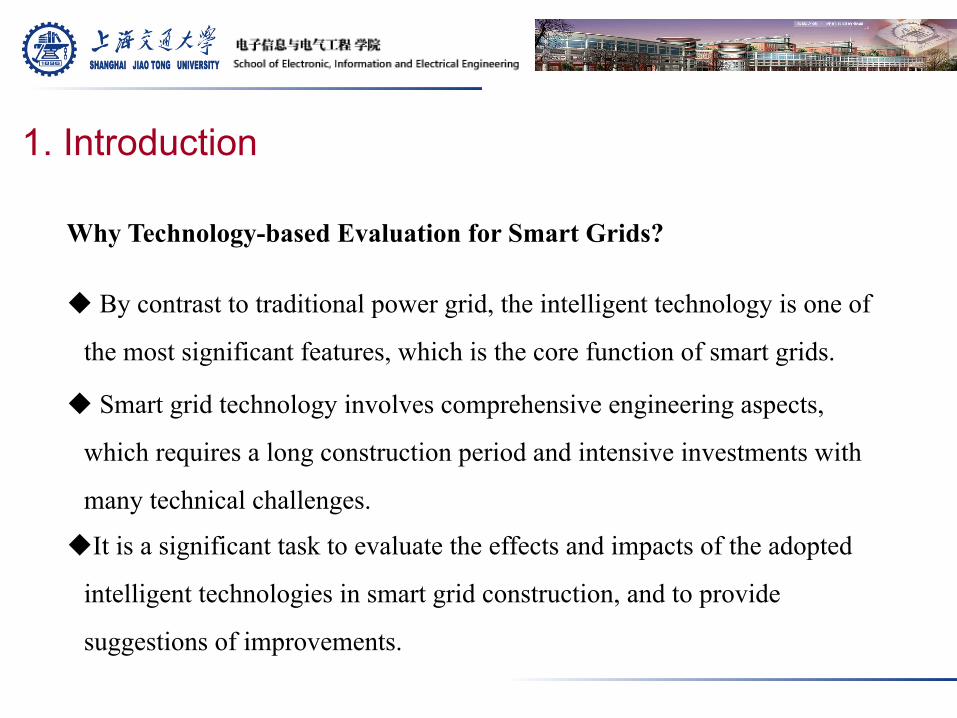
1. Introduction
u By contrast to traditional power grid, the intelligent technology is one of
the most significant features, which is the core function of smart grids.
Why Technology-based Evaluation for Smart Grids?
u Smart grid technology involves comprehensive engineering aspects,
which requires a long construction period and intensive investments with
many technical challenges.
u It is a significant task to evaluate the effects and impacts of the adopted
intelligent technologies in smart grid construction, and to provide
suggestions of improvements.
The study on technology-based evaluation for smart grids
covers the topics as follows: § Technology-based Evaluation Indices
§ Technological Progress Evaluation
§ Technological Efficiency Evaluation
§ Technological Benefits Evaluation
§ Technological Advancement Evaluation
Introduction
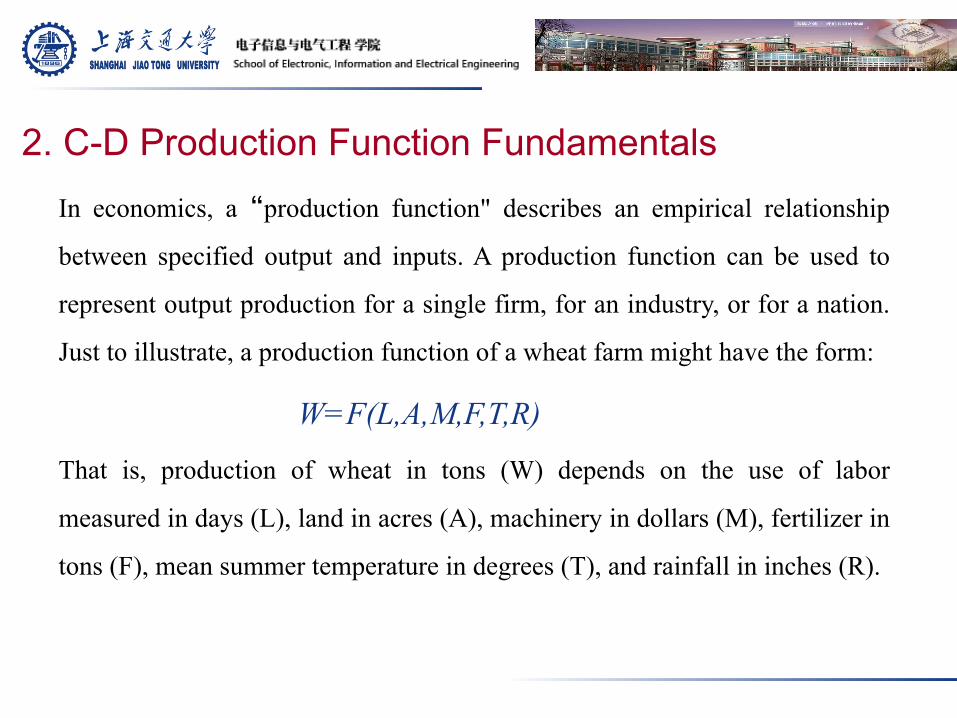
2. C-D Production Function Fundamentals In economics, a“production function" describes an empirical relationship
between specified output and inputs. A production function can be used to
represent output production for a single firm, for an industry, or for a nation.
Just to illustrate, a production function of a wheat farm might have the form:
W=F(L,A,M,F,T,R)
That is, production of wheat in tons (W) depends on the use of labor
measured in days (L), land in acres (A), machinery in dollars (M), fertilizer in
tons (F), mean summer temperature in degrees (T), and rainfall in inches (R).
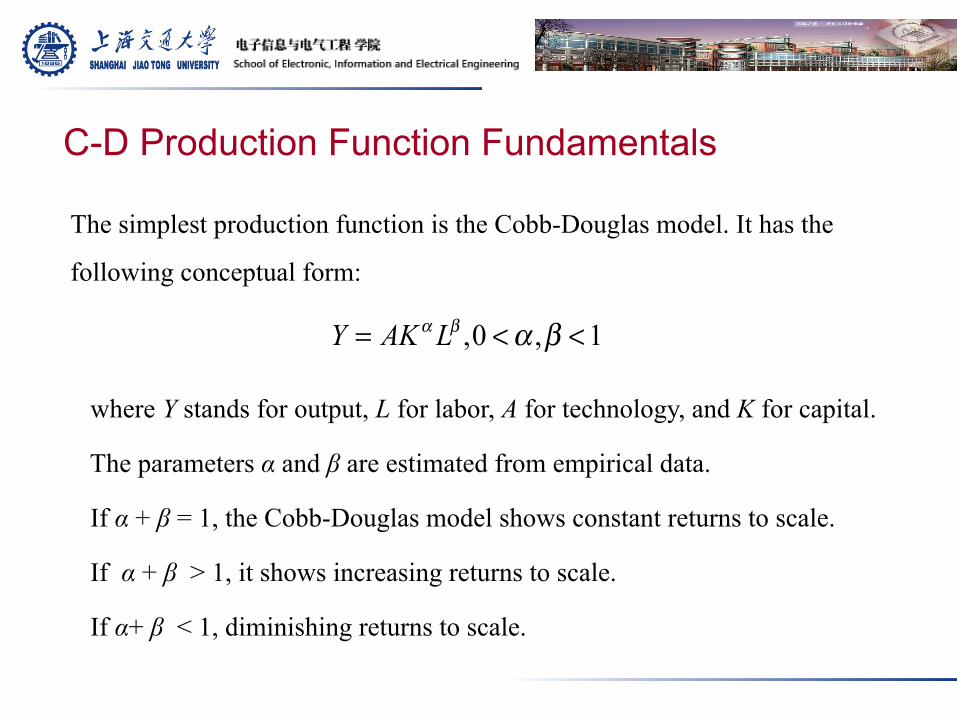
The simplest production function is the Cobb-Douglas model. It has the
following conceptual form:
where Y stands for output, L for labor, A for technology, and K for capital.
The parameters α and β are estimated from empirical data.
If α + β = 1, the Cobb-Douglas model shows constant returns to scale.
If α + β > 1, it shows increasing returns to scale.
If α+ β < 1, diminishing returns to scale.
Y = AKα Lβ ,0 <α ,β <1
C-D Production Function Fundamentals
dYdt
= ∂Y∂A
dAdt
+ ∂Y∂K
dKdt
+ ∂Y∂L
dLdt
dYdt
= Kα Lβ dAdt
+ AαKα−1Lβ dKdt
+ AβKα Lβ−1 dLdt
(dY
dt) / Y = (dA
dt) / A+α (dK
dt) / K + β(dL
dt) / L
ΔYY
= ΔAA
+α ΔKK
+ β ΔLL
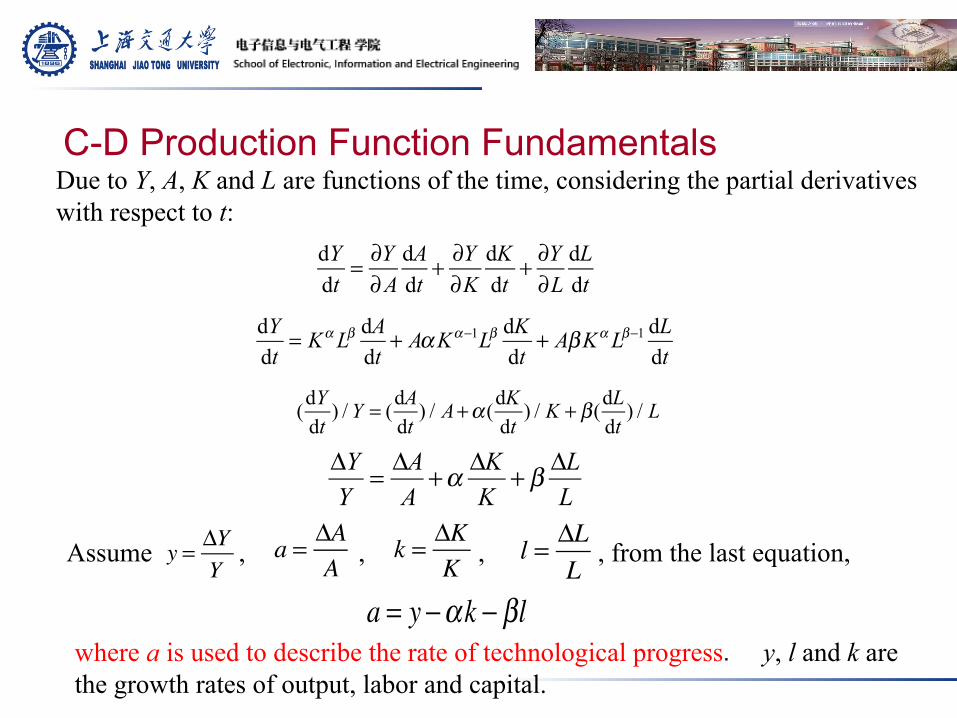
Due to Y, A, K and L are functions of the time, considering the partial derivatives with respect to t:
Assume , , , , from the last equation, y = ΔYY
a = ΔAA
k = ΔKK
l = ΔLL
a = y −αk − βlwhere a is used to describe the rate of technological progress. y, l and k are the growth rates of output, labor and capital.
C-D Production Function Fundamentals
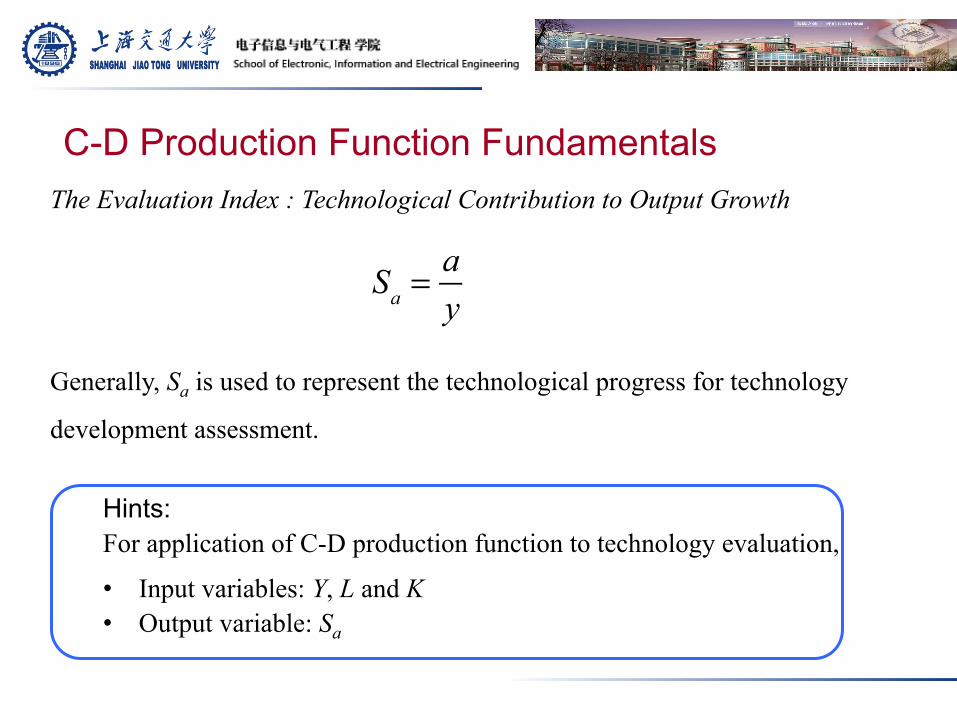
Sa =
ay
The Evaluation Index : Technological Contribution to Output Growth
Generally, Sa is used to represent the technological progress for technology
development assessment.
Hints: For application of C-D production function to technology evaluation,
• Input variables: Y, L and K • Output variable: Sa
C-D Production Function Fundamentals
3. Stochastic Frontier C-D Production Function
Motivations: § Allow for the fact that deviations of observed choices from optimal
ones are due to two factors:
§ Stochastic Frontier Analysis (SFA) is one such technique to model producer’s behavior in a more realistic way.
§ SFA provides a powerful tool for examining effects of technology intervention, i.e., given the same inputs, and the same technology, different producers may have different results, some will produce more output than others.
o random fluctuations of source data o failure to reach optimization, i.e., inefficiency
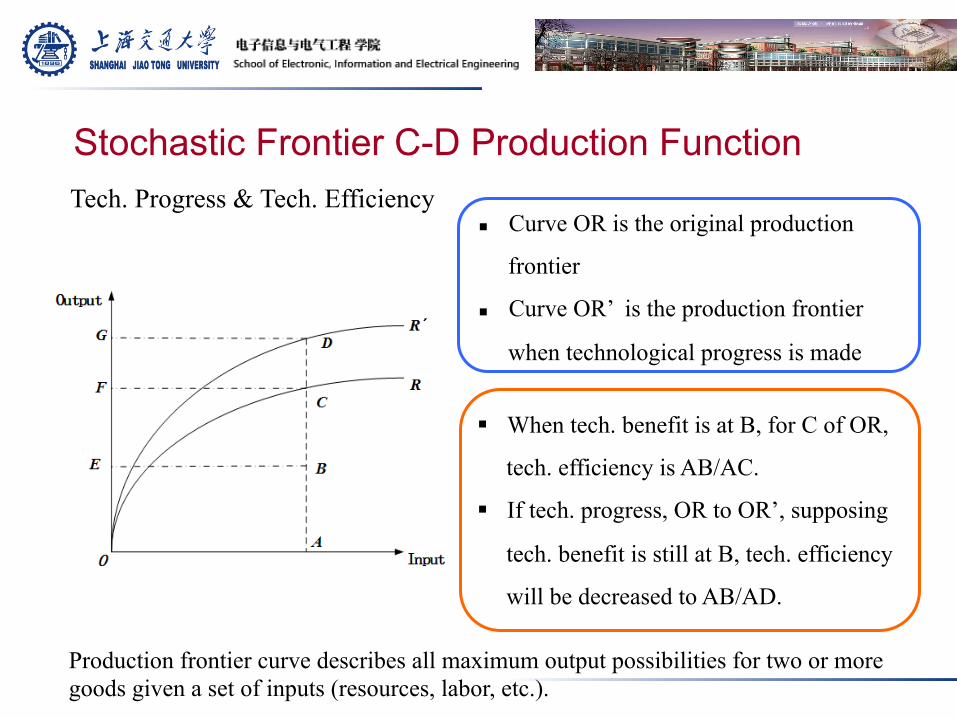
Tech. Progress & Tech. Efficiency n Curve OR is the original production
frontier
n Curve OR’ is the production frontier
when technological progress is made
§ When tech. benefit is at B, for C of OR,
tech. efficiency is AB/AC.
§ If tech. progress, OR to OR’, supposing
tech. benefit is still at B, tech. efficiency
will be decreased to AB/AD.
Stochastic Frontier C-D Production Function
Production frontier curve describes all maximum output possibilities for two or more goods given a set of inputs (resources, labor, etc.).
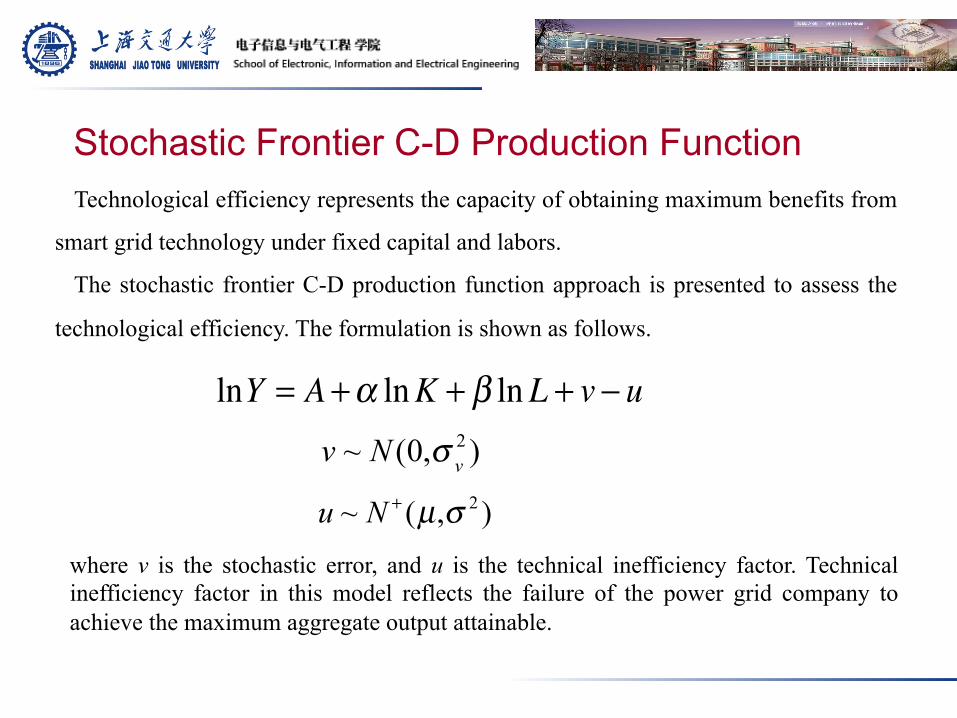
Technological efficiency represents the capacity of obtaining maximum benefits from
smart grid technology under fixed capital and labors.
The stochastic frontier C-D production function approach is presented to assess the
technological efficiency. The formulation is shown as follows.
v ~ N (0,σ v2 )
u ~ N + (µ,σ 2 )where v is the stochastic error, and u is the technical inefficiency factor. Technical inefficiency factor in this model reflects the failure of the power grid company to achieve the maximum aggregate output attainable.
lnY = A +α lnK + β lnL + v − u
Stochastic Frontier C-D Production Function
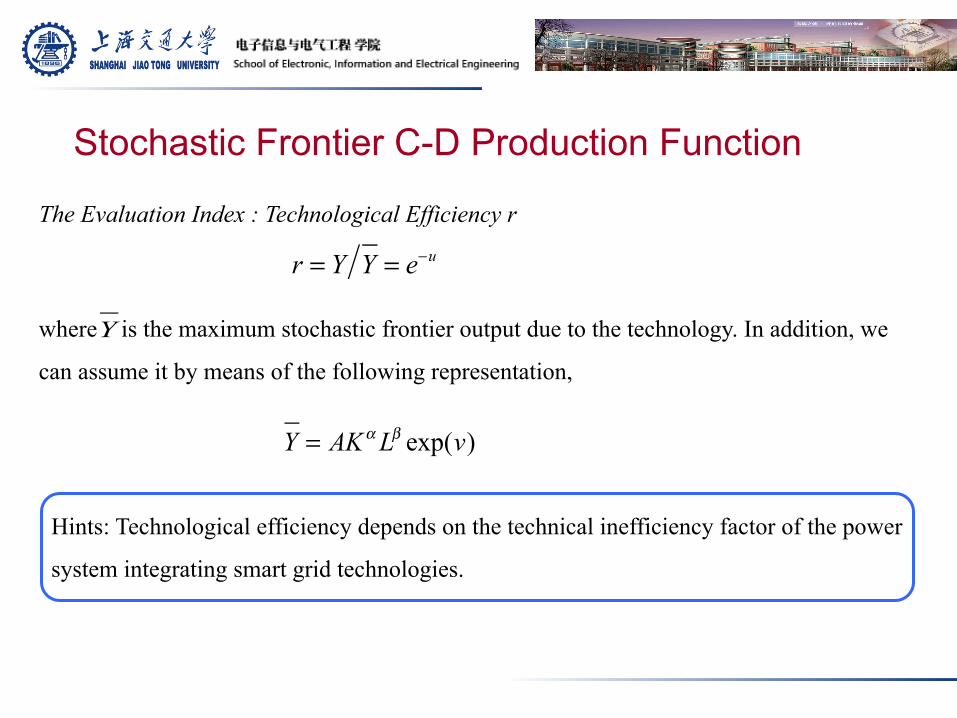
The Evaluation Index : Technological Efficiency r
r = Y Y = e−u
where is the maximum stochastic frontier output due to the technology. In addition, we
can assume it by means of the following representation,
Y = AKα Lβ exp(v)
Hints: Technological efficiency depends on the technical inefficiency factor of the power
system integrating smart grid technologies.
Stochastic Frontier C-D Production Function
Y
4. Selected Applications
Assumption of Variance and Estimates of Parameters
§ The first issue that needs to be considered is how to estimate the parameters i.e., α
and β. Generally, for the sake of comparison, α and β are regarded as constant
variables. However, still some researchers focus on the algorithms about
estimates of α and β.
§ It should be recognized that the labor component will be measured by the staff,
which will be calculated as the total staff minus the services staff, and the
production and the capital component will also be measured by money.
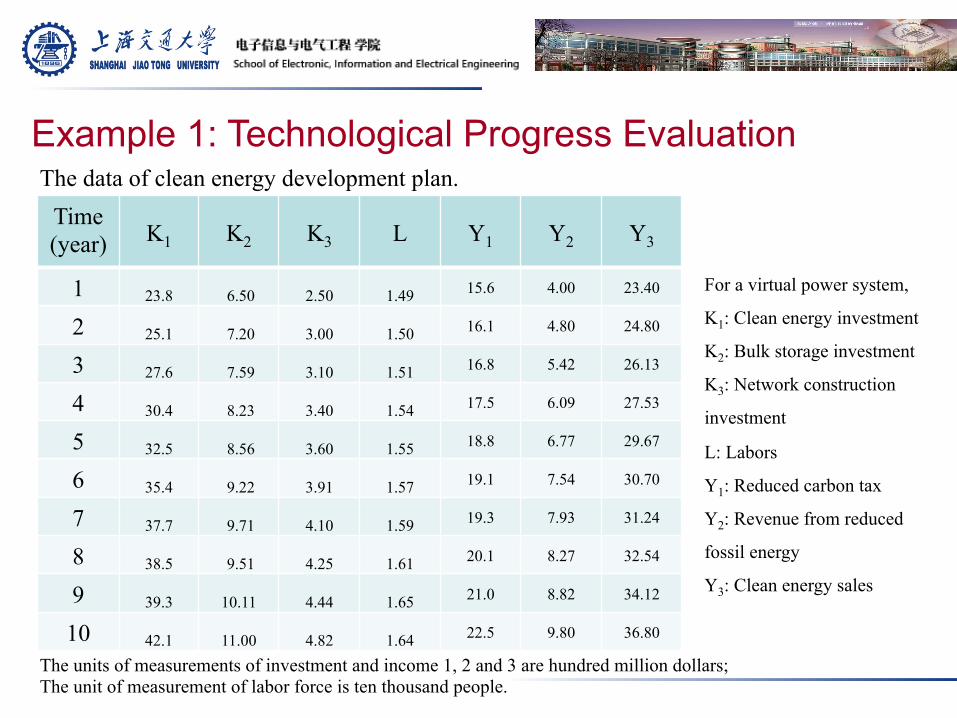
Example 1: Technological Progress Evaluation The data of clean energy development plan.
The units of measurements of investment and income 1, 2 and 3 are hundred million dollars; The unit of measurement of labor force is ten thousand people.
Time (year) K1 K2 K3 L Y1 Y2 Y3
1 23.8 6.50 2.50 1.49 15.6 4.00 23.40
2 25.1 7.20 3.00 1.50 16.1 4.80 24.80
3 27.6 7.59 3.10 1.51 16.8 5.42 26.13
4 30.4 8.23 3.40 1.54 17.5 6.09 27.53
5 32.5 8.56 3.60 1.55 18.8 6.77 29.67
6 35.4 9.22 3.91 1.57 19.1 7.54 30.70
7 37.7 9.71 4.10 1.59 19.3 7.93 31.24
8 38.5 9.51 4.25 1.61 20.1 8.27 32.54
9 39.3 10.11 4.44 1.65 21.0 8.82 34.12
10 42.1 11.00 4.82 1.64 22.5 9.80 36.80
For a virtual power system,
K1: Clean energy investment
K2: Bulk storage investment
K3: Network construction
investment
L: Labors
Y1: Reduced carbon tax
Y2: Revenue from reduced
fossil energy
Y3: Clean energy sales
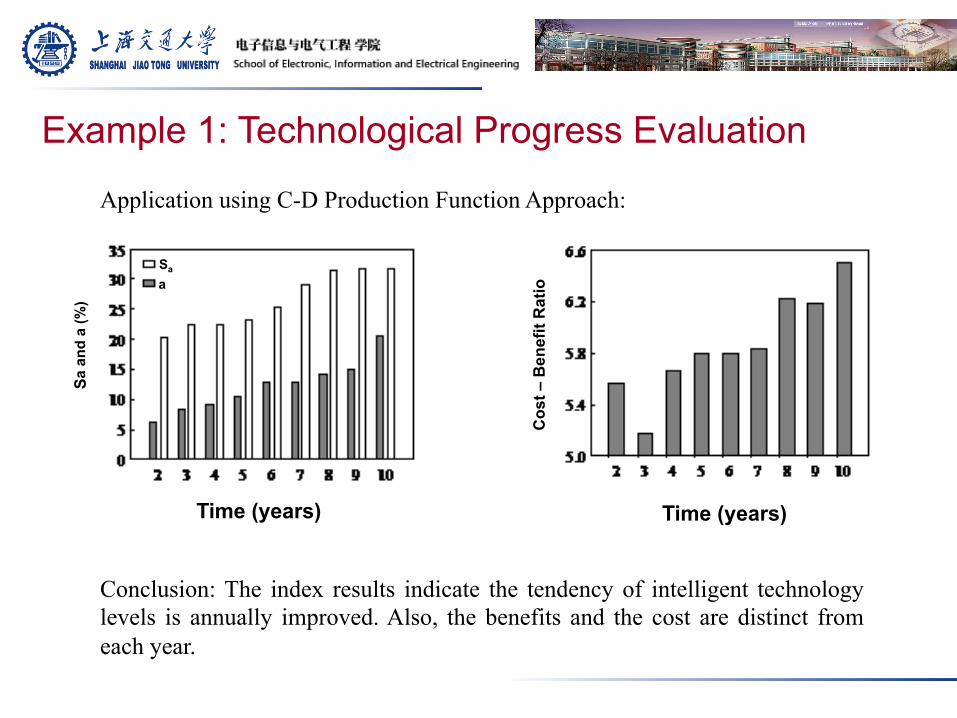
Application using C-D Production Function Approach:
Time (years)
a Sa
Sa a
nd a
(%)
Time (years) C
ost –
Ben
efit
Rat
io
Conclusion: The index results indicate the tendency of intelligent technology levels is annually improved. Also, the benefits and the cost are distinct from each year.
Example 1: Technological Progress Evaluation
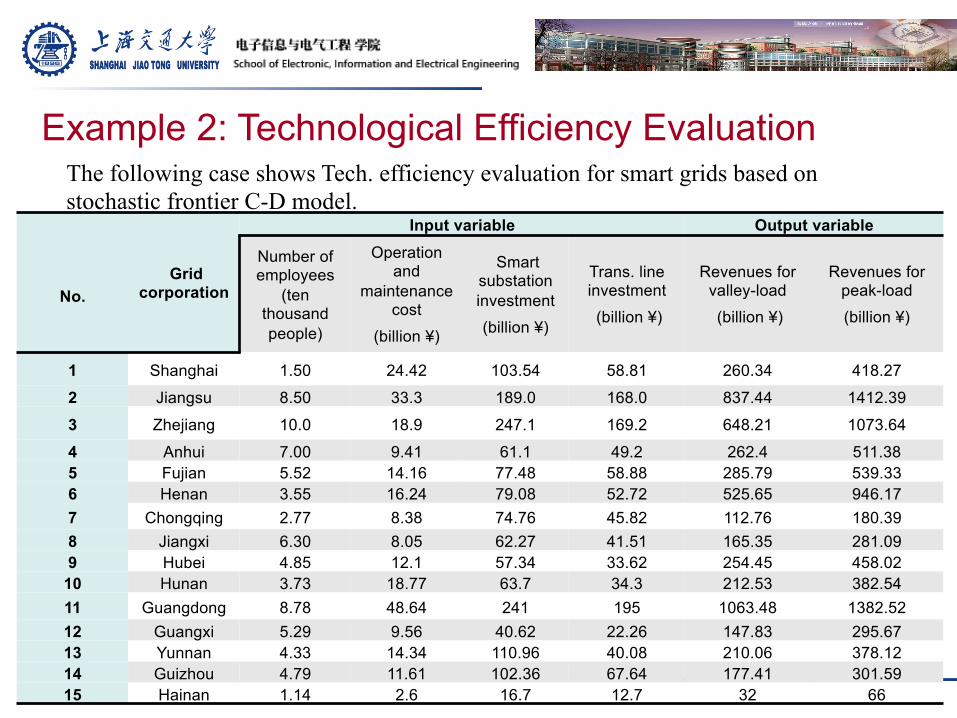
No.
Grid corporation
Input variable Output variable Number of employees
(ten thousand people)
Operation and
maintenance cost
(billion ¥)
Smart substation investment
(billion ¥)
Trans. line investment
(billion ¥)
Revenues for valley-load
(billion ¥)
Revenues for peak-load
(billion ¥)
1 Shanghai 1.50 24.42 103.54 58.81 260.34 418.27
2 Jiangsu 8.50 33.3 189.0 168.0 837.44 1412.39
3 Zhejiang 10.0 18.9 247.1 169.2 648.21 1073.64
4 Anhui 7.00 9.41 61.1 49.2 262.4 511.38 5 Fujian 5.52 14.16 77.48 58.88 285.79 539.33 6 Henan 3.55 16.24 79.08 52.72 525.65 946.17 7 Chongqing 2.77 8.38 74.76 45.82 112.76 180.39 8 Jiangxi 6.30 8.05 62.27 41.51 165.35 281.09 9 Hubei 4.85 12.1 57.34 33.62 254.45 458.02
10 Hunan 3.73 18.77 63.7 34.3 212.53 382.54 11 Guangdong 8.78 48.64 241 195 1063.48 1382.52 12 Guangxi 5.29 9.56 40.62 22.26 147.83 295.67 13 Yunnan 4.33 14.34 110.96 40.08 210.06 378.12 14 Guizhou 4.79 11.61 102.36 67.64 177.41 301.59 15 Hainan 1.14 2.6 16.7 12.7 32 66
Example 2: Technological Efficiency Evaluation The following case shows Tech. efficiency evaluation for smart grids based on stochastic frontier C-D model.
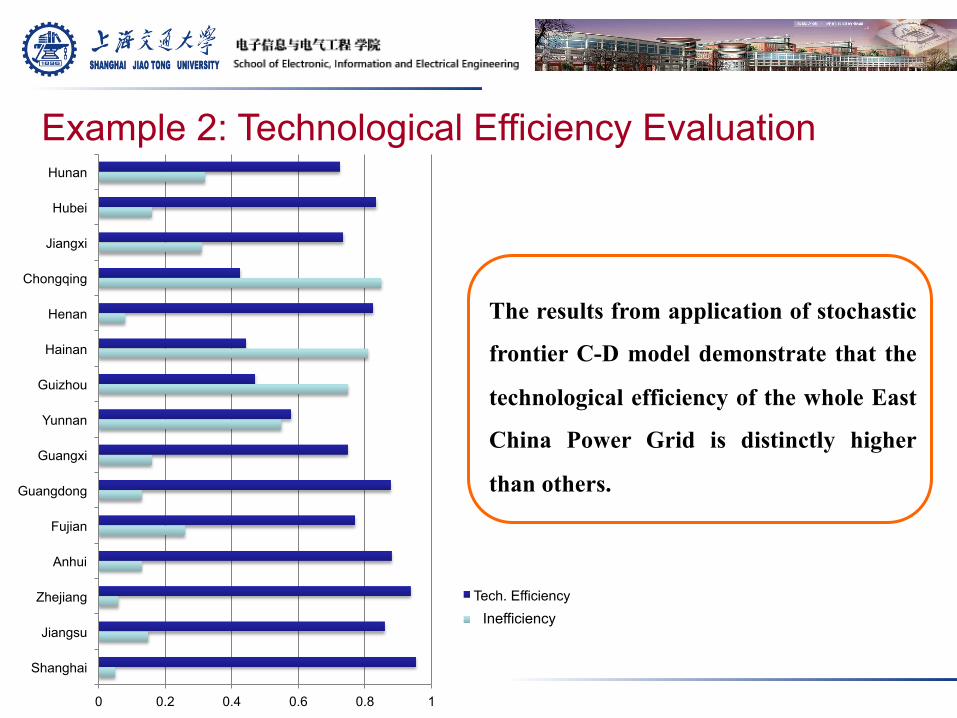
Example 2: Technological Efficiency Evaluation
0 0.2 0.4 0.6 0.8 1
Shanghai
Jiangsu
Zhejiang
Anhui
Fujian
Guangdong
Guangxi
Yunnan
Guizhou
Hainan
Henan
Chongqing
Jiangxi
Hubei
Hunan
Tech. Efficiency
Non-efficiency
The results from application of stochastic
frontier C-D model demonstrate that the
technological efficiency of the whole East
China Power Grid is distinctly higher
than others.
Inefficiency
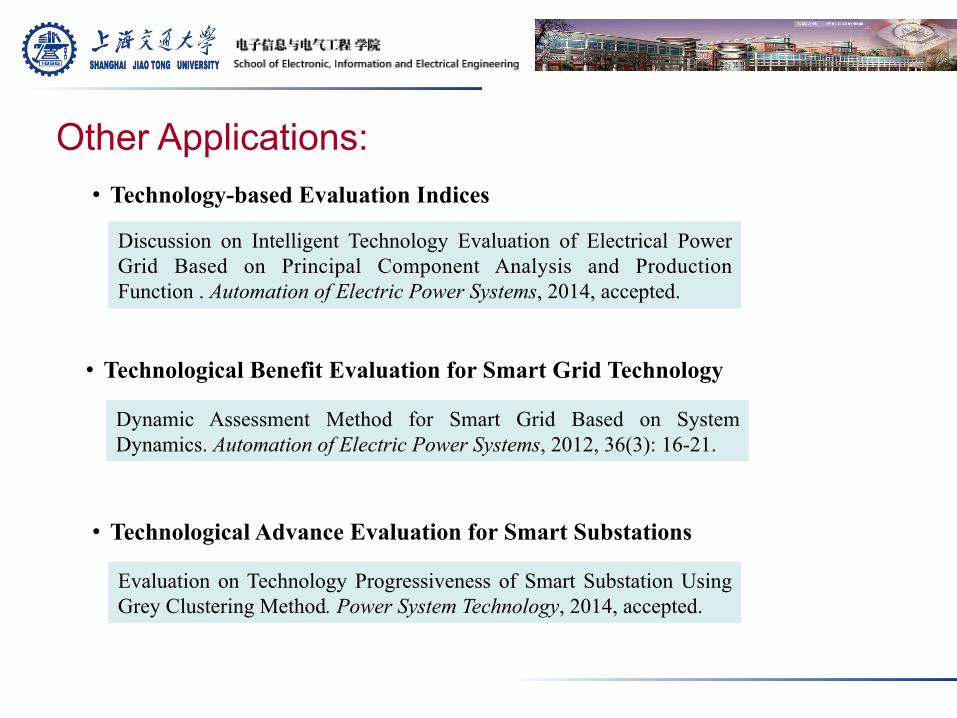
Other Applications:
• Technological Benefit Evaluation for Smart Grid Technology
• Technological Advance Evaluation for Smart Substations
Dynamic Assessment Method for Smart Grid Based on System Dynamics. Automation of Electric Power Systems, 2012, 36(3): 16-21.
Evaluation on Technology Progressiveness of Smart Substation Using Grey Clustering Method. Power System Technology, 2014, accepted.
• Technology-based Evaluation Indices
Discussion on Intelligent Technology Evaluation of Electrical Power Grid Based on Principal Component Analysis and Production Function . Automation of Electric Power Systems, 2014, accepted.
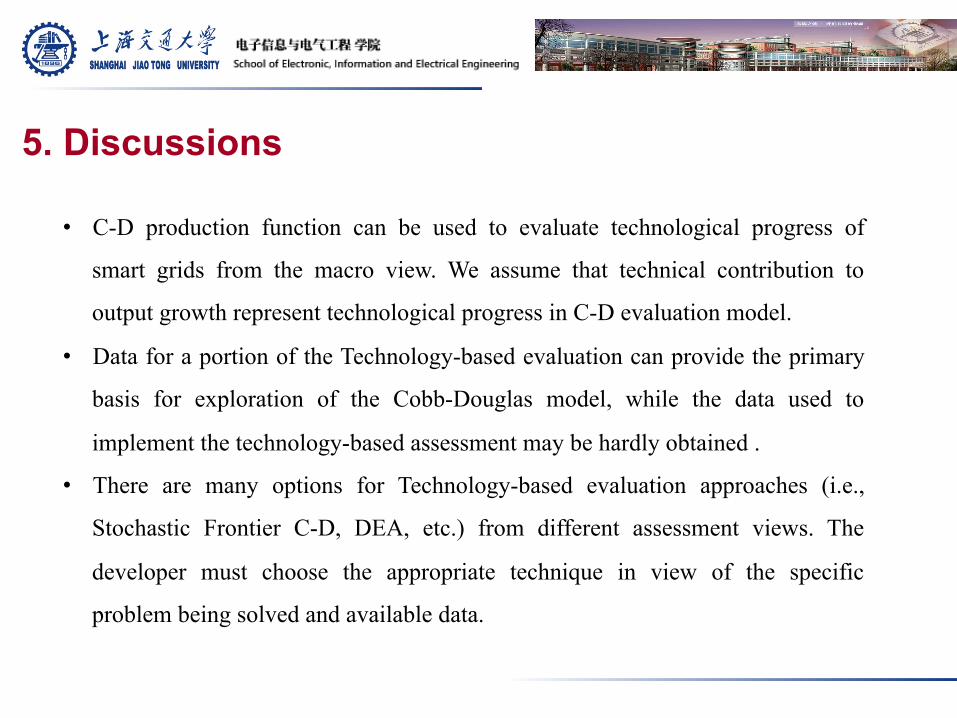
5. Discussions
• C-D production function can be used to evaluate technological progress of
smart grids from the macro view. We assume that technical contribution to
output growth represent technological progress in C-D evaluation model.
• Data for a portion of the Technology-based evaluation can provide the primary
basis for exploration of the Cobb-Douglas model, while the data used to
implement the technology-based assessment may be hardly obtained .
• There are many options for Technology-based evaluation approaches (i.e.,
Stochastic Frontier C-D, DEA, etc.) from different assessment views. The
developer must choose the appropriate technique in view of the specific
problem being solved and available data.

The Achieved Research Results: 1. An Evaluation Method for the Development of Intelligent Techniques Based on Cobb-Douglas Production
Function. Proceedings of the CSEE, 2012, 32(1): 71-77. 2. Dynamic Assessment Method for Smart Grid Based on System Dynamics. Automation of Electric Power
Systems, 2012, 36(3): 16-21. 3. Evaluation on Technology Progressiveness of Smart Substation Using Grey Clustering Method. Power System
Technology, 2014, accepted. 4. An Evaluation Method for Efficiency of Smart Grids Based on Stochastic Frontier Model. Electric Power
Automation Equipment, 2014, accepted. 5. Discussion on Intelligent Technology Evaluation of Electrical Power Grid Based on Principal Component
Analysis and Production Function . Automation of Electric Power Systems, 2014, accepted. 6. Comprehensive Assessment of Smart Grid Construction Based on Principal Component Analysis and Cluster
Analysis. Power System Technology, 2013, 37(8): 2238-2243. 7. Evaluation Model of Low-Carbon Electricity Benefits Based on Improved Super Efficiency DEA and its
Application. Automation of Electric Power Systems, under review. 8. Measuring Technological Progress of Smart Grid Based on Production Function Approach. Mathematical
Problem in Engineering, under review. 9. Methodologies to Evaluate the Technology development of Smart Substations. Journal of Electrical
Engineering & Technology, under review. 10. Overview of Comprehensive Evaluation Models and Methods for Smart Grids. Power System Technology,
under review.
This work has been supported by the National Natural Science Foundation of China, China State Grid, China Southern Grid.
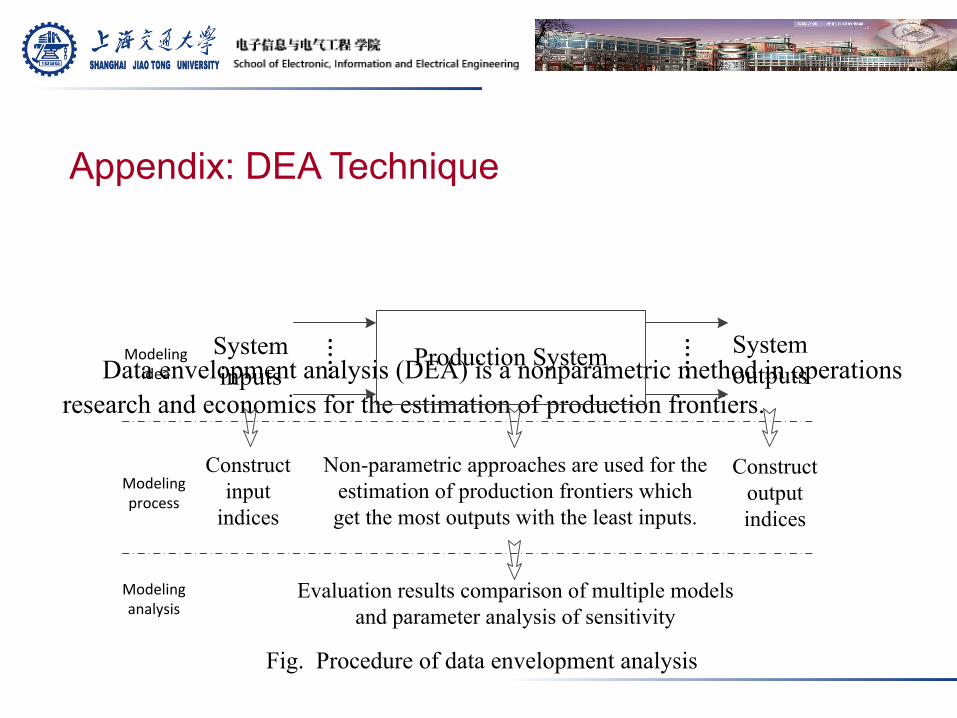
Data envelopment analysis (DEA) is a nonparametric method in operations research and economics for the estimation of production frontiers.
Fig. Procedure of data envelopment analysis
Production System
……
……System
inputsSystem outputs
Constructinput
indices
Construct output indices
Non-parametric approaches are used for the estimation of production frontiers which get the most outputs with the least inputs.
Evaluation results comparison of multiple models and parameter analysis of sensitivity
Modeling idea
Modeling process
Modeling analysis
Appendix: DEA Technique
2
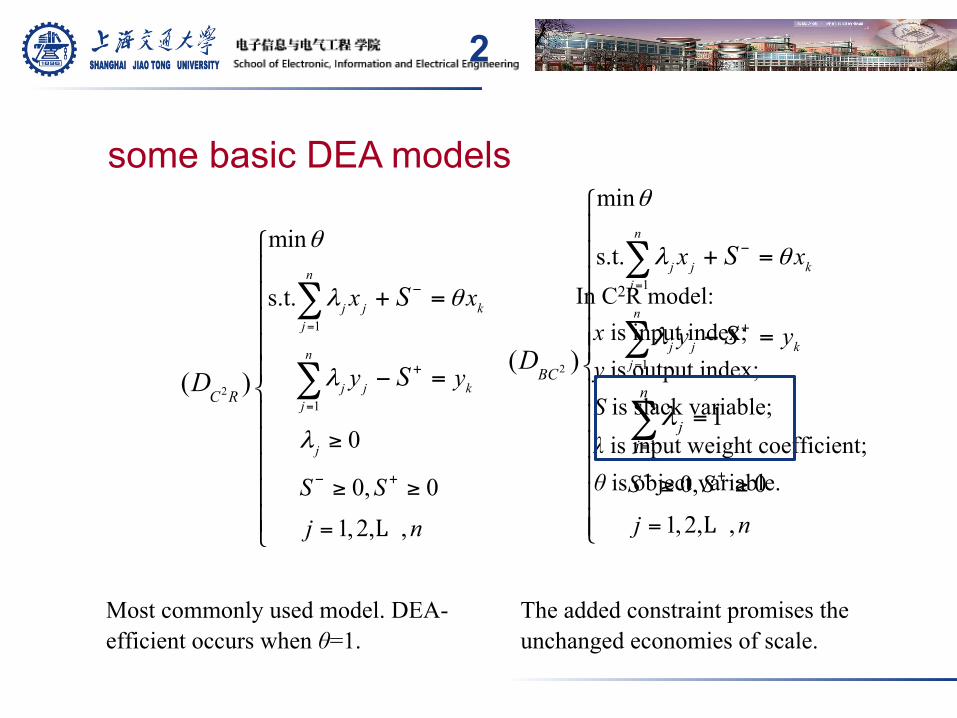
In C2R model: x is input index; y is output index; S is slack variable; λ is input weight coefficient; θ is object variable.
2
1
1
min
s.t.
0
0, 0
1, 2, ,
( )
n
j j kj
n
j j kj
j
C R
x x
y y
S Sj n
S
SD
θ
λ θ
λ
λ
=
=
−
+
− +
≥
≥ ≥
=
⎧⎪⎪ + =⎪⎪⎪ − =⎨⎪⎪⎪⎪⎪⎩
∑
∑
L
Most commonly used model. DEA-efficient occurs when θ=1.
2
1
1
1
min
s.t.
0, 0
1, 2, ,
( )
1
n
j j kj
n
j j kj
BCn
jj
x x
y y
S Sj n
S
SD
θ
λ θ
λ
λ
=
=
−
+
=
− +≥ ≥
=
⎧⎪⎪ + =⎪⎪⎪ − =⎪⎨⎪
=⎪⎪⎪⎪⎪⎩
∑
∑
∑
L
The added constraint promises the unchanged economies of scale.
some basic DEA models
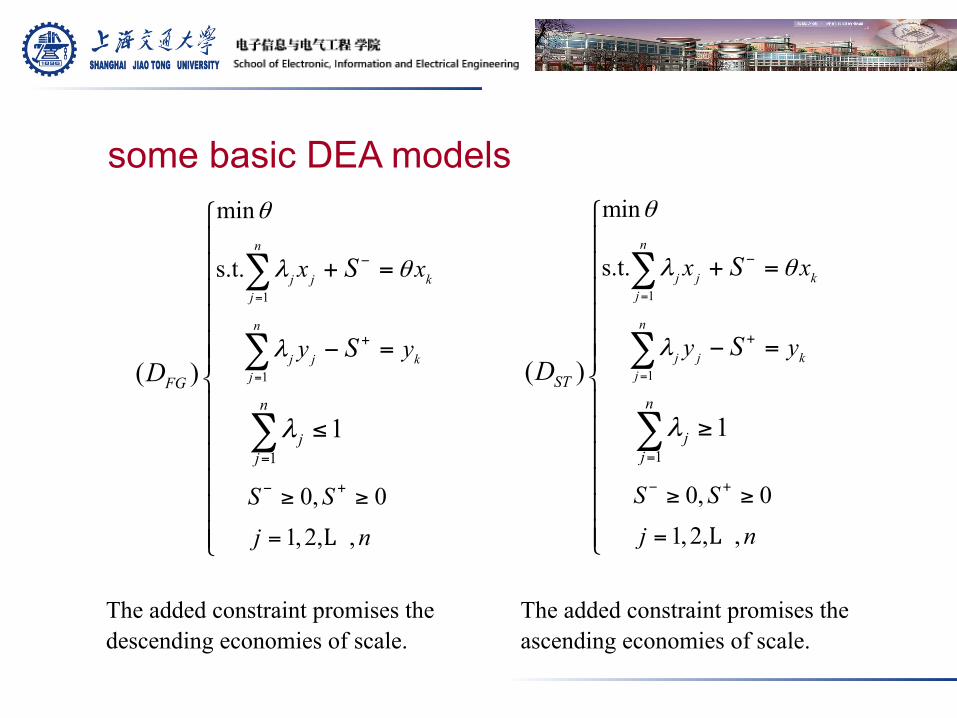
The added constraint promises the descending economies of scale.
The added constraint promises the ascending economies of scale.
1
1
1
min
s.t.
0, 0
1, 2, ,
( )
1
n
j j kj
n
j j kjSTn
jj
x x
y y
S Sj n
S
SD
θ
λ θ
λ
λ
=
=
−
+
=
− +≥ ≥
=
⎧⎪⎪ + =⎪⎪⎪ − =⎪⎨⎪
≥⎪⎪⎪⎪⎪⎩
∑
∑
∑
L
1
1
1
min
s.t.
0, 0
1, 2, ,
( )
1
n
j j kj
n
j j kjFGn
jj
x x
y y
S Sj n
S
SD
θ
λ θ
λ
λ
=
=
−
+
=
− +≥ ≥
=
⎧⎪⎪ + =⎪⎪⎪ − =⎪⎨⎪
≤⎪⎪⎪⎪⎪⎩
∑
∑
∑
L
some basic DEA models

Example 2: Technological Efficiency Evaluation by DEA
The following case will show the low-carbon based technological efficiency evaluation for smart grids using DEA approach.
Index category Number of index Name of index (unit)
Low-carbon
electricity input
indices
A1 Installed capacity proportion of clean energy(%)
A2 Installed capacity proportion of efficient thermal power(%)
A3 Scale of power plant and transmission system coordination instruments(%)
B1 Proportion of energy storage applied(‰)
B2 Access rate of distributed generation(‰)
B3 Capacity proportion of intelligent substation (%)
C1 Intelligent electric meters penetration(%)
C2 Electric vehicle penetration(‰)
C3 Coverage rate of information collection system(%)
Low-carbon
electricity output indices
O1* CO2 emissions per unit power generation(g/KWh)
O2* Rate of power transmission losses(%)
O3* Rate of average valley-to-peak loads(%)
Step 1.
Establish evaluation index system
Step 2.
Collect input and output data
Province A1 (%)
A2 (%)
A3 (%)
B1 (‰)
B2 (‰)
B3 (%)
C1 (%)
C2 (‰)
C3 (%)
O1*
(g/KWh)
O2*
(%) O3
* (%)
Shanghai 2.25 59.14 42.7 17.9 10.2 5.9 68.7 9.5 83.2 223 3.15 35.1
Jiangsu 7.29 45.71 34.4 26.5 7.3 2.5 41.3 8.6 54.3 215 3.64 17.7
Zhejiang 4.85 52.33 31.3 27.9 5.6 3.3 47.9 11.5 62.1 238 4.28 33.1
Anhui 3.63 40.27 29.0 15.1 2.8 2.0 40.3 9.1 73.7 373 6.76 26.7
Fujian 33.74 21.02 38.1 24.4 4.1 1.2 32.4 12.7 23.8 190 4.73 31.9 Guang dong 26.18 39.48 17.9 18.0 4.5 14.8 33.1 8.3 45.4 192 5.04 41.7
Guangxi 51.71 24.96 12.8 10.3 2.4 9.5 13.8 2.6 43.6 201 5.96 27.6
Yunnan 68.87 10.20 10.6 13.2 1.3 9.3 29.0 4.0 56.3 196 6.78 23.1
Guizhou 55.60 9.34 11.3 12.8 2.8 8.6 26.3 2.8 27.5 255 6.89 30.3
Hainan 31.42 13.29 19.8 9.1 1.7 7.7 30.4 7.6 42.7 159 7.05 29.0
Step 3.
Solve PCA-SE-DEA model
1,
1,
1
1
min
s.t.
0, 0, 0
1, 2, ,
, 1, 2, ,
, 1, 2, ,
n
j ij ikj j k
n
j rj rkj j k
j
li
i ki
k l
ii
ii k
r
i r
LEEI
s
y s y
s s
j n
LIPF
LIPF
LIPC LIPC i l
r s
λ θ
λ
λ
θ
= ≠
= ≠
− +
=
=
−
+
=
+ =
− =
≥ ≥ ≥
=
⎧⎪⎪⎪⎪⎪⎪ =⎨⎪⎪
=⎪⎪⎪⎪⎩
∑
∑
∑
∑
L
g
L
L
Where LIPF stands for low-carbon input preference factor, LIPC stands for low-carbon input principal component, LEEI stands for low-carbon electricity efficiency index. We use LEEI to evaluate low-carbon technological efficiency of smart grid.
Step 4.
Results comparison and sensitivity
analysis
1.55
1.22 1.20 1.10 1.09 1.05 1.01
0.89 0.85 0.84
0
0.2
0.4
0.6
0.8
1
1.2
1.4
1.6
1.8
Low
-Car
bon
Elec
trici
ty E
ffici
ency
Inde
x
LEEI
0.6
0.8
1
1.2
1.4
1.6
1.8
Eval
uatio
n re
sults
of l
ow-c
arbo
n ef
ficie
ncy DEA SE-DEA PCA-SE-DEA
0.4
0.6
0.8
1
1.2
1.4
1.6
1.8
LEEI
α=85% α=90% α=95% α=99%
Where α is the significance level. From the comparison, it can be seen that the higher the significance level is, the more precise and stable the results will be.

WELCOME TO VISIT SEIEE OF SJTU!
Thank you!
1896 1920 1987 2006
State Energy Smart Grid R&D Center
(Shanghai)
国家能源智能电网(上海)研发中心 State Energy Smart Grid R&D Center (Shanghai)
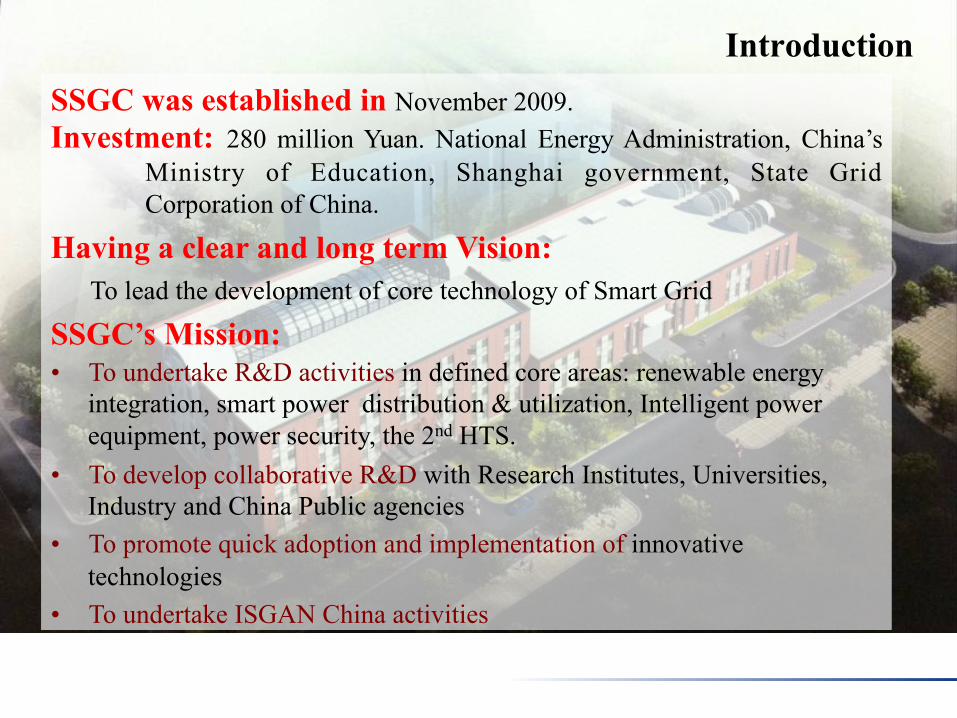
Introduction SSGC was established in November 2009. Investment: 280 million Yuan. National Energy Administration, China’s
Ministry of Education, Shanghai government, State Grid Corporation of China.
Having a clear and long term Vision: To lead the development of core technology of Smart Grid
SSGC’s Mission: • To undertake R&D activities in defined core areas: renewable energy
integration, smart power distribution & utilization, Intelligent power equipment, power security, the 2nd HTS.
• To develop collaborative R&D with Research Institutes, Universities, Industry and China Public agencies
• To promote quick adoption and implementation of innovative technologies
• To undertake ISGAN China activities
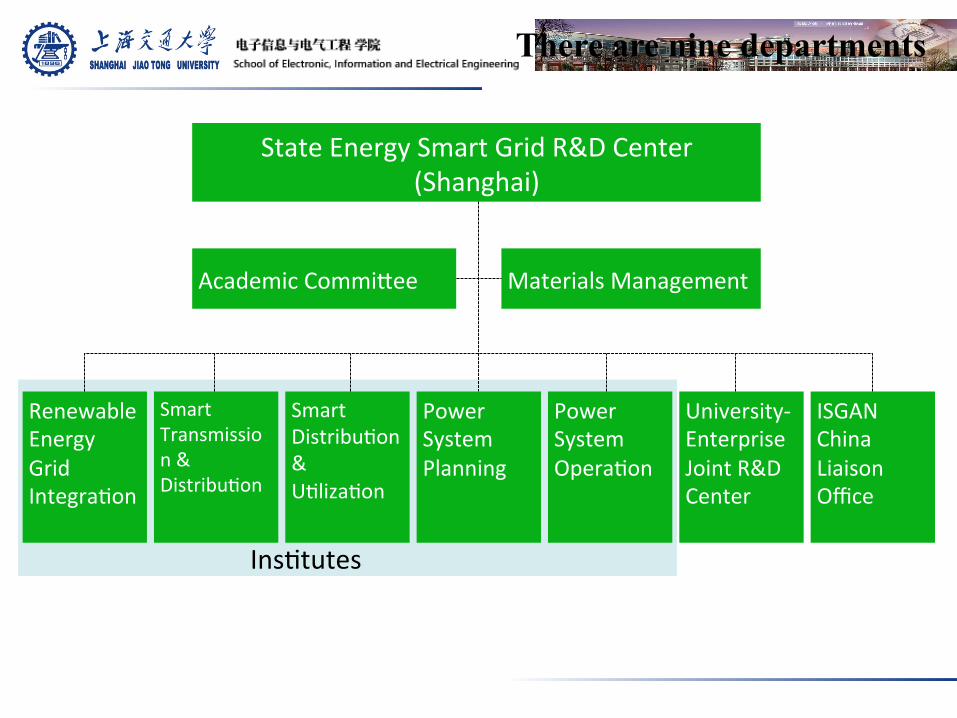
State Energy Smart Grid R&D Center (Shanghai)
Renewable Energy Grid Integra:on
Academic Commi>ee Materials Management
Smart Transmission & Distribu:on
Smart Distribu:on & U:liza:on
Power System Planning
Power System Opera:on
University-‐Enterprise Joint R&D Center
ISGAN China Liaison Office
There are nine departments
Ins:tutes
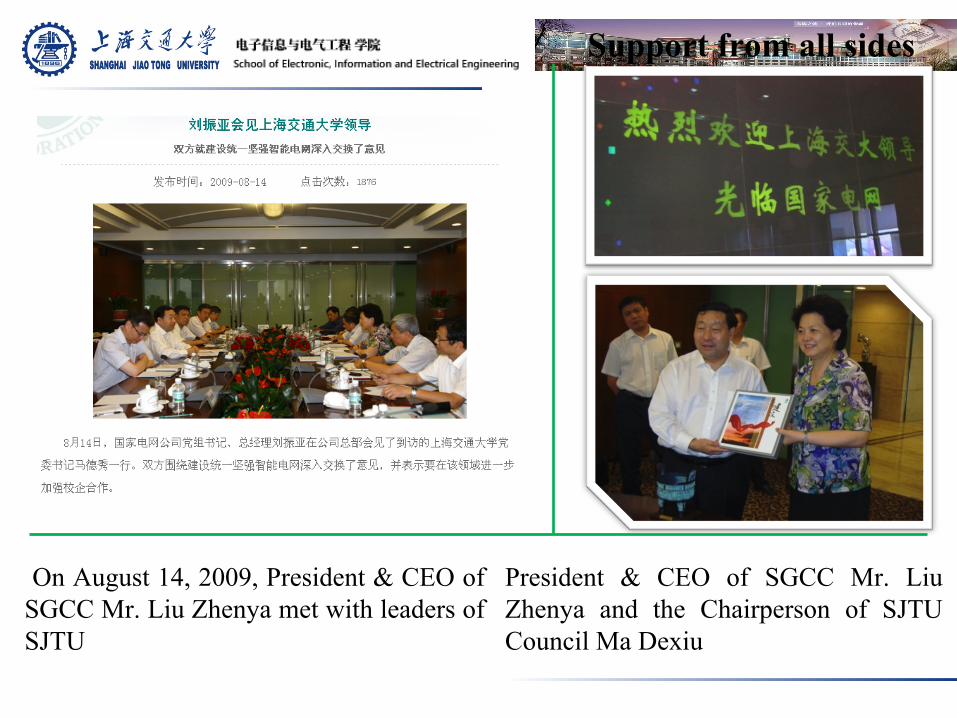
President & CEO of SGCC Mr. Liu Zhenya and the Chairperson of SJTU Council Ma Dexiu
On August 14, 2009, President & CEO of SGCC Mr. Liu Zhenya met with leaders of SJTU
Support from all sides
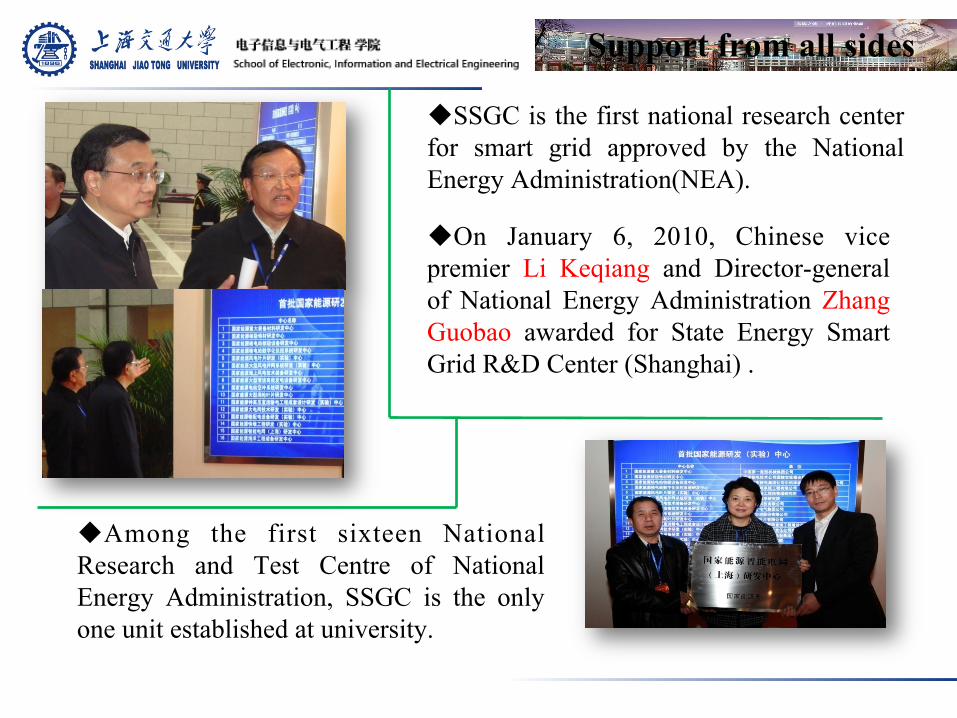
u Among the first sixteen National Research and Test Centre of National Energy Administration, SSGC is the only one unit established at university.
u SSGC is the first national research center for smart grid approved by the National Energy Administration(NEA).
u On January 6, 2010, Chinese vice premier Li Keqiang and Director-general of National Energy Administration Zhang Guobao awarded for State Energy Smart Grid R&D Center (Shanghai) .
Support from all sides
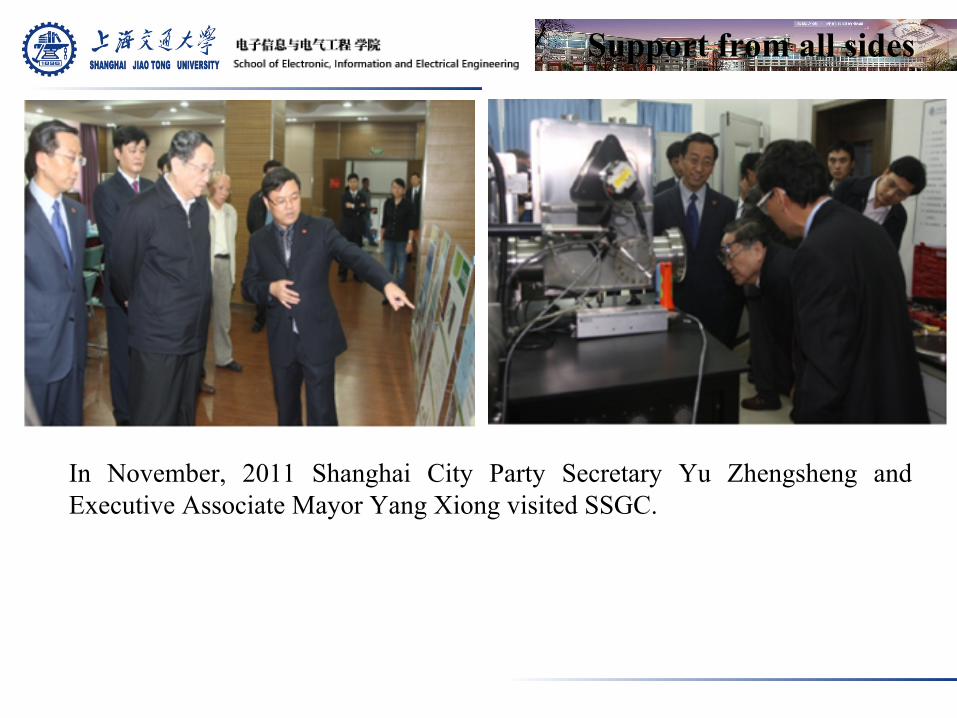
In November, 2011 Shanghai City Party Secretary Yu Zhengsheng and Executive Associate Mayor Yang Xiong visited SSGC.
Support from all sides

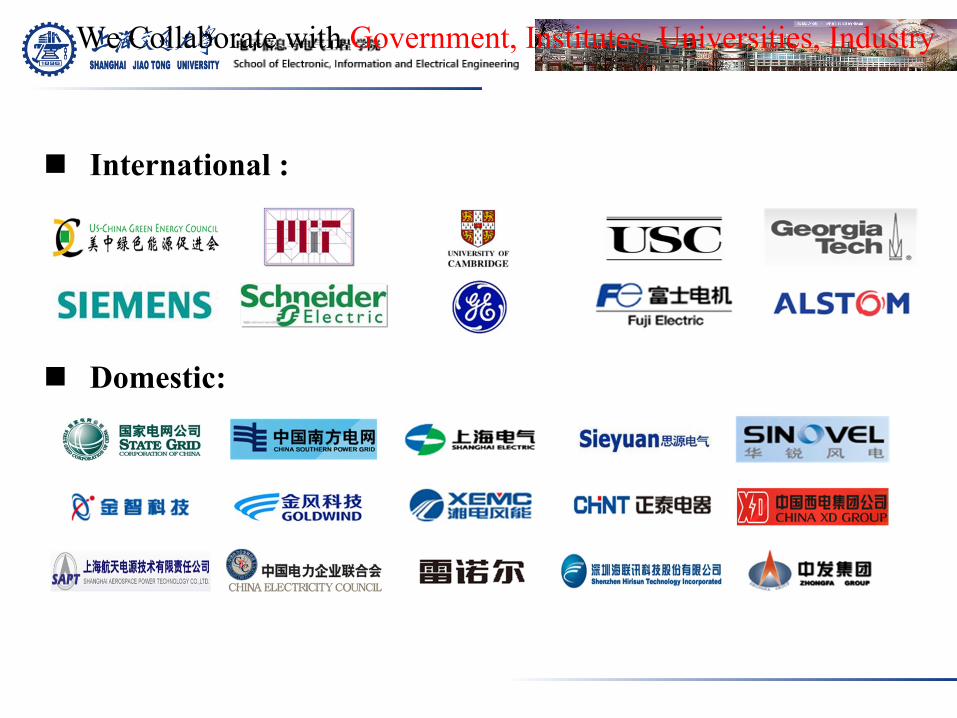
n International :
n Domestic:
We Collaborate with Government, Institutes, Universities, Industry
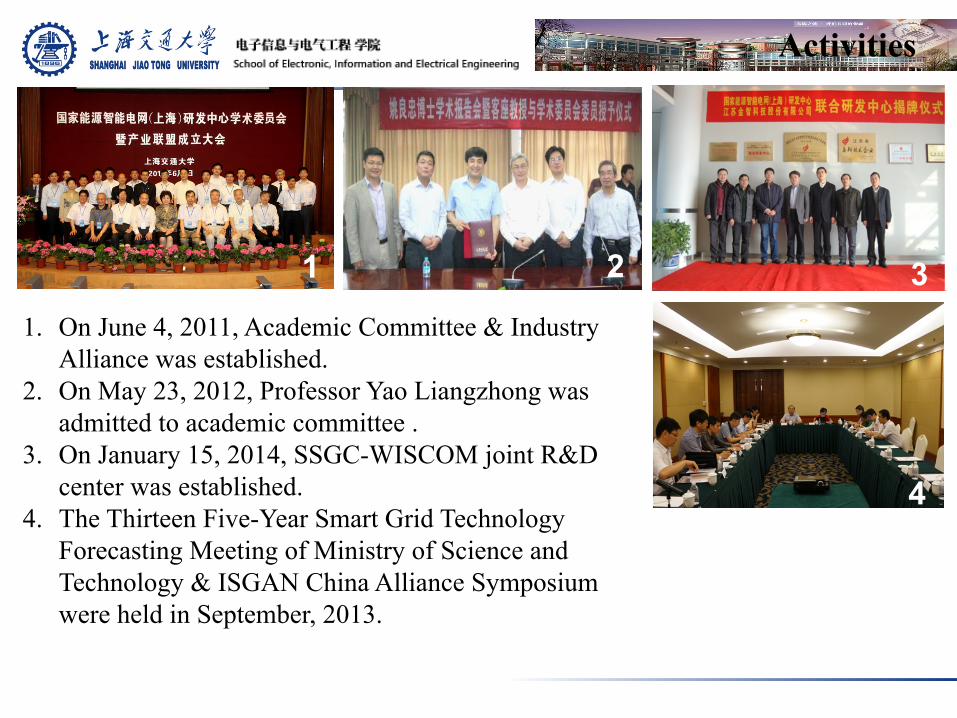
1. On June 4, 2011, Academic Committee & Industry Alliance was established.
2. On May 23, 2012, Professor Yao Liangzhong was admitted to academic committee .
3. On January 15, 2014, SSGC-WISCOM joint R&D center was established.
4. The Thirteen Five-Year Smart Grid Technology Forecasting Meeting of Ministry of Science and Technology & ISGAN China Alliance Symposium were held in September, 2013.
5. R&D Center
Activities
1 2 3
4

Activities
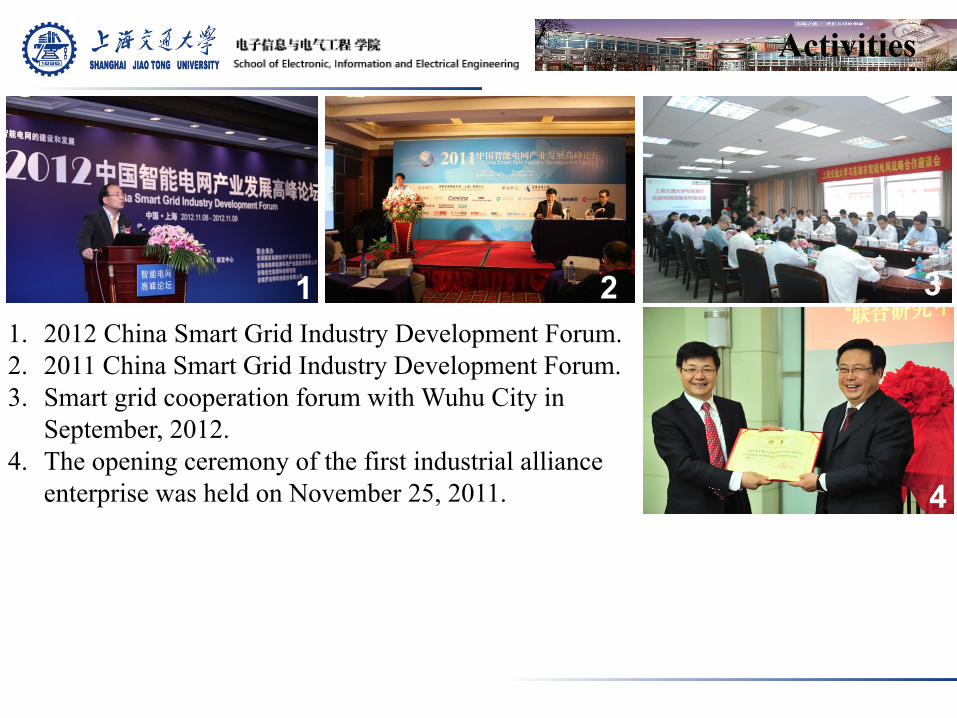
1. 2012 China Smart Grid Industry Development Forum. 2. 2011 China Smart Grid Industry Development Forum. 3. Smart grid cooperation forum with Wuhu City in
September, 2012. 4. The opening ceremony of the first industrial alliance
enterprise was held on November 25, 2011.
1 2 3
4

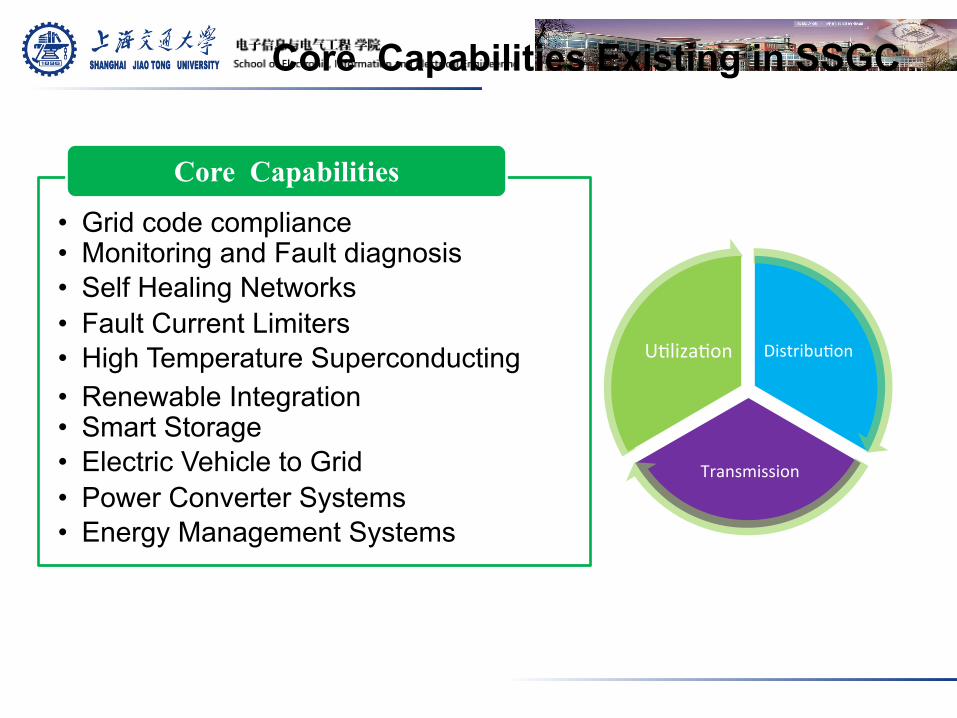
Core Capabilities Existing in SSGC
Distribu:on
Transmission
U:liza:on
• Grid code compliance• Monitoring and Fault diagnosis • Self Healing Networks • Fault Current Limiters • High Temperature Superconducting • Renewable Integration• Smart Storage • Electric Vehicle to Grid • Power Converter Systems • Energy Management Systems
Core Capabilities
Experimental hall illumination
Engineering Test Area Power Utilization
Office Power Utilization
Laboratory Power Utilization
SFCL
FTDC Transmission System
50kW
Lithium Battery
50kW
WT Emulator
EV charging
10kW
Energy Recycling Electric Load
30kW
PV Emulator
20kW
PMSG WT
Emulator
30kW
DFID WT
Emulator
10kW
PV Emulator
380V 21kW
Power
Amplifier
Line Impedance Emulator
Micro-grid Flexible Configuration Platform
Transformer Line Impedance Emulator
Distribution Network Flexible Configuration Platform
380/690V Transformer
APF
Power Quality Platform
5kW WT
5kW WT
10kW PV
0-3kW
Energy Recycling Electric Load
Impedance
RTDS
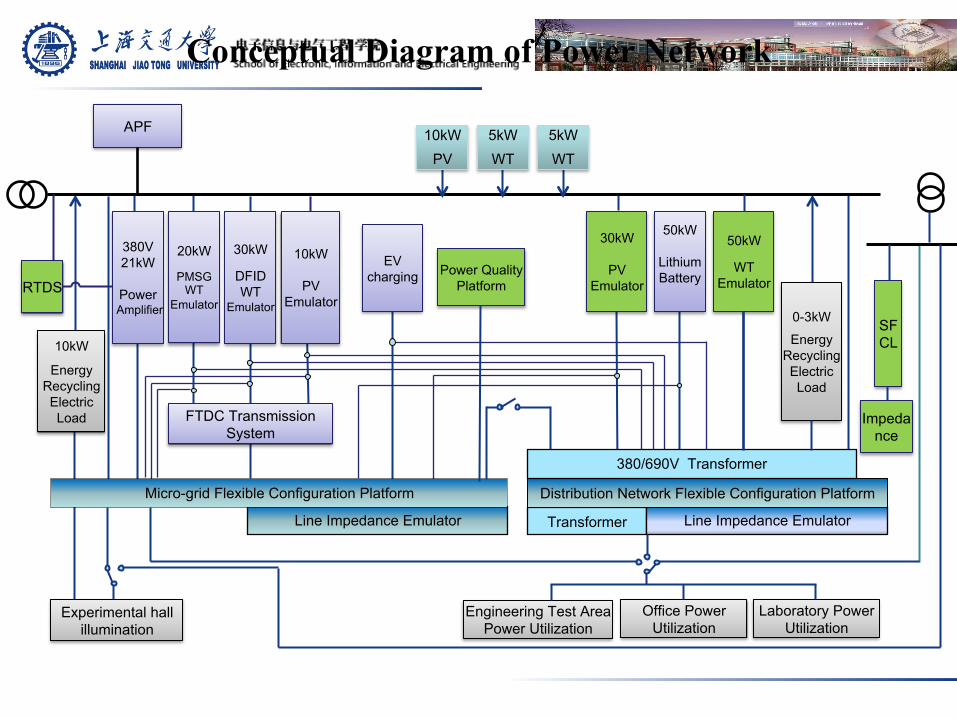
Conceptual Diagram of Power Network
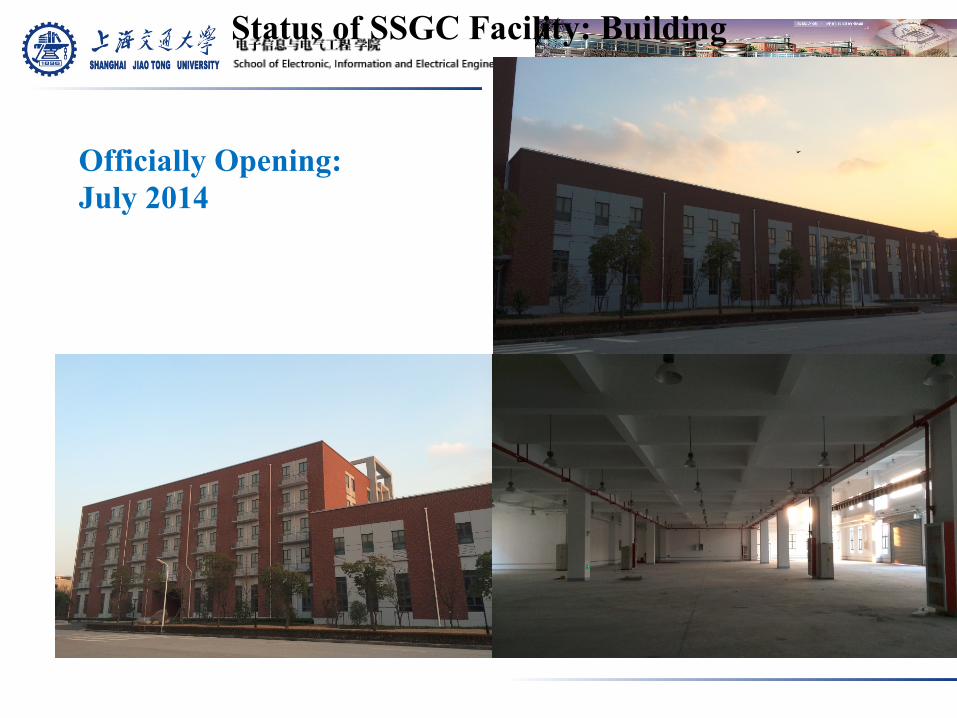
Status of SSGC Facility: Building
Officially Opening: July 2014
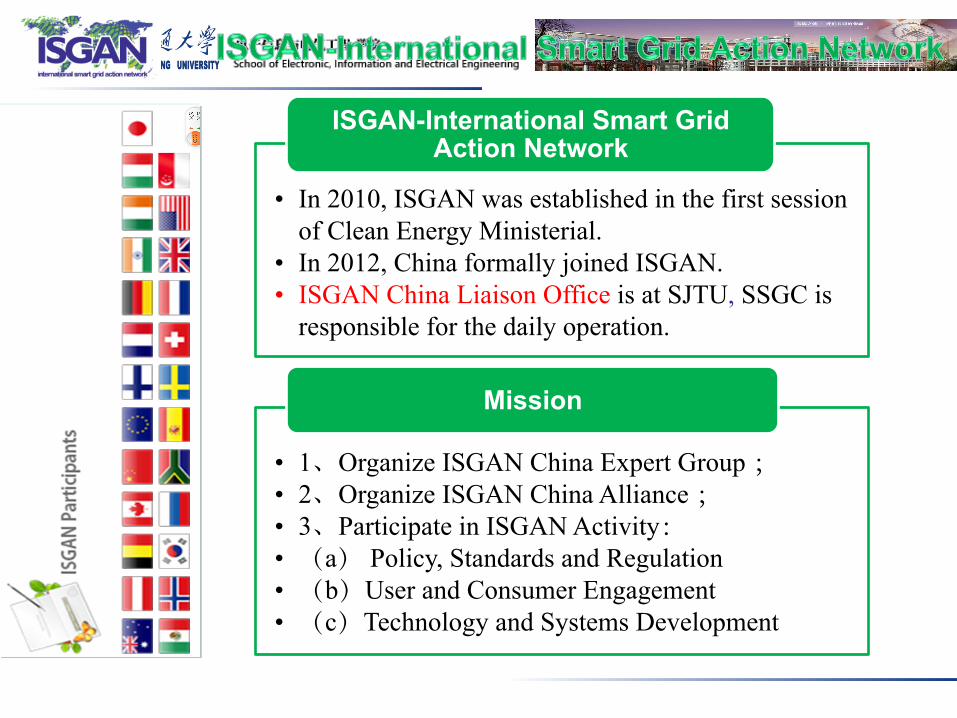
• In 2010, ISGAN was established in the first session of Clean Energy Ministerial.
• In 2012, China formally joined ISGAN.• ISGAN China Liaison Office is at SJTU, SSGC is
responsible for the daily operation.
ISGAN-International Smart Grid Action Network
• 1、Organize ISGAN China Expert Group ;• 2、Organize ISGAN China Alliance ;• 3、Participate in ISGAN Activity:• (a) Policy, Standards and Regulation• (b)User and Consumer Engagement • (c)Technology and Systems Development
Mission
n International :
n Domestic:
We Collaborate with Government, Institutes, Universities, Industry

1. On June 4, 2011, Academic Committee & Industry Alliance was established.
2. On May 23, 2012, Professor Yao Liangzhong was admitted to academic committee .
3. On January 15, 2014, SSGC-WISCOM joint R&D center was established.
4. The Thirteen Five-Year Smart Grid Technology Forecasting Meeting of Ministry of Science and Technology & ISGAN China Alliance Symposium were held in September, 2013.
5. R&D Center
Activities
1 2 3
4
Activities
1. 2012 China Smart Grid Industry Development Forum. 2. 2011 China Smart Grid Industry Development Forum. 3. Smart grid cooperation forum with Wuhu City in
September, 2012. 4. The opening ceremony of the first industrial alliance
enterprise was held on November 25, 2011.
1 2 3
4
Core Capabilities Existing in SSGC
Distribu:on
Transmission
U:liza:on
• Grid code compliance• Monitoring and Fault diagnosis • Self Healing Networks • Fault Current Limiters • High Temperature Superconducting • Renewable Integration• Smart Storage • Electric Vehicle to Grid • Power Converter Systems • Energy Management Systems
Core Capabilities

Experimental hall illumination
Engineering Test Area Power Utilization
Office Power Utilization
Laboratory Power Utilization
SFCL
FTDC Transmission System
50kW
Lithium Battery
50kW
WT Emulator
EV charging
10kW
Energy Recycling Electric Load
30kW
PV Emulator
20kW
PMSG WT
Emulator
30kW
DFID WT
Emulator
10kW
PV Emulator
380V 21kW
Power
Amplifier
Line Impedance Emulator
Micro-grid Flexible Configuration Platform
Transformer Line Impedance Emulator
Distribution Network Flexible Configuration Platform
380/690V Transformer
APF
Power Quality Platform
5kW WT
5kW WT
10kW PV
0-3kW
Energy Recycling Electric Load
Impedance
RTDS
Conceptual Diagram of Power Network

Status of SSGC Facility: Building
Officially Opening: July 2014

• In 2010, ISGAN was established in the first session of Clean Energy Ministerial.
• In 2012, China formally joined ISGAN.• ISGAN China Liaison Office is at SJTU, SSGC is
responsible for the daily operation.
ISGAN-International Smart Grid Action Network
• 1、Organize ISGAN China Expert Group ;• 2、Organize ISGAN China Alliance ;• 3、Participate in ISGAN Activity:• (a) Policy, Standards and Regulation• (b)User and Consumer Engagement • (c)Technology and Systems Development
Mission

In September 2012, on behalf of the Chinese government, Professor Jiang Xiuchen took part in the 4th ISGAN Executive Committee Meeting in Nizza, France.
We are Playing a Key Role For China Government in Smart Grid Activity
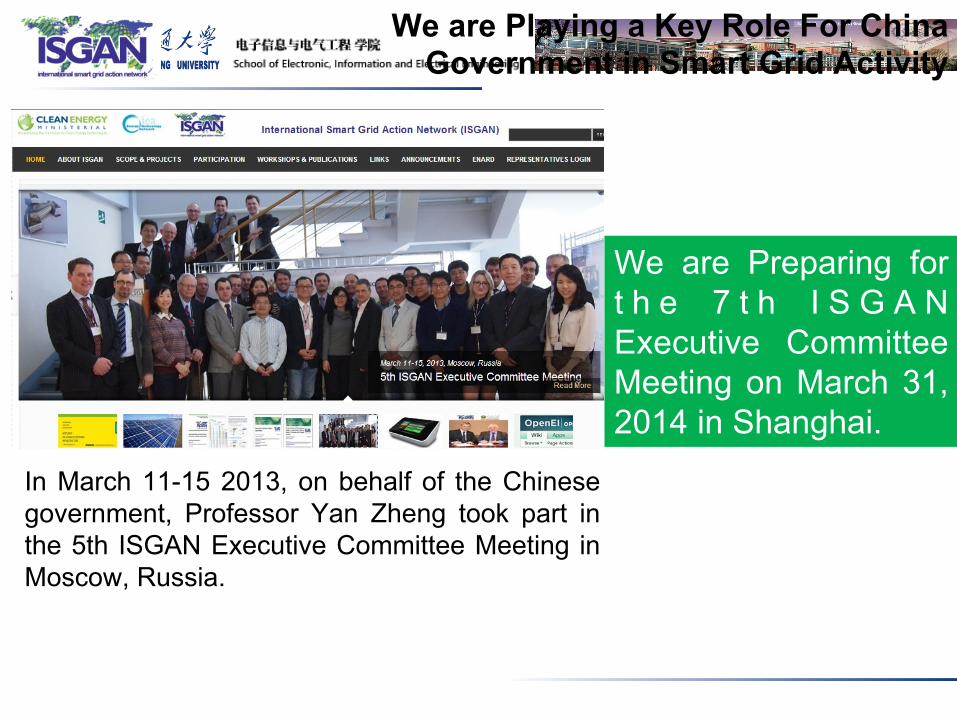
In March 11-15 2013, on behalf of the Chinese government, Professor Yan Zheng took part in the 5th ISGAN Executive Committee Meeting in Moscow, Russia.
We are Playing a Key Role For China Government in Smart Grid Activity
We are Preparing for t h e 7 t h I S G A N Executive Committee Meeting on March 31, 2014 in Shanghai.
Thank you! Please feel free to contact us! SSGC - State Energy Smart Grid R&D Center (Shanghai) 800 Dongchuan Road, Shanghai China 200240 Tel : 021-34207470 Fax : 021-34207470 Website: www.ssgc.sjtu.edu.cn


![Smart Grids[1]](https://static.fdocuments.us/doc/165x107/541009b77bef0a0e0a8b45d7/smart-grids1.jpg)