Technology and Properties of Peripheral Laser-Welded Micro ...
16
materials Article Technology and Properties of Peripheral Laser-Welded Micro-Joints Szymon Tofil * , Hubert Danielewski , Grzegorz Witkowski, Krystian Mulczyk and Bogdan Antoszewski Citation: Tofil, S.; Danielewski, H.; Witkowski, G.; Mulczyk, K.; Antoszewski, B. Technology and Properties of Peripheral Laser- Welded Micro-Joints. Materials 2021, 14, 3213. https://doi.org/10.3390/ ma14123213 Academic Editor: Aleksander Lisiecki Received: 12 March 2021 Accepted: 1 June 2021 Published: 10 June 2021 Publisher’s Note: MDPI stays neutral with regard to jurisdictional claims in published maps and institutional affil- iations. Copyright: © 2021 by the authors. Licensee MDPI, Basel, Switzerland. This article is an open access article distributed under the terms and conditions of the Creative Commons Attribution (CC BY) license (https:// creativecommons.org/licenses/by/ 4.0/). Laser Research Centre, Faculty of Mechatronics and Mechanical Engineering, Kielce University of Technology, Al. Tysi ˛ aclecia Pa ´ nstwa Polskiego 7, 25-314 Kielce, Poland; [email protected] (H.D.); [email protected] (G.W.); [email protected] (K.M.); [email protected] (B.A.) * Correspondence: tofi[email protected]; Tel.: +48-413424533 Abstract: This article presents the results of research on the technology and peripheral properties of laser-welded micro-couplings. The aim of this research was to determine the characteristics of properly made joints and to indicate the range of optimal parameters of the welding process. Thin-walled AISI 316L steel pipes with diameters of 1.5 and 2 mm used in medical equipment were tested. The micro-welding process was carried out on a SISMA LM-D210 Nd:YAG laser. The research methods used were macroscopic and microscopic analyses of the samples, and assessment of the distribution of elements in the weld, the distribution of microhardness and the tear strength of the joint. As a result of the tests, the following welding parameters are recommended: a pulse energy of 2.05 J, pulse duration of 4 ms and frequency of 2 Hz, beam focusing to a diameter of 0.4 mm and a rotation speed of 0.157 rad/s. In addition, the tests show good joint properties with a strength of more than 75% of the thinner pipe, uniform distribution of alloying elements and a complex dendritic structure characteristic of pulse welding. Keywords: laser micro-welding; cryosurgical probe; butt weld; thin tube welding 1. Introduction The progressive development of technology in many fields is associated with minia- turisation. This is especially true in areas such as electrical engineering, automation, the automotive industry, aerospace and medical technology. In many solutions, there is a need for durable and reliable joints. An effective way to meet these expectations is laser micro-welding. The term is not unambiguous, but it is usually assumed that the term refers to a welding process in which the welded parts and the penetration zone have a dimension not exceeding 1 mm [1]. The literature on micro-welding addresses such topics as the following: - Micro-welding of materials with diverse properties [2–7]; - Choice of laser type and the impact of the operating parameters on the joint properties [1,7–9]; - Micro-welding of materials with diverse shapes and sizes [2–4]; - Modelling of the micro-welding process [1,10–14]; - Evaluation of properties and metallurgical changes of laser-welded micro-joints [15–17]. Micro-scale laser welding has specific features that make the process require a special approach. Here, we are dealing with a material with a very low heat capacity, and there- fore the energy supplied must be extremely precisely selected. Laser welding technology, as opposed to standard methods, is distinguished by features that make laser welding, on a micro-scale, the best possible solution next to electron-beam welding [3,4,9]. This is deter- mined by the possibility of choosing the type of laser beam used for welding, the possibility of precise energy dosing in the form of pulses of a short duration and the possibility of focusing the beam on a very small area located in a specific place. Nd:YAG, fibre and disc lasers are the most commonly used lasers for micro-welding applications [1,18–21]. The cur- rent research interest is focused on the use of ultrashort pulse lasers [6,9]. The nanosecond Materials 2021, 14, 3213. https://doi.org/10.3390/ma14123213 https://www.mdpi.com/journal/materials
Transcript of Technology and Properties of Peripheral Laser-Welded Micro ...

materials
Article
Technology and Properties of PeripheralLaser-Welded Micro-Joints
Szymon Tofil * , Hubert Danielewski , Grzegorz Witkowski, Krystian Mulczyk and Bogdan Antoszewski
�����������������
Citation: Tofil, S.; Danielewski, H.;
Witkowski, G.; Mulczyk, K.;
Antoszewski, B. Technology and
Properties of Peripheral Laser-
Welded Micro-Joints. Materials 2021,
14, 3213. https://doi.org/10.3390/
ma14123213
Academic Editor: Aleksander Lisiecki
Received: 12 March 2021
Accepted: 1 June 2021
Published: 10 June 2021
Publisher’s Note: MDPI stays neutral
with regard to jurisdictional claims in
published maps and institutional affil-
iations.
Copyright: © 2021 by the authors.
Licensee MDPI, Basel, Switzerland.
This article is an open access article
distributed under the terms and
conditions of the Creative Commons
Attribution (CC BY) license (https://
creativecommons.org/licenses/by/
4.0/).
Laser Research Centre, Faculty of Mechatronics and Mechanical Engineering, Kielce University of Technology,Al. Tysiaclecia Panstwa Polskiego 7, 25-314 Kielce, Poland; [email protected] (H.D.);[email protected] (G.W.); [email protected] (K.M.); [email protected] (B.A.)* Correspondence: [email protected]; Tel.: +48-413424533
Abstract: This article presents the results of research on the technology and peripheral propertiesof laser-welded micro-couplings. The aim of this research was to determine the characteristicsof properly made joints and to indicate the range of optimal parameters of the welding process.Thin-walled AISI 316L steel pipes with diameters of 1.5 and 2 mm used in medical equipment weretested. The micro-welding process was carried out on a SISMA LM-D210 Nd:YAG laser. The researchmethods used were macroscopic and microscopic analyses of the samples, and assessment of thedistribution of elements in the weld, the distribution of microhardness and the tear strength of thejoint. As a result of the tests, the following welding parameters are recommended: a pulse energy of2.05 J, pulse duration of 4 ms and frequency of 2 Hz, beam focusing to a diameter of 0.4 mm and arotation speed of 0.157 rad/s. In addition, the tests show good joint properties with a strength ofmore than 75% of the thinner pipe, uniform distribution of alloying elements and a complex dendriticstructure characteristic of pulse welding.
Keywords: laser micro-welding; cryosurgical probe; butt weld; thin tube welding
1. Introduction
The progressive development of technology in many fields is associated with minia-turisation. This is especially true in areas such as electrical engineering, automation,the automotive industry, aerospace and medical technology. In many solutions, there is aneed for durable and reliable joints. An effective way to meet these expectations is lasermicro-welding. The term is not unambiguous, but it is usually assumed that the termrefers to a welding process in which the welded parts and the penetration zone have adimension not exceeding 1 mm [1]. The literature on micro-welding addresses such topicsas the following:
−Micro-welding of materials with diverse properties [2–7];− Choice of laser type and the impact of the operating parameters on the joint properties [1,7–9];−Micro-welding of materials with diverse shapes and sizes [2–4];−Modelling of the micro-welding process [1,10–14];− Evaluation of properties and metallurgical changes of laser-welded micro-joints [15–17].
Micro-scale laser welding has specific features that make the process require a specialapproach. Here, we are dealing with a material with a very low heat capacity, and there-fore the energy supplied must be extremely precisely selected. Laser welding technology,as opposed to standard methods, is distinguished by features that make laser welding, on amicro-scale, the best possible solution next to electron-beam welding [3,4,9]. This is deter-mined by the possibility of choosing the type of laser beam used for welding, the possibilityof precise energy dosing in the form of pulses of a short duration and the possibility offocusing the beam on a very small area located in a specific place. Nd:YAG, fibre and disclasers are the most commonly used lasers for micro-welding applications [1,18–21]. The cur-rent research interest is focused on the use of ultrashort pulse lasers [6,9]. The nanosecond
Materials 2021, 14, 3213. https://doi.org/10.3390/ma14123213 https://www.mdpi.com/journal/materials

Materials 2021, 14, 3213 2 of 16
and picosecond interaction of pulses causes a qualitative change in the phenomena oc-curring in the material and is a rewarding research area, which also enters the field ofmicro-welding. The above-mentioned considerations determine that each case of micro-welding, depending on the requirements set, should be treated with special care for theprecise selection of all aspects of the technological process.
Macro-scale welding of stainless steels is widely reported in the literature. However,welding on a micro-scale causes significant differences. The progress of miniaturisationcontributes to extensive progress in micro-welding, including laser welding of stainlesssteels, which is reflected in the number of articles on this subject. The authors of [22]studied the welding parameters for butt welding of 100 µm-thick foil of AISI 316 steel.Good quality joints were obtained using a pulsed Nd:YAG laser for the following processparameters: energy of 1.75 J, welding speed of 525 mm/min and pulse duration of 4 ms.According to the results of the studies in [23–31], the increase in laser power increases thedepth of the weld when welding stainless steel sheets. In [31], an effective empirical modelwas presented in order to predict the joint properties of stainless AISI 304 and 316 steels,where an estimation error between the model and experiment equal to 15% was achieved.The laser power and scanning speed were indicated as essential factors affecting the jointstrength. The grain refinement together with the formation of δ-ferrite in the weld causesa slight increase in hardness in the fusion zone. Similar results were observed in [32–34].The authors of [7] carried out extensive research on butt welding of thin sheets (0.45 mm)of AISI 316 steel with a Nd:YAG laser. The study confirmed that the laser power is themost important parameter in the welding of thin sheets because it significantly affects theproperties of mechanical and metallurgical joints. The overlap of pulses significantly affectsthe surface roughness and strength of welded joints. The authors of [32] presented theresults of a comparative study of arc and Nd:YAG laser welding of AISI 316 steel. It wasfound that laser welding causes less distortion and lower residual stress compared to arcwelding. The differences between laser macro- and micro-welding of stainless steels refermainly to the narrower range of micro-laser welding parameters, which guarantees a goodjoint quality [22,25,29]. In addition, with micro-welding, welds have a very narrow heat-affected zone (HAZ) along the fusion line, and microstructure changes are related to grainrefinement during crystallisation [10,13,30]. Therefore, hardness changes are practicallynegligible. A significant barrier to achieving an acceptable level of welded joints is thermaldeformation, which can cause crack formation during weld formation and lead to loss ofits continuity [27–30]. In the study of [35], the authors studied, in detail, the problem ofgaps in lap joint welding, where, by studying the changes in the microstructure and theshape of the weld, they recommended an acceptable gap size of less than 0.1 mm. One ofthe main problems presented in the abovementioned publications is the problem of stressconcentration and deformation of welded materials, which is particularly troublesome incircumferential lap welding [35]. As a result of deformation, the gap between the weldedelements may increase, and defects may appear in the joint. For these reasons, the problemof joined element stabilisation often determines the effect of the entire operation.
While the welding of thick-walled pipes is widely described in the literature, there areno reports on the welding of thin-walled AISI 316 steel pipes with diameters on the orderof millimetres.
Of special interest in recent years are medical subjects [2,6] in which laser technologyis applied, such as stents, implants and dentures, probes and other medical components.
The authors of this article deal with the development of the technology of laser micro-welding of elements of a medical implement, in a design solution with basically threetypes of circumferential welds (Figure 1—own photos produced by the authors of thisarticle)—lap–butt weld of a probe tip with a tube-shaped probe body; lap joint of two tubes;and fillet joint of two tubes.
The main purpose of this research team is to develop a laser welding method forthin-walled tubes which can be used as an alternative to brazing when the followingrequirements need to be achieved. The joints shall have a weld with no visible welding

Materials 2021, 14, 3213 3 of 16
imperfections, and a regular face and back of the weld with no traces of surface scorching.Small single pores are acceptable. The weld should not degrade the strength of the probe(75% of the strength of the weaker probe component) or its corrosion resistance. The faceof the weld should not extend above the parts being joined.
The developed laser micro-welding technology is innovative for the target productand can replace solutions in current use. For the implementation of the established task,it was necessary to solve the following problems: the selection of a laser device and itsoperating parameters, the study of mechanical properties of the joint and the assessment ofmetallurgical changes in the joint area.
Materials 2021, 14, x FOR PEER REVIEW 3 of 16
article)—lap–butt weld of a probe tip with a tube-shaped probe body; lap joint of two
tubes; and fillet joint of two tubes.
Figure 1. Cont.

Materials 2021, 14, 3213 4 of 16Materials 2021, 14, x FOR PEER REVIEW 4 of 16
Figure 1. Example view of analysed welds: (A) lap–butt weld of the probe tip with a tube-shaped
probe body; (B) lap joint of two tubes; (C) fillet joint of two tubes.
The main purpose of this research team is to develop a laser welding method for thin-
walled tubes which can be used as an alternative to brazing when the following require-
ments need to be achieved. The joints shall have a weld with no visible welding imperfec-
tions, and a regular face and back of the weld with no traces of surface scorching. Small
single pores are acceptable. The weld should not degrade the strength of the probe (75%
of the strength of the weaker probe component) or its corrosion resistance. The face of the
weld should not extend above the parts being joined.
The developed laser micro-welding technology is innovative for the target product
and can replace solutions in current use. For the implementation of the established task,
it was necessary to solve the following problems: the selection of a laser device and its
operating parameters, the study of mechanical properties of the joint and the assessment
of metallurgical changes in the joint area.
2. Experimental Tests
2.1. Methodology
Pulse welding was adopted as the welding method due to the small size and heat
capacity of the welded parts. This provided protection to the component from excessive
temperature increases that could cause structural changes and oxide formation on the sur-
face. The micro-welding process was performed using a typical process parameter selec-
tion procedure with a professional SISMA LM-D210 laser micro-welder. In accordance
with PN-EN ISO 13919-1, the correctness of the joint structure was determined, and weld-
ing imperfections were identified. Welding was performed in two variants with an argon
shroud and without a gas shield. The chemical composition of the welded material is
shown in Table 1. The presented paper describes a detailed study on the selection of weld-
ing process parameters and joint properties for a lap weld according to Figure 1B. The test
procedure for the other welds followed the same pattern, and due to the limited volume
of this article, the results for the other two types of welds are not included here.
The completed joints were continuously evaluated by visual tests (VT) and qualified
for further testing. The planned tests included: macroscopic and microscopic tests of the
weld (HIROX KH-8700 microscope), microstructure and elemental distribution with an
accelerated voltage of 15 keV and a work distance of 10 mm according to ISO 22309:2011
(JOEL 7100f electron microscope and HIROX KH-8700 microscope), and mechanical prop-
erty tests with a standard repeatable measurement accuracy of less than 2.5 N (INSTRON
Figure 1. Example view of analysed welds: (A) lap–butt weld of the probe tip with a tube-shapedprobe body; (B) lap joint of two tubes; (C) fillet joint of two tubes.
2. Experimental Tests2.1. Methodology
Pulse welding was adopted as the welding method due to the small size and heatcapacity of the welded parts. This provided protection to the component from excessivetemperature increases that could cause structural changes and oxide formation on thesurface. The micro-welding process was performed using a typical process parameterselection procedure with a professional SISMA LM-D210 laser micro-welder. In accordancewith PN-EN ISO 13919-1, the correctness of the joint structure was determined, and weldingimperfections were identified. Welding was performed in two variants with an argonshroud and without a gas shield. The chemical composition of the welded material isshown in Table 1. The presented paper describes a detailed study on the selection ofwelding process parameters and joint properties for a lap weld according to Figure 1B.The test procedure for the other welds followed the same pattern, and due to the limitedvolume of this article, the results for the other two types of welds are not included here.
Table 1. Chemical composition of 316 L steel according to EN10204 certified 190821-S047.
%C %Si %Mn %P %S %Cr %Ni %Mo %N
0.009 0.485 1.615 0.0307 0.0041 16.763 11.208 2.041 0.0619
The completed joints were continuously evaluated by visual tests (VT) and qualifiedfor further testing. The planned tests included: macroscopic and microscopic tests of theweld (HIROX KH-8700 microscope), microstructure and elemental distribution with anaccelerated voltage of 15 keV and a work distance of 10 mm according to ISO 22309:2011(JOEL 7100f electron microscope and HIROX KH-8700 microscope), and mechanical prop-erty tests with a standard repeatable measurement accuracy of less than 2.5 N (INSTRON4502 device in accordance with the recommendations of PN-EN ISO 6892-1). The strengthof the resulting welded joints was determined by static tensile testing. The repeatability ofthe results was checked by producing two sets of samples for welding in an argon shroudand without a shielding gas. Five samples were taken for each set based on the processparameters for set 4 as shown in Table 2. The test samples were mounted in speciallydesigned mounting fixtures to maintain the alignment of the tensile force. The strengthtests were conducted at a constant tensile speed of 0.5 mm/s for the samples.
Materials 2021, 14, 3213 5 of 16
Table 2. List of welding parameters accepted after visual testing.
Weld No. Power Setting % Pulse Energy (J) Pulse Power (kW) Welding LinearEnergy (J/mm])
1 7 1.36 0.34 8.69
2 8 1.59 0.4 10.13
3 9 1.82 0.45 11.58
4 10 2.05 0.51 13.03
5 11 2.27 0.57 14.47
Microhardness tests were conducted with load HV0,1 (Innovatest Nexus 4303 hardnesstester in accordance with PN-EN ISO 6507-1). Measurements were recorded for sampleswelded in an argon shroud in the tube core material, in the centre of the penetration and atits edge.
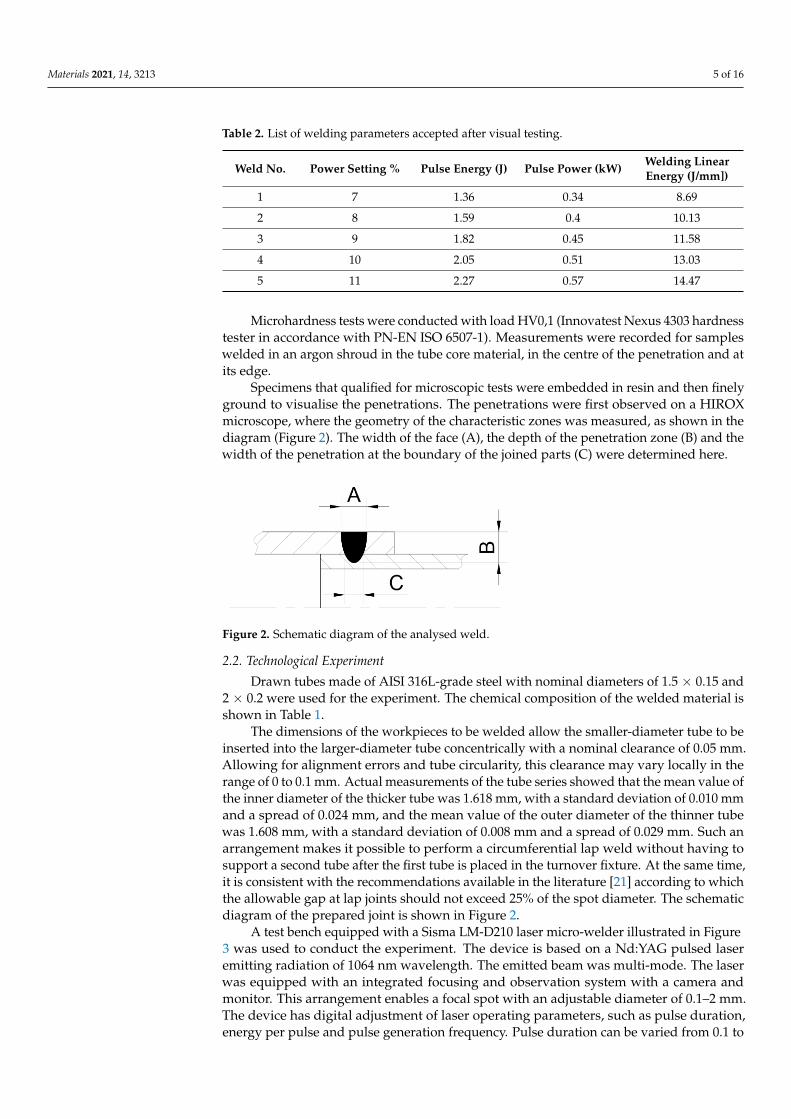
Specimens that qualified for microscopic tests were embedded in resin and then finelyground to visualise the penetrations. The penetrations were first observed on a HIROXmicroscope, where the geometry of the characteristic zones was measured, as shown in thediagram (Figure 2). The width of the face (A), the depth of the penetration zone (B) and thewidth of the penetration at the boundary of the joined parts (C) were determined here.
Materials 2021, 14, x FOR PEER REVIEW 5 of 16
4502 device in accordance with the recommendations of PN-EN ISO 6892-1). The strength
of the resulting welded joints was determined by static tensile testing. The repeatability
of the results was checked by producing two sets of samples for welding in an argon
shroud and without a shielding gas. Five samples were taken for each set based on the
process parameters for set 4 as shown in Table 2. The test samples were mounted in spe-
cially designed mounting fixtures to maintain the alignment of the tensile force. The
strength tests were conducted at a constant tensile speed of 0.5 mm/s for the samples.
Microhardness tests were conducted with load HV0,1 (Innovatest Nexus 4303 hard-
ness tester in accordance with PN-EN ISO 6507-1). Measurements were recorded for sam-
ples welded in an argon shroud in the tube core material, in the centre of the penetration
and at its edge.
Specimens that qualified for microscopic tests were embedded in resin and then
finely ground to visualise the penetrations. The penetrations were first observed on a HI-
ROX microscope, where the geometry of the characteristic zones was measured, as shown
in the diagram (Figure 2). The width of the face (A), the depth of the penetration zone (B)
and the width of the penetration at the boundary of the joined parts (C) were determined
here.
Figure 2. Schematic diagram of the analysed weld.
2.2. Technological Experiment
Drawn tubes made of AISI 316L-grade steel with nominal diameters of 1.5 × 0.15 and
2 × 0.2 were used for the experiment. The chemical composition of the welded material is
shown in Table 1.
Table 1. Chemical composition of 316 L steel according to EN10204 certified 190821-S047.
%C %Si %Mn %P %S %Cr %Ni %Mo %N
0.009 0.485 1.615 0.0307 0.0041 16.763 11.208 2.041 0.0619
The dimensions of the workpieces to be welded allow the smaller-diameter tube to
be inserted into the larger-diameter tube concentrically with a nominal clearance of 0.05
mm. Allowing for alignment errors and tube circularity, this clearance may vary locally
in the range of 0 to 0.1 mm. Actual measurements of the tube series showed that the mean
value of the inner diameter of the thicker tube was 1.618 mm, with a standard deviation
of 0.010 mm and a spread of 0.024 mm, and the mean value of the outer diameter of the
thinner tube was 1.608 mm, with a standard deviation of 0.008 mm and a spread of 0.029
mm. Such an arrangement makes it possible to perform a circumferential lap weld with-
out having to support a second tube after the first tube is placed in the turnover fixture.
At the same time, it is consistent with the recommendations available in the literature [21]
according to which the allowable gap at lap joints should not exceed 25% of the spot di-
ameter. The schematic diagram of the prepared joint is shown in Figure 2.
A test bench equipped with a Sisma LM-D210 laser micro-welder illustrated in Figure
3 was used to conduct the experiment. The device is based on a Nd:YAG pulsed laser
emitting radiation of 1064 nm wavelength. The emitted beam was multi-mode. The laser
was equipped with an integrated focusing and observation system with a camera and
Figure 2. Schematic diagram of the analysed weld.
2.2. Technological Experiment
Drawn tubes made of AISI 316L-grade steel with nominal diameters of 1.5 × 0.15 and2 × 0.2 were used for the experiment. The chemical composition of the welded material isshown in Table 1.
The dimensions of the workpieces to be welded allow the smaller-diameter tube to beinserted into the larger-diameter tube concentrically with a nominal clearance of 0.05 mm.Allowing for alignment errors and tube circularity, this clearance may vary locally in therange of 0 to 0.1 mm. Actual measurements of the tube series showed that the mean value ofthe inner diameter of the thicker tube was 1.618 mm, with a standard deviation of 0.010 mmand a spread of 0.024 mm, and the mean value of the outer diameter of the thinner tubewas 1.608 mm, with a standard deviation of 0.008 mm and a spread of 0.029 mm. Such anarrangement makes it possible to perform a circumferential lap weld without having tosupport a second tube after the first tube is placed in the turnover fixture. At the same time,it is consistent with the recommendations available in the literature [21] according to whichthe allowable gap at lap joints should not exceed 25% of the spot diameter. The schematicdiagram of the prepared joint is shown in Figure 2.
A test bench equipped with a Sisma LM-D210 laser micro-welder illustrated in Figure3 was used to conduct the experiment. The device is based on a Nd:YAG pulsed laseremitting radiation of 1064 nm wavelength. The emitted beam was multi-mode. The laserwas equipped with an integrated focusing and observation system with a camera andmonitor. This arrangement enables a focal spot with an adjustable diameter of 0.1–2 mm.The device has digital adjustment of laser operating parameters, such as pulse duration,energy per pulse and pulse generation frequency. Pulse duration can be varied from 0.1 to

Materials 2021, 14, 3213 6 of 16
25 ms, pulse energy from 0 to 210 J and frequency from 0 to 50 Hz. The maximum powerper pulse reaches 10.5 kW. A protective atmosphere in the weld area was provided by localargon flow.
Materials 2021, 14, x FOR PEER REVIEW 6 of 16
monitor. This arrangement enables a focal spot with an adjustable diameter of 0.1–2 mm.
The device has digital adjustment of laser operating parameters, such as pulse duration,
energy per pulse and pulse generation frequency. Pulse duration can be varied from 0.1
to 25 ms, pulse energy from 0 to 210 J and frequency from 0 to 50 Hz. The maximum power
per pulse reaches 10.5 kW. A protective atmosphere in the weld area was provided by
local argon flow.
Figure 3. View of the SISMA LM-D210 laser bench. (A)—general view, (B)—workspace view. 1—
front touch panel, 2—lighting spots, 3—laser head, 4—gas extractor, 5—manual parameter set
panel, 6—rotary motor, 7—nozzle of gas shield.
Rotation of the workpiece around the axis during the welding process was performed
using a miniature speed-controlled turnover fixture developed and made for this purpose.
Rotational motion was provided by a stepping motor with microstep control. The motor
controller was controlled by a PC and allows a speed range of 0.002–20 rad/s.
In order to select the optimum process parameters, preliminary experiments were
conducted by performing a series of circumferential welds using different laser beam
pulse energies in the range of 1.36–2.27 J. Based on the preliminary tests, the pulse dura-
tion and frequency were selected to be 4 ms and 2 Hz, respectively. The criterion adopted
for the selection of the parameters was to achieve the effect of applying individual pulses
at the level of 80% while maintaining the correct appearance of the weld face and the ab-
sence of clear thermal interaction in the weld area. The recommended overlap value for
tight joints in the literature [21] is 80 to 90%. The focus diameter of the laser beam used in
the welding process was 0.4 mm. The workpiece speed was 0.157 rad/s. The beam was
quenched after the welded workpiece had rotated through an angle of 6.3 rad to ensure a
continuous circumferential weld. Table 2 lists the welding parameters for which a positive
evaluation was obtained from visual testing.
Table 2. List of welding parameters accepted after visual testing.
Weld No. Power Setting % Pulse Energy
(J)
Pulse Power
(kW)
Welding Linear Energy
(J/mm])
1 7 1.36 0.34 8.69
2 8 1.59 0.4 10.13
3 9 1.82 0.45 11.58
4 10 2.05 0.51 13.03
5 11 2.27 0.57 14.47
3. Properties of Laser Micro-Joints—Results and Discussion
3.1. Microstructural Tests
After producing metallographic sections, the images of penetrations were revealed,
which are shown in Figure 4. It can be observed here that the penetration depth (Figure
2B) of welds 1, 2 and 3 (Figure 4) is less than half the thickness of the inner tube. Moreover,
Figure 3. View of the SISMA LM-D210 laser bench. (A)—general view, (B)—workspace view. 1—fronttouch panel, 2—lighting spots, 3—laser head, 4—gas extractor, 5—manual parameter set panel, 6—rotarymotor, 7—nozzle of gas shield.
Rotation of the workpiece around the axis during the welding process was performedusing a miniature speed-controlled turnover fixture developed and made for this purpose.Rotational motion was provided by a stepping motor with microstep control. The motorcontroller was controlled by a PC and allows a speed range of 0.002–20 rad/s.
In order to select the optimum process parameters, preliminary experiments wereconducted by performing a series of circumferential welds using different laser beam pulseenergies in the range of 1.36–2.27 J. Based on the preliminary tests, the pulse duration andfrequency were selected to be 4 ms and 2 Hz, respectively. The criterion adopted for theselection of the parameters was to achieve the effect of applying individual pulses at thelevel of 80% while maintaining the correct appearance of the weld face and the absence ofclear thermal interaction in the weld area. The recommended overlap value for tight jointsin the literature [21] is 80 to 90%. The focus diameter of the laser beam used in the weldingprocess was 0.4 mm. The workpiece speed was 0.157 rad/s. The beam was quenchedafter the welded workpiece had rotated through an angle of 6.3 rad to ensure a continuouscircumferential weld. Table 2 lists the welding parameters for which a positive evaluationwas obtained from visual testing.
3. Properties of Laser Micro-Joints—Results and Discussion3.1. Microstructural Tests
After producing metallographic sections, the images of penetrations were revealed,which are shown in Figure 4. It can be observed here that the penetration depth (Figure 2B)of welds 1, 2 and 3 (Figure 4) is less than half the thickness of the inner tube. Moreover,in the case of weld 1, there was no fusion penetration into the lower material (inner tube);therefore, we deal with the so-called adherence. At the same time, there is a clear increasein the depth of penetration with increasing pulse energy. In the case of weld 5, there is apenetration of both materials to be welded, but there was an outflow of material from theroot side and a significant concavity of the weld face. Based on observations of the structureof the welds obtained, weld 4 was selected, which is characterised by a lack of buckles ofthe weld face, fusion penetration into the lower tube for at least half of its thickness andthe absence of visible welding imperfections.
The appearance of the face as well as its width (Figure 2A) for all welds (except weld 5)is to be qualified as correct. The occurrence of a slight face concavity of welds 3 and 4 isacceptable in contrast to the occurrence of a convex face. The fusion penetration width(Figure 2C) at the boundary of the joined tubes increases with increasing pulse energy.It can be seen that the value of width A stabilises for welds 3, 4 and 5. The face width for

Materials 2021, 14, 3213 7 of 16
weld 4 was 0.468 mm. The trends of changes in the A, B and C quantities characterising thepenetration geometry are shown in the graph in Figure 5.
Materials 2021, 14, x FOR PEER REVIEW 7 of 16
in the case of weld 1, there was no fusion penetration into the lower material (inner tube);
therefore, we deal with the so-called adherence. At the same time, there is a clear increase
in the depth of penetration with increasing pulse energy. In the case of weld 5, there is a
penetration of both materials to be welded, but there was an outflow of material from the
root side and a significant concavity of the weld face. Based on observations of the struc-
ture of the welds obtained, weld 4 was selected, which is characterised by a lack of buckles
of the weld face, fusion penetration into the lower tube for at least half of its thickness and
the absence of visible welding imperfections.
Figure 4. View of obtained welds for lap joints in cross-section.
The appearance of the face as well as its width (Figure 2A) for all welds (except weld
5) is to be qualified as correct. The occurrence of a slight face concavity of welds 3 and 4
is acceptable in contrast to the occurrence of a convex face. The fusion penetration width
(Figure 2C) at the boundary of the joined tubes increases with increasing pulse energy. It
can be seen that the value of width A stabilises for welds 3, 4 and 5. The face width for
weld 4 was 0.468 mm. The trends of changes in the A, B and C quantities characterising
the penetration geometry are shown in the graph in Figure 5.
Figure 5. Dependence of characteristic dimensions of the penetration on the pulse energy value.
Geometrical parameters A, B and C according to Figure 2.
The conducted tests showed that the weld width in the overlap zone (C) has the high-
est growth dynamics. Additionally, the weld depth (B) increases with increasing pulse
energy, which is natural for the process tested. On the other hand, the weld face width (A)
increases slightly due to the constant spot diameter during the performed process. The
increase in the weld face width is caused by an increase in the amount of energy trans-
ferred to the surface of the material and thus the heating of the welded parts.
A joint quality level analysis was performed on the sample joints produced by pulsed
laser micro-welding. Samples were taken from the circumferential lap joint and used for
metallographic tests after grinding and etching processes (Figure 4).
Based on the results obtained, it was found that there is a lack of regularity in the
structure of welds 1 and 5 (areas marked in red), and in the case of the first weld, the
Figure 4. View of obtained welds for lap joints in cross-section.
Materials 2021, 14, x FOR PEER REVIEW 7 of 16
in the case of weld 1, there was no fusion penetration into the lower material (inner tube);
therefore, we deal with the so-called adherence. At the same time, there is a clear increase
in the depth of penetration with increasing pulse energy. In the case of weld 5, there is a
penetration of both materials to be welded, but there was an outflow of material from the
root side and a significant concavity of the weld face. Based on observations of the struc-
ture of the welds obtained, weld 4 was selected, which is characterised by a lack of buckles
of the weld face, fusion penetration into the lower tube for at least half of its thickness and
the absence of visible welding imperfections.
Figure 4. View of obtained welds for lap joints in cross-section.
The appearance of the face as well as its width (Figure 2A) for all welds (except weld
5) is to be qualified as correct. The occurrence of a slight face concavity of welds 3 and 4
is acceptable in contrast to the occurrence of a convex face. The fusion penetration width
(Figure 2C) at the boundary of the joined tubes increases with increasing pulse energy. It
can be seen that the value of width A stabilises for welds 3, 4 and 5. The face width for
weld 4 was 0.468 mm. The trends of changes in the A, B and C quantities characterising
the penetration geometry are shown in the graph in Figure 5.
Figure 5. Dependence of characteristic dimensions of the penetration on the pulse energy value.
Geometrical parameters A, B and C according to Figure 2.
The conducted tests showed that the weld width in the overlap zone (C) has the high-
est growth dynamics. Additionally, the weld depth (B) increases with increasing pulse
energy, which is natural for the process tested. On the other hand, the weld face width (A)
increases slightly due to the constant spot diameter during the performed process. The
increase in the weld face width is caused by an increase in the amount of energy trans-
ferred to the surface of the material and thus the heating of the welded parts.
A joint quality level analysis was performed on the sample joints produced by pulsed
laser micro-welding. Samples were taken from the circumferential lap joint and used for
metallographic tests after grinding and etching processes (Figure 4).
Based on the results obtained, it was found that there is a lack of regularity in the
structure of welds 1 and 5 (areas marked in red), and in the case of the first weld, the
Figure 5. Dependence of characteristic dimensions of the penetration on the pulse energy value.Geometrical parameters A, B and C according to Figure 2.
The conducted tests showed that the weld width in the overlap zone (C) has thehighest growth dynamics. Additionally, the weld depth (B) increases with increasing pulseenergy, which is natural for the process tested. On the other hand, the weld face width(A) increases slightly due to the constant spot diameter during the performed process.The increase in the weld face width is caused by an increase in the amount of energytransferred to the surface of the material and thus the heating of the welded parts.
A joint quality level analysis was performed on the sample joints produced by pulsedlaser micro-welding. Samples were taken from the circumferential lap joint and used formetallographic tests after grinding and etching processes (Figure 4).
Based on the results obtained, it was found that there is a lack of regularity in thestructure of welds 1 and 5 (areas marked in red), and in the case of the first weld, the fusionpenetration line is located at the boundary of the zone between the welded materials,which indicates an unstable joint in the form of incomplete fusion.
In the case of the fifth weld, we are dealing with a through penetration, but the amountof energy supplied by the laser beam was too high and a concavity of the weld face occurreddue to an excessive outflow of material in the root area. Both of the abovementionedwelding imperfections disqualify the resulting joints. For joints 2–4, the assumed fusionpenetration into the lower material was achieved; however, due to the obtained fusionpenetration depths, joint 4 was chosen for further analysis, where a fusion penetration ofthe lower material above half of its thickness was obtained (Figure 6).

Materials 2021, 14, 3213 8 of 16
Materials 2021, 14, x FOR PEER REVIEW 8 of 16
fusion penetration line is located at the boundary of the zone between the welded materi-
als, which indicates an unstable joint in the form of incomplete fusion.
In the case of the fifth weld, we are dealing with a through penetration, but the
amount of energy supplied by the laser beam was too high and a concavity of the weld
face occurred due to an excessive outflow of material in the root area. Both of the above-
mentioned welding imperfections disqualify the resulting joints. For joints 2–4, the as-
sumed fusion penetration into the lower material was achieved; however, due to the ob-
tained fusion penetration depths, joint 4 was chosen for further analysis, where a fusion
penetration of the lower material above half of its thickness was obtained (Figure 6).
Figure 6. Structure of the weld with the characteristic areas of the joint marked. I – weld face, II
and III - the fusion penetration line of the weld into the base material.
The obtained weld has a correct structure with a slight concavity of the weld face
(area 1), which is 20 µm, but it does not exceed the permissible 5% of the thickness of
welded materials. Area 2 shows the fusion penetration line of the weld into the base ma-
terial (Figure 7).
Figure 7. The fusion penetration line zone of the weld into the base material.
Figure 6. Structure of the weld with the characteristic areas of the joint marked. I – weld face, II andIII - the fusion penetration line of the weld into the base material.
The obtained weld has a correct structure with a slight concavity of the weld face(area 1), which is 20 µm, but it does not exceed the permissible 5% of the thickness ofwelded materials. Area 2 shows the fusion penetration line of the weld into the basematerial (Figure 7).
Materials 2021, 14, x FOR PEER REVIEW 8 of 16
fusion penetration line is located at the boundary of the zone between the welded materi-
als, which indicates an unstable joint in the form of incomplete fusion.
In the case of the fifth weld, we are dealing with a through penetration, but the
amount of energy supplied by the laser beam was too high and a concavity of the weld
face occurred due to an excessive outflow of material in the root area. Both of the above-
mentioned welding imperfections disqualify the resulting joints. For joints 2–4, the as-
sumed fusion penetration into the lower material was achieved; however, due to the ob-
tained fusion penetration depths, joint 4 was chosen for further analysis, where a fusion
penetration of the lower material above half of its thickness was obtained (Figure 6).
Figure 6. Structure of the weld with the characteristic areas of the joint marked. I – weld face, II
and III - the fusion penetration line of the weld into the base material.
The obtained weld has a correct structure with a slight concavity of the weld face
(area 1), which is 20 µm, but it does not exceed the permissible 5% of the thickness of
welded materials. Area 2 shows the fusion penetration line of the weld into the base ma-
terial (Figure 7).
Figure 7. The fusion penetration line zone of the weld into the base material. Figure 7. The fusion penetration line zone of the weld into the base material.
Within area 3, the presence of a heat-affected zone was identified, and no clear zonewas found, which is typical of welds in austenitic stainless steels. In the case underconsideration, no growth of austenite grains was observed, only elongated ferrite grainsforming a discontinuous grid around the austenite grains. Such areas occur in steels witha base material structure consisting of austenite with ferrite δ. At high temperatures, aγ→ δ transformation occurs along the fusion penetration line, which begins in the existingferrite δ grains and progresses toward the area of increased chromium concentration.Upon recooling, this area does not reach phase equilibrium, by which the proportion offerrite δ increases, forming a narrow heat-affected zone (Figure 7). The weld root is also
Materials 2021, 14, 3213 9 of 16
marked within area 3 along with the overlapping of the individual weld layers resultingfrom the pulsed welding mode. In pulsed welding, a series of overlapping pulses causesthe material to instantaneously melt and recrystallise, producing the characteristic scalyweld bead. A dendritic structure is formed in the interaction area of the individual pulses,but for individual heat cycles, when the laser beam penetrates the lower sheet region onlyto a certain depth, the impact of the flow field is evident in the solidified structure and thedirection of dendrite growth. In the case of partial weld penetration at the pulsed mode ofthe heat source, discrete growth bands are present, suggesting strong fluctuations in theflow field and affecting the grain growth process and direction.
For the weld case considered, no significant welding imperfections were found;the slight concavity of the weld face is within the acceptable range, and the penetra-tion depth of the laser beam for joint 4 exceeds half the thickness of the lower material.No other type of welding imperfections were found; thus, the fabricated joint was classi-fied as quality level B. Analysis of the microstructure showed a dendritic structure withvisible banding of the dendrite growth resulting from the pulsed welding mode. A narrowheat-affected zone characteristic of austenitic steel was identified.
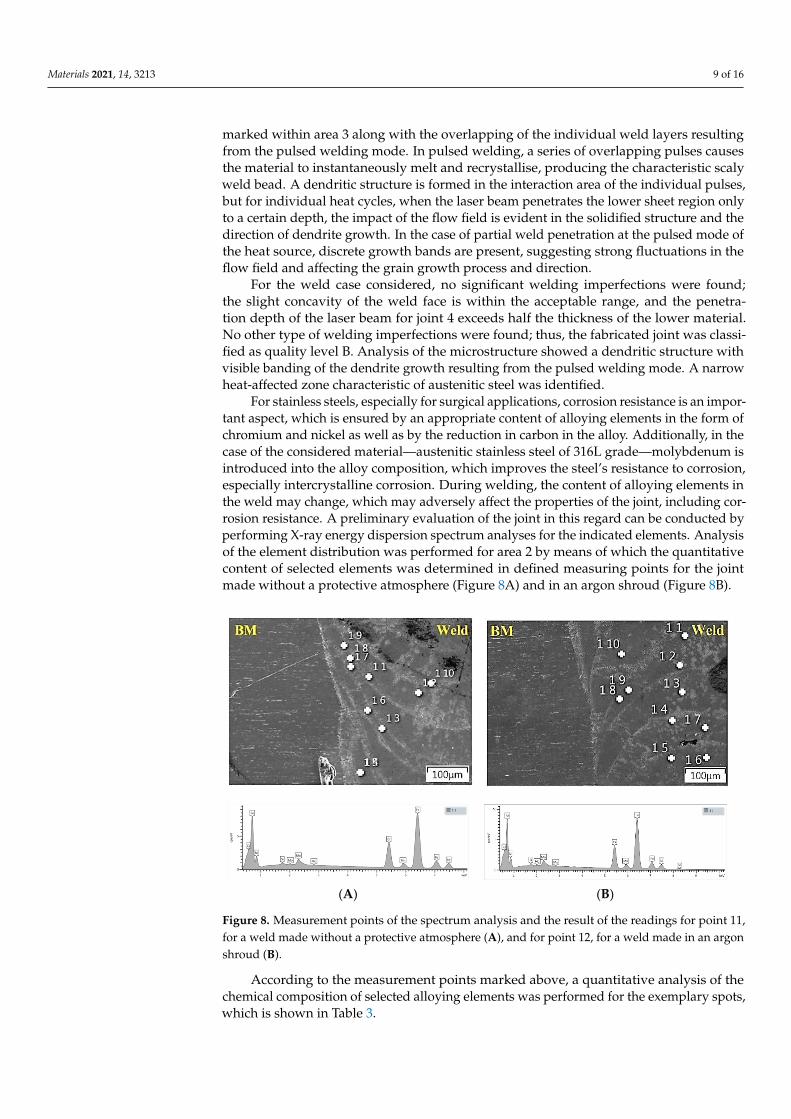
For stainless steels, especially for surgical applications, corrosion resistance is an impor-tant aspect, which is ensured by an appropriate content of alloying elements in the form ofchromium and nickel as well as by the reduction in carbon in the alloy. Additionally, in thecase of the considered material—austenitic stainless steel of 316L grade—molybdenum isintroduced into the alloy composition, which improves the steel’s resistance to corrosion,especially intercrystalline corrosion. During welding, the content of alloying elements inthe weld may change, which may adversely affect the properties of the joint, including cor-rosion resistance. A preliminary evaluation of the joint in this regard can be conducted byperforming X-ray energy dispersion spectrum analyses for the indicated elements. Analysisof the element distribution was performed for area 2 by means of which the quantitativecontent of selected elements was determined in defined measuring points for the jointmade without a protective atmosphere (Figure 8A) and in an argon shroud (Figure 8B).
Materials 2021, 14, x FOR PEER REVIEW 9 of 16
Within area 3, the presence of a heat-affected zone was identified, and no clear zone
was found, which is typical of welds in austenitic stainless steels. In the case under con-
sideration, no growth of austenite grains was observed, only elongated ferrite grains
forming a discontinuous grid around the austenite grains. Such areas occur in steels with
a base material structure consisting of austenite with ferrite δ. At high temperatures, a γ
→ δ transformation occurs along the fusion penetration line, which begins in the existing
ferrite δ grains and progresses toward the area of increased chromium concentration.
Upon recooling, this area does not reach phase equilibrium, by which the proportion of
ferrite δ increases, forming a narrow heat-affected zone (Figure 7). The weld root is also
marked within area 3 along with the overlapping of the individual weld layers resulting
from the pulsed welding mode. In pulsed welding, a series of overlapping pulses causes
the material to instantaneously melt and recrystallise, producing the characteristic scaly
weld bead. A dendritic structure is formed in the interaction area of the individual pulses,
but for individual heat cycles, when the laser beam penetrates the lower sheet region only
to a certain depth, the impact of the flow field is evident in the solidified structure and the
direction of dendrite growth. In the case of partial weld penetration at the pulsed mode
of the heat source, discrete growth bands are present, suggesting strong fluctuations in
the flow field and affecting the grain growth process and direction.
For the weld case considered, no significant welding imperfections were found; the
slight concavity of the weld face is within the acceptable range, and the penetration depth
of the laser beam for joint 4 exceeds half the thickness of the lower material. No other type
of welding imperfections were found; thus, the fabricated joint was classified as quality
level B. Analysis of the microstructure showed a dendritic structure with visible banding
of the dendrite growth resulting from the pulsed welding mode. A narrow heat-affected
zone characteristic of austenitic steel was identified.
For stainless steels, especially for surgical applications, corrosion resistance is an im-
portant aspect, which is ensured by an appropriate content of alloying elements in the
form of chromium and nickel as well as by the reduction in carbon in the alloy. Addition-
ally, in the case of the considered material—austenitic stainless steel of 316L grade—mo-
lybdenum is introduced into the alloy composition, which improves the steel’s resistance
to corrosion, especially intercrystalline corrosion. During welding, the content of alloying
elements in the weld may change, which may adversely affect the properties of the joint,
including corrosion resistance. A preliminary evaluation of the joint in this regard can be
conducted by performing X-ray energy dispersion spectrum analyses for the indicated
elements. Analysis of the element distribution was performed for area 2 by means of
which the quantitative content of selected elements was determined in defined measuring
points for the joint made without a protective atmosphere (Figure 8A) and in an argon
shroud (Figure 8B).
Materials 2021, 14, x FOR PEER REVIEW 10 of 16
(A) (B)
Figure 8. Measurement points of the spectrum analysis and the result of the readings for point 11,
for a weld made without a protective atmosphere (A), and for point 12, for a weld made in an argon
shroud (B).
According to the measurement points marked above, a quantitative analysis of the
chemical composition of selected alloying elements was performed for the exemplary
spots, which is shown in Table 3.
Table 3. Percentage content of selected alloying elements at measurement points.
Welding Atmos-
phere Measurement Point Si % Mn % Cr % Ni % Mo %
in air 1 1 0.31 1.06 16.75 10.26 2.54
1 2 0.32 1.07 16.76 10.49 2.42
in argon 11 0.39 1.25 16.78 10.40 2.45
12 0.26 0.86 16.9 10.58 2.15
The quality level of a joint in terms of anti-corrosivity is defined not only by the con-
tent of selected elements within the weld but also by the difference in the content of these
elements in relation to the base material. In order to determine if there are significant dif-
ferences between the distribution of chromium, nickel, molybdenum and iron in the weld
relative to the base material, qualitative analysis was performed on the cross-section of
the joint (Figure 9).
Figure 8. Measurement points of the spectrum analysis and the result of the readings for point 11,for a weld made without a protective atmosphere (A), and for point 12, for a weld made in an argonshroud (B).
According to the measurement points marked above, a quantitative analysis of thechemical composition of selected alloying elements was performed for the exemplary spots,which is shown in Table 3.

Materials 2021, 14, 3213 10 of 16
Table 3. Percentage content of selected alloying elements at measurement points.
Welding Atmosphere Measurement Point Si % Mn % Cr % Ni % Mo %
in air1 1 0.31 1.06 16.75 10.26 2.54
1 2 0.32 1.07 16.76 10.49 2.42
in argon11 0.39 1.25 16.78 10.40 2.45
12 0.26 0.86 16.9 10.58 2.15
The quality level of a joint in terms of anti-corrosivity is defined not only by thecontent of selected elements within the weld but also by the difference in the content ofthese elements in relation to the base material. In order to determine if there are significantdifferences between the distribution of chromium, nickel, molybdenum and iron in theweld relative to the base material, qualitative analysis was performed on the cross-sectionof the joint (Figure 9).
Materials 2021, 14, x FOR PEER REVIEW 10 of 16
(A) (B)
Figure 8. Measurement points of the spectrum analysis and the result of the readings for point 11,
for a weld made without a protective atmosphere (A), and for point 12, for a weld made in an argon
shroud (B).
According to the measurement points marked above, a quantitative analysis of the
chemical composition of selected alloying elements was performed for the exemplary
spots, which is shown in Table 3.
Table 3. Percentage content of selected alloying elements at measurement points.
Welding Atmos-
phere Measurement Point Si % Mn % Cr % Ni % Mo %
in air 1 1 0.31 1.06 16.75 10.26 2.54
1 2 0.32 1.07 16.76 10.49 2.42
in argon 11 0.39 1.25 16.78 10.40 2.45
12 0.26 0.86 16.9 10.58 2.15
The quality level of a joint in terms of anti-corrosivity is defined not only by the con-
tent of selected elements within the weld but also by the difference in the content of these
elements in relation to the base material. In order to determine if there are significant dif-
ferences between the distribution of chromium, nickel, molybdenum and iron in the weld
relative to the base material, qualitative analysis was performed on the cross-section of
the joint (Figure 9).
Figure 9. Linear analysis of the distribution of elements (Cr, Fe, Mo, Ni) in the weld–MR transitionzone: (a) a weld made in air; (b) a weld made in an argon shroud.
The results of the analysis show a uniform distribution of the selected elements,close to linear in nature, and no significant differences between the nickel and molybdenumcontents in the weld relative to the base material for both welding variants. On the otherhand, a slight reduction in chromium was observed, which may be due to the migrationof this element during metallurgical processes in connection with the residual content ofatmospheric oxygen in the zone between welded elements, or to the burning out of a partof chromium during the welding process. A similar trend was observed for both cases.However, no separations were found in the penetration zone, especially in the chromiumcarbides, which may cause intercrystalline corrosion, and it was therefore assumed that thewelded joint is characterised by good anti-corrosion properties. A full evaluation of thecorrosion resistance of the joint will be obtained after detailed specialised corrosion testing.

Materials 2021, 14, 3213 11 of 16
3.2. Microhardness and Joint Strength Testing
Hardness measurements were performed according to the scheme shown in Figure 10.The measured microhardness values for welds (Figure 4) 3 and 4 averaged 371 HV0.1 in thetube core material (1), ranging from 220 HV0.1 in the central part of the penetration (2) to avalue of 240 HV0.1 near the fusion penetration line (3). This variability is due to the differentcooling conditions of the molten material. The increased microhardness value of the tubecore is the result of crumple occurring during the tube drag process. The result obtainedshows that there are no overheating effects on the material, which is also confirmed by theabsence of discolouration of the material after the welding process. For samples withoutthe argon shroud, there are no significant differences in the microhardness measurementsrecorded.
Materials 2021, 14, x FOR PEER REVIEW 11 of 16
Figure 9. Linear analysis of the distribution of elements (Cr, Fe, Mo, Ni) in the weld–MR transition
zone: (a) a weld made in air; (b) a weld made in an argon shroud.
The results of the analysis show a uniform distribution of the selected elements, close
to linear in nature, and no significant differences between the nickel and molybdenum
contents in the weld relative to the base material for both welding variants. On the other
hand, a slight reduction in chromium was observed, which may be due to the migration
of this element during metallurgical processes in connection with the residual content of
atmospheric oxygen in the zone between welded elements, or to the burning out of a part
of chromium during the welding process. A similar trend was observed for both cases.
However, no separations were found in the penetration zone, especially in the chromium
carbides, which may cause intercrystalline corrosion, and it was therefore assumed that
the welded joint is characterised by good anti-corrosion properties. A full evaluation of
the corrosion resistance of the joint will be obtained after detailed specialised corrosion
testing.
3.2. Microhardness and Joint Strength Testing
Hardness measurements were performed according to the scheme shown in Figure
10. The measured microhardness values for welds (Figure 4) 3 and 4 averaged 371 HV0.1
in the tube core material (1), ranging from 220 HV0.1 in the central part of the penetration
(2) to a value of 240 HV0.1 near the fusion penetration line (3). This variability is due to
the different cooling conditions of the molten material. The increased microhardness
value of the tube core is the result of crumple occurring during the tube drag process. The
result obtained shows that there are no overheating effects on the material, which is also
confirmed by the absence of discolouration of the material after the welding process. For
samples without the argon shroud, there are no significant differences in the microhard-
ness measurements recorded.
Figure 10. The scheme of microhardness measurements: the tube core material (1); the central part
of the penetration (2); near the fusion penetration line (3).
3.3. Test Results for Joint Strength
The results of tensile shear test are shown in Table 4 and in Figure 11.
Table 4. Tensile shear test results of the fabricated micro-joints.
Sample No Sisma
No Shroud (N)
Sisma
With Ar Shroud (N)
Sample 1 773 759
Figure 10. The scheme of microhardness measurements: the tube core material (1); the central part ofthe penetration (2); near the fusion penetration line (3).
3.3. Test Results for Joint Strength
The results of tensile shear test are shown in Table 4 and in Figure 11.
Table 4. Tensile shear test results of the fabricated micro-joints.
Sample No SismaNo Shroud (N)
SismaWith Ar Shroud (N)
Sample 1 773 759
Sample 2 767 788
Sample 3 724 753
Sample 4 761 803
Sample 5 745 750
Mean value (N) 754 770.6
Standard deviation (N) 19.74 23.56
The results obtained were statistically analysed to determine the mean, minimumand maximum values and the mean dispersion of results. On the basis of the analysisperformed, the mean value of the breaking force of the welded joints made was determined,which is 754 N for the weld made without the application of a shielding gas and 770.6 Nfor the joints made in an argon shroud. A slight increase of only 2.20% in the averagestrength of joints made in an argon shroud was observed. However, taking into account thedispersion of the results, it cannot be clearly stated that the shielding gas contributes to the

Materials 2021, 14, 3213 12 of 16
increase in the joint strength. In view of the fact that the measured breaking strength of thethinner tube in the joint is 976 N, it must be concluded that the required strength criterionof the joint (75% of the strength of the weaker element in the joint) was met. This conditionis met for both unshielded and argon-shielded welding.
Materials 2021, 14, x FOR PEER REVIEW 12 of 16
Sample 2 767 788
Sample 3 724 753
Sample 4 761 803
Sample 5 745 750
Mean value (N) 754 770.6
Standard deviation (N) 19.74 23.56
The results obtained were statistically analysed to determine the mean, minimum
and maximum values and the mean dispersion of results. On the basis of the analysis
performed, the mean value of the breaking force of the welded joints made was deter-
mined, which is 754 N for the weld made without the application of a shielding gas and
770.6 N for the joints made in an argon shroud. A slight increase of only 2.20% in the
average strength of joints made in an argon shroud was observed. However, taking into
account the dispersion of the results, it cannot be clearly stated that the shielding gas con-
tributes to the increase in the joint strength. In view of the fact that the measured breaking
strength of the thinner tube in the joint is 976 N, it must be concluded that the required
strength criterion of the joint (75% of the strength of the weaker element in the joint) was
met. This condition is met for both unshielded and argon-shielded welding.
Figure 11. Results of tensile shear test.
During the static tensile test, a rupture characteristic of brittle fracture occurred in
each of the welds tested. Until the moment of breaking, the samples underwent a charac-
teristic deformation passing successively through the areas of elasticity and plasticity. No
obvious plasticity growth before fracture was observed. The course of deformation in both
highlighted areas should be described as typical for austenitic steel. Tensile cracking of a
sample is the result of the joint interaction of tensile and shear stresses. There are two
types of tensile cracking in laser welds: heat-affected zone boundary cracking and inter-
facial cracking. Since the hardness of the tube material is greater than the hardness of the
weld, the tensile deformation is concentrated in the heat-affected zone or at its boundary.
The grains in the heat-affected zone tend to grow because the heat-affected zone is kept
at a high temperature for a long time; the high temperature gradient results in the trans-
formation of the material structure. Hence, the heat-affected zone is often the weakest area
of the weld. As a result, joint breaking most often occurs along the fusion penetration line
or at the boundary between the heat-affected zone and the base material. The fracture
characteristics observed (for sample nr 4) in the scanning microscope images are shown
in Figure 12. These observations suggest that the fractures are complex in nature. On the
one hand, it was noticed that fractures along the fusion penetration line were observed on
some samples (Figure 12A). On the other hand, some samples, in whole or in part, were
Figure 11. Results of tensile shear test.
During the static tensile test, a rupture characteristic of brittle fracture occurredin each of the welds tested. Until the moment of breaking, the samples underwent acharacteristic deformation passing successively through the areas of elasticity and plasticity.No obvious plasticity growth before fracture was observed. The course of deformation inboth highlighted areas should be described as typical for austenitic steel. Tensile crackingof a sample is the result of the joint interaction of tensile and shear stresses. There aretwo types of tensile cracking in laser welds: heat-affected zone boundary cracking andinterfacial cracking. Since the hardness of the tube material is greater than the hardnessof the weld, the tensile deformation is concentrated in the heat-affected zone or at itsboundary. The grains in the heat-affected zone tend to grow because the heat-affected zoneis kept at a high temperature for a long time; the high temperature gradient results in thetransformation of the material structure. Hence, the heat-affected zone is often the weakestarea of the weld. As a result, joint breaking most often occurs along the fusion penetrationline or at the boundary between the heat-affected zone and the base material. The fracturecharacteristics observed (for sample nr 4) in the scanning microscope images are shownin Figure 12. These observations suggest that the fractures are complex in nature. On theone hand, it was noticed that fractures along the fusion penetration line were observedon some samples (Figure 12A). On the other hand, some samples, in whole or in part,were fractured across the penetrated zone (Figure 12B). In both observed mechanisms(Figure 12A,B), areas of brittle fracture (marked 1) and areas of ductile fracture (marked 2)are distinguished. At the fusion penetration line crack, traces of overlapping consecutivelaser pulses are visible, on which transverse cracks are visible (Figure 12C). They are theresult of accumulated stresses resulting from tensile and shear forces as well as internalstresses in the exposed fusion penetration line. Figure 12D shows the ductile fracture onthe inner edge of the welded tubes. A partially developed ductile fracture is observed inthe inner part of the tube outside the penetration (Figure 12E). Figure 12F shows a fracturealong the fusion penetration line in the beam extinction area at the end of the circumferentialweld. The authors believe that the complex nature of the fracture is the cause of the largedispersion of shear fracture strength results. This is due to the increased gap betweenthe joined elements. It results from deformations during welding and the accuracy ofwelded tubes. This proves that the weld may not be uniform along the entire circumference.To avoid this, a dimensional selection of the tubes should be made before welding.

Materials 2021, 14, 3213 13 of 16
Materials 2021, 14, x FOR PEER REVIEW 13 of 16
fractured across the penetrated zone (Figure 12B). In both observed mechanisms (Figure
12A,B), areas of brittle fracture (marked 1) and areas of ductile fracture (marked 2) are
distinguished. At the fusion penetration line crack, traces of overlapping consecutive laser
pulses are visible, on which transverse cracks are visible (Figure 12C). They are the result
of accumulated stresses resulting from tensile and shear forces as well as internal stresses
in the exposed fusion penetration line. Figure 12D shows the ductile fracture on the inner
edge of the welded tubes. A partially developed ductile fracture is observed in the inner
part of the tube outside the penetration (Figure 12E). Figure 12F shows a fracture along
the fusion penetration line in the beam extinction area at the end of the circumferential
weld. The authors believe that the complex nature of the fracture is the cause of the large
dispersion of shear fracture strength results. This is due to the increased gap between the
joined elements. It results from deformations during welding and the accuracy of welded
tubes. This proves that the weld may not be uniform along the entire circumference. To
avoid this, a dimensional selection of the tubes should be made before welding.
Figure 12. Morphology of the sample fracture after breaking: (A) 500× magnification; (B) 100× mag-
nification; (C) 1000× magnification; (D) 500× magnification; (E) 10,000× magnification; (F) 200× mag-
nification.
Figure 12. Morphology of the sample fracture after breaking: (A) 500×magnification; (B) 100×magnification; (C) 1000×mag-nification; (D) 500×magnification; (E) 10,000×magnification; (F) 200×magnification.
The shape shown in microphotograph 12f is the result of the last laser pulse and is atypical image for extinction without reducing the laser power (without power ramping).The solidification of the metal here takes place from the area of the highest temperaturegradient, i.e., from the outer diameter, and the material in the liquid phase begins tocrystallise at a speed higher than the flow velocity of the liquid metal; hence, the centre isonly partially flooded, which results in the formation of a concave.
4. Summary
The results of the conducted tests on laser overlap welding of thin-walled tubeswith nominal diameters of 1.5 × 0.15 and 2 × 0.2 mm allow for the formulation of thefollowing conclusions.

Materials 2021, 14, 3213 14 of 16
1. The best weld properties were obtained in argon-shielded welding at a pulse energyof 2.05 J, pulse duration of 4 ms and frequency of 2 Hz, beam focusing to a diameter of0.4 mm and a rotation speed of 0.157 rad/s.
2. The weld face is smooth with a gentle undulation corresponding to the number ofpulses on the circumference, avoiding the formation of surface oxides when welding in anargon shroud.
3. The fusion penetration zone has a typical U shape, and its microstructure ischaracterised by the occurrence of dendrite density in the zone near the fusion penetrationboundary. Moreover, the boundaries of the overlapping consecutive coagulated meltingfronts of the material stand out in the fusion penetration structure.
4. The cracking of samples during static tensile testing is complex in nature. It mostoften occurs along the fusion penetration line, and less often by penetration. The observedfractures show areas of brittle fracture and weaker-shaped areas of ductile fracture.
5. Analysis of the chemical composition according to the defined measurementpoints showed no significant differences for both welding variants. No excessive burningor oxidation of alloying elements was observed in both analysed welds relative to thebase material.
6. The linear nature of the chromium, nickel and molybdenum distribution betweenthe base material and the weld shows the high level of purity of the welds obtained andthe lack of reduction in the content of alloying elements. Additionally, no changes werefound in the fusion penetration line area, and thus the corrosion protection capability ofthe material was maintained.
7. Before welding, it is recommended that a dimensional selection of the tubes shouldbe conducted ensuring the smallest possible gap between the welded elements (maximum0.1 mm).
Author Contributions: Conceptualization, B.A. and S.T.; methodology, B.A.; validation, B.A. and S.T.;formal analysis, H.D. and S.T.; investigation, G.W., S.T., H.D. and K.M.; data curation, G.W. and K.M.;writing—original draft preparation, S.T.; writing—review and editing, B.A. and S.T. All authors haveread and agreed to the published version of the manuscript.
Funding: Supported by a grant from the National Centre for Research and Development (NCBiR),project No. POIR.04.01.04-00-0161/17.
Institutional Review Board Statement: Not applicable.
Informed Consent Statement: Not applicable.
Data Availability Statement: Not applicable.
Acknowledgments: The research reported herein was supported by a grant from the National Centrefor Research and Development (NCBiR), project No. POIR.04.01.04-00-0161/17.
Conflicts of Interest: The authors declare no conflict of interest.
References1. Naeem, M. Developments in Laser Microwelding Technology Handbook of Laser Welding Technologies, 1st ed.; Woodhead Publishing:
Cambridge, UK, 2013.2. Baruah, M.; Bag, S. Influence of pulsation in thermo-mechanical analysis on laser micro-welding of Ti6Al4V alloy. Opt. Laser Tech-
nol. 2017, 90, 40–51. [CrossRef]3. Chen, X.; Brox, D.; Assadsangabi, B.; Ali, M.S.M.; Takahata, K. A stainless-steel-based implantable pressure sensor chip and its
integration by microwelding. Sens. Actuators A Phys. 2017, 257, 134–144. [CrossRef]4. Heinen, P.; Haeusler, A.; Mehlmann, B.; Olowinsky, A. Laser Beam Microwelding of Lithium-ion Battery Cells with Copper
Connectors for Electrical Connections in Energy Storage Devices. Lasers Eng. 2017, 36, 24. [CrossRef]5. Seiler, M.; Patschger, A.; Bliedtner, J. Investigations of welding instabilities and weld seam formation during laser microwelding of
ultrathin metal sheets. In Proceedings of the 34th International Congress on Applications of Lasers and Electro-Optics (ICALEO),Atlanta, GA, USA, 18–22 October 2015. J. Laser Appl. 2016, 28, 022417. [CrossRef]
6. Carter, R.M.; Troughton, M.; Chen, J.; Elder, I.; Thomson, R.R.; Esser, M.J.D.; Lamb, R.A.; Hand, D.P. Towards industrial ultrafastlaser microwelding: SiO_2 and BK7 to aluminum alloy. Appl. Opt. 2017, 56, 4873–4881. [CrossRef] [PubMed]

Materials 2021, 14, 3213 15 of 16
7. Jiang, X.; Chandrasekar, S.; Wang, C. A laser microwelding method for assembly of polymer based microfluidic devices. Opt.Lasers Eng. 2015, 66, 98–104. [CrossRef]
8. Mao, J.; Huang, Y.; He, P. Study on joint formation evolution in laser microwelding of Pt-10% Ir and 316 LVM SS crossedwires. In Proceedings of the International Symposium on Mechanical Engineering and Material Science (ISMEMS), Jeju Island,South Korea, 17–19 November 2016; AER-Advances in Engineering Research. Volume 93, pp. 11–16. [CrossRef]
9. Kim, S.; Park, J.; So, S.; Ahn, S.; Choi, J.; Koo, C.; Joung, Y.-H. Characteristics of an Implantable Blood Pressure Sensor Packagedby Ultrafast Laser Microwelding. Sensors 2019, 19, 1801. [CrossRef]
10. Haeusler, A.; Schuermann, A.; Schoeler, C.; Olowinsky, A.; Gillner, A.; Poprawe, R. Quality improvement of copper welds bylaser microwelding with the usage of spatial power modulation. J. Laser Appl. 2017, 29, 022422. [CrossRef]
11. Danielewski, H.; Skrzypczyk, A.; Hebda, M.; Tofil, S.; Witkowski, G.; Długosz, P.; Nigrovic, R. Numerical and MetallurgicalAnalysis of Laser Welded, Sealed Lap Joints of S355J2 and 316L Steels under Different Configurations. Materials 2020, 13, 5819.[CrossRef] [PubMed]
12. Saha, P.; Waghmare, D. Parametric optimization for autogenous butt laser welding of sub-millimeter thick SS 316 sheets usingcentral composite design. Opt. Laser Technol. 2020, 122, 105833. [CrossRef]
13. Wang, L.; Wei, Y.; Chen, J.; Zhao, W. Macro-micro modeling and simulation on columnar grains growth in the laser welding poolof aluminum alloy. Int. J. Heat Mass Transf. 2018, 123, 826–838. [CrossRef]
14. Wang, L.; Wang, K. Investigation on microstructural patterns and hot crack in the molten pool via integrated finite-element andphase-field modeling. J. Manuf. Process. 2019, 48, 191–198. [CrossRef]
15. Salleh, M.N.M.; Ishak, M.; Quazi, M.M.; Aiman, M.H. Microstructure, mechanical, and failure characteristics of laser-microweldedAZ31B Mg alloy optimized by response surface methodology. Int. J. Adv. Manuf. Technol. 2018, 99, 985–1001. [CrossRef]
16. Hummel, M.; Haeusler, A.; Olowinsky, A.; Gillner, A.; Poprawe, R. Comparing 1070 nm and 515 nm Wavelength Laser BeamSources in Terms of Efficiency for Laser Microwelding Copper. Lasers Eng. 2020, 46, 187–202. Available online: https://www.oldcitypublishing.com/journals/lie-home/lie-issue-contents/lie-volume-46-number-1-4-2020/lie-46-1-4-p-187-202/ (accessedon 20 January 2021).
17. Geng, S.; Jiang, P.; Guo, L.; Gao, X.; Mi, G. Multi-scale simulation of grain/sub-grain structure evolution during solidification inlaser welding of aluminum alloys. Int. J. Heat Mass Transf. 2020, 149, 119252. [CrossRef]
18. Huang, S.-H.; Huang, Y.-J.; Hsieh, C.-H.; Chen, H.-Z.; Chui, H.-C. Visual-assisted laser microwelding of carbon microfiber onmetal plates. Opt. Laser Technol. 2018, 108, 368–371. [CrossRef]
19. Patschger, A.; Bliedtner, J. Constraints and optimization of the laser microwelding process of thin metal foils. J. Laser Appl. 2017,29, 22408. [CrossRef]
20. Okamoto, Y.; Nishi, N.; Nakashiba, S.; Sakagawa, T.; Okada, A. Smart laser micro-welding of difficult-to-weld materials forelectronic industry. Laser-based Micro Nanoprocessing IX 2015, 9351, 935102. [CrossRef]
21. Anming, H.; Jolanta, J.-R.; Tomokazu, S. Joining Technology Innovations at the Macro, Micro, and Nano Levels. Appl. Sci. 2019, 9,3568. [CrossRef]
22. Gao, Z.; Shao, X.; Jiang, P.; Cao, L.; Zhou, Q.; Yue, C.; Liu, Y.; Wang, C. Parameters optimization of hybrid fiber laser-arc buttwelding on 316L stainless steel using Kriging model and GA. Opt. Laser Technol. 2016, 83, 153–162. [CrossRef]
23. Miyamoto, I.; Kosumi, T.; Park, S.; Uragishi, H.; Watanabe, K.; Ooie, T. Applications of single-mode fiber-lasers to novel microwelding. In Proceedings of the Fifth International Symposium on Laser Precision Microfabrication, Nara, Japan, 11–14 May 2004;Volume 5662, pp. 507–514.
24. Ventrella, V.A.; Berretta, J.R.; de Rossi, W. Pulsed Nd:YAG laser seam welding of AISI 316L stainless steel thin foils. J. Mater.Process. Technol. 2010, 210, 1838–1843. [CrossRef]
25. Landowski, M.; Swierczynska, A.; Rogalski, G.; Fydrych, D. Autogenous fiber laser welding of 316L austenitic and 2304 leanduplex stainless steels. Materials 2020, 13, 2930. [CrossRef]
26. Lisiecki, A.; Klimpel, A. Laser welding of butt joints of austenitic stainless steel AISI 321. J. Achieve. Mater. Manufact. Eng. 2007,25, 63–66.
27. Dontu, O.; Ganatsios, S.; Alexandrescu Nicolae, D.B. Laser micro-welding of stainless steel components used in mechatronicsystems. Mecatronica 2006, 40–42.
28. Kumar, A.; Gupta, M.P.; Banerjee, J.; Neogy, S.; Keskar, N.; Bhatt, R.B.; Behere, P.; Biswas, D.J. Micro-Welding of Stainless Steeland Copper Foils Using a Nano -Second Pulsed Fiber Laser. Lasers Manuf. Mater. Process. 2019, 6, 158–172. [CrossRef]
29. Liao, H.T.; Chen, Z.W. A study on fiber laser micro-spot welding of thin stainless steel using response surface methodology andsimulated annealing approach. Int. J. Adv. Manuf. Technol. 2012, 67, 1015–1025. [CrossRef]
30. Türkan, M.; Karakas, Ö. The influence of corrosion on the mechanical behavior of AISI 316L stainless steel welds. Mechanika 2019,25, 114–118. [CrossRef]
31. Kumar, N.; Mukherjee, M.; Bandyopadhyay, A. Comparative study of pulsed Nd:YAG laser welding of AISI 304 and AISI 316stainless steels. Opt. Laser Technol. 2017, 88, 24–39. [CrossRef]
32. Chatterjee, S.; Mahapatra, S.S.; Bharadwaj, V.; Upadhyay, B.N.; Bindra, K.S.; Thomas, J. Parametric appraisal of mechanical andmetallurgical behavior of butt welded joints using pulsed Nd:YAG laser on thin sheets of AISI 316. Opt. Laser Technol. 2019, 117,186–199. [CrossRef]

Materials 2021, 14, 3213 16 of 16
33. Sathiya, P.; Abdul Jaleel, M.Y. Measurement of the bead profile and microstructural characterization of a CO2 laser welded AISI904 L super austenitic stainless steel. Opt. Laser Technol. 2010, 42, 960–968. [CrossRef]
34. Anawa, E.M.; Olabi, A.G. Using Taguchi method to optimize welding pool of dissimilar laser-welded components. Opt.Laser Technol. 2008, 40, 379–388. [CrossRef]
35. Wang, H.; Wang, Y.; Li, X.; Wang, W.; Yang, X. Influence of assembly gap size on the structure and properties of SUS301L stainlesssteel laser welded lap joint. Materials 2021, 14, 996. [CrossRef] [PubMed]