Technology and Expenditure Growth in Health Care Amitabh Chandra HARVARD UNIVERSITY.
38
Technology and Expenditure Growth in Health Care Amitabh Chandra HARVARD UNIVERSITY
-
Upload
shanna-hawkins -
Category
Documents
-
view
215 -
download
1
Transcript of Technology and Expenditure Growth in Health Care Amitabh Chandra HARVARD UNIVERSITY.

Technology and Expenditure Growth in Health Care
Amitabh Chandra HARVARD UNIVERSITY

United StatesSweden
DenmarkGermany
IrelandNetherlands
AustriaSwitzerland
NorwayFranceCanada
JapanIcelandFinland
BelgiumAustralia
New ZealandGreece
UKPortugal
Spain
0.0 2.0 4.0 6.0 8.0 10.0 12.0 14.0 16.0
Health Care Share of GDP for OECD Countries in 1980
US is not an outlier

United StatesSweden
DenmarkGermany
IrelandNetherlands
AustriaSwitzerland
NorwayFranceCanada
JapanIcelandFinland
BelgiumAustralia
New ZealandGreece
UKPortugal
Spain
0.0 2.0 4.0 6.0 8.0 10.0 12.0 14.0 16.0
Health Care Share of GDP for OECD Countries in 2010

United StatesSweden
DenmarkGermany
IrelandNetherlands
AustriaSwitzerland
NorwayFrance
CanadaJapan
IcelandFinland
BelgiumAustralia
New ZealandGreece
UKPortugal
Spain
0.0 1.0 2.0 3.0 4.0 5.0 6.0 7.0
Health Care Share of GDP for OECD Countries Increase from 1980-2010
Outlier?

Houston...we have a problem...
This particular insurance company has made promises to its policy holders that have a current value $40 trillion… in excess of the revenues that it expects to receive…..
Think of the United States government as a gigantic insurance company with a sideline business in national defense…
This particular insurance company has made promises to its policy holders that have a current value $20 trillion… in excess of the revenues that it expects to receive…..
It is an accident waiting to happen.
Peter FisherUndersecretary of the TreasuryNovember 2002
Congressional Budget Office (CBO)September 2010

Incomplete Understanding of Tradeoffs

Questions and Puzzles• What is the association between
technology growth and rising health care expenditures?
• Why have U.S. health care expenditures grown so rapidly, relative to other countries, but without consistently better outcomes?
• Medical technologies differ in their average productivity
• Some technologies have high average productivity, others are lesser average productivity
• US reimbursement system leads to the adoption of lower productivity technologies
• Reimbursement system encourages more innovation in lower (average) productivity technologies

xx*
The Productivity of Medical Treatments
Cost per patient
x*
Marginal Benefit from Treatment
Treatment (X)

xx*
Cost per patient
The Productivity of Medical Treatments
x* x*x*
Marginal Benefit from Treatment
Treatment (X)

xx*
Cost per patient
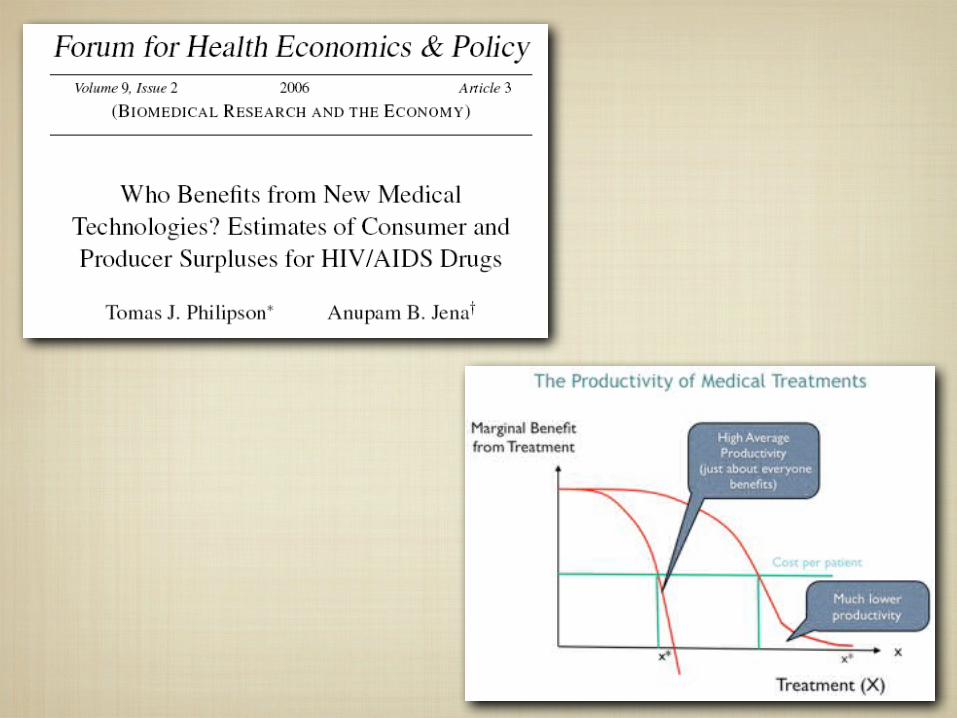
The Productivity of Medical Treatments Marginal
Benefit from Treatment
x*x*
High Average Productivity
(just about everyone benefits)
Lower average productivity
Treatment (X)

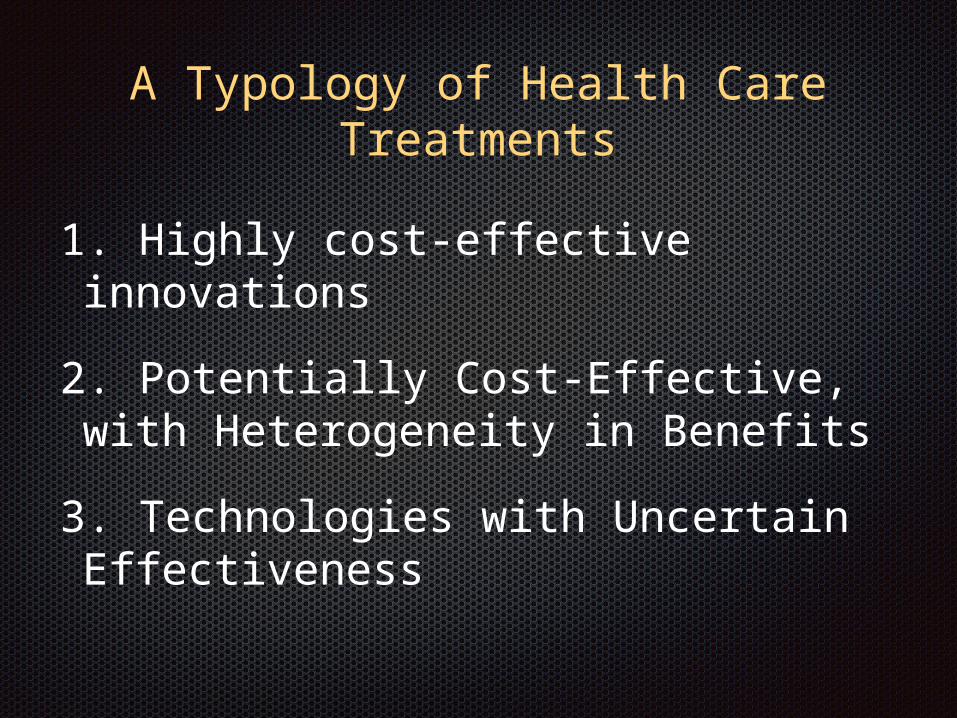
A Typology of Health Care Treatments
1. Highly cost-effective innovations
2. Potentially Cost-Effective, with Heterogeneity in Benefits
3. Technologies with Uncertain Effectiveness

Benefits (area under the curve) and Costs of Category I
Innovation

Source: Swartz, MN, NEJM Oct 28, 2004
A Typology of Health Care Treatments
1. Highly cost-effective innovations
2. Potentially Cost-Effective, with Heterogeneity in Benefits
3. Technologies with Uncertain Effectiveness
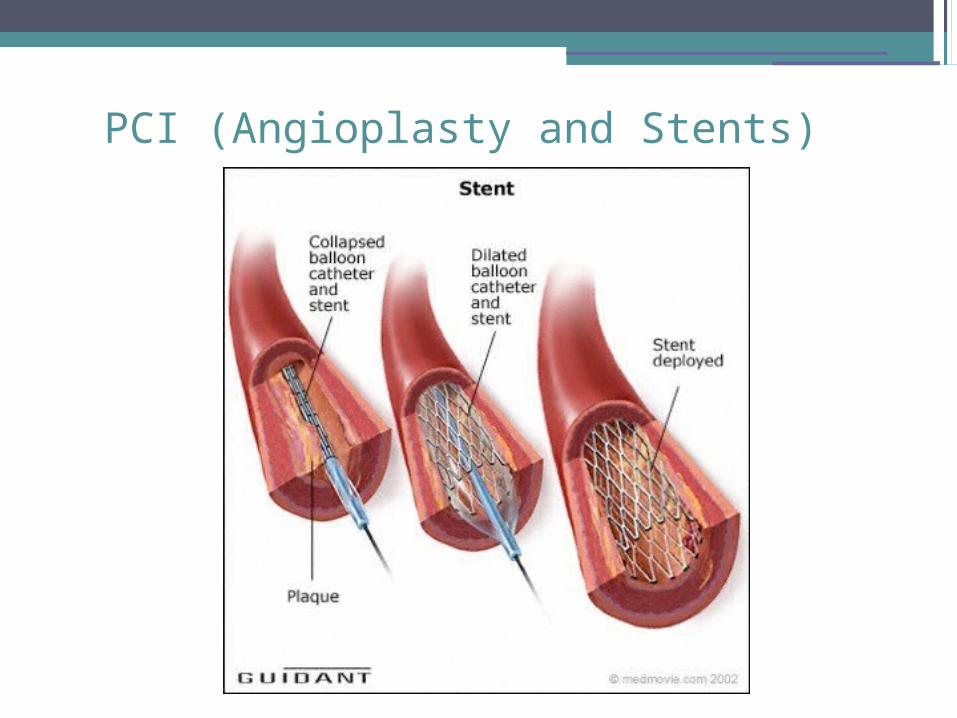
PCI (Angioplasty and Stents)


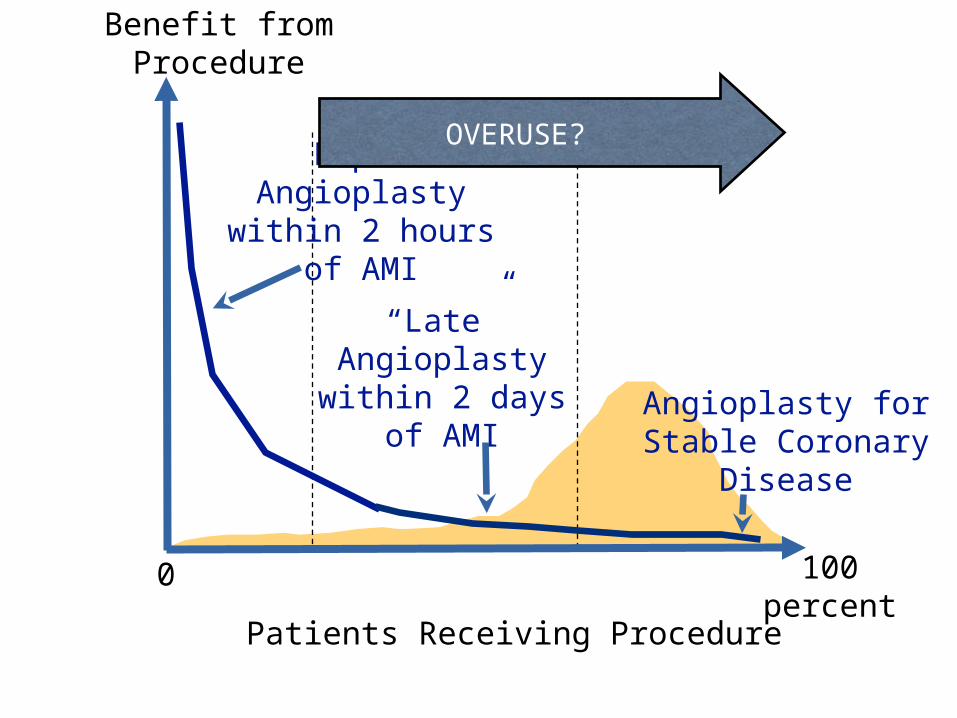
Patients Receiving Procedure
0
Benefit from Procedure
100 percent
Rapid Angioplasty within 2 hours of
AMI
“Late” Angioplasty
within 2 days of AMI Angioplasty for Stable
Coronary Disease
OVERUSE?
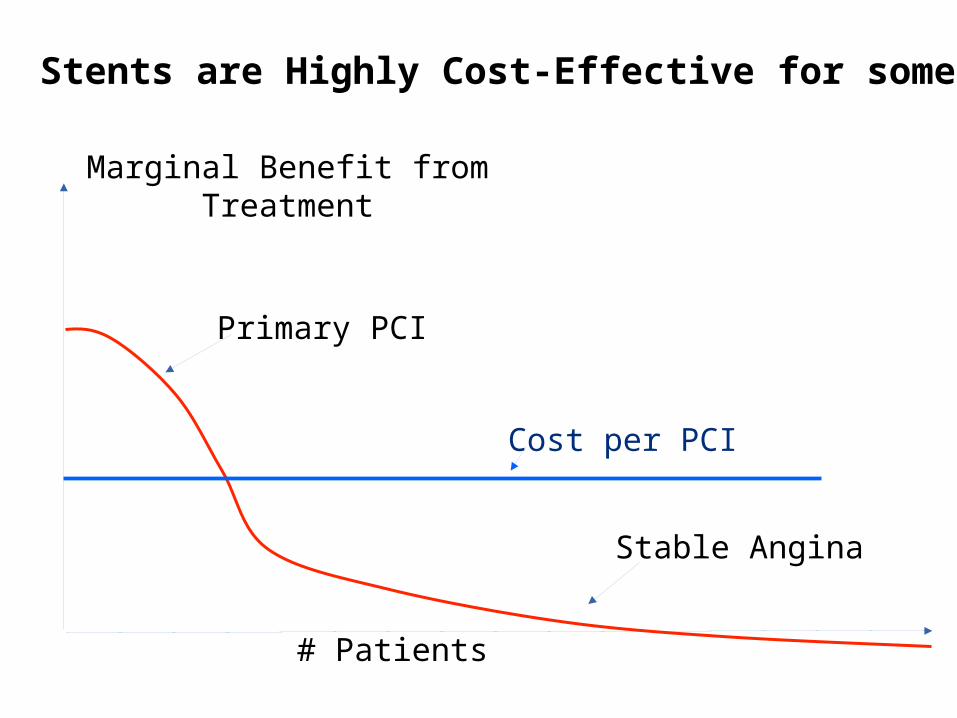
Primary PCI
Stable Angina
# Patients
Cost per PCI
Stents are Highly Cost-Effective for some
Marginal Benefit from Treatment

# Patients
Cost per PCI
Total Cost
X’
But less so for the marginal patient
Marginal Benefit from Treatment
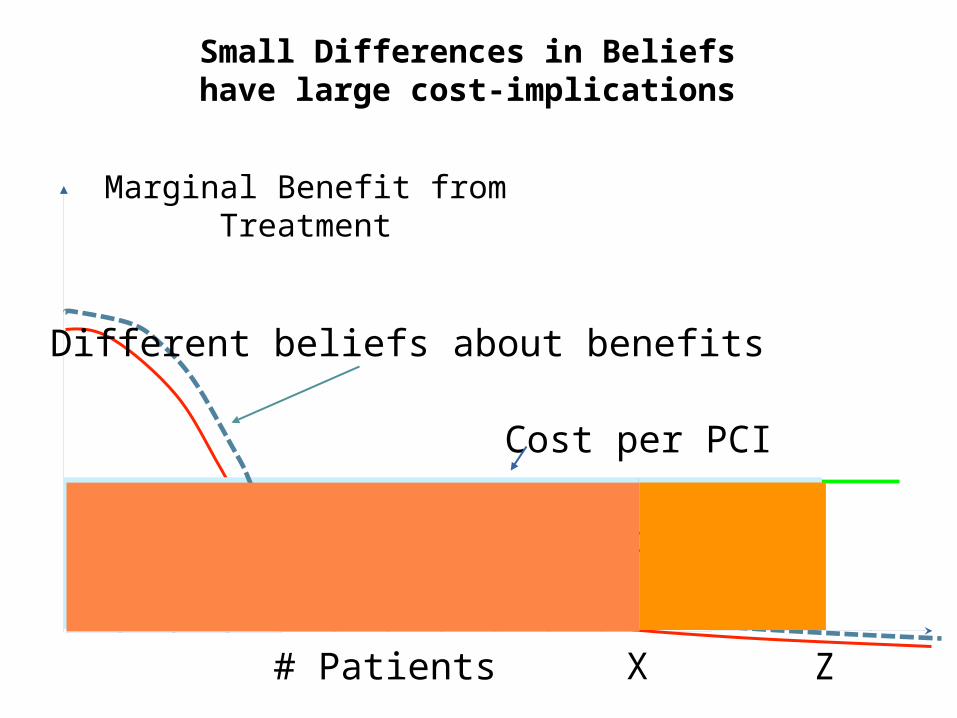
# Patients
Cost per PCI
Total Cost
X Z
Different beliefs about benefits
Small Differences in Beliefs have large cost-implications
Marginal Benefit from Treatment

Three Categories of Health Care Treatments
1. Highly cost-effective innovations
2. Potentially Cost-Effective Treatments with Heterogeneity in Benefits
3. Technologies with Uncertain Effectiveness

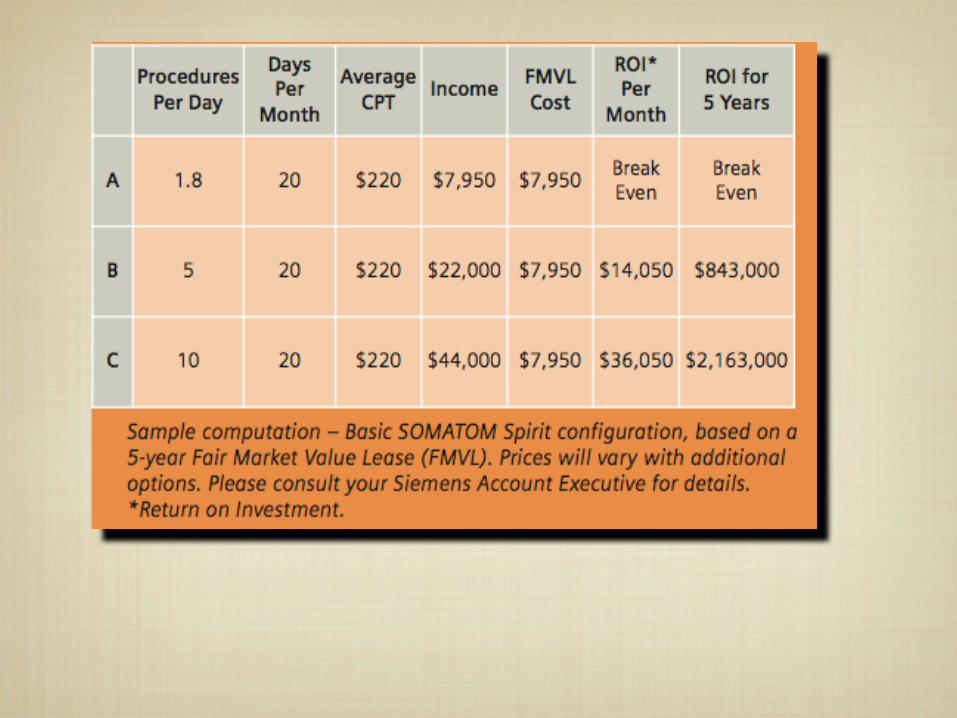

Fixed Cost: $150 millionBenefit: Unknown
PROTON BEAM THERAPY
Medicare reimburses $6000 per treatment

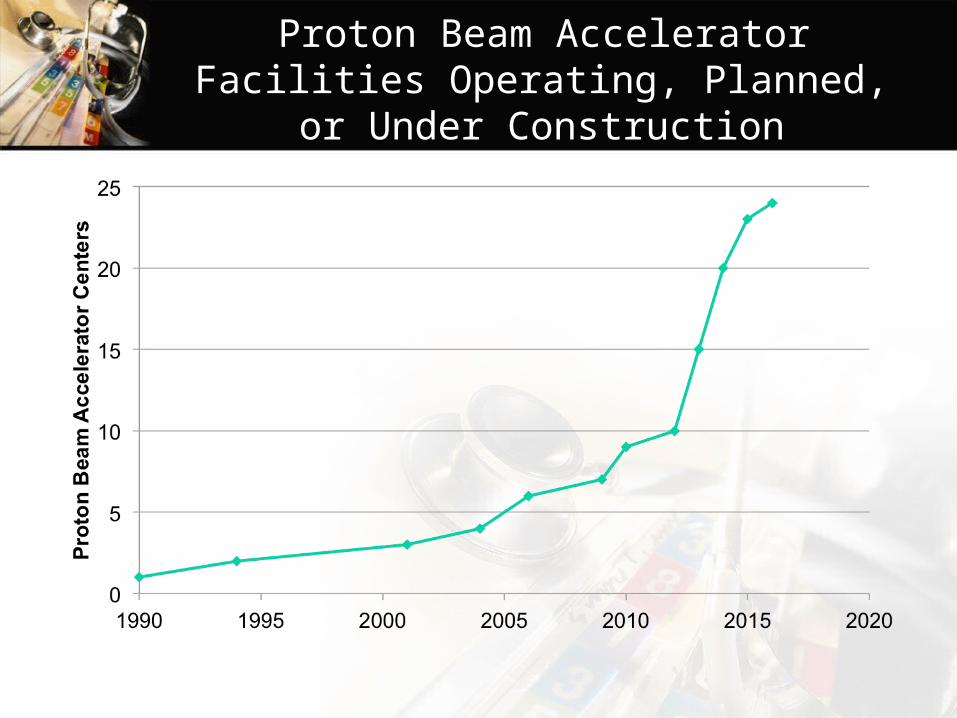
Proton Beam Accelerator Facilities Operating, Planned, or Under Construction
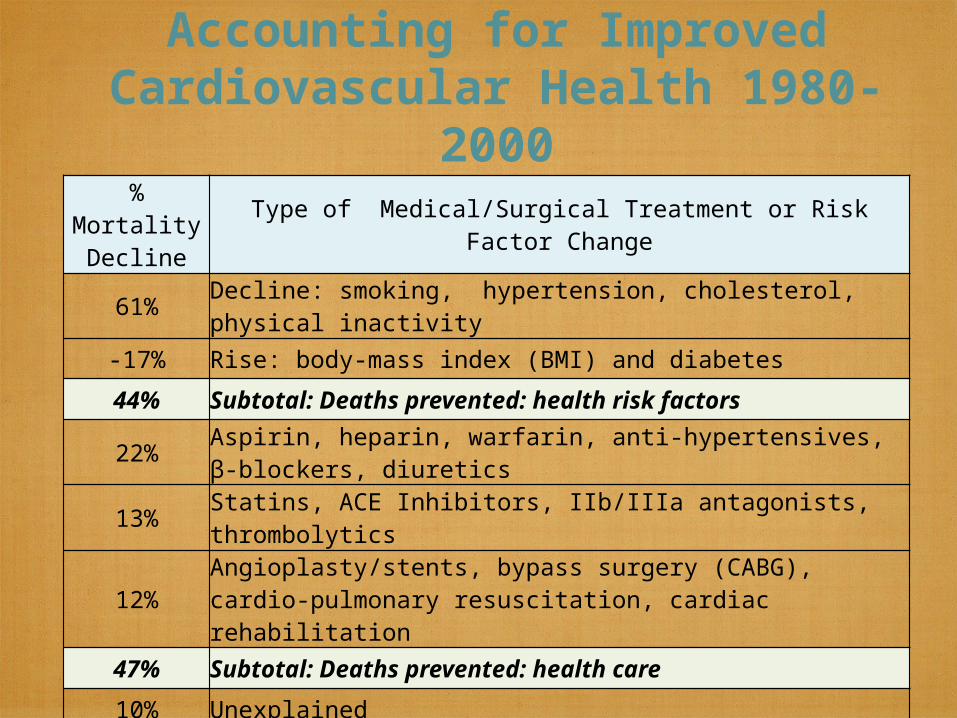
Accounting for Improved Cardiovascular Health 1980-
2000% Mortality
Decline Type of Medical/Surgical Treatment or Risk Factor Change
61% Decline: smoking, hypertension, cholesterol, physical inactivity
-17% Rise: body-mass index (BMI) and diabetes
44% Subtotal: Deaths prevented: health risk factors
22% Aspirin, heparin, warfarin, anti-hypertensives, β-blockers, diuretics
13% Statins, ACE Inhibitors, IIb/IIIa antagonists, thrombolytics
12%Angioplasty/stents, bypass surgery (CABG), cardio-pulmonary resuscitation, cardiac rehabilitation
47% Subtotal: Deaths prevented: health care
10% Unexplained
100% Total deaths prevented (341,745 total)
Source: Ford, et al., NEJM 2007.
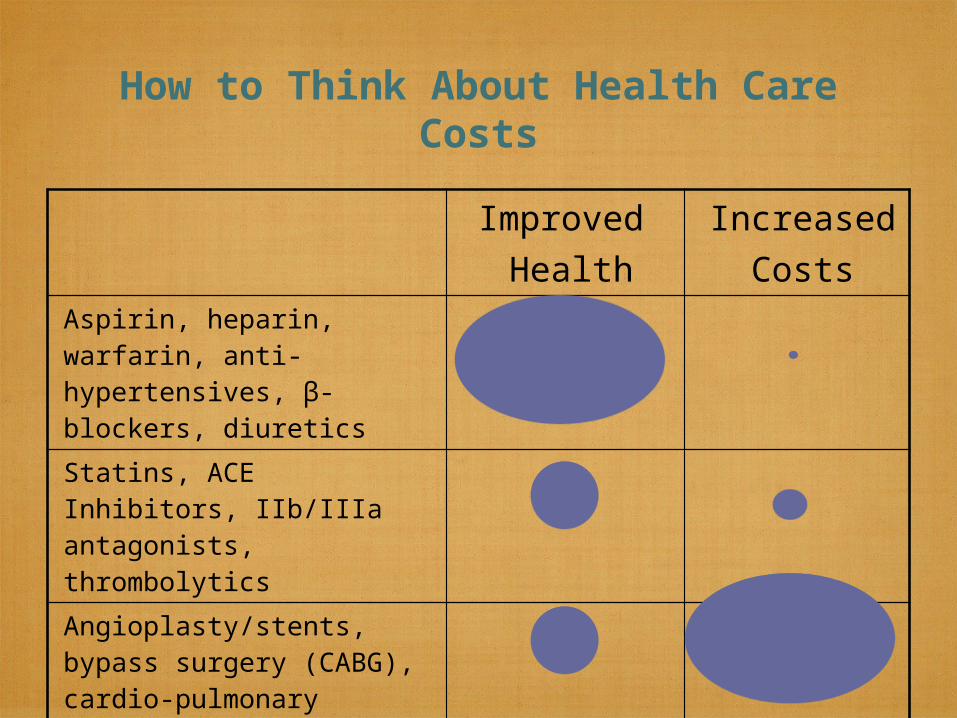
How to Think About Health Care Costs
Improved Health
Increased Costs
Aspirin, heparin, warfarin, anti-hypertensives, β-blockers, diuretics
Statins, ACE Inhibitors, IIb/IIIa antagonists, thrombolytics
Angioplasty/stents, bypass surgery (CABG), cardio-pulmonary resuscitation, cardiac rehabilitation

Highest Performance
Lowest Performance
Source: Chandra, Skinner and Staiger (2010). IOM.
Category II and III Technologies
Cate
gory
I
Tech
nolo
gie
s

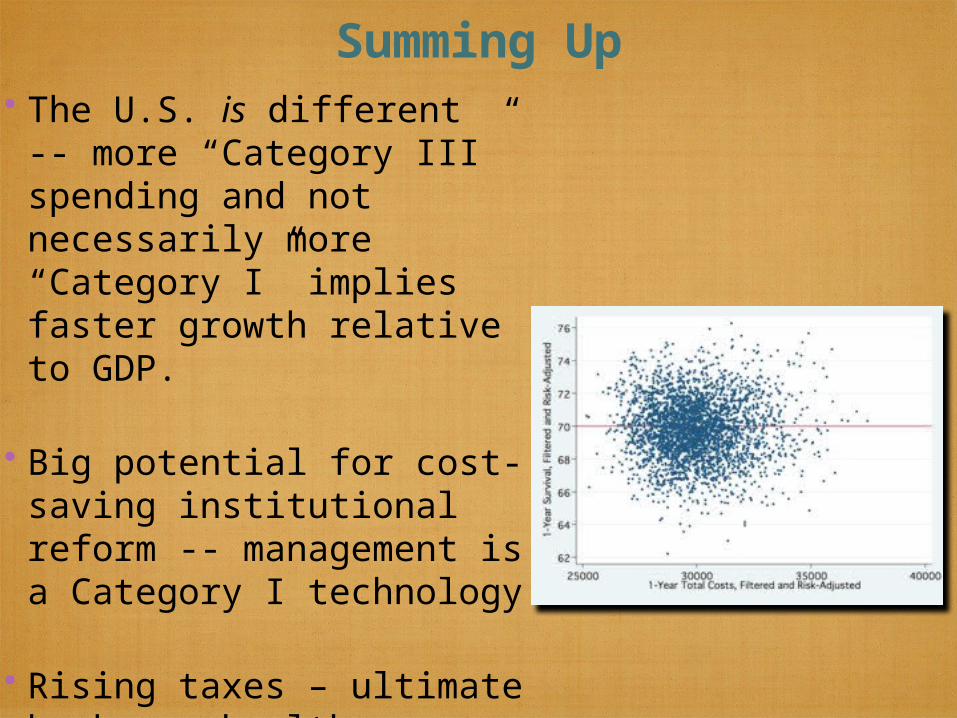
Summing Up• The U.S. is different -- more
“Category III” spending and not necessarily more “Category I” implies faster growth relative to GDP.
• Big potential for cost-saving institutional reform -- could swamp importance of cost-saving technologies
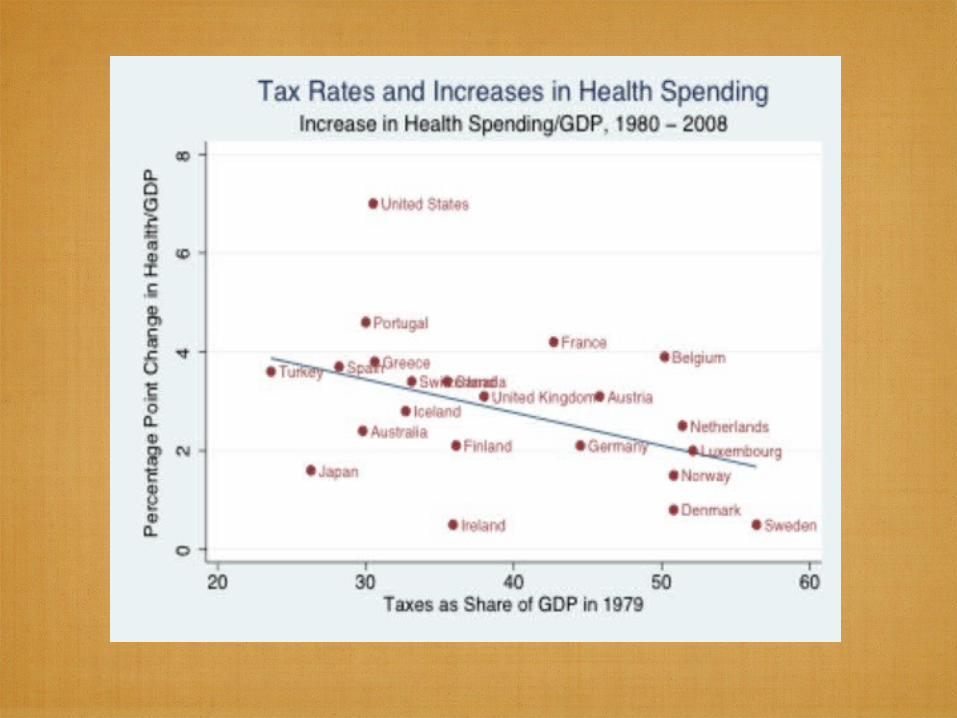
• Rising taxes – ultimate brake on health care spending?
Rest of
World
US
0
350
700
1050
1400
1750
20072009
Barbash and Glied, NEJM 2010
Summing Up• The U.S. is different -- more
“Category III” spending and not necessarily more “Category I” implies faster growth relative to GDP.
• Big potential for cost-saving institutional reform -- management is a Category I technology
• Rising taxes – ultimate brake on health care spending?

Summing Up• The U.S. is different -- more
“Category III” spending and not necessarily more “Category I” implies faster growth relative to GDP.
• Big potential for cost-saving institutional reform -- management is a Category I technology
• Rising taxes – ultimate brake on health care spending?