Technology and Competitiveness in Vietnam - UNU-WIDER · 2015-08-27 · Technology and Compet...
48
Technology and Competitiveness in Vietnam General Statistics Office, Hanoi, Vietnam July 3 rd , 2014 Prof. Carol Newman, Trinity College Dublin Prof. Finn Tarp, University of Copenhagen and UNU-WIDER 1
Transcript of Technology and Competitiveness in Vietnam - UNU-WIDER · 2015-08-27 · Technology and Compet...

Technology and Competitiveness in Vietnam
General Statistics Office, Hanoi, VietnamJuly 3rd, 2014
Prof. Carol Newman, Trinity College Dublin Prof. Finn Tarp, University of Copenhagen and UNU-WIDER
1

Introduction
• Global financial crisis (the great recession) has changed the international landscape for doing business
• The pace of economic transformation has quickened in emerging economies
• Economies will in future stand or fall on their ability to compete in global markets
• Competitiveness a key factor
• But, increasingly economies will be distinguished by their ability to create new value added products
• One key determinant will be technology adoption and innovation
2

Introduction
• Vietnam’s economy has grown rapidly - between 2000 and 2013 growth was at a rate of 6% per annum on average
• This has changed the nature of economic activity
• Domestically, the quality of goods and services has increased and the range of choices available to consumers has expanded
• Internationally, exports are expanding and foreign direct investment (FDI) into Vietnam is growing at a fast pace
• The way in which output is produced (=the production function) is changing
• The future success of the Vietnamese economy will depend on its ability to continue the remarkable growth and economic transformation
3

Introduction
• What determines the growth rate? • Quantity: tangible capital and labour (and land)
• Total factor productivity: more intangible ranging from technology to knowledge of labour (human capital), and includes the way that capital interacts with labour (= a measure of an economy’s long-term technological change or technological dynamism)
• Vietnam has a large labour force and has experienced significant increases in the capital stock
• There are high levels of domestic savings but also large inflows of FDI
• Up to now ‘factor accumulation’ has played key role in Vietnam’s growth
4

Introduction
• To further the transition from relying on ‘factor-accumulation’ to a ‘TFP’ driven’ economy increasing focus needs to be placed on productivity and technology
• This is a necessary next step in the development process
• Understanding the relationship between technology and productivity is crucial in designing policies that improve the technological readiness of firms
• Illustrative estimates of macro-economic developments available, but developing a deep policy-relevant understanding of the productivity-technology relationship requires firm-level data over time that allows the complexities of the interplay to be uncovered
5

Introduction
• We aim to demonstrate the value of a unique source of data collected by the GSO in collaboration with the University of Copenhagen and CIEM (funded by Danida)
• Technology and Competitiveness Survey (TCS) 2010-2013
• Note: survey also has material and data about corporate social responsibility (focus here is on technology and competitiveness)
• Roadmap:• International perspective on technology and competitiveness
• Overview of the TCS
• Key trends emerging from the TCS
• Examples of in-depth studies using the TCS
• Recommendations for the future
6

Technology and Competitiveness: An International Perspective
7

Global Competitiveness Rankings
• World Economic Forum, Global Competitiveness Report, 2013-2014
• Vietnam ranked 70th in the world on the Global Competitiveness Index (which is rather low)
• What is this index made up of?
8

Competitiveness defined
• Key reference: World Economic Forum. Annual Competitiveness Reports
9
Pillars of Competitiveness
InstitutionsInfrastructureMacroeconomic environmentHealth and primary educationHigher education and trainingGoods market efficiencyLabor market efficiencyFinancial market developmentMarket sizeTechnological readinessBusiness sophisticationInnovation
Basic requirements for factor-driven economies (shifting through factor accumulation)
Efficiency enhancers for efficiency-driven economies (relative to potential)
Innovation and sophistication factors for innovation-driven economies

Global Competitiveness Rankings
• Vietnam ranks highest on efficiency-enhancers overall
• Market size (36th), labor market efficiency (56th) and goods market efficiency (74th)
• But ranks particularly poorly on technological readiness (102nd)
• Vietnam also ranks comparatively well on innovation and sophistication factors – suggesting promising potential for the future
• Ranks 76th on innovation
• However, it is still one of the poorest ranking on most measures in the ASEAN region where most competitors are located, so beware
10
What is missing from this analysis?
• This analysis is informative but it is limited
• These are very broad categories and the indicators are based on administrative data - no new data is collected
• Tells us nothing about the underlying mechanisms – why Vietnam does well in some areas and not in others
• To really understand the drivers of technology adoption and innovation and their impacts more information is required
• More detail on firm behavior• Track the same firms over time so underlying mechanisms can be
identified
• The Vietnamese TCS is the only example that we know of that collects detailed panel data on technology and competitiveness
• This is a very valuable resource which we will now demonstrate
11

Vietnam Technology and Competitiveness Surveys2010-2013
12

Overview
• The TCS 2010-2013 was developed in collaboration between GSO, CIEM and UoC
• Aim: to give researchers and policymakers a detailed understanding of the dynamics of technology, productivity and profitability of Vietnam’s growing private sector
• It is a detailed firm-level survey on a sub-sample of some 7,500 manufacturing enterprises that was implemented by the GSO as part of the annual Vietnam Enterprise Survey
• To ensure that high quality data are collected each round involved extensive discussions between collaborating institutions on the questionnaire content and the sampling
• The results are reported through annual statistical reports and a range of in-depth studies that are presented to partners and key stakeholders at drafting and final report stages
13

14
Structure of the Survey
Section Description
Taking stock of technologies and technological basis
Capturing the status-quo of the firm’s level of technological investment and sophistication through questions about the age, cost, and type of current production technologies.
Input and supplier relations
The details of major suppliers’ locations and the value of inputs obtained, differentiated across domestic and international suppliers.
Output and customer relations
The details of major customers’ locations and value of outputs sold, differentiated between domestic and international customers.
Innovation and technology capacities
Diagnostic questions targeting the constraints affecting technology adaptation and level of the firms’ investment in technology transfers or research and development.
CompetitorsNumber and location of competitors, and dimensions (cost / quality) along which competition occurs.
Corporate Social Responsibility (CSR)
Questions relating to formal and informal commitment to CSR practices.

Manufacturing Sectors Covered (2012)
15
0.00%
2.00%
4.00%
6.00%
8.00%
10.00%
12.00%
14.00%
16.00%
18.00%
N=7,467

16
Types and Sizes of Firms
Legal structure Description
State-owned Wholly state-owned or joint stock firm with state involvement
Private Ent. Domestically-owned private firms or cooperatives
FDI Wholly foreign-owned or joint stock firms with majority FDI ownership
Size category
Number of employees
Micro 0 – 10
Small 10 – 50Medium 50 – 300Large 300 or more

Ownership of Firms
17
0
1000
2000
3000
4000
5000
6000
7000
2009 2010 2011 2012
Ownership
State Private ForeignNote: very few state left in 2012

Size of Firms
18
0
500
1000
1500
2000
2500
3000
3500
2009 2010 2011 2012
Size
Micro Small Medium Large
TCS Key Trends 2010-2013
19

Trends in competition
20
0
5
10
15
20
25
30
35
40
45
Total State Private Foreign Micro Small Medium Large
Number of Competitors
2010 2011 2012

Trends in competition
21
Locality of Competition Private domestic Foreign
Distribution of competitors (in
2010 2012 2010 2012
Within same province 65.8 62.1 29.7 36.8
Different province 31.1 34.2 41.6 36.2
Foreign 3.1 3.6 28.7 27.0

Trends in technology sophistication
22
Sophistication of in-house technology – machinery
(latest machine purchased)Total Private Foreign
2009 2012 2009 2012 2009 2012
Mechanical hand tools 1.6 0.8 1.8 0.9 1.2 0.4
Power driven hand tools 7.5 5.6 8.9 6.1 4.6 4.0
Human op. machines 81.5 84.6 82.4 86.1 78.5 79.8
Computer op. machines 8.3 8.3 5.7 6.1 14.9 15.0

Trends in international engagement
23
Engagement with international markets
0102030405060708090
% Exporters
2009 2010 2011 2012

Trends in international engagement
24
Destination of exportsTotal Private Foreign
% of exporting firms exporting to:
2009 2012 2009 2012 2009 2012
China 6.1 15.4 7.0 15.1 5.2 15.8
Other Asia 100 90.2 100 87.3 100 92.8
US/Canada 18.1 30.0 19.9 31.5 17.1 28.8
Europe 16.3 28.0 25.5 35.4 8.2 21.3
Note: Increasing diversification of export markets

Trends in international engagement
25
Engagement with international markets (note: less sourcing via imports)
0
10
20
30
40
50
60
70
80
90
Total State Private Foreign Micro Small Medium Large
% Import Inputs
2009 2010 2011 2012

Trends in engagement with FDI firms
26
Engagement with FDI firms (selling to FDI firms – downstream)
0
10
20
30
40
50
60
Total State Private Foreign Micro Small Medium Large
% FDI Customers
2010 2011 2012

Trends in engagement with FDI firms
27
Engagement with FDI firms (procuring inputs from foreign firms – upstream)
0
10
20
30
40
50
60
70
Total State Private Foreign Micro Small Medium Large
% FDI Suppliers
2010 2011

Trends in Technology Transfers
% of firms Transfer from Supplier Transfer from Customer
2009 2012 2009 2012
Total 10.7 11.9 8.6 12.1
State 19.6 27.9 10.8 18.6
Private 9.6 11.0 6.8 11.6
Foreign 15.8 14.5 9.9 13.6
Micro 5.2 5.1 4.7 6.3
Small 7.7 9.0 5.6 9.6
Medium 12.0 14.1 8.6 13.7
Large 16.5 18.2 10.9 18.2
28

Source of Technology Transfers (2012)
Total %
Vietnamese firm, same sector 1,640 20.3
Vietnamese firm, other sector 3,885 48.0
Foreign firm, same sector 1,487 18.4
Foreign firm, other sector 875 10.8
29
Technology from foreign firms is important but less important than local firms

Innovation Trends
All firms Private Domestic Firms
% 2010 2011 2012 2010 2011 2012
Process 59.9 62.6 66.8 59.1 62.5 67.2
Quality 76.5 79.0 80.0 76.3 79.5 81.2
Variety 42.6 43.6 42.5 41.6 42.7 42.4
Expand sector 14.4 13.4 12.5 14.6 13.8 13.6
Change sector 2.7 3.2 3.4 2.9 3.5 3.6
Tech Adapt 8.0 6.4 4.8 7.8 6.0 4.9
R&D 11.3 10.5 6.6 10.5 9.5 6.9
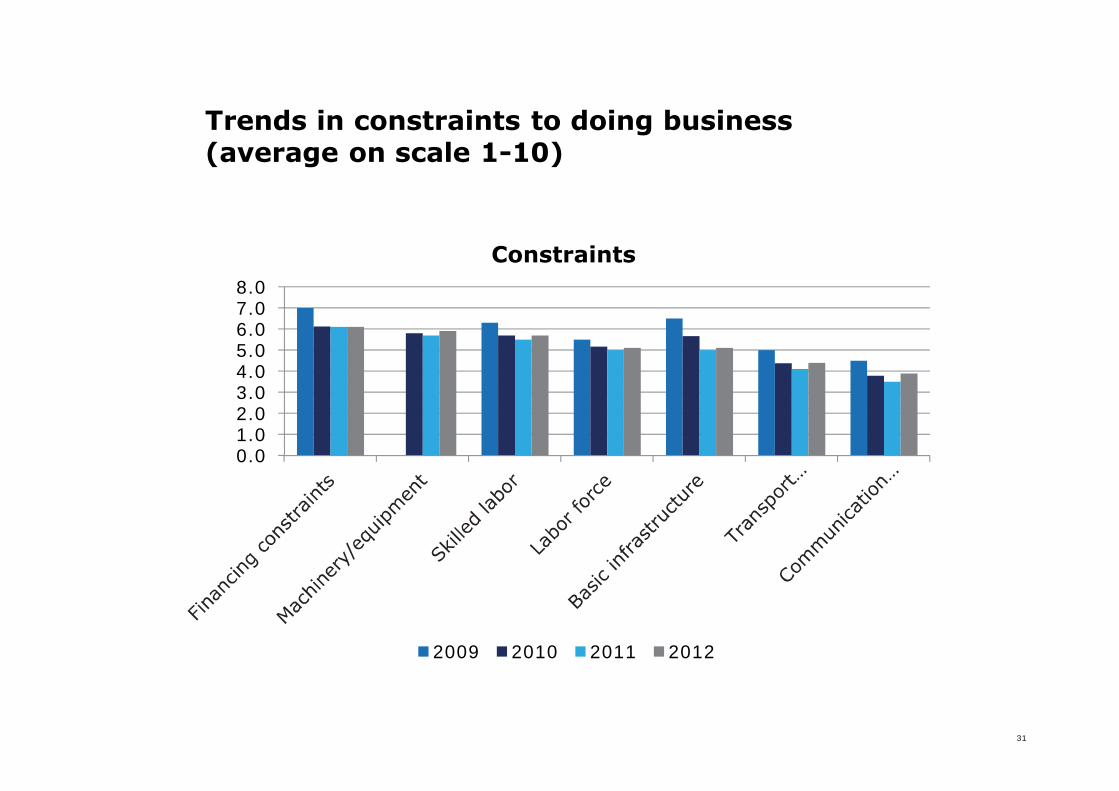
Trends in constraints to doing business (average on scale 1-10)
31
0.01.02.03.04.05.06.07.08.0
Constraints
2009 2010 2011 2012

Which firms are more constrained?
32
32
33
34
35
36
37
38
Private Foreign Micro Small Medium Large
Total Constraints Score in 2012

TCS Indepth Studies (from correlation to causation using GSO VES)
33

Technology Transfer
34

Technology transfer
• Firms use capital (machinery, finance) and labour
• They also need technology: the quality of machinery and the organisation of machinery and labour
• For emerging economies such as Vietnam technology transfer is key• Vietnam is below the technology frontier but can catch up
by learning from others
• Studying technology transfer is a core feature of TCS
• The interplay between technology transfer, FDI, trade and innovation is of particular importance
35

Technology transfer through spillovers
36
Type of spillover Description
ForwardTechnology is transferred from foreign-owned input suppliers based in Vietnam to Vietnamese domestic producers
BackwardTechnology is transferred from foreign-owned customers based in Vietnam to Vietnamese domestic input producers
Horizontal Technology is transferred from foreign-owned competitors based in Vietnam to Vietnamese domestic producers
How Do These Happen?
37
• Inputs supplied by foreign firms use a new technology
• Foreign input suppliers provide training on how to use the new technology
• Foreign customers provide domestic input suppliers with technological know-how about how to produce new inputs
• Domestic firms could purchase new technology from foreign firms or have it transferred through some contractual relationship
• New employees could bring with them skills acquired while working at a foreign firm

In-depth evidence on FDI spillovers
38
• Evidence suggests that productivity gains from FDI firms are not through direct linkages between domestic and FDI firms
• We find evidence for positive forward spillovers from foreign inputs suppliers to domestic producers but these are not due to direct linkages or contractual technology transfers but are due to some other productivity channel
• Moreover, direct linkages with downstream FDI firms have a negative impact on firm productivity for some firms, but firms that adapt by investing or adjusting their labour inputs can benefit from such relationships

Learning by exporting
39

Learning by exporting
• An important advantage of the TCS data is – as noted –that it can be linked to the main VES allowing for detailed in-depth analysis of important topics of policy relevance.
• Together with CIEM we have analyzed the impact of entering export markets on the productivity performance of private Vietnamese firms
• This is possible because of the long panel data tracking the same firms over time
• Linking the VES with the TCS allows the mechanisms driving the productivity impact of exports to be explored.
40

Do firms learn by exporting?
Productivity (1)2006-2011 VES
(6)2009-2011 TCS
Lag Export 0.028**(0.013)
0.032*(0.019)
R2 0.826 0.733Firms 5,210 5,210Observations 31,260 15,630
• Strong evidence that there are learning effects associated with exporting for private domestic firms in Vietnam
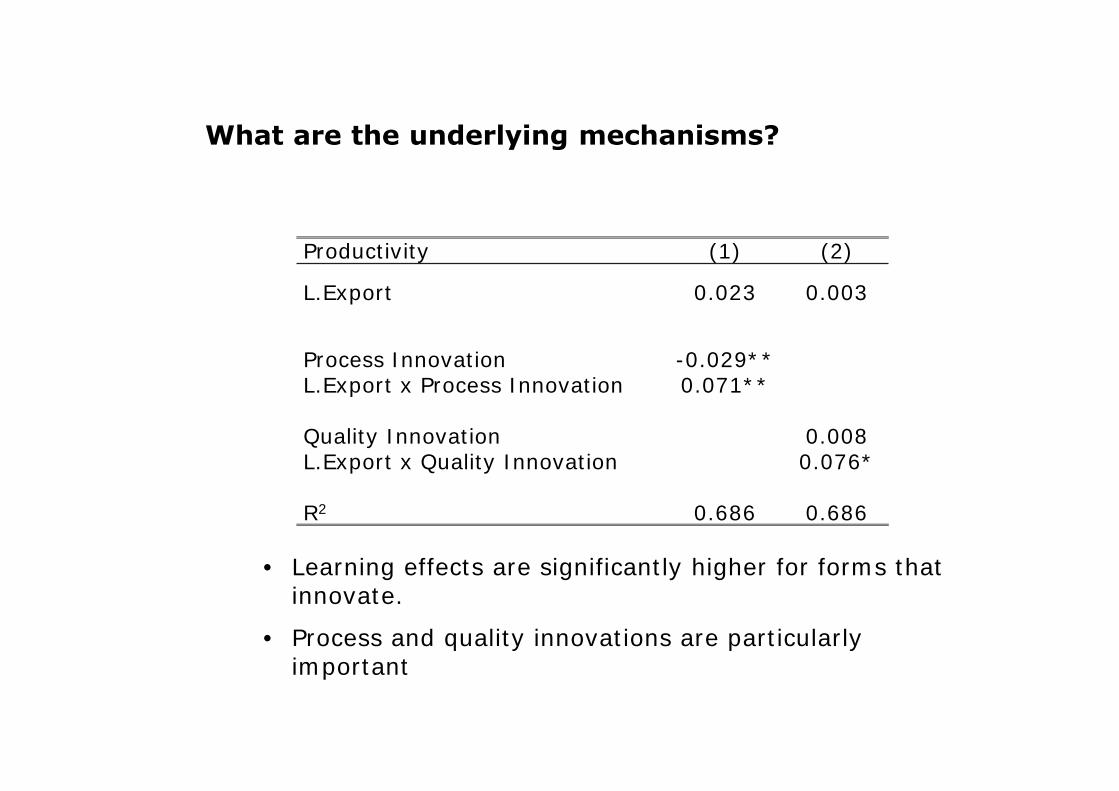
What are the underlying mechanisms?
• Learning effects are significantly higher for forms that innovate.
• Process and quality innovations are particularly important
Productivity (1) (2)
L.Export 0.023 0.003
Process Innovation -0.029**L.Export x Process Innovation 0.071**
Quality Innovation 0.008L.Export x Quality Innovation 0.076*
R2 0.686 0.686

Lessons form learning by exporting
• Facilitating the entry of Vietnamese firms into export markets will help enhance the productivity of the domestic manufacturing sector
• Small and medium sized domestic firms are less likely to export than large firms and foreign-owned enterprises
• Investigating the constraints to entry to export markets by these firms requires future research
• For firms that successfully enter export markets facilitating firm-specific innovations is likely to enhance the magnitude of the productivity gains

Conclusions and recommendations
44

Conclusion and recommendations for the future (1)
• Technology adoption critical in promoting competitiveness at firm and economy level in the next stage of Vietnam’s development (not sufficient just to accumulate capital and labour)
• Proper analysis of technology-productivity links require data – firm level panel data to uncover causal links and underlying mechanisms (indispensable for formulating policy)
• TCS provides insights on key firm-level trends and differences among types of firms
• Competition increasing
• Exporting increasing
• Diversification of export markets taking place
• Decline in reliance on imported inputs
• Gradually things are changing but significant differences between foreign and Vietnamese firms and between large and small firms
45

Conclusion and recommendations for the future (2)
• Technology & innovation
• Sophistication of technology use increasing
• Technology transfers among firms increasing
• Process and quality innovations increasing
• But: technology adaptation and R&D in decline
• In-depth studies
• FDI spillovers: FDI suppliers of inputs help productivity spillovers –
but technology transfer not the channel
• Exporting associated with learning effects
46

Conclusion and recommendations for the future (3)
• Lessons for policy – some examples:
• Lesson 1: firms continue to be constrained, especially private and
small: reform job not yet done (alleviate financial constraints,
education, access to high tech machinery and equipment)
• Lesson 2: limited frontier innovations – support for R&D (patents
law and subsidies/tax breaks)
• Lesson 3: FDI spillovers do not work through typical channels –
investment promotion agencies should focus on targeting FDI into
upstream sectors where spillovers the greatest; and types of
contracts needs to be investigated further
• Lesson 4: finding ways to help firms export promotes productivity47

Conclusion and recommendations for the future (4)
• Technology adoption and innovation are gradual time-consuming
processes: a few years of data give good basis to start
understanding process but needs to be followed up for time-series
to build up
• Tracking the same firms critical to identifying transmission
mechanisms and productivity impacts of technology adoption and
innovation
• Continuing TCS will provide unique inputs for policy making in next
phase of Vietnam’s economic development and reform process
48